Cities with the Lowest Unemployment Rate Among Males in Connecticut
RELATED REPORTS & OPTIONS
Lowest Unemployment | Male
Connecticut
Compare Cities
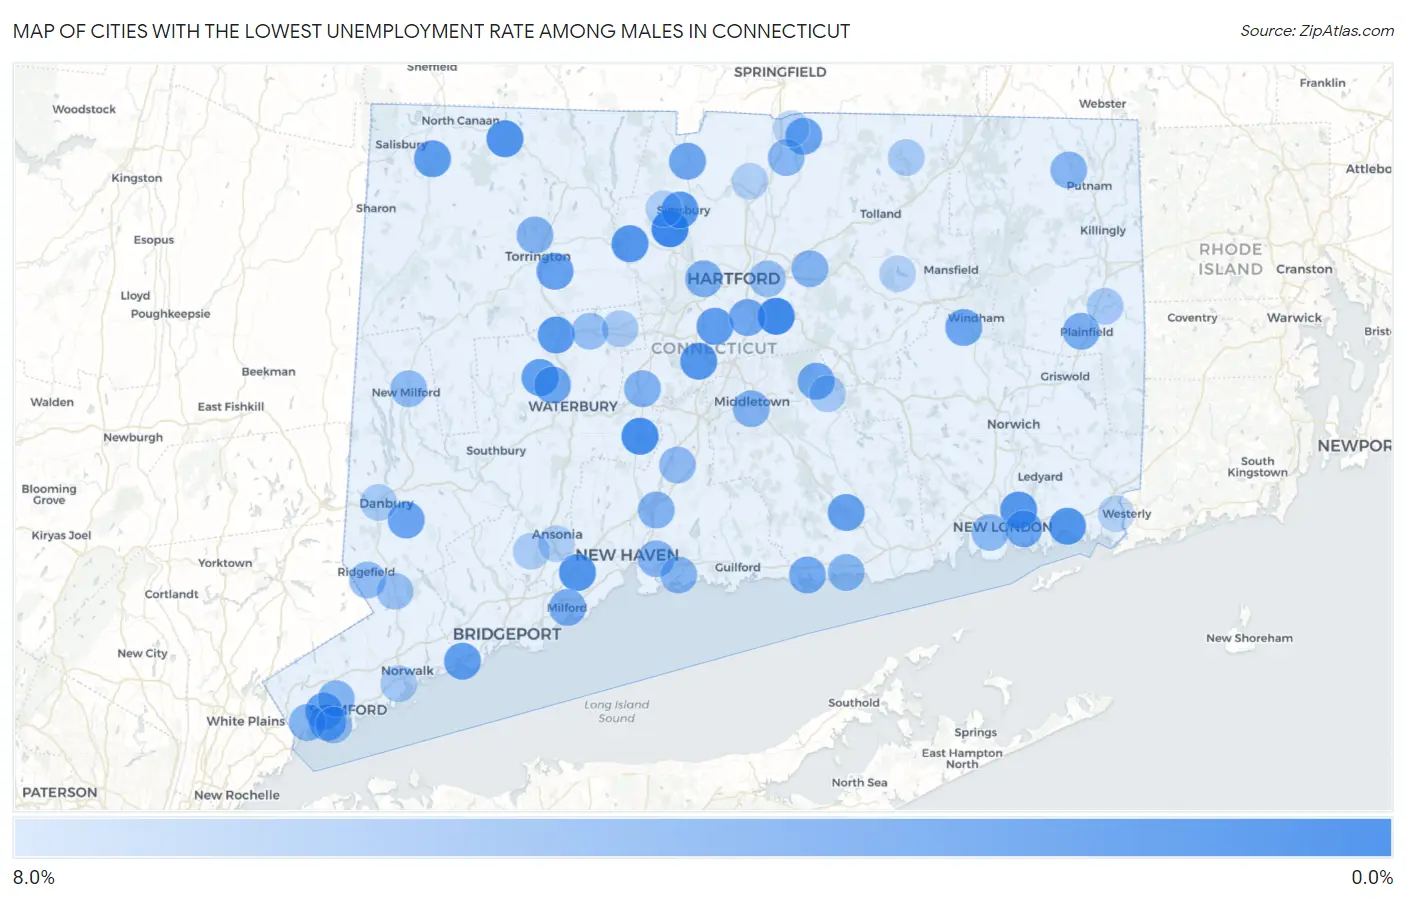
Map of Cities with the Lowest Unemployment Rate Among Males in Connecticut
8.0%
0.0%
Cities with the Lowest Unemployment Rate Among Males in Connecticut
| City | Male Unemployment | vs State | vs National | |
| 1. | Stepney | 0.20% | 6.1%(-5.90)#1 | 5.0%(-4.80)#25 |
| 2. | Weatogue | 0.40% | 6.1%(-5.70)#2 | 5.0%(-4.60)#119 |
| 3. | Glastonbury Center | 0.70% | 6.1%(-5.40)#3 | 5.0%(-4.30)#329 |
| 4. | Litchfield Borough | 0.80% | 6.1%(-5.30)#4 | 5.0%(-4.20)#551 |
| 5. | Cheshire Village | 0.90% | 6.1%(-5.20)#5 | 5.0%(-4.10)#633 |
| 6. | Northford | 1.2% | 6.1%(-4.90)#6 | 5.0%(-3.80)#1,186 |
| 7. | Noroton | 1.3% | 6.1%(-4.80)#7 | 5.0%(-3.70)#1,365 |
| 8. | South Wilton | 1.4% | 6.1%(-4.70)#8 | 5.0%(-3.60)#1,646 |
| 9. | Greens Farms | 1.5% | 6.1%(-4.60)#9 | 5.0%(-3.50)#1,817 |
| 10. | Norfolk | 1.6% | 6.1%(-4.50)#10 | 5.0%(-3.40)#2,083 |
| 11. | Orange | 1.7% | 6.1%(-4.40)#11 | 5.0%(-3.30)#2,139 |
| 12. | Mystic | 1.7% | 6.1%(-4.40)#12 | 5.0%(-3.30)#2,192 |
| 13. | Kensington | 1.8% | 6.1%(-4.30)#13 | 5.0%(-3.20)#2,355 |
| 14. | Newtown Borough | 1.8% | 6.1%(-4.30)#14 | 5.0%(-3.20)#2,459 |
| 15. | Collinsville | 1.9% | 6.1%(-4.20)#15 | 5.0%(-3.10)#2,643 |
| 16. | Conning Towers Nautilus Park | 2.0% | 6.1%(-4.10)#16 | 5.0%(-3.00)#2,815 |
| 17. | Simsbury Center | 2.1% | 6.1%(-4.00)#17 | 5.0%(-2.90)#3,064 |
| 18. | Thomaston | 2.1% | 6.1%(-4.00)#18 | 5.0%(-2.90)#3,122 |
| 19. | Quinnipiac University | 2.3% | 6.1%(-3.80)#19 | 5.0%(-2.70)#3,568 |
| 20. | Inglenook | 2.3% | 6.1%(-3.80)#20 | 5.0%(-2.70)#3,660 |
| 21. | Falls Village | 2.3% | 6.1%(-3.80)#21 | 5.0%(-2.70)#3,708 |
| 22. | East | 2.4% | 6.1%(-3.70)#22 | 5.0%(-2.60)#3,864 |
| 23. | Old Hill | 2.4% | 6.1%(-3.70)#23 | 5.0%(-2.60)#3,887 |
| 24. | Poplar Plains | 2.4% | 6.1%(-3.70)#24 | 5.0%(-2.60)#3,920 |
| 25. | Newington | 2.5% | 6.1%(-3.60)#25 | 5.0%(-2.50)#4,018 |
| 26. | Cos Cob | 2.6% | 6.1%(-3.50)#26 | 5.0%(-2.40)#4,328 |
| 27. | Watertown | 2.6% | 6.1%(-3.50)#27 | 5.0%(-2.40)#4,354 |
| 28. | Mill Plain | 2.6% | 6.1%(-3.50)#28 | 5.0%(-2.40)#4,393 |
| 29. | Southport | 2.6% | 6.1%(-3.50)#29 | 5.0%(-2.40)#4,402 |
| 30. | Northwest Harwinton | 2.8% | 6.1%(-3.30)#30 | 5.0%(-2.20)#4,838 |
| 31. | Deep River Center | 2.8% | 6.1%(-3.30)#31 | 5.0%(-2.20)#4,847 |
| 32. | Riverside | 2.9% | 6.1%(-3.20)#32 | 5.0%(-2.10)#5,026 |
| 33. | Bethel | 3.0% | 6.1%(-3.10)#33 | 5.0%(-2.00)#5,270 |
| 34. | Hazardville | 3.0% | 6.1%(-3.10)#34 | 5.0%(-2.00)#5,304 |
| 35. | Oakville | 3.1% | 6.1%(-3.00)#35 | 5.0%(-1.90)#5,544 |
| 36. | Lake Pocotopaug | 3.1% | 6.1%(-3.00)#36 | 5.0%(-1.90)#5,579 |
| 37. | Long Hill | 3.1% | 6.1%(-3.00)#37 | 5.0%(-1.90)#5,581 |
| 38. | South Windham | 3.1% | 6.1%(-3.00)#38 | 5.0%(-1.90)#5,647 |
| 39. | Salmon Brook | 3.3% | 6.1%(-2.80)#39 | 5.0%(-1.70)#6,074 |
| 40. | Wethersfield | 3.4% | 6.1%(-2.70)#40 | 5.0%(-1.60)#6,211 |
| 41. | Trumbull Center | 3.4% | 6.1%(-2.70)#41 | 5.0%(-1.60)#6,260 |
| 42. | Mamanasco Lake | 3.4% | 6.1%(-2.70)#42 | 5.0%(-1.60)#6,379 |
| 43. | Clinton | 3.6% | 6.1%(-2.50)#43 | 5.0%(-1.40)#6,721 |
| 44. | Saugatuck | 3.6% | 6.1%(-2.50)#44 | 5.0%(-1.40)#6,723 |
| 45. | Tokeneke | 3.6% | 6.1%(-2.50)#45 | 5.0%(-1.40)#6,734 |
| 46. | Lordship | 3.7% | 6.1%(-2.40)#46 | 5.0%(-1.30)#6,941 |
| 47. | Staples | 3.8% | 6.1%(-2.30)#47 | 5.0%(-1.20)#7,115 |
| 48. | Bantam Borough | 3.8% | 6.1%(-2.30)#48 | 5.0%(-1.20)#7,214 |
| 49. | Milford City Balance | 3.9% | 6.1%(-2.20)#49 | 5.0%(-1.10)#7,293 |
| 50. | Plainfield Village | 3.9% | 6.1%(-2.20)#50 | 5.0%(-1.10)#7,407 |
| 51. | West Hartford | 4.0% | 6.1%(-2.10)#51 | 5.0%(-1.00)#7,512 |
| 52. | Darien Downtown | 4.0% | 6.1%(-2.10)#52 | 5.0%(-1.00)#7,676 |
| 53. | Torrington | 4.3% | 6.1%(-1.80)#53 | 5.0%(-0.700)#8,196 |
| 54. | North Haven | 4.3% | 6.1%(-1.80)#54 | 5.0%(-0.700)#8,211 |
| 55. | Middletown | 4.4% | 6.1%(-1.70)#55 | 5.0%(-0.600)#8,419 |
| 56. | Compo | 4.4% | 6.1%(-1.70)#56 | 5.0%(-0.600)#8,506 |
| 57. | Tashua | 4.4% | 6.1%(-1.70)#57 | 5.0%(-0.600)#8,509 |
| 58. | Plantsville | 4.4% | 6.1%(-1.70)#58 | 5.0%(-0.600)#8,534 |
| 59. | Manchester | 4.5% | 6.1%(-1.60)#59 | 5.0%(-0.500)#8,633 |
| 60. | Groton Long Point Borough | 4.5% | 6.1%(-1.60)#60 | 5.0%(-0.500)#8,789 |
| 61. | Stamford | 4.6% | 6.1%(-1.50)#61 | 5.0%(-0.400)#8,819 |
| 62. | East Haven | 4.6% | 6.1%(-1.50)#62 | 5.0%(-0.400)#8,843 |
| 63. | Greenwich | 4.6% | 6.1%(-1.50)#63 | 5.0%(-0.400)#8,861 |
| 64. | Branford Center | 4.6% | 6.1%(-1.50)#64 | 5.0%(-0.400)#8,900 |
| 65. | Westbrook Center | 4.6% | 6.1%(-1.50)#65 | 5.0%(-0.400)#8,938 |
| 66. | Southwood Acres | 4.7% | 6.1%(-1.40)#66 | 5.0%(-0.300)#9,056 |
| 67. | South Woodstock | 4.7% | 6.1%(-1.40)#67 | 5.0%(-0.300)#9,119 |
| 68. | Waterford | 4.9% | 6.1%(-1.20)#68 | 5.0%(-0.100)#9,461 |
| 69. | Candlewood Shores | 5.0% | 6.1%(-1.10)#69 | 5.0%(=0.000)#9,698 |
| 70. | Indian Field | 5.0% | 6.1%(-1.10)#70 | 5.0%(=0.000)#9,714 |
| 71. | Wallingford Center | 5.1% | 6.1%(-1.00)#71 | 5.0%(+0.100)#9,781 |
| 72. | Daniels Farm | 5.1% | 6.1%(-1.00)#72 | 5.0%(+0.100)#9,828 |
| 73. | New Milford | 5.2% | 6.1%(-0.900)#73 | 5.0%(+0.200)#10,022 |
| 74. | Naugatuck Borough | 5.3% | 6.1%(-0.800)#74 | 5.0%(+0.300)#10,165 |
| 75. | Ridgefield | 5.3% | 6.1%(-0.800)#75 | 5.0%(+0.300)#10,202 |
| 76. | East Hartford | 5.5% | 6.1%(-0.600)#76 | 5.0%(+0.500)#10,522 |
| 77. | Terryville | 5.5% | 6.1%(-0.600)#77 | 5.0%(+0.500)#10,600 |
| 78. | Noroton Heights | 5.6% | 6.1%(-0.500)#78 | 5.0%(+0.600)#10,770 |
| 79. | Georgetown | 5.6% | 6.1%(-0.500)#79 | 5.0%(+0.600)#10,791 |
| 80. | Old Greenwich | 5.7% | 6.1%(-0.400)#80 | 5.0%(+0.700)#10,933 |
| 81. | Woodmont Borough | 5.7% | 6.1%(-0.400)#81 | 5.0%(+0.700)#10,986 |
| 82. | Westport | 5.8% | 6.1%(-0.300)#82 | 5.0%(+0.800)#11,158 |
| 83. | Murray | 6.3% | 6.1%(+0.200)#83 | 5.0%(+1.30)#12,000 |
| 84. | Norwalk | 6.4% | 6.1%(+0.300)#84 | 5.0%(+1.40)#12,066 |
| 85. | Moosup | 6.4% | 6.1%(+0.300)#85 | 5.0%(+1.40)#12,147 |
| 86. | East Hampton | 6.4% | 6.1%(+0.300)#86 | 5.0%(+1.40)#12,150 |
| 87. | Cornwall Bridge | 6.4% | 6.1%(+0.300)#87 | 5.0%(+1.40)#12,207 |
| 88. | Danbury | 6.5% | 6.1%(+0.400)#88 | 5.0%(+1.50)#12,217 |
| 89. | Bristol | 6.5% | 6.1%(+0.400)#89 | 5.0%(+1.50)#12,219 |
| 90. | Stafford Springs | 6.5% | 6.1%(+0.400)#90 | 5.0%(+1.50)#12,266 |
| 91. | Candlewood Orchards | 6.5% | 6.1%(+0.400)#91 | 5.0%(+1.50)#12,344 |
| 92. | Shelton | 6.7% | 6.1%(+0.600)#92 | 5.0%(+1.70)#12,512 |
| 93. | Derby | 6.8% | 6.1%(+0.700)#93 | 5.0%(+1.80)#12,648 |
| 94. | Windsor Locks | 6.9% | 6.1%(+0.800)#94 | 5.0%(+1.90)#12,790 |
| 95. | West Simsbury | 7.0% | 6.1%(+0.900)#95 | 5.0%(+2.00)#12,941 |
| 96. | Ball Pond | 7.0% | 6.1%(+0.900)#96 | 5.0%(+2.00)#12,944 |
| 97. | Coventry Lake | 7.1% | 6.1%(+1.000)#97 | 5.0%(+2.10)#13,057 |
| 98. | Sandy Hook | 7.2% | 6.1%(+1.10)#98 | 5.0%(+2.20)#13,163 |
| 99. | Pawcatuck | 7.2% | 6.1%(+1.10)#99 | 5.0%(+2.20)#13,174 |
| 100. | Sherwood Manor | 7.3% | 6.1%(+1.20)#100 | 5.0%(+2.30)#13,259 |
1
2Common Questions
What are the Top 10 Cities with the Lowest Unemployment Rate Among Males in Connecticut?
Top 10 Cities with the Lowest Unemployment Rate Among Males in Connecticut are:
#1
0.40%
#2
0.70%
#3
0.90%
#4
1.6%
#5
1.7%
#6
1.7%
#7
1.8%
#8
1.9%
#9
2.0%
#10
2.1%
What city has the Lowest Unemployment Rate Among Males in Connecticut?
Weatogue has the Lowest Unemployment Rate Among Males in Connecticut with 0.40%.
What is the Unemployment Rate Among Males in the State of Connecticut?
Unemployment Rate Among Males in Connecticut is 6.1%.
What is the Unemployment Rate Among Males in the United States?
Unemployment Rate Among Males in the United States is 5.0%.