Stonington borough, CT Map & Demographics
Stonington borough Overview
$105,580
PER CAPITA INCOME
$173,889
AVG FAMILY INCOME
$84,583
AVG HOUSEHOLD INCOME
15.1%
WAGE / INCOME GAP [ % ]
84.9¢/ $1
WAGE / INCOME GAP [ $ ]
0.59
INEQUALITY / GINI INDEX
942
TOTAL POPULATION
449
MALE POPULATION
493
FEMALE POPULATION
91.08
MALES / 100 FEMALES
109.80
FEMALES / 100 MALES
58.3
MEDIAN AGE
2.6
AVG FAMILY SIZE
1.7
AVG HOUSEHOLD SIZE
471
LABOR FORCE [ PEOPLE ]
55.9%
PERCENT IN LABOR FORCE
6.5%
UNEMPLOYMENT RATE
Income in Stonington borough
Income Overview in Stonington borough
Per Capita Income in Stonington borough is $105,580, while median incomes of families and households are $173,889 and $84,583 respectively.
| Characteristic | Number | Measure |
| Per Capita Income | 942 | $105,580 |
| Median Family Income | 214 | $173,889 |
| Mean Family Income | 214 | $276,593 |
| Median Household Income | 563 | $84,583 |
| Mean Household Income | 563 | $175,837 |
| Income Deficit | 214 | $0 |
| Wage / Income Gap (%) | 942 | 15.09% |
| Wage / Income Gap ($) | 942 | 84.91¢ per $1 |
| Gini / Inequality Index | 942 | 0.59 |
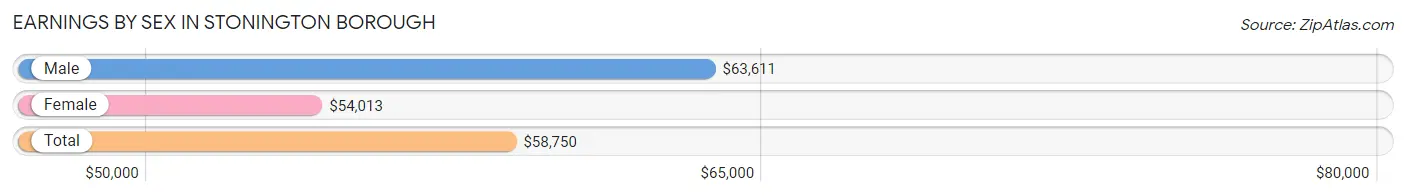
Earnings by Sex in Stonington borough
Average Earnings in Stonington borough are $58,750, $63,611 for men and $54,013 for women, a difference of 15.1%.
| Sex | Number | Average Earnings |
| Male | 244 (48.3%) | $63,611 |
| Female | 261 (51.7%) | $54,013 |
| Total | 505 (100.0%) | $58,750 |
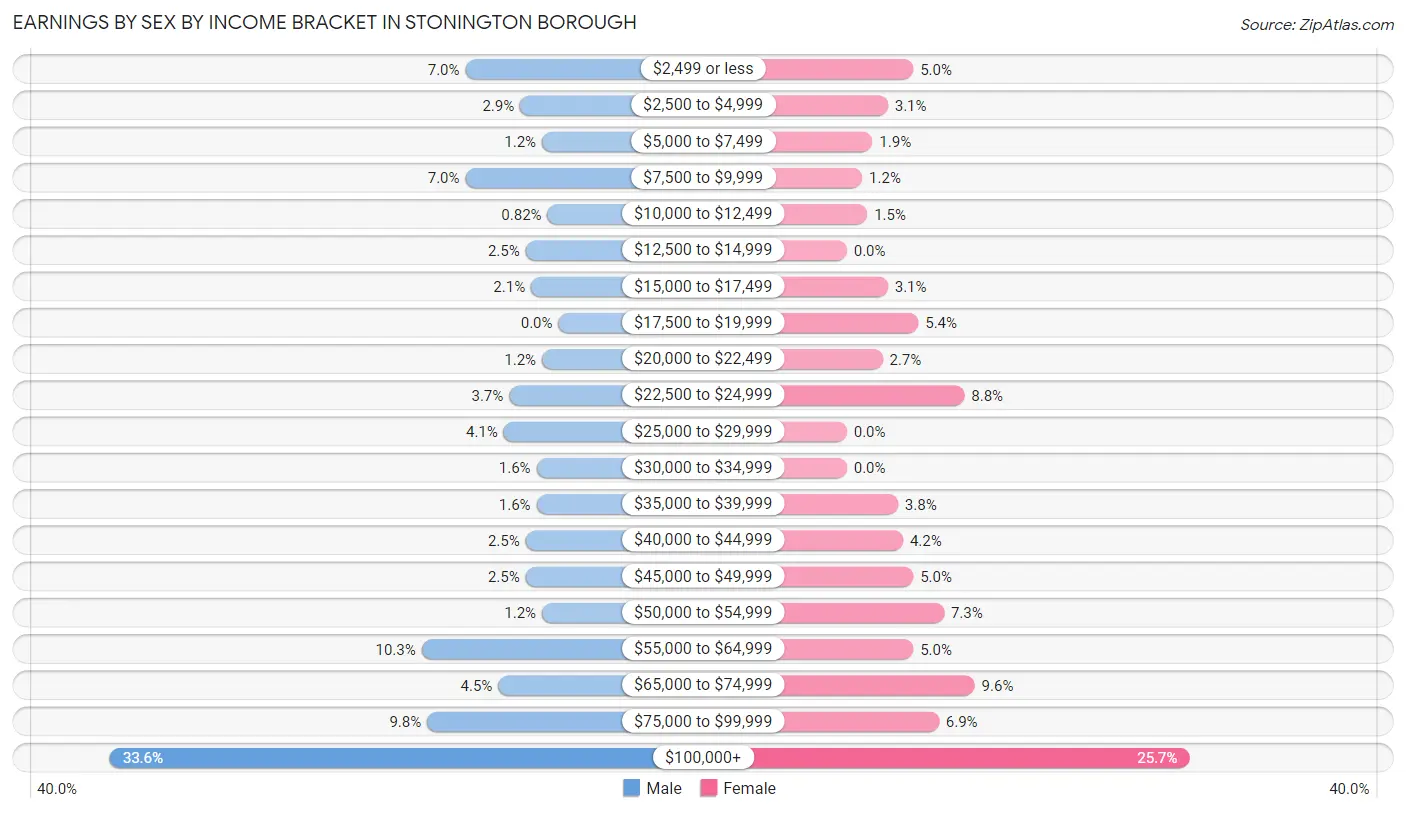
Earnings by Sex by Income Bracket in Stonington borough
The most common earnings brackets in Stonington borough are $100,000+ for men (82 | 33.6%) and $100,000+ for women (67 | 25.7%).
| Income | Male | Female |
| $2,499 or less | 17 (7.0%) | 13 (5.0%) |
| $2,500 to $4,999 | 7 (2.9%) | 8 (3.1%) |
| $5,000 to $7,499 | 3 (1.2%) | 5 (1.9%) |
| $7,500 to $9,999 | 17 (7.0%) | 3 (1.1%) |
| $10,000 to $12,499 | 2 (0.8%) | 4 (1.5%) |
| $12,500 to $14,999 | 6 (2.5%) | 0 (0.0%) |
| $15,000 to $17,499 | 5 (2.1%) | 8 (3.1%) |
| $17,500 to $19,999 | 0 (0.0%) | 14 (5.4%) |
| $20,000 to $22,499 | 3 (1.2%) | 7 (2.7%) |
| $22,500 to $24,999 | 9 (3.7%) | 23 (8.8%) |
| $25,000 to $29,999 | 10 (4.1%) | 0 (0.0%) |
| $30,000 to $34,999 | 4 (1.6%) | 0 (0.0%) |
| $35,000 to $39,999 | 4 (1.6%) | 10 (3.8%) |
| $40,000 to $44,999 | 6 (2.5%) | 11 (4.2%) |
| $45,000 to $49,999 | 6 (2.5%) | 13 (5.0%) |
| $50,000 to $54,999 | 3 (1.2%) | 19 (7.3%) |
| $55,000 to $64,999 | 25 (10.2%) | 13 (5.0%) |
| $65,000 to $74,999 | 11 (4.5%) | 25 (9.6%) |
| $75,000 to $99,999 | 24 (9.8%) | 18 (6.9%) |
| $100,000+ | 82 (33.6%) | 67 (25.7%) |
| Total | 244 (100.0%) | 261 (100.0%) |
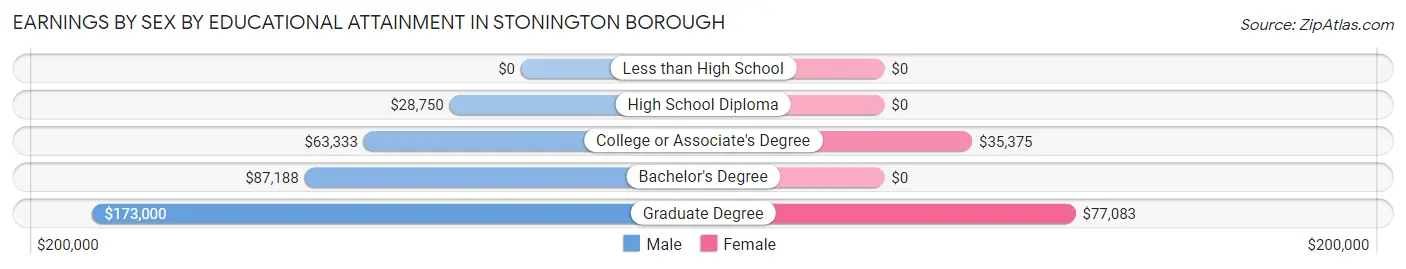
Earnings by Sex by Educational Attainment in Stonington borough
Average earnings in Stonington borough are $76,250 for men and $57,083 for women, a difference of 25.1%. Men with an educational attainment of graduate degree enjoy the highest average annual earnings of $173,000, while those with high school diploma education earn the least with $28,750. Women with an educational attainment of graduate degree earn the most with the average annual earnings of $77,083, while those with college or associate's degree education have the smallest earnings of $35,375.
| Educational Attainment | Male Income | Female Income |
| Less than High School | - | - |
| High School Diploma | $28,750 | $0 |
| College or Associate's Degree | $63,333 | $35,375 |
| Bachelor's Degree | $87,188 | $0 |
| Graduate Degree | $173,000 | $77,083 |
| Total | $76,250 | $57,083 |
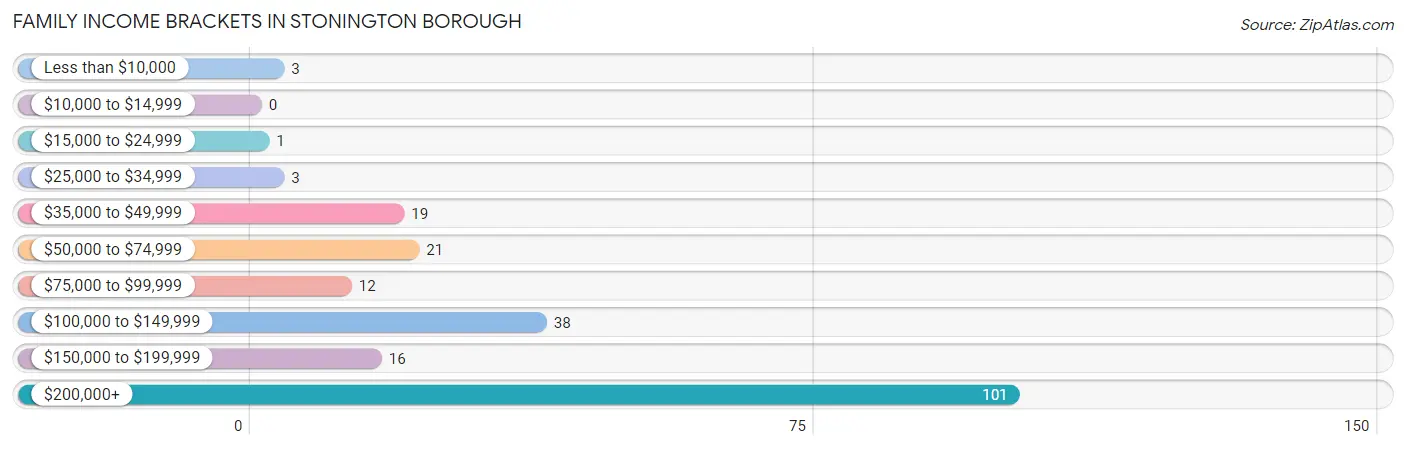
Family Income in Stonington borough
Family Income Brackets in Stonington borough
According to the Stonington borough family income data, there are 101 families falling into the $200,000+ income range, which is the most common income bracket and makes up 47.2% of all families.
| Income Bracket | # Families | % Families |
| Less than $10,000 | 3 | 1.4% |
| $10,000 to $14,999 | 0 | 0.0% |
| $15,000 to $24,999 | 1 | 0.5% |
| $25,000 to $34,999 | 3 | 1.4% |
| $35,000 to $49,999 | 19 | 8.9% |
| $50,000 to $74,999 | 21 | 9.8% |
| $75,000 to $99,999 | 12 | 5.6% |
| $100,000 to $149,999 | 38 | 17.8% |
| $150,000 to $199,999 | 16 | 7.5% |
| $200,000+ | 101 | 47.2% |
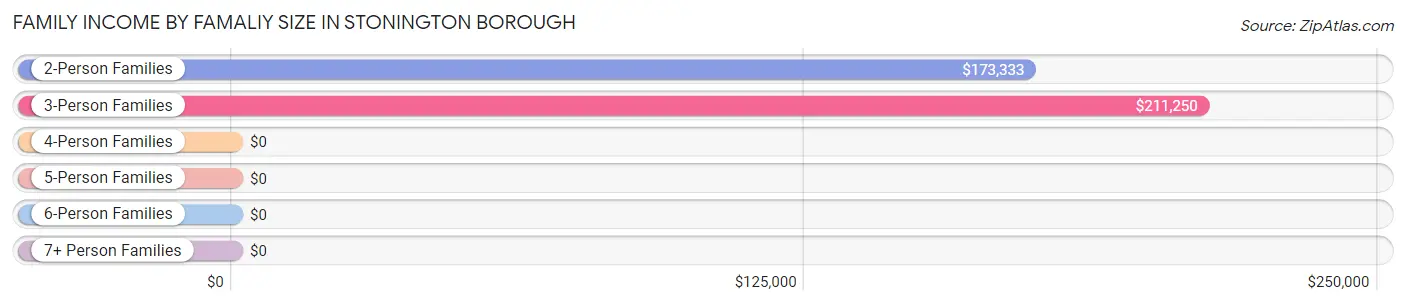
Family Income by Famaliy Size in Stonington borough
3-person families (30 | 14.0%) account for the highest median family income in Stonington borough with $211,250 per family, while 2-person families (158 | 73.8%) have the highest median income of $86,666 per family member.
| Income Bracket | # Families | Median Income |
| 2-Person Families | 158 (73.8%) | $173,333 |
| 3-Person Families | 30 (14.0%) | $211,250 |
| 4-Person Families | 22 (10.3%) | $0 |
| 5-Person Families | 4 (1.9%) | $0 |
| 6-Person Families | 0 (0.0%) | $0 |
| 7+ Person Families | 0 (0.0%) | $0 |
| Total | 214 (100.0%) | $173,889 |
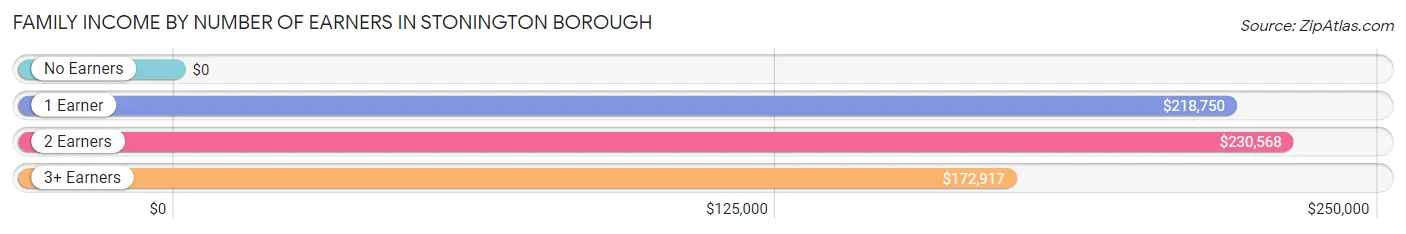
Family Income by Number of Earners in Stonington borough
| Number of Earners | # Families | Median Income |
| No Earners | 61 (28.5%) | $0 |
| 1 Earner | 61 (28.5%) | $218,750 |
| 2 Earners | 81 (37.9%) | $230,568 |
| 3+ Earners | 11 (5.1%) | $172,917 |
| Total | 214 (100.0%) | $173,889 |
Household Income in Stonington borough
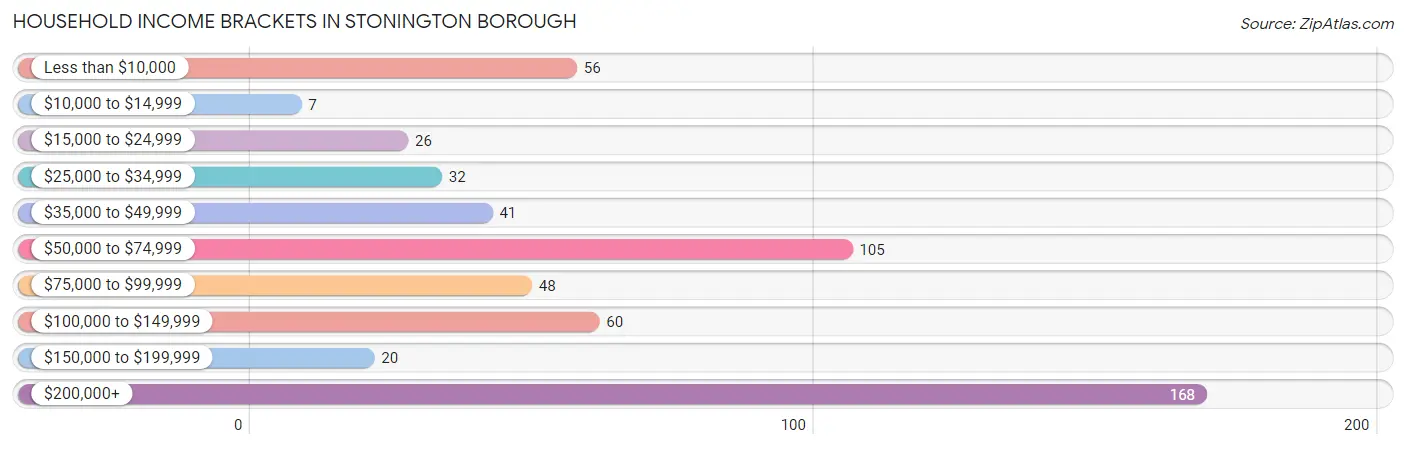
Household Income Brackets in Stonington borough
With 168 households falling in the category, the $200,000+ income range is the most frequent in Stonington borough, accounting for 29.8% of all households. In contrast, only 7 households (1.2%) fall into the $10,000 to $14,999 income bracket, making it the least populous group.
| Income Bracket | # Households | % Households |
| Less than $10,000 | 56 | 9.9% |
| $10,000 to $14,999 | 7 | 1.2% |
| $15,000 to $24,999 | 26 | 4.6% |
| $25,000 to $34,999 | 32 | 5.7% |
| $35,000 to $49,999 | 41 | 7.3% |
| $50,000 to $74,999 | 105 | 18.7% |
| $75,000 to $99,999 | 48 | 8.5% |
| $100,000 to $149,999 | 60 | 10.7% |
| $150,000 to $199,999 | 20 | 3.6% |
| $200,000+ | 168 | 29.8% |
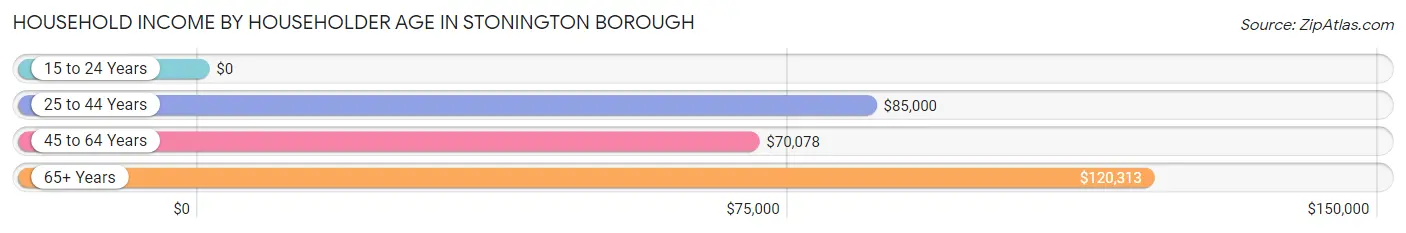
Household Income by Householder Age in Stonington borough
The median household income in Stonington borough is $84,583, with the highest median household income of $120,313 found in the 65+ years age bracket for the primary householder. A total of 267 households (47.4%) fall into this category. Meanwhile, the 15 to 24 years age bracket for the primary householder has the lowest median household income of $0, with 15 households (2.7%) in this group.
| Income Bracket | # Households | Median Income |
| 15 to 24 Years | 15 (2.7%) | $0 |
| 25 to 44 Years | 80 (14.2%) | $85,000 |
| 45 to 64 Years | 201 (35.7%) | $70,078 |
| 65+ Years | 267 (47.4%) | $120,313 |
| Total | 563 (100.0%) | $84,583 |
Poverty in Stonington borough
Income Below Poverty by Sex and Age in Stonington borough
With 10.5% poverty level for males and 3.0% for females among the residents of Stonington borough, 45 to 54 year old males and 25 to 34 year old females are the most vulnerable to poverty, with 16 males (41.0%) and 3 females (7.9%) in their respective age groups living below the poverty level.
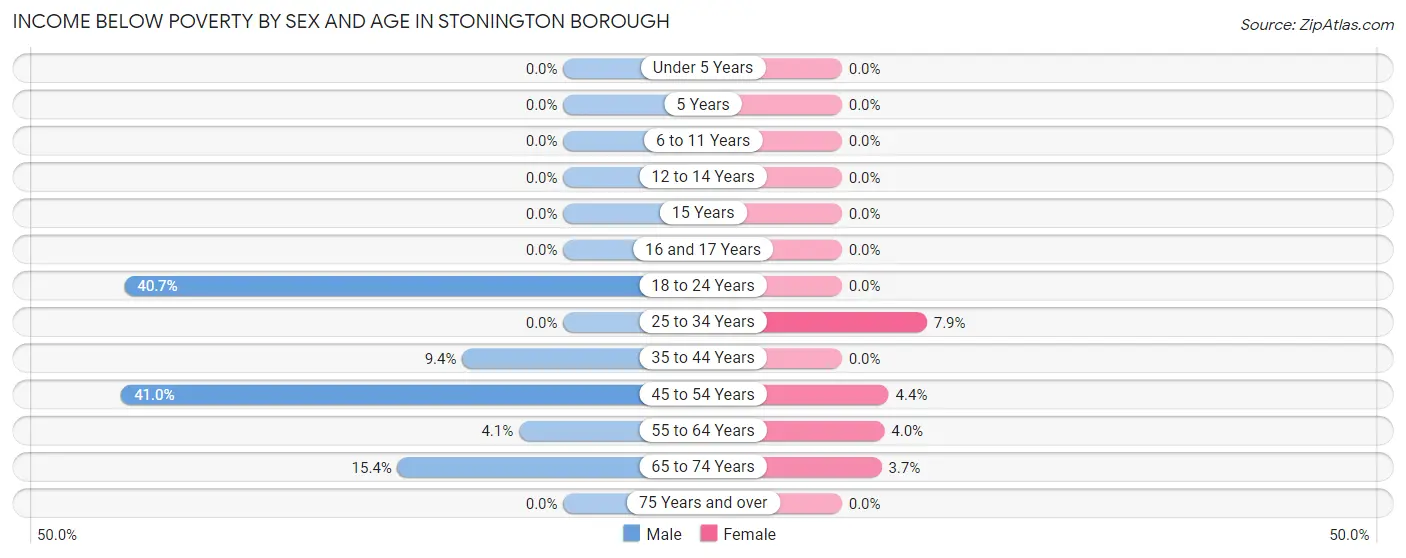
| Age Bracket | Male | Female |
| Under 5 Years | 0 (0.0%) | 0 (0.0%) |
| 5 Years | 0 (0.0%) | 0 (0.0%) |
| 6 to 11 Years | 0 (0.0%) | 0 (0.0%) |
| 12 to 14 Years | 0 (0.0%) | 0 (0.0%) |
| 15 Years | 0 (0.0%) | 0 (0.0%) |
| 16 and 17 Years | 0 (0.0%) | 0 (0.0%) |
| 18 to 24 Years | 11 (40.7%) | 0 (0.0%) |
| 25 to 34 Years | 0 (0.0%) | 3 (7.9%) |
| 35 to 44 Years | 3 (9.4%) | 0 (0.0%) |
| 45 to 54 Years | 16 (41.0%) | 4 (4.3%) |
| 55 to 64 Years | 3 (4.1%) | 3 (4.0%) |
| 65 to 74 Years | 14 (15.4%) | 5 (3.7%) |
| 75 Years and over | 0 (0.0%) | 0 (0.0%) |
| Total | 47 (10.5%) | 15 (3.0%) |
Income Above Poverty by Sex and Age in Stonington borough
According to the poverty statistics in Stonington borough, males aged under 5 years and females aged 6 to 11 years are the age groups that are most secure financially, with 100.0% of males and 100.0% of females in these age groups living above the poverty line.
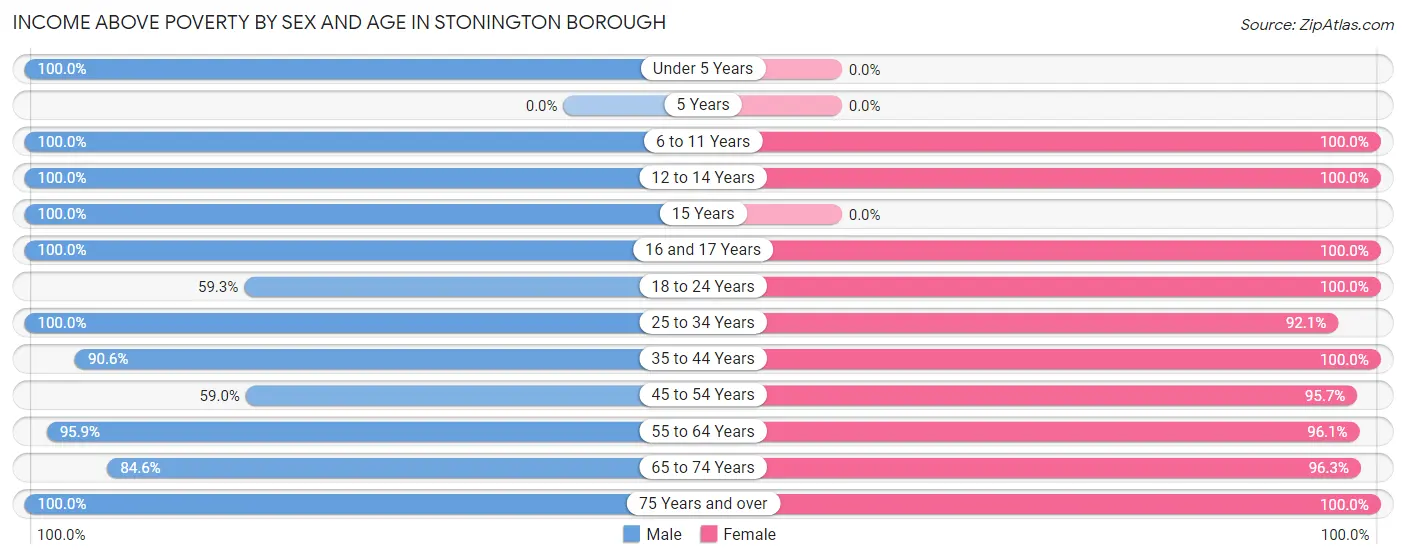
| Age Bracket | Male | Female |
| Under 5 Years | 8 (100.0%) | 0 (0.0%) |
| 5 Years | 0 (0.0%) | 0 (0.0%) |
| 6 to 11 Years | 4 (100.0%) | 26 (100.0%) |
| 12 to 14 Years | 42 (100.0%) | 17 (100.0%) |
| 15 Years | 3 (100.0%) | 0 (0.0%) |
| 16 and 17 Years | 33 (100.0%) | 4 (100.0%) |
| 18 to 24 Years | 16 (59.3%) | 16 (100.0%) |
| 25 to 34 Years | 29 (100.0%) | 35 (92.1%) |
| 35 to 44 Years | 29 (90.6%) | 14 (100.0%) |
| 45 to 54 Years | 23 (59.0%) | 88 (95.7%) |
| 55 to 64 Years | 70 (95.9%) | 73 (96.1%) |
| 65 to 74 Years | 77 (84.6%) | 131 (96.3%) |
| 75 Years and over | 68 (100.0%) | 74 (100.0%) |
| Total | 402 (89.5%) | 478 (97.0%) |
Income Below Poverty Among Married-Couple Families in Stonington borough
The poverty statistics for married-couple families in Stonington borough show that 1.8% or 3 of the total 168 families live below the poverty line. Families with no children have the highest poverty rate of 2.3%, comprising of 3 families. On the other hand, families with 1 or 2 children have the lowest poverty rate of 0.0%, which includes 0 families.
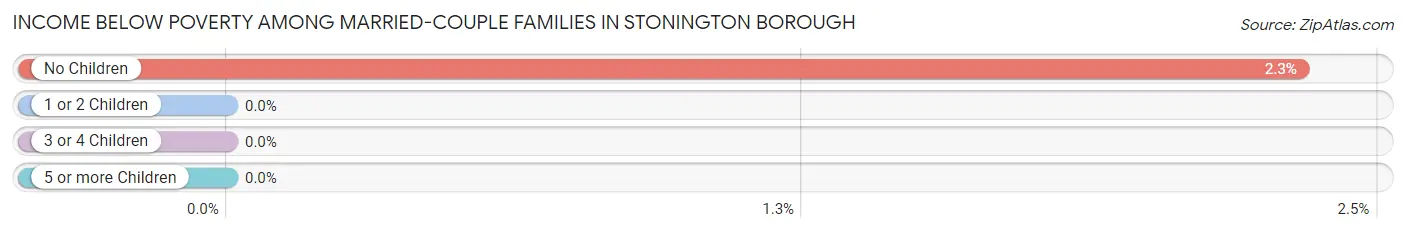
| Children | Above Poverty | Below Poverty |
| No Children | 126 (97.7%) | 3 (2.3%) |
| 1 or 2 Children | 39 (100.0%) | 0 (0.0%) |
| 3 or 4 Children | 0 (0.0%) | 0 (0.0%) |
| 5 or more Children | 0 (0.0%) | 0 (0.0%) |
| Total | 165 (98.2%) | 3 (1.8%) |
Income Below Poverty Among Single-Parent Households in Stonington borough
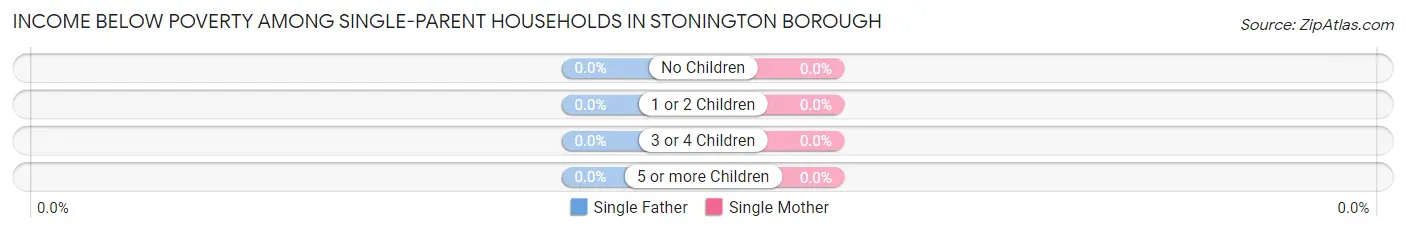
| Children | Single Father | Single Mother |
| No Children | 0 (0.0%) | 0 (0.0%) |
| 1 or 2 Children | 0 (0.0%) | 0 (0.0%) |
| 3 or 4 Children | 0 (0.0%) | 0 (0.0%) |
| 5 or more Children | 0 (0.0%) | 0 (0.0%) |
| Total | 0 (0.0%) | 0 (0.0%) |
Income Below Poverty Among Married-Couple vs Single-Parent Households in Stonington borough
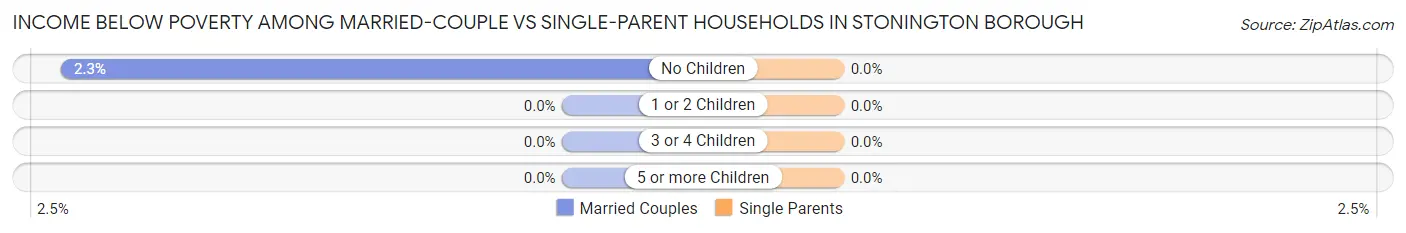
| Children | Married-Couple Families | Single-Parent Households |
| No Children | 3 (2.3%) | 0 (0.0%) |
| 1 or 2 Children | 0 (0.0%) | 0 (0.0%) |
| 3 or 4 Children | 0 (0.0%) | 0 (0.0%) |
| 5 or more Children | 0 (0.0%) | 0 (0.0%) |
| Total | 3 (1.8%) | 0 (0.0%) |
Race in Stonington borough
The most populous races in Stonington borough are White / Caucasian (861 | 91.4%), Two or more Races (58 | 6.2%), and Hispanic or Latino (56 | 5.9%).
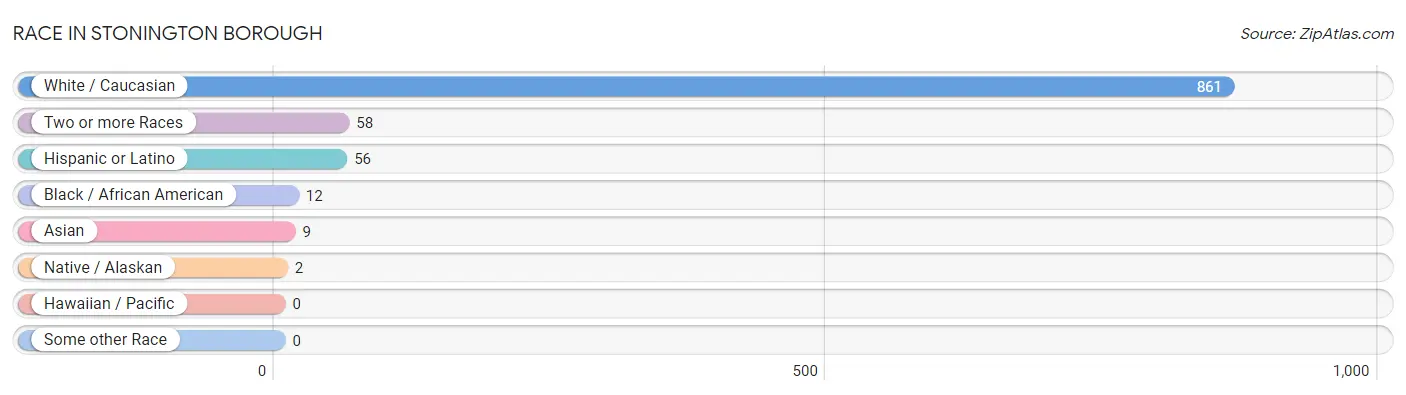
| Race | # Population | % Population |
| Asian | 9 | 1.0% |
| Black / African American | 12 | 1.3% |
| Hawaiian / Pacific | 0 | 0.0% |
| Hispanic or Latino | 56 | 5.9% |
| Native / Alaskan | 2 | 0.2% |
| White / Caucasian | 861 | 91.4% |
| Two or more Races | 58 | 6.2% |
| Some other Race | 0 | 0.0% |
| Total | 942 | 100.0% |
Ancestry in Stonington borough
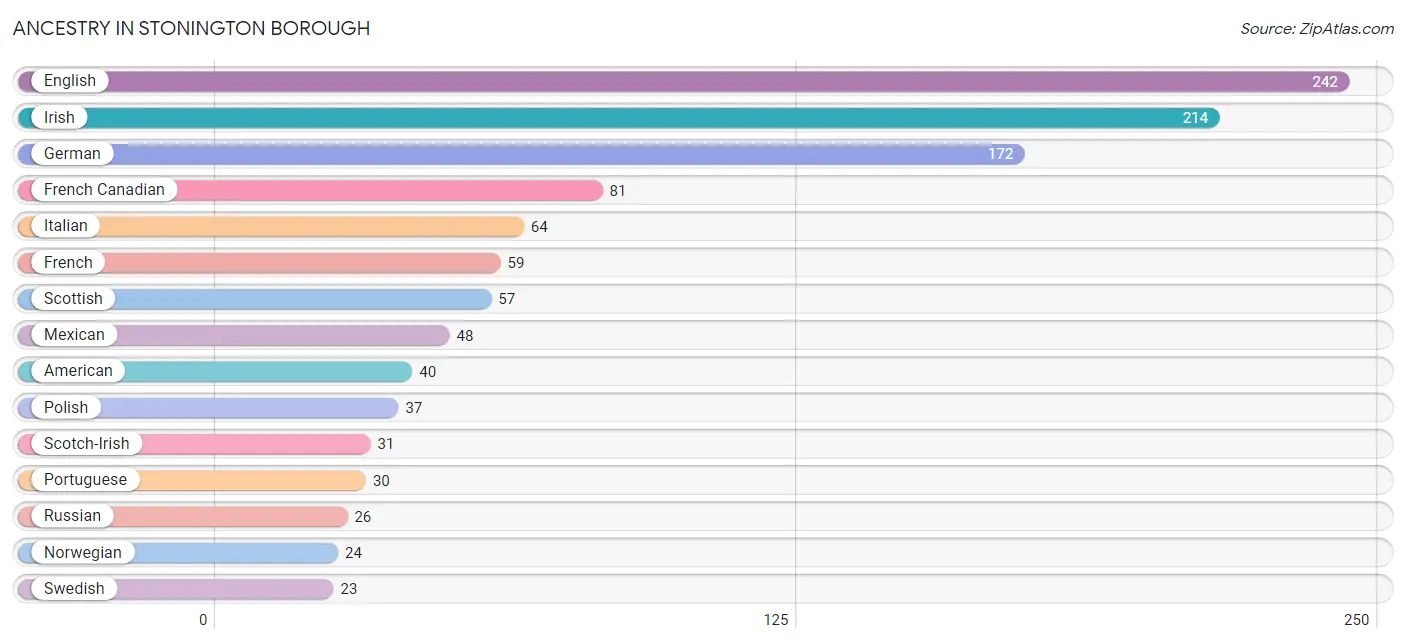
The most populous ancestries reported in Stonington borough are English (242 | 25.7%), Irish (214 | 22.7%), German (172 | 18.3%), French Canadian (81 | 8.6%), and Italian (64 | 6.8%), together accounting for 82.1% of all Stonington borough residents.
| Ancestry | # Population | % Population |
| American | 40 | 4.3% |
| Arab | 2 | 0.2% |
| Armenian | 2 | 0.2% |
| British | 8 | 0.9% |
| Burmese | 8 | 0.9% |
| Celtic | 6 | 0.6% |
| Cuban | 2 | 0.2% |
| Czech | 3 | 0.3% |
| Czechoslovakian | 2 | 0.2% |
| Danish | 6 | 0.6% |
| Dutch | 3 | 0.3% |
| Eastern European | 10 | 1.1% |
| English | 242 | 25.7% |
| European | 18 | 1.9% |
| French | 59 | 6.3% |
| French Canadian | 81 | 8.6% |
| German | 172 | 18.3% |
| Hungarian | 10 | 1.1% |
| Indian (Asian) | 1 | 0.1% |
| Irish | 214 | 22.7% |
| Italian | 64 | 6.8% |
| Jamaican | 4 | 0.4% |
| Lebanese | 2 | 0.2% |
| Mexican | 48 | 5.1% |
| Norwegian | 24 | 2.5% |
| Polish | 37 | 3.9% |
| Portuguese | 30 | 3.2% |
| Russian | 26 | 2.8% |
| Scotch-Irish | 31 | 3.3% |
| Scottish | 57 | 6.0% |
| Serbian | 16 | 1.7% |
| Spaniard | 3 | 0.3% |
| Spanish | 3 | 0.3% |
| Subsaharan African | 4 | 0.4% |
| Swedish | 23 | 2.4% |
| Swiss | 3 | 0.3% |
| Turkish | 16 | 1.7% |
| Ugandan | 4 | 0.4% |
| Ukrainian | 4 | 0.4% |
| Welsh | 13 | 1.4% | View All 40 Rows |
Immigrants in Stonington borough
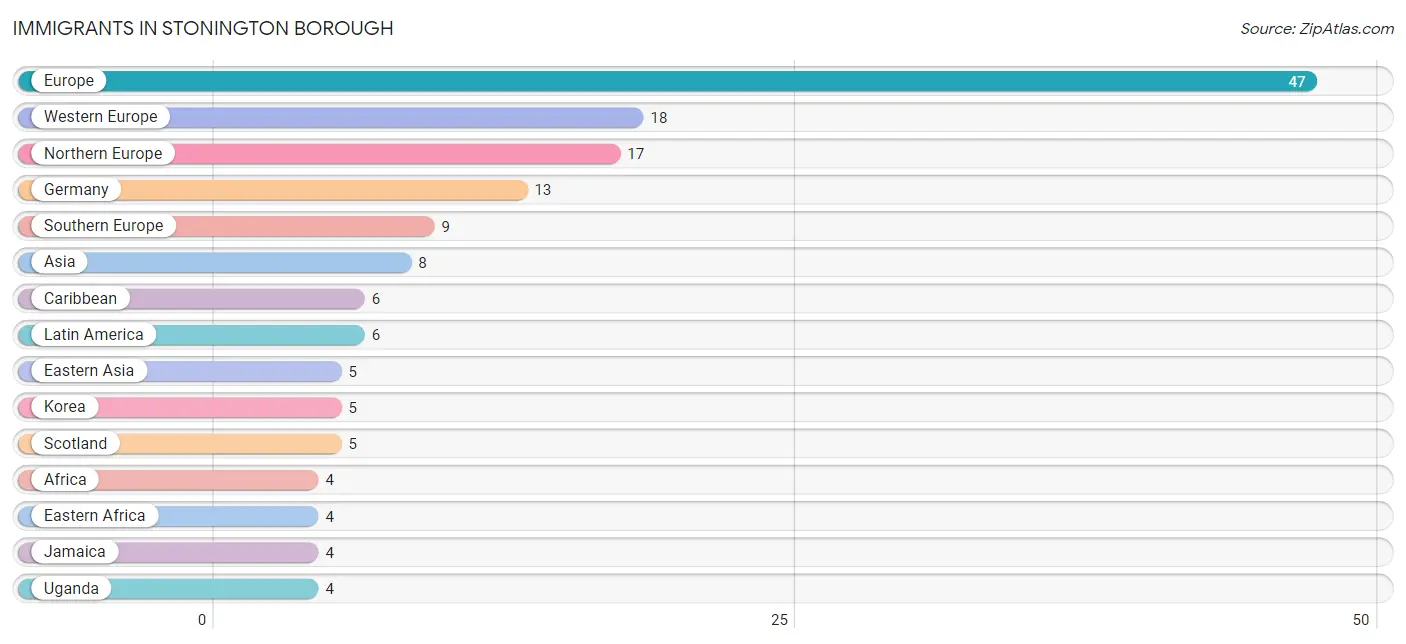
The most numerous immigrant groups reported in Stonington borough came from Europe (47 | 5.0%), Western Europe (18 | 1.9%), Northern Europe (17 | 1.8%), Germany (13 | 1.4%), and Southern Europe (9 | 1.0%), together accounting for 11.0% of all Stonington borough residents.
| Immigration Origin | # Population | % Population |
| Africa | 4 | 0.4% |
| Asia | 8 | 0.9% |
| Canada | 3 | 0.3% |
| Caribbean | 6 | 0.6% |
| Cuba | 2 | 0.2% |
| Czechoslovakia | 3 | 0.3% |
| Eastern Africa | 4 | 0.4% |
| Eastern Asia | 5 | 0.5% |
| Eastern Europe | 3 | 0.3% |
| England | 3 | 0.3% |
| Europe | 47 | 5.0% |
| France | 3 | 0.3% |
| Germany | 13 | 1.4% |
| Italy | 3 | 0.3% |
| Jamaica | 4 | 0.4% |
| Korea | 5 | 0.5% |
| Latin America | 6 | 0.6% |
| Northern Europe | 17 | 1.8% |
| Portugal | 3 | 0.3% |
| Scotland | 5 | 0.5% |
| Southern Europe | 9 | 1.0% |
| Spain | 3 | 0.3% |
| Switzerland | 2 | 0.2% |
| Turkey | 3 | 0.3% |
| Uganda | 4 | 0.4% |
| Western Asia | 3 | 0.3% |
| Western Europe | 18 | 1.9% | View All 27 Rows |
Sex and Age in Stonington borough
Sex and Age in Stonington borough
The most populous age groups in Stonington borough are 75 to 79 Years (57 | 12.7%) for men and 70 to 74 Years (69 | 14.0%) for women.
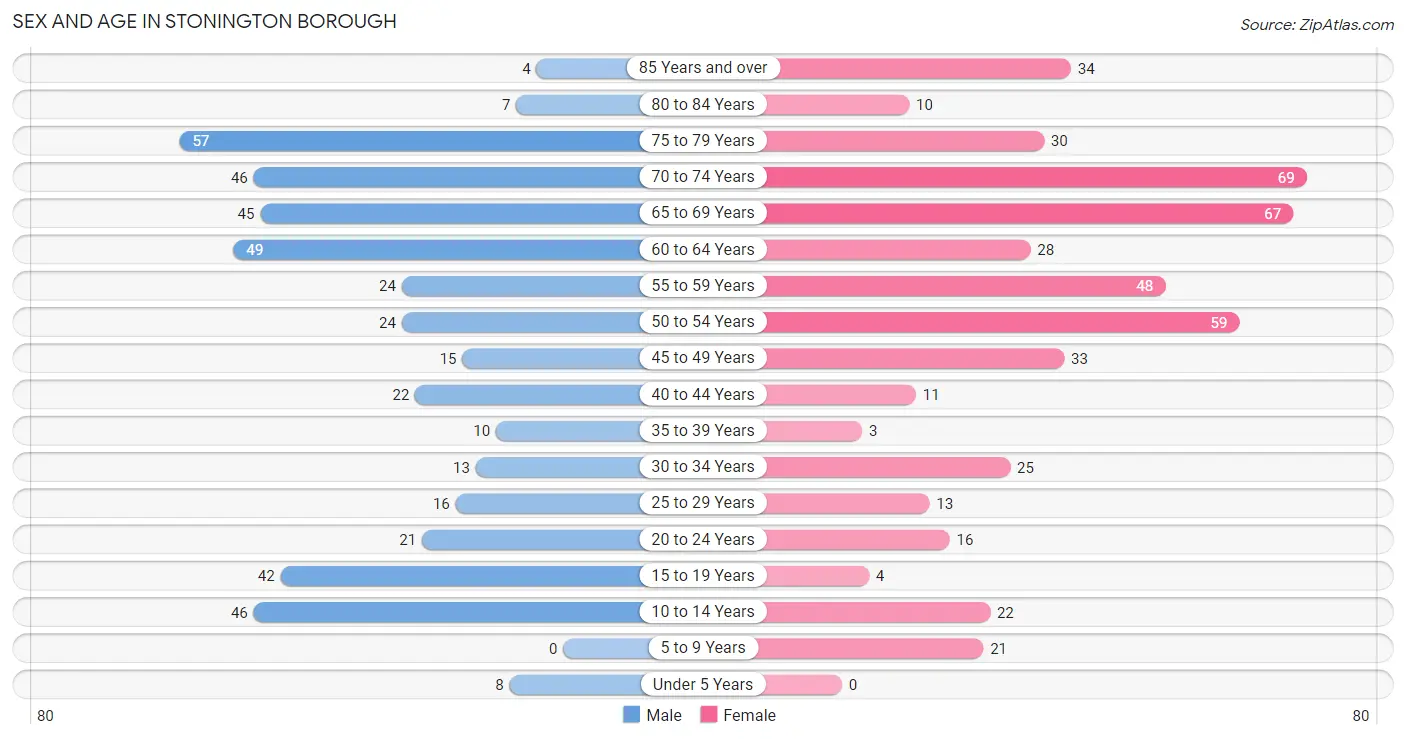
| Age Bracket | Male | Female |
| Under 5 Years | 8 (1.8%) | 0 (0.0%) |
| 5 to 9 Years | 0 (0.0%) | 21 (4.3%) |
| 10 to 14 Years | 46 (10.2%) | 22 (4.5%) |
| 15 to 19 Years | 42 (9.3%) | 4 (0.8%) |
| 20 to 24 Years | 21 (4.7%) | 16 (3.3%) |
| 25 to 29 Years | 16 (3.6%) | 13 (2.6%) |
| 30 to 34 Years | 13 (2.9%) | 25 (5.1%) |
| 35 to 39 Years | 10 (2.2%) | 3 (0.6%) |
| 40 to 44 Years | 22 (4.9%) | 11 (2.2%) |
| 45 to 49 Years | 15 (3.3%) | 33 (6.7%) |
| 50 to 54 Years | 24 (5.3%) | 59 (12.0%) |
| 55 to 59 Years | 24 (5.3%) | 48 (9.7%) |
| 60 to 64 Years | 49 (10.9%) | 28 (5.7%) |
| 65 to 69 Years | 45 (10.0%) | 67 (13.6%) |
| 70 to 74 Years | 46 (10.2%) | 69 (14.0%) |
| 75 to 79 Years | 57 (12.7%) | 30 (6.1%) |
| 80 to 84 Years | 7 (1.6%) | 10 (2.0%) |
| 85 Years and over | 4 (0.9%) | 34 (6.9%) |
| Total | 449 (100.0%) | 493 (100.0%) |
Families and Households in Stonington borough
Median Family Size in Stonington borough
The median family size in Stonington borough is 2.63 persons per family, with single female/mother families (28 | 13.1%) accounting for the largest median family size of 3.71 persons per family. On the other hand, married-couple families (168 | 78.5%) represent the smallest median family size with 2.40 persons per family.
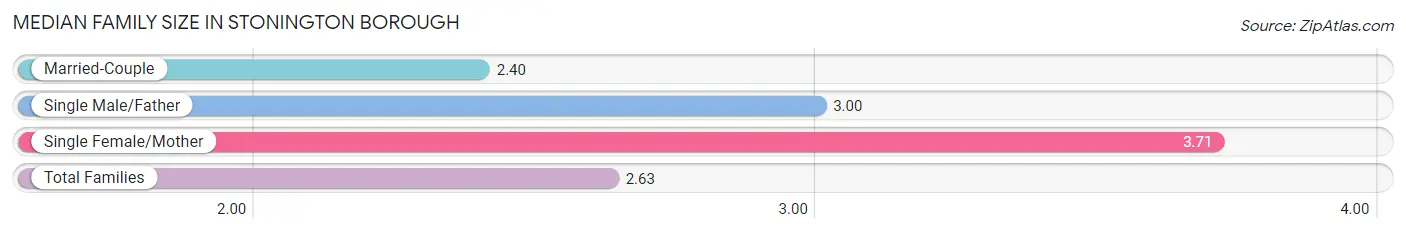
| Family Type | # Families | Family Size |
| Married-Couple | 168 (78.5%) | 2.40 |
| Single Male/Father | 18 (8.4%) | 3.00 |
| Single Female/Mother | 28 (13.1%) | 3.71 |
| Total Families | 214 (100.0%) | 2.63 |
Median Household Size in Stonington borough
The median household size in Stonington borough is 1.67 persons per household, with single female/mother households (28 | 5.0%) accounting for the largest median household size of 3.89 persons per household. non-family households (349 | 62.0%) represent the smallest median household size with 1.06 persons per household.
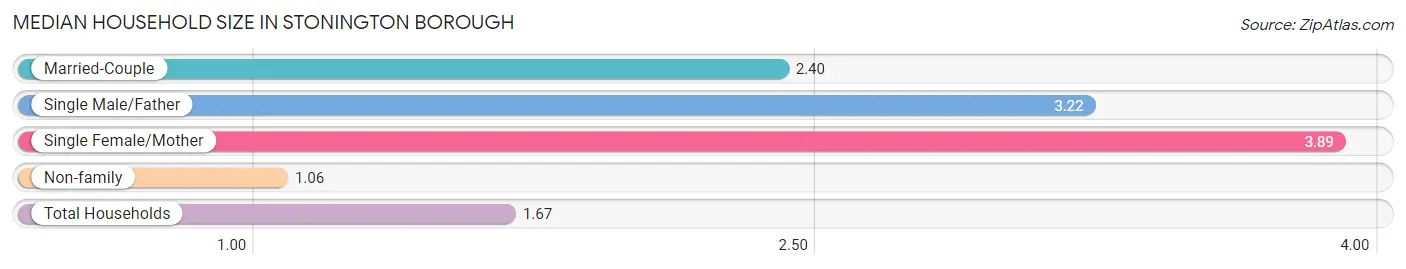
| Household Type | # Households | Household Size |
| Married-Couple | 168 (29.8%) | 2.40 |
| Single Male/Father | 18 (3.2%) | 3.22 |
| Single Female/Mother | 28 (5.0%) | 3.89 |
| Non-family | 349 (62.0%) | 1.06 |
| Total Households | 563 (100.0%) | 1.67 |
Household Size by Marriage Status in Stonington borough
Out of a total of 563 households in Stonington borough, 214 (38.0%) are family households, while 349 (62.0%) are nonfamily households. The most numerous type of family households are 2-person households, comprising 158, and the most common type of nonfamily households are 1-person households, comprising 333.
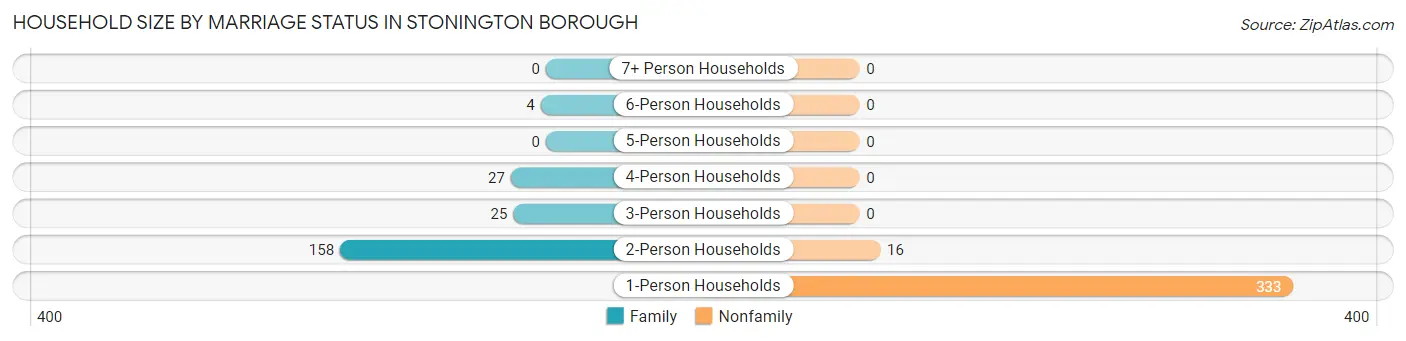
| Household Size | Family Households | Nonfamily Households |
| 1-Person Households | - | 333 (59.2%) |
| 2-Person Households | 158 (28.1%) | 16 (2.8%) |
| 3-Person Households | 25 (4.4%) | 0 (0.0%) |
| 4-Person Households | 27 (4.8%) | 0 (0.0%) |
| 5-Person Households | 0 (0.0%) | 0 (0.0%) |
| 6-Person Households | 4 (0.7%) | 0 (0.0%) |
| 7+ Person Households | 0 (0.0%) | 0 (0.0%) |
| Total | 214 (38.0%) | 349 (62.0%) |
Female Fertility in Stonington borough
Fertility by Age in Stonington borough
| Age Bracket | Women with Births | Births / 1,000 Women |
| 15 to 19 years | 0 (0.0%) | 0.0 |
| 20 to 34 years | 0 (0.0%) | 0.0 |
| 35 to 50 years | 0 (0.0%) | 0.0 |
| Total | 0 (0.0%) | 0.0 |
Fertility by Age by Marriage Status in Stonington borough
| Age Bracket | Married | Unmarried |
| 15 to 19 years | 0 (0.0%) | 0 (0.0%) |
| 20 to 34 years | 0 (0.0%) | 0 (0.0%) |
| 35 to 50 years | 0 (0.0%) | 0 (0.0%) |
| Total | 0 (0.0%) | 0 (0.0%) |
Fertility by Education in Stonington borough
| Educational Attainment | Women with Births | Births / 1,000 Women |
| Less than High School | 0 (0.0%) | 0.0 |
| High School Diploma | 0 (0.0%) | 0.0 |
| College or Associate's Degree | 0 (0.0%) | 0.0 |
| Bachelor's Degree | 0 (0.0%) | 0.0 |
| Graduate Degree | 0 (0.0%) | 0.0 |
| Total | 0 (0.0%) | 0.0 |
Fertility by Education by Marriage Status in Stonington borough
| Educational Attainment | Married | Unmarried |
| Less than High School | 0 (0.0%) | 0 (0.0%) |
| High School Diploma | 0 (0.0%) | 0 (0.0%) |
| College or Associate's Degree | 0 (0.0%) | 0 (0.0%) |
| Bachelor's Degree | 0 (0.0%) | 0 (0.0%) |
| Graduate Degree | 0 (0.0%) | 0 (0.0%) |
| Total | 0 (0.0%) | 0 (0.0%) |
Employment Characteristics in Stonington borough
Employment by Class of Employer in Stonington borough
Among the 442 employed individuals in Stonington borough, private company employees (220 | 49.8%), self-employed (not incorporated) (63 | 14.2%), and not-for-profit organizations (63 | 14.2%) make up the most common classes of employment.
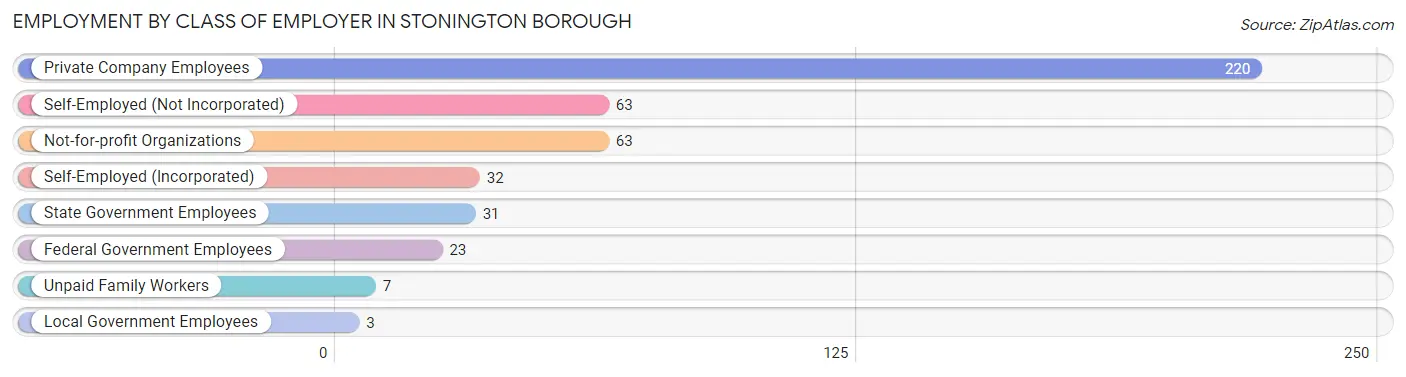
| Employer Class | # Employees | % Employees |
| Private Company Employees | 220 | 49.8% |
| Self-Employed (Incorporated) | 32 | 7.2% |
| Self-Employed (Not Incorporated) | 63 | 14.2% |
| Not-for-profit Organizations | 63 | 14.2% |
| Local Government Employees | 3 | 0.7% |
| State Government Employees | 31 | 7.0% |
| Federal Government Employees | 23 | 5.2% |
| Unpaid Family Workers | 7 | 1.6% |
| Total | 442 | 100.0% |
Employment Status by Age in Stonington borough
According to the labor force statistics for Stonington borough, out of the total population over 16 years of age (842), 55.9% or 471 individuals are in the labor force, with 6.5% or 31 of them unemployed. The age group with the highest labor force participation rate is 20 to 24 years, with 100.0% or 37 individuals in the labor force. Within the labor force, the 20 to 24 years age range has the highest percentage of unemployed individuals, with 29.7% or 11 of them being unemployed.
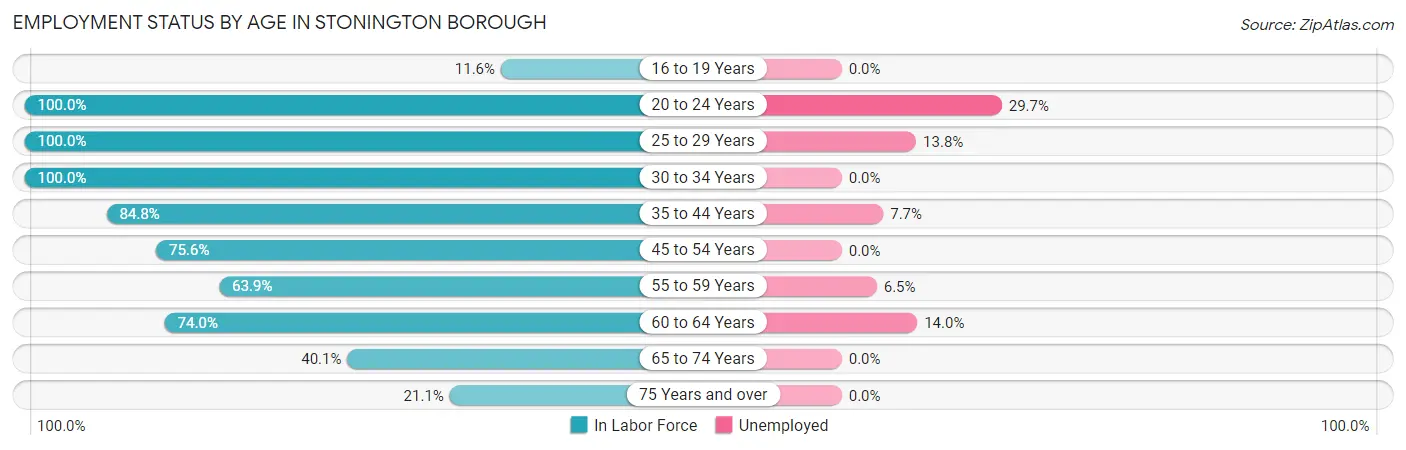
| Age Bracket | In Labor Force | Unemployed |
| 16 to 19 Years | 5 (11.6%) | 0 (0.0%) |
| 20 to 24 Years | 37 (100.0%) | 11 (29.7%) |
| 25 to 29 Years | 29 (100.0%) | 4 (13.8%) |
| 30 to 34 Years | 38 (100.0%) | 0 (0.0%) |
| 35 to 44 Years | 39 (84.8%) | 3 (7.7%) |
| 45 to 54 Years | 99 (75.6%) | 0 (0.0%) |
| 55 to 59 Years | 46 (63.9%) | 3 (6.5%) |
| 60 to 64 Years | 57 (74.0%) | 8 (14.0%) |
| 65 to 74 Years | 91 (40.1%) | 0 (0.0%) |
| 75 Years and over | 30 (21.1%) | 0 (0.0%) |
| Total | 471 (55.9%) | 31 (6.5%) |
Employment Status by Educational Attainment in Stonington borough
According to labor force statistics for Stonington borough, 78.4% of individuals (308) out of the total population between 25 and 64 years of age (393) are in the labor force, with 6.3% or 19 of them being unemployed. The group with the highest labor force participation rate are those with the educational attainment of high school diploma, with 87.5% or 49 individuals in the labor force. Within the labor force, individuals with high school diploma education have the highest percentage of unemployment, with 24.5% or 12 of them being unemployed.
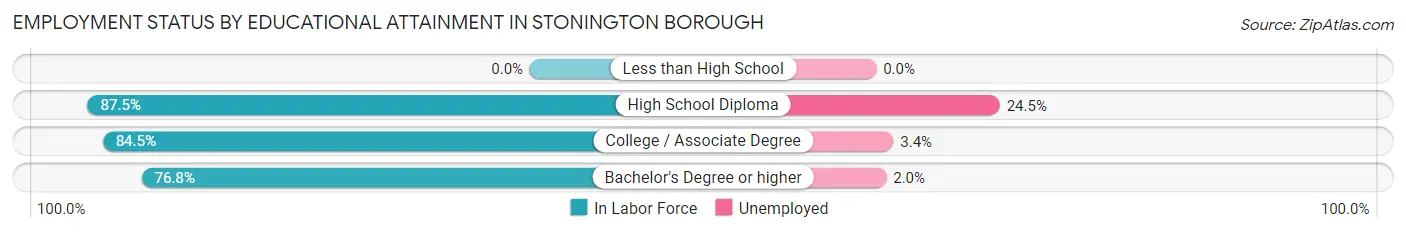
| Educational Attainment | In Labor Force | Unemployed |
| Less than High School | 0 (0.0%) | 0 (0.0%) |
| High School Diploma | 49 (87.5%) | 14 (24.5%) |
| College / Associate Degree | 87 (84.5%) | 4 (3.4%) |
| Bachelor's Degree or higher | 172 (76.8%) | 4 (2.0%) |
| Total | 308 (78.4%) | 25 (6.3%) |
Employment Occupations by Sex in Stonington borough
Management, Business, Science and Arts Occupations
The most common Management, Business, Science and Arts occupations in Stonington borough are Management (111 | 26.5%), Business & Financial (46 | 11.0%), Community & Social Service (37 | 8.8%), Computers, Engineering & Science (35 | 8.4%), and Health Diagnosing & Treating (18 | 4.3%).
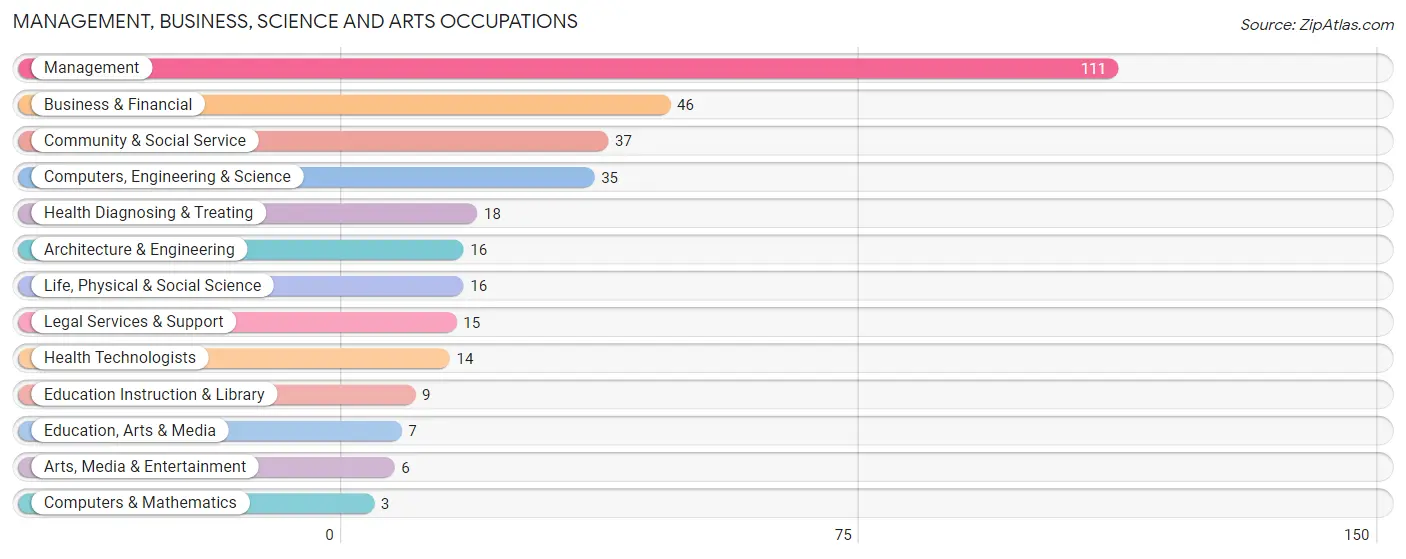
Management, Business, Science and Arts Occupations by Sex
Within the Management, Business, Science and Arts occupations in Stonington borough, the most male-oriented occupations are Computers & Mathematics (100.0%), Management (59.5%), and Business & Financial (58.7%), while the most female-oriented occupations are Education, Arts & Media (100.0%), Arts, Media & Entertainment (100.0%), and Life, Physical & Social Science (87.5%).
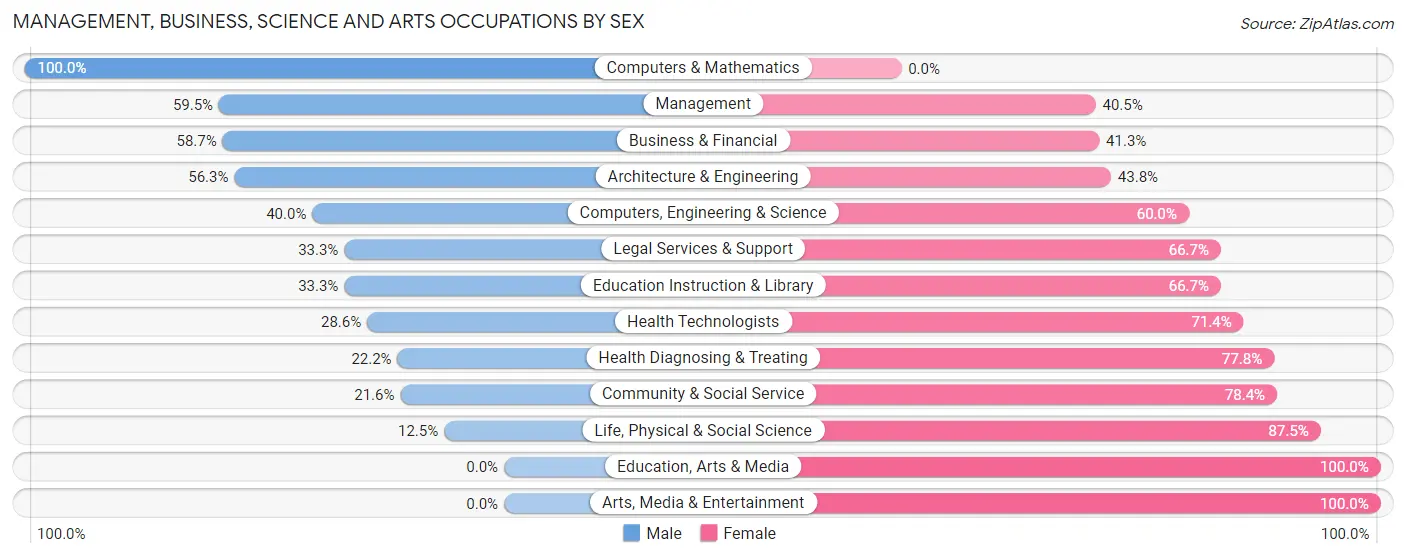
| Occupation | Male | Female |
| Management | 66 (59.5%) | 45 (40.5%) |
| Business & Financial | 27 (58.7%) | 19 (41.3%) |
| Computers, Engineering & Science | 14 (40.0%) | 21 (60.0%) |
| Computers & Mathematics | 3 (100.0%) | 0 (0.0%) |
| Architecture & Engineering | 9 (56.2%) | 7 (43.8%) |
| Life, Physical & Social Science | 2 (12.5%) | 14 (87.5%) |
| Community & Social Service | 8 (21.6%) | 29 (78.4%) |
| Education, Arts & Media | 0 (0.0%) | 7 (100.0%) |
| Legal Services & Support | 5 (33.3%) | 10 (66.7%) |
| Education Instruction & Library | 3 (33.3%) | 6 (66.7%) |
| Arts, Media & Entertainment | 0 (0.0%) | 6 (100.0%) |
| Health Diagnosing & Treating | 4 (22.2%) | 14 (77.8%) |
| Health Technologists | 4 (28.6%) | 10 (71.4%) |
| Total (Category) | 119 (48.2%) | 128 (51.8%) |
| Total (Overall) | 187 (44.6%) | 232 (55.4%) |
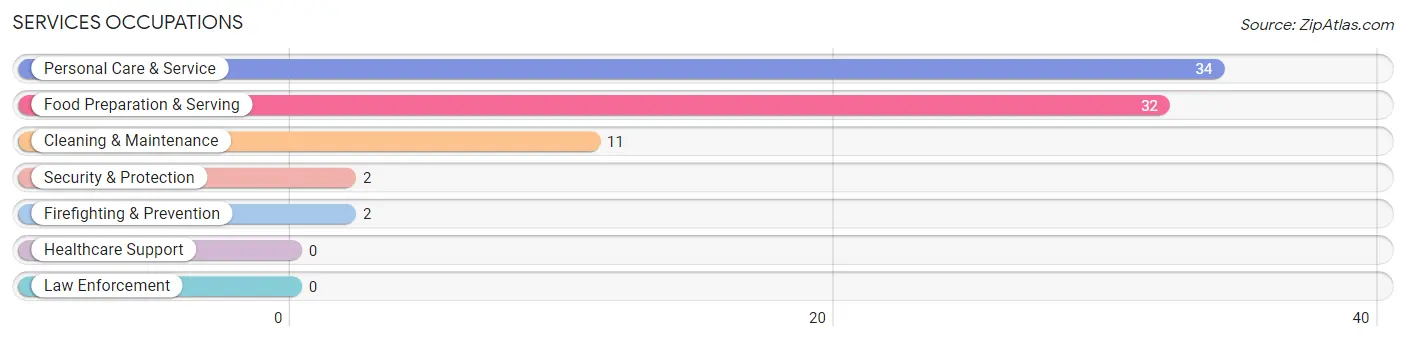
Services Occupations
The most common Services occupations in Stonington borough are Personal Care & Service (34 | 8.1%), Food Preparation & Serving (32 | 7.6%), Cleaning & Maintenance (11 | 2.6%), Security & Protection (2 | 0.5%), and Firefighting & Prevention (2 | 0.5%).
Services Occupations by Sex
Within the Services occupations in Stonington borough, the most male-oriented occupations are Security & Protection (100.0%), Firefighting & Prevention (100.0%), and Cleaning & Maintenance (100.0%), while the most female-oriented occupations are Personal Care & Service (100.0%), and Food Preparation & Serving (59.4%).
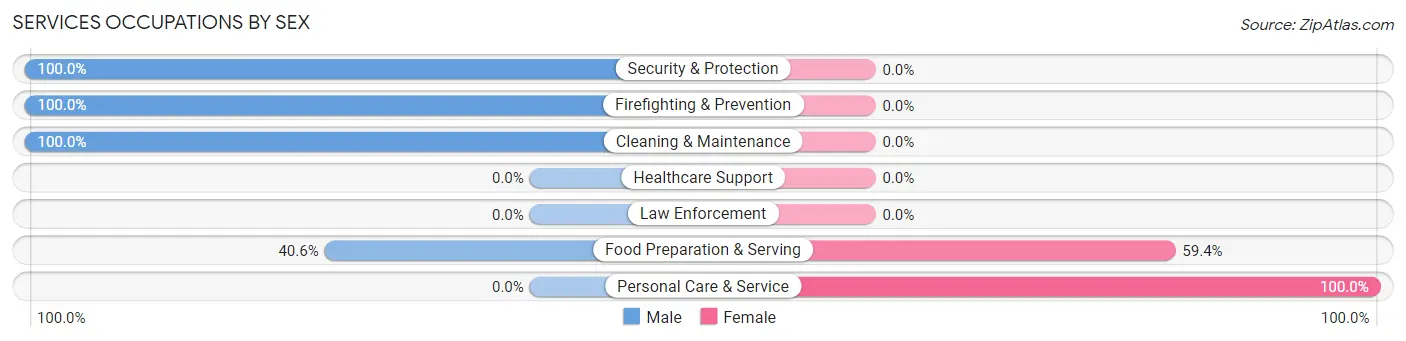
| Occupation | Male | Female |
| Healthcare Support | 0 (0.0%) | 0 (0.0%) |
| Security & Protection | 2 (100.0%) | 0 (0.0%) |
| Firefighting & Prevention | 2 (100.0%) | 0 (0.0%) |
| Law Enforcement | 0 (0.0%) | 0 (0.0%) |
| Food Preparation & Serving | 13 (40.6%) | 19 (59.4%) |
| Cleaning & Maintenance | 11 (100.0%) | 0 (0.0%) |
| Personal Care & Service | 0 (0.0%) | 34 (100.0%) |
| Total (Category) | 26 (32.9%) | 53 (67.1%) |
| Total (Overall) | 187 (44.6%) | 232 (55.4%) |
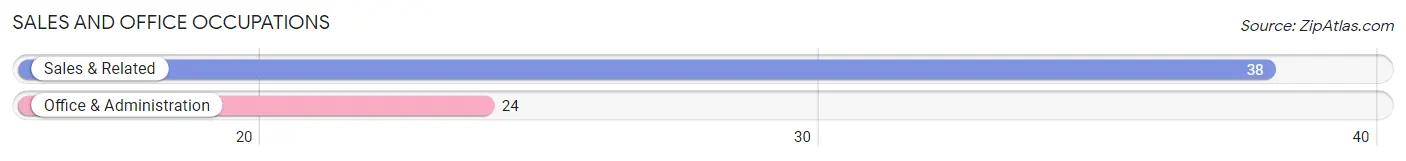
Sales and Office Occupations
The most common Sales and Office occupations in Stonington borough are Sales & Related (38 | 9.1%), and Office & Administration (24 | 5.7%).
Sales and Office Occupations by Sex
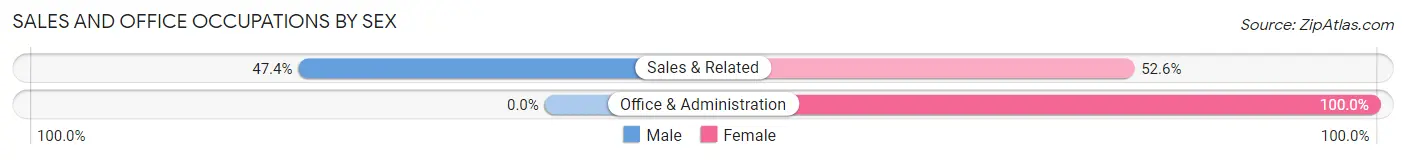
| Occupation | Male | Female |
| Sales & Related | 18 (47.4%) | 20 (52.6%) |
| Office & Administration | 0 (0.0%) | 24 (100.0%) |
| Total (Category) | 18 (29.0%) | 44 (71.0%) |
| Total (Overall) | 187 (44.6%) | 232 (55.4%) |
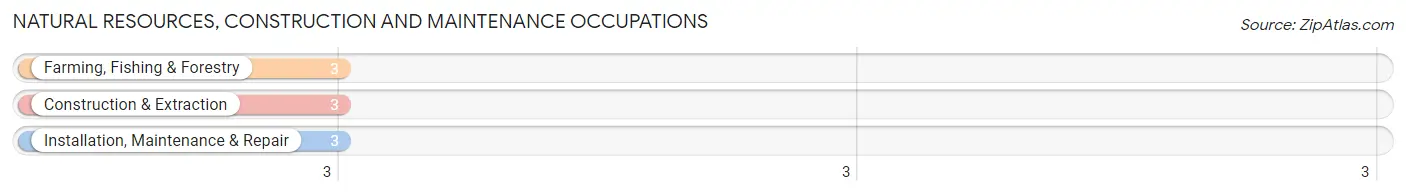
Natural Resources, Construction and Maintenance Occupations
The most common Natural Resources, Construction and Maintenance occupations in Stonington borough are Farming, Fishing & Forestry (3 | 0.7%), Construction & Extraction (3 | 0.7%), and Installation, Maintenance & Repair (3 | 0.7%).
Natural Resources, Construction and Maintenance Occupations by Sex
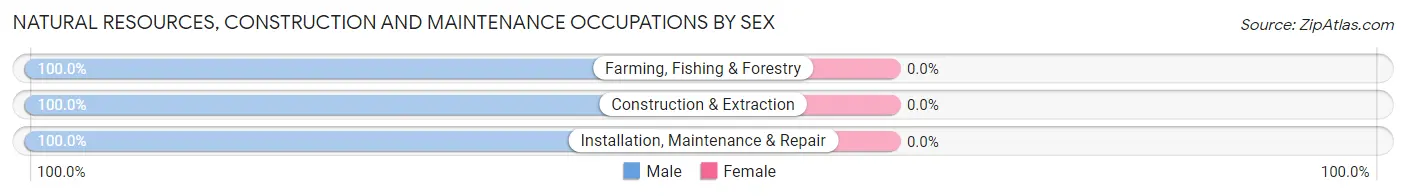
| Occupation | Male | Female |
| Farming, Fishing & Forestry | 3 (100.0%) | 0 (0.0%) |
| Construction & Extraction | 3 (100.0%) | 0 (0.0%) |
| Installation, Maintenance & Repair | 3 (100.0%) | 0 (0.0%) |
| Total (Category) | 9 (100.0%) | 0 (0.0%) |
| Total (Overall) | 187 (44.6%) | 232 (55.4%) |
Production, Transportation and Moving Occupations
The most common Production, Transportation and Moving occupations in Stonington borough are Transportation (9 | 2.1%), Material Moving (9 | 2.1%), and Production (4 | 0.9%).
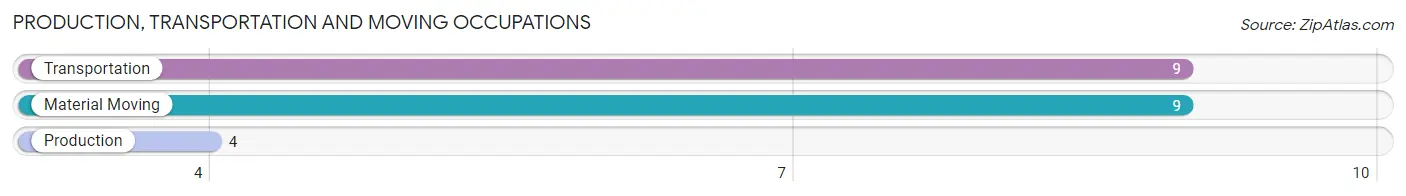
Production, Transportation and Moving Occupations by Sex
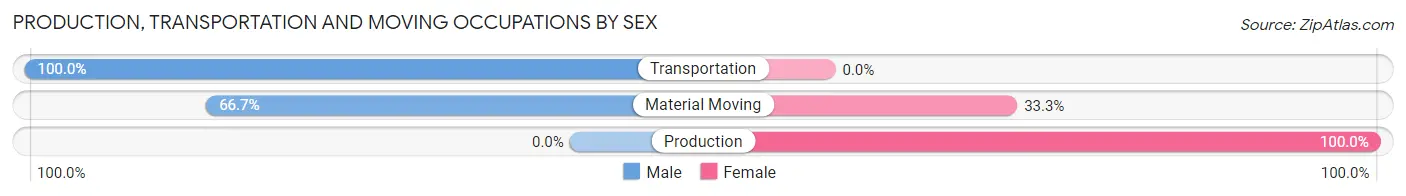
| Occupation | Male | Female |
| Production | 0 (0.0%) | 4 (100.0%) |
| Transportation | 9 (100.0%) | 0 (0.0%) |
| Material Moving | 6 (66.7%) | 3 (33.3%) |
| Total (Category) | 15 (68.2%) | 7 (31.8%) |
| Total (Overall) | 187 (44.6%) | 232 (55.4%) |
Employment Industries by Sex in Stonington borough
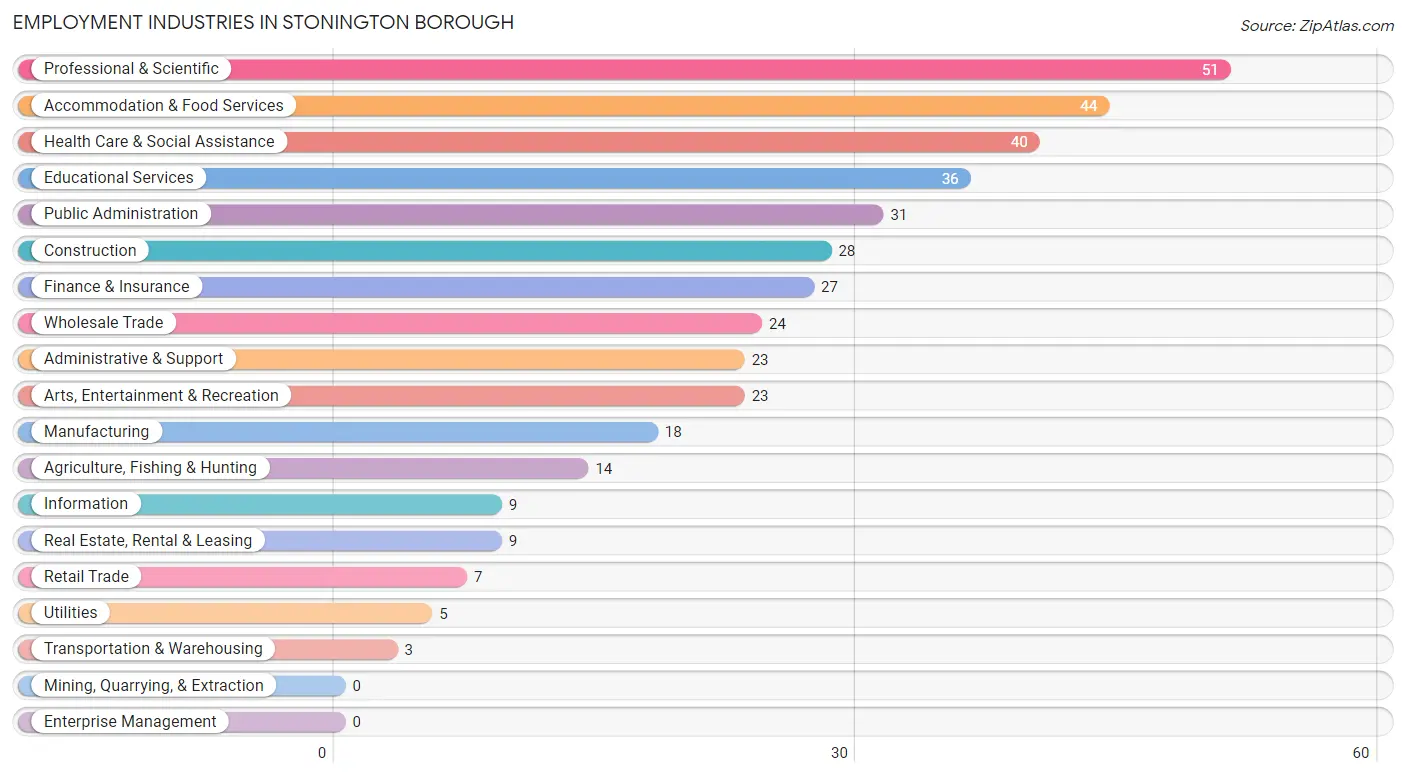
Employment Industries in Stonington borough
The major employment industries in Stonington borough include Professional & Scientific (51 | 12.2%), Accommodation & Food Services (44 | 10.5%), Health Care & Social Assistance (40 | 9.6%), Educational Services (36 | 8.6%), and Public Administration (31 | 7.4%).
Employment Industries by Sex in Stonington borough
The Stonington borough industries that see more men than women are Utilities (100.0%), Finance & Insurance (88.9%), and Construction (85.7%), whereas the industries that tend to have a higher number of women are Transportation & Warehousing (100.0%), Health Care & Social Assistance (90.0%), and Retail Trade (85.7%).
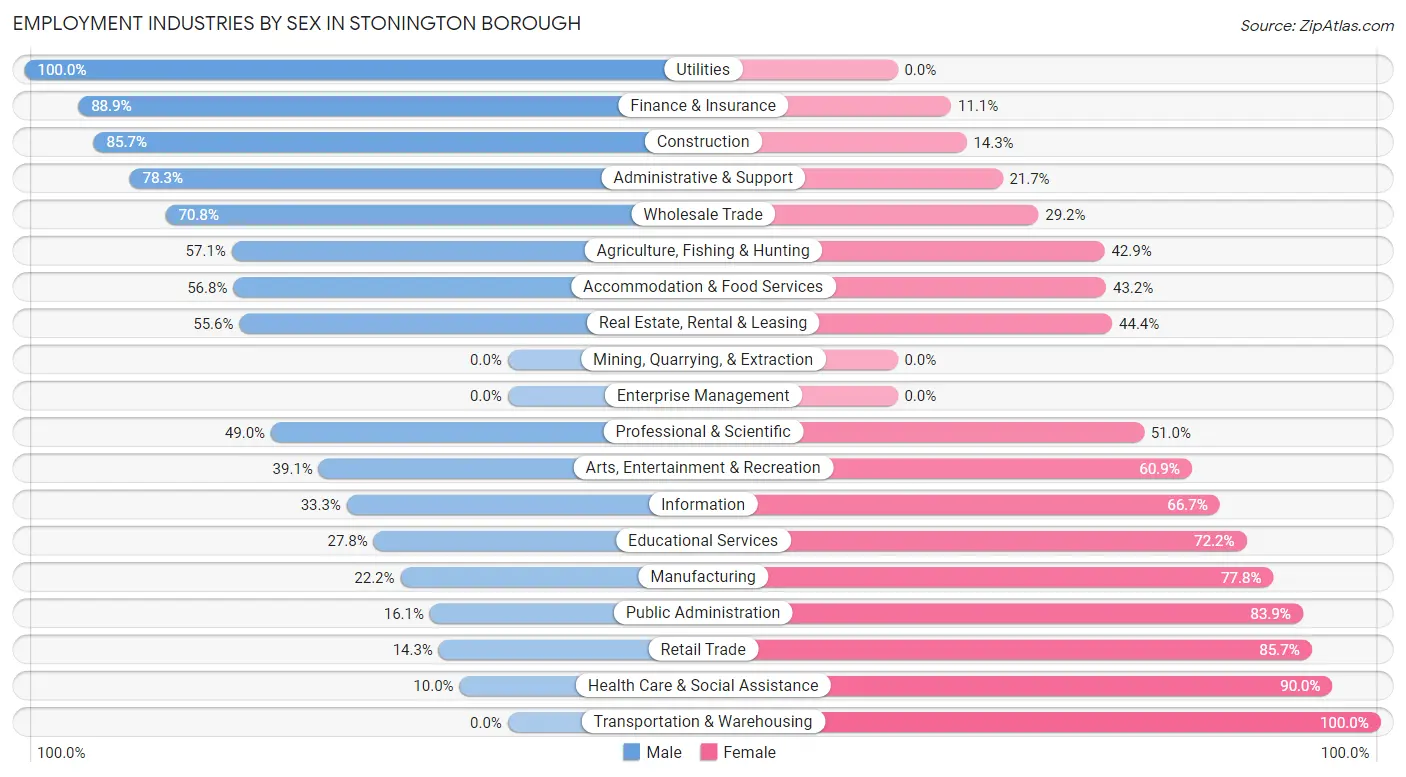
| Industry | Male | Female |
| Agriculture, Fishing & Hunting | 8 (57.1%) | 6 (42.9%) |
| Mining, Quarrying, & Extraction | 0 (0.0%) | 0 (0.0%) |
| Construction | 24 (85.7%) | 4 (14.3%) |
| Manufacturing | 4 (22.2%) | 14 (77.8%) |
| Wholesale Trade | 17 (70.8%) | 7 (29.2%) |
| Retail Trade | 1 (14.3%) | 6 (85.7%) |
| Transportation & Warehousing | 0 (0.0%) | 3 (100.0%) |
| Utilities | 5 (100.0%) | 0 (0.0%) |
| Information | 3 (33.3%) | 6 (66.7%) |
| Finance & Insurance | 24 (88.9%) | 3 (11.1%) |
| Real Estate, Rental & Leasing | 5 (55.6%) | 4 (44.4%) |
| Professional & Scientific | 25 (49.0%) | 26 (51.0%) |
| Enterprise Management | 0 (0.0%) | 0 (0.0%) |
| Administrative & Support | 18 (78.3%) | 5 (21.7%) |
| Educational Services | 10 (27.8%) | 26 (72.2%) |
| Health Care & Social Assistance | 4 (10.0%) | 36 (90.0%) |
| Arts, Entertainment & Recreation | 9 (39.1%) | 14 (60.9%) |
| Accommodation & Food Services | 25 (56.8%) | 19 (43.2%) |
| Public Administration | 5 (16.1%) | 26 (83.9%) |
| Total | 187 (44.6%) | 232 (55.4%) |
Education in Stonington borough
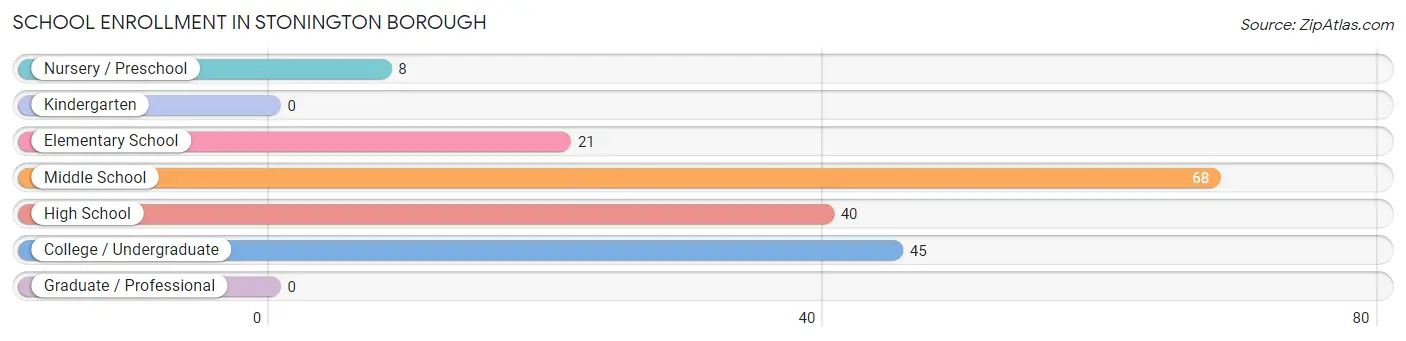
School Enrollment in Stonington borough
The most common levels of schooling among the 182 students in Stonington borough are middle school (68 | 37.4%), college / undergraduate (45 | 24.7%), and high school (40 | 22.0%).
| School Level | # Students | % Students |
| Nursery / Preschool | 8 | 4.4% |
| Kindergarten | 0 | 0.0% |
| Elementary School | 21 | 11.5% |
| Middle School | 68 | 37.4% |
| High School | 40 | 22.0% |
| College / Undergraduate | 45 | 24.7% |
| Graduate / Professional | 0 | 0.0% |
| Total | 182 | 100.0% |
School Enrollment by Age by Funding Source in Stonington borough
Out of a total of 182 students who are enrolled in schools in Stonington borough, 33 (18.1%) attend a private institution, while the remaining 149 (81.9%) are enrolled in public schools. The age group of 3 to 4 year olds has the highest likelihood of being enrolled in private schools, with 8 (100.0% in the age bracket) enrolled. Conversely, the age group of 18 to 19 year olds has the lowest likelihood of being enrolled in a private school, with 6 (100.0% in the age bracket) attending a public institution.
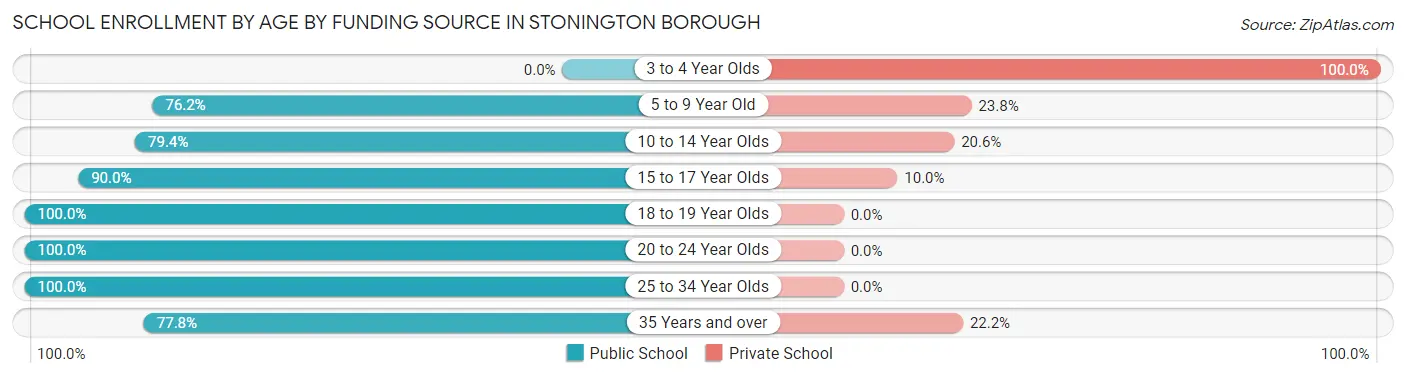
| Age Bracket | Public School | Private School |
| 3 to 4 Year Olds | 0 (0.0%) | 8 (100.0%) |
| 5 to 9 Year Old | 16 (76.2%) | 5 (23.8%) |
| 10 to 14 Year Olds | 54 (79.4%) | 14 (20.6%) |
| 15 to 17 Year Olds | 36 (90.0%) | 4 (10.0%) |
| 18 to 19 Year Olds | 6 (100.0%) | 0 (0.0%) |
| 20 to 24 Year Olds | 21 (100.0%) | 0 (0.0%) |
| 25 to 34 Year Olds | 9 (100.0%) | 0 (0.0%) |
| 35 Years and over | 7 (77.8%) | 2 (22.2%) |
| Total | 149 (81.9%) | 33 (18.1%) |
Educational Attainment by Field of Study in Stonington borough
Social sciences (104 | 18.1%), literature & languages (96 | 16.8%), business (66 | 11.5%), liberal arts & history (62 | 10.8%), and education (43 | 7.5%) are the most common fields of study among 573 individuals in Stonington borough who have obtained a bachelor's degree or higher.
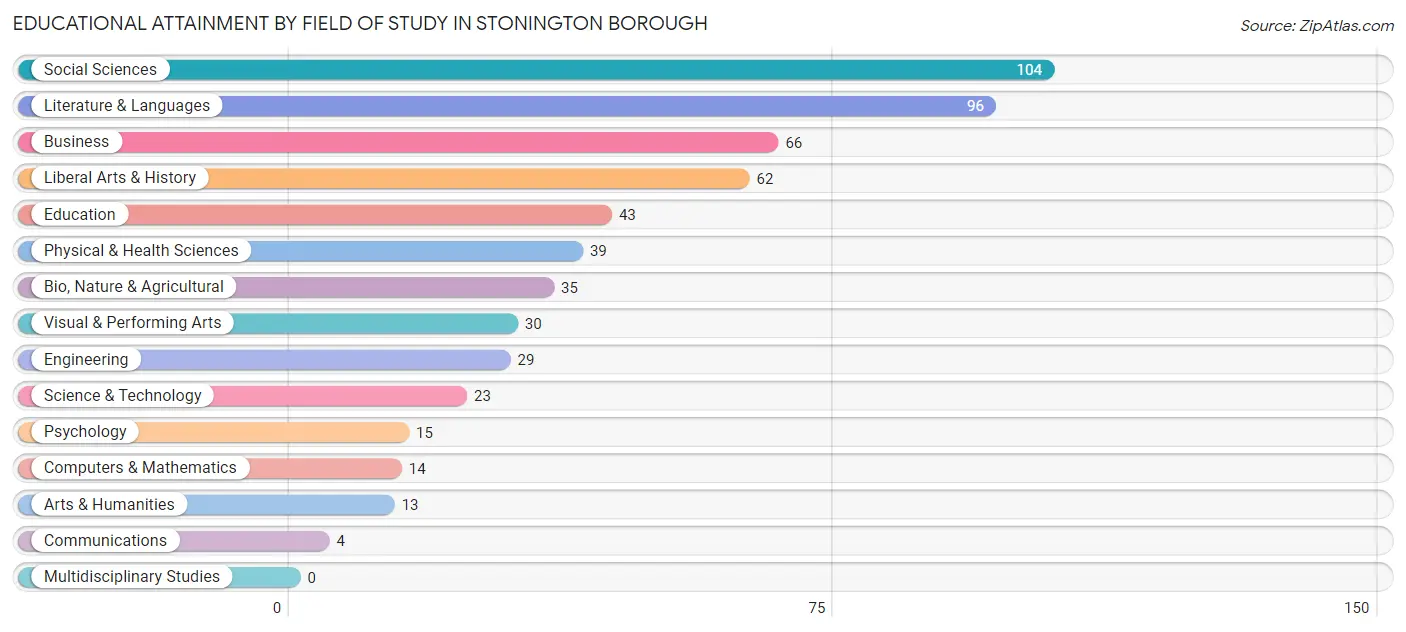
| Field of Study | # Graduates | % Graduates |
| Computers & Mathematics | 14 | 2.4% |
| Bio, Nature & Agricultural | 35 | 6.1% |
| Physical & Health Sciences | 39 | 6.8% |
| Psychology | 15 | 2.6% |
| Social Sciences | 104 | 18.1% |
| Engineering | 29 | 5.1% |
| Multidisciplinary Studies | 0 | 0.0% |
| Science & Technology | 23 | 4.0% |
| Business | 66 | 11.5% |
| Education | 43 | 7.5% |
| Literature & Languages | 96 | 16.8% |
| Liberal Arts & History | 62 | 10.8% |
| Visual & Performing Arts | 30 | 5.2% |
| Communications | 4 | 0.7% |
| Arts & Humanities | 13 | 2.3% |
| Total | 573 | 100.0% |
Transportation & Commute in Stonington borough
Vehicle Availability by Sex in Stonington borough
The most prevalent vehicle ownership categories in Stonington borough are males with 1 vehicle (92, accounting for 46.7%) and females with 1 vehicle (146, making up 37.6%).
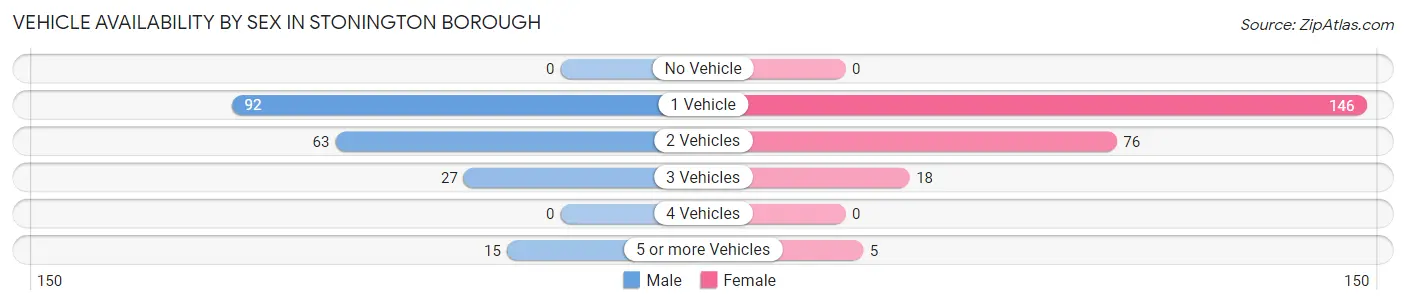
| Vehicles Available | Male | Female |
| No Vehicle | 0 (0.0%) | 0 (0.0%) |
| 1 Vehicle | 92 (46.7%) | 146 (59.6%) |
| 2 Vehicles | 63 (32.0%) | 76 (31.0%) |
| 3 Vehicles | 27 (13.7%) | 18 (7.3%) |
| 4 Vehicles | 0 (0.0%) | 0 (0.0%) |
| 5 or more Vehicles | 15 (7.6%) | 5 (2.0%) |
| Total | 197 (100.0%) | 245 (100.0%) |
Commute Time in Stonington borough
The most frequently occuring commute durations in Stonington borough are 10 to 14 minutes (58 commuters, 18.4%), 20 to 24 minutes (53 commuters, 16.8%), and less than 5 minutes (41 commuters, 13.0%).
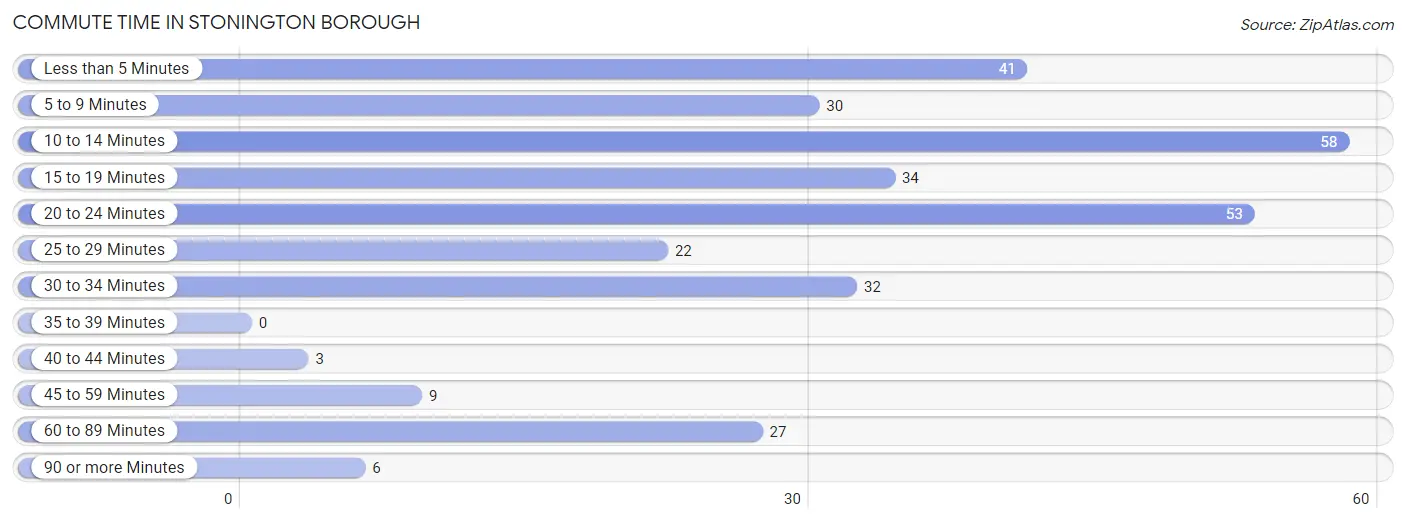
| Commute Time | # Commuters | % Commuters |
| Less than 5 Minutes | 41 | 13.0% |
| 5 to 9 Minutes | 30 | 9.5% |
| 10 to 14 Minutes | 58 | 18.4% |
| 15 to 19 Minutes | 34 | 10.8% |
| 20 to 24 Minutes | 53 | 16.8% |
| 25 to 29 Minutes | 22 | 7.0% |
| 30 to 34 Minutes | 32 | 10.2% |
| 35 to 39 Minutes | 0 | 0.0% |
| 40 to 44 Minutes | 3 | 0.9% |
| 45 to 59 Minutes | 9 | 2.9% |
| 60 to 89 Minutes | 27 | 8.6% |
| 90 or more Minutes | 6 | 1.9% |
Commute Time by Sex in Stonington borough
The most common commute times in Stonington borough are 20 to 24 minutes (41 commuters, 27.5%) for males and 10 to 14 minutes (29 commuters, 17.5%) for females.
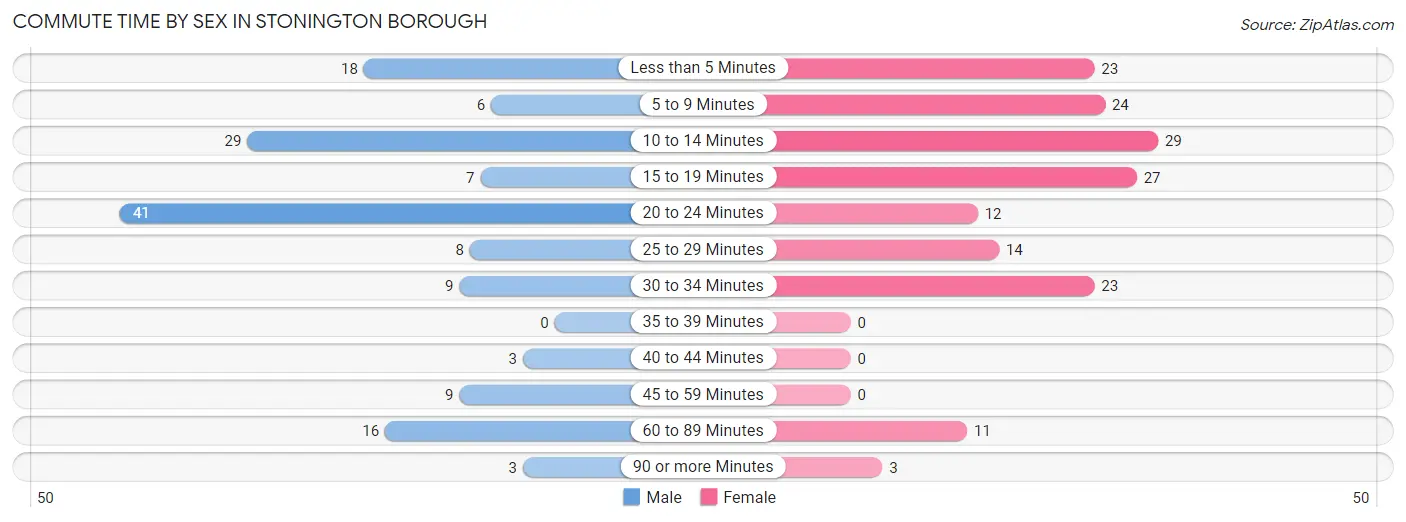
| Commute Time | Male | Female |
| Less than 5 Minutes | 18 (12.1%) | 23 (13.9%) |
| 5 to 9 Minutes | 6 (4.0%) | 24 (14.5%) |
| 10 to 14 Minutes | 29 (19.5%) | 29 (17.5%) |
| 15 to 19 Minutes | 7 (4.7%) | 27 (16.3%) |
| 20 to 24 Minutes | 41 (27.5%) | 12 (7.2%) |
| 25 to 29 Minutes | 8 (5.4%) | 14 (8.4%) |
| 30 to 34 Minutes | 9 (6.0%) | 23 (13.9%) |
| 35 to 39 Minutes | 0 (0.0%) | 0 (0.0%) |
| 40 to 44 Minutes | 3 (2.0%) | 0 (0.0%) |
| 45 to 59 Minutes | 9 (6.0%) | 0 (0.0%) |
| 60 to 89 Minutes | 16 (10.7%) | 11 (6.6%) |
| 90 or more Minutes | 3 (2.0%) | 3 (1.8%) |
Time of Departure to Work by Sex in Stonington borough
The most frequent times of departure to work in Stonington borough are 7:30 AM to 7:59 AM (30, 20.1%) for males and 8:00 AM to 8:29 AM (33, 19.9%) for females.
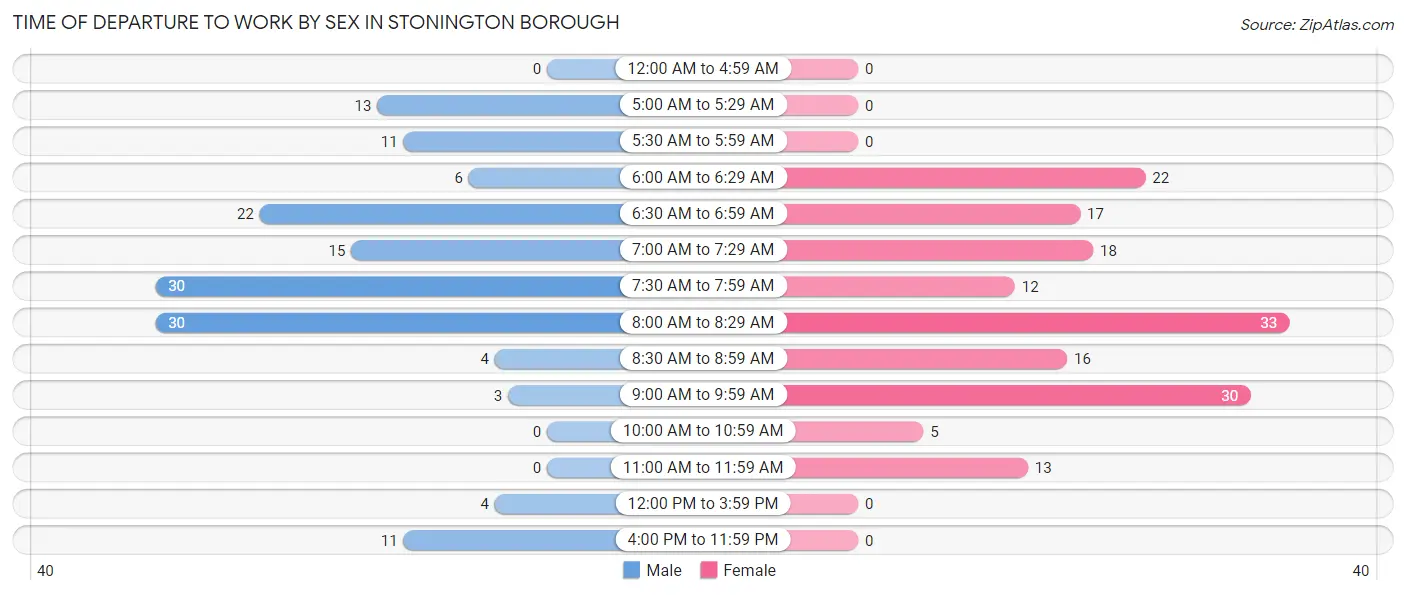
| Time of Departure | Male | Female |
| 12:00 AM to 4:59 AM | 0 (0.0%) | 0 (0.0%) |
| 5:00 AM to 5:29 AM | 13 (8.7%) | 0 (0.0%) |
| 5:30 AM to 5:59 AM | 11 (7.4%) | 0 (0.0%) |
| 6:00 AM to 6:29 AM | 6 (4.0%) | 22 (13.3%) |
| 6:30 AM to 6:59 AM | 22 (14.8%) | 17 (10.2%) |
| 7:00 AM to 7:29 AM | 15 (10.1%) | 18 (10.8%) |
| 7:30 AM to 7:59 AM | 30 (20.1%) | 12 (7.2%) |
| 8:00 AM to 8:29 AM | 30 (20.1%) | 33 (19.9%) |
| 8:30 AM to 8:59 AM | 4 (2.7%) | 16 (9.6%) |
| 9:00 AM to 9:59 AM | 3 (2.0%) | 30 (18.1%) |
| 10:00 AM to 10:59 AM | 0 (0.0%) | 5 (3.0%) |
| 11:00 AM to 11:59 AM | 0 (0.0%) | 13 (7.8%) |
| 12:00 PM to 3:59 PM | 4 (2.7%) | 0 (0.0%) |
| 4:00 PM to 11:59 PM | 11 (7.4%) | 0 (0.0%) |
| Total | 149 (100.0%) | 166 (100.0%) |
Housing Occupancy in Stonington borough
Occupancy by Ownership in Stonington borough
Of the total 563 dwellings in Stonington borough, owner-occupied units account for 298 (52.9%), while renter-occupied units make up 265 (47.1%).
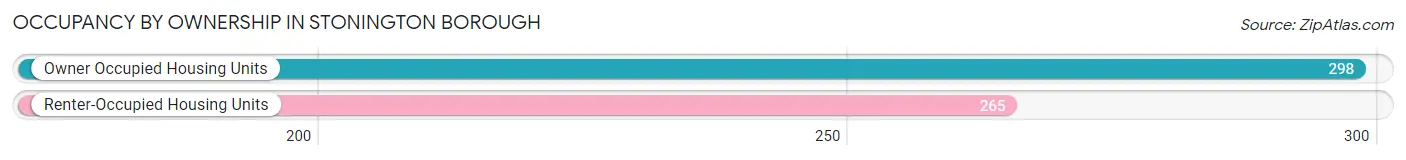
| Occupancy | # Housing Units | % Housing Units |
| Owner Occupied Housing Units | 298 | 52.9% |
| Renter-Occupied Housing Units | 265 | 47.1% |
| Total Occupied Housing Units | 563 | 100.0% |
Occupancy by Household Size in Stonington borough
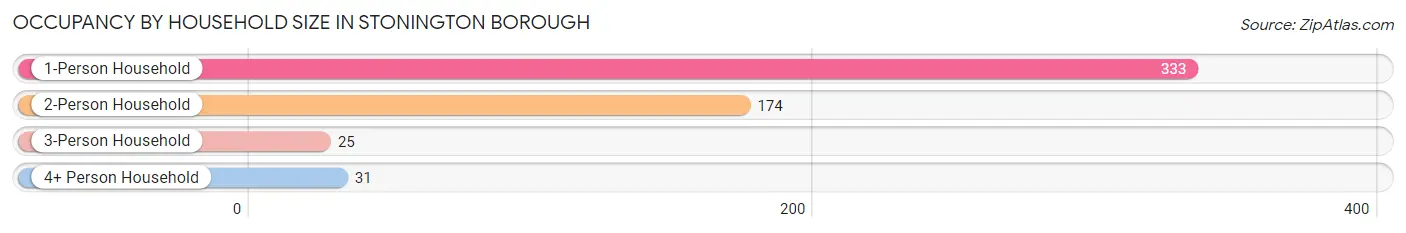
| Household Size | # Housing Units | % Housing Units |
| 1-Person Household | 333 | 59.2% |
| 2-Person Household | 174 | 30.9% |
| 3-Person Household | 25 | 4.4% |
| 4+ Person Household | 31 | 5.5% |
| Total Housing Units | 563 | 100.0% |
Occupancy by Ownership by Household Size in Stonington borough
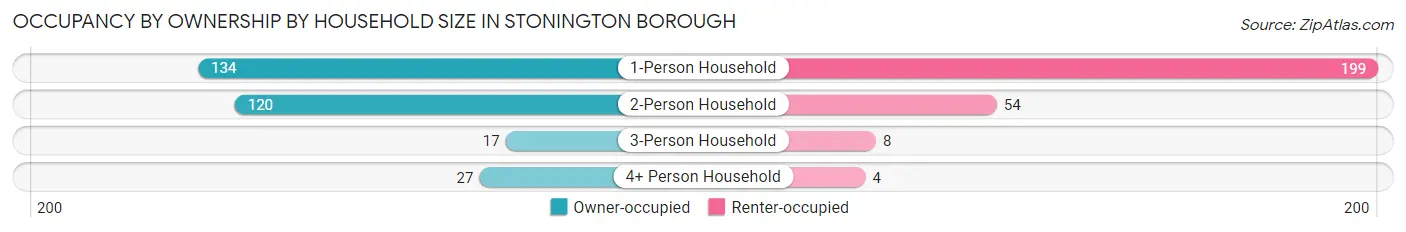
| Household Size | Owner-occupied | Renter-occupied |
| 1-Person Household | 134 (40.2%) | 199 (59.8%) |
| 2-Person Household | 120 (69.0%) | 54 (31.0%) |
| 3-Person Household | 17 (68.0%) | 8 (32.0%) |
| 4+ Person Household | 27 (87.1%) | 4 (12.9%) |
| Total Housing Units | 298 (52.9%) | 265 (47.1%) |
Occupancy by Educational Attainment in Stonington borough
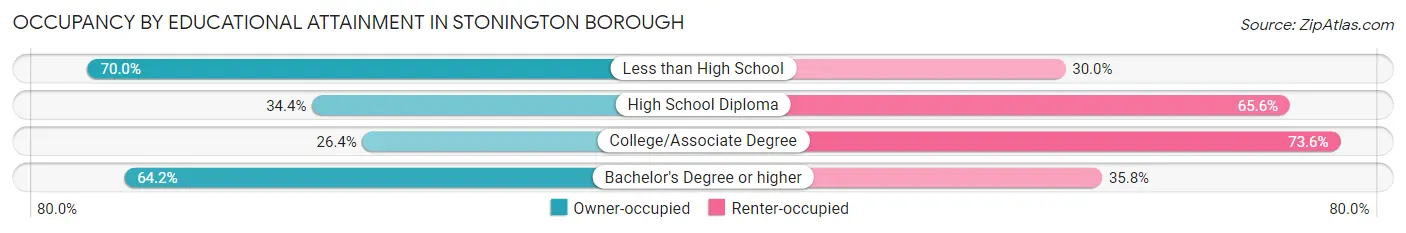
| Household Size | Owner-occupied | Renter-occupied |
| Less than High School | 7 (70.0%) | 3 (30.0%) |
| High School Diploma | 11 (34.4%) | 21 (65.6%) |
| College/Associate Degree | 38 (26.4%) | 106 (73.6%) |
| Bachelor's Degree or higher | 242 (64.2%) | 135 (35.8%) |
Occupancy by Age of Householder in Stonington borough
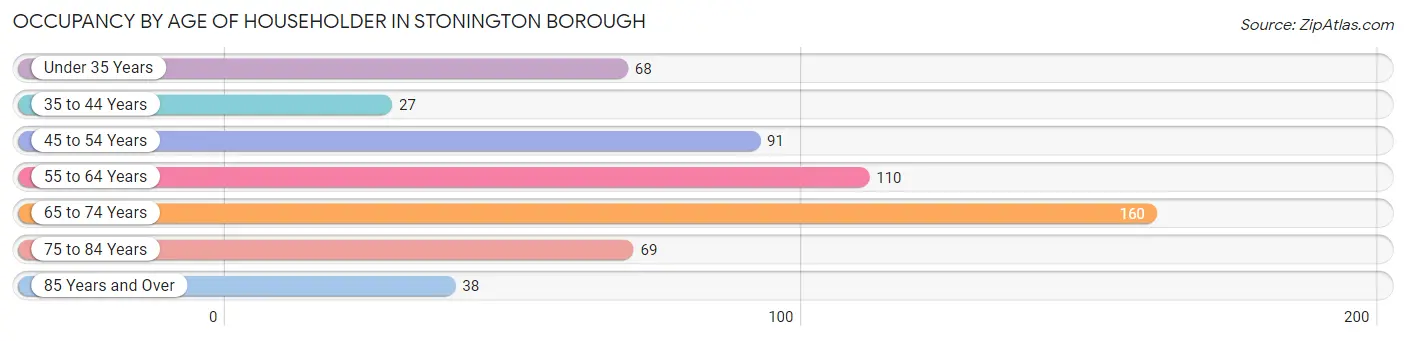
| Age Bracket | # Households | % Households |
| Under 35 Years | 68 | 12.1% |
| 35 to 44 Years | 27 | 4.8% |
| 45 to 54 Years | 91 | 16.2% |
| 55 to 64 Years | 110 | 19.5% |
| 65 to 74 Years | 160 | 28.4% |
| 75 to 84 Years | 69 | 12.3% |
| 85 Years and Over | 38 | 6.8% |
| Total | 563 | 100.0% |
Housing Finances in Stonington borough
Median Income by Occupancy in Stonington borough
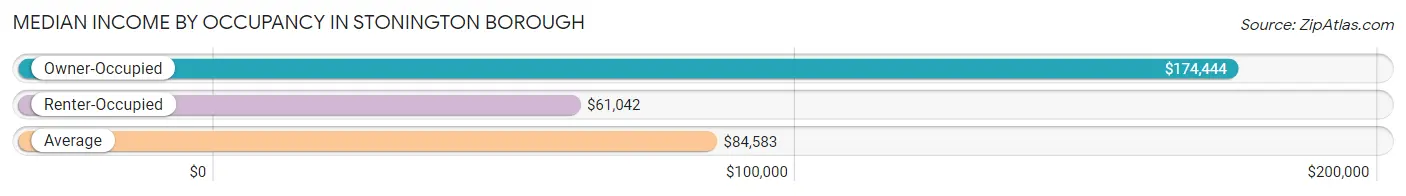
| Occupancy Type | # Households | Median Income |
| Owner-Occupied | 298 (52.9%) | $174,444 |
| Renter-Occupied | 265 (47.1%) | $61,042 |
| Average | 563 (100.0%) | $84,583 |
Occupancy by Householder Income Bracket in Stonington borough
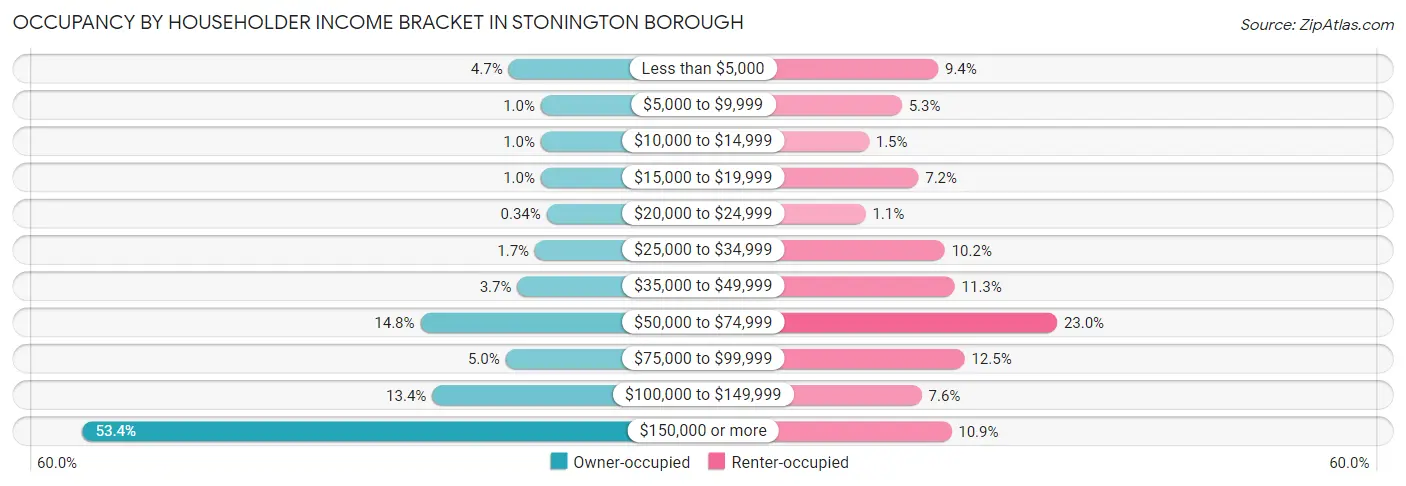
| Income Bracket | Owner-occupied | Renter-occupied |
| Less than $5,000 | 14 (4.7%) | 25 (9.4%) |
| $5,000 to $9,999 | 3 (1.0%) | 14 (5.3%) |
| $10,000 to $14,999 | 3 (1.0%) | 4 (1.5%) |
| $15,000 to $19,999 | 3 (1.0%) | 19 (7.2%) |
| $20,000 to $24,999 | 1 (0.3%) | 3 (1.1%) |
| $25,000 to $34,999 | 5 (1.7%) | 27 (10.2%) |
| $35,000 to $49,999 | 11 (3.7%) | 30 (11.3%) |
| $50,000 to $74,999 | 44 (14.8%) | 61 (23.0%) |
| $75,000 to $99,999 | 15 (5.0%) | 33 (12.4%) |
| $100,000 to $149,999 | 40 (13.4%) | 20 (7.5%) |
| $150,000 or more | 159 (53.4%) | 29 (10.9%) |
| Total | 298 (100.0%) | 265 (100.0%) |
Monthly Housing Cost Tiers in Stonington borough
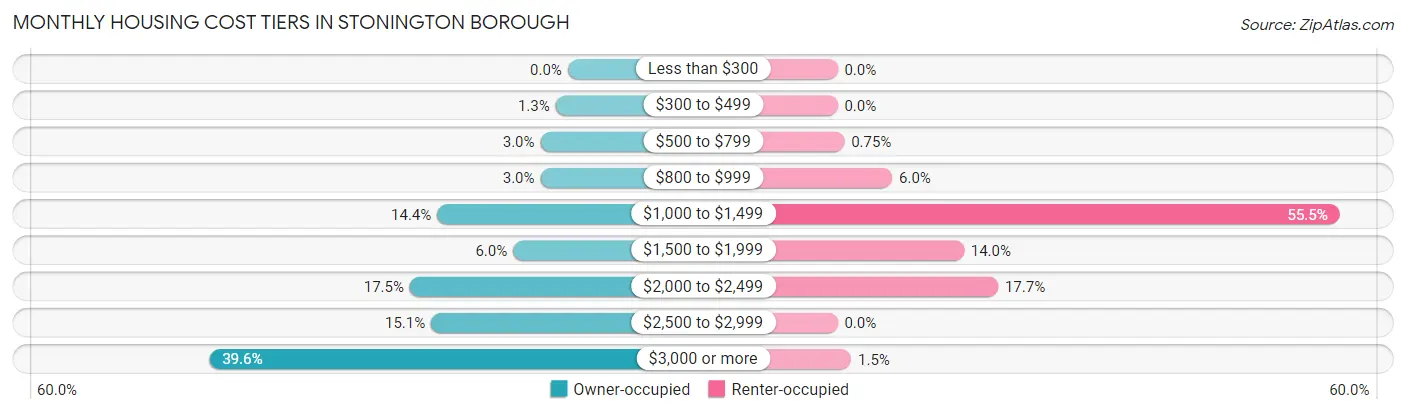
| Monthly Cost | Owner-occupied | Renter-occupied |
| Less than $300 | 0 (0.0%) | 0 (0.0%) |
| $300 to $499 | 4 (1.3%) | 0 (0.0%) |
| $500 to $799 | 9 (3.0%) | 2 (0.7%) |
| $800 to $999 | 9 (3.0%) | 16 (6.0%) |
| $1,000 to $1,499 | 43 (14.4%) | 147 (55.5%) |
| $1,500 to $1,999 | 18 (6.0%) | 37 (14.0%) |
| $2,000 to $2,499 | 52 (17.4%) | 47 (17.7%) |
| $2,500 to $2,999 | 45 (15.1%) | 0 (0.0%) |
| $3,000 or more | 118 (39.6%) | 4 (1.5%) |
| Total | 298 (100.0%) | 265 (100.0%) |
Physical Housing Characteristics in Stonington borough
Housing Structures in Stonington borough
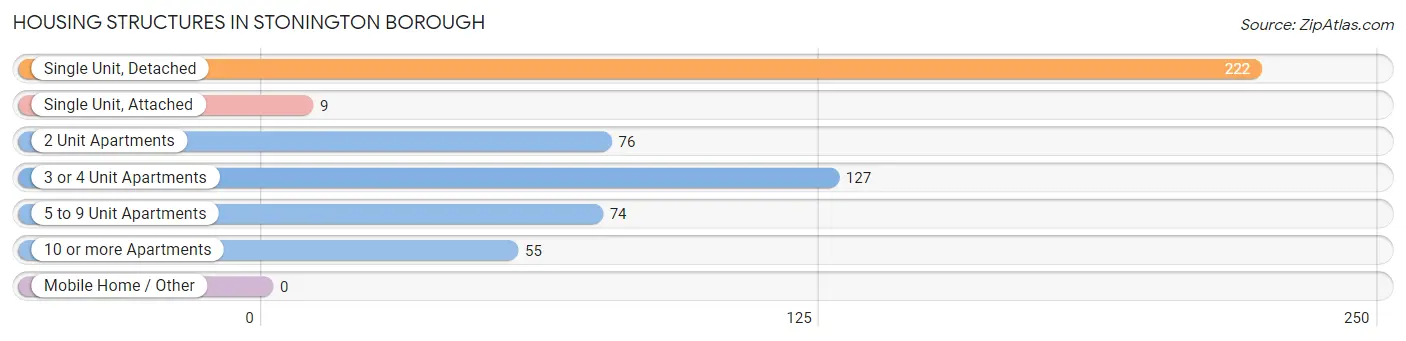
| Structure Type | # Housing Units | % Housing Units |
| Single Unit, Detached | 222 | 39.4% |
| Single Unit, Attached | 9 | 1.6% |
| 2 Unit Apartments | 76 | 13.5% |
| 3 or 4 Unit Apartments | 127 | 22.6% |
| 5 to 9 Unit Apartments | 74 | 13.1% |
| 10 or more Apartments | 55 | 9.8% |
| Mobile Home / Other | 0 | 0.0% |
| Total | 563 | 100.0% |
Housing Structures by Occupancy in Stonington borough
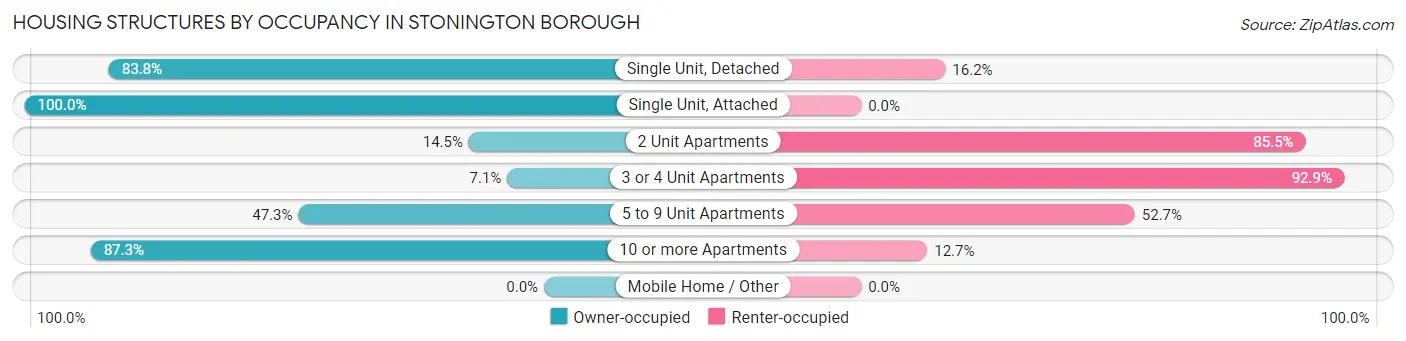
| Structure Type | Owner-occupied | Renter-occupied |
| Single Unit, Detached | 186 (83.8%) | 36 (16.2%) |
| Single Unit, Attached | 9 (100.0%) | 0 (0.0%) |
| 2 Unit Apartments | 11 (14.5%) | 65 (85.5%) |
| 3 or 4 Unit Apartments | 9 (7.1%) | 118 (92.9%) |
| 5 to 9 Unit Apartments | 35 (47.3%) | 39 (52.7%) |
| 10 or more Apartments | 48 (87.3%) | 7 (12.7%) |
| Mobile Home / Other | 0 (0.0%) | 0 (0.0%) |
| Total | 298 (52.9%) | 265 (47.1%) |
Housing Structures by Number of Rooms in Stonington borough
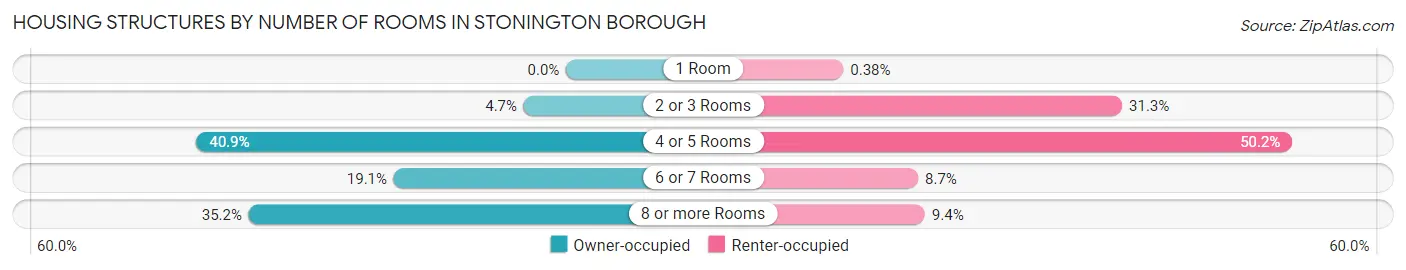
| Number of Rooms | Owner-occupied | Renter-occupied |
| 1 Room | 0 (0.0%) | 1 (0.4%) |
| 2 or 3 Rooms | 14 (4.7%) | 83 (31.3%) |
| 4 or 5 Rooms | 122 (40.9%) | 133 (50.2%) |
| 6 or 7 Rooms | 57 (19.1%) | 23 (8.7%) |
| 8 or more Rooms | 105 (35.2%) | 25 (9.4%) |
| Total | 298 (100.0%) | 265 (100.0%) |
Housing Structure by Heating Type in Stonington borough
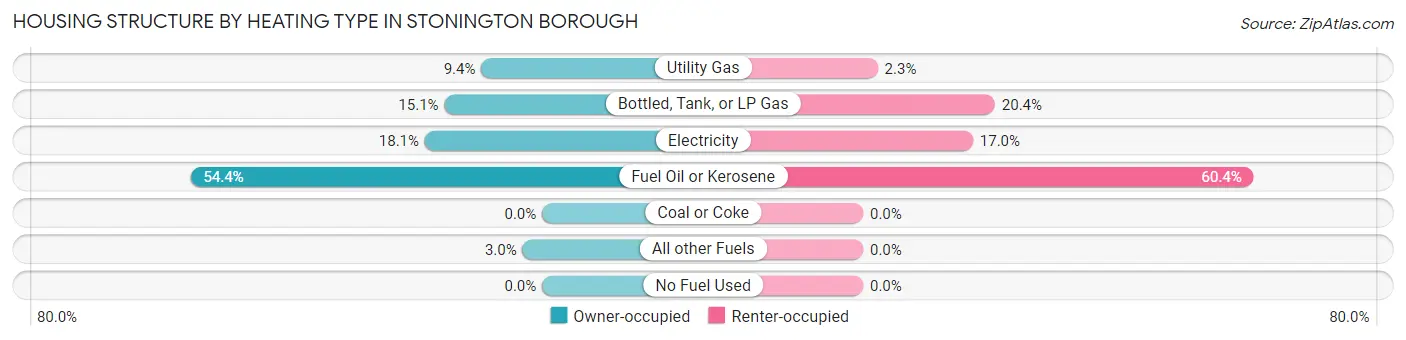
| Heating Type | Owner-occupied | Renter-occupied |
| Utility Gas | 28 (9.4%) | 6 (2.3%) |
| Bottled, Tank, or LP Gas | 45 (15.1%) | 54 (20.4%) |
| Electricity | 54 (18.1%) | 45 (17.0%) |
| Fuel Oil or Kerosene | 162 (54.4%) | 160 (60.4%) |
| Coal or Coke | 0 (0.0%) | 0 (0.0%) |
| All other Fuels | 9 (3.0%) | 0 (0.0%) |
| No Fuel Used | 0 (0.0%) | 0 (0.0%) |
| Total | 298 (100.0%) | 265 (100.0%) |
Household Vehicle Usage in Stonington borough
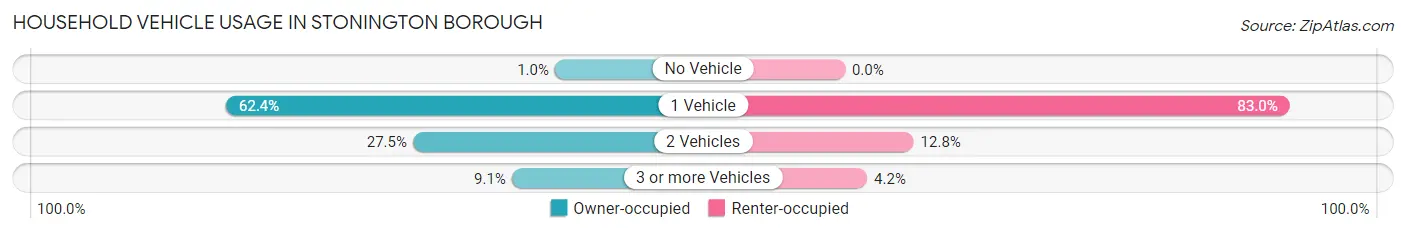
| Vehicles per Household | Owner-occupied | Renter-occupied |
| No Vehicle | 3 (1.0%) | 0 (0.0%) |
| 1 Vehicle | 186 (62.4%) | 220 (83.0%) |
| 2 Vehicles | 82 (27.5%) | 34 (12.8%) |
| 3 or more Vehicles | 27 (9.1%) | 11 (4.2%) |
| Total | 298 (100.0%) | 265 (100.0%) |
Real Estate & Mortgages in Stonington borough
Real Estate and Mortgage Overview in Stonington borough
| Characteristic | Without Mortgage | With Mortgage |
| Housing Units | 145 | 153 |
| Median Property Value | $843,800 | $710,600 |
| Median Household Income | $102,083 | $103 |
| Monthly Housing Costs | $1,501 | $98 |
| Real Estate Taxes | $10,001 | $0 |
Property Value by Mortgage Status in Stonington borough
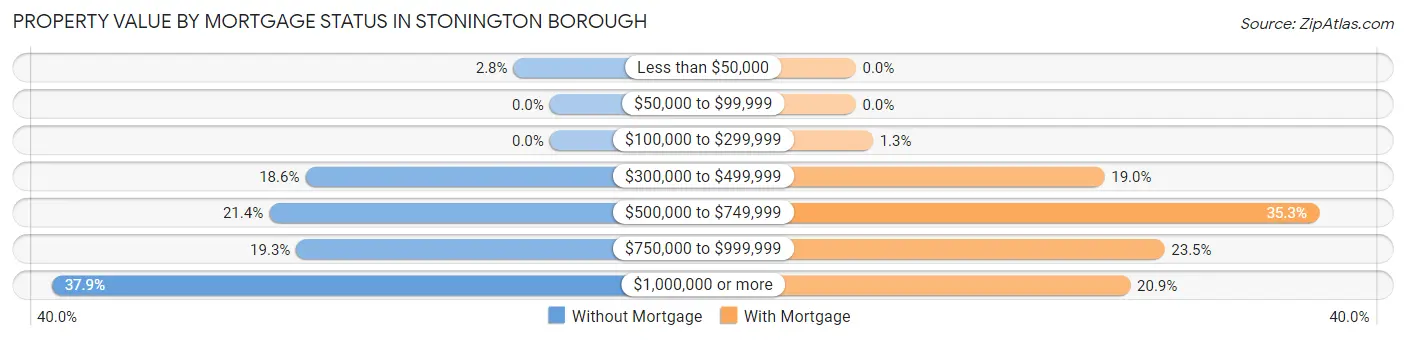
| Property Value | Without Mortgage | With Mortgage |
| Less than $50,000 | 4 (2.8%) | 0 (0.0%) |
| $50,000 to $99,999 | 0 (0.0%) | 0 (0.0%) |
| $100,000 to $299,999 | 0 (0.0%) | 2 (1.3%) |
| $300,000 to $499,999 | 27 (18.6%) | 29 (19.0%) |
| $500,000 to $749,999 | 31 (21.4%) | 54 (35.3%) |
| $750,000 to $999,999 | 28 (19.3%) | 36 (23.5%) |
| $1,000,000 or more | 55 (37.9%) | 32 (20.9%) |
| Total | 145 (100.0%) | 153 (100.0%) |
Household Income by Mortgage Status in Stonington borough
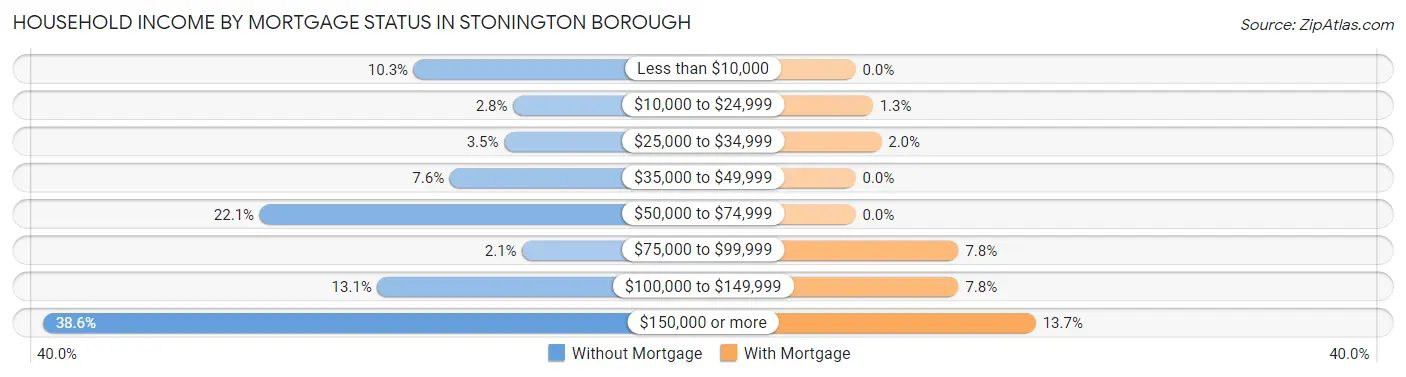
| Household Income | Without Mortgage | With Mortgage |
| Less than $10,000 | 15 (10.3%) | 0 (0.0%) |
| $10,000 to $24,999 | 4 (2.8%) | 2 (1.3%) |
| $25,000 to $34,999 | 5 (3.5%) | 3 (2.0%) |
| $35,000 to $49,999 | 11 (7.6%) | 0 (0.0%) |
| $50,000 to $74,999 | 32 (22.1%) | 0 (0.0%) |
| $75,000 to $99,999 | 3 (2.1%) | 12 (7.8%) |
| $100,000 to $149,999 | 19 (13.1%) | 12 (7.8%) |
| $150,000 or more | 56 (38.6%) | 21 (13.7%) |
| Total | 145 (100.0%) | 153 (100.0%) |
Property Value to Household Income Ratio in Stonington borough
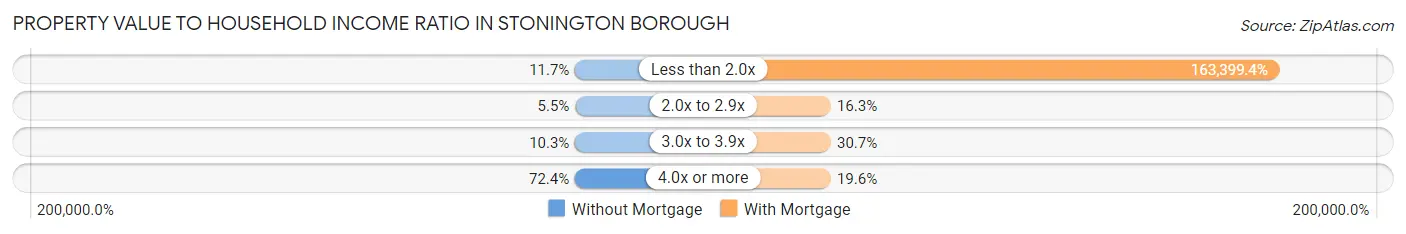
| Value-to-Income Ratio | Without Mortgage | With Mortgage |
| Less than 2.0x | 17 (11.7%) | 250,001 (163,399.4%) |
| 2.0x to 2.9x | 8 (5.5%) | 25 (16.3%) |
| 3.0x to 3.9x | 15 (10.3%) | 47 (30.7%) |
| 4.0x or more | 105 (72.4%) | 30 (19.6%) |
| Total | 145 (100.0%) | 153 (100.0%) |
Real Estate Taxes by Mortgage Status in Stonington borough
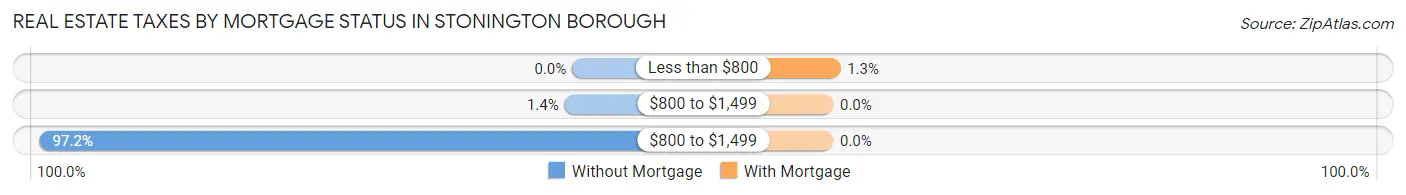
| Property Taxes | Without Mortgage | With Mortgage |
| Less than $800 | 0 (0.0%) | 2 (1.3%) |
| $800 to $1,499 | 2 (1.4%) | 0 (0.0%) |
| $800 to $1,499 | 141 (97.2%) | 0 (0.0%) |
| Total | 145 (100.0%) | 153 (100.0%) |
Health & Disability in Stonington borough
Health Insurance Coverage by Age in Stonington borough
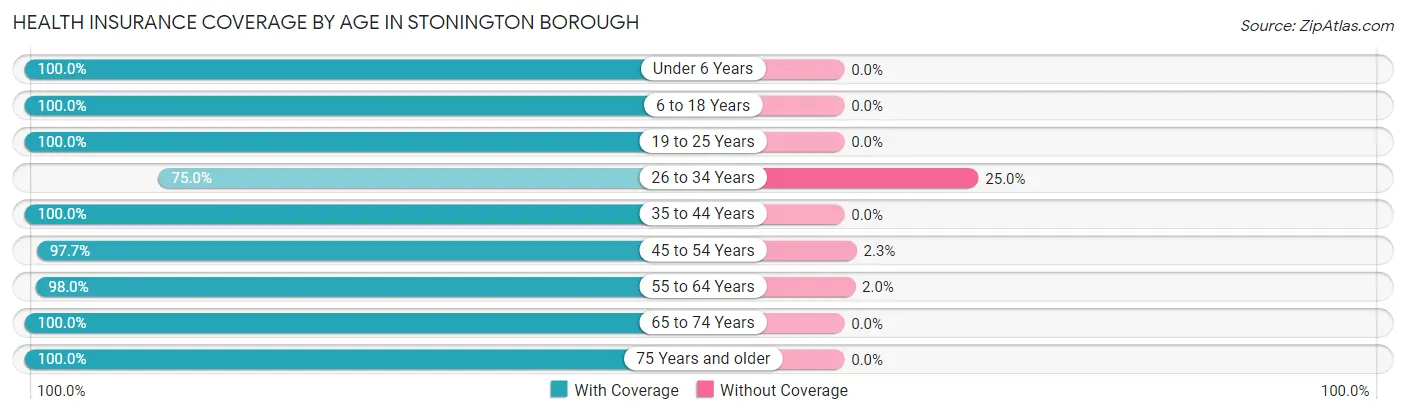
| Age Bracket | With Coverage | Without Coverage |
| Under 6 Years | 8 (100.0%) | 0 (0.0%) |
| 6 to 18 Years | 130 (100.0%) | 0 (0.0%) |
| 19 to 25 Years | 42 (100.0%) | 0 (0.0%) |
| 26 to 34 Years | 33 (75.0%) | 11 (25.0%) |
| 35 to 44 Years | 46 (100.0%) | 0 (0.0%) |
| 45 to 54 Years | 128 (97.7%) | 3 (2.3%) |
| 55 to 64 Years | 146 (98.0%) | 3 (2.0%) |
| 65 to 74 Years | 227 (100.0%) | 0 (0.0%) |
| 75 Years and older | 142 (100.0%) | 0 (0.0%) |
| Total | 902 (98.2%) | 17 (1.8%) |
Health Insurance Coverage by Citizenship Status in Stonington borough
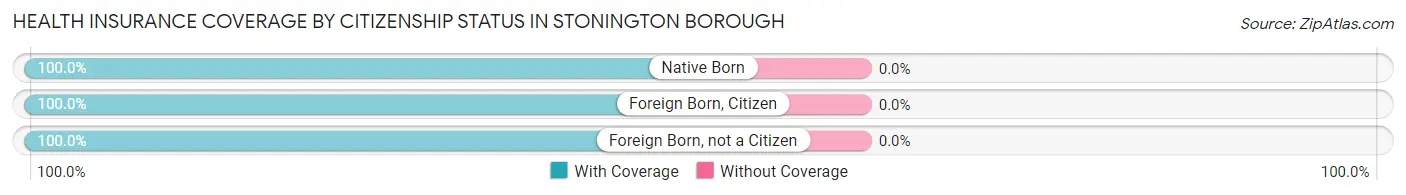
| Citizenship Status | With Coverage | Without Coverage |
| Native Born | 8 (100.0%) | 0 (0.0%) |
| Foreign Born, Citizen | 130 (100.0%) | 0 (0.0%) |
| Foreign Born, not a Citizen | 42 (100.0%) | 0 (0.0%) |
Health Insurance Coverage by Household Income in Stonington borough
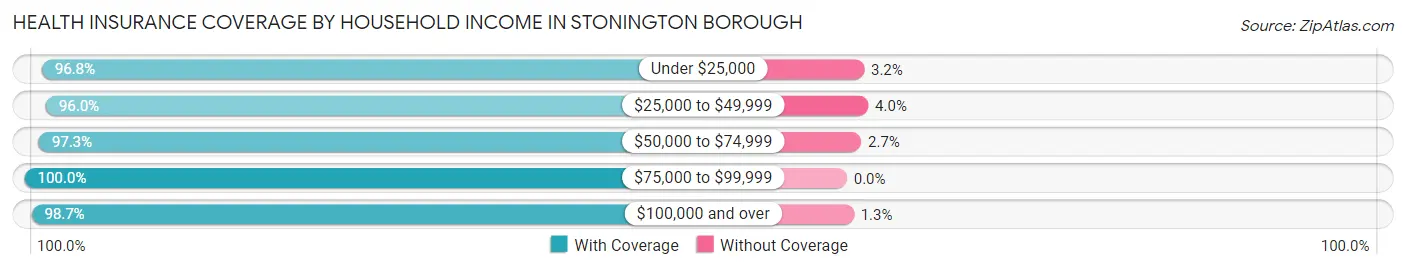
| Household Income | With Coverage | Without Coverage |
| Under $25,000 | 90 (96.8%) | 3 (3.2%) |
| $25,000 to $49,999 | 96 (96.0%) | 4 (4.0%) |
| $50,000 to $74,999 | 109 (97.3%) | 3 (2.7%) |
| $75,000 to $99,999 | 70 (100.0%) | 0 (0.0%) |
| $100,000 and over | 537 (98.7%) | 7 (1.3%) |
Public vs Private Health Insurance Coverage by Age in Stonington borough
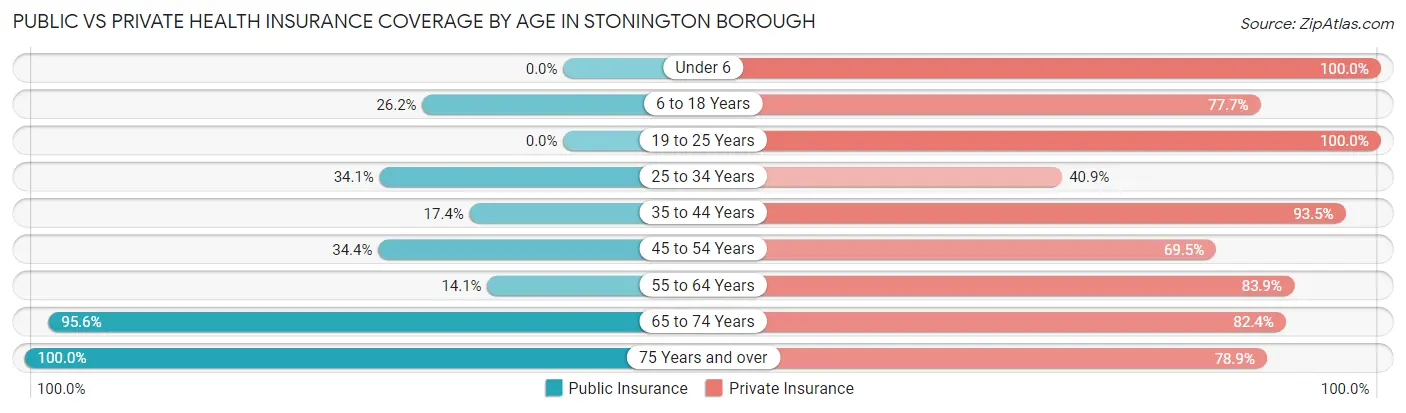
| Age Bracket | Public Insurance | Private Insurance |
| Under 6 | 0 (0.0%) | 8 (100.0%) |
| 6 to 18 Years | 34 (26.2%) | 101 (77.7%) |
| 19 to 25 Years | 0 (0.0%) | 42 (100.0%) |
| 25 to 34 Years | 15 (34.1%) | 18 (40.9%) |
| 35 to 44 Years | 8 (17.4%) | 43 (93.5%) |
| 45 to 54 Years | 45 (34.4%) | 91 (69.5%) |
| 55 to 64 Years | 21 (14.1%) | 125 (83.9%) |
| 65 to 74 Years | 217 (95.6%) | 187 (82.4%) |
| 75 Years and over | 142 (100.0%) | 112 (78.9%) |
| Total | 482 (52.4%) | 727 (79.1%) |
Disability Status by Sex by Age in Stonington borough
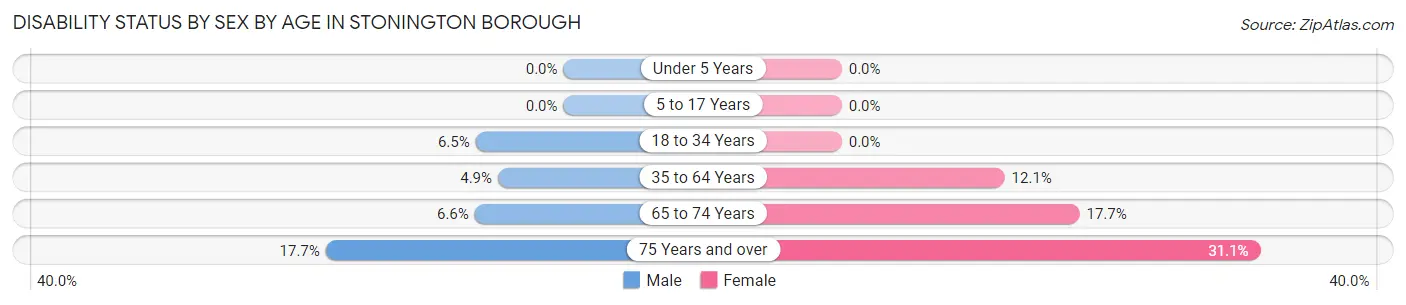
| Age Bracket | Male | Female |
| Under 5 Years | 0 (0.0%) | 0 (0.0%) |
| 5 to 17 Years | 0 (0.0%) | 0 (0.0%) |
| 18 to 34 Years | 3 (6.5%) | 0 (0.0%) |
| 35 to 64 Years | 7 (4.9%) | 22 (12.1%) |
| 65 to 74 Years | 6 (6.6%) | 24 (17.6%) |
| 75 Years and over | 12 (17.6%) | 23 (31.1%) |
Disability Class by Sex by Age in Stonington borough
Disability Class: Hearing Difficulty
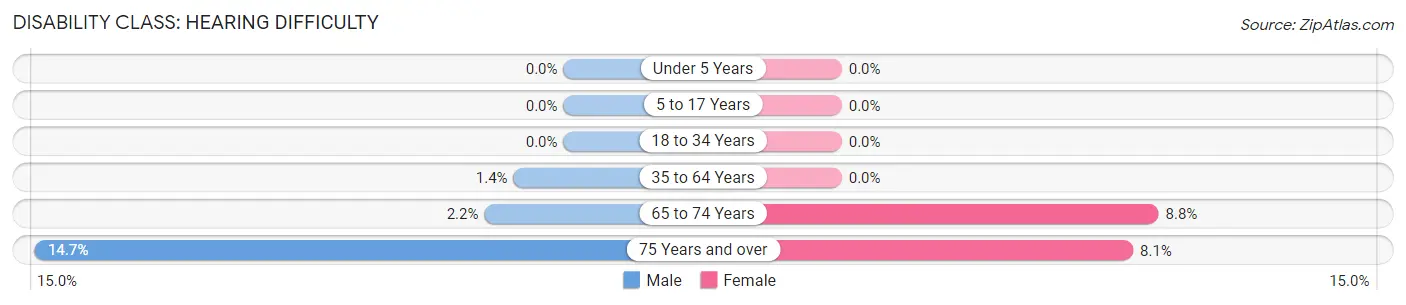
| Age Bracket | Male | Female |
| Under 5 Years | 0 (0.0%) | 0 (0.0%) |
| 5 to 17 Years | 0 (0.0%) | 0 (0.0%) |
| 18 to 34 Years | 0 (0.0%) | 0 (0.0%) |
| 35 to 64 Years | 2 (1.4%) | 0 (0.0%) |
| 65 to 74 Years | 2 (2.2%) | 12 (8.8%) |
| 75 Years and over | 10 (14.7%) | 6 (8.1%) |
Disability Class: Vision Difficulty
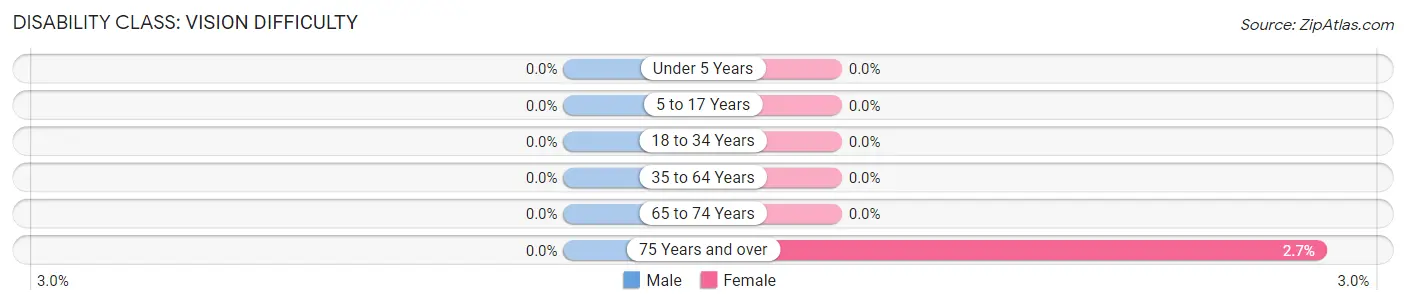
| Age Bracket | Male | Female |
| Under 5 Years | 0 (0.0%) | 0 (0.0%) |
| 5 to 17 Years | 0 (0.0%) | 0 (0.0%) |
| 18 to 34 Years | 0 (0.0%) | 0 (0.0%) |
| 35 to 64 Years | 0 (0.0%) | 0 (0.0%) |
| 65 to 74 Years | 0 (0.0%) | 0 (0.0%) |
| 75 Years and over | 0 (0.0%) | 2 (2.7%) |
Disability Class: Cognitive Difficulty
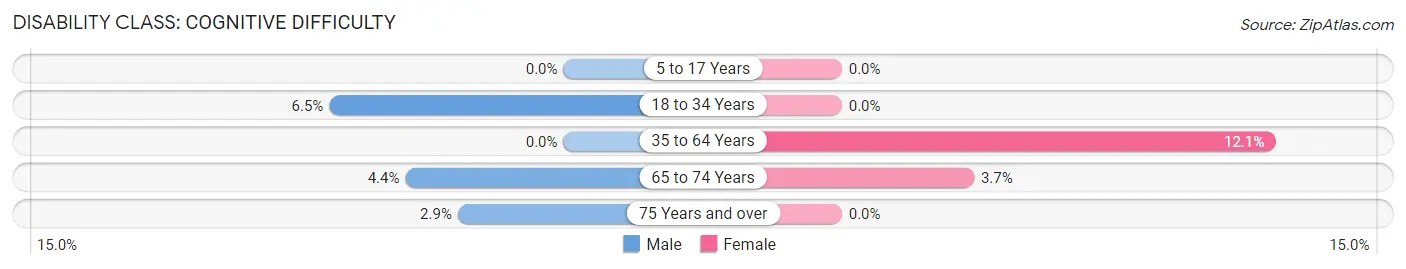
| Age Bracket | Male | Female |
| 5 to 17 Years | 0 (0.0%) | 0 (0.0%) |
| 18 to 34 Years | 3 (6.5%) | 0 (0.0%) |
| 35 to 64 Years | 0 (0.0%) | 22 (12.1%) |
| 65 to 74 Years | 4 (4.4%) | 5 (3.7%) |
| 75 Years and over | 2 (2.9%) | 0 (0.0%) |
Disability Class: Ambulatory Difficulty
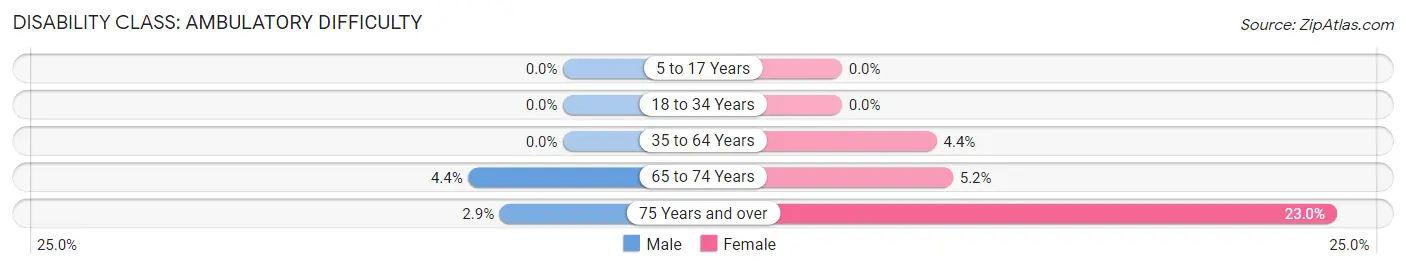
| Age Bracket | Male | Female |
| 5 to 17 Years | 0 (0.0%) | 0 (0.0%) |
| 18 to 34 Years | 0 (0.0%) | 0 (0.0%) |
| 35 to 64 Years | 0 (0.0%) | 8 (4.4%) |
| 65 to 74 Years | 4 (4.4%) | 7 (5.1%) |
| 75 Years and over | 2 (2.9%) | 17 (23.0%) |
Disability Class: Self-Care Difficulty
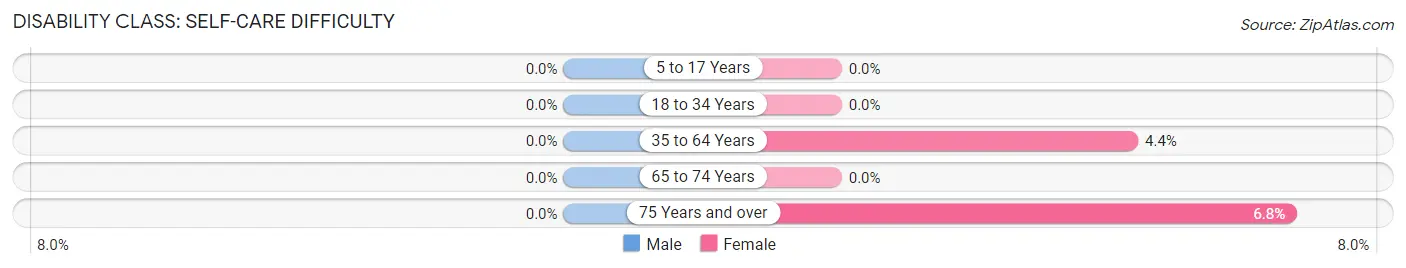
| Age Bracket | Male | Female |
| 5 to 17 Years | 0 (0.0%) | 0 (0.0%) |
| 18 to 34 Years | 0 (0.0%) | 0 (0.0%) |
| 35 to 64 Years | 0 (0.0%) | 8 (4.4%) |
| 65 to 74 Years | 0 (0.0%) | 0 (0.0%) |
| 75 Years and over | 0 (0.0%) | 5 (6.8%) |
Technology Access in Stonington borough
Computing Device Access in Stonington borough
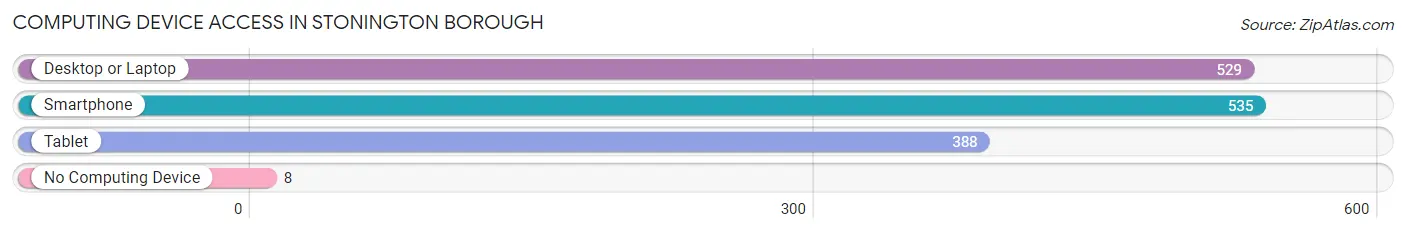
| Device Type | # Households | % Households |
| Desktop or Laptop | 529 | 94.0% |
| Smartphone | 535 | 95.0% |
| Tablet | 388 | 68.9% |
| No Computing Device | 8 | 1.4% |
| Total | 563 | 100.0% |
Internet Access in Stonington borough
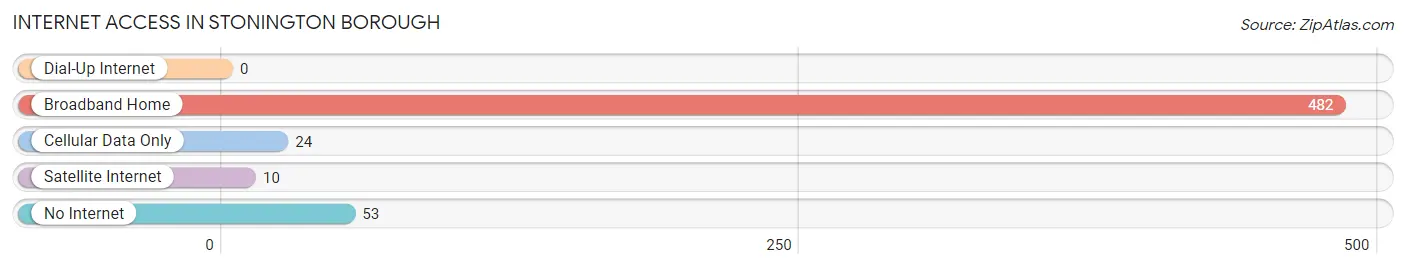
| Internet Type | # Households | % Households |
| Dial-Up Internet | 0 | 0.0% |
| Broadband Home | 482 | 85.6% |
| Cellular Data Only | 24 | 4.3% |
| Satellite Internet | 10 | 1.8% |
| No Internet | 53 | 9.4% |
| Total | 563 | 100.0% |
Stonington borough Summary
Stonington Borough is a small town located in New London County, Connecticut. It is situated on the eastern shore of Long Island Sound, and is bordered by the towns of Groton, North Stonington, and Mystic. The town has a population of 2,297 as of the 2010 census, and is part of the larger Stonington Borough-Mystic-Noank area.
History
Stonington Borough was first settled in 1649 by Thomas Miner and his family. The town was originally part of the Pequot Nation, and was known as Pawcatuck. In 1658, the town was incorporated as a part of the Connecticut Colony. During the Revolutionary War, Stonington was the site of a major battle between the British and American forces. The battle, which took place on August 9, 1775, was the first naval battle of the war. The Americans were victorious, and the British retreated.
In the 19th century, Stonington became a popular summer resort destination for wealthy New Yorkers. The town was home to several grand hotels, including the Ocean House, which was built in 1868. The town also became a center for the fishing and whaling industries.
Geography
Stonington Borough is located in southeastern Connecticut, on the eastern shore of Long Island Sound. The town is bordered by the towns of Groton, North Stonington, and Mystic. The town has a total area of 4.2 square miles, of which 3.9 square miles is land and 0.3 square miles is water. The town is located on a peninsula, and is surrounded by several small islands, including Fishers Island, Ram Island, and Copps Island.
Economy
Stonington Borough has a vibrant economy, with a variety of businesses and industries. The town is home to several marinas, which provide services to recreational boaters. The town is also home to several restaurants, retail stores, and other businesses. The town is also home to several manufacturing companies, including a boatbuilding company and a seafood processing plant.
Demographics
As of the 2010 census, there were 2,297 people, 1,039 households, and 602 families residing in the town. The population density was 590.3 people per square mile. The racial makeup of the town was 94.2% White, 1.2% African American, 0.4% Native American, 1.2% Asian, 0.1% Pacific Islander, 1.2% from other races, and 1.7% from two or more races. Hispanic or Latino of any race were 3.2% of the population.
The median income for a household in the town was $60,938, and the median income for a family was $76,250. The per capita income for the town was $35,945. About 4.2% of families and 6.2% of the population were below the poverty line, including 8.2% of those under age 18 and 4.2% of those age 65 or over.
Common Questions
What is Per Capita Income in Stonington borough?
Per Capita income in Stonington borough is $105,580.
What is the Median Family Income in Stonington borough?
Median Family Income in Stonington borough is $173,889.
What is the Median Household income in Stonington borough?
Median Household Income in Stonington borough is $84,583.
What is Income or Wage Gap in Stonington borough?
Income or Wage Gap in Stonington borough is 15.1%.
Women in Stonington borough earn 84.9 cents for every dollar earned by a man.
What is Inequality or Gini Index in Stonington borough?
Inequality or Gini Index in Stonington borough is 0.59.
What is the Total Population of Stonington borough?
Total Population of Stonington borough is 942.
What is the Total Male Population of Stonington borough?
Total Male Population of Stonington borough is 449.
What is the Total Female Population of Stonington borough?
Total Female Population of Stonington borough is 493.
What is the Ratio of Males per 100 Females in Stonington borough?
There are 91.08 Males per 100 Females in Stonington borough.
What is the Ratio of Females per 100 Males in Stonington borough?
There are 109.80 Females per 100 Males in Stonington borough.
What is the Median Population Age in Stonington borough?
Median Population Age in Stonington borough is 58.3 Years.
What is the Average Family Size in Stonington borough
Average Family Size in Stonington borough is 2.6 People.
What is the Average Household Size in Stonington borough
Average Household Size in Stonington borough is 1.7 People.
How Large is the Labor Force in Stonington borough?
There are 471 People in the Labor Forcein in Stonington borough.
What is the Percentage of People in the Labor Force in Stonington borough?
55.9% of People are in the Labor Force in Stonington borough.
What is the Unemployment Rate in Stonington borough?
Unemployment Rate in Stonington borough is 6.5%.