Cities with the Largest Northern European Community in Connecticut
RELATED REPORTS & OPTIONS
Northern European
Connecticut
Compare Cities
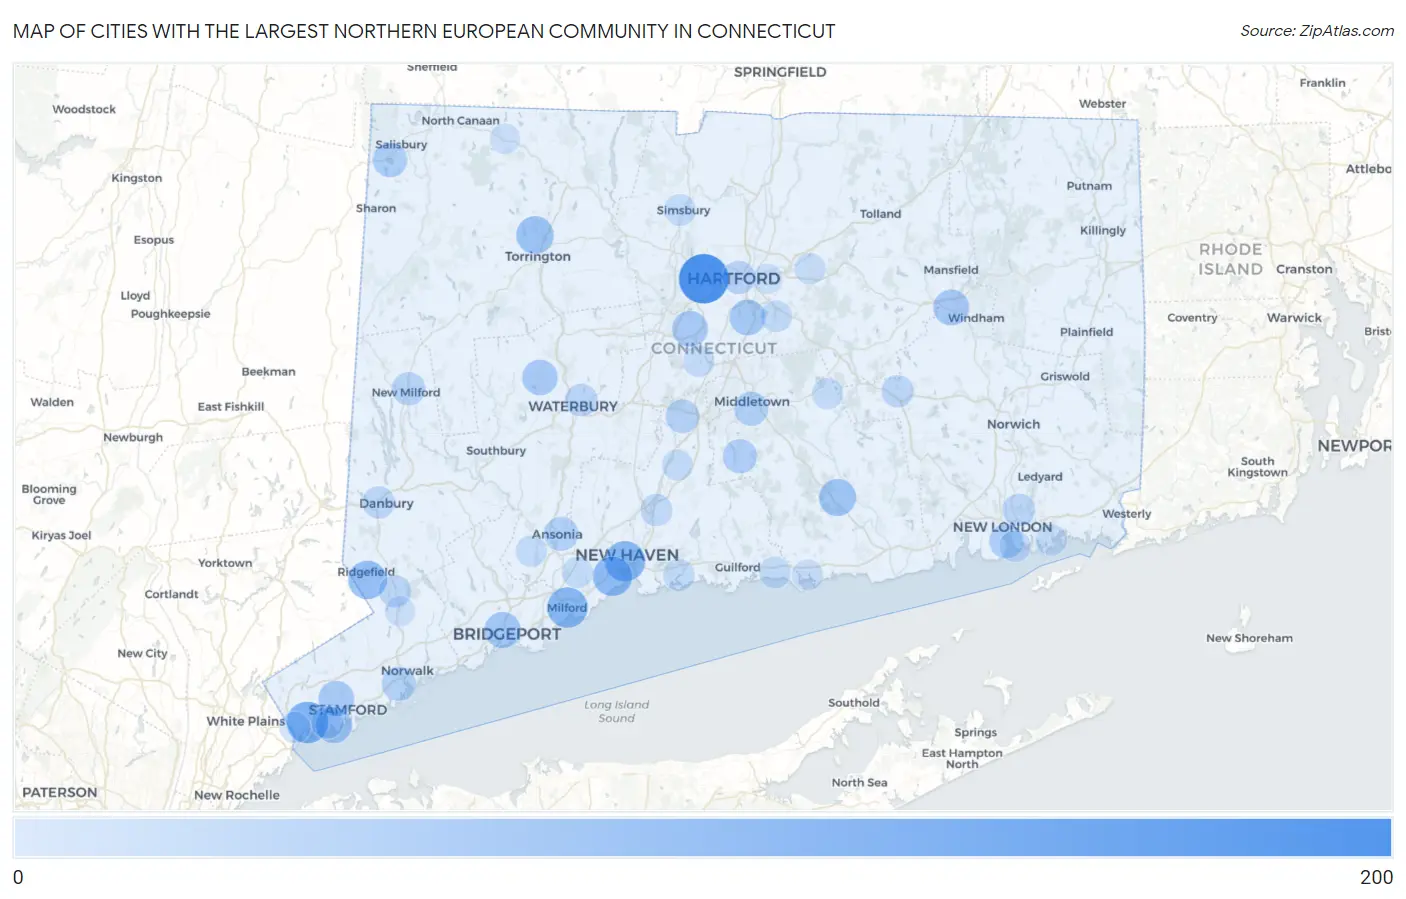
Map of Cities with the Largest Northern European Community in Connecticut
0
200
Cities with the Largest Northern European Community in Connecticut
| City | Northern European | vs State | vs National | |
| 1. | West Hartford | 154 | 3,621(4.25%)#1 | 487,800(0.03%)#488 |
| 2. | East | 105 | 3,621(2.90%)#2 | 487,800(0.02%)#786 |
| 3. | Greenwich | 90 | 3,621(2.49%)#3 | 487,800(0.02%)#929 |
| 4. | Milford City Balance | 81 | 3,621(2.24%)#4 | 487,800(0.02%)#1,030 |
| 5. | New Haven | 79 | 3,621(2.18%)#5 | 487,800(0.02%)#1,062 |
| 6. | West Haven | 72 | 3,621(1.99%)#6 | 487,800(0.01%)#1,157 |
| 7. | Ridgefield | 65 | 3,621(1.80%)#7 | 487,800(0.01%)#1,281 |
| 8. | Torrington | 57 | 3,621(1.57%)#8 | 487,800(0.01%)#1,431 |
| 9. | Chester Center | 53 | 3,621(1.46%)#9 | 487,800(0.01%)#1,543 |
| 10. | Old Greenwich | 48 | 3,621(1.33%)#10 | 487,800(0.01%)#1,685 |
| 11. | Bridgeport | 46 | 3,621(1.27%)#11 | 487,800(0.01%)#1,726 |
| 12. | Wethersfield | 44 | 3,621(1.22%)#12 | 487,800(0.01%)#1,797 |
| 13. | Stamford | 43 | 3,621(1.19%)#13 | 487,800(0.01%)#1,818 |
| 14. | New Britain | 43 | 3,621(1.19%)#14 | 487,800(0.01%)#1,821 |
| 15. | Willimantic | 43 | 3,621(1.19%)#15 | 487,800(0.01%)#1,842 |
| 16. | Watertown | 41 | 3,621(1.13%)#16 | 487,800(0.01%)#1,919 |
| 17. | Weston | 35 | 3,621(0.97%)#17 | 487,800(0.01%)#2,150 |
| 18. | Northford | 33 | 3,621(0.91%)#18 | 487,800(0.01%)#2,228 |
| 19. | Lakeville | 33 | 3,621(0.91%)#19 | 487,800(0.01%)#2,239 |
| 20. | New London | 31 | 3,621(0.86%)#20 | 487,800(0.01%)#2,297 |
| 21. | Durham | 31 | 3,621(0.86%)#21 | 487,800(0.01%)#2,336 |
| 22. | Plattsville | 31 | 3,621(0.86%)#22 | 487,800(0.01%)#2,344 |
| 23. | Norwalk | 30 | 3,621(0.83%)#23 | 487,800(0.01%)#2,351 |
| 24. | Middletown | 30 | 3,621(0.83%)#24 | 487,800(0.01%)#2,355 |
| 25. | Ansonia | 30 | 3,621(0.83%)#25 | 487,800(0.01%)#2,370 |
| 26. | Meriden | 27 | 3,621(0.75%)#26 | 487,800(0.01%)#2,534 |
| 27. | New Milford | 24 | 3,621(0.66%)#27 | 487,800(0.00%)#2,774 |
| 28. | Hartford | 23 | 3,621(0.64%)#28 | 487,800(0.00%)#2,797 |
| 29. | Waterbury | 19 | 3,621(0.52%)#29 | 487,800(0.00%)#3,099 |
| 30. | Tashua | 19 | 3,621(0.52%)#30 | 487,800(0.00%)#3,166 |
| 31. | Conning Towers Nautilus Park | 18 | 3,621(0.50%)#31 | 487,800(0.00%)#3,254 |
| 32. | Danbury | 17 | 3,621(0.47%)#32 | 487,800(0.00%)#3,303 |
| 33. | Riverside | 17 | 3,621(0.47%)#33 | 487,800(0.00%)#3,342 |
| 34. | Georgetown | 17 | 3,621(0.47%)#34 | 487,800(0.00%)#3,388 |
| 35. | Colchester | 16 | 3,621(0.44%)#35 | 487,800(0.00%)#3,477 |
| 36. | North Haven | 15 | 3,621(0.41%)#36 | 487,800(0.00%)#3,539 |
| 37. | Mill Plain | 15 | 3,621(0.41%)#37 | 487,800(0.00%)#3,614 |
| 38. | Lakes West | 12 | 3,621(0.33%)#38 | 487,800(0.00%)#4,011 |
| 39. | Branford Center | 11 | 3,621(0.30%)#39 | 487,800(0.00%)#4,098 |
| 40. | Simsbury Center | 11 | 3,621(0.30%)#40 | 487,800(0.00%)#4,100 |
| 41. | Newtown Borough | 11 | 3,621(0.30%)#41 | 487,800(0.00%)#4,143 |
| 42. | Glastonbury Center | 10 | 3,621(0.28%)#42 | 487,800(0.00%)#4,254 |
| 43. | Madison Center | 10 | 3,621(0.28%)#43 | 487,800(0.00%)#4,327 |
| 44. | Kensington | 9 | 3,621(0.25%)#44 | 487,800(0.00%)#4,421 |
| 45. | Ridgebury | 9 | 3,621(0.25%)#45 | 487,800(0.00%)#4,496 |
| 46. | Poplar Plains | 9 | 3,621(0.25%)#46 | 487,800(0.00%)#4,517 |
| 47. | Shelton | 8 | 3,621(0.22%)#47 | 487,800(0.00%)#4,557 |
| 48. | Wallingford Center | 8 | 3,621(0.22%)#48 | 487,800(0.00%)#4,577 |
| 49. | Orange | 8 | 3,621(0.22%)#49 | 487,800(0.00%)#4,587 |
| 50. | Groton | 8 | 3,621(0.22%)#50 | 487,800(0.00%)#4,605 |
| 51. | Noroton | 8 | 3,621(0.22%)#51 | 487,800(0.00%)#4,637 |
| 52. | Pemberwick | 8 | 3,621(0.22%)#52 | 487,800(0.00%)#4,665 |
| 53. | East Hampton | 8 | 3,621(0.22%)#53 | 487,800(0.00%)#4,668 |
| 54. | Manchester | 7 | 3,621(0.19%)#54 | 487,800(0.00%)#4,768 |
| 55. | Old Hill | 7 | 3,621(0.19%)#55 | 487,800(0.00%)#4,845 |
| 56. | Noank | 7 | 3,621(0.19%)#56 | 487,800(0.00%)#4,884 |
| 57. | Greens Farms | 6 | 3,621(0.17%)#57 | 487,800(0.00%)#5,030 |
| 58. | Clinton | 5 | 3,621(0.14%)#58 | 487,800(0.00%)#5,227 |
| 59. | Fenwick Borough | 5 | 3,621(0.14%)#59 | 487,800(0.00%)#5,369 |
| 60. | Woodmont Borough | 3 | 3,621(0.08%)#60 | 487,800(0.00%)#5,683 |
| 61. | Candlewood Isle | 3 | 3,621(0.08%)#61 | 487,800(0.00%)#5,831 |
| 62. | Norfolk | 2 | 3,621(0.06%)#62 | 487,800(0.00%)#6,009 |
| 63. | East Hartford | 1 | 3,621(0.03%)#63 | 487,800(0.00%)#6,168 |
| 64. | Cannondale | 1 | 3,621(0.03%)#64 | 487,800(0.00%)#6,235 |
Common Questions
What are the Top 10 Cities with the Largest Northern European Community in Connecticut?
Top 10 Cities with the Largest Northern European Community in Connecticut are:
#1
154
#2
90
#3
81
#4
79
#5
72
#6
65
#7
57
#8
53
#9
48
#10
46
What city has the Largest Northern European Community in Connecticut?
West Hartford has the Largest Northern European Community in Connecticut with 154.
What is the Total Northern European Population in the State of Connecticut?
Total Northern European Population in Connecticut is 3,621.
What is the Total Northern European Population in the United States?
Total Northern European Population in the United States is 487,800.