Cities with the Highest Percentage of Population Employed in Production in Connecticut
RELATED REPORTS & OPTIONS
Production
Connecticut
Compare Cities
Map of Cities with the Highest Percentage of Population Employed in Production in Connecticut
0.0%
25.0%
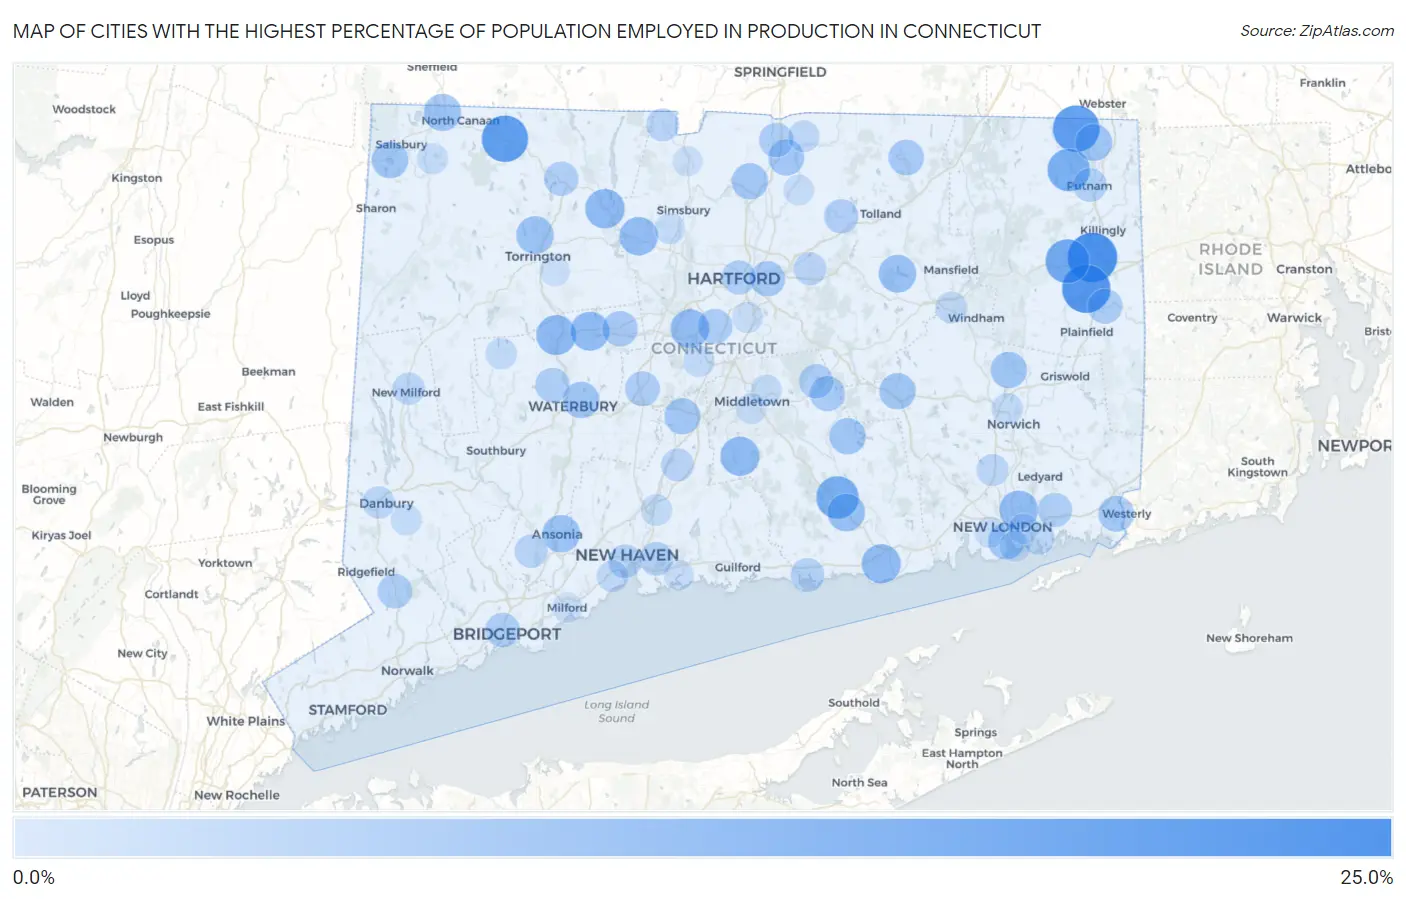
Cities with the Highest Percentage of Population Employed in Production in Connecticut
| City | % Employed | vs State | vs National | |
| 1. | East Brooklyn | 20.7% | 4.7%(+16.0)#1 | 5.5%(+15.2)#2,085 |
| 2. | Wauregan | 19.5% | 4.7%(+14.8)#2 | 5.5%(+14.0)#2,408 |
| 3. | Quinebaug | 18.0% | 4.7%(+13.3)#3 | 5.5%(+12.5)#2,942 |
| 4. | Norfolk | 17.7% | 4.7%(+13.0)#4 | 5.5%(+12.2)#3,061 |
| 5. | Pleasant Valley | 17.6% | 4.7%(+12.9)#5 | 5.5%(+12.1)#3,086 |
| 6. | Brooklyn | 15.3% | 4.7%(+10.6)#6 | 5.5%(+9.84)#4,225 |
| 7. | Chester Center | 14.1% | 4.7%(+9.45)#7 | 5.5%(+8.67)#4,930 |
| 8. | South Woodstock | 14.1% | 4.7%(+9.41)#8 | 5.5%(+8.63)#4,950 |
| 9. | Gaylordsville | 13.1% | 4.7%(+8.44)#9 | 5.5%(+7.67)#5,654 |
| 10. | Thomaston | 11.5% | 4.7%(+6.84)#10 | 5.5%(+6.07)#7,094 |
| 11. | New Hartford Center | 11.2% | 4.7%(+6.48)#11 | 5.5%(+5.70)#7,458 |
| 12. | Quasset Lake | 11.0% | 4.7%(+6.34)#12 | 5.5%(+5.57)#7,616 |
| 13. | Durham | 10.9% | 4.7%(+6.24)#13 | 5.5%(+5.46)#7,730 |
| 14. | Old Saybrook Center | 10.9% | 4.7%(+6.23)#14 | 5.5%(+5.45)#7,738 |
| 15. | Mechanicsville | 10.9% | 4.7%(+6.17)#15 | 5.5%(+5.40)#7,800 |
| 16. | Terryville | 10.7% | 4.7%(+6.06)#16 | 5.5%(+5.28)#7,903 |
| 17. | Conning Towers Nautilus Park | 10.6% | 4.7%(+5.93)#17 | 5.5%(+5.15)#8,020 |
| 18. | New Britain | 10.6% | 4.7%(+5.87)#18 | 5.5%(+5.09)#8,082 |
| 19. | Canton Valley | 10.4% | 4.7%(+5.70)#19 | 5.5%(+4.92)#8,284 |
| 20. | Deep River Center | 9.6% | 4.7%(+4.88)#20 | 5.5%(+4.10)#9,248 |
| 21. | Coventry Lake | 9.6% | 4.7%(+4.86)#21 | 5.5%(+4.08)#9,272 |
| 22. | Dayville | 9.5% | 4.7%(+4.80)#22 | 5.5%(+4.03)#9,354 |
| 23. | Torrington | 9.5% | 4.7%(+4.80)#23 | 5.5%(+4.02)#9,361 |
| 24. | Ansonia | 9.4% | 4.7%(+4.71)#24 | 5.5%(+3.94)#9,462 |
| 25. | Danielson Borough | 9.4% | 4.7%(+4.67)#25 | 5.5%(+3.89)#9,527 |
| 26. | Canaan | 9.1% | 4.7%(+4.42)#26 | 5.5%(+3.64)#9,810 |
| 27. | Naugatuck Borough | 9.1% | 4.7%(+4.41)#27 | 5.5%(+3.63)#9,824 |
| 28. | North Grosvenor Dale | 8.9% | 4.7%(+4.19)#28 | 5.5%(+3.42)#10,123 |
| 29. | Lakeville | 8.6% | 4.7%(+3.88)#29 | 5.5%(+3.10)#10,552 |
| 30. | Lordship | 8.5% | 4.7%(+3.76)#30 | 5.5%(+2.99)#10,702 |
| 31. | New London | 8.4% | 4.7%(+3.75)#31 | 5.5%(+2.97)#10,733 |
| 32. | Moodus | 8.4% | 4.7%(+3.71)#32 | 5.5%(+2.93)#10,788 |
| 33. | Waterbury | 8.4% | 4.7%(+3.71)#33 | 5.5%(+2.93)#10,791 |
| 34. | Baltic | 8.4% | 4.7%(+3.70)#34 | 5.5%(+2.92)#10,807 |
| 35. | Colchester | 8.3% | 4.7%(+3.65)#35 | 5.5%(+2.87)#10,865 |
| 36. | Windsor Locks | 8.3% | 4.7%(+3.58)#36 | 5.5%(+2.81)#10,980 |
| 37. | Southwood Acres | 8.2% | 4.7%(+3.50)#37 | 5.5%(+2.72)#11,085 |
| 38. | Meriden | 8.1% | 4.7%(+3.44)#38 | 5.5%(+2.66)#11,172 |
| 39. | Pawcatuck | 7.8% | 4.7%(+3.16)#39 | 5.5%(+2.38)#11,579 |
| 40. | Stafford Springs | 7.7% | 4.7%(+3.01)#40 | 5.5%(+2.23)#11,809 |
| 41. | Bristol | 7.6% | 4.7%(+2.87)#41 | 5.5%(+2.09)#12,055 |
| 42. | East Hartford | 7.4% | 4.7%(+2.72)#42 | 5.5%(+1.94)#12,294 |
| 43. | East Hampton | 7.2% | 4.7%(+2.50)#43 | 5.5%(+1.72)#12,653 |
| 44. | Moosup | 7.1% | 4.7%(+2.39)#44 | 5.5%(+1.62)#12,833 |
| 45. | Northford | 6.9% | 4.7%(+2.24)#45 | 5.5%(+1.46)#13,106 |
| 46. | Newington | 6.9% | 4.7%(+2.23)#46 | 5.5%(+1.45)#13,119 |
| 47. | Lake Bungee | 6.9% | 4.7%(+2.23)#47 | 5.5%(+1.45)#13,124 |
| 48. | Plantsville | 6.9% | 4.7%(+2.22)#48 | 5.5%(+1.45)#13,128 |
| 49. | Georgetown | 6.8% | 4.7%(+2.06)#49 | 5.5%(+1.28)#13,400 |
| 50. | Lake Pocotopaug | 6.7% | 4.7%(+2.05)#50 | 5.5%(+1.27)#13,414 |
| 51. | Bridgeport | 6.7% | 4.7%(+2.05)#51 | 5.5%(+1.27)#13,415 |
| 52. | Thompsonville | 6.7% | 4.7%(+1.99)#52 | 5.5%(+1.22)#13,525 |
| 53. | Oakville | 6.7% | 4.7%(+1.99)#53 | 5.5%(+1.21)#13,531 |
| 54. | Old Mystic | 6.5% | 4.7%(+1.83)#54 | 5.5%(+1.05)#13,805 |
| 55. | Rockville | 6.5% | 4.7%(+1.81)#55 | 5.5%(+1.04)#13,838 |
| 56. | Winsted | 6.5% | 4.7%(+1.79)#56 | 5.5%(+1.02)#13,864 |
| 57. | Hartford | 6.4% | 4.7%(+1.73)#57 | 5.5%(+0.948)#13,983 |
| 58. | Clinton | 6.0% | 4.7%(+1.30)#58 | 5.5%(+0.526)#14,729 |
| 59. | Putnam | 6.0% | 4.7%(+1.27)#59 | 5.5%(+0.491)#14,804 |
| 60. | East Haven | 5.8% | 4.7%(+1.12)#60 | 5.5%(+0.346)#15,077 |
| 61. | New Haven | 5.8% | 4.7%(+1.10)#61 | 5.5%(+0.318)#15,138 |
| 62. | Bantam Borough | 5.8% | 4.7%(+1.09)#62 | 5.5%(+0.312)#15,153 |
| 63. | Shelton | 5.5% | 4.7%(+0.795)#63 | 5.5%(+0.017)#15,741 |
| 64. | Manchester | 5.3% | 4.7%(+0.577)#64 | 5.5%(-0.202)#16,148 |
| 65. | North Granby | 5.3% | 4.7%(+0.567)#65 | 5.5%(-0.211)#16,195 |
| 66. | Wallingford Center | 5.2% | 4.7%(+0.490)#66 | 5.5%(-0.288)#16,331 |
| 67. | New Milford | 4.8% | 4.7%(+0.108)#67 | 5.5%(-0.670)#17,057 |
| 68. | Danbury | 4.7% | 4.7%(+0.049)#68 | 5.5%(-0.730)#17,174 |
| 69. | Oronoque | 4.5% | 4.7%(-0.214)#69 | 5.5%(-0.992)#17,706 |
| 70. | Oxoboxo River | 4.5% | 4.7%(-0.236)#70 | 5.5%(-1.01)#17,742 |
| 71. | Poquonock Bridge | 4.4% | 4.7%(-0.311)#71 | 5.5%(-1.09)#17,903 |
| 72. | Willimantic | 4.3% | 4.7%(-0.372)#72 | 5.5%(-1.15)#18,059 |
| 73. | West Haven | 4.2% | 4.7%(-0.461)#73 | 5.5%(-1.24)#18,245 |
| 74. | Stratford Downtown | 4.2% | 4.7%(-0.463)#74 | 5.5%(-1.24)#18,250 |
| 75. | Hazardville | 4.1% | 4.7%(-0.561)#75 | 5.5%(-1.34)#18,461 |
| 76. | North Haven | 4.1% | 4.7%(-0.570)#76 | 5.5%(-1.35)#18,486 |
| 77. | Trumbull Center | 4.1% | 4.7%(-0.616)#77 | 5.5%(-1.39)#18,578 |
| 78. | Bethlehem Village | 4.0% | 4.7%(-0.721)#78 | 5.5%(-1.50)#18,794 |
| 79. | Kensington | 3.9% | 4.7%(-0.783)#79 | 5.5%(-1.56)#18,927 |
| 80. | Norwich | 3.9% | 4.7%(-0.787)#80 | 5.5%(-1.57)#18,939 |
| 81. | Lake Chaffee | 3.7% | 4.7%(-0.959)#81 | 5.5%(-1.74)#19,298 |
| 82. | Falls Village | 3.7% | 4.7%(-1.04)#82 | 5.5%(-1.82)#19,462 |
| 83. | Portland | 3.5% | 4.7%(-1.15)#83 | 5.5%(-1.93)#19,706 |
| 84. | Bethel | 3.5% | 4.7%(-1.16)#84 | 5.5%(-1.94)#19,743 |
| 85. | Sacred Heart University | 3.5% | 4.7%(-1.20)#85 | 5.5%(-1.98)#19,825 |
| 86. | Wethersfield | 3.4% | 4.7%(-1.29)#86 | 5.5%(-2.07)#20,033 |
| 87. | Waterford | 3.4% | 4.7%(-1.31)#87 | 5.5%(-2.09)#20,068 |
| 88. | Middletown | 3.4% | 4.7%(-1.32)#88 | 5.5%(-2.10)#20,097 |
| 89. | Broad Brook | 3.4% | 4.7%(-1.34)#89 | 5.5%(-2.11)#20,120 |
| 90. | Groton | 3.3% | 4.7%(-1.43)#90 | 5.5%(-2.21)#20,353 |
| 91. | Weatogue | 3.3% | 4.7%(-1.44)#91 | 5.5%(-2.22)#20,367 |
| 92. | Branford Center | 3.1% | 4.7%(-1.58)#92 | 5.5%(-2.36)#20,658 |
| 93. | Long Hill | 3.1% | 4.7%(-1.59)#93 | 5.5%(-2.37)#20,672 |
| 94. | Daniels Farm | 3.1% | 4.7%(-1.60)#94 | 5.5%(-2.38)#20,701 |
| 95. | Jewett City Borough | 3.0% | 4.7%(-1.66)#95 | 5.5%(-2.44)#20,811 |
| 96. | Stepney | 2.9% | 4.7%(-1.74)#96 | 5.5%(-2.52)#20,974 |
| 97. | Milford City Balance | 2.9% | 4.7%(-1.83)#97 | 5.5%(-2.61)#21,197 |
| 98. | Salmon Brook | 2.8% | 4.7%(-1.85)#98 | 5.5%(-2.63)#21,235 |
| 99. | Northwest Harwinton | 2.8% | 4.7%(-1.87)#99 | 5.5%(-2.64)#21,272 |
| 100. | Bridgewater | 2.8% | 4.7%(-1.91)#100 | 5.5%(-2.69)#21,371 |
Common Questions
What are the Top 10 Cities with the Highest Percentage of Population Employed in Production in Connecticut?
Top 10 Cities with the Highest Percentage of Population Employed in Production in Connecticut are:
#1
20.7%
#2
19.5%
#3
18.0%
#4
17.7%
#5
15.3%
#6
14.1%
#7
14.1%
#8
11.5%
#9
11.2%
#10
10.9%
What city has the Highest Percentage of Population Employed in Production in Connecticut?
East Brooklyn has the Highest Percentage of Population Employed in Production in Connecticut with 20.7%.
What is the Percentage of Population Employed in Production in the State of Connecticut?
Percentage of Population Employed in Production in Connecticut is 4.7%.
What is the Percentage of Population Employed in Production in the United States?
Percentage of Population Employed in Production in the United States is 5.5%.