New Britain, CT Map & Demographics
New Britain Map
New Britain Overview
$28,796
PER CAPITA INCOME
$68,050
AVG FAMILY INCOME
$53,766
AVG HOUSEHOLD INCOME
20.0%
WAGE / INCOME GAP [ % ]
80.0¢/ $1
WAGE / INCOME GAP [ $ ]
$10,429
FAMILY INCOME DEFICIT
0.46
INEQUALITY / GINI INDEX
74,212
TOTAL POPULATION
35,973
MALE POPULATION
38,239
FEMALE POPULATION
94.07
MALES / 100 FEMALES
106.30
FEMALES / 100 MALES
33.4
MEDIAN AGE
3.2
AVG FAMILY SIZE
2.5
AVG HOUSEHOLD SIZE
38,729
LABOR FORCE [ PEOPLE ]
66.0%
PERCENT IN LABOR FORCE
8.9%
UNEMPLOYMENT RATE
New Britain Area Codes
Income in New Britain
Income Overview in New Britain
Per Capita Income in New Britain is $28,796, while median incomes of families and households are $68,050 and $53,766 respectively.
| Characteristic | Number | Measure |
| Per Capita Income | 74,212 | $28,796 |
| Median Family Income | 16,742 | $68,050 |
| Mean Family Income | 16,742 | $83,965 |
| Median Household Income | 28,575 | $53,766 |
| Mean Household Income | 28,575 | $72,419 |
| Income Deficit | 16,742 | $10,429 |
| Wage / Income Gap (%) | 74,212 | 20.03% |
| Wage / Income Gap ($) | 74,212 | 79.97¢ per $1 |
| Gini / Inequality Index | 74,212 | 0.46 |
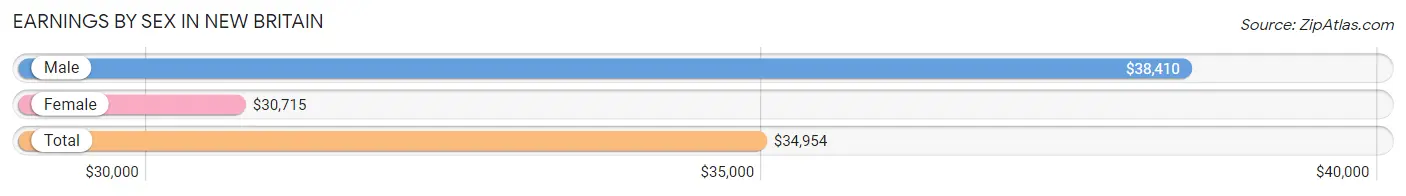
Earnings by Sex in New Britain
Average Earnings in New Britain are $34,954, $38,410 for men and $30,715 for women, a difference of 20.0%.
| Sex | Number | Average Earnings |
| Male | 20,182 (51.3%) | $38,410 |
| Female | 19,153 (48.7%) | $30,715 |
| Total | 39,335 (100.0%) | $34,954 |
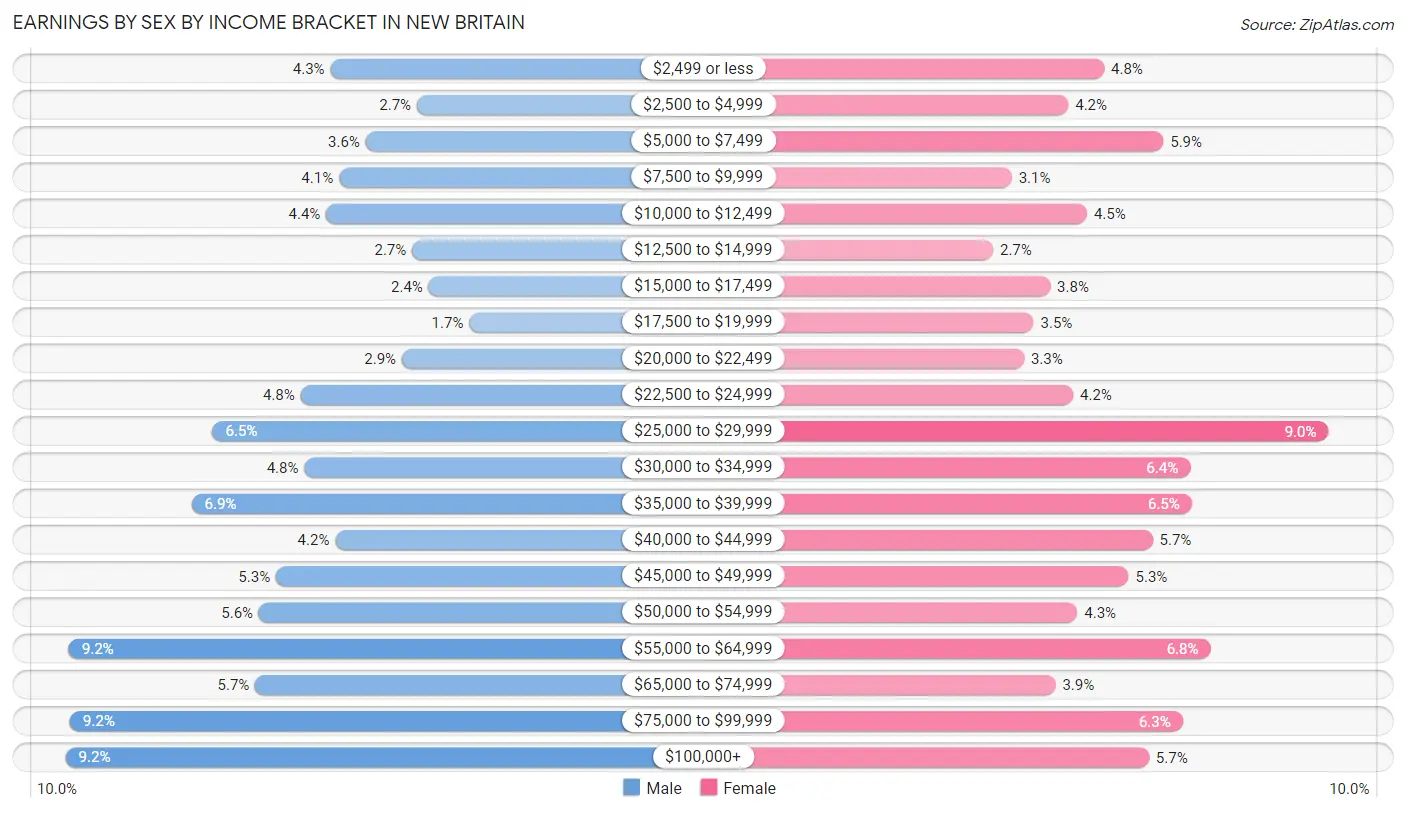
Earnings by Sex by Income Bracket in New Britain
The most common earnings brackets in New Britain are $100,000+ for men (1,862 | 9.2%) and $25,000 to $29,999 for women (1,728 | 9.0%).
| Income | Male | Female |
| $2,499 or less | 862 (4.3%) | 924 (4.8%) |
| $2,500 to $4,999 | 535 (2.6%) | 795 (4.2%) |
| $5,000 to $7,499 | 729 (3.6%) | 1,135 (5.9%) |
| $7,500 to $9,999 | 829 (4.1%) | 592 (3.1%) |
| $10,000 to $12,499 | 877 (4.3%) | 862 (4.5%) |
| $12,500 to $14,999 | 552 (2.7%) | 524 (2.7%) |
| $15,000 to $17,499 | 491 (2.4%) | 729 (3.8%) |
| $17,500 to $19,999 | 338 (1.7%) | 671 (3.5%) |
| $20,000 to $22,499 | 591 (2.9%) | 636 (3.3%) |
| $22,500 to $24,999 | 975 (4.8%) | 812 (4.2%) |
| $25,000 to $29,999 | 1,308 (6.5%) | 1,728 (9.0%) |
| $30,000 to $34,999 | 961 (4.8%) | 1,232 (6.4%) |
| $35,000 to $39,999 | 1,387 (6.9%) | 1,238 (6.5%) |
| $40,000 to $44,999 | 843 (4.2%) | 1,097 (5.7%) |
| $45,000 to $49,999 | 1,067 (5.3%) | 1,011 (5.3%) |
| $50,000 to $54,999 | 1,132 (5.6%) | 827 (4.3%) |
| $55,000 to $64,999 | 1,850 (9.2%) | 1,304 (6.8%) |
| $65,000 to $74,999 | 1,147 (5.7%) | 748 (3.9%) |
| $75,000 to $99,999 | 1,846 (9.1%) | 1,204 (6.3%) |
| $100,000+ | 1,862 (9.2%) | 1,084 (5.7%) |
| Total | 20,182 (100.0%) | 19,153 (100.0%) |
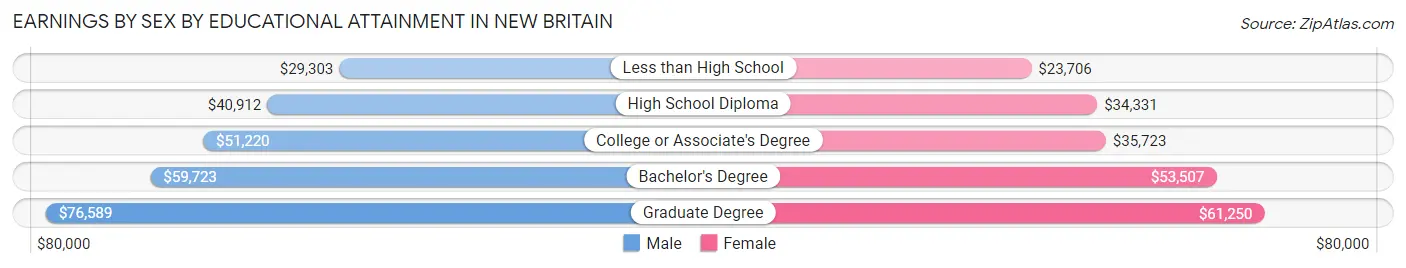
Earnings by Sex by Educational Attainment in New Britain
Average earnings in New Britain are $46,574 for men and $36,907 for women, a difference of 20.8%. Men with an educational attainment of graduate degree enjoy the highest average annual earnings of $76,589, while those with less than high school education earn the least with $29,303. Women with an educational attainment of graduate degree earn the most with the average annual earnings of $61,250, while those with less than high school education have the smallest earnings of $23,706.
| Educational Attainment | Male Income | Female Income |
| Less than High School | $29,303 | $23,706 |
| High School Diploma | $40,912 | $34,331 |
| College or Associate's Degree | $51,220 | $35,723 |
| Bachelor's Degree | $59,723 | $53,507 |
| Graduate Degree | $76,589 | $61,250 |
| Total | $46,574 | $36,907 |
Family Income in New Britain
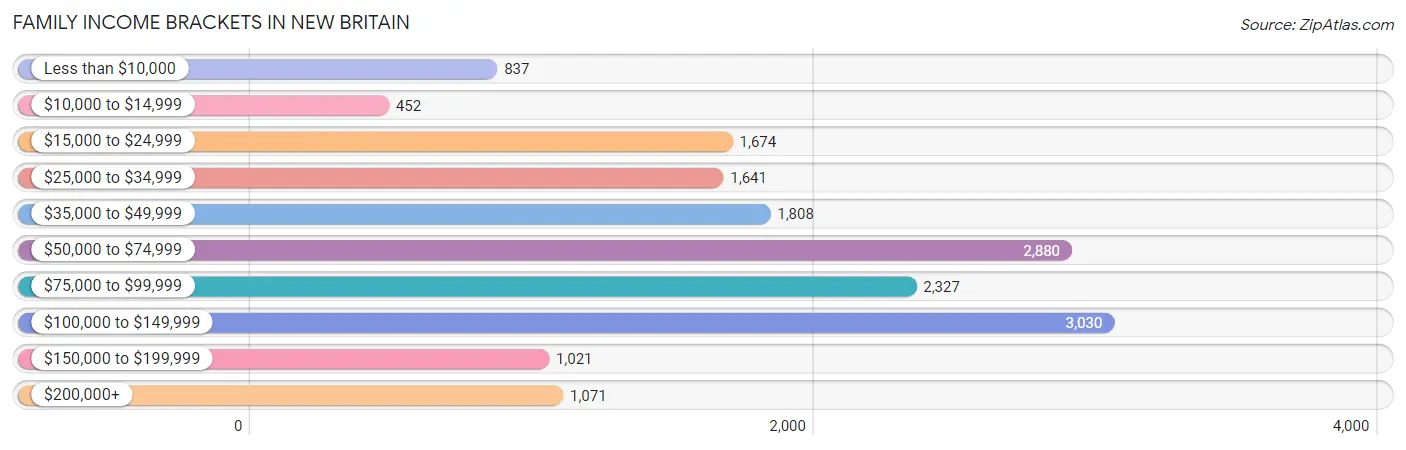
Family Income Brackets in New Britain
According to the New Britain family income data, there are 3,030 families falling into the $100,000 to $149,999 income range, which is the most common income bracket and makes up 18.1% of all families. Conversely, the $10,000 to $14,999 income bracket is the least frequent group with only 452 families (2.7%) belonging to this category.
| Income Bracket | # Families | % Families |
| Less than $10,000 | 837 | 5.0% |
| $10,000 to $14,999 | 452 | 2.7% |
| $15,000 to $24,999 | 1,674 | 10.0% |
| $25,000 to $34,999 | 1,641 | 9.8% |
| $35,000 to $49,999 | 1,808 | 10.8% |
| $50,000 to $74,999 | 2,880 | 17.2% |
| $75,000 to $99,999 | 2,327 | 13.9% |
| $100,000 to $149,999 | 3,030 | 18.1% |
| $150,000 to $199,999 | 1,021 | 6.1% |
| $200,000+ | 1,071 | 6.4% |
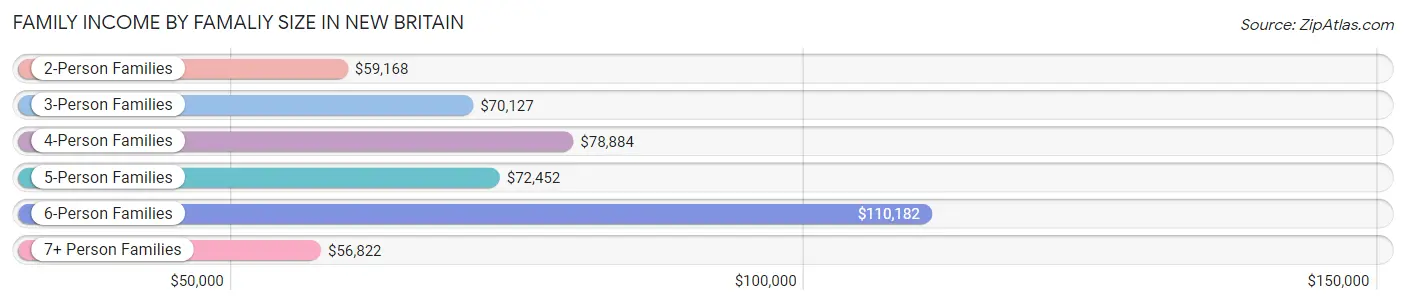
Family Income by Famaliy Size in New Britain
6-person families (754 | 4.5%) account for the highest median family income in New Britain with $110,182 per family, while 2-person families (7,275 | 43.4%) have the highest median income of $29,584 per family member.
| Income Bracket | # Families | Median Income |
| 2-Person Families | 7,275 (43.4%) | $59,168 |
| 3-Person Families | 4,200 (25.1%) | $70,127 |
| 4-Person Families | 3,091 (18.5%) | $78,884 |
| 5-Person Families | 1,185 (7.1%) | $72,452 |
| 6-Person Families | 754 (4.5%) | $110,182 |
| 7+ Person Families | 237 (1.4%) | $56,822 |
| Total | 16,742 (100.0%) | $68,050 |
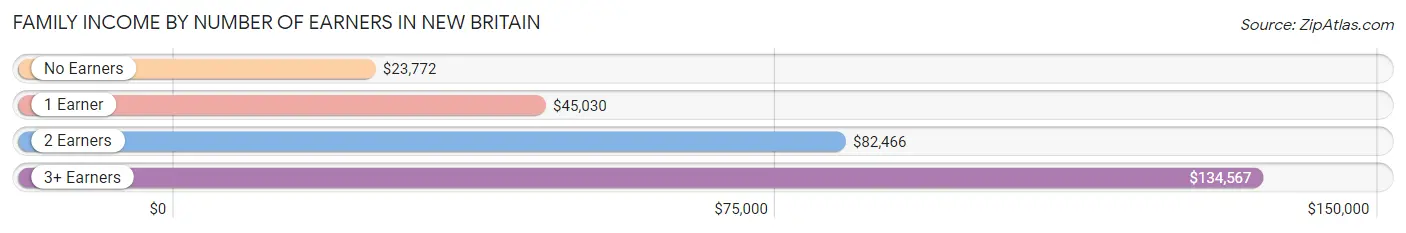
Family Income by Number of Earners in New Britain
The median family income in New Britain is $68,050, with families comprising 3+ earners (2,440) having the highest median family income of $134,567, while families with no earners (2,368) have the lowest median family income of $23,772, accounting for 14.6% and 14.1% of families, respectively.
| Number of Earners | # Families | Median Income |
| No Earners | 2,368 (14.1%) | $23,772 |
| 1 Earner | 6,060 (36.2%) | $45,030 |
| 2 Earners | 5,874 (35.1%) | $82,466 |
| 3+ Earners | 2,440 (14.6%) | $134,567 |
| Total | 16,742 (100.0%) | $68,050 |
Household Income in New Britain
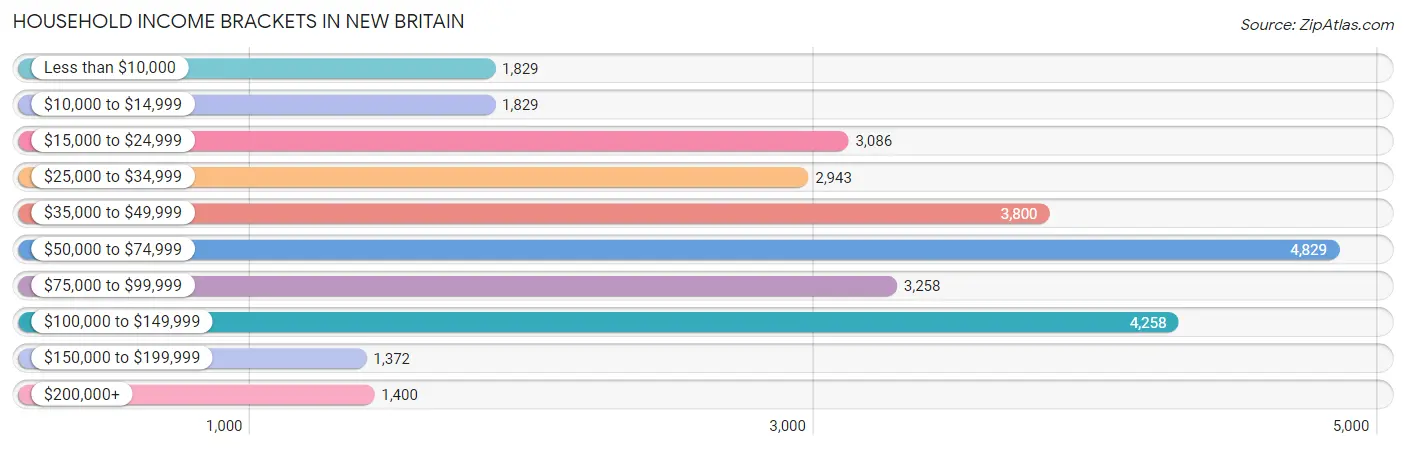
Household Income Brackets in New Britain
With 4,829 households falling in the category, the $50,000 to $74,999 income range is the most frequent in New Britain, accounting for 16.9% of all households. In contrast, only 1,372 households (4.8%) fall into the $150,000 to $199,999 income bracket, making it the least populous group.
| Income Bracket | # Households | % Households |
| Less than $10,000 | 1,829 | 6.4% |
| $10,000 to $14,999 | 1,829 | 6.4% |
| $15,000 to $24,999 | 3,086 | 10.8% |
| $25,000 to $34,999 | 2,943 | 10.3% |
| $35,000 to $49,999 | 3,800 | 13.3% |
| $50,000 to $74,999 | 4,829 | 16.9% |
| $75,000 to $99,999 | 3,258 | 11.4% |
| $100,000 to $149,999 | 4,258 | 14.9% |
| $150,000 to $199,999 | 1,372 | 4.8% |
| $200,000+ | 1,400 | 4.9% |
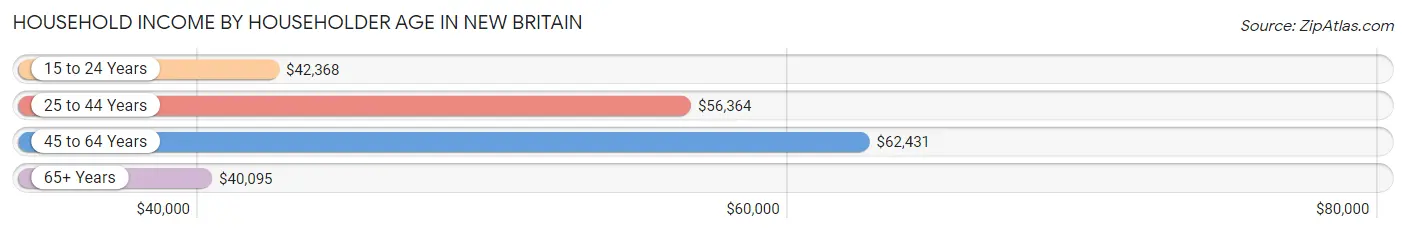
Household Income by Householder Age in New Britain
The median household income in New Britain is $53,766, with the highest median household income of $62,431 found in the 45 to 64 years age bracket for the primary householder. A total of 9,776 households (34.2%) fall into this category. Meanwhile, the 65+ years age bracket for the primary householder has the lowest median household income of $40,095, with 6,326 households (22.1%) in this group.
| Income Bracket | # Households | Median Income |
| 15 to 24 Years | 1,716 (6.0%) | $42,368 |
| 25 to 44 Years | 10,757 (37.6%) | $56,364 |
| 45 to 64 Years | 9,776 (34.2%) | $62,431 |
| 65+ Years | 6,326 (22.1%) | $40,095 |
| Total | 28,575 (100.0%) | $53,766 |
Poverty in New Britain
Income Below Poverty by Sex and Age in New Britain
With 18.9% poverty level for males and 20.4% for females among the residents of New Britain, 5 year old males and 5 year old females are the most vulnerable to poverty, with 116 males (42.6%) and 180 females (28.2%) in their respective age groups living below the poverty level.
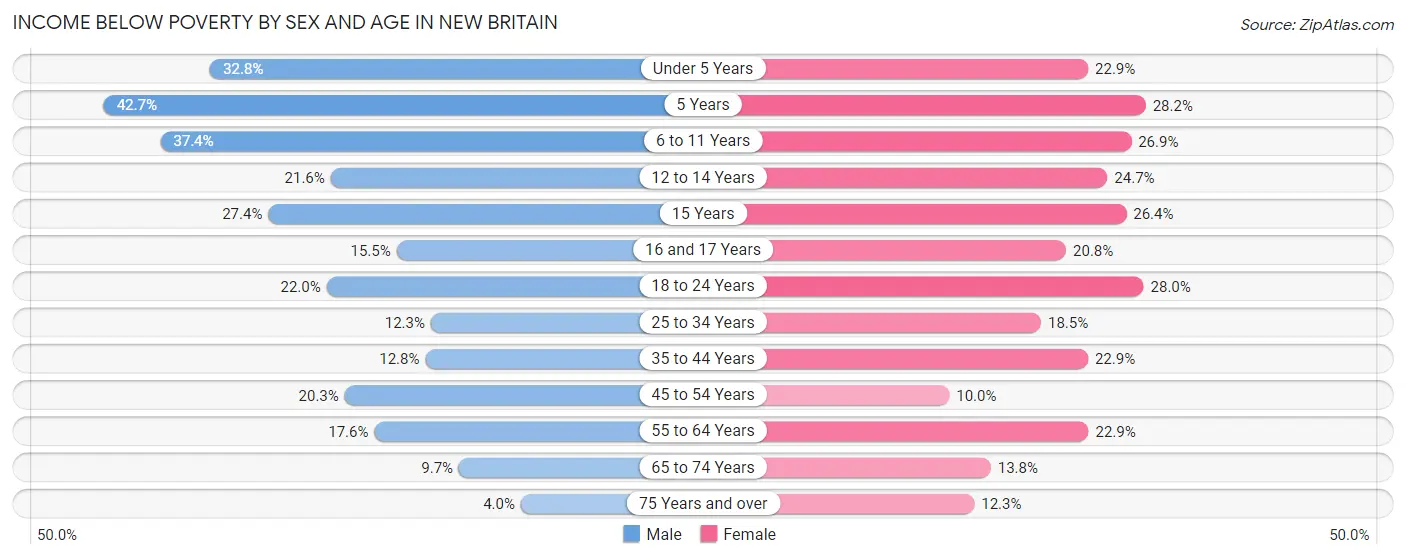
| Age Bracket | Male | Female |
| Under 5 Years | 681 (32.8%) | 635 (22.9%) |
| 5 Years | 116 (42.6%) | 180 (28.2%) |
| 6 to 11 Years | 1,138 (37.4%) | 760 (26.9%) |
| 12 to 14 Years | 303 (21.6%) | 339 (24.6%) |
| 15 Years | 123 (27.4%) | 127 (26.4%) |
| 16 and 17 Years | 165 (15.5%) | 168 (20.8%) |
| 18 to 24 Years | 955 (22.0%) | 1,182 (28.0%) |
| 25 to 34 Years | 629 (12.3%) | 1,080 (18.5%) |
| 35 to 44 Years | 604 (12.8%) | 1,086 (22.9%) |
| 45 to 54 Years | 831 (20.3%) | 427 (10.0%) |
| 55 to 64 Years | 663 (17.5%) | 873 (22.9%) |
| 65 to 74 Years | 261 (9.7%) | 432 (13.8%) |
| 75 Years and over | 55 (4.0%) | 243 (12.3%) |
| Total | 6,524 (18.9%) | 7,532 (20.4%) |
Income Above Poverty by Sex and Age in New Britain
According to the poverty statistics in New Britain, males aged 75 years and over and females aged 45 to 54 years are the age groups that are most secure financially, with 96.1% of males and 90.0% of females in these age groups living above the poverty line.
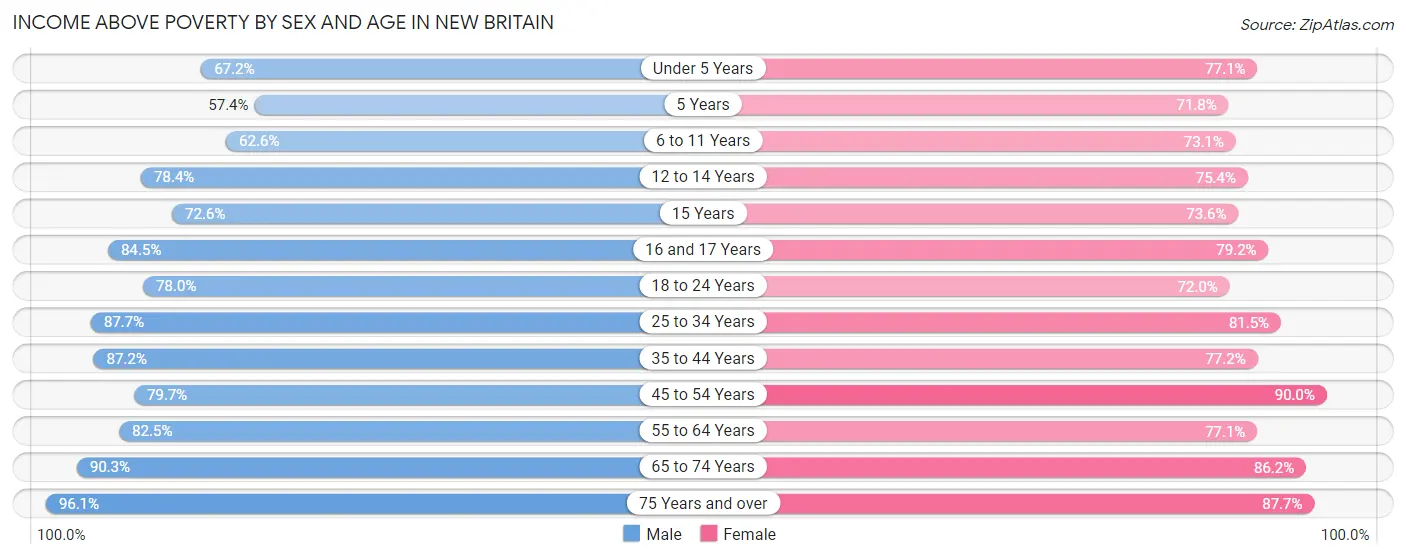
| Age Bracket | Male | Female |
| Under 5 Years | 1,396 (67.2%) | 2,143 (77.1%) |
| 5 Years | 156 (57.4%) | 458 (71.8%) |
| 6 to 11 Years | 1,905 (62.6%) | 2,070 (73.1%) |
| 12 to 14 Years | 1,100 (78.4%) | 1,036 (75.3%) |
| 15 Years | 326 (72.6%) | 354 (73.6%) |
| 16 and 17 Years | 901 (84.5%) | 639 (79.2%) |
| 18 to 24 Years | 3,390 (78.0%) | 3,038 (72.0%) |
| 25 to 34 Years | 4,484 (87.7%) | 4,761 (81.5%) |
| 35 to 44 Years | 4,110 (87.2%) | 3,667 (77.1%) |
| 45 to 54 Years | 3,263 (79.7%) | 3,853 (90.0%) |
| 55 to 64 Years | 3,115 (82.5%) | 2,939 (77.1%) |
| 65 to 74 Years | 2,433 (90.3%) | 2,691 (86.2%) |
| 75 Years and over | 1,336 (96.1%) | 1,732 (87.7%) |
| Total | 27,915 (81.1%) | 29,381 (79.6%) |
Income Below Poverty Among Married-Couple Families in New Britain
The poverty statistics for married-couple families in New Britain show that 6.7% or 561 of the total 8,380 families live below the poverty line. Families with 5 or more children have the highest poverty rate of 22.4%, comprising of 13 families. On the other hand, families with 1 or 2 children have the lowest poverty rate of 4.4%, which includes 120 families.
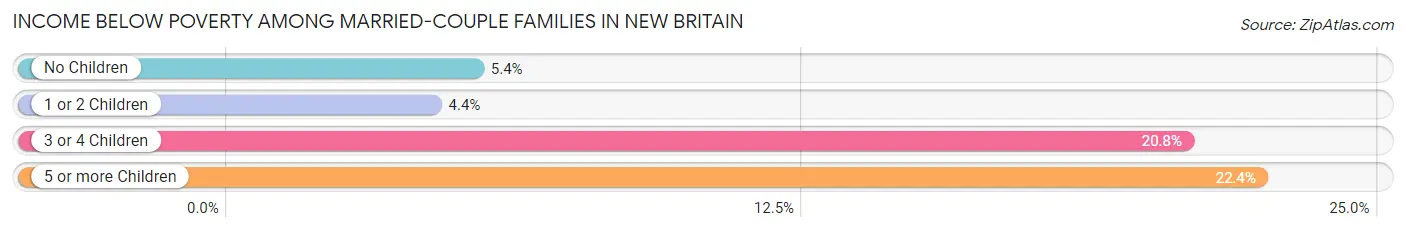
| Children | Above Poverty | Below Poverty |
| No Children | 4,532 (94.7%) | 256 (5.3%) |
| 1 or 2 Children | 2,587 (95.6%) | 120 (4.4%) |
| 3 or 4 Children | 655 (79.2%) | 172 (20.8%) |
| 5 or more Children | 45 (77.6%) | 13 (22.4%) |
| Total | 7,819 (93.3%) | 561 (6.7%) |
Income Below Poverty Among Single-Parent Households in New Britain
According to the poverty data in New Britain, 13.2% or 265 single-father households and 26.8% or 1,705 single-mother households are living below the poverty line. Among single-father households, those with 5 or more children have the highest poverty rate, with 7 households (100.0%) experiencing poverty. Likewise, among single-mother households, those with 3 or 4 children have the highest poverty rate, with 548 households (69.1%) falling below the poverty line.
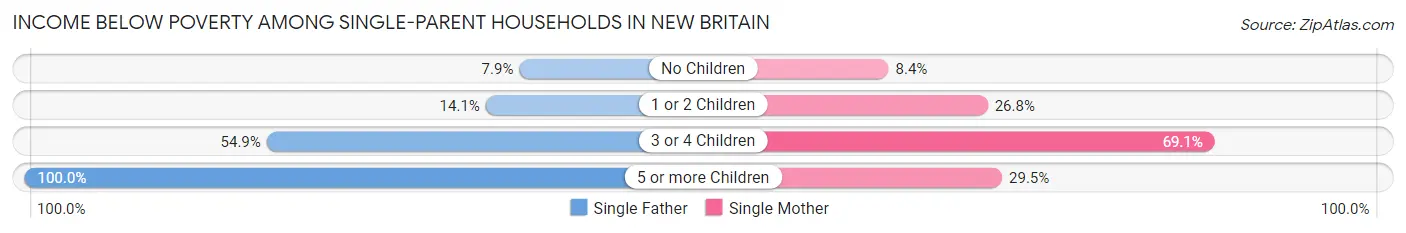
| Children | Single Father | Single Mother |
| No Children | 93 (7.9%) | 153 (8.4%) |
| 1 or 2 Children | 98 (14.1%) | 986 (26.8%) |
| 3 or 4 Children | 67 (54.9%) | 548 (69.1%) |
| 5 or more Children | 7 (100.0%) | 18 (29.5%) |
| Total | 265 (13.2%) | 1,705 (26.8%) |
Income Below Poverty Among Married-Couple vs Single-Parent Households in New Britain
The poverty data for New Britain shows that 561 of the married-couple family households (6.7%) and 1,970 of the single-parent households (23.6%) are living below the poverty level. Within the married-couple family households, those with 5 or more children have the highest poverty rate, with 13 households (22.4%) falling below the poverty line. Among the single-parent households, those with 3 or 4 children have the highest poverty rate, with 615 household (67.2%) living below poverty.
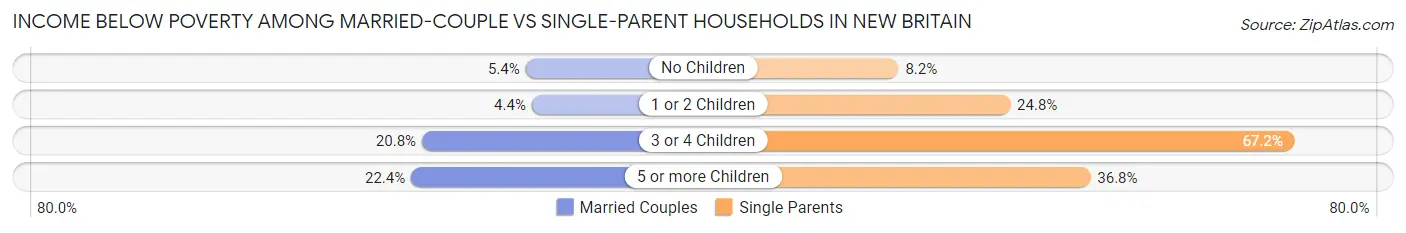
| Children | Married-Couple Families | Single-Parent Households |
| No Children | 256 (5.3%) | 246 (8.2%) |
| 1 or 2 Children | 120 (4.4%) | 1,084 (24.8%) |
| 3 or 4 Children | 172 (20.8%) | 615 (67.2%) |
| 5 or more Children | 13 (22.4%) | 25 (36.8%) |
| Total | 561 (6.7%) | 1,970 (23.6%) |
Race in New Britain
The most populous races in New Britain are White / Caucasian (41,141 | 55.4%), Hispanic or Latino (32,910 | 44.4%), and Some other Race (10,843 | 14.6%).
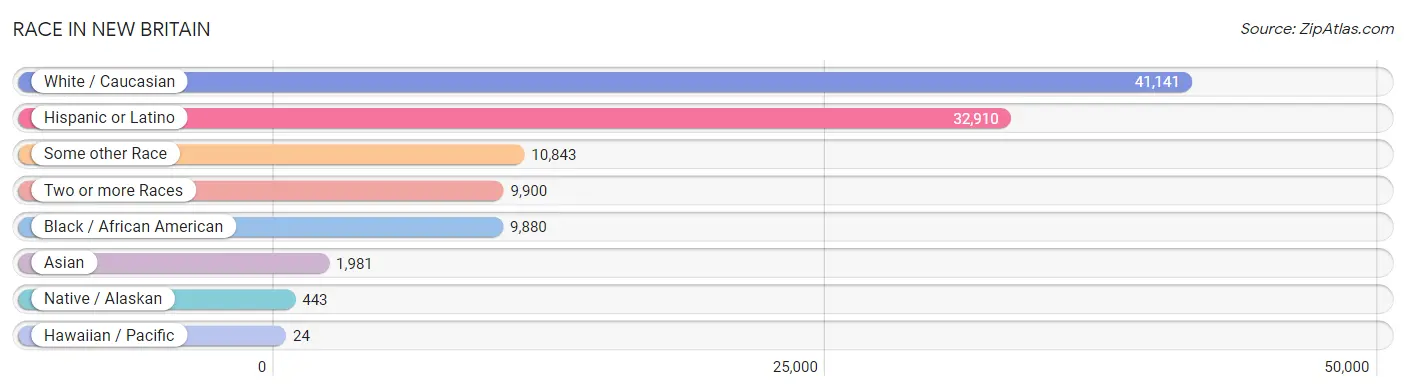
| Race | # Population | % Population |
| Asian | 1,981 | 2.7% |
| Black / African American | 9,880 | 13.3% |
| Hawaiian / Pacific | 24 | 0.0% |
| Hispanic or Latino | 32,910 | 44.4% |
| Native / Alaskan | 443 | 0.6% |
| White / Caucasian | 41,141 | 55.4% |
| Two or more Races | 9,900 | 13.3% |
| Some other Race | 10,843 | 14.6% |
| Total | 74,212 | 100.0% |
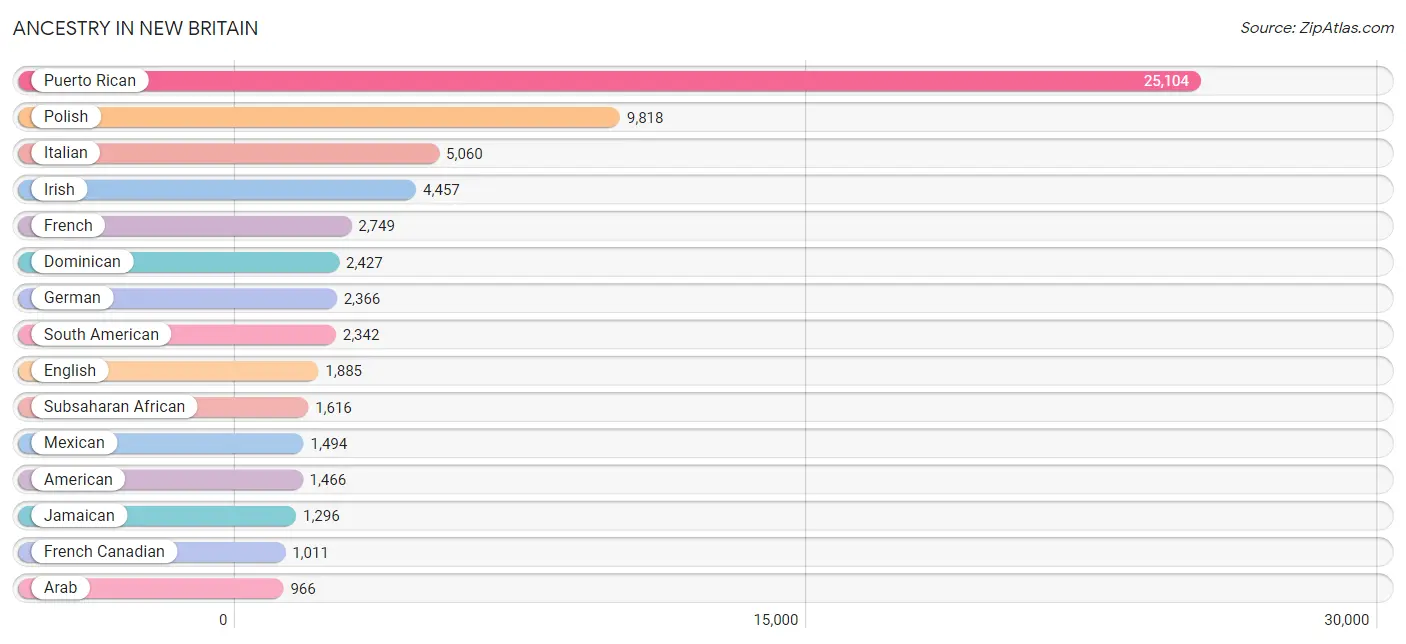
Ancestry in New Britain
The most populous ancestries reported in New Britain are Puerto Rican (25,104 | 33.8%), Polish (9,818 | 13.2%), Italian (5,060 | 6.8%), Irish (4,457 | 6.0%), and French (2,749 | 3.7%), together accounting for 63.6% of all New Britain residents.
| Ancestry | # Population | % Population |
| African | 545 | 0.7% |
| American | 1,466 | 2.0% |
| Arab | 966 | 1.3% |
| Argentinean | 125 | 0.2% |
| Armenian | 10 | 0.0% |
| Assyrian / Chaldean / Syriac | 142 | 0.2% |
| Austrian | 117 | 0.2% |
| Barbadian | 23 | 0.0% |
| Belgian | 7 | 0.0% |
| Bhutanese | 139 | 0.2% |
| Blackfeet | 77 | 0.1% |
| Brazilian | 33 | 0.0% |
| British | 98 | 0.1% |
| British West Indian | 82 | 0.1% |
| Burmese | 94 | 0.1% |
| Cajun | 18 | 0.0% |
| Canadian | 101 | 0.1% |
| Cape Verdean | 93 | 0.1% |
| Celtic | 13 | 0.0% |
| Central American | 560 | 0.7% |
| Central American Indian | 178 | 0.2% |
| Chilean | 13 | 0.0% |
| Colombian | 474 | 0.6% |
| Costa Rican | 35 | 0.1% |
| Croatian | 29 | 0.0% |
| Cuban | 34 | 0.1% |
| Czech | 65 | 0.1% |
| Danish | 27 | 0.0% |
| Dominican | 2,427 | 3.3% |
| Dutch | 67 | 0.1% |
| Eastern European | 252 | 0.3% |
| Ecuadorian | 785 | 1.1% |
| Egyptian | 40 | 0.1% |
| English | 1,885 | 2.5% |
| Estonian | 19 | 0.0% |
| European | 218 | 0.3% |
| Filipino | 18 | 0.0% |
| Finnish | 15 | 0.0% |
| French | 2,749 | 3.7% |
| French American Indian | 28 | 0.0% |
| French Canadian | 1,011 | 1.4% |
| German | 2,366 | 3.2% |
| Ghanaian | 21 | 0.0% |
| Greek | 269 | 0.4% |
| Guatemalan | 99 | 0.1% |
| Guyanese | 11 | 0.0% |
| Haitian | 281 | 0.4% |
| Honduran | 103 | 0.1% |
| Hungarian | 215 | 0.3% |
| Indian (Asian) | 442 | 0.6% |
| Iranian | 62 | 0.1% |
| Irish | 4,457 | 6.0% |
| Iroquois | 27 | 0.0% |
| Italian | 5,060 | 6.8% |
| Jamaican | 1,296 | 1.8% |
| Kenyan | 18 | 0.0% |
| Korean | 134 | 0.2% |
| Latvian | 9 | 0.0% |
| Lebanese | 47 | 0.1% |
| Lithuanian | 606 | 0.8% |
| Malaysian | 232 | 0.3% |
| Mexican | 1,494 | 2.0% |
| Mexican American Indian | 11 | 0.0% |
| Moroccan | 305 | 0.4% |
| Native Hawaiian | 34 | 0.1% |
| Navajo | 1 | 0.0% |
| Nicaraguan | 18 | 0.0% |
| Nigerian | 138 | 0.2% |
| Northern European | 43 | 0.1% |
| Norwegian | 24 | 0.0% |
| Panamanian | 40 | 0.1% |
| Paraguayan | 14 | 0.0% |
| Peruvian | 809 | 1.1% |
| Polish | 9,818 | 13.2% |
| Portuguese | 332 | 0.4% |
| Pueblo | 10 | 0.0% |
| Puerto Rican | 25,104 | 33.8% |
| Romanian | 105 | 0.1% |
| Russian | 244 | 0.3% |
| Salvadoran | 265 | 0.4% |
| Scandinavian | 109 | 0.2% |
| Scotch-Irish | 101 | 0.1% |
| Scottish | 460 | 0.6% |
| Slavic | 56 | 0.1% |
| Slovak | 160 | 0.2% |
| South American | 2,342 | 3.2% |
| South American Indian | 97 | 0.1% |
| Spaniard | 117 | 0.2% |
| Spanish | 77 | 0.1% |
| Sri Lankan | 322 | 0.4% |
| Subsaharan African | 1,616 | 2.2% |
| Sudanese | 213 | 0.3% |
| Swedish | 591 | 0.8% |
| Swiss | 7 | 0.0% |
| Syrian | 16 | 0.0% |
| Thai | 917 | 1.2% |
| Trinidadian and Tobagonian | 34 | 0.1% |
| Turkish | 21 | 0.0% |
| U.S. Virgin Islander | 5 | 0.0% |
| Ukrainian | 167 | 0.2% |
| Venezuelan | 122 | 0.2% |
| Vietnamese | 88 | 0.1% |
| Welsh | 76 | 0.1% |
| West Indian | 273 | 0.4% |
| Yugoslavian | 489 | 0.7% | View All 105 Rows |
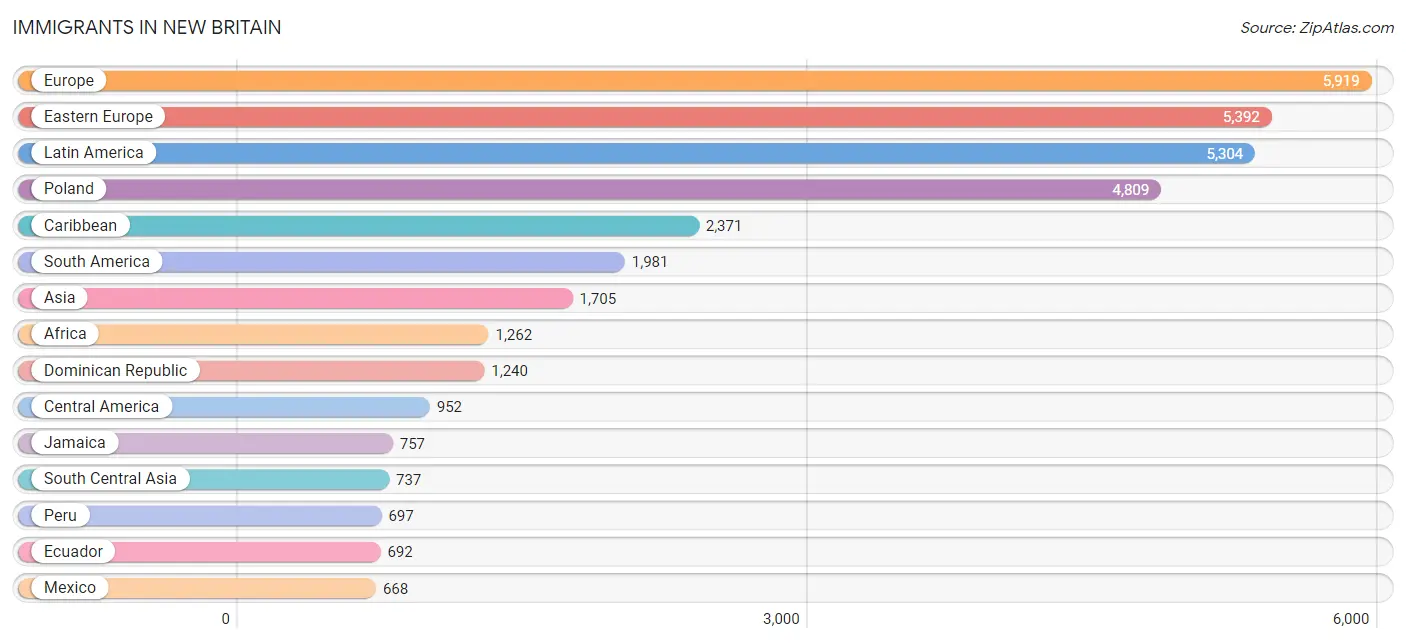
Immigrants in New Britain
The most numerous immigrant groups reported in New Britain came from Europe (5,919 | 8.0%), Eastern Europe (5,392 | 7.3%), Latin America (5,304 | 7.1%), Poland (4,809 | 6.5%), and Caribbean (2,371 | 3.2%), together accounting for 32.1% of all New Britain residents.
| Immigration Origin | # Population | % Population |
| Africa | 1,262 | 1.7% |
| Argentina | 30 | 0.0% |
| Asia | 1,705 | 2.3% |
| Austria | 7 | 0.0% |
| Bangladesh | 88 | 0.1% |
| Barbados | 7 | 0.0% |
| Belgium | 9 | 0.0% |
| Bosnia and Herzegovina | 326 | 0.4% |
| Brazil | 27 | 0.0% |
| Cameroon | 588 | 0.8% |
| Canada | 210 | 0.3% |
| Caribbean | 2,371 | 3.2% |
| Central America | 952 | 1.3% |
| Chile | 13 | 0.0% |
| China | 202 | 0.3% |
| Colombia | 417 | 0.6% |
| Cuba | 11 | 0.0% |
| Czechoslovakia | 8 | 0.0% |
| Dominican Republic | 1,240 | 1.7% |
| Eastern Africa | 18 | 0.0% |
| Eastern Asia | 285 | 0.4% |
| Eastern Europe | 5,392 | 7.3% |
| Ecuador | 692 | 0.9% |
| Egypt | 26 | 0.0% |
| El Salvador | 24 | 0.0% |
| England | 44 | 0.1% |
| Europe | 5,919 | 8.0% |
| France | 54 | 0.1% |
| Germany | 122 | 0.2% |
| Ghana | 21 | 0.0% |
| Greece | 17 | 0.0% |
| Grenada | 54 | 0.1% |
| Guatemala | 98 | 0.1% |
| Guyana | 11 | 0.0% |
| Haiti | 192 | 0.3% |
| Honduras | 162 | 0.2% |
| India | 504 | 0.7% |
| Iran | 53 | 0.1% |
| Iraq | 37 | 0.1% |
| Israel | 17 | 0.0% |
| Italy | 142 | 0.2% |
| Jamaica | 757 | 1.0% |
| Japan | 20 | 0.0% |
| Jordan | 5 | 0.0% |
| Kenya | 9 | 0.0% |
| Korea | 63 | 0.1% |
| Laos | 118 | 0.2% |
| Latin America | 5,304 | 7.1% |
| Latvia | 9 | 0.0% |
| Lebanon | 6 | 0.0% |
| Lithuania | 13 | 0.0% |
| Mexico | 668 | 0.9% |
| Middle Africa | 597 | 0.8% |
| Morocco | 162 | 0.2% |
| Nigeria | 142 | 0.2% |
| Northern Africa | 342 | 0.5% |
| Northern Europe | 44 | 0.1% |
| Pakistan | 30 | 0.0% |
| Peru | 697 | 0.9% |
| Philippines | 73 | 0.1% |
| Poland | 4,809 | 6.5% |
| Portugal | 107 | 0.1% |
| Romania | 94 | 0.1% |
| Russia | 26 | 0.0% |
| Saudi Arabia | 21 | 0.0% |
| South Africa | 8 | 0.0% |
| South America | 1,981 | 2.7% |
| South Central Asia | 737 | 1.0% |
| South Eastern Asia | 377 | 0.5% |
| Southern Europe | 291 | 0.4% |
| Spain | 25 | 0.0% |
| Sri Lanka | 62 | 0.1% |
| Sudan | 154 | 0.2% |
| Syria | 9 | 0.0% |
| Taiwan | 25 | 0.0% |
| Thailand | 27 | 0.0% |
| Trinidad and Tobago | 92 | 0.1% |
| Ukraine | 107 | 0.1% |
| Venezuela | 80 | 0.1% |
| Vietnam | 159 | 0.2% |
| Western Africa | 188 | 0.3% |
| Western Asia | 306 | 0.4% |
| Western Europe | 192 | 0.3% |
| Yemen | 211 | 0.3% | View All 84 Rows |
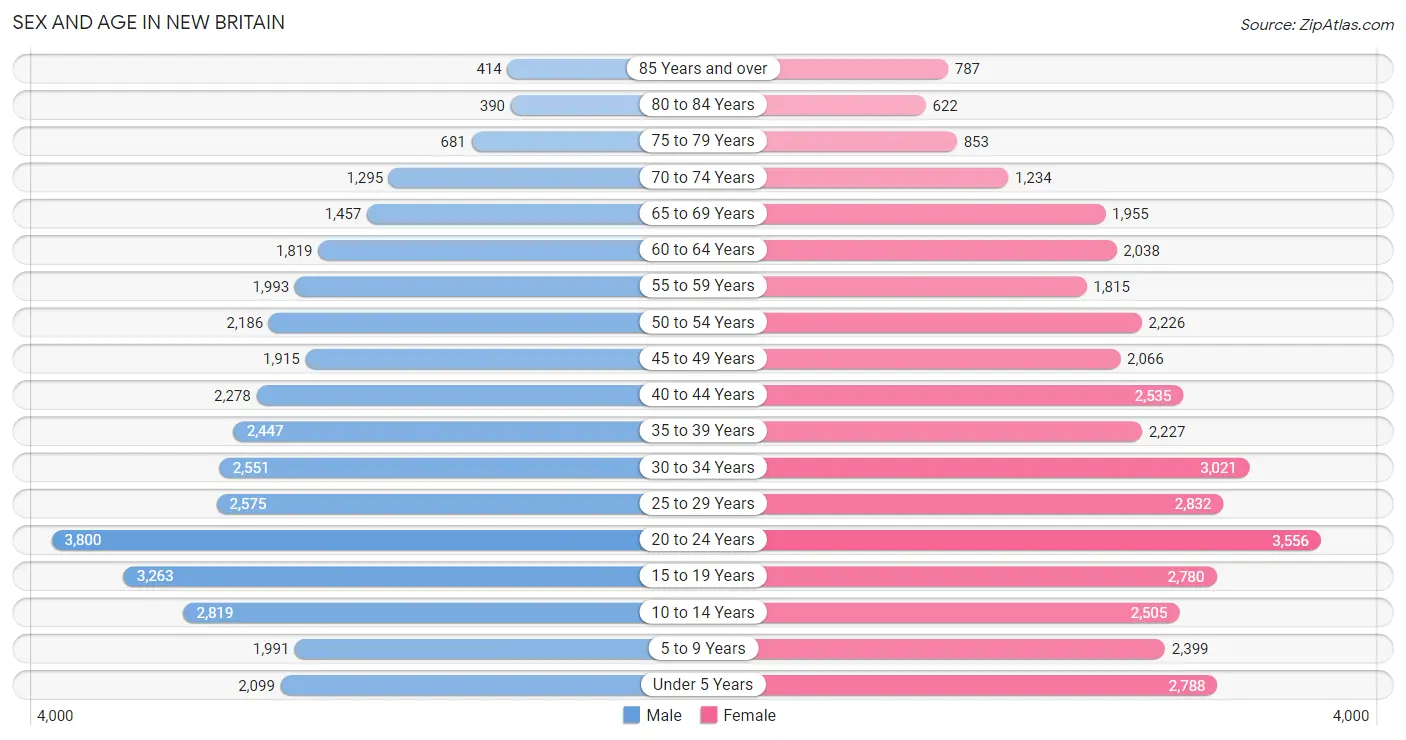
Sex and Age in New Britain
Sex and Age in New Britain
The most populous age groups in New Britain are 20 to 24 Years (3,800 | 10.6%) for men and 20 to 24 Years (3,556 | 9.3%) for women.
| Age Bracket | Male | Female |
| Under 5 Years | 2,099 (5.8%) | 2,788 (7.3%) |
| 5 to 9 Years | 1,991 (5.5%) | 2,399 (6.3%) |
| 10 to 14 Years | 2,819 (7.8%) | 2,505 (6.6%) |
| 15 to 19 Years | 3,263 (9.1%) | 2,780 (7.3%) |
| 20 to 24 Years | 3,800 (10.6%) | 3,556 (9.3%) |
| 25 to 29 Years | 2,575 (7.2%) | 2,832 (7.4%) |
| 30 to 34 Years | 2,551 (7.1%) | 3,021 (7.9%) |
| 35 to 39 Years | 2,447 (6.8%) | 2,227 (5.8%) |
| 40 to 44 Years | 2,278 (6.3%) | 2,535 (6.6%) |
| 45 to 49 Years | 1,915 (5.3%) | 2,066 (5.4%) |
| 50 to 54 Years | 2,186 (6.1%) | 2,226 (5.8%) |
| 55 to 59 Years | 1,993 (5.5%) | 1,815 (4.8%) |
| 60 to 64 Years | 1,819 (5.1%) | 2,038 (5.3%) |
| 65 to 69 Years | 1,457 (4.1%) | 1,955 (5.1%) |
| 70 to 74 Years | 1,295 (3.6%) | 1,234 (3.2%) |
| 75 to 79 Years | 681 (1.9%) | 853 (2.2%) |
| 80 to 84 Years | 390 (1.1%) | 622 (1.6%) |
| 85 Years and over | 414 (1.1%) | 787 (2.1%) |
| Total | 35,973 (100.0%) | 38,239 (100.0%) |
Families and Households in New Britain
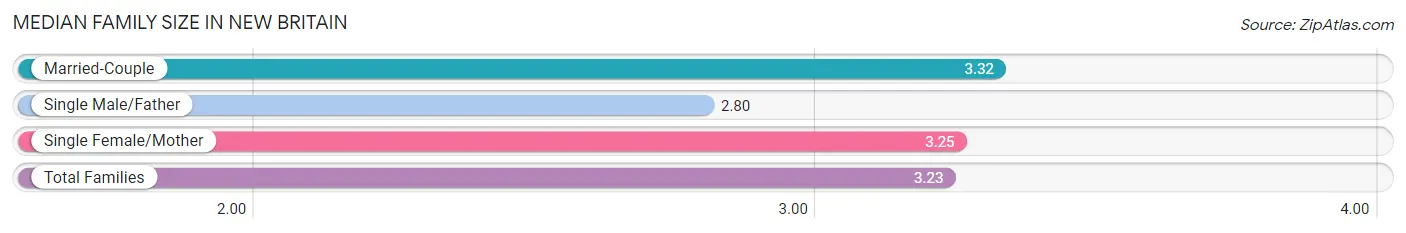
Median Family Size in New Britain
The median family size in New Britain is 3.23 persons per family, with married-couple families (8,380 | 50.0%) accounting for the largest median family size of 3.32 persons per family. On the other hand, single male/father families (2,004 | 12.0%) represent the smallest median family size with 2.80 persons per family.
| Family Type | # Families | Family Size |
| Married-Couple | 8,380 (50.0%) | 3.32 |
| Single Male/Father | 2,004 (12.0%) | 2.80 |
| Single Female/Mother | 6,358 (38.0%) | 3.25 |
| Total Families | 16,742 (100.0%) | 3.23 |
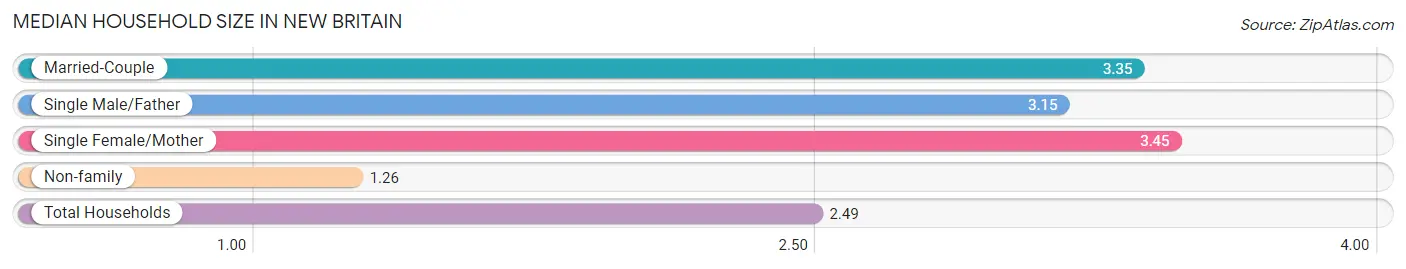
Median Household Size in New Britain
The median household size in New Britain is 2.49 persons per household, with single female/mother households (6,358 | 22.3%) accounting for the largest median household size of 3.45 persons per household. non-family households (11,833 | 41.4%) represent the smallest median household size with 1.26 persons per household.
| Household Type | # Households | Household Size |
| Married-Couple | 8,380 (29.3%) | 3.35 |
| Single Male/Father | 2,004 (7.0%) | 3.15 |
| Single Female/Mother | 6,358 (22.3%) | 3.45 |
| Non-family | 11,833 (41.4%) | 1.26 |
| Total Households | 28,575 (100.0%) | 2.49 |
Household Size by Marriage Status in New Britain
Out of a total of 28,575 households in New Britain, 16,742 (58.6%) are family households, while 11,833 (41.4%) are nonfamily households. The most numerous type of family households are 2-person households, comprising 6,501, and the most common type of nonfamily households are 1-person households, comprising 9,466.
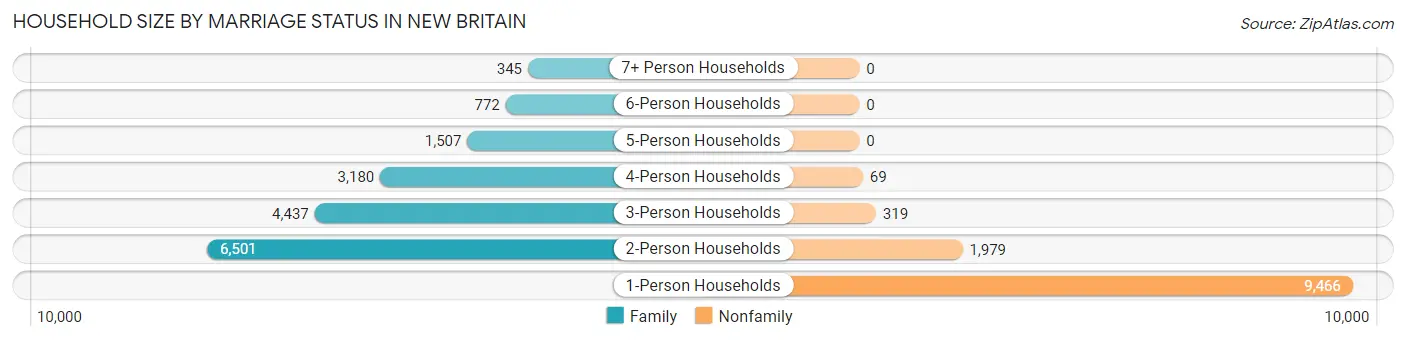
| Household Size | Family Households | Nonfamily Households |
| 1-Person Households | - | 9,466 (33.1%) |
| 2-Person Households | 6,501 (22.8%) | 1,979 (6.9%) |
| 3-Person Households | 4,437 (15.5%) | 319 (1.1%) |
| 4-Person Households | 3,180 (11.1%) | 69 (0.2%) |
| 5-Person Households | 1,507 (5.3%) | 0 (0.0%) |
| 6-Person Households | 772 (2.7%) | 0 (0.0%) |
| 7+ Person Households | 345 (1.2%) | 0 (0.0%) |
| Total | 16,742 (58.6%) | 11,833 (41.4%) |
Female Fertility in New Britain
Fertility by Age in New Britain
Average fertility rate in New Britain is 60.0 births per 1,000 women. Women in the age bracket of 20 to 34 years have the highest fertility rate with 91.0 births per 1,000 women. Women in the age bracket of 20 to 34 years acount for 72.9% of all women with births.
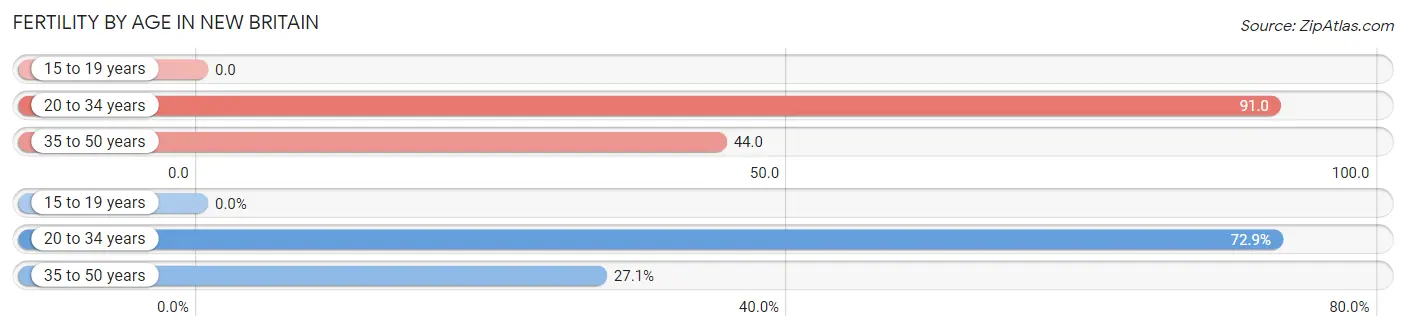
| Age Bracket | Women with Births | Births / 1,000 Women |
| 15 to 19 years | 0 (0.0%) | 0.0 |
| 20 to 34 years | 854 (72.9%) | 91.0 |
| 35 to 50 years | 317 (27.1%) | 44.0 |
| Total | 1,171 (100.0%) | 60.0 |
Fertility by Age by Marriage Status in New Britain
39.9% of women with births (1,171) in New Britain are married. The highest percentage of unmarried women with births falls into 20 to 34 years age bracket with 71.3% of them unmarried at the time of birth, while the lowest percentage of unmarried women with births belong to 35 to 50 years age bracket with 30.0% of them unmarried.
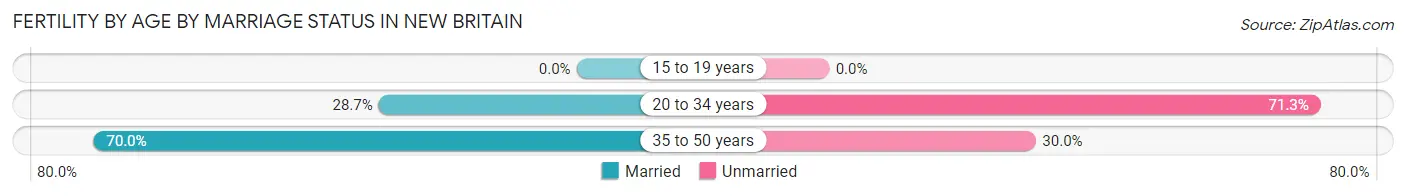
| Age Bracket | Married | Unmarried |
| 15 to 19 years | 0 (0.0%) | 0 (0.0%) |
| 20 to 34 years | 245 (28.7%) | 609 (71.3%) |
| 35 to 50 years | 222 (70.0%) | 95 (30.0%) |
| Total | 467 (39.9%) | 704 (60.1%) |
Fertility by Education in New Britain
Average fertility rate in New Britain is 60.0 births per 1,000 women. Women with the education attainment of college or associate's degree have the highest fertility rate of 83.0 births per 1,000 women, while women with the education attainment of less than high school have the lowest fertility at 32.0 births per 1,000 women. Women with the education attainment of college or associate's degree represent 48.0% of all women with births.
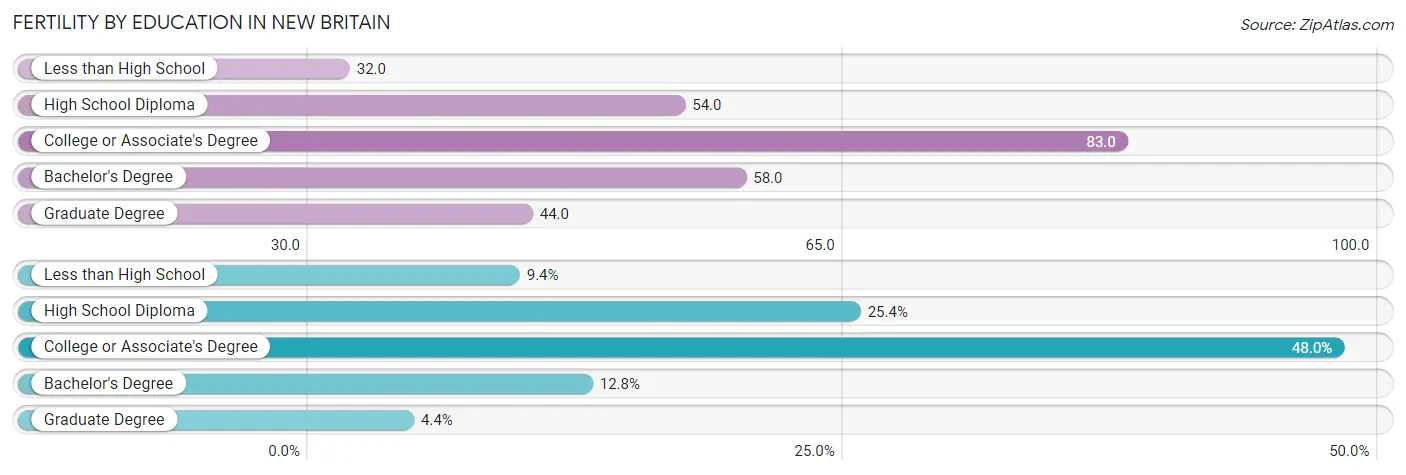
| Educational Attainment | Women with Births | Births / 1,000 Women |
| Less than High School | 110 (9.4%) | 32.0 |
| High School Diploma | 297 (25.4%) | 54.0 |
| College or Associate's Degree | 562 (48.0%) | 83.0 |
| Bachelor's Degree | 150 (12.8%) | 58.0 |
| Graduate Degree | 52 (4.4%) | 44.0 |
| Total | 1,171 (100.0%) | 60.0 |
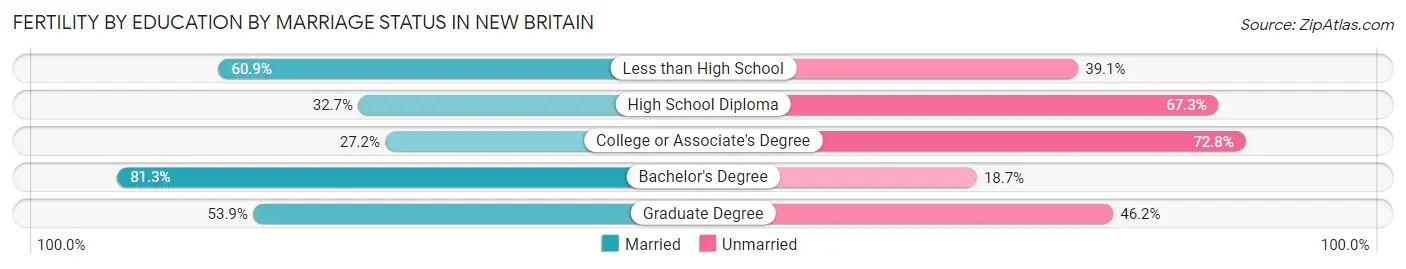
Fertility by Education by Marriage Status in New Britain
60.1% of women with births in New Britain are unmarried. Women with the educational attainment of bachelor's degree are most likely to be married with 81.3% of them married at childbirth, while women with the educational attainment of college or associate's degree are least likely to be married with 72.8% of them unmarried at childbirth.
| Educational Attainment | Married | Unmarried |
| Less than High School | 67 (60.9%) | 43 (39.1%) |
| High School Diploma | 97 (32.7%) | 200 (67.3%) |
| College or Associate's Degree | 153 (27.2%) | 409 (72.8%) |
| Bachelor's Degree | 122 (81.3%) | 28 (18.7%) |
| Graduate Degree | 28 (53.8%) | 24 (46.2%) |
| Total | 467 (39.9%) | 704 (60.1%) |
Employment Characteristics in New Britain
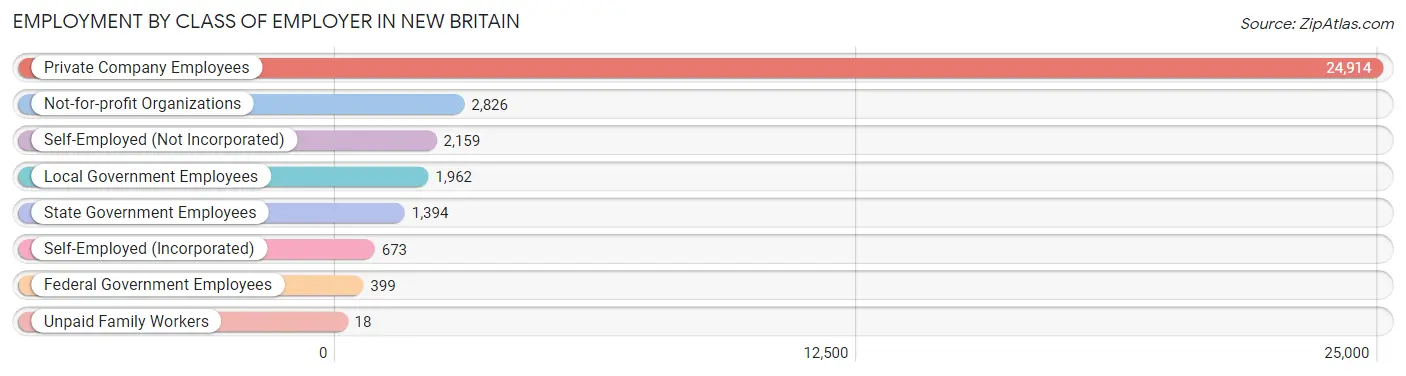
Employment by Class of Employer in New Britain
Among the 34,345 employed individuals in New Britain, private company employees (24,914 | 72.5%), not-for-profit organizations (2,826 | 8.2%), and self-employed (not incorporated) (2,159 | 6.3%) make up the most common classes of employment.
| Employer Class | # Employees | % Employees |
| Private Company Employees | 24,914 | 72.5% |
| Self-Employed (Incorporated) | 673 | 2.0% |
| Self-Employed (Not Incorporated) | 2,159 | 6.3% |
| Not-for-profit Organizations | 2,826 | 8.2% |
| Local Government Employees | 1,962 | 5.7% |
| State Government Employees | 1,394 | 4.1% |
| Federal Government Employees | 399 | 1.2% |
| Unpaid Family Workers | 18 | 0.1% |
| Total | 34,345 | 100.0% |
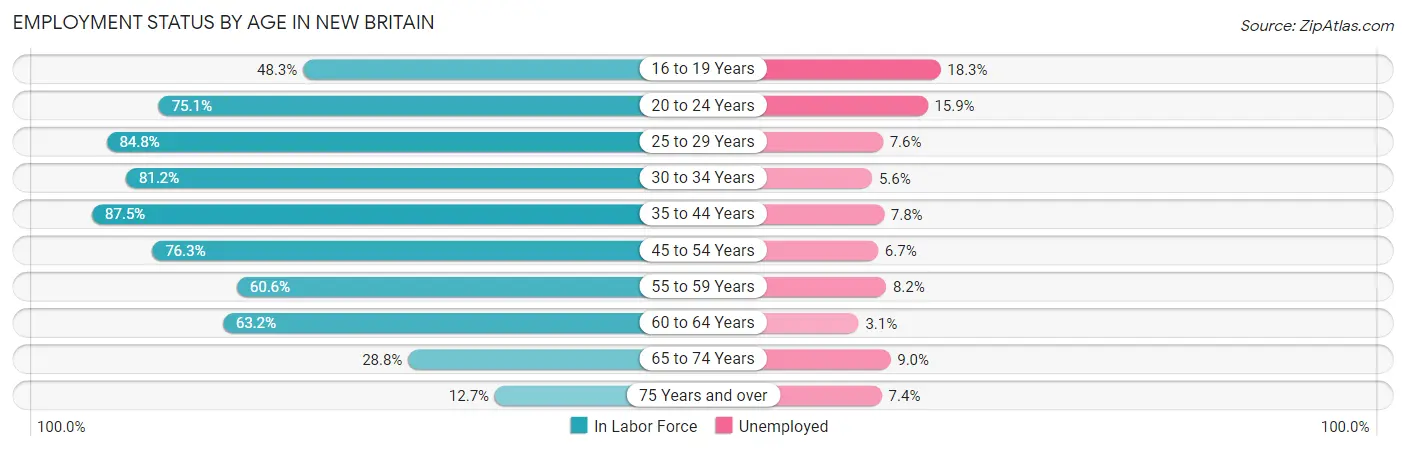
Employment Status by Age in New Britain
According to the labor force statistics for New Britain, out of the total population over 16 years of age (58,681), 66.0% or 38,729 individuals are in the labor force, with 8.9% or 3,447 of them unemployed. The age group with the highest labor force participation rate is 35 to 44 years, with 87.5% or 8,301 individuals in the labor force. Within the labor force, the 16 to 19 years age range has the highest percentage of unemployed individuals, with 18.3% or 452 of them being unemployed.
| Age Bracket | In Labor Force | Unemployed |
| 16 to 19 Years | 2,470 (48.3%) | 452 (18.3%) |
| 20 to 24 Years | 5,524 (75.1%) | 878 (15.9%) |
| 25 to 29 Years | 4,585 (84.8%) | 348 (7.6%) |
| 30 to 34 Years | 4,524 (81.2%) | 253 (5.6%) |
| 35 to 44 Years | 8,301 (87.5%) | 647 (7.8%) |
| 45 to 54 Years | 6,404 (76.3%) | 429 (6.7%) |
| 55 to 59 Years | 2,308 (60.6%) | 189 (8.2%) |
| 60 to 64 Years | 2,438 (63.2%) | 76 (3.1%) |
| 65 to 74 Years | 1,711 (28.8%) | 154 (9.0%) |
| 75 Years and over | 476 (12.7%) | 35 (7.4%) |
| Total | 38,729 (66.0%) | 3,447 (8.9%) |
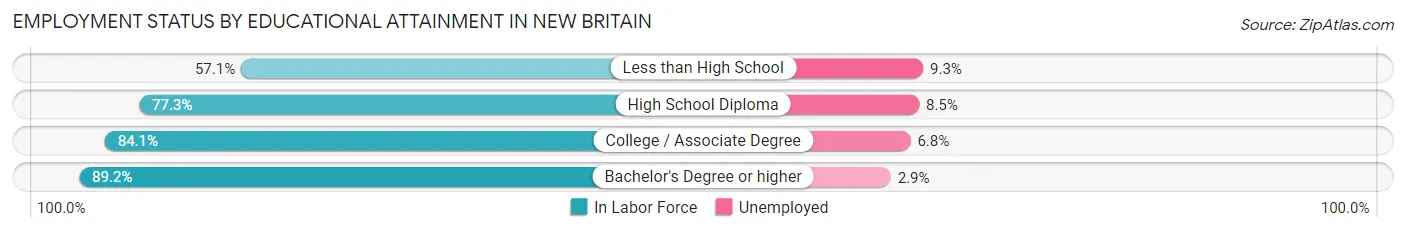
Employment Status by Educational Attainment in New Britain
According to labor force statistics for New Britain, 78.2% of individuals (28,562) out of the total population between 25 and 64 years of age (36,524) are in the labor force, with 6.8% or 1,942 of them being unemployed. The group with the highest labor force participation rate are those with the educational attainment of bachelor's degree or higher, with 89.2% or 6,571 individuals in the labor force. Within the labor force, individuals with less than high school education have the highest percentage of unemployment, with 9.3% or 332 of them being unemployed.
| Educational Attainment | In Labor Force | Unemployed |
| Less than High School | 3,566 (57.1%) | 581 (9.3%) |
| High School Diploma | 9,743 (77.3%) | 1,071 (8.5%) |
| College / Associate Degree | 8,669 (84.1%) | 701 (6.8%) |
| Bachelor's Degree or higher | 6,571 (89.2%) | 214 (2.9%) |
| Total | 28,562 (78.2%) | 2,484 (6.8%) |
Employment Occupations by Sex in New Britain
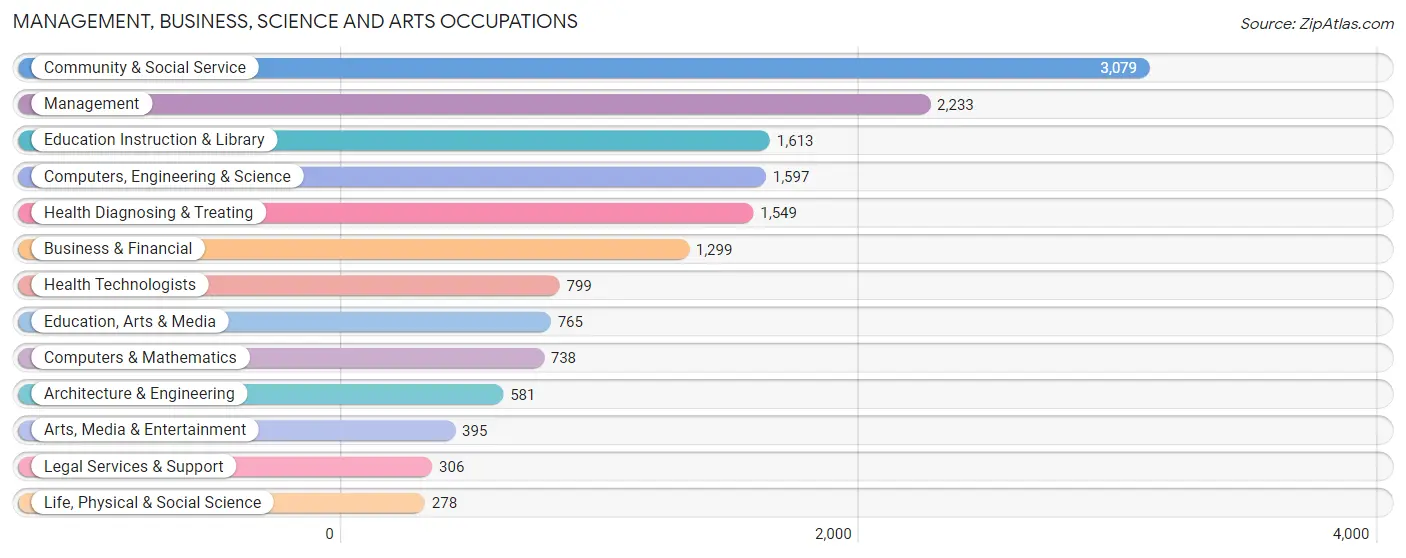
Management, Business, Science and Arts Occupations
The most common Management, Business, Science and Arts occupations in New Britain are Community & Social Service (3,079 | 8.7%), Management (2,233 | 6.3%), Education Instruction & Library (1,613 | 4.6%), Computers, Engineering & Science (1,597 | 4.5%), and Health Diagnosing & Treating (1,549 | 4.4%).
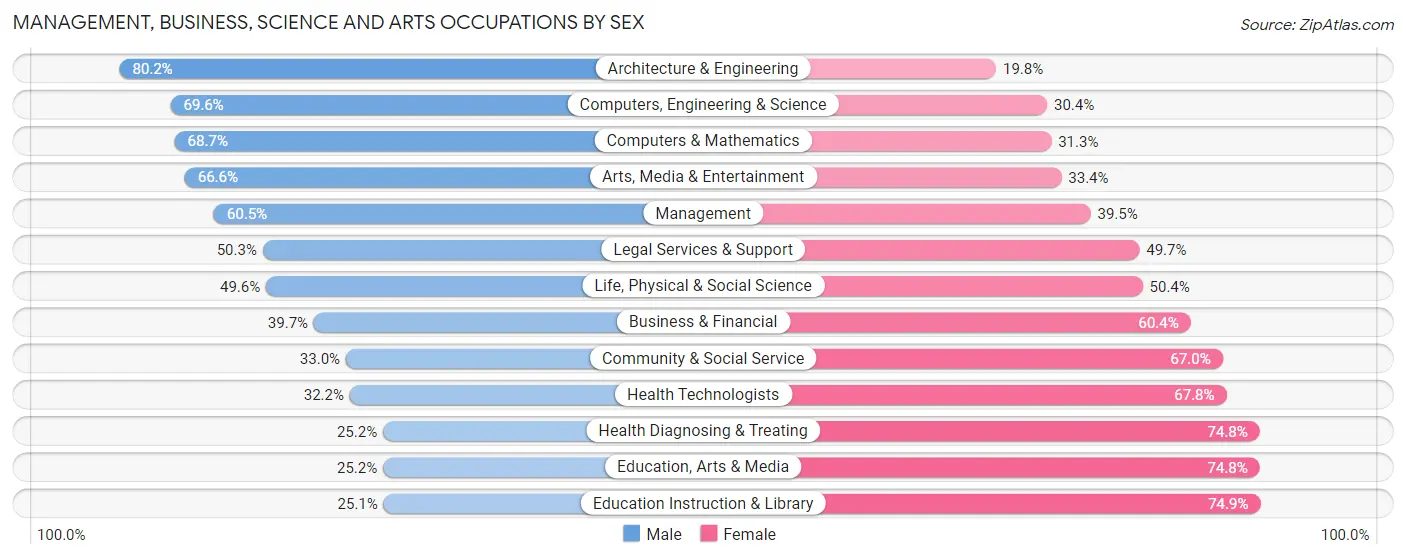
Management, Business, Science and Arts Occupations by Sex
Within the Management, Business, Science and Arts occupations in New Britain, the most male-oriented occupations are Architecture & Engineering (80.2%), Computers, Engineering & Science (69.6%), and Computers & Mathematics (68.7%), while the most female-oriented occupations are Education Instruction & Library (74.9%), Education, Arts & Media (74.8%), and Health Diagnosing & Treating (74.8%).
| Occupation | Male | Female |
| Management | 1,351 (60.5%) | 882 (39.5%) |
| Business & Financial | 515 (39.7%) | 784 (60.4%) |
| Computers, Engineering & Science | 1,111 (69.6%) | 486 (30.4%) |
| Computers & Mathematics | 507 (68.7%) | 231 (31.3%) |
| Architecture & Engineering | 466 (80.2%) | 115 (19.8%) |
| Life, Physical & Social Science | 138 (49.6%) | 140 (50.4%) |
| Community & Social Service | 1,015 (33.0%) | 2,064 (67.0%) |
| Education, Arts & Media | 193 (25.2%) | 572 (74.8%) |
| Legal Services & Support | 154 (50.3%) | 152 (49.7%) |
| Education Instruction & Library | 405 (25.1%) | 1,208 (74.9%) |
| Arts, Media & Entertainment | 263 (66.6%) | 132 (33.4%) |
| Health Diagnosing & Treating | 391 (25.2%) | 1,158 (74.8%) |
| Health Technologists | 257 (32.2%) | 542 (67.8%) |
| Total (Category) | 4,383 (44.9%) | 5,374 (55.1%) |
| Total (Overall) | 18,323 (51.9%) | 16,952 (48.1%) |
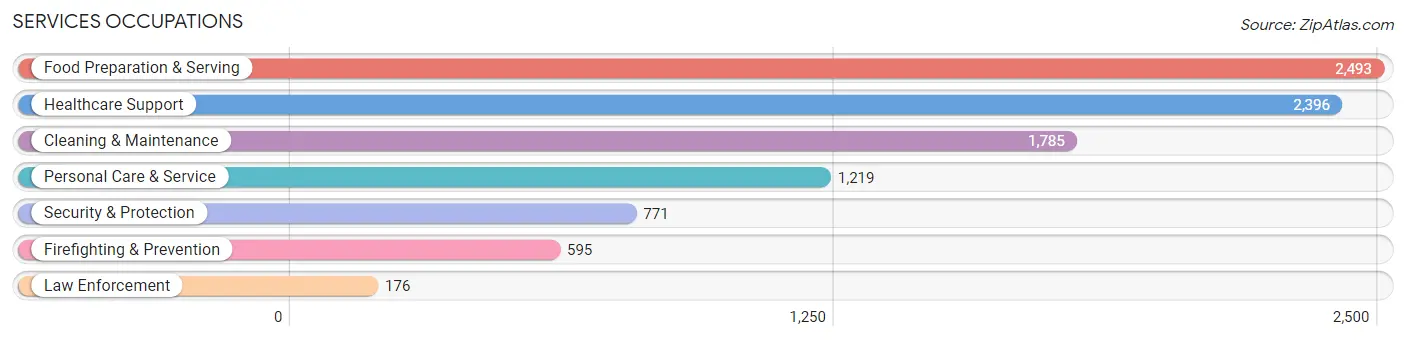
Services Occupations
The most common Services occupations in New Britain are Food Preparation & Serving (2,493 | 7.1%), Healthcare Support (2,396 | 6.8%), Cleaning & Maintenance (1,785 | 5.1%), Personal Care & Service (1,219 | 3.5%), and Security & Protection (771 | 2.2%).
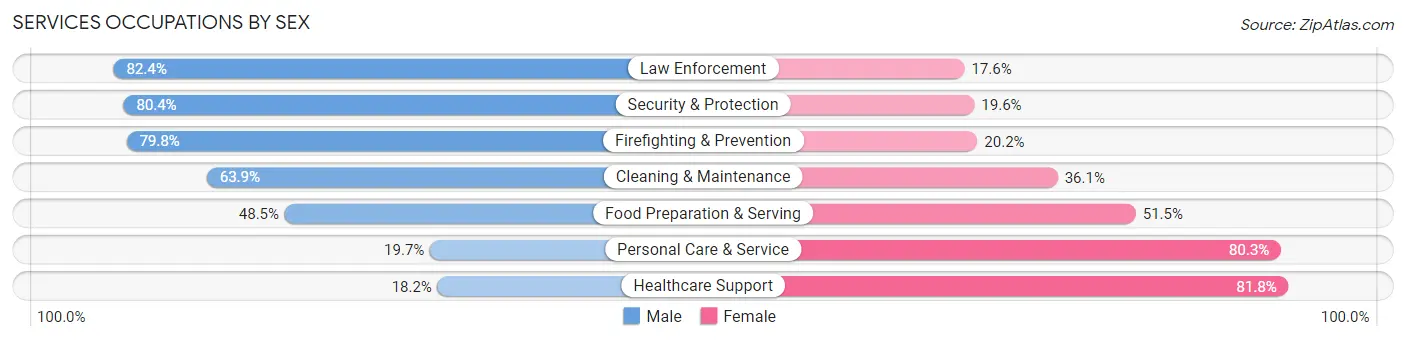
Services Occupations by Sex
Within the Services occupations in New Britain, the most male-oriented occupations are Law Enforcement (82.4%), Security & Protection (80.4%), and Firefighting & Prevention (79.8%), while the most female-oriented occupations are Healthcare Support (81.8%), Personal Care & Service (80.3%), and Food Preparation & Serving (51.5%).
| Occupation | Male | Female |
| Healthcare Support | 436 (18.2%) | 1,960 (81.8%) |
| Security & Protection | 620 (80.4%) | 151 (19.6%) |
| Firefighting & Prevention | 475 (79.8%) | 120 (20.2%) |
| Law Enforcement | 145 (82.4%) | 31 (17.6%) |
| Food Preparation & Serving | 1,208 (48.5%) | 1,285 (51.5%) |
| Cleaning & Maintenance | 1,141 (63.9%) | 644 (36.1%) |
| Personal Care & Service | 240 (19.7%) | 979 (80.3%) |
| Total (Category) | 3,645 (42.1%) | 5,019 (57.9%) |
| Total (Overall) | 18,323 (51.9%) | 16,952 (48.1%) |
Sales and Office Occupations
The most common Sales and Office occupations in New Britain are Office & Administration (4,196 | 11.9%), and Sales & Related (3,194 | 9.0%).

Sales and Office Occupations by Sex
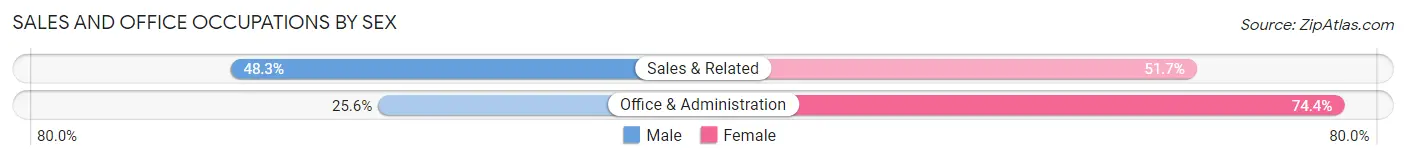
| Occupation | Male | Female |
| Sales & Related | 1,543 (48.3%) | 1,651 (51.7%) |
| Office & Administration | 1,075 (25.6%) | 3,121 (74.4%) |
| Total (Category) | 2,618 (35.4%) | 4,772 (64.6%) |
| Total (Overall) | 18,323 (51.9%) | 16,952 (48.1%) |
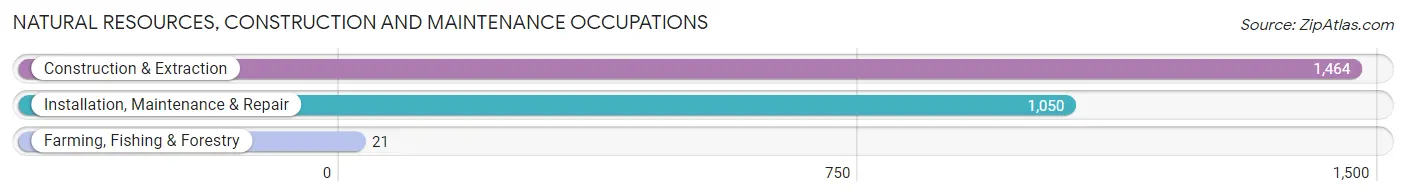
Natural Resources, Construction and Maintenance Occupations
The most common Natural Resources, Construction and Maintenance occupations in New Britain are Construction & Extraction (1,464 | 4.2%), Installation, Maintenance & Repair (1,050 | 3.0%), and Farming, Fishing & Forestry (21 | 0.1%).
Natural Resources, Construction and Maintenance Occupations by Sex
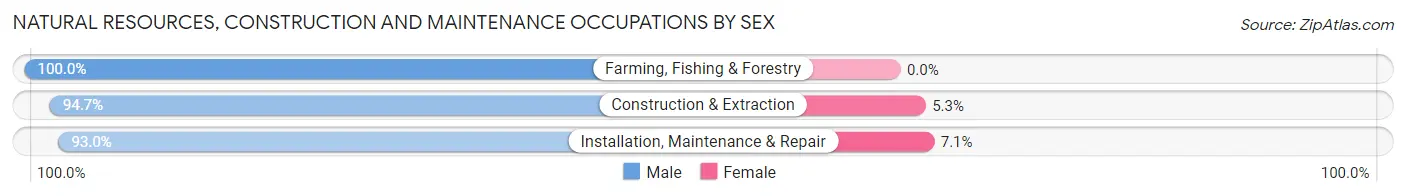
| Occupation | Male | Female |
| Farming, Fishing & Forestry | 21 (100.0%) | 0 (0.0%) |
| Construction & Extraction | 1,387 (94.7%) | 77 (5.3%) |
| Installation, Maintenance & Repair | 976 (92.9%) | 74 (7.0%) |
| Total (Category) | 2,384 (94.0%) | 151 (6.0%) |
| Total (Overall) | 18,323 (51.9%) | 16,952 (48.1%) |
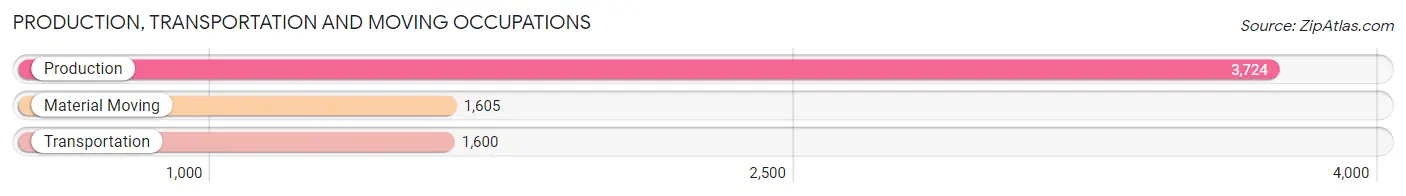
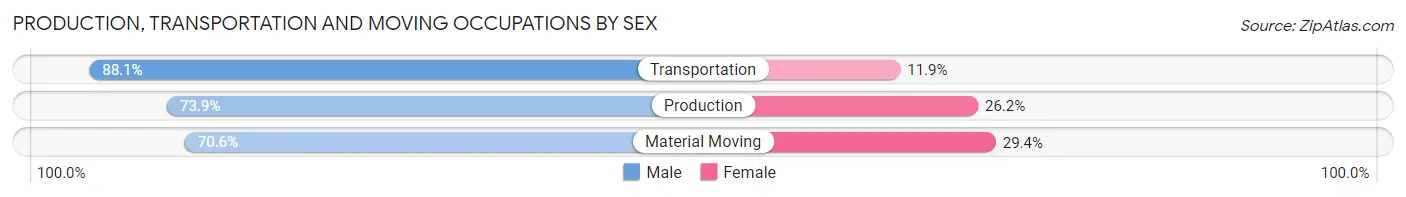
Production, Transportation and Moving Occupations
The most common Production, Transportation and Moving occupations in New Britain are Production (3,724 | 10.6%), Material Moving (1,605 | 4.5%), and Transportation (1,600 | 4.5%).
Production, Transportation and Moving Occupations by Sex
| Occupation | Male | Female |
| Production | 2,750 (73.9%) | 974 (26.2%) |
| Transportation | 1,410 (88.1%) | 190 (11.9%) |
| Material Moving | 1,133 (70.6%) | 472 (29.4%) |
| Total (Category) | 5,293 (76.4%) | 1,636 (23.6%) |
| Total (Overall) | 18,323 (51.9%) | 16,952 (48.1%) |
Employment Industries by Sex in New Britain
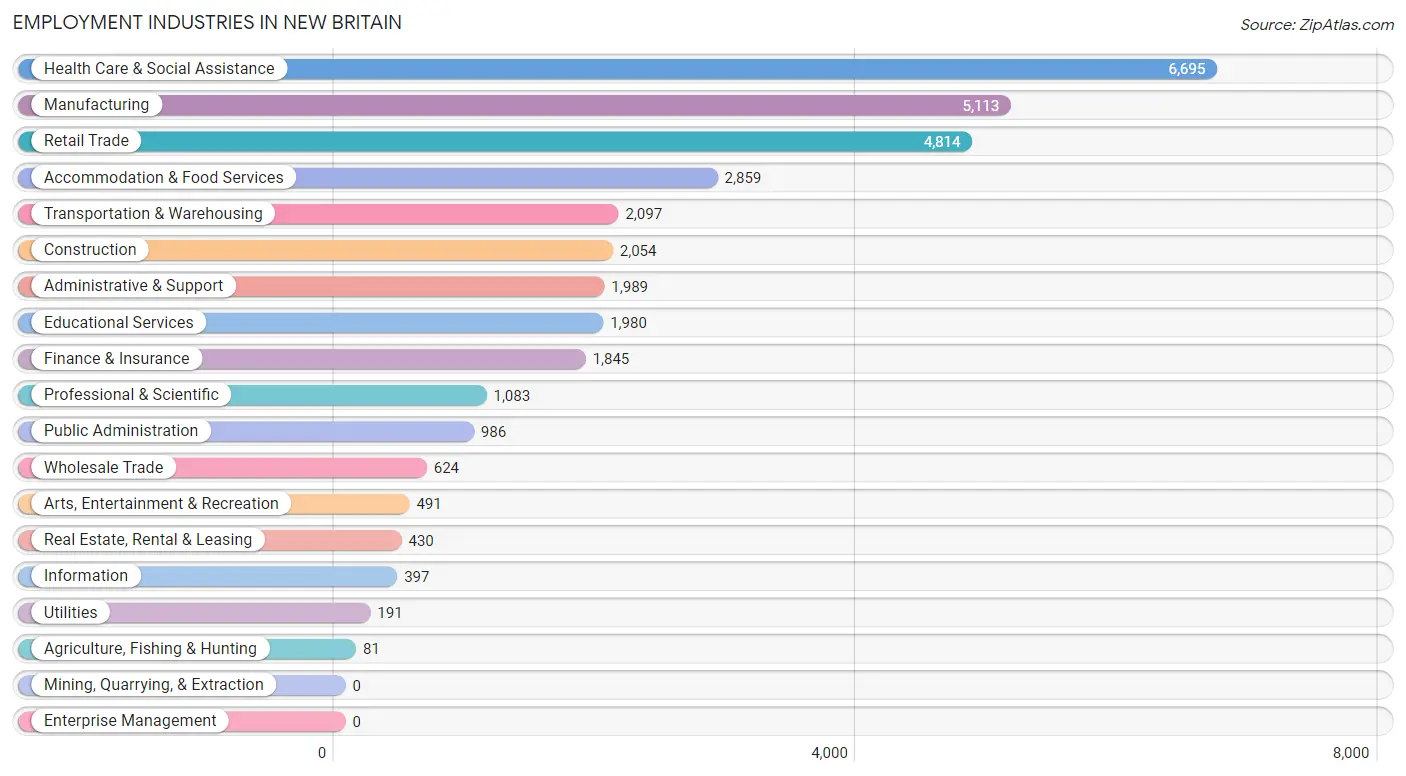
Employment Industries in New Britain
The major employment industries in New Britain include Health Care & Social Assistance (6,695 | 19.0%), Manufacturing (5,113 | 14.5%), Retail Trade (4,814 | 13.7%), Accommodation & Food Services (2,859 | 8.1%), and Transportation & Warehousing (2,097 | 5.9%).
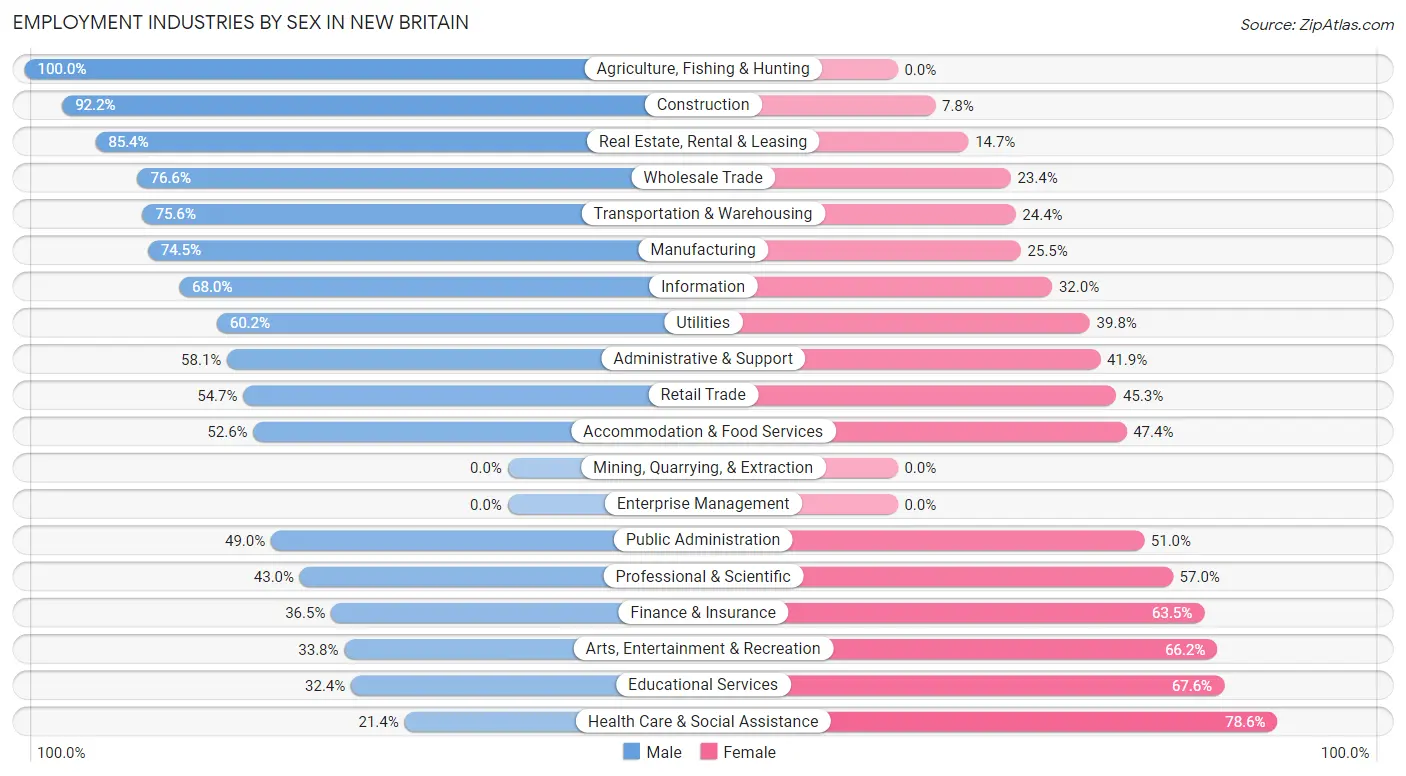
Employment Industries by Sex in New Britain
The New Britain industries that see more men than women are Agriculture, Fishing & Hunting (100.0%), Construction (92.2%), and Real Estate, Rental & Leasing (85.4%), whereas the industries that tend to have a higher number of women are Health Care & Social Assistance (78.6%), Educational Services (67.6%), and Arts, Entertainment & Recreation (66.2%).
| Industry | Male | Female |
| Agriculture, Fishing & Hunting | 81 (100.0%) | 0 (0.0%) |
| Mining, Quarrying, & Extraction | 0 (0.0%) | 0 (0.0%) |
| Construction | 1,894 (92.2%) | 160 (7.8%) |
| Manufacturing | 3,809 (74.5%) | 1,304 (25.5%) |
| Wholesale Trade | 478 (76.6%) | 146 (23.4%) |
| Retail Trade | 2,635 (54.7%) | 2,179 (45.3%) |
| Transportation & Warehousing | 1,585 (75.6%) | 512 (24.4%) |
| Utilities | 115 (60.2%) | 76 (39.8%) |
| Information | 270 (68.0%) | 127 (32.0%) |
| Finance & Insurance | 674 (36.5%) | 1,171 (63.5%) |
| Real Estate, Rental & Leasing | 367 (85.4%) | 63 (14.6%) |
| Professional & Scientific | 466 (43.0%) | 617 (57.0%) |
| Enterprise Management | 0 (0.0%) | 0 (0.0%) |
| Administrative & Support | 1,155 (58.1%) | 834 (41.9%) |
| Educational Services | 642 (32.4%) | 1,338 (67.6%) |
| Health Care & Social Assistance | 1,430 (21.4%) | 5,265 (78.6%) |
| Arts, Entertainment & Recreation | 166 (33.8%) | 325 (66.2%) |
| Accommodation & Food Services | 1,505 (52.6%) | 1,354 (47.4%) |
| Public Administration | 483 (49.0%) | 503 (51.0%) |
| Total | 18,323 (51.9%) | 16,952 (48.1%) |
Education in New Britain
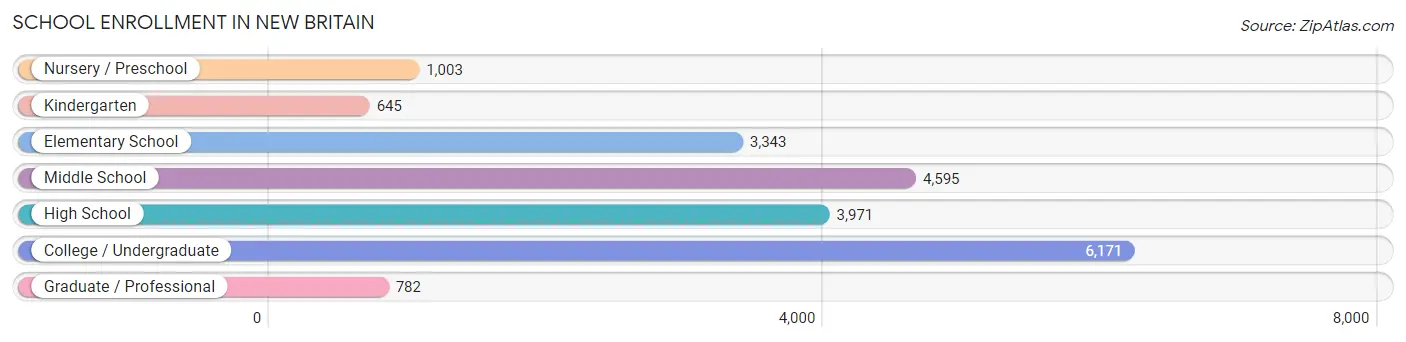
School Enrollment in New Britain
The most common levels of schooling among the 20,510 students in New Britain are college / undergraduate (6,171 | 30.1%), middle school (4,595 | 22.4%), and high school (3,971 | 19.4%).
| School Level | # Students | % Students |
| Nursery / Preschool | 1,003 | 4.9% |
| Kindergarten | 645 | 3.1% |
| Elementary School | 3,343 | 16.3% |
| Middle School | 4,595 | 22.4% |
| High School | 3,971 | 19.4% |
| College / Undergraduate | 6,171 | 30.1% |
| Graduate / Professional | 782 | 3.8% |
| Total | 20,510 | 100.0% |
School Enrollment by Age by Funding Source in New Britain
Out of a total of 20,510 students who are enrolled in schools in New Britain, 2,769 (13.5%) attend a private institution, while the remaining 17,741 (86.5%) are enrolled in public schools. The age group of 35 years and over has the highest likelihood of being enrolled in private schools, with 356 (37.8% in the age bracket) enrolled. Conversely, the age group of 5 to 9 year old has the lowest likelihood of being enrolled in a private school, with 3,772 (94.7% in the age bracket) attending a public institution.
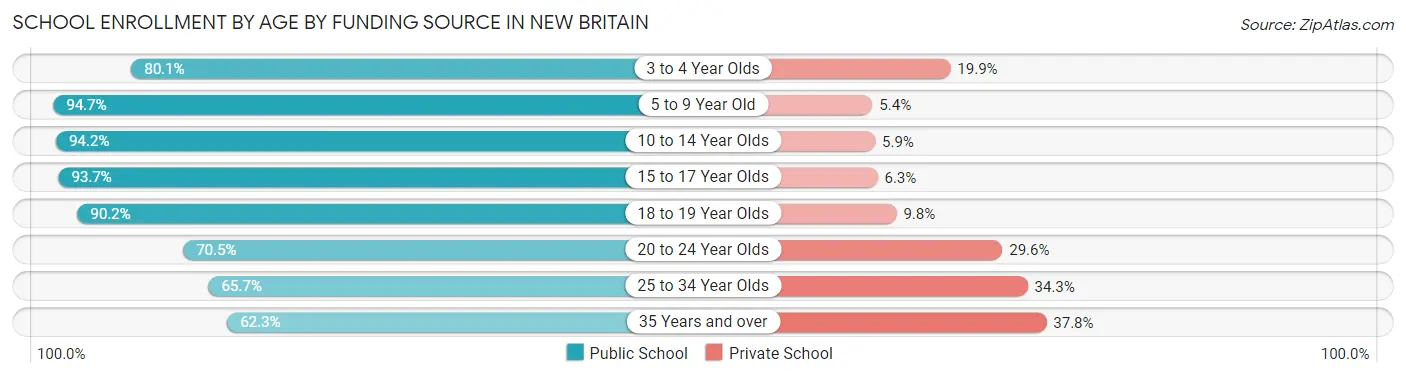
| Age Bracket | Public School | Private School |
| 3 to 4 Year Olds | 770 (80.1%) | 191 (19.9%) |
| 5 to 9 Year Old | 3,772 (94.7%) | 213 (5.3%) |
| 10 to 14 Year Olds | 4,921 (94.2%) | 306 (5.9%) |
| 15 to 17 Year Olds | 2,525 (93.7%) | 170 (6.3%) |
| 18 to 19 Year Olds | 2,311 (90.2%) | 252 (9.8%) |
| 20 to 24 Year Olds | 2,048 (70.5%) | 859 (29.5%) |
| 25 to 34 Year Olds | 808 (65.7%) | 421 (34.3%) |
| 35 Years and over | 587 (62.3%) | 356 (37.8%) |
| Total | 17,741 (86.5%) | 2,769 (13.5%) |
Educational Attainment by Field of Study in New Britain
Business (1,706 | 17.6%), education (895 | 9.2%), science & technology (856 | 8.8%), social sciences (800 | 8.3%), and engineering (700 | 7.2%) are the most common fields of study among 9,701 individuals in New Britain who have obtained a bachelor's degree or higher.
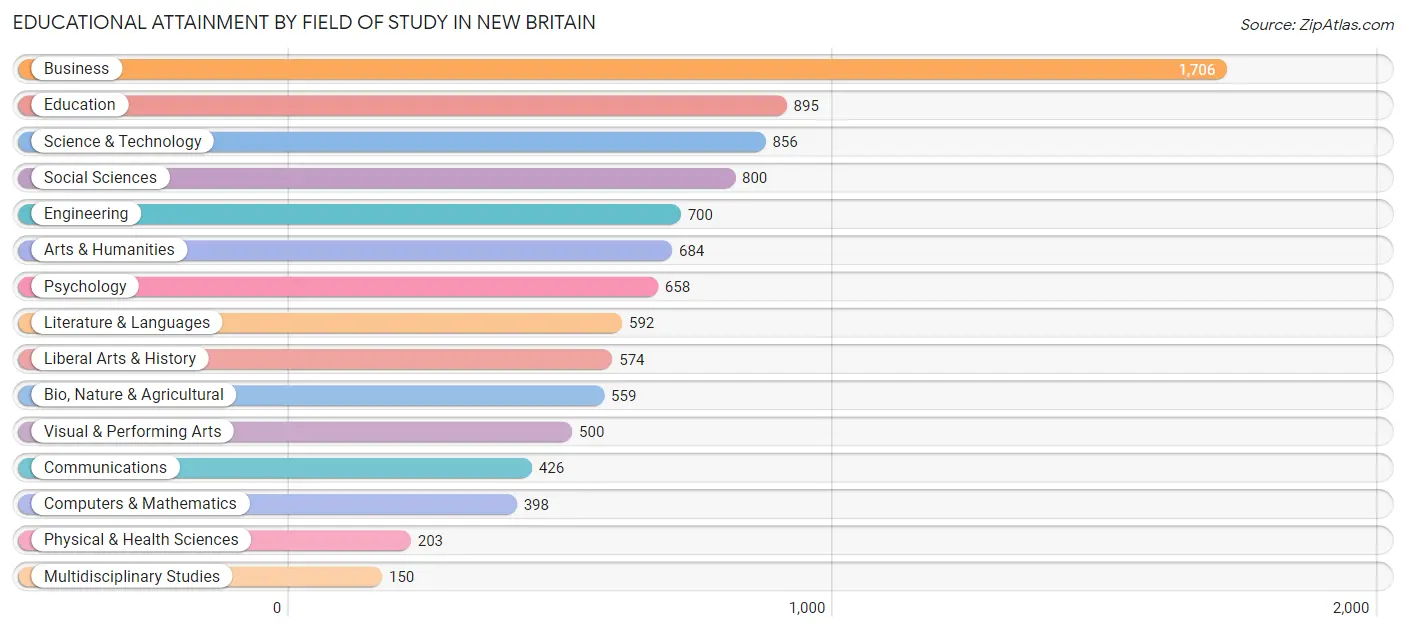
| Field of Study | # Graduates | % Graduates |
| Computers & Mathematics | 398 | 4.1% |
| Bio, Nature & Agricultural | 559 | 5.8% |
| Physical & Health Sciences | 203 | 2.1% |
| Psychology | 658 | 6.8% |
| Social Sciences | 800 | 8.3% |
| Engineering | 700 | 7.2% |
| Multidisciplinary Studies | 150 | 1.5% |
| Science & Technology | 856 | 8.8% |
| Business | 1,706 | 17.6% |
| Education | 895 | 9.2% |
| Literature & Languages | 592 | 6.1% |
| Liberal Arts & History | 574 | 5.9% |
| Visual & Performing Arts | 500 | 5.1% |
| Communications | 426 | 4.4% |
| Arts & Humanities | 684 | 7.0% |
| Total | 9,701 | 100.0% |
Transportation & Commute in New Britain
Vehicle Availability by Sex in New Britain
The most prevalent vehicle ownership categories in New Britain are males with 2 vehicles (5,779, accounting for 33.0%) and females with 2 vehicles (5,288, making up 35.8%).
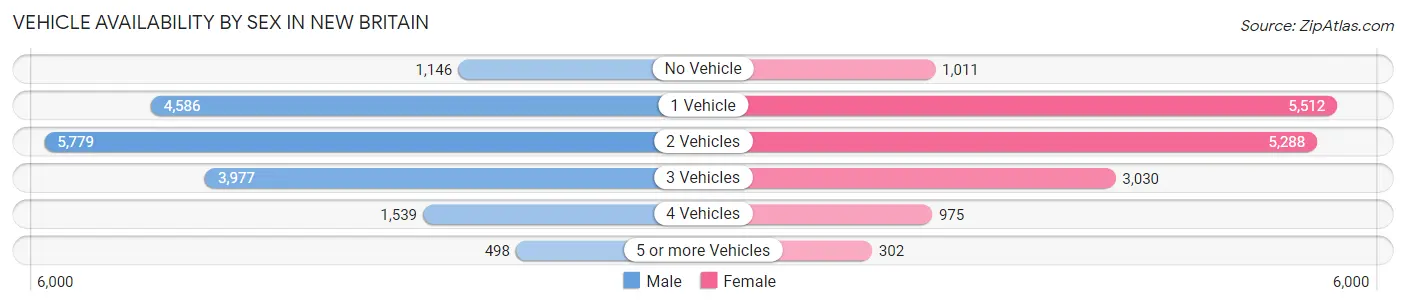
| Vehicles Available | Male | Female |
| No Vehicle | 1,146 (6.5%) | 1,011 (6.3%) |
| 1 Vehicle | 4,586 (26.2%) | 5,512 (34.2%) |
| 2 Vehicles | 5,779 (33.0%) | 5,288 (32.8%) |
| 3 Vehicles | 3,977 (22.7%) | 3,030 (18.8%) |
| 4 Vehicles | 1,539 (8.8%) | 975 (6.0%) |
| 5 or more Vehicles | 498 (2.8%) | 302 (1.9%) |
| Total | 17,525 (100.0%) | 16,118 (100.0%) |
Commute Time in New Britain
The most frequently occuring commute durations in New Britain are 10 to 14 minutes (6,795 commuters, 21.2%), 15 to 19 minutes (6,182 commuters, 19.3%), and 20 to 24 minutes (4,527 commuters, 14.1%).
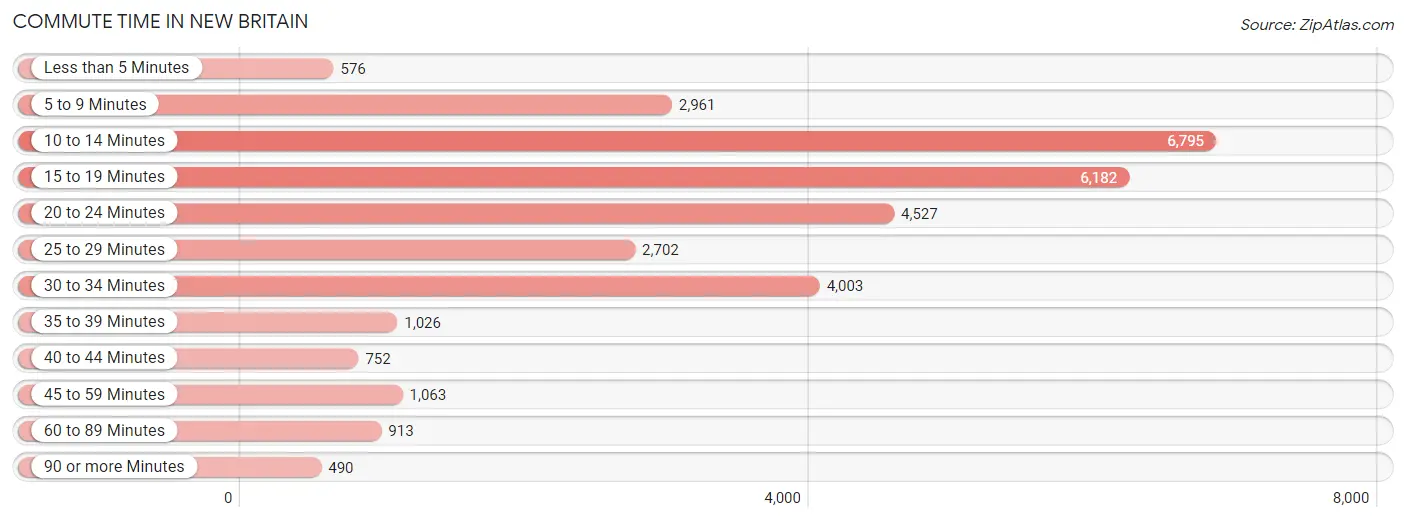
| Commute Time | # Commuters | % Commuters |
| Less than 5 Minutes | 576 | 1.8% |
| 5 to 9 Minutes | 2,961 | 9.3% |
| 10 to 14 Minutes | 6,795 | 21.2% |
| 15 to 19 Minutes | 6,182 | 19.3% |
| 20 to 24 Minutes | 4,527 | 14.1% |
| 25 to 29 Minutes | 2,702 | 8.5% |
| 30 to 34 Minutes | 4,003 | 12.5% |
| 35 to 39 Minutes | 1,026 | 3.2% |
| 40 to 44 Minutes | 752 | 2.4% |
| 45 to 59 Minutes | 1,063 | 3.3% |
| 60 to 89 Minutes | 913 | 2.9% |
| 90 or more Minutes | 490 | 1.5% |
Commute Time by Sex in New Britain
The most common commute times in New Britain are 10 to 14 minutes (3,257 commuters, 19.2%) for males and 10 to 14 minutes (3,538 commuters, 23.6%) for females.
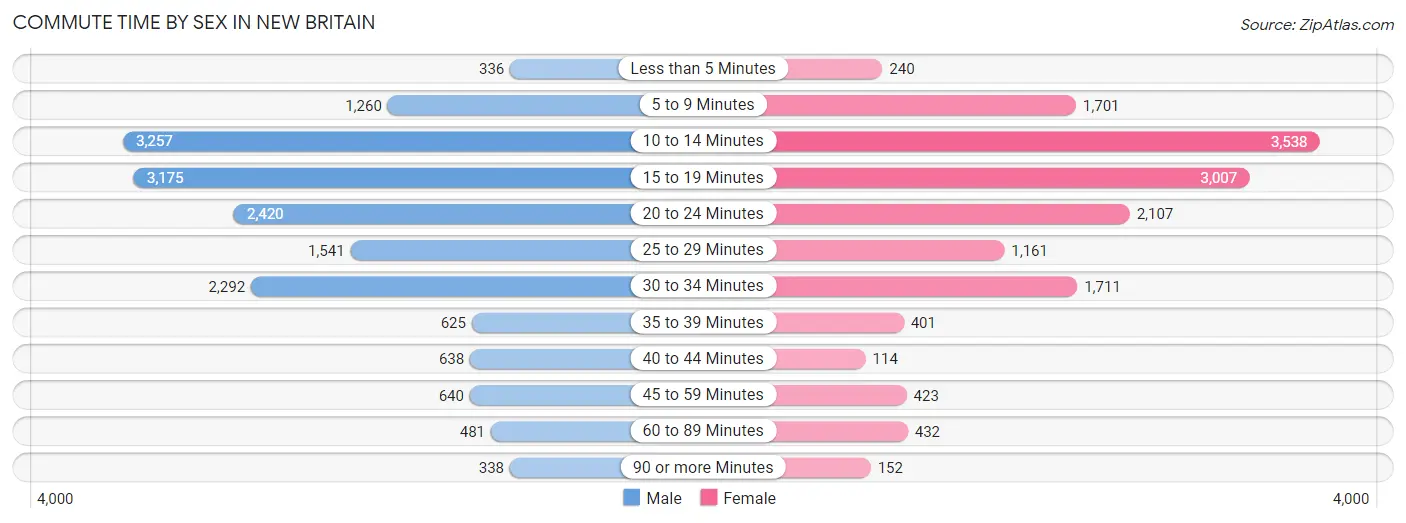
| Commute Time | Male | Female |
| Less than 5 Minutes | 336 (2.0%) | 240 (1.6%) |
| 5 to 9 Minutes | 1,260 (7.4%) | 1,701 (11.4%) |
| 10 to 14 Minutes | 3,257 (19.2%) | 3,538 (23.6%) |
| 15 to 19 Minutes | 3,175 (18.7%) | 3,007 (20.1%) |
| 20 to 24 Minutes | 2,420 (14.2%) | 2,107 (14.1%) |
| 25 to 29 Minutes | 1,541 (9.1%) | 1,161 (7.7%) |
| 30 to 34 Minutes | 2,292 (13.5%) | 1,711 (11.4%) |
| 35 to 39 Minutes | 625 (3.7%) | 401 (2.7%) |
| 40 to 44 Minutes | 638 (3.7%) | 114 (0.8%) |
| 45 to 59 Minutes | 640 (3.8%) | 423 (2.8%) |
| 60 to 89 Minutes | 481 (2.8%) | 432 (2.9%) |
| 90 or more Minutes | 338 (2.0%) | 152 (1.0%) |
Time of Departure to Work by Sex in New Britain
The most frequent times of departure to work in New Britain are 7:00 AM to 7:29 AM (2,163, 12.7%) for males and 8:00 AM to 8:29 AM (2,155, 14.4%) for females.
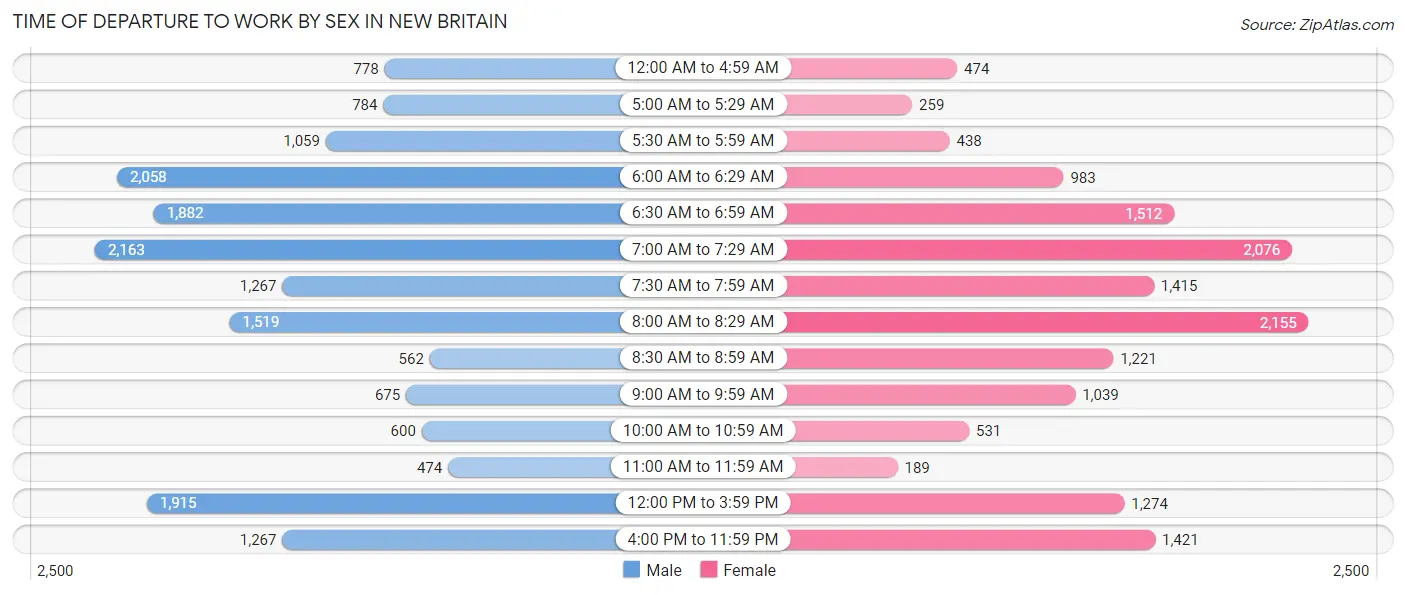
| Time of Departure | Male | Female |
| 12:00 AM to 4:59 AM | 778 (4.6%) | 474 (3.2%) |
| 5:00 AM to 5:29 AM | 784 (4.6%) | 259 (1.7%) |
| 5:30 AM to 5:59 AM | 1,059 (6.2%) | 438 (2.9%) |
| 6:00 AM to 6:29 AM | 2,058 (12.1%) | 983 (6.6%) |
| 6:30 AM to 6:59 AM | 1,882 (11.1%) | 1,512 (10.1%) |
| 7:00 AM to 7:29 AM | 2,163 (12.7%) | 2,076 (13.9%) |
| 7:30 AM to 7:59 AM | 1,267 (7.4%) | 1,415 (9.4%) |
| 8:00 AM to 8:29 AM | 1,519 (8.9%) | 2,155 (14.4%) |
| 8:30 AM to 8:59 AM | 562 (3.3%) | 1,221 (8.2%) |
| 9:00 AM to 9:59 AM | 675 (4.0%) | 1,039 (6.9%) |
| 10:00 AM to 10:59 AM | 600 (3.5%) | 531 (3.5%) |
| 11:00 AM to 11:59 AM | 474 (2.8%) | 189 (1.3%) |
| 12:00 PM to 3:59 PM | 1,915 (11.3%) | 1,274 (8.5%) |
| 4:00 PM to 11:59 PM | 1,267 (7.4%) | 1,421 (9.5%) |
| Total | 17,003 (100.0%) | 14,987 (100.0%) |
Housing Occupancy in New Britain
Occupancy by Ownership in New Britain
Of the total 28,575 dwellings in New Britain, owner-occupied units account for 11,815 (41.3%), while renter-occupied units make up 16,760 (58.7%).
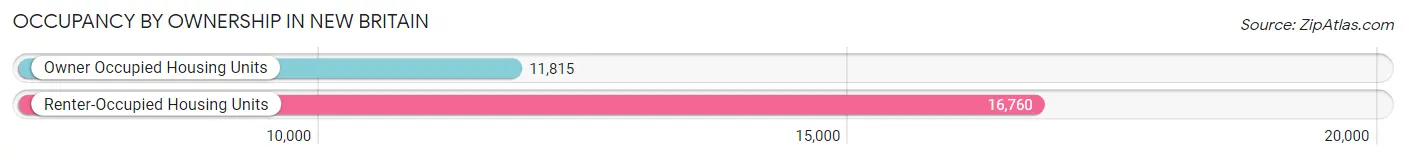
| Occupancy | # Housing Units | % Housing Units |
| Owner Occupied Housing Units | 11,815 | 41.3% |
| Renter-Occupied Housing Units | 16,760 | 58.7% |
| Total Occupied Housing Units | 28,575 | 100.0% |
Occupancy by Household Size in New Britain
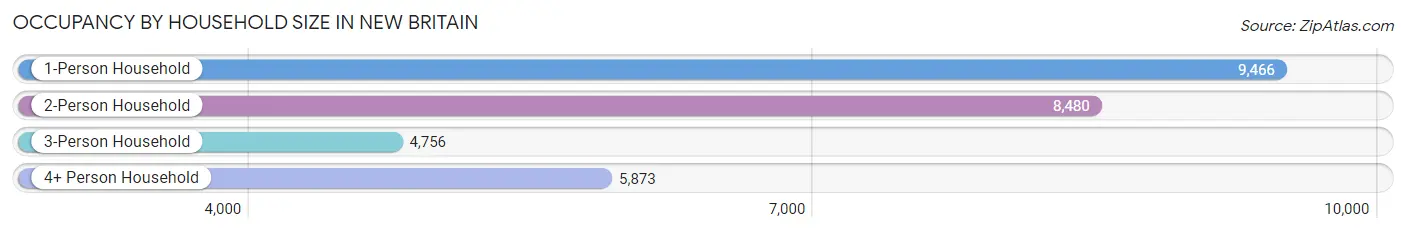
| Household Size | # Housing Units | % Housing Units |
| 1-Person Household | 9,466 | 33.1% |
| 2-Person Household | 8,480 | 29.7% |
| 3-Person Household | 4,756 | 16.6% |
| 4+ Person Household | 5,873 | 20.5% |
| Total Housing Units | 28,575 | 100.0% |
Occupancy by Ownership by Household Size in New Britain
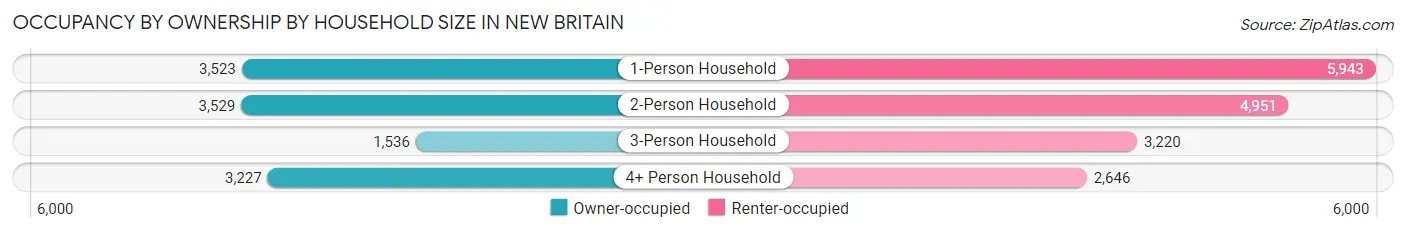
| Household Size | Owner-occupied | Renter-occupied |
| 1-Person Household | 3,523 (37.2%) | 5,943 (62.8%) |
| 2-Person Household | 3,529 (41.6%) | 4,951 (58.4%) |
| 3-Person Household | 1,536 (32.3%) | 3,220 (67.7%) |
| 4+ Person Household | 3,227 (54.9%) | 2,646 (45.1%) |
| Total Housing Units | 11,815 (41.3%) | 16,760 (58.7%) |
Occupancy by Educational Attainment in New Britain
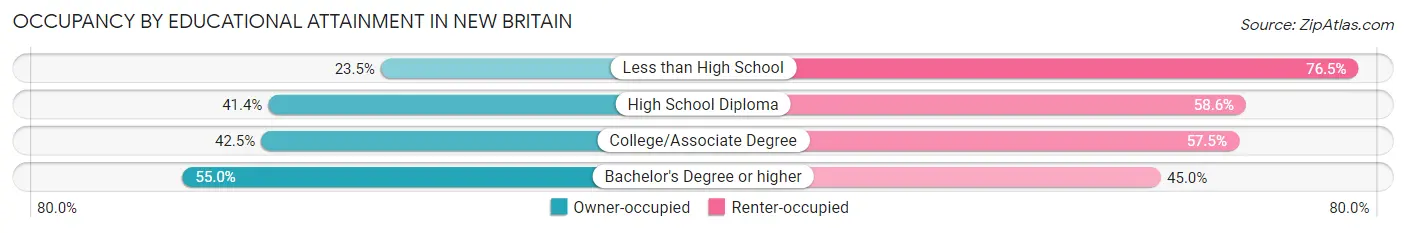
| Household Size | Owner-occupied | Renter-occupied |
| Less than High School | 1,134 (23.5%) | 3,688 (76.5%) |
| High School Diploma | 3,893 (41.4%) | 5,520 (58.6%) |
| College/Associate Degree | 3,729 (42.5%) | 5,045 (57.5%) |
| Bachelor's Degree or higher | 3,059 (55.0%) | 2,507 (45.0%) |
Occupancy by Age of Householder in New Britain
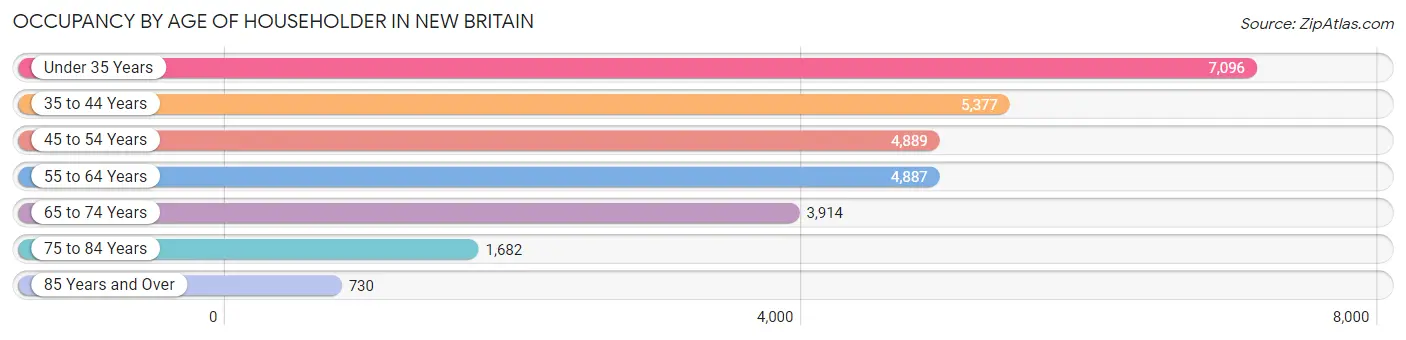
| Age Bracket | # Households | % Households |
| Under 35 Years | 7,096 | 24.8% |
| 35 to 44 Years | 5,377 | 18.8% |
| 45 to 54 Years | 4,889 | 17.1% |
| 55 to 64 Years | 4,887 | 17.1% |
| 65 to 74 Years | 3,914 | 13.7% |
| 75 to 84 Years | 1,682 | 5.9% |
| 85 Years and Over | 730 | 2.5% |
| Total | 28,575 | 100.0% |
Housing Finances in New Britain
Median Income by Occupancy in New Britain
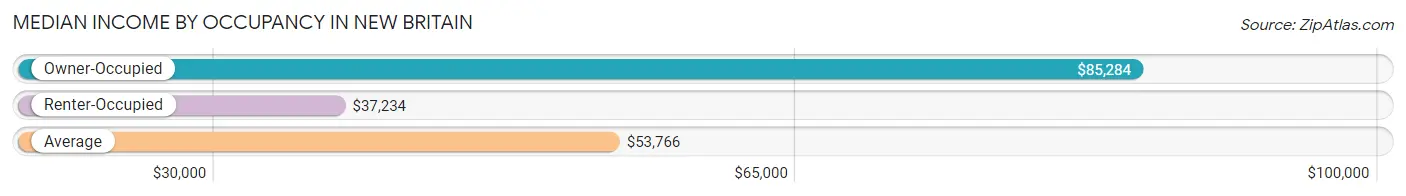
| Occupancy Type | # Households | Median Income |
| Owner-Occupied | 11,815 (41.3%) | $85,284 |
| Renter-Occupied | 16,760 (58.7%) | $37,234 |
| Average | 28,575 (100.0%) | $53,766 |
Occupancy by Householder Income Bracket in New Britain
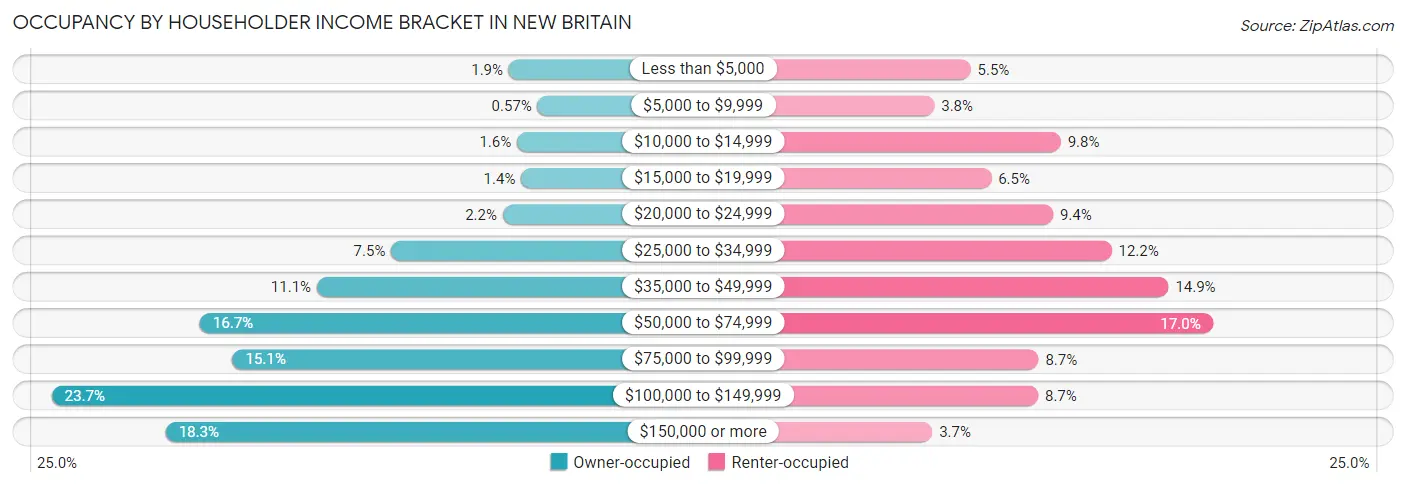
| Income Bracket | Owner-occupied | Renter-occupied |
| Less than $5,000 | 229 (1.9%) | 918 (5.5%) |
| $5,000 to $9,999 | 67 (0.6%) | 628 (3.7%) |
| $10,000 to $14,999 | 183 (1.5%) | 1,637 (9.8%) |
| $15,000 to $19,999 | 160 (1.3%) | 1,083 (6.5%) |
| $20,000 to $24,999 | 264 (2.2%) | 1,576 (9.4%) |
| $25,000 to $34,999 | 891 (7.5%) | 2,043 (12.2%) |
| $35,000 to $49,999 | 1,309 (11.1%) | 2,497 (14.9%) |
| $50,000 to $74,999 | 1,967 (16.7%) | 2,849 (17.0%) |
| $75,000 to $99,999 | 1,784 (15.1%) | 1,460 (8.7%) |
| $100,000 to $149,999 | 2,801 (23.7%) | 1,457 (8.7%) |
| $150,000 or more | 2,160 (18.3%) | 612 (3.6%) |
| Total | 11,815 (100.0%) | 16,760 (100.0%) |
Monthly Housing Cost Tiers in New Britain
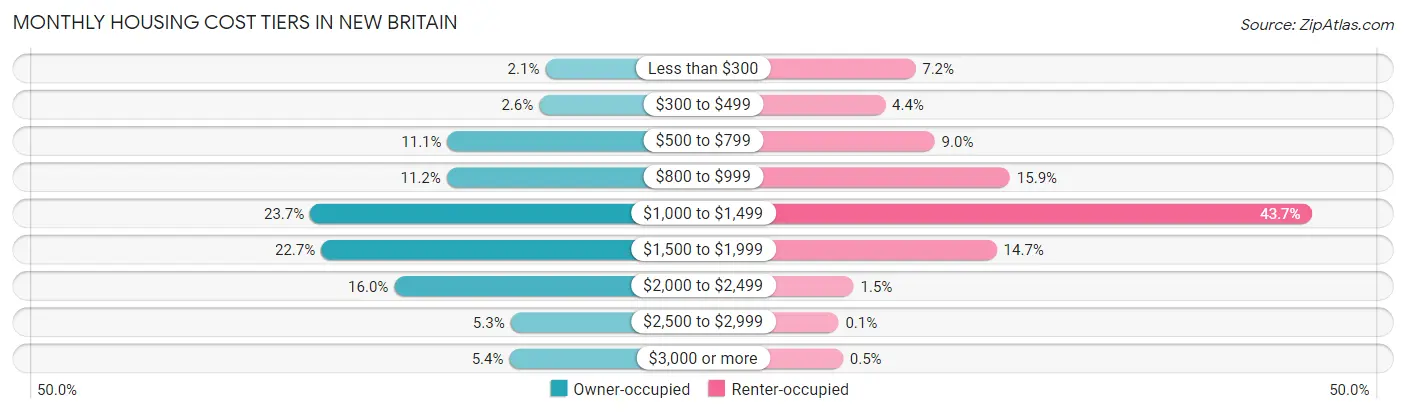
| Monthly Cost | Owner-occupied | Renter-occupied |
| Less than $300 | 245 (2.1%) | 1,201 (7.2%) |
| $300 to $499 | 312 (2.6%) | 736 (4.4%) |
| $500 to $799 | 1,309 (11.1%) | 1,500 (8.9%) |
| $800 to $999 | 1,317 (11.2%) | 2,661 (15.9%) |
| $1,000 to $1,499 | 2,802 (23.7%) | 7,327 (43.7%) |
| $1,500 to $1,999 | 2,683 (22.7%) | 2,457 (14.7%) |
| $2,000 to $2,499 | 1,888 (16.0%) | 250 (1.5%) |
| $2,500 to $2,999 | 623 (5.3%) | 17 (0.1%) |
| $3,000 or more | 636 (5.4%) | 83 (0.5%) |
| Total | 11,815 (100.0%) | 16,760 (100.0%) |
Physical Housing Characteristics in New Britain
Housing Structures in New Britain
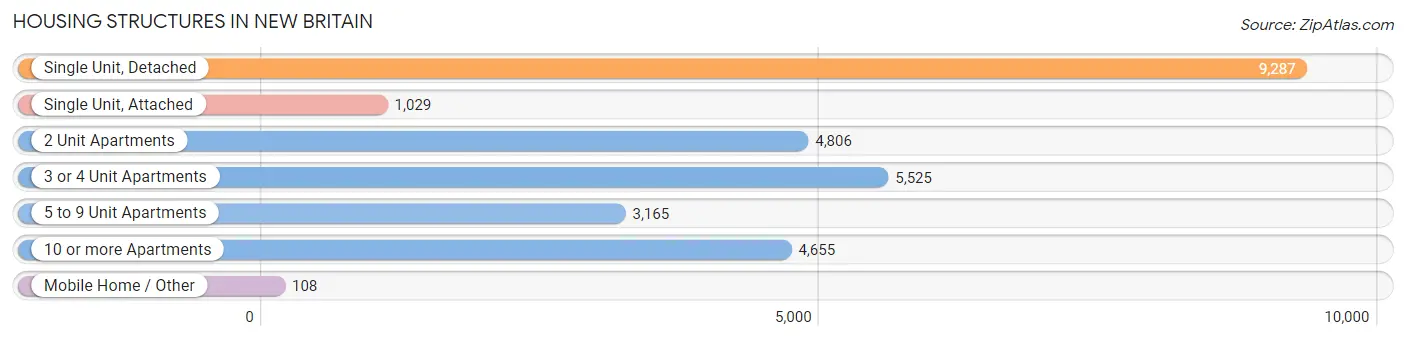
| Structure Type | # Housing Units | % Housing Units |
| Single Unit, Detached | 9,287 | 32.5% |
| Single Unit, Attached | 1,029 | 3.6% |
| 2 Unit Apartments | 4,806 | 16.8% |
| 3 or 4 Unit Apartments | 5,525 | 19.3% |
| 5 to 9 Unit Apartments | 3,165 | 11.1% |
| 10 or more Apartments | 4,655 | 16.3% |
| Mobile Home / Other | 108 | 0.4% |
| Total | 28,575 | 100.0% |
Housing Structures by Occupancy in New Britain
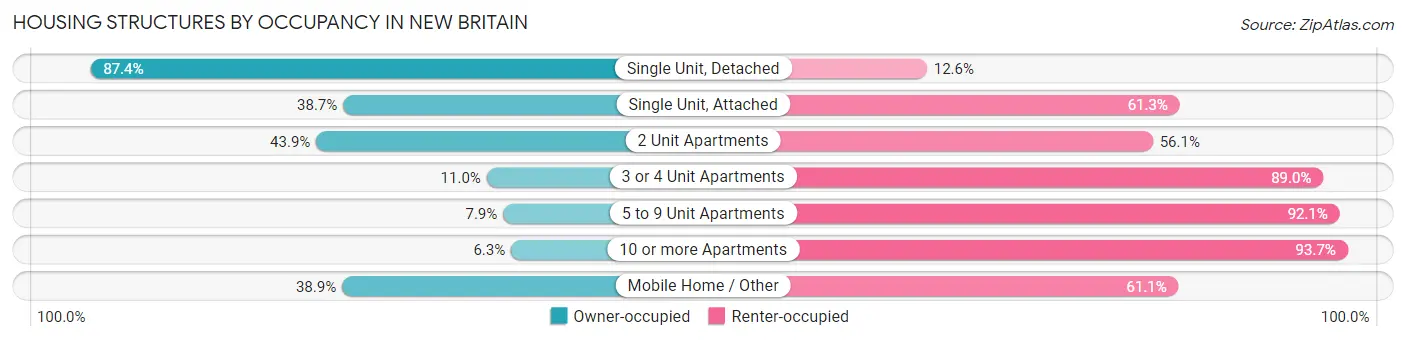
| Structure Type | Owner-occupied | Renter-occupied |
| Single Unit, Detached | 8,113 (87.4%) | 1,174 (12.6%) |
| Single Unit, Attached | 398 (38.7%) | 631 (61.3%) |
| 2 Unit Apartments | 2,108 (43.9%) | 2,698 (56.1%) |
| 3 or 4 Unit Apartments | 610 (11.0%) | 4,915 (89.0%) |
| 5 to 9 Unit Apartments | 249 (7.9%) | 2,916 (92.1%) |
| 10 or more Apartments | 295 (6.3%) | 4,360 (93.7%) |
| Mobile Home / Other | 42 (38.9%) | 66 (61.1%) |
| Total | 11,815 (41.3%) | 16,760 (58.7%) |
Housing Structures by Number of Rooms in New Britain
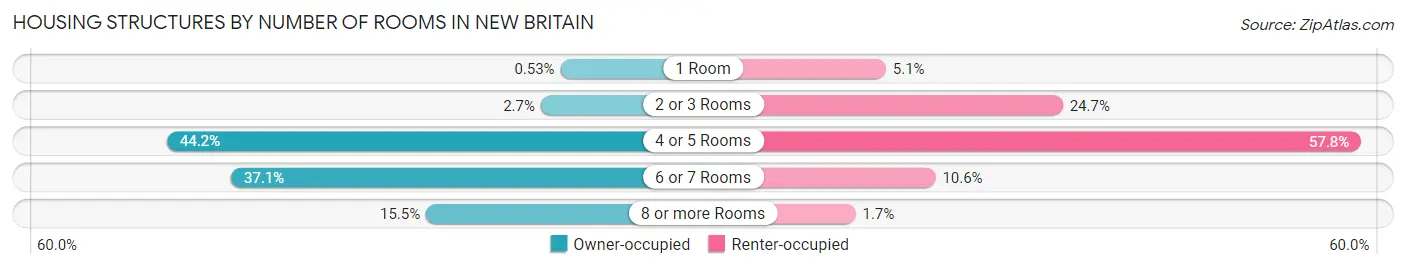
| Number of Rooms | Owner-occupied | Renter-occupied |
| 1 Room | 63 (0.5%) | 855 (5.1%) |
| 2 or 3 Rooms | 320 (2.7%) | 4,145 (24.7%) |
| 4 or 5 Rooms | 5,224 (44.2%) | 9,694 (57.8%) |
| 6 or 7 Rooms | 4,383 (37.1%) | 1,776 (10.6%) |
| 8 or more Rooms | 1,825 (15.4%) | 290 (1.7%) |
| Total | 11,815 (100.0%) | 16,760 (100.0%) |
Housing Structure by Heating Type in New Britain
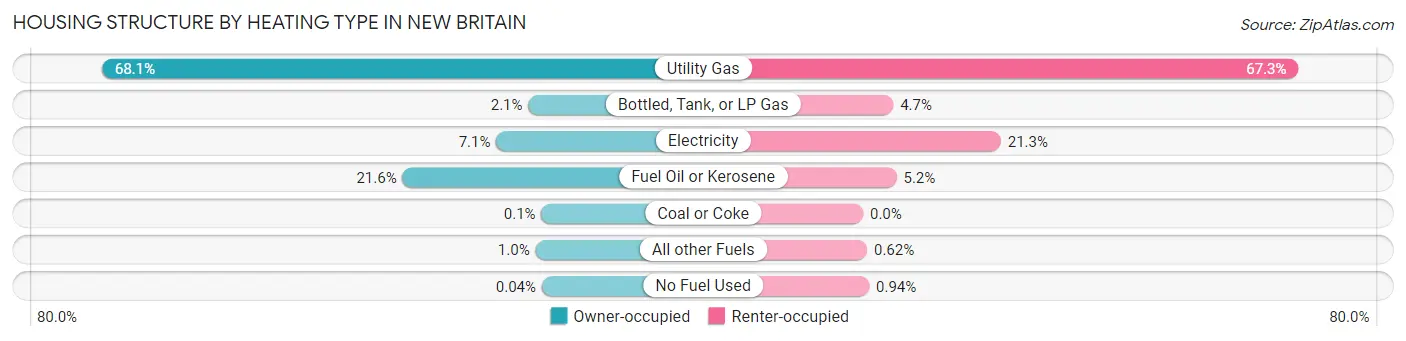
| Heating Type | Owner-occupied | Renter-occupied |
| Utility Gas | 8,041 (68.1%) | 11,278 (67.3%) |
| Bottled, Tank, or LP Gas | 250 (2.1%) | 783 (4.7%) |
| Electricity | 837 (7.1%) | 3,569 (21.3%) |
| Fuel Oil or Kerosene | 2,550 (21.6%) | 869 (5.2%) |
| Coal or Coke | 12 (0.1%) | 0 (0.0%) |
| All other Fuels | 120 (1.0%) | 104 (0.6%) |
| No Fuel Used | 5 (0.0%) | 157 (0.9%) |
| Total | 11,815 (100.0%) | 16,760 (100.0%) |
Household Vehicle Usage in New Britain
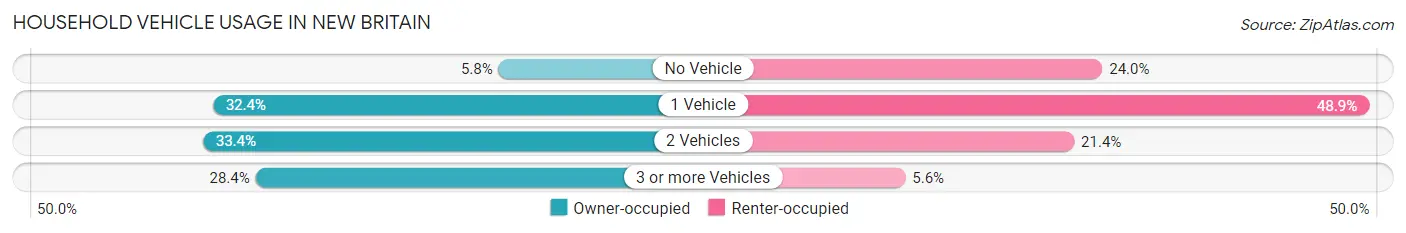
| Vehicles per Household | Owner-occupied | Renter-occupied |
| No Vehicle | 680 (5.8%) | 4,028 (24.0%) |
| 1 Vehicle | 3,833 (32.4%) | 8,200 (48.9%) |
| 2 Vehicles | 3,942 (33.4%) | 3,586 (21.4%) |
| 3 or more Vehicles | 3,360 (28.4%) | 946 (5.6%) |
| Total | 11,815 (100.0%) | 16,760 (100.0%) |
Real Estate & Mortgages in New Britain
Real Estate and Mortgage Overview in New Britain
| Characteristic | Without Mortgage | With Mortgage |
| Housing Units | 3,838 | 7,977 |
| Median Property Value | $188,700 | $188,700 |
| Median Household Income | $70,476 | $1,547 |
| Monthly Housing Costs | $845 | $636 |
| Real Estate Taxes | $5,582 | $197 |
Property Value by Mortgage Status in New Britain
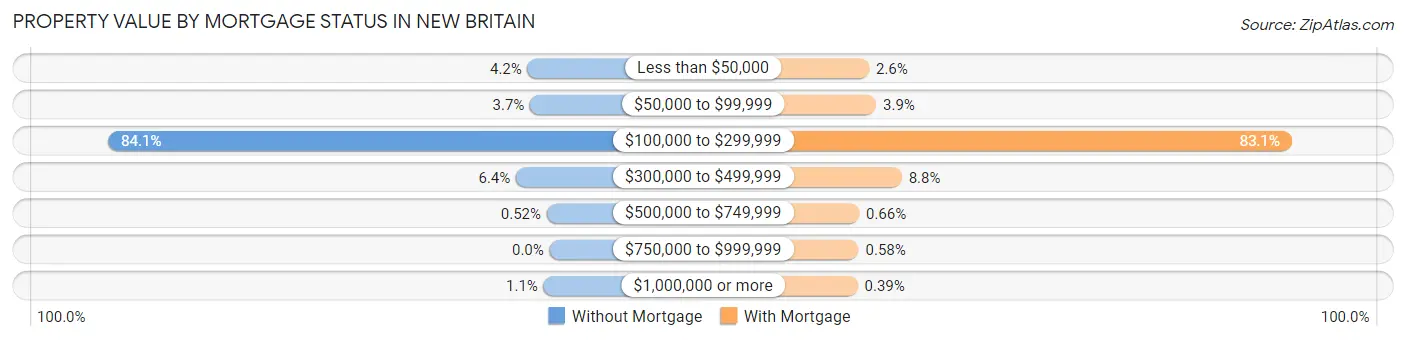
| Property Value | Without Mortgage | With Mortgage |
| Less than $50,000 | 161 (4.2%) | 205 (2.6%) |
| $50,000 to $99,999 | 142 (3.7%) | 313 (3.9%) |
| $100,000 to $299,999 | 3,227 (84.1%) | 6,628 (83.1%) |
| $300,000 to $499,999 | 245 (6.4%) | 701 (8.8%) |
| $500,000 to $749,999 | 20 (0.5%) | 53 (0.7%) |
| $750,000 to $999,999 | 0 (0.0%) | 46 (0.6%) |
| $1,000,000 or more | 43 (1.1%) | 31 (0.4%) |
| Total | 3,838 (100.0%) | 7,977 (100.0%) |
Household Income by Mortgage Status in New Britain
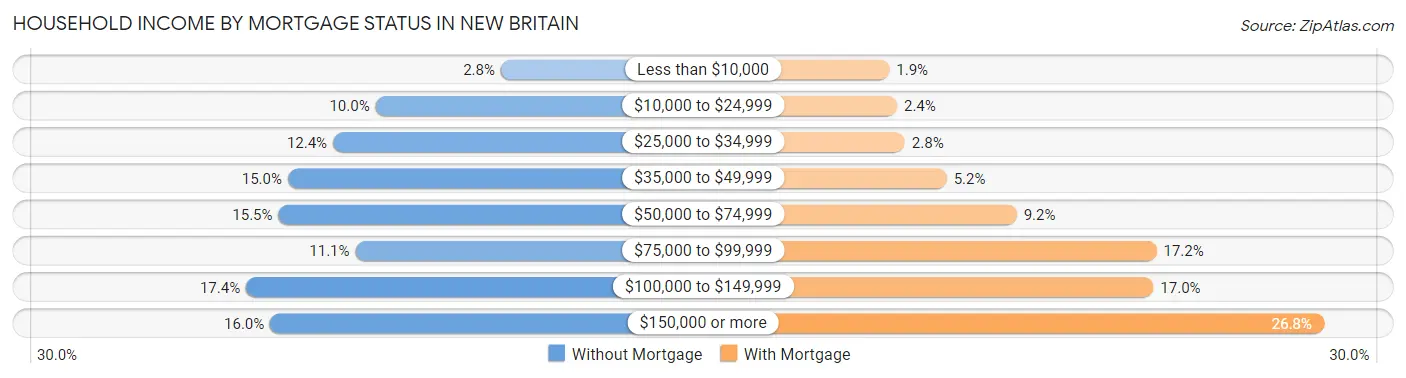
| Household Income | Without Mortgage | With Mortgage |
| Less than $10,000 | 107 (2.8%) | 154 (1.9%) |
| $10,000 to $24,999 | 382 (10.0%) | 189 (2.4%) |
| $25,000 to $34,999 | 475 (12.4%) | 225 (2.8%) |
| $35,000 to $49,999 | 574 (15.0%) | 416 (5.2%) |
| $50,000 to $74,999 | 595 (15.5%) | 735 (9.2%) |
| $75,000 to $99,999 | 426 (11.1%) | 1,372 (17.2%) |
| $100,000 to $149,999 | 666 (17.3%) | 1,358 (17.0%) |
| $150,000 or more | 613 (16.0%) | 2,135 (26.8%) |
| Total | 3,838 (100.0%) | 7,977 (100.0%) |
Property Value to Household Income Ratio in New Britain
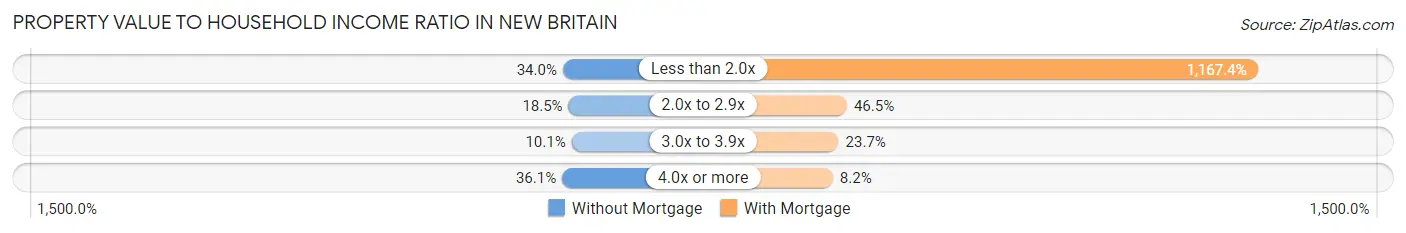
| Value-to-Income Ratio | Without Mortgage | With Mortgage |
| Less than 2.0x | 1,304 (34.0%) | 93,121 (1,167.4%) |
| 2.0x to 2.9x | 710 (18.5%) | 3,708 (46.5%) |
| 3.0x to 3.9x | 388 (10.1%) | 1,894 (23.7%) |
| 4.0x or more | 1,386 (36.1%) | 651 (8.2%) |
| Total | 3,838 (100.0%) | 7,977 (100.0%) |
Real Estate Taxes by Mortgage Status in New Britain
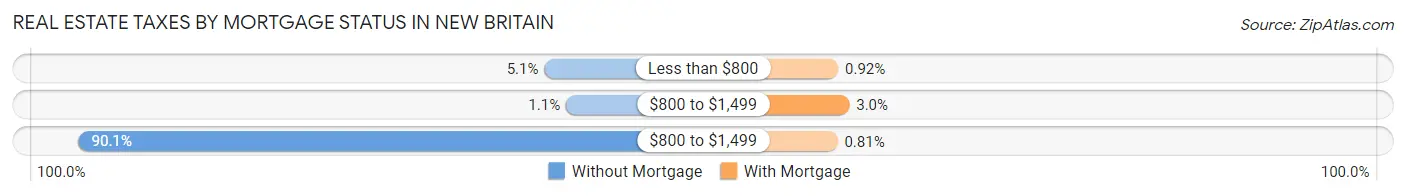
| Property Taxes | Without Mortgage | With Mortgage |
| Less than $800 | 195 (5.1%) | 73 (0.9%) |
| $800 to $1,499 | 43 (1.1%) | 237 (3.0%) |
| $800 to $1,499 | 3,459 (90.1%) | 65 (0.8%) |
| Total | 3,838 (100.0%) | 7,977 (100.0%) |
Health & Disability in New Britain
Health Insurance Coverage by Age in New Britain
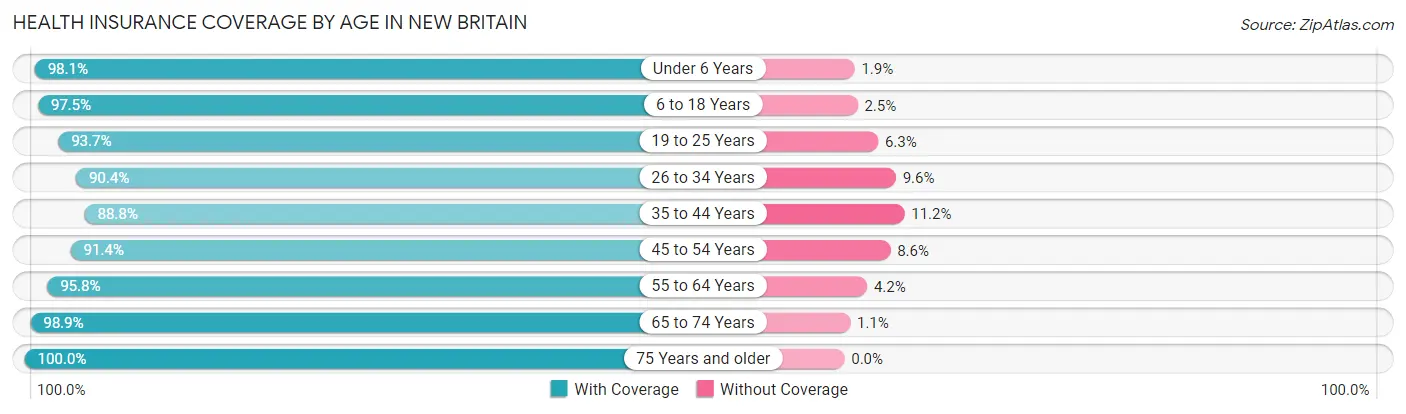
| Age Bracket | With Coverage | Without Coverage |
| Under 6 Years | 5,687 (98.1%) | 110 (1.9%) |
| 6 to 18 Years | 12,713 (97.5%) | 321 (2.5%) |
| 19 to 25 Years | 9,500 (93.7%) | 637 (6.3%) |
| 26 to 34 Years | 9,011 (90.4%) | 956 (9.6%) |
| 35 to 44 Years | 8,408 (88.8%) | 1,059 (11.2%) |
| 45 to 54 Years | 7,656 (91.4%) | 718 (8.6%) |
| 55 to 64 Years | 7,269 (95.8%) | 321 (4.2%) |
| 65 to 74 Years | 5,755 (98.9%) | 62 (1.1%) |
| 75 Years and older | 3,366 (100.0%) | 0 (0.0%) |
| Total | 69,365 (94.3%) | 4,184 (5.7%) |
Health Insurance Coverage by Citizenship Status in New Britain
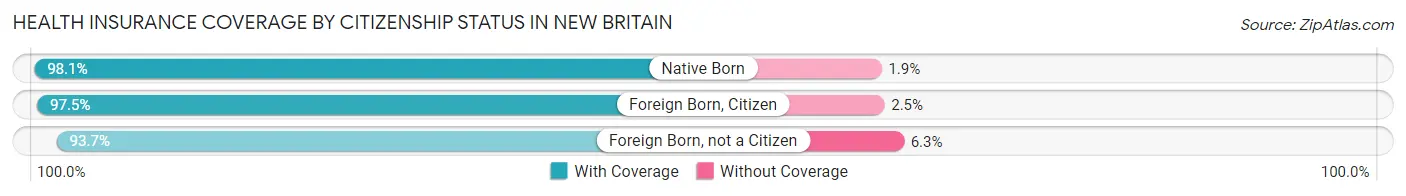
| Citizenship Status | With Coverage | Without Coverage |
| Native Born | 5,687 (98.1%) | 110 (1.9%) |
| Foreign Born, Citizen | 12,713 (97.5%) | 321 (2.5%) |
| Foreign Born, not a Citizen | 9,500 (93.7%) | 637 (6.3%) |
Health Insurance Coverage by Household Income in New Britain
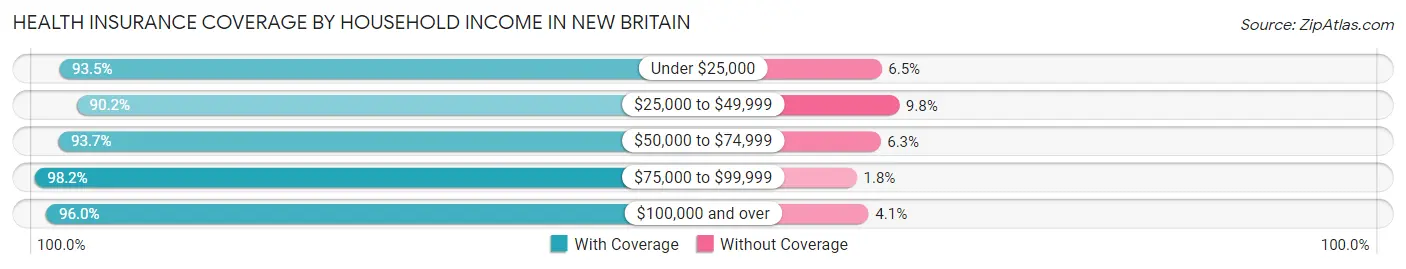
| Household Income | With Coverage | Without Coverage |
| Under $25,000 | 12,129 (93.5%) | 841 (6.5%) |
| $25,000 to $49,999 | 13,270 (90.2%) | 1,436 (9.8%) |
| $50,000 to $74,999 | 11,493 (93.7%) | 769 (6.3%) |
| $75,000 to $99,999 | 8,823 (98.2%) | 165 (1.8%) |
| $100,000 and over | 21,307 (96.0%) | 900 (4.1%) |
Public vs Private Health Insurance Coverage by Age in New Britain
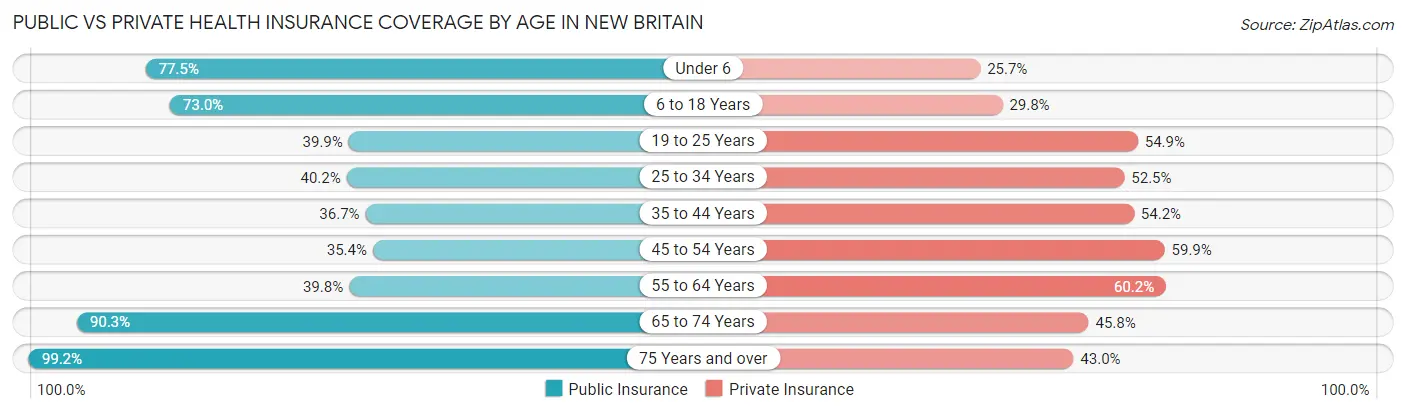
| Age Bracket | Public Insurance | Private Insurance |
| Under 6 | 4,495 (77.5%) | 1,489 (25.7%) |
| 6 to 18 Years | 9,518 (73.0%) | 3,887 (29.8%) |
| 19 to 25 Years | 4,041 (39.9%) | 5,569 (54.9%) |
| 25 to 34 Years | 4,011 (40.2%) | 5,228 (52.4%) |
| 35 to 44 Years | 3,478 (36.7%) | 5,133 (54.2%) |
| 45 to 54 Years | 2,962 (35.4%) | 5,018 (59.9%) |
| 55 to 64 Years | 3,020 (39.8%) | 4,568 (60.2%) |
| 65 to 74 Years | 5,252 (90.3%) | 2,664 (45.8%) |
| 75 Years and over | 3,339 (99.2%) | 1,447 (43.0%) |
| Total | 40,116 (54.5%) | 35,003 (47.6%) |
Disability Status by Sex by Age in New Britain
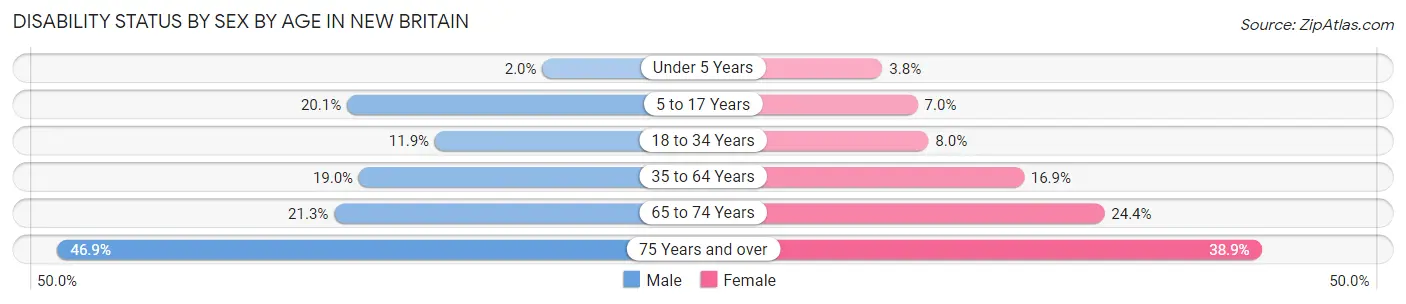
| Age Bracket | Male | Female |
| Under 5 Years | 41 (1.9%) | 105 (3.8%) |
| 5 to 17 Years | 1,270 (20.1%) | 436 (7.0%) |
| 18 to 34 Years | 1,269 (11.9%) | 875 (8.0%) |
| 35 to 64 Years | 2,387 (19.0%) | 2,169 (16.9%) |
| 65 to 74 Years | 573 (21.3%) | 761 (24.4%) |
| 75 Years and over | 653 (46.9%) | 769 (38.9%) |
Disability Class by Sex by Age in New Britain
Disability Class: Hearing Difficulty
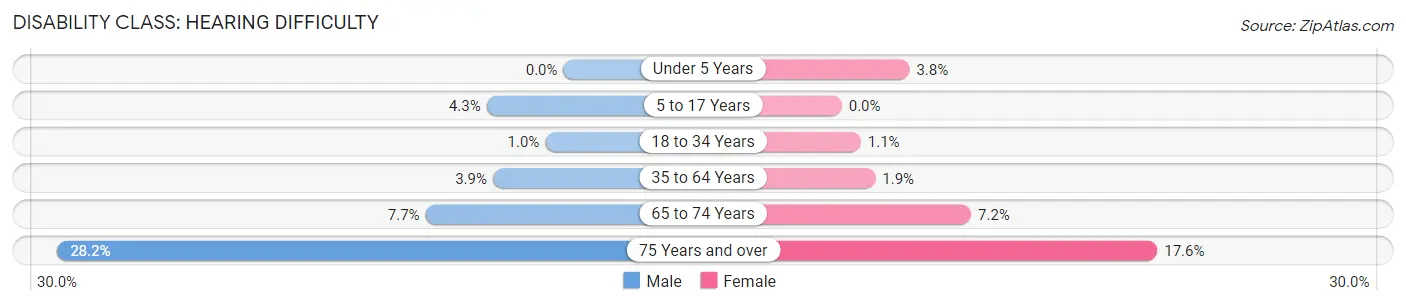
| Age Bracket | Male | Female |
| Under 5 Years | 0 (0.0%) | 105 (3.8%) |
| 5 to 17 Years | 271 (4.3%) | 0 (0.0%) |
| 18 to 34 Years | 107 (1.0%) | 115 (1.1%) |
| 35 to 64 Years | 495 (3.9%) | 240 (1.9%) |
| 65 to 74 Years | 207 (7.7%) | 225 (7.2%) |
| 75 Years and over | 392 (28.2%) | 347 (17.6%) |
Disability Class: Vision Difficulty
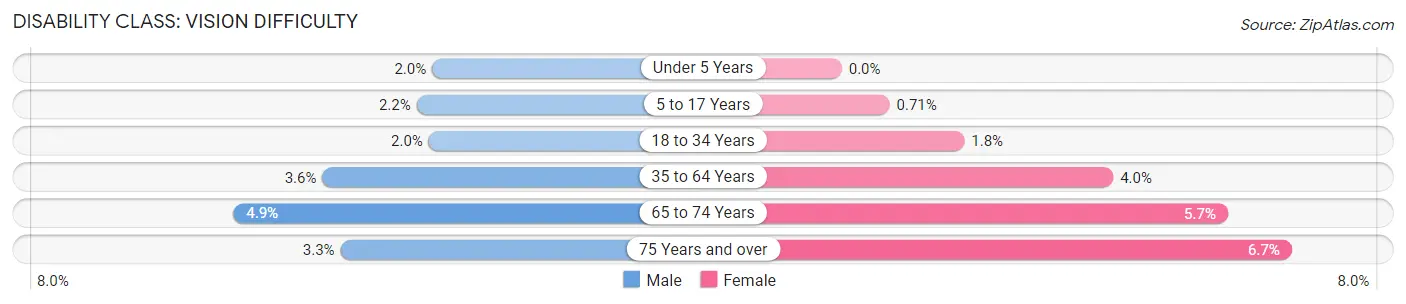
| Age Bracket | Male | Female |
| Under 5 Years | 41 (1.9%) | 0 (0.0%) |
| 5 to 17 Years | 138 (2.2%) | 44 (0.7%) |
| 18 to 34 Years | 213 (2.0%) | 198 (1.8%) |
| 35 to 64 Years | 450 (3.6%) | 518 (4.0%) |
| 65 to 74 Years | 132 (4.9%) | 179 (5.7%) |
| 75 Years and over | 46 (3.3%) | 132 (6.7%) |
Disability Class: Cognitive Difficulty
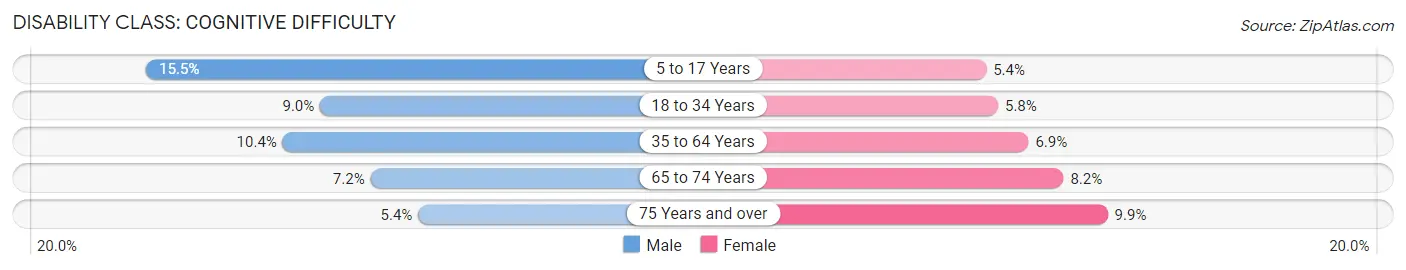
| Age Bracket | Male | Female |
| 5 to 17 Years | 980 (15.5%) | 332 (5.4%) |
| 18 to 34 Years | 961 (9.0%) | 631 (5.8%) |
| 35 to 64 Years | 1,312 (10.4%) | 890 (6.9%) |
| 65 to 74 Years | 193 (7.2%) | 257 (8.2%) |
| 75 Years and over | 75 (5.4%) | 195 (9.9%) |
Disability Class: Ambulatory Difficulty
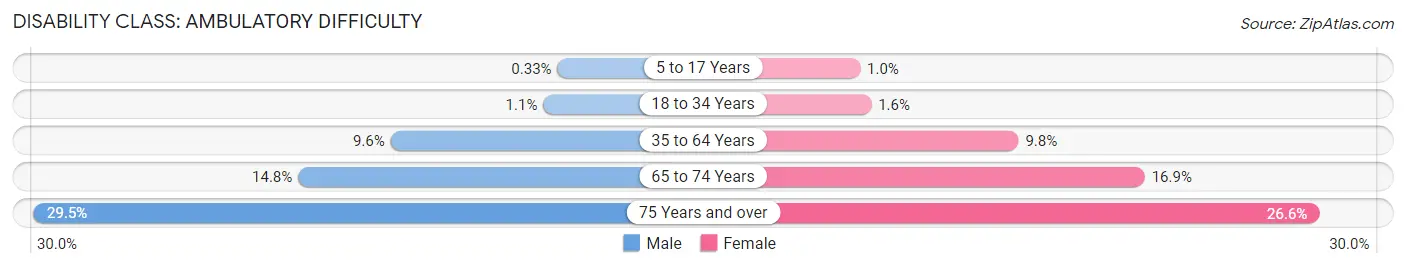
| Age Bracket | Male | Female |
| 5 to 17 Years | 21 (0.3%) | 63 (1.0%) |
| 18 to 34 Years | 119 (1.1%) | 179 (1.6%) |
| 35 to 64 Years | 1,211 (9.6%) | 1,264 (9.8%) |
| 65 to 74 Years | 398 (14.8%) | 527 (16.9%) |
| 75 Years and over | 410 (29.5%) | 525 (26.6%) |
Disability Class: Self-Care Difficulty
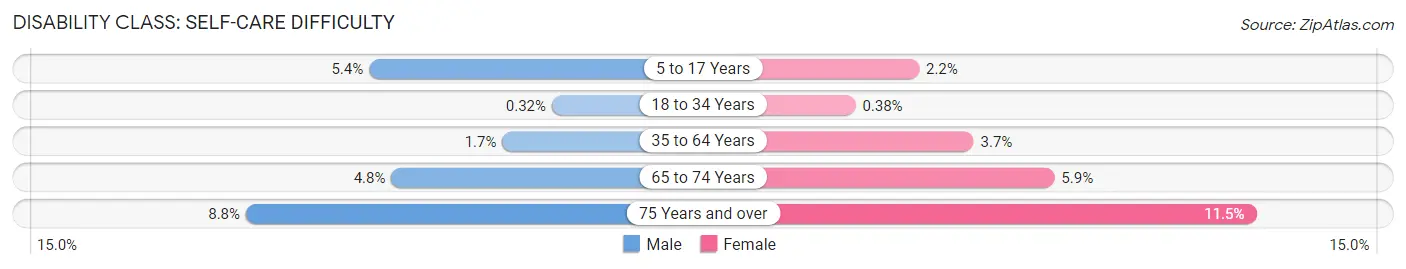
| Age Bracket | Male | Female |
| 5 to 17 Years | 342 (5.4%) | 133 (2.1%) |
| 18 to 34 Years | 34 (0.3%) | 41 (0.4%) |
| 35 to 64 Years | 214 (1.7%) | 471 (3.7%) |
| 65 to 74 Years | 129 (4.8%) | 185 (5.9%) |
| 75 Years and over | 123 (8.8%) | 228 (11.5%) |
Technology Access in New Britain
Computing Device Access in New Britain
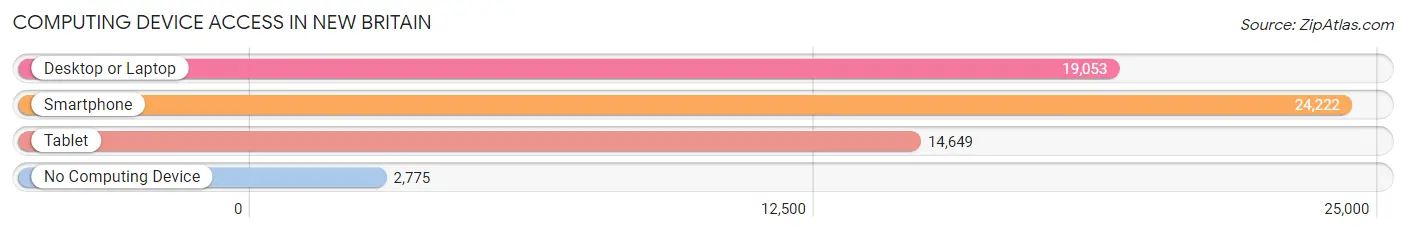
| Device Type | # Households | % Households |
| Desktop or Laptop | 19,053 | 66.7% |
| Smartphone | 24,222 | 84.8% |
| Tablet | 14,649 | 51.3% |
| No Computing Device | 2,775 | 9.7% |
| Total | 28,575 | 100.0% |
Internet Access in New Britain
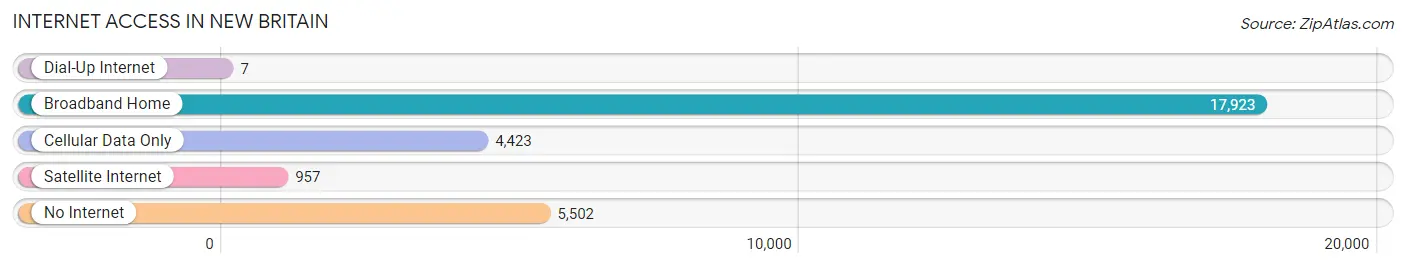
| Internet Type | # Households | % Households |
| Dial-Up Internet | 7 | 0.0% |
| Broadband Home | 17,923 | 62.7% |
| Cellular Data Only | 4,423 | 15.5% |
| Satellite Internet | 957 | 3.4% |
| No Internet | 5,502 | 19.3% |
| Total | 28,575 | 100.0% |
New Britain Summary
New Britain, Connecticut is a city located in Hartford County, Connecticut. It is the second largest city in the state, with a population of 73,206 as of the 2010 census. The city is located in the center of the state, about 10 miles southwest of Hartford, the state capital. It is part of the Greater Hartford metropolitan area.
History
New Britain was founded in 1871 by a group of settlers from New Britain, Connecticut. The settlers were led by John Barber, who had previously been a part of the original settlement of New Britain. The settlers chose the name New Britain because of its similarity to the original settlement.
The city was incorporated in 1871 and quickly grew to become an industrial center. The city was home to several factories, including the Stanley Works, which produced tools and hardware. The city was also home to several other industries, including rubber, textiles, and paper.
The city was also home to several cultural institutions, including the New Britain Museum of American Art, the New Britain Symphony Orchestra, and the New Britain Youth Theater.
Geography
New Britain is located in central Connecticut, about 10 miles southwest of Hartford. The city is located in the Connecticut River Valley, and is bordered by the towns of Berlin, Plainville, and Southington. The city has a total area of 11.3 square miles, of which 11.2 square miles is land and 0.1 square miles is water.
The city is located in a hilly region, with several small hills and ridges. The highest point in the city is the summit of Prospect Hill, which is located in the northern part of the city and has an elevation of 590 feet.
Economy
New Britain has a diverse economy, with a variety of industries represented. The city is home to several large employers, including Stanley Black & Decker, the world’s largest tool and hardware manufacturer, and the New Britain General Hospital. The city is also home to several smaller businesses, including several restaurants, retail stores, and professional services.
The city is also home to several educational institutions, including Central Connecticut State University, Charter Oak State College, and the University of Hartford.
Demographics
As of the 2010 census, the population of New Britain was 73,206. The racial makeup of the city was 64.2% White, 17.3% African American, 0.5% Native American, 5.2% Asian, 0.1% Pacific Islander, 8.2% from other races, and 4.5% from two or more races. Hispanic or Latino of any race were 24.3% of the population.
The median income for a household in the city was $41,945, and the median income for a family was $50,919. The per capita income for the city was $20,945. About 16.2% of the population was below the poverty line.
New Britain is a diverse city, with a variety of cultures and backgrounds represented. The city is home to a large Hispanic population, as well as a large Polish population. The city is also home to a large number of immigrants from other countries, including India, China, and the Dominican Republic.
Common Questions
What is Per Capita Income in New Britain?
Per Capita income in New Britain is $28,796.
What is the Median Family Income in New Britain?
Median Family Income in New Britain is $68,050.
What is the Median Household income in New Britain?
Median Household Income in New Britain is $53,766.
What is Income or Wage Gap in New Britain?
Income or Wage Gap in New Britain is 20.0%.
Women in New Britain earn 80.0 cents for every dollar earned by a man.
What is Family Income Deficit in New Britain?
Family Income Deficit in New Britain is $10,429.
Families that are below poverty line in New Britain earn $10,429 less on average than the poverty threshold level.
What is Inequality or Gini Index in New Britain?
Inequality or Gini Index in New Britain is 0.46.
What is the Total Population of New Britain?
Total Population of New Britain is 74,212.
What is the Total Male Population of New Britain?
Total Male Population of New Britain is 35,973.
What is the Total Female Population of New Britain?
Total Female Population of New Britain is 38,239.
What is the Ratio of Males per 100 Females in New Britain?
There are 94.07 Males per 100 Females in New Britain.
What is the Ratio of Females per 100 Males in New Britain?
There are 106.30 Females per 100 Males in New Britain.
What is the Median Population Age in New Britain?
Median Population Age in New Britain is 33.4 Years.
What is the Average Family Size in New Britain
Average Family Size in New Britain is 3.2 People.
What is the Average Household Size in New Britain
Average Household Size in New Britain is 2.5 People.
How Large is the Labor Force in New Britain?
There are 38,729 People in the Labor Forcein in New Britain.
What is the Percentage of People in the Labor Force in New Britain?
66.0% of People are in the Labor Force in New Britain.
What is the Unemployment Rate in New Britain?
Unemployment Rate in New Britain is 8.9%.