Lake Pocotopaug, CT Map & Demographics
Lake Pocotopaug Map
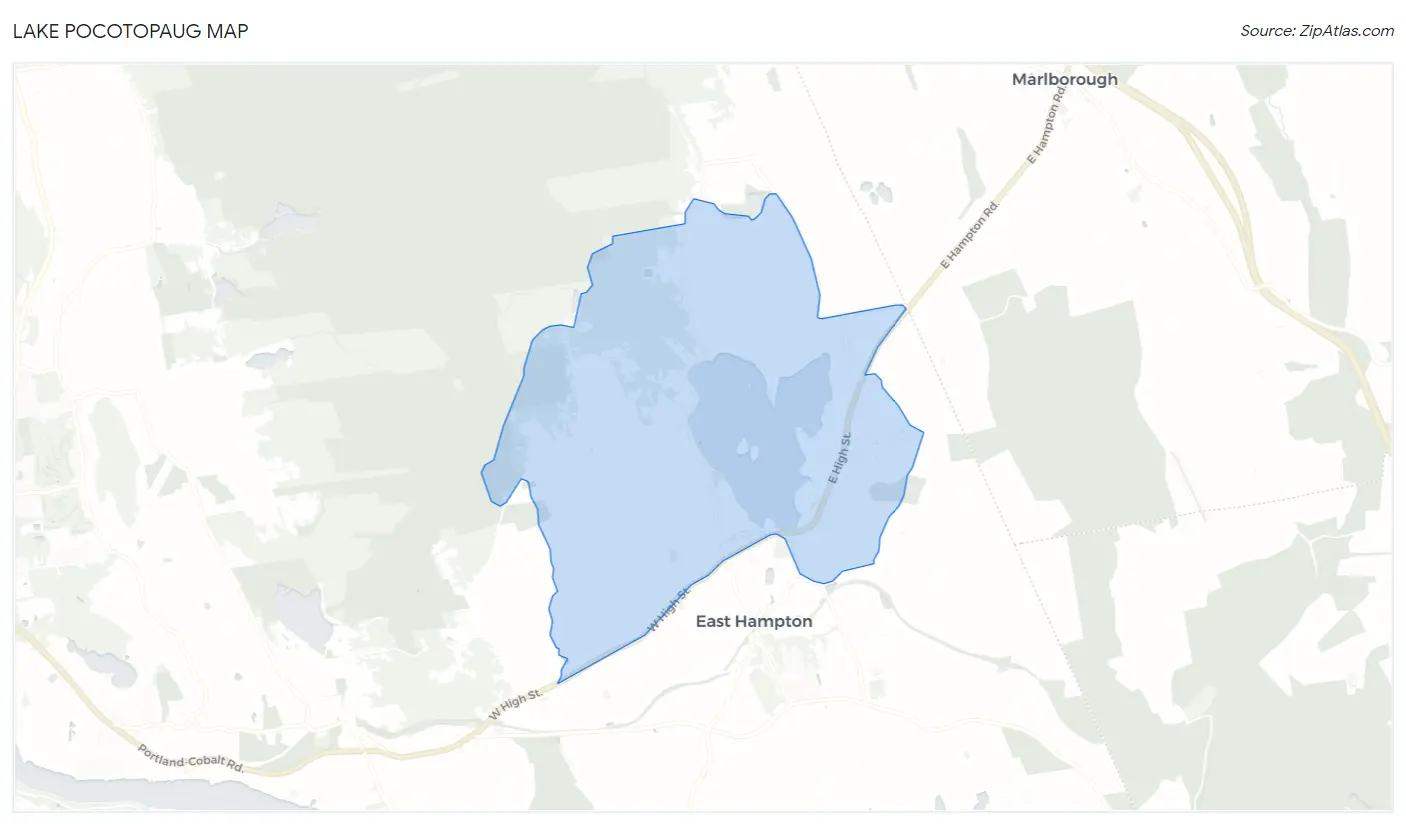
Lake Pocotopaug Overview
$50,124
PER CAPITA INCOME
$122,232
AVG FAMILY INCOME
$105,750
AVG HOUSEHOLD INCOME
30.5%
WAGE / INCOME GAP [ % ]
69.5¢/ $1
WAGE / INCOME GAP [ $ ]
0.39
INEQUALITY / GINI INDEX
4,761
TOTAL POPULATION
2,214
MALE POPULATION
2,547
FEMALE POPULATION
86.93
MALES / 100 FEMALES
115.04
FEMALES / 100 MALES
43.8
MEDIAN AGE
3.1
AVG FAMILY SIZE
2.4
AVG HOUSEHOLD SIZE
2,460
LABOR FORCE [ PEOPLE ]
64.0%
PERCENT IN LABOR FORCE
5.3%
UNEMPLOYMENT RATE
Income in Lake Pocotopaug
Income Overview in Lake Pocotopaug
Per Capita Income in Lake Pocotopaug is $50,124, while median incomes of families and households are $122,232 and $105,750 respectively.
| Characteristic | Number | Measure |
| Per Capita Income | 4,761 | $50,124 |
| Median Family Income | 1,279 | $122,232 |
| Mean Family Income | 1,279 | $144,590 |
| Median Household Income | 1,963 | $105,750 |
| Mean Household Income | 1,963 | $120,646 |
| Income Deficit | 1,279 | $0 |
| Wage / Income Gap (%) | 4,761 | 30.54% |
| Wage / Income Gap ($) | 4,761 | 69.46¢ per $1 |
| Gini / Inequality Index | 4,761 | 0.39 |
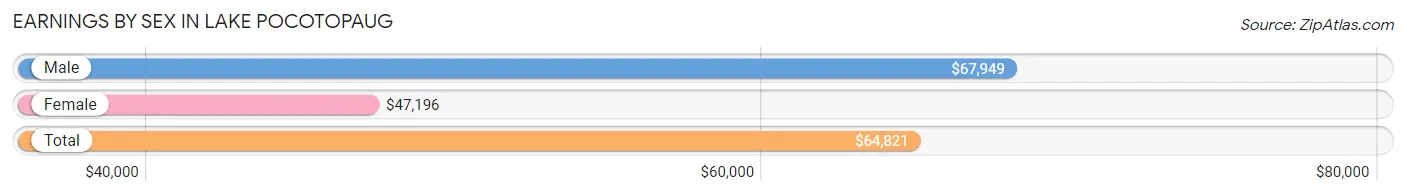
Earnings by Sex in Lake Pocotopaug
Average Earnings in Lake Pocotopaug are $64,821, $67,949 for men and $47,196 for women, a difference of 30.5%.
| Sex | Number | Average Earnings |
| Male | 1,382 (52.2%) | $67,949 |
| Female | 1,267 (47.8%) | $47,196 |
| Total | 2,649 (100.0%) | $64,821 |
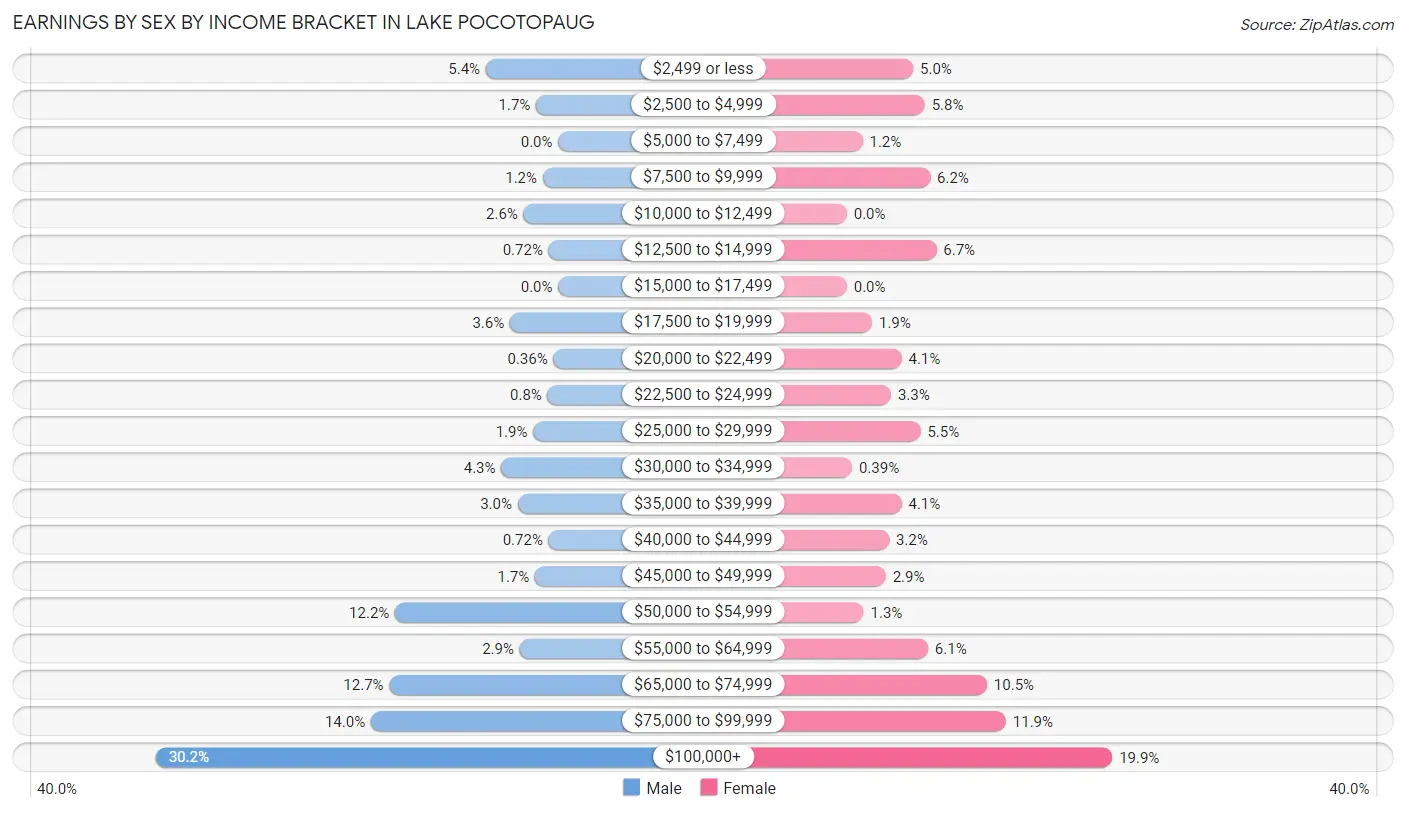
Earnings by Sex by Income Bracket in Lake Pocotopaug
The most common earnings brackets in Lake Pocotopaug are $100,000+ for men (417 | 30.2%) and $100,000+ for women (252 | 19.9%).
| Income | Male | Female |
| $2,499 or less | 75 (5.4%) | 63 (5.0%) |
| $2,500 to $4,999 | 23 (1.7%) | 74 (5.8%) |
| $5,000 to $7,499 | 0 (0.0%) | 15 (1.2%) |
| $7,500 to $9,999 | 16 (1.2%) | 79 (6.2%) |
| $10,000 to $12,499 | 36 (2.6%) | 0 (0.0%) |
| $12,500 to $14,999 | 10 (0.7%) | 85 (6.7%) |
| $15,000 to $17,499 | 0 (0.0%) | 0 (0.0%) |
| $17,500 to $19,999 | 50 (3.6%) | 24 (1.9%) |
| $20,000 to $22,499 | 5 (0.4%) | 52 (4.1%) |
| $22,500 to $24,999 | 11 (0.8%) | 42 (3.3%) |
| $25,000 to $29,999 | 26 (1.9%) | 70 (5.5%) |
| $30,000 to $34,999 | 59 (4.3%) | 5 (0.4%) |
| $35,000 to $39,999 | 42 (3.0%) | 52 (4.1%) |
| $40,000 to $44,999 | 10 (0.7%) | 40 (3.2%) |
| $45,000 to $49,999 | 24 (1.7%) | 37 (2.9%) |
| $50,000 to $54,999 | 169 (12.2%) | 16 (1.3%) |
| $55,000 to $64,999 | 40 (2.9%) | 77 (6.1%) |
| $65,000 to $74,999 | 175 (12.7%) | 133 (10.5%) |
| $75,000 to $99,999 | 194 (14.0%) | 151 (11.9%) |
| $100,000+ | 417 (30.2%) | 252 (19.9%) |
| Total | 1,382 (100.0%) | 1,267 (100.0%) |
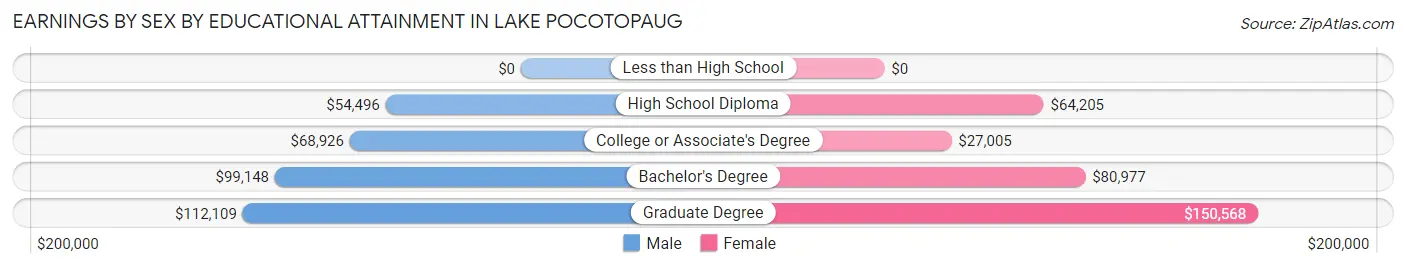
Earnings by Sex by Educational Attainment in Lake Pocotopaug
Average earnings in Lake Pocotopaug are $73,438 for men and $62,105 for women, a difference of 15.4%. Men with an educational attainment of graduate degree enjoy the highest average annual earnings of $112,109, while those with high school diploma education earn the least with $54,496. Women with an educational attainment of graduate degree earn the most with the average annual earnings of $150,568, while those with college or associate's degree education have the smallest earnings of $27,005.
| Educational Attainment | Male Income | Female Income |
| Less than High School | - | - |
| High School Diploma | $54,496 | $64,205 |
| College or Associate's Degree | $68,926 | $27,005 |
| Bachelor's Degree | $99,148 | $80,977 |
| Graduate Degree | $112,109 | $150,568 |
| Total | $73,438 | $62,105 |
Family Income in Lake Pocotopaug
Family Income Brackets in Lake Pocotopaug
According to the Lake Pocotopaug family income data, there are 404 families falling into the $100,000 to $149,999 income range, which is the most common income bracket and makes up 31.6% of all families.
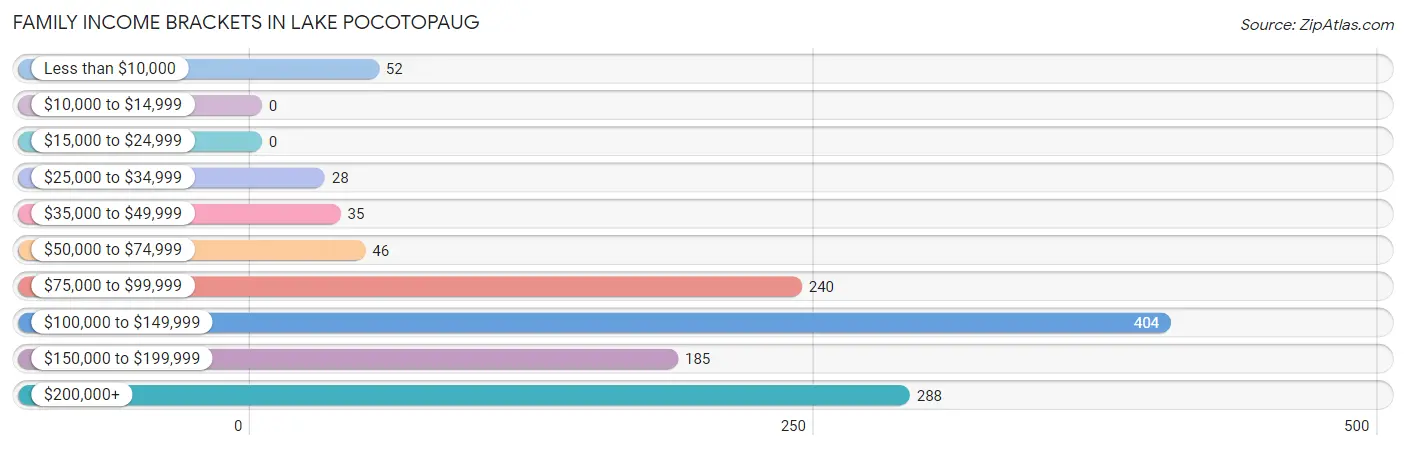
| Income Bracket | # Families | % Families |
| Less than $10,000 | 52 | 4.1% |
| $10,000 to $14,999 | 0 | 0.0% |
| $15,000 to $24,999 | 0 | 0.0% |
| $25,000 to $34,999 | 28 | 2.2% |
| $35,000 to $49,999 | 35 | 2.7% |
| $50,000 to $74,999 | 46 | 3.6% |
| $75,000 to $99,999 | 240 | 18.8% |
| $100,000 to $149,999 | 404 | 31.6% |
| $150,000 to $199,999 | 185 | 14.5% |
| $200,000+ | 288 | 22.5% |
Family Income by Famaliy Size in Lake Pocotopaug
4-person families (174 | 13.6%) account for the highest median family income in Lake Pocotopaug with $173,182 per family, while 2-person families (576 | 45.0%) have the highest median income of $51,389 per family member.
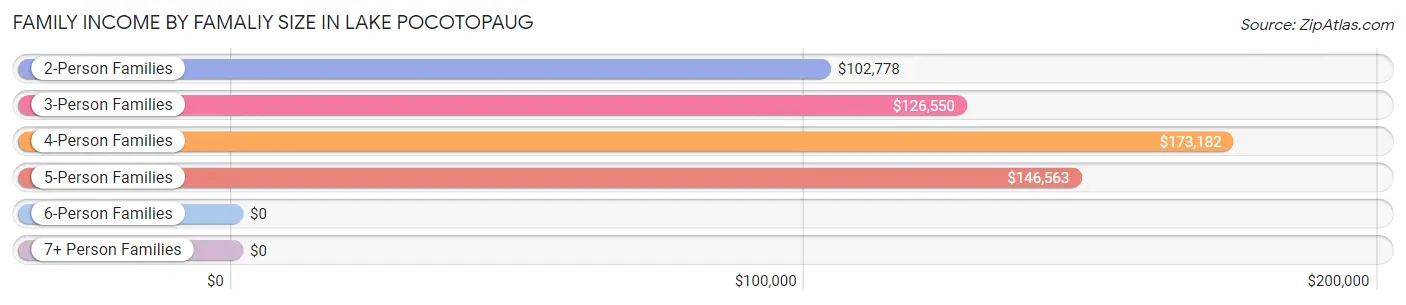
| Income Bracket | # Families | Median Income |
| 2-Person Families | 576 (45.0%) | $102,778 |
| 3-Person Families | 371 (29.0%) | $126,550 |
| 4-Person Families | 174 (13.6%) | $173,182 |
| 5-Person Families | 136 (10.6%) | $146,563 |
| 6-Person Families | 0 (0.0%) | $0 |
| 7+ Person Families | 22 (1.7%) | $0 |
| Total | 1,279 (100.0%) | $122,232 |
Family Income by Number of Earners in Lake Pocotopaug
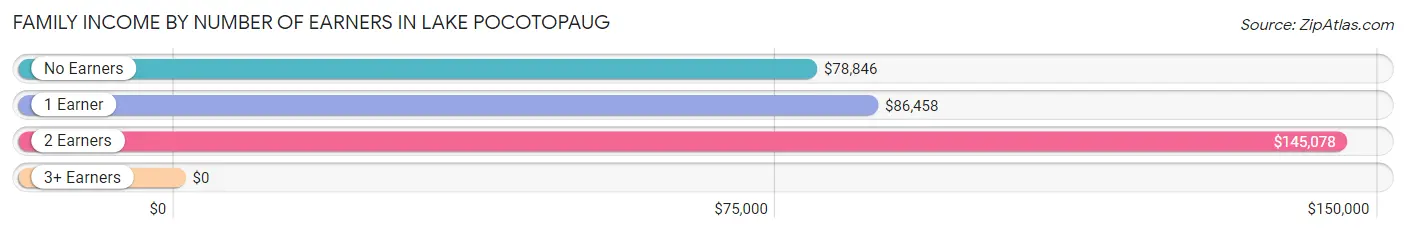
| Number of Earners | # Families | Median Income |
| No Earners | 138 (10.8%) | $78,846 |
| 1 Earner | 235 (18.4%) | $86,458 |
| 2 Earners | 822 (64.3%) | $145,078 |
| 3+ Earners | 84 (6.6%) | $0 |
| Total | 1,279 (100.0%) | $122,232 |
Household Income in Lake Pocotopaug
Household Income Brackets in Lake Pocotopaug
With 510 households falling in the category, the $100,000 to $149,999 income range is the most frequent in Lake Pocotopaug, accounting for 26.0% of all households. In contrast, only 31 households (1.6%) fall into the $10,000 to $14,999 income bracket, making it the least populous group.
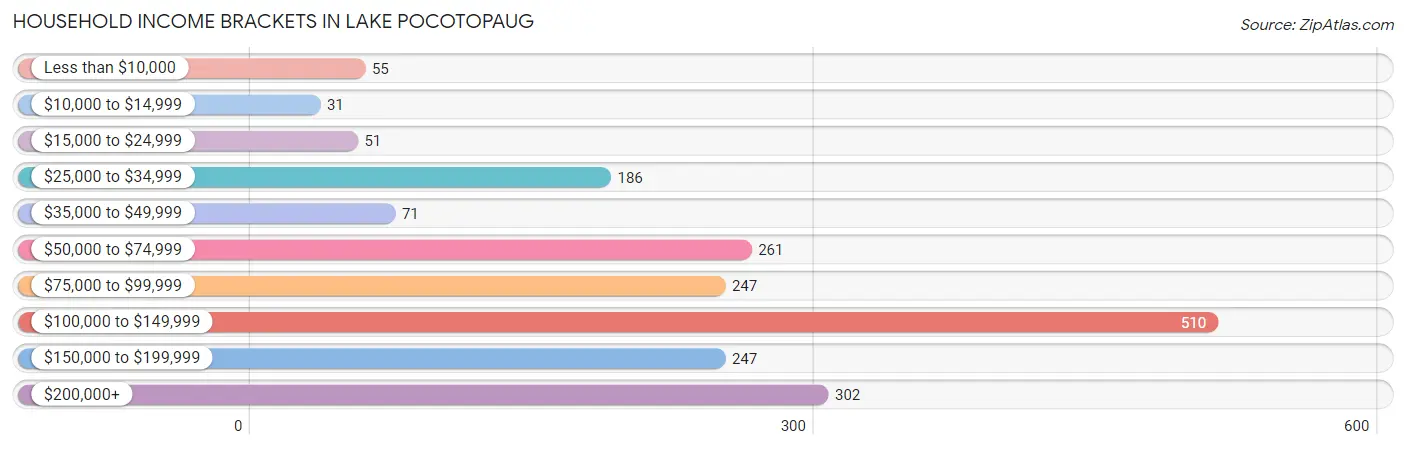
| Income Bracket | # Households | % Households |
| Less than $10,000 | 55 | 2.8% |
| $10,000 to $14,999 | 31 | 1.6% |
| $15,000 to $24,999 | 51 | 2.6% |
| $25,000 to $34,999 | 186 | 9.5% |
| $35,000 to $49,999 | 71 | 3.6% |
| $50,000 to $74,999 | 261 | 13.3% |
| $75,000 to $99,999 | 247 | 12.6% |
| $100,000 to $149,999 | 510 | 26.0% |
| $150,000 to $199,999 | 247 | 12.6% |
| $200,000+ | 302 | 15.4% |
Household Income by Householder Age in Lake Pocotopaug
The median household income in Lake Pocotopaug is $105,750, with the highest median household income of $130,881 found in the 45 to 64 years age bracket for the primary householder. A total of 779 households (39.7%) fall into this category. Meanwhile, the 15 to 24 years age bracket for the primary householder has the lowest median household income of $0, with 22 households (1.1%) in this group.
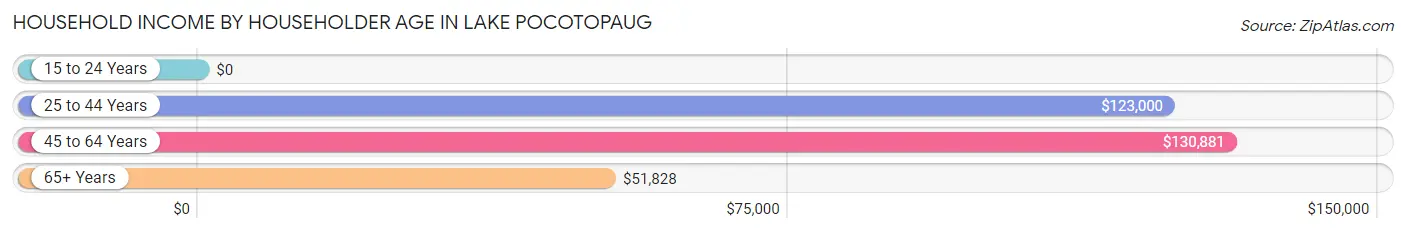
| Income Bracket | # Households | Median Income |
| 15 to 24 Years | 22 (1.1%) | $0 |
| 25 to 44 Years | 498 (25.4%) | $123,000 |
| 45 to 64 Years | 779 (39.7%) | $130,881 |
| 65+ Years | 664 (33.8%) | $51,828 |
| Total | 1,963 (100.0%) | $105,750 |
Poverty in Lake Pocotopaug
Income Below Poverty by Sex and Age in Lake Pocotopaug
With 3.7% poverty level for males and 3.7% for females among the residents of Lake Pocotopaug, 6 to 11 year old males and 25 to 34 year old females are the most vulnerable to poverty, with 37 males (22.6%) and 39 females (14.7%) in their respective age groups living below the poverty level.
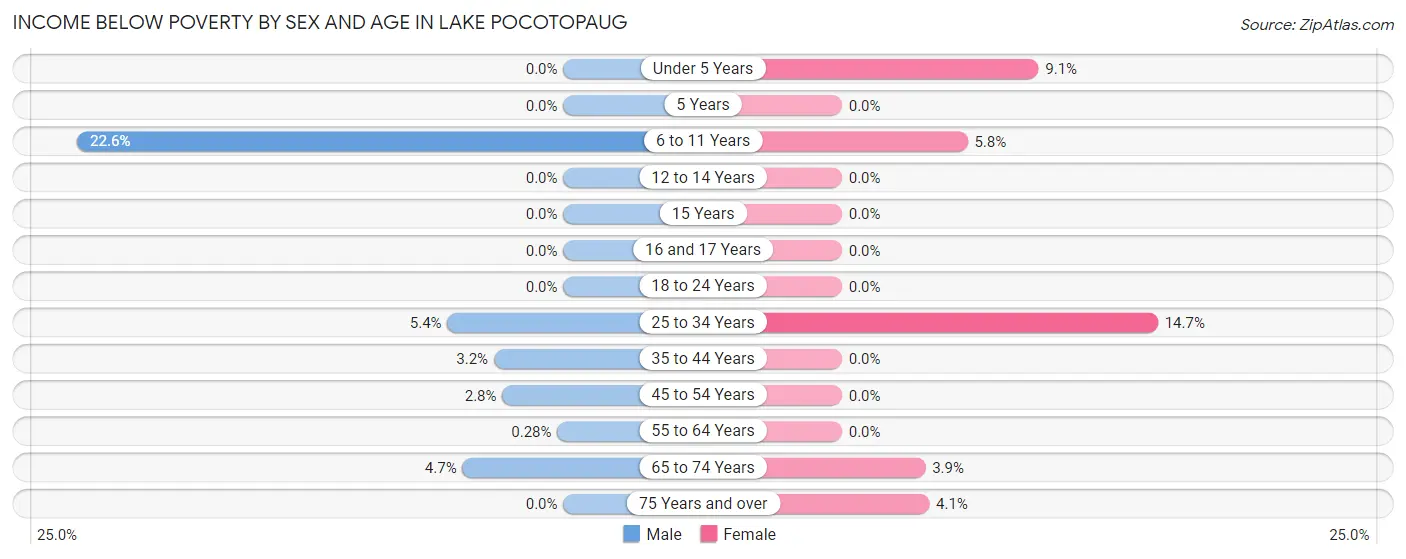
| Age Bracket | Male | Female |
| Under 5 Years | 0 (0.0%) | 26 (9.1%) |
| 5 Years | 0 (0.0%) | 0 (0.0%) |
| 6 to 11 Years | 37 (22.6%) | 7 (5.8%) |
| 12 to 14 Years | 0 (0.0%) | 0 (0.0%) |
| 15 Years | 0 (0.0%) | 0 (0.0%) |
| 16 and 17 Years | 0 (0.0%) | 0 (0.0%) |
| 18 to 24 Years | 0 (0.0%) | 0 (0.0%) |
| 25 to 34 Years | 10 (5.4%) | 39 (14.7%) |
| 35 to 44 Years | 11 (3.2%) | 0 (0.0%) |
| 45 to 54 Years | 9 (2.8%) | 0 (0.0%) |
| 55 to 64 Years | 1 (0.3%) | 0 (0.0%) |
| 65 to 74 Years | 13 (4.7%) | 13 (3.9%) |
| 75 Years and over | 0 (0.0%) | 9 (4.1%) |
| Total | 81 (3.7%) | 94 (3.7%) |
Income Above Poverty by Sex and Age in Lake Pocotopaug
According to the poverty statistics in Lake Pocotopaug, males aged under 5 years and females aged 5 years are the age groups that are most secure financially, with 100.0% of males and 100.0% of females in these age groups living above the poverty line.
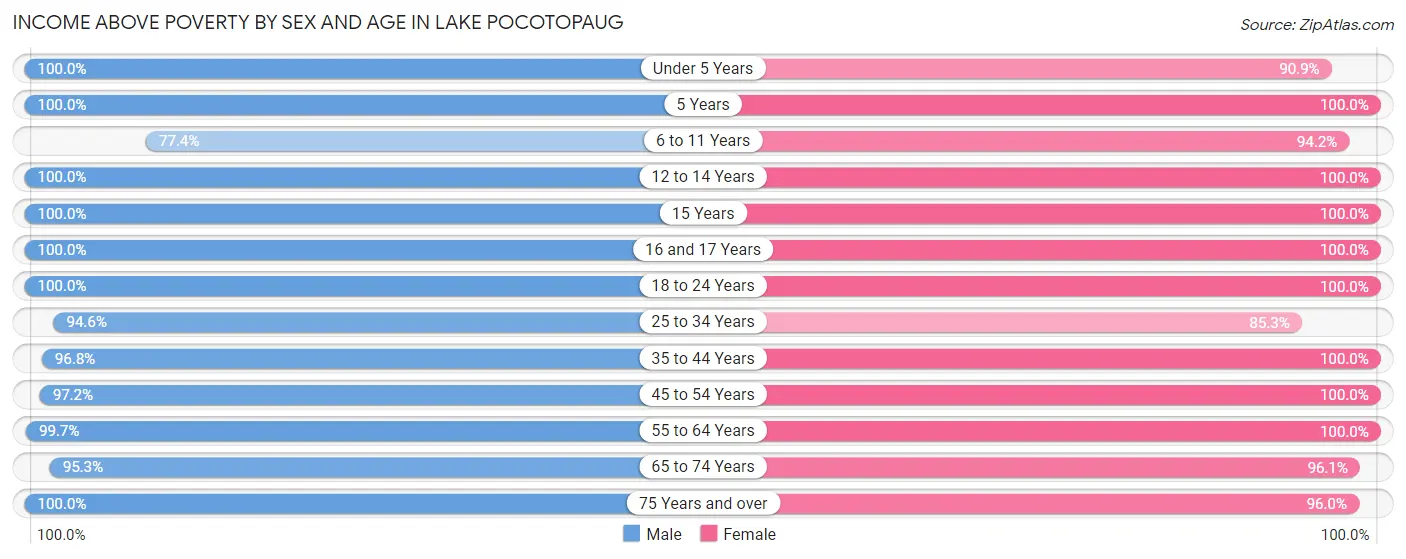
| Age Bracket | Male | Female |
| Under 5 Years | 89 (100.0%) | 259 (90.9%) |
| 5 Years | 37 (100.0%) | 47 (100.0%) |
| 6 to 11 Years | 127 (77.4%) | 113 (94.2%) |
| 12 to 14 Years | 59 (100.0%) | 54 (100.0%) |
| 15 Years | 34 (100.0%) | 28 (100.0%) |
| 16 and 17 Years | 54 (100.0%) | 115 (100.0%) |
| 18 to 24 Years | 135 (100.0%) | 130 (100.0%) |
| 25 to 34 Years | 176 (94.6%) | 227 (85.3%) |
| 35 to 44 Years | 331 (96.8%) | 269 (100.0%) |
| 45 to 54 Years | 309 (97.2%) | 324 (100.0%) |
| 55 to 64 Years | 361 (99.7%) | 351 (100.0%) |
| 65 to 74 Years | 265 (95.3%) | 323 (96.1%) |
| 75 Years and over | 156 (100.0%) | 213 (96.0%) |
| Total | 2,133 (96.3%) | 2,453 (96.3%) |
Income Below Poverty Among Married-Couple Families in Lake Pocotopaug
The poverty statistics for married-couple families in Lake Pocotopaug show that 1.3% or 13 of the total 1,001 families live below the poverty line. Families with no children have the highest poverty rate of 2.5%, comprising of 13 families. On the other hand, families with 1 or 2 children have the lowest poverty rate of 0.0%, which includes 0 families.
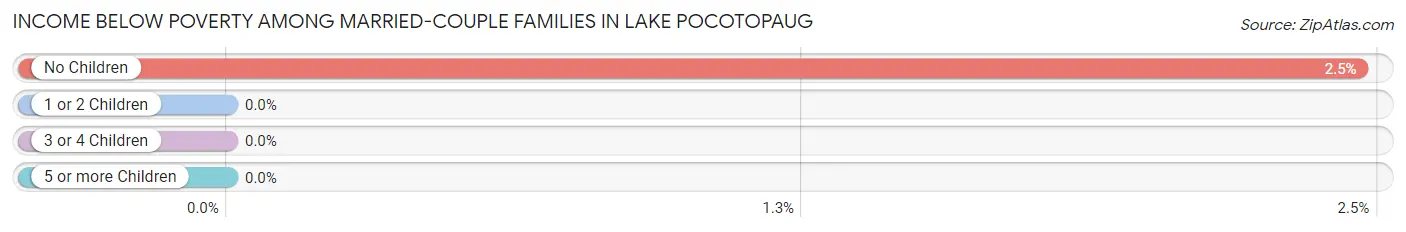
| Children | Above Poverty | Below Poverty |
| No Children | 515 (97.5%) | 13 (2.5%) |
| 1 or 2 Children | 355 (100.0%) | 0 (0.0%) |
| 3 or 4 Children | 96 (100.0%) | 0 (0.0%) |
| 5 or more Children | 22 (100.0%) | 0 (0.0%) |
| Total | 988 (98.7%) | 13 (1.3%) |
Income Below Poverty Among Single-Parent Households in Lake Pocotopaug
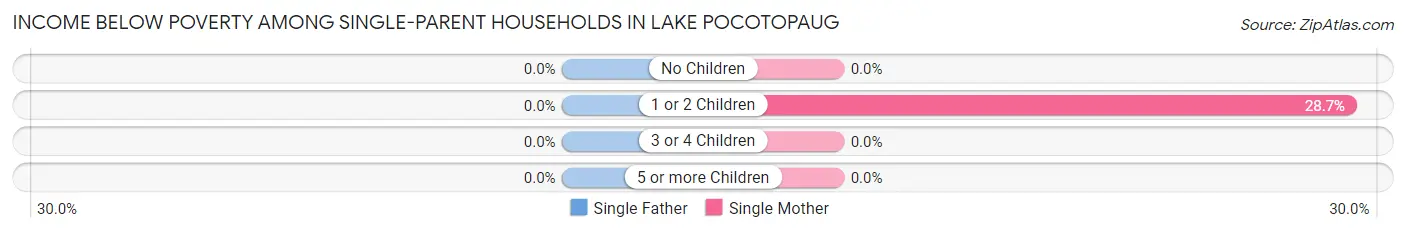
| Children | Single Father | Single Mother |
| No Children | 0 (0.0%) | 0 (0.0%) |
| 1 or 2 Children | 0 (0.0%) | 39 (28.7%) |
| 3 or 4 Children | 0 (0.0%) | 0 (0.0%) |
| 5 or more Children | 0 (0.0%) | 0 (0.0%) |
| Total | 0 (0.0%) | 39 (16.8%) |
Income Below Poverty Among Married-Couple vs Single-Parent Households in Lake Pocotopaug
The poverty data for Lake Pocotopaug shows that 13 of the married-couple family households (1.3%) and 39 of the single-parent households (14.0%) are living below the poverty level. Within the married-couple family households, those with no children have the highest poverty rate, with 13 households (2.5%) falling below the poverty line. Among the single-parent households, those with 1 or 2 children have the highest poverty rate, with 39 household (26.0%) living below poverty.
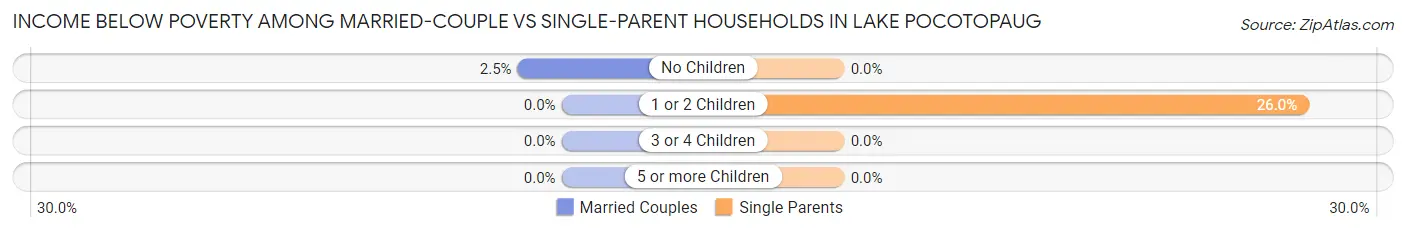
| Children | Married-Couple Families | Single-Parent Households |
| No Children | 13 (2.5%) | 0 (0.0%) |
| 1 or 2 Children | 0 (0.0%) | 39 (26.0%) |
| 3 or 4 Children | 0 (0.0%) | 0 (0.0%) |
| 5 or more Children | 0 (0.0%) | 0 (0.0%) |
| Total | 13 (1.3%) | 39 (14.0%) |
Race in Lake Pocotopaug
The most populous races in Lake Pocotopaug are White / Caucasian (4,279 | 89.9%), Two or more Races (235 | 4.9%), and Asian (208 | 4.4%).
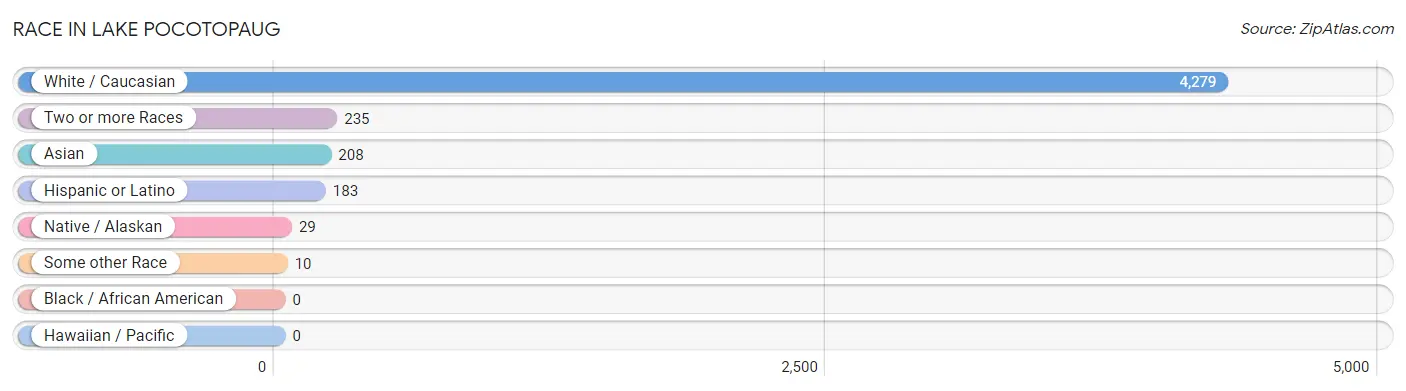
| Race | # Population | % Population |
| Asian | 208 | 4.4% |
| Black / African American | 0 | 0.0% |
| Hawaiian / Pacific | 0 | 0.0% |
| Hispanic or Latino | 183 | 3.8% |
| Native / Alaskan | 29 | 0.6% |
| White / Caucasian | 4,279 | 89.9% |
| Two or more Races | 235 | 4.9% |
| Some other Race | 10 | 0.2% |
| Total | 4,761 | 100.0% |
Ancestry in Lake Pocotopaug
The most populous ancestries reported in Lake Pocotopaug are Italian (1,034 | 21.7%), Irish (677 | 14.2%), English (565 | 11.9%), German (442 | 9.3%), and Polish (356 | 7.5%), together accounting for 64.6% of all Lake Pocotopaug residents.
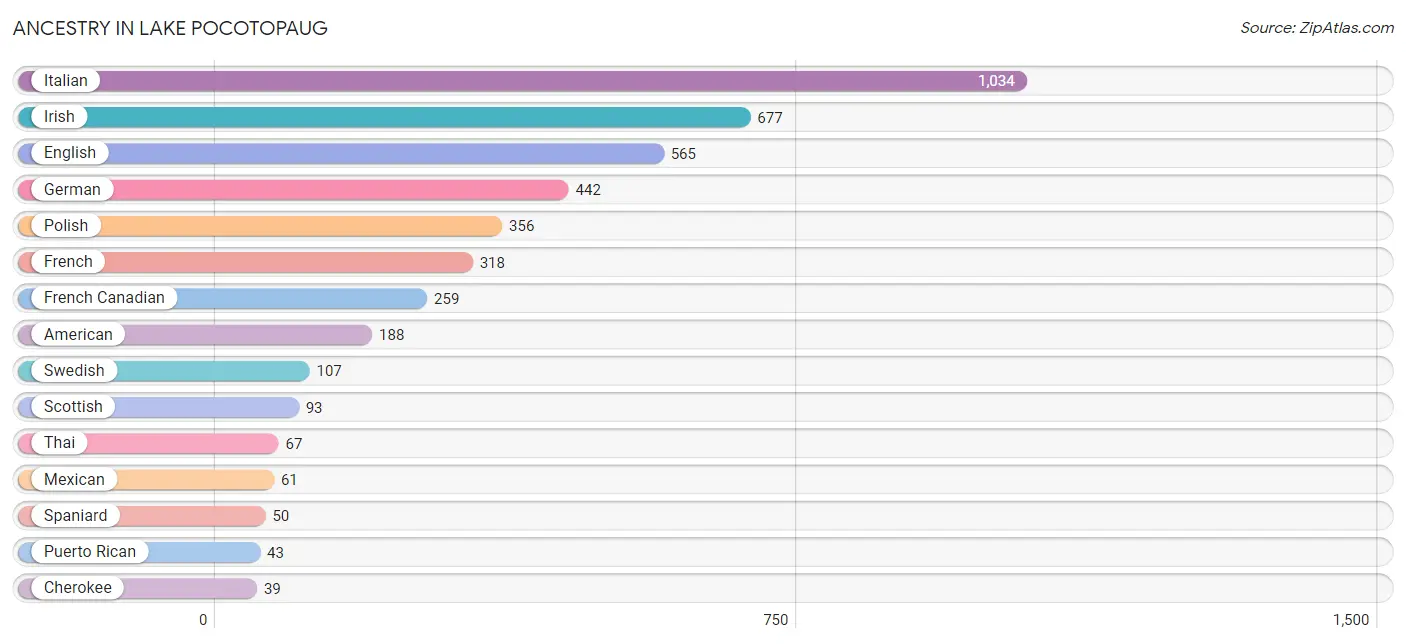
| Ancestry | # Population | % Population |
| American | 188 | 4.0% |
| Arab | 37 | 0.8% |
| Austrian | 9 | 0.2% |
| British | 21 | 0.4% |
| Central American Indian | 21 | 0.4% |
| Cherokee | 39 | 0.8% |
| Creek | 12 | 0.3% |
| Czech | 26 | 0.5% |
| Danish | 36 | 0.8% |
| Dutch | 7 | 0.2% |
| Eastern European | 12 | 0.3% |
| Egyptian | 16 | 0.3% |
| English | 565 | 11.9% |
| European | 21 | 0.4% |
| Finnish | 39 | 0.8% |
| French | 318 | 6.7% |
| French Canadian | 259 | 5.4% |
| German | 442 | 9.3% |
| Greek | 32 | 0.7% |
| Hungarian | 18 | 0.4% |
| Indian (Asian) | 7 | 0.2% |
| Irish | 677 | 14.2% |
| Italian | 1,034 | 21.7% |
| Korean | 16 | 0.3% |
| Lebanese | 21 | 0.4% |
| Lithuanian | 20 | 0.4% |
| Mexican | 61 | 1.3% |
| Norwegian | 26 | 0.5% |
| Polish | 356 | 7.5% |
| Portuguese | 9 | 0.2% |
| Puerto Rican | 43 | 0.9% |
| Russian | 8 | 0.2% |
| Scandinavian | 10 | 0.2% |
| Scotch-Irish | 28 | 0.6% |
| Scottish | 93 | 1.9% |
| Slovak | 27 | 0.6% |
| Spaniard | 50 | 1.1% |
| Swedish | 107 | 2.2% |
| Thai | 67 | 1.4% | View All 39 Rows |
Immigrants in Lake Pocotopaug
The most numerous immigrant groups reported in Lake Pocotopaug came from Europe (125 | 2.6%), Asia (124 | 2.6%), South Central Asia (101 | 2.1%), Eastern Europe (83 | 1.7%), and Poland (83 | 1.7%), together accounting for 10.8% of all Lake Pocotopaug residents.
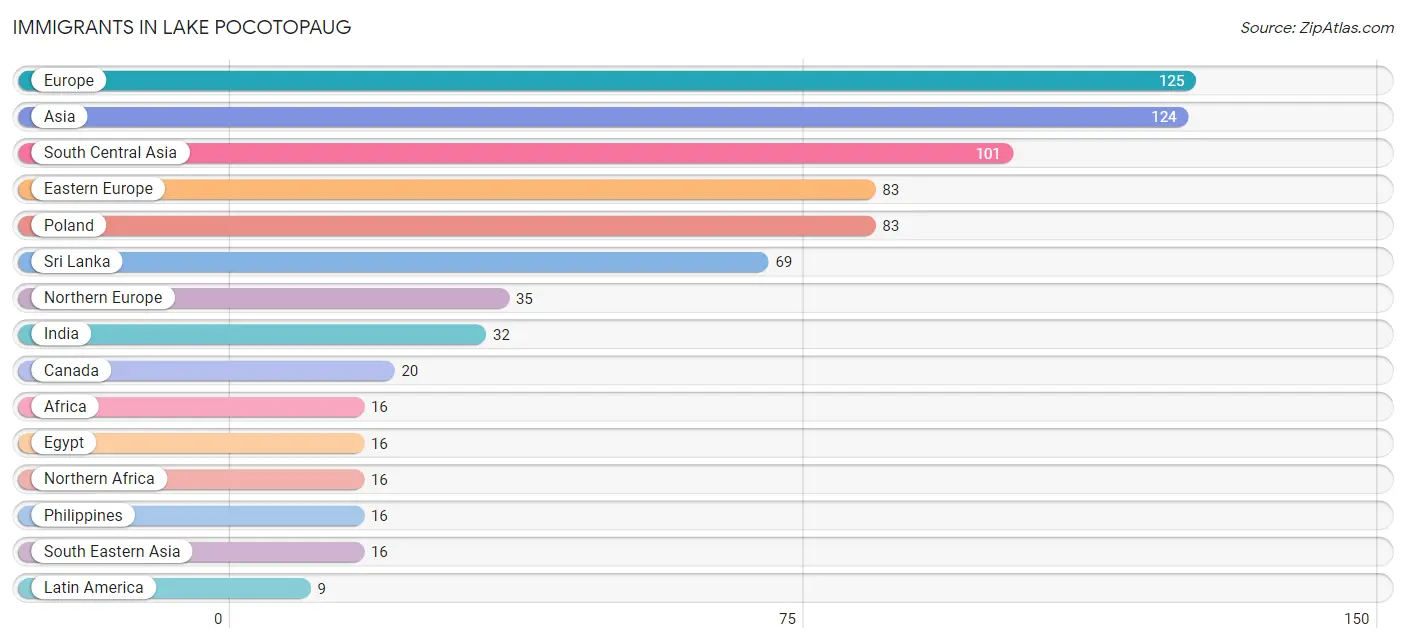
| Immigration Origin | # Population | % Population |
| Africa | 16 | 0.3% |
| Asia | 124 | 2.6% |
| Canada | 20 | 0.4% |
| China | 7 | 0.2% |
| Eastern Asia | 7 | 0.2% |
| Eastern Europe | 83 | 1.7% |
| Egypt | 16 | 0.3% |
| England | 2 | 0.0% |
| Europe | 125 | 2.6% |
| India | 32 | 0.7% |
| Latin America | 9 | 0.2% |
| Netherlands | 7 | 0.2% |
| Northern Africa | 16 | 0.3% |
| Northern Europe | 35 | 0.7% |
| Philippines | 16 | 0.3% |
| Poland | 83 | 1.7% |
| South America | 9 | 0.2% |
| South Central Asia | 101 | 2.1% |
| South Eastern Asia | 16 | 0.3% |
| Sri Lanka | 69 | 1.5% |
| Venezuela | 9 | 0.2% |
| Western Europe | 7 | 0.2% | View All 22 Rows |
Sex and Age in Lake Pocotopaug
Sex and Age in Lake Pocotopaug
The most populous age groups in Lake Pocotopaug are 50 to 54 Years (229 | 10.3%) for men and Under 5 Years (285 | 11.2%) for women.
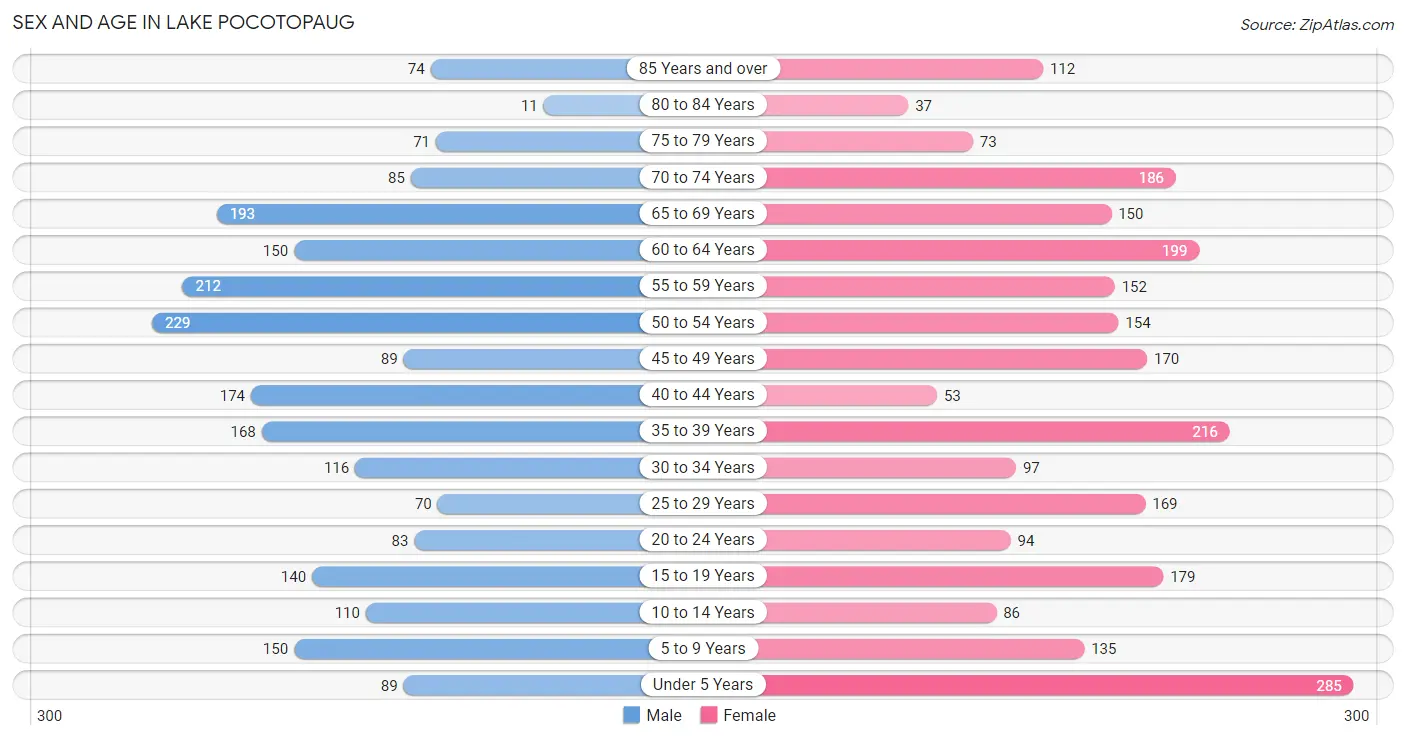
| Age Bracket | Male | Female |
| Under 5 Years | 89 (4.0%) | 285 (11.2%) |
| 5 to 9 Years | 150 (6.8%) | 135 (5.3%) |
| 10 to 14 Years | 110 (5.0%) | 86 (3.4%) |
| 15 to 19 Years | 140 (6.3%) | 179 (7.0%) |
| 20 to 24 Years | 83 (3.7%) | 94 (3.7%) |
| 25 to 29 Years | 70 (3.2%) | 169 (6.6%) |
| 30 to 34 Years | 116 (5.2%) | 97 (3.8%) |
| 35 to 39 Years | 168 (7.6%) | 216 (8.5%) |
| 40 to 44 Years | 174 (7.9%) | 53 (2.1%) |
| 45 to 49 Years | 89 (4.0%) | 170 (6.7%) |
| 50 to 54 Years | 229 (10.3%) | 154 (6.0%) |
| 55 to 59 Years | 212 (9.6%) | 152 (6.0%) |
| 60 to 64 Years | 150 (6.8%) | 199 (7.8%) |
| 65 to 69 Years | 193 (8.7%) | 150 (5.9%) |
| 70 to 74 Years | 85 (3.8%) | 186 (7.3%) |
| 75 to 79 Years | 71 (3.2%) | 73 (2.9%) |
| 80 to 84 Years | 11 (0.5%) | 37 (1.5%) |
| 85 Years and over | 74 (3.3%) | 112 (4.4%) |
| Total | 2,214 (100.0%) | 2,547 (100.0%) |
Families and Households in Lake Pocotopaug
Median Family Size in Lake Pocotopaug
The median family size in Lake Pocotopaug is 3.09 persons per family, with married-couple families (1,001 | 78.3%) accounting for the largest median family size of 3.28 persons per family. On the other hand, single female/mother families (232 | 18.1%) represent the smallest median family size with 2.34 persons per family.
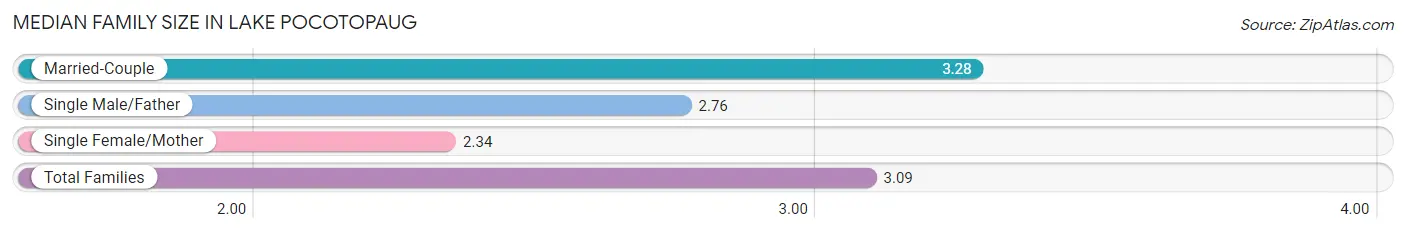
| Family Type | # Families | Family Size |
| Married-Couple | 1,001 (78.3%) | 3.28 |
| Single Male/Father | 46 (3.6%) | 2.76 |
| Single Female/Mother | 232 (18.1%) | 2.34 |
| Total Families | 1,279 (100.0%) | 3.09 |
Median Household Size in Lake Pocotopaug
The median household size in Lake Pocotopaug is 2.42 persons per household, with single male/father households (46 | 2.3%) accounting for the largest median household size of 3.72 persons per household. non-family households (684 | 34.8%) represent the smallest median household size with 1.01 persons per household.
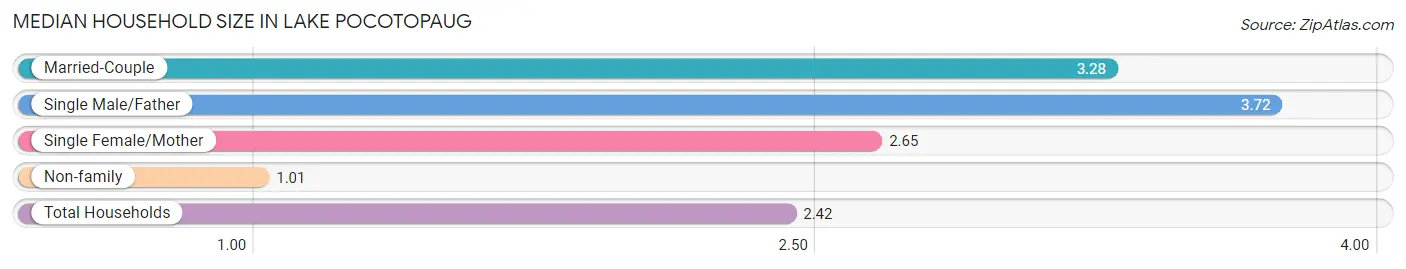
| Household Type | # Households | Household Size |
| Married-Couple | 1,001 (51.0%) | 3.28 |
| Single Male/Father | 46 (2.3%) | 3.72 |
| Single Female/Mother | 232 (11.8%) | 2.65 |
| Non-family | 684 (34.8%) | 1.01 |
| Total Households | 1,963 (100.0%) | 2.42 |
Household Size by Marriage Status in Lake Pocotopaug
Out of a total of 1,963 households in Lake Pocotopaug, 1,279 (65.2%) are family households, while 684 (34.8%) are nonfamily households. The most numerous type of family households are 2-person households, comprising 500, and the most common type of nonfamily households are 1-person households, comprising 670.
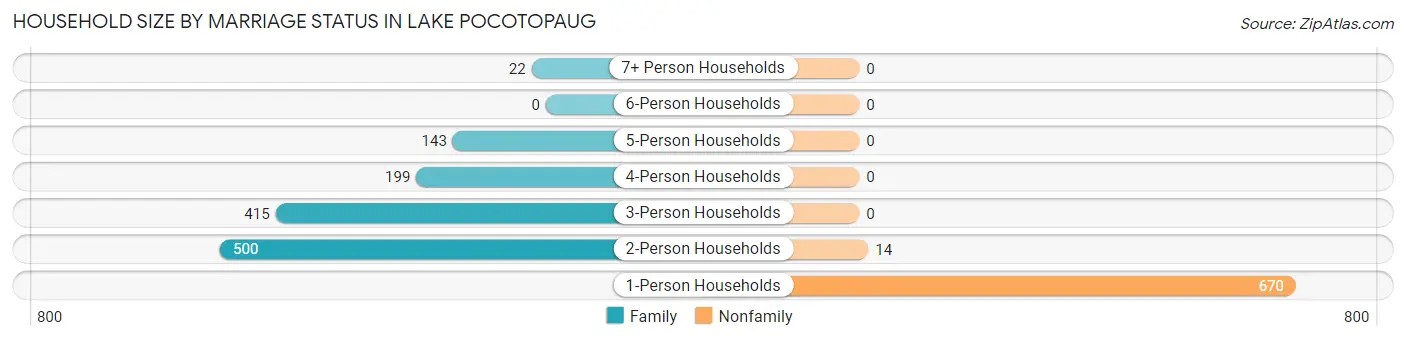
| Household Size | Family Households | Nonfamily Households |
| 1-Person Households | - | 670 (34.1%) |
| 2-Person Households | 500 (25.5%) | 14 (0.7%) |
| 3-Person Households | 415 (21.1%) | 0 (0.0%) |
| 4-Person Households | 199 (10.1%) | 0 (0.0%) |
| 5-Person Households | 143 (7.3%) | 0 (0.0%) |
| 6-Person Households | 0 (0.0%) | 0 (0.0%) |
| 7+ Person Households | 22 (1.1%) | 0 (0.0%) |
| Total | 1,279 (65.2%) | 684 (34.8%) |
Female Fertility in Lake Pocotopaug
Fertility by Age in Lake Pocotopaug
Average fertility rate in Lake Pocotopaug is 79.0 births per 1,000 women. Women in the age bracket of 35 to 50 years have the highest fertility rate with 97.0 births per 1,000 women. Women in the age bracket of 35 to 50 years acount for 58.5% of all women with births.
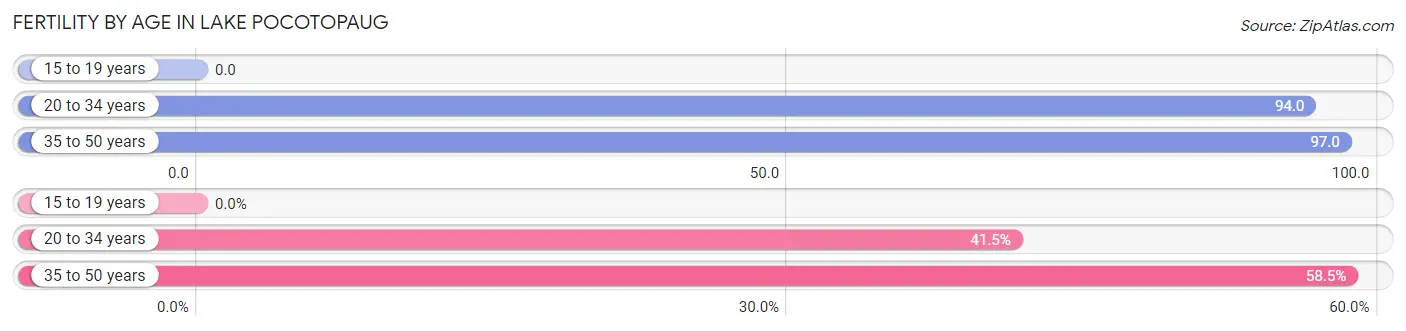
| Age Bracket | Women with Births | Births / 1,000 Women |
| 15 to 19 years | 0 (0.0%) | 0.0 |
| 20 to 34 years | 34 (41.5%) | 94.0 |
| 35 to 50 years | 48 (58.5%) | 97.0 |
| Total | 82 (100.0%) | 79.0 |
Fertility by Age by Marriage Status in Lake Pocotopaug
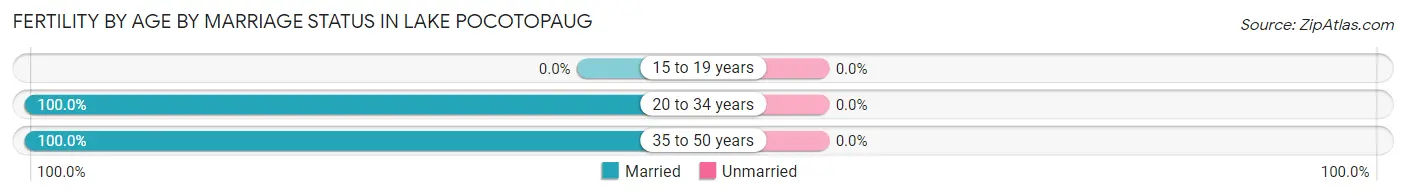
| Age Bracket | Married | Unmarried |
| 15 to 19 years | 0 (0.0%) | 0 (0.0%) |
| 20 to 34 years | 34 (100.0%) | 0 (0.0%) |
| 35 to 50 years | 48 (100.0%) | 0 (0.0%) |
| Total | 82 (100.0%) | 0 (0.0%) |
Fertility by Education in Lake Pocotopaug
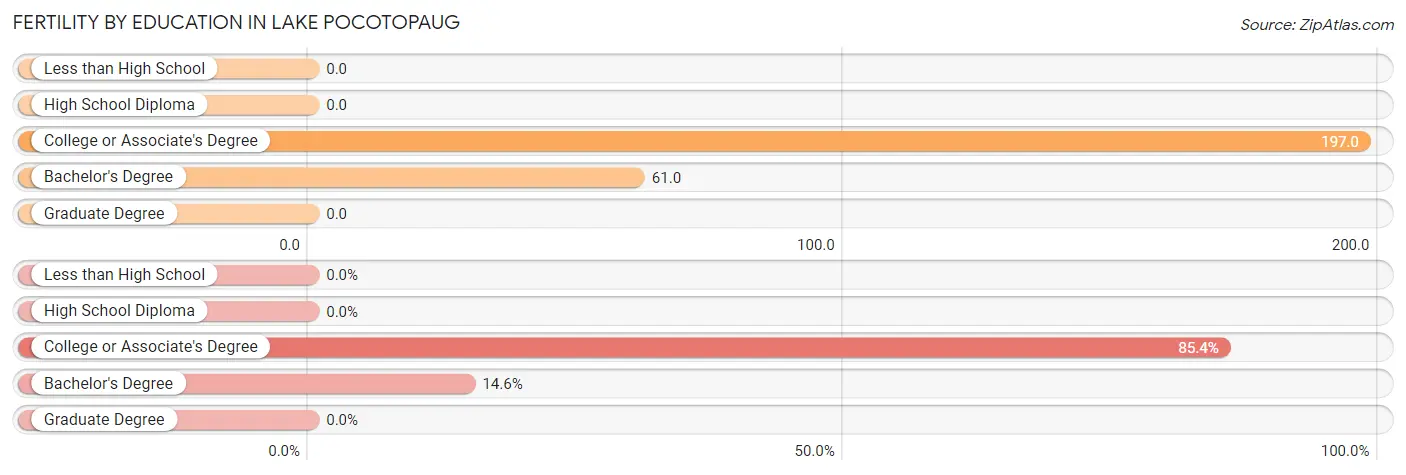
| Educational Attainment | Women with Births | Births / 1,000 Women |
| Less than High School | 0 (0.0%) | 0.0 |
| High School Diploma | 0 (0.0%) | 0.0 |
| College or Associate's Degree | 70 (85.4%) | 197.0 |
| Bachelor's Degree | 12 (14.6%) | 61.0 |
| Graduate Degree | 0 (0.0%) | 0.0 |
| Total | 82 (100.0%) | 79.0 |
Fertility by Education by Marriage Status in Lake Pocotopaug
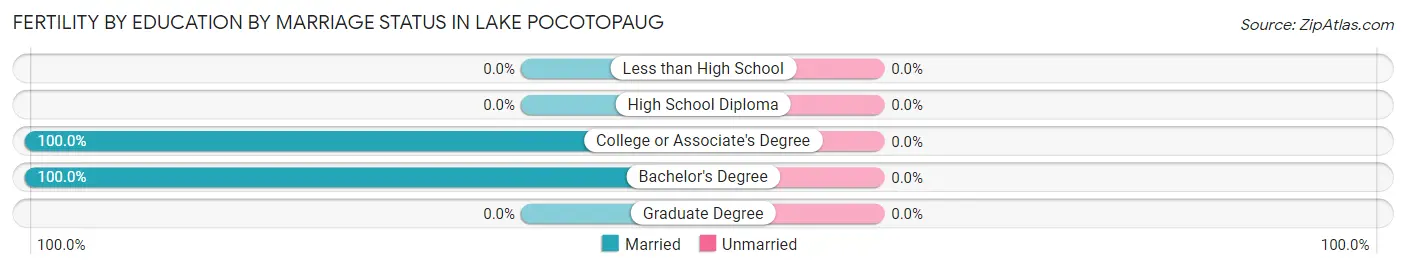
| Educational Attainment | Married | Unmarried |
| Less than High School | 0 (0.0%) | 0 (0.0%) |
| High School Diploma | 0 (0.0%) | 0 (0.0%) |
| College or Associate's Degree | 70 (100.0%) | 0 (0.0%) |
| Bachelor's Degree | 12 (100.0%) | 0 (0.0%) |
| Graduate Degree | 0 (0.0%) | 0 (0.0%) |
| Total | 82 (100.0%) | 0 (0.0%) |
Employment Characteristics in Lake Pocotopaug
Employment by Class of Employer in Lake Pocotopaug
Among the 2,173 employed individuals in Lake Pocotopaug, private company employees (1,762 | 81.1%), state government employees (143 | 6.6%), and local government employees (100 | 4.6%) make up the most common classes of employment.
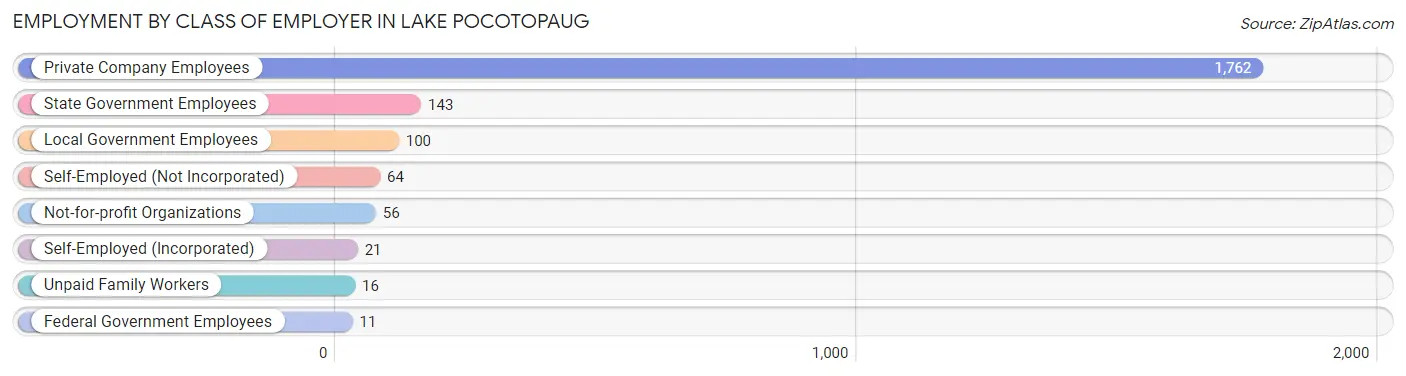
| Employer Class | # Employees | % Employees |
| Private Company Employees | 1,762 | 81.1% |
| Self-Employed (Incorporated) | 21 | 1.0% |
| Self-Employed (Not Incorporated) | 64 | 2.9% |
| Not-for-profit Organizations | 56 | 2.6% |
| Local Government Employees | 100 | 4.6% |
| State Government Employees | 143 | 6.6% |
| Federal Government Employees | 11 | 0.5% |
| Unpaid Family Workers | 16 | 0.7% |
| Total | 2,173 | 100.0% |
Employment Status by Age in Lake Pocotopaug
According to the labor force statistics for Lake Pocotopaug, out of the total population over 16 years of age (3,844), 64.0% or 2,460 individuals are in the labor force, with 5.3% or 130 of them unemployed. The age group with the highest labor force participation rate is 45 to 54 years, with 96.6% or 620 individuals in the labor force. Within the labor force, the 30 to 34 years age range has the highest percentage of unemployed individuals, with 18.7% or 32 of them being unemployed.
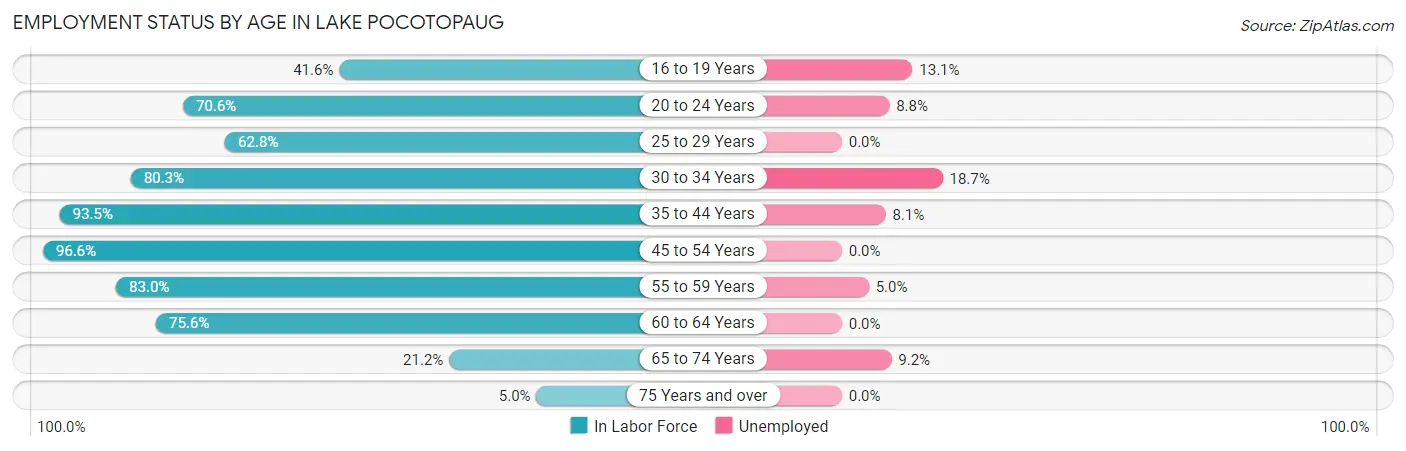
| Age Bracket | In Labor Force | Unemployed |
| 16 to 19 Years | 107 (41.6%) | 14 (13.1%) |
| 20 to 24 Years | 125 (70.6%) | 11 (8.8%) |
| 25 to 29 Years | 150 (62.8%) | 0 (0.0%) |
| 30 to 34 Years | 171 (80.3%) | 32 (18.7%) |
| 35 to 44 Years | 571 (93.5%) | 46 (8.1%) |
| 45 to 54 Years | 620 (96.6%) | 0 (0.0%) |
| 55 to 59 Years | 302 (83.0%) | 15 (5.0%) |
| 60 to 64 Years | 264 (75.6%) | 0 (0.0%) |
| 65 to 74 Years | 130 (21.2%) | 12 (9.2%) |
| 75 Years and over | 19 (5.0%) | 0 (0.0%) |
| Total | 2,460 (64.0%) | 130 (5.3%) |
Employment Status by Educational Attainment in Lake Pocotopaug
According to labor force statistics for Lake Pocotopaug, 85.9% of individuals (2,077) out of the total population between 25 and 64 years of age (2,418) are in the labor force, with 4.5% or 93 of them being unemployed. The group with the highest labor force participation rate are those with the educational attainment of bachelor's degree or higher, with 93.1% or 856 individuals in the labor force. Within the labor force, individuals with bachelor's degree or higher education have the highest percentage of unemployment, with 7.1% or 61 of them being unemployed.
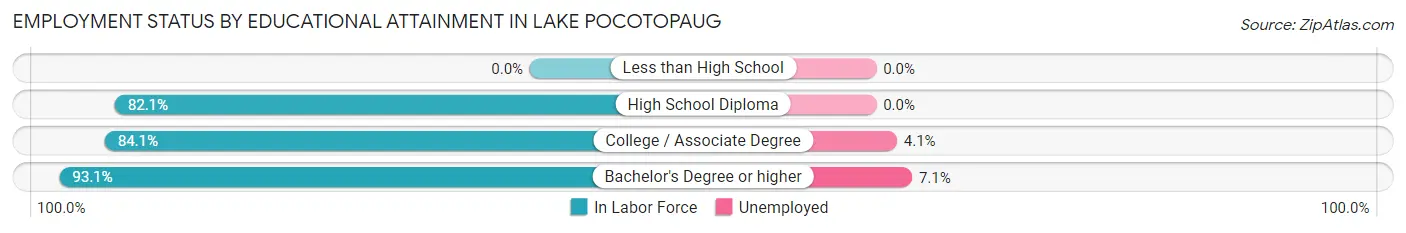
| Educational Attainment | In Labor Force | Unemployed |
| Less than High School | 0 (0.0%) | 0 (0.0%) |
| High School Diploma | 432 (82.1%) | 0 (0.0%) |
| College / Associate Degree | 790 (84.1%) | 38 (4.1%) |
| Bachelor's Degree or higher | 856 (93.1%) | 65 (7.1%) |
| Total | 2,077 (85.9%) | 109 (4.5%) |
Employment Occupations by Sex in Lake Pocotopaug
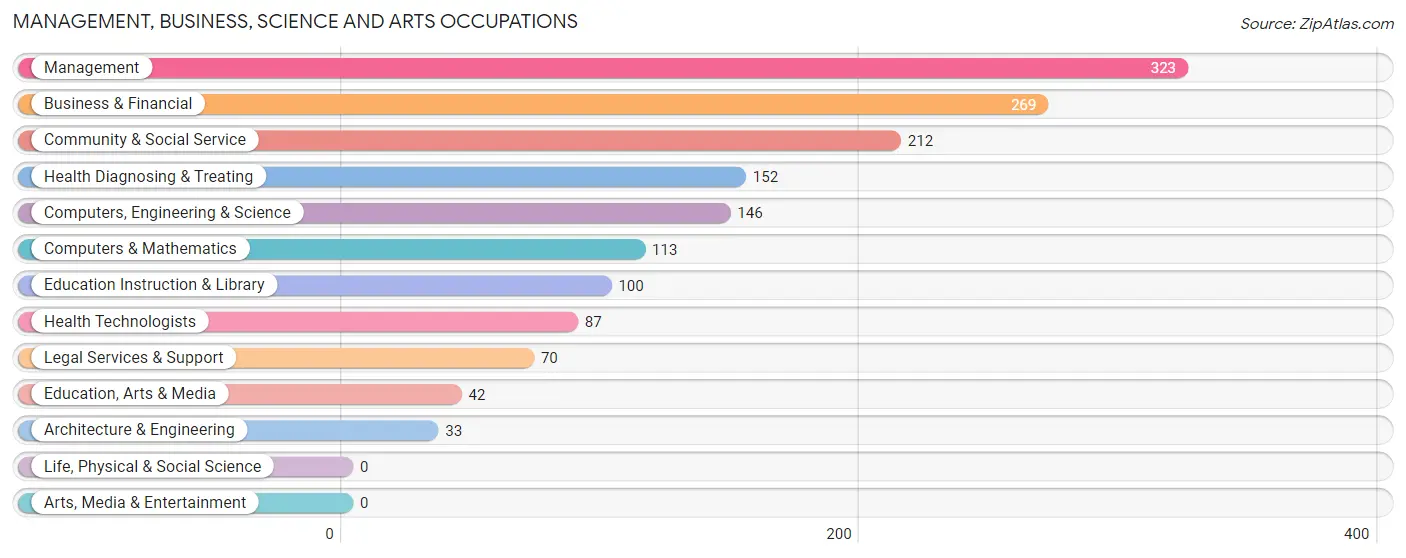
Management, Business, Science and Arts Occupations
The most common Management, Business, Science and Arts occupations in Lake Pocotopaug are Management (323 | 13.9%), Business & Financial (269 | 11.6%), Community & Social Service (212 | 9.1%), Health Diagnosing & Treating (152 | 6.5%), and Computers, Engineering & Science (146 | 6.3%).
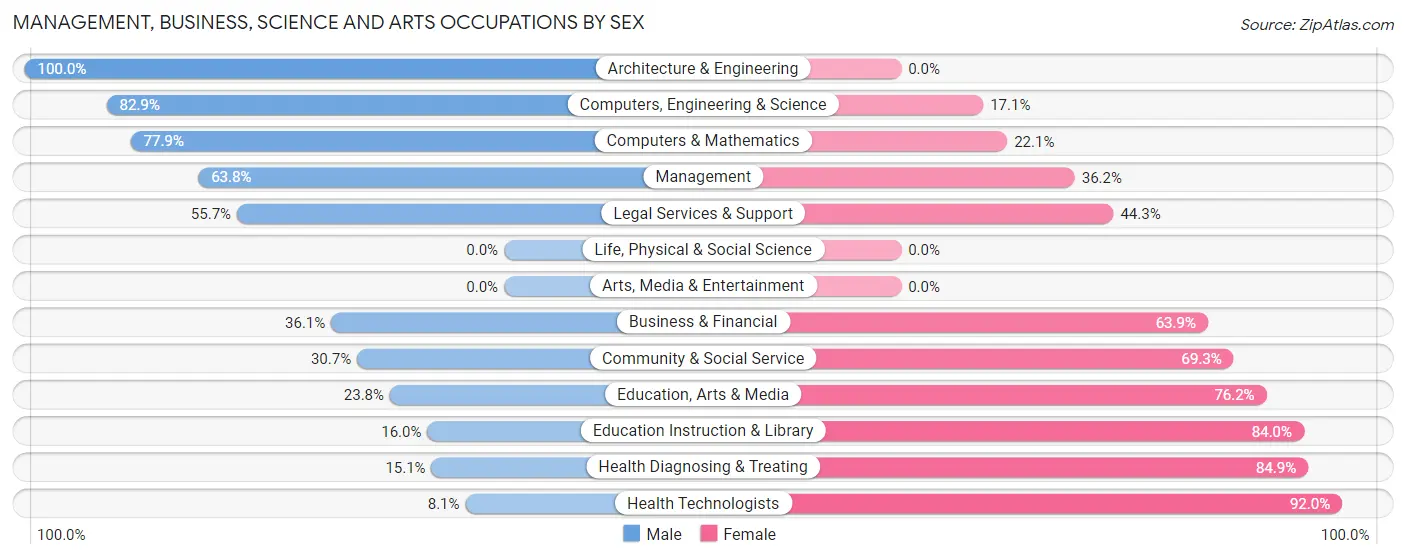
Management, Business, Science and Arts Occupations by Sex
Within the Management, Business, Science and Arts occupations in Lake Pocotopaug, the most male-oriented occupations are Architecture & Engineering (100.0%), Computers, Engineering & Science (82.9%), and Computers & Mathematics (77.9%), while the most female-oriented occupations are Health Technologists (91.9%), Health Diagnosing & Treating (84.9%), and Education Instruction & Library (84.0%).
| Occupation | Male | Female |
| Management | 206 (63.8%) | 117 (36.2%) |
| Business & Financial | 97 (36.1%) | 172 (63.9%) |
| Computers, Engineering & Science | 121 (82.9%) | 25 (17.1%) |
| Computers & Mathematics | 88 (77.9%) | 25 (22.1%) |
| Architecture & Engineering | 33 (100.0%) | 0 (0.0%) |
| Life, Physical & Social Science | 0 (0.0%) | 0 (0.0%) |
| Community & Social Service | 65 (30.7%) | 147 (69.3%) |
| Education, Arts & Media | 10 (23.8%) | 32 (76.2%) |
| Legal Services & Support | 39 (55.7%) | 31 (44.3%) |
| Education Instruction & Library | 16 (16.0%) | 84 (84.0%) |
| Arts, Media & Entertainment | 0 (0.0%) | 0 (0.0%) |
| Health Diagnosing & Treating | 23 (15.1%) | 129 (84.9%) |
| Health Technologists | 7 (8.1%) | 80 (91.9%) |
| Total (Category) | 512 (46.5%) | 590 (53.5%) |
| Total (Overall) | 1,219 (52.3%) | 1,110 (47.7%) |
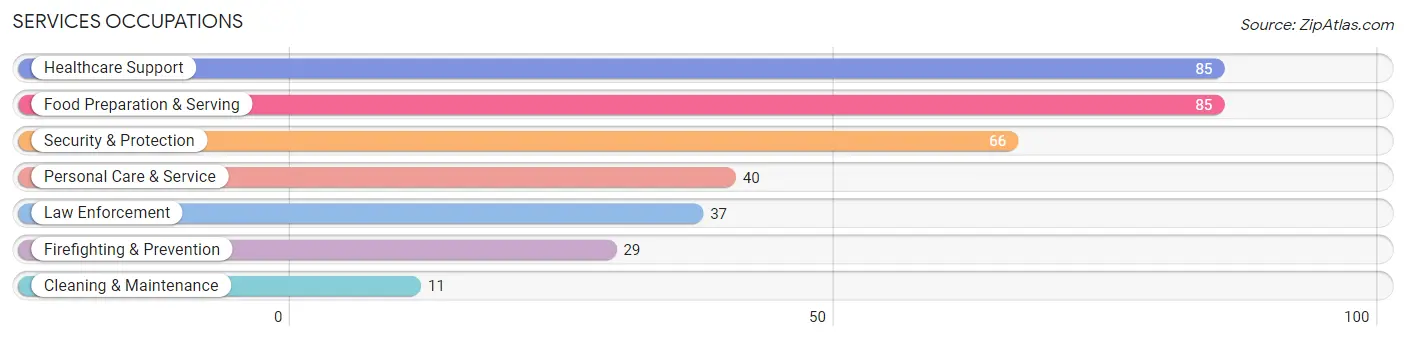
Services Occupations
The most common Services occupations in Lake Pocotopaug are Healthcare Support (85 | 3.6%), Food Preparation & Serving (85 | 3.6%), Security & Protection (66 | 2.8%), Personal Care & Service (40 | 1.7%), and Law Enforcement (37 | 1.6%).
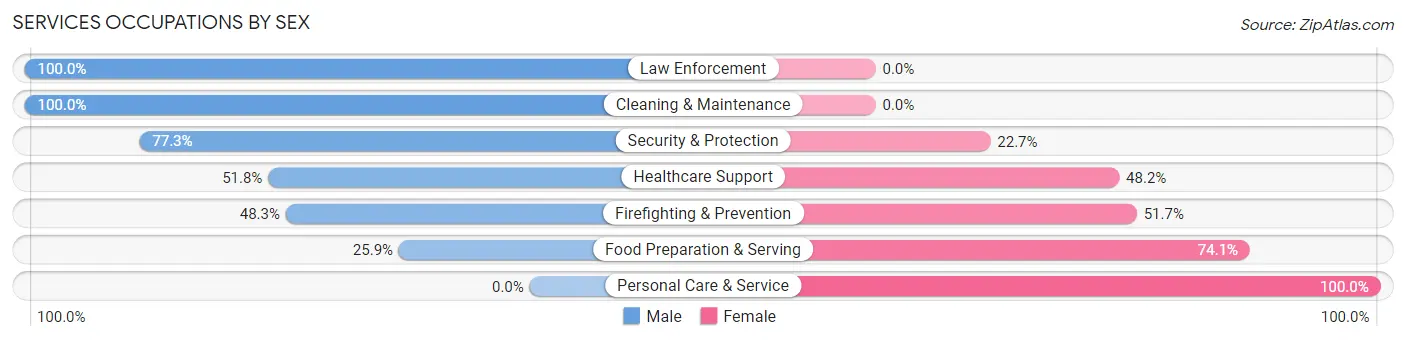
Services Occupations by Sex
Within the Services occupations in Lake Pocotopaug, the most male-oriented occupations are Law Enforcement (100.0%), Cleaning & Maintenance (100.0%), and Security & Protection (77.3%), while the most female-oriented occupations are Personal Care & Service (100.0%), Food Preparation & Serving (74.1%), and Firefighting & Prevention (51.7%).
| Occupation | Male | Female |
| Healthcare Support | 44 (51.8%) | 41 (48.2%) |
| Security & Protection | 51 (77.3%) | 15 (22.7%) |
| Firefighting & Prevention | 14 (48.3%) | 15 (51.7%) |
| Law Enforcement | 37 (100.0%) | 0 (0.0%) |
| Food Preparation & Serving | 22 (25.9%) | 63 (74.1%) |
| Cleaning & Maintenance | 11 (100.0%) | 0 (0.0%) |
| Personal Care & Service | 0 (0.0%) | 40 (100.0%) |
| Total (Category) | 128 (44.6%) | 159 (55.4%) |
| Total (Overall) | 1,219 (52.3%) | 1,110 (47.7%) |
Sales and Office Occupations
The most common Sales and Office occupations in Lake Pocotopaug are Sales & Related (319 | 13.7%), and Office & Administration (223 | 9.6%).
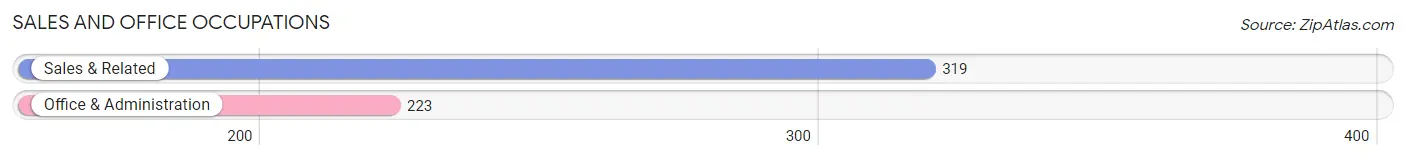
Sales and Office Occupations by Sex
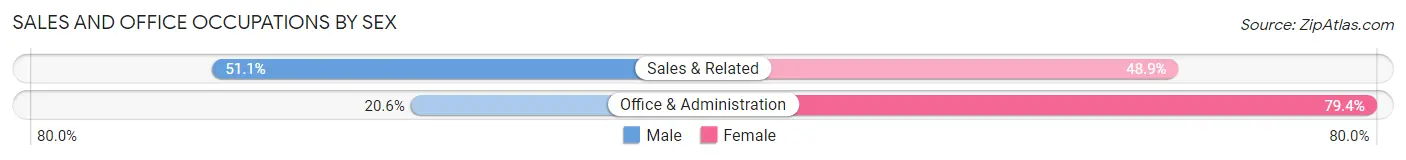
| Occupation | Male | Female |
| Sales & Related | 163 (51.1%) | 156 (48.9%) |
| Office & Administration | 46 (20.6%) | 177 (79.4%) |
| Total (Category) | 209 (38.6%) | 333 (61.4%) |
| Total (Overall) | 1,219 (52.3%) | 1,110 (47.7%) |
Natural Resources, Construction and Maintenance Occupations
The most common Natural Resources, Construction and Maintenance occupations in Lake Pocotopaug are Construction & Extraction (159 | 6.8%), and Installation, Maintenance & Repair (77 | 3.3%).
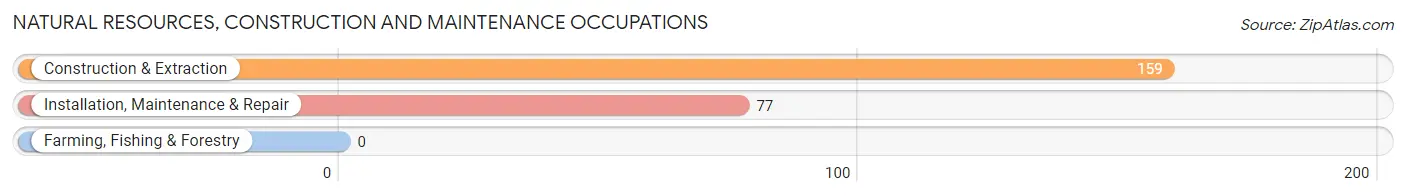
Natural Resources, Construction and Maintenance Occupations by Sex
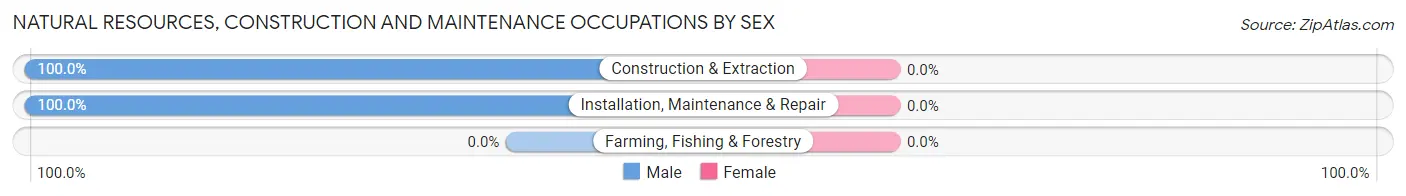
| Occupation | Male | Female |
| Farming, Fishing & Forestry | 0 (0.0%) | 0 (0.0%) |
| Construction & Extraction | 159 (100.0%) | 0 (0.0%) |
| Installation, Maintenance & Repair | 77 (100.0%) | 0 (0.0%) |
| Total (Category) | 236 (100.0%) | 0 (0.0%) |
| Total (Overall) | 1,219 (52.3%) | 1,110 (47.7%) |
Production, Transportation and Moving Occupations
The most common Production, Transportation and Moving occupations in Lake Pocotopaug are Production (157 | 6.7%), and Transportation (5 | 0.2%).
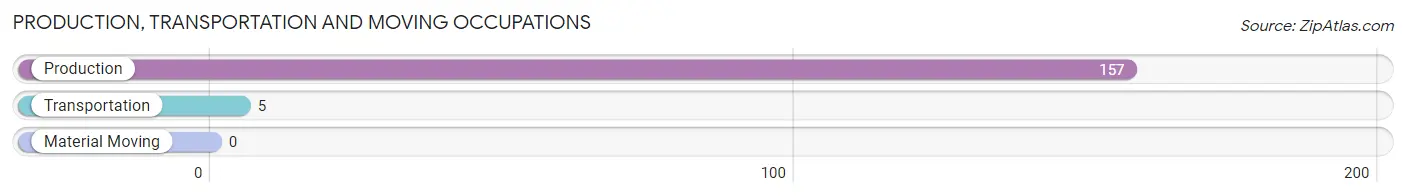
Production, Transportation and Moving Occupations by Sex
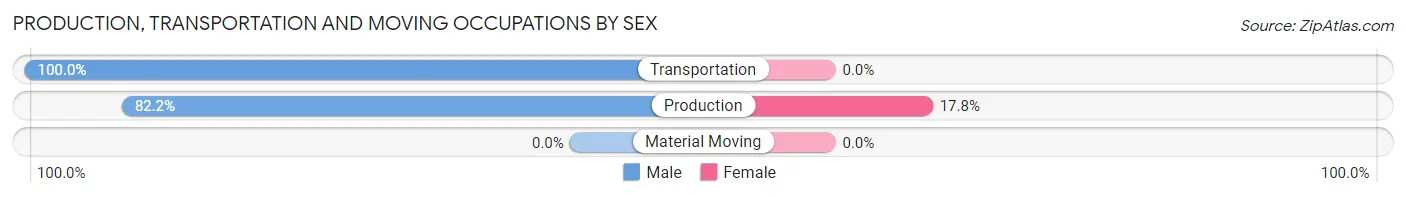
| Occupation | Male | Female |
| Production | 129 (82.2%) | 28 (17.8%) |
| Transportation | 5 (100.0%) | 0 (0.0%) |
| Material Moving | 0 (0.0%) | 0 (0.0%) |
| Total (Category) | 134 (82.7%) | 28 (17.3%) |
| Total (Overall) | 1,219 (52.3%) | 1,110 (47.7%) |
Employment Industries by Sex in Lake Pocotopaug
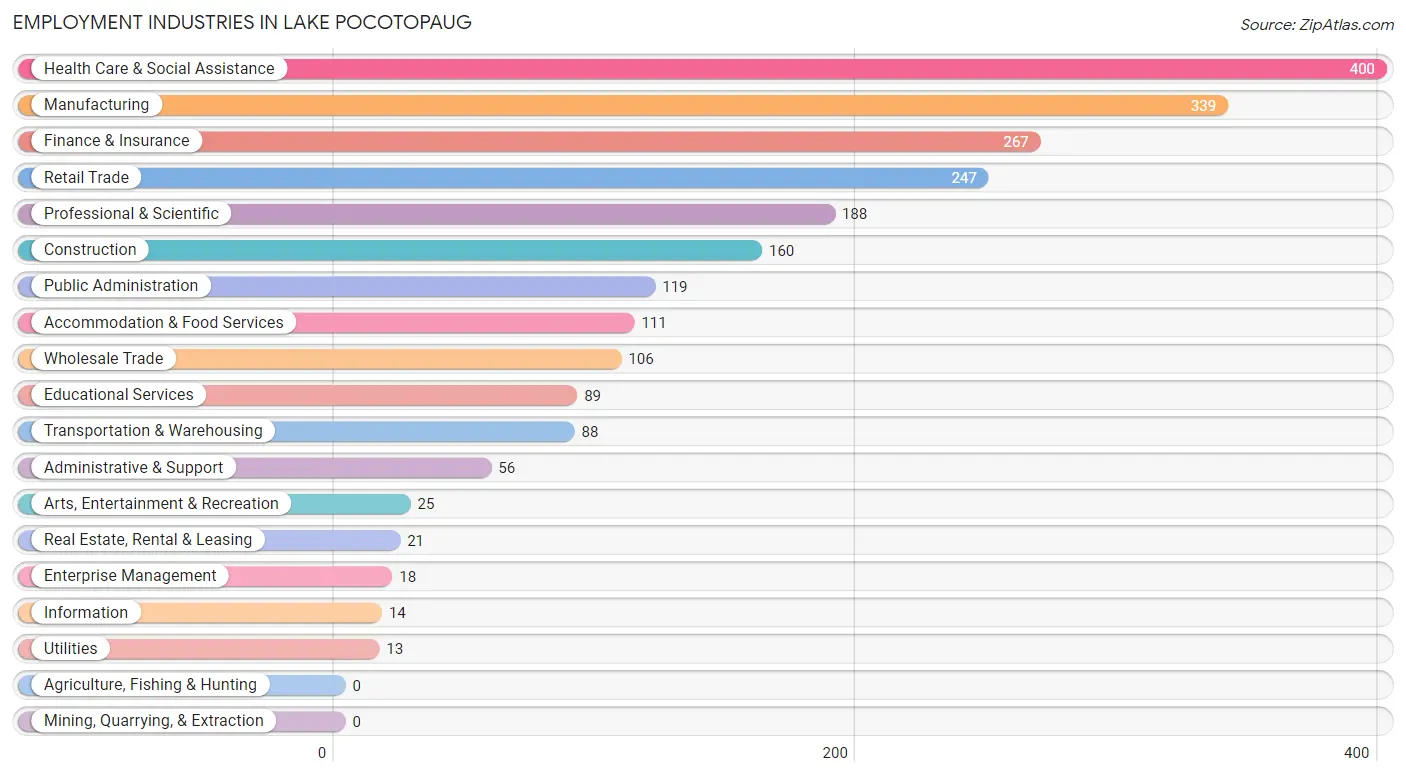
Employment Industries in Lake Pocotopaug
The major employment industries in Lake Pocotopaug include Health Care & Social Assistance (400 | 17.2%), Manufacturing (339 | 14.6%), Finance & Insurance (267 | 11.5%), Retail Trade (247 | 10.6%), and Professional & Scientific (188 | 8.1%).
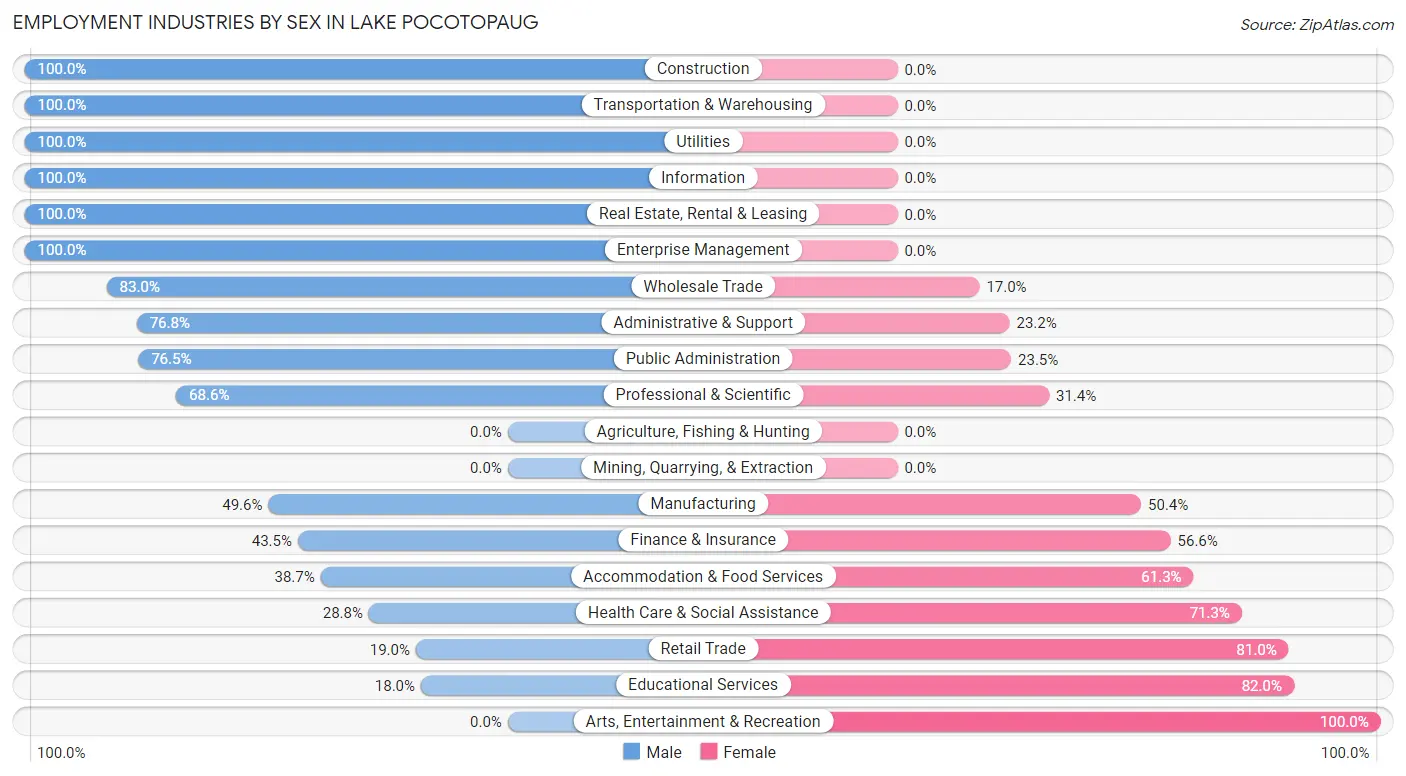
Employment Industries by Sex in Lake Pocotopaug
The Lake Pocotopaug industries that see more men than women are Construction (100.0%), Transportation & Warehousing (100.0%), and Utilities (100.0%), whereas the industries that tend to have a higher number of women are Arts, Entertainment & Recreation (100.0%), Educational Services (82.0%), and Retail Trade (81.0%).
| Industry | Male | Female |
| Agriculture, Fishing & Hunting | 0 (0.0%) | 0 (0.0%) |
| Mining, Quarrying, & Extraction | 0 (0.0%) | 0 (0.0%) |
| Construction | 160 (100.0%) | 0 (0.0%) |
| Manufacturing | 168 (49.6%) | 171 (50.4%) |
| Wholesale Trade | 88 (83.0%) | 18 (17.0%) |
| Retail Trade | 47 (19.0%) | 200 (81.0%) |
| Transportation & Warehousing | 88 (100.0%) | 0 (0.0%) |
| Utilities | 13 (100.0%) | 0 (0.0%) |
| Information | 14 (100.0%) | 0 (0.0%) |
| Finance & Insurance | 116 (43.4%) | 151 (56.6%) |
| Real Estate, Rental & Leasing | 21 (100.0%) | 0 (0.0%) |
| Professional & Scientific | 129 (68.6%) | 59 (31.4%) |
| Enterprise Management | 18 (100.0%) | 0 (0.0%) |
| Administrative & Support | 43 (76.8%) | 13 (23.2%) |
| Educational Services | 16 (18.0%) | 73 (82.0%) |
| Health Care & Social Assistance | 115 (28.7%) | 285 (71.3%) |
| Arts, Entertainment & Recreation | 0 (0.0%) | 25 (100.0%) |
| Accommodation & Food Services | 43 (38.7%) | 68 (61.3%) |
| Public Administration | 91 (76.5%) | 28 (23.5%) |
| Total | 1,219 (52.3%) | 1,110 (47.7%) |
Education in Lake Pocotopaug
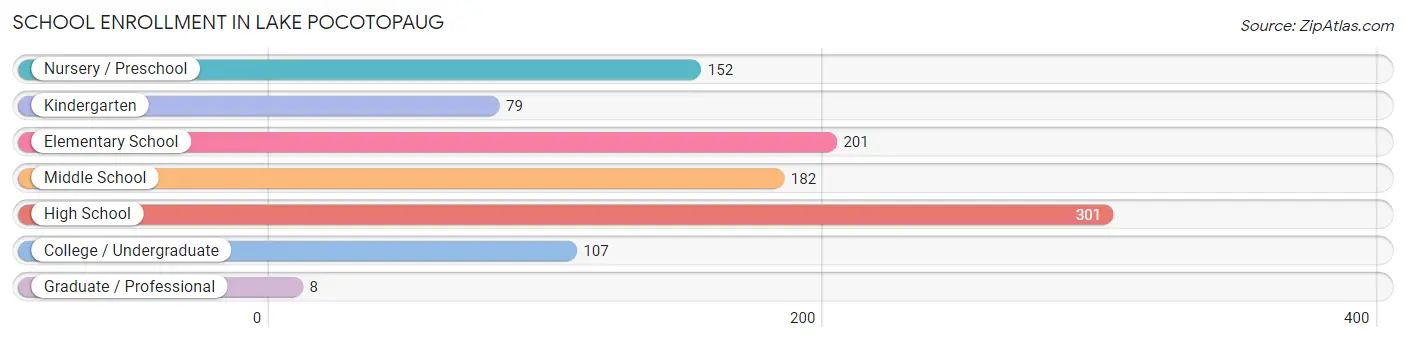
School Enrollment in Lake Pocotopaug
The most common levels of schooling among the 1,030 students in Lake Pocotopaug are high school (301 | 29.2%), elementary school (201 | 19.5%), and middle school (182 | 17.7%).
| School Level | # Students | % Students |
| Nursery / Preschool | 152 | 14.8% |
| Kindergarten | 79 | 7.7% |
| Elementary School | 201 | 19.5% |
| Middle School | 182 | 17.7% |
| High School | 301 | 29.2% |
| College / Undergraduate | 107 | 10.4% |
| Graduate / Professional | 8 | 0.8% |
| Total | 1,030 | 100.0% |
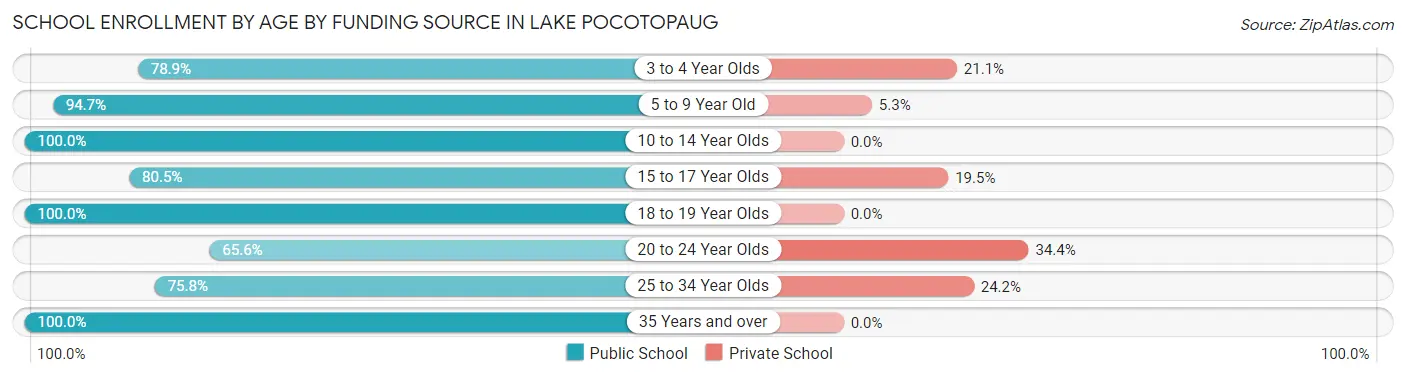
School Enrollment by Age by Funding Source in Lake Pocotopaug
Out of a total of 1,030 students who are enrolled in schools in Lake Pocotopaug, 121 (11.7%) attend a private institution, while the remaining 909 (88.3%) are enrolled in public schools. The age group of 20 to 24 year olds has the highest likelihood of being enrolled in private schools, with 21 (34.4% in the age bracket) enrolled. Conversely, the age group of 10 to 14 year olds has the lowest likelihood of being enrolled in a private school, with 196 (100.0% in the age bracket) attending a public institution.
| Age Bracket | Public School | Private School |
| 3 to 4 Year Olds | 116 (78.9%) | 31 (21.1%) |
| 5 to 9 Year Old | 270 (94.7%) | 15 (5.3%) |
| 10 to 14 Year Olds | 196 (100.0%) | 0 (0.0%) |
| 15 to 17 Year Olds | 186 (80.5%) | 45 (19.5%) |
| 18 to 19 Year Olds | 67 (100.0%) | 0 (0.0%) |
| 20 to 24 Year Olds | 40 (65.6%) | 21 (34.4%) |
| 25 to 34 Year Olds | 25 (75.8%) | 8 (24.2%) |
| 35 Years and over | 10 (100.0%) | 0 (0.0%) |
| Total | 909 (88.3%) | 121 (11.7%) |
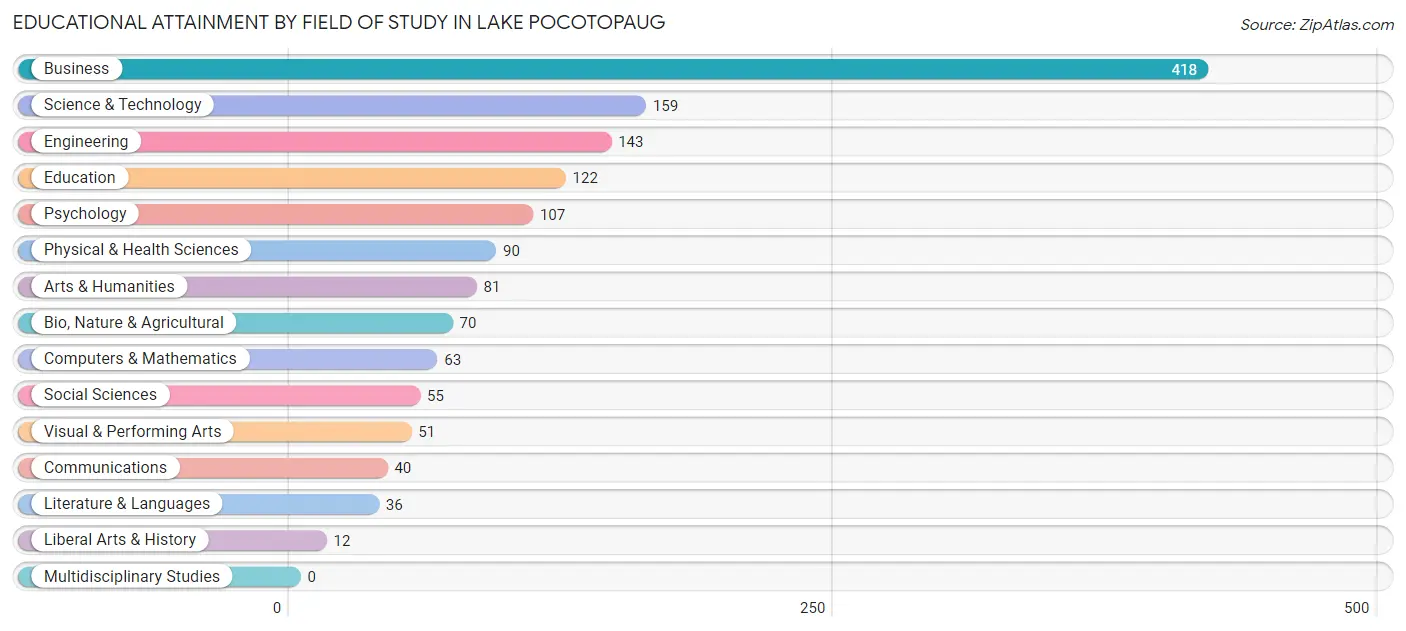
Educational Attainment by Field of Study in Lake Pocotopaug
Business (418 | 28.9%), science & technology (159 | 11.0%), engineering (143 | 9.9%), education (122 | 8.4%), and psychology (107 | 7.4%) are the most common fields of study among 1,447 individuals in Lake Pocotopaug who have obtained a bachelor's degree or higher.
| Field of Study | # Graduates | % Graduates |
| Computers & Mathematics | 63 | 4.3% |
| Bio, Nature & Agricultural | 70 | 4.8% |
| Physical & Health Sciences | 90 | 6.2% |
| Psychology | 107 | 7.4% |
| Social Sciences | 55 | 3.8% |
| Engineering | 143 | 9.9% |
| Multidisciplinary Studies | 0 | 0.0% |
| Science & Technology | 159 | 11.0% |
| Business | 418 | 28.9% |
| Education | 122 | 8.4% |
| Literature & Languages | 36 | 2.5% |
| Liberal Arts & History | 12 | 0.8% |
| Visual & Performing Arts | 51 | 3.5% |
| Communications | 40 | 2.8% |
| Arts & Humanities | 81 | 5.6% |
| Total | 1,447 | 100.0% |
Transportation & Commute in Lake Pocotopaug
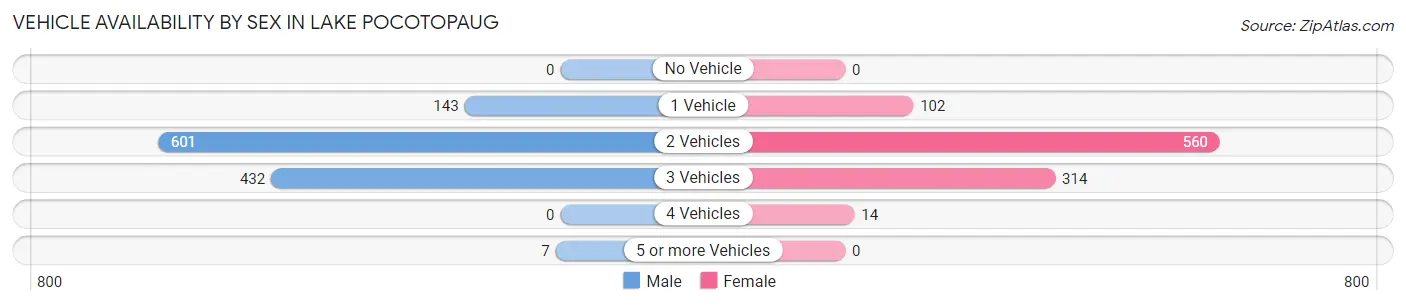
Vehicle Availability by Sex in Lake Pocotopaug
The most prevalent vehicle ownership categories in Lake Pocotopaug are males with 2 vehicles (601, accounting for 50.8%) and females with 2 vehicles (560, making up 60.7%).
| Vehicles Available | Male | Female |
| No Vehicle | 0 (0.0%) | 0 (0.0%) |
| 1 Vehicle | 143 (12.1%) | 102 (10.3%) |
| 2 Vehicles | 601 (50.8%) | 560 (56.6%) |
| 3 Vehicles | 432 (36.5%) | 314 (31.7%) |
| 4 Vehicles | 0 (0.0%) | 14 (1.4%) |
| 5 or more Vehicles | 7 (0.6%) | 0 (0.0%) |
| Total | 1,183 (100.0%) | 990 (100.0%) |
Commute Time in Lake Pocotopaug
The most frequently occuring commute durations in Lake Pocotopaug are 45 to 59 minutes (421 commuters, 22.0%), 30 to 34 minutes (279 commuters, 14.5%), and 10 to 14 minutes (225 commuters, 11.7%).
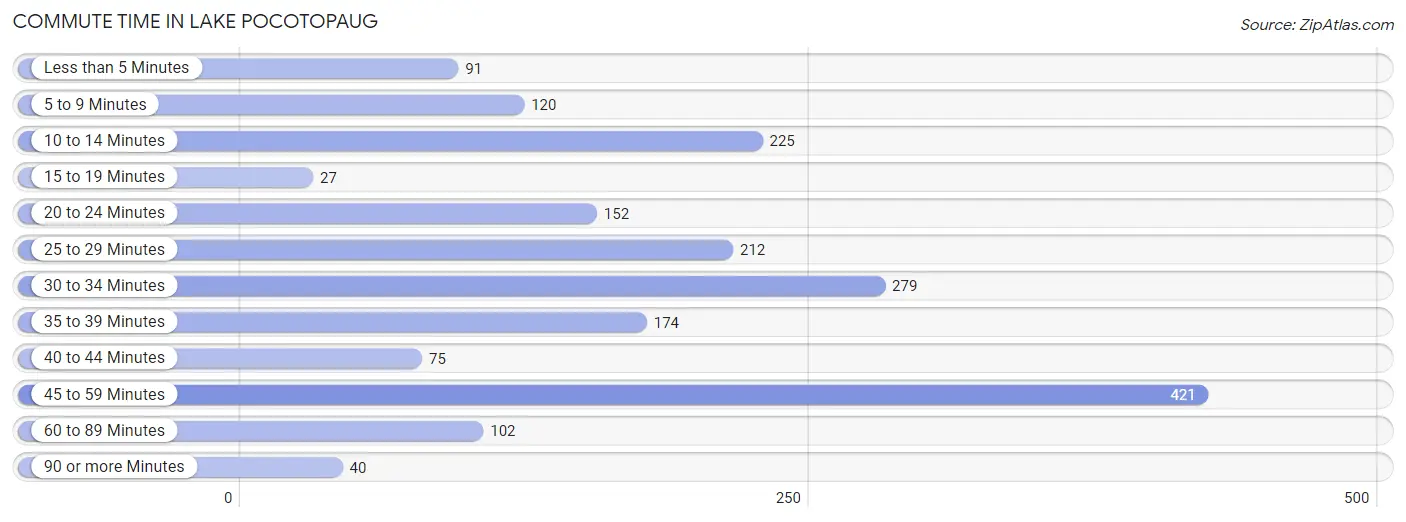
| Commute Time | # Commuters | % Commuters |
| Less than 5 Minutes | 91 | 4.7% |
| 5 to 9 Minutes | 120 | 6.3% |
| 10 to 14 Minutes | 225 | 11.7% |
| 15 to 19 Minutes | 27 | 1.4% |
| 20 to 24 Minutes | 152 | 7.9% |
| 25 to 29 Minutes | 212 | 11.1% |
| 30 to 34 Minutes | 279 | 14.5% |
| 35 to 39 Minutes | 174 | 9.1% |
| 40 to 44 Minutes | 75 | 3.9% |
| 45 to 59 Minutes | 421 | 22.0% |
| 60 to 89 Minutes | 102 | 5.3% |
| 90 or more Minutes | 40 | 2.1% |
Commute Time by Sex in Lake Pocotopaug
The most common commute times in Lake Pocotopaug are 45 to 59 minutes (330 commuters, 30.1%) for males and 30 to 34 minutes (161 commuters, 19.6%) for females.
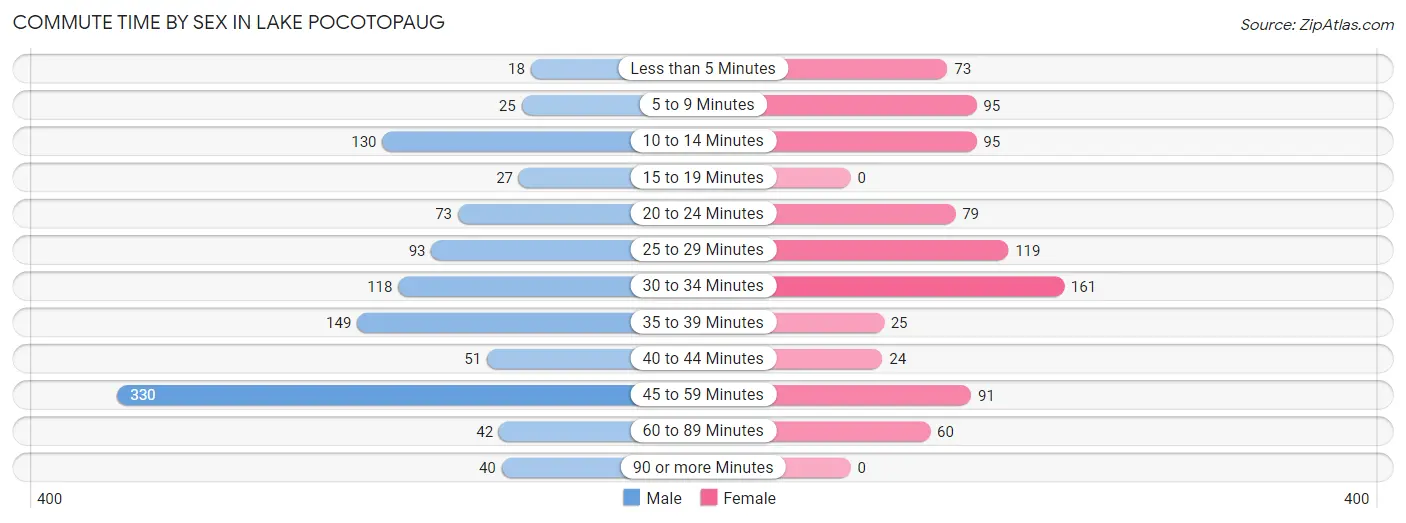
| Commute Time | Male | Female |
| Less than 5 Minutes | 18 (1.6%) | 73 (8.9%) |
| 5 to 9 Minutes | 25 (2.3%) | 95 (11.6%) |
| 10 to 14 Minutes | 130 (11.9%) | 95 (11.6%) |
| 15 to 19 Minutes | 27 (2.5%) | 0 (0.0%) |
| 20 to 24 Minutes | 73 (6.7%) | 79 (9.6%) |
| 25 to 29 Minutes | 93 (8.5%) | 119 (14.5%) |
| 30 to 34 Minutes | 118 (10.8%) | 161 (19.6%) |
| 35 to 39 Minutes | 149 (13.6%) | 25 (3.0%) |
| 40 to 44 Minutes | 51 (4.6%) | 24 (2.9%) |
| 45 to 59 Minutes | 330 (30.1%) | 91 (11.1%) |
| 60 to 89 Minutes | 42 (3.8%) | 60 (7.3%) |
| 90 or more Minutes | 40 (3.6%) | 0 (0.0%) |
Time of Departure to Work by Sex in Lake Pocotopaug
The most frequent times of departure to work in Lake Pocotopaug are 7:00 AM to 7:29 AM (259, 23.6%) for males and 7:00 AM to 7:29 AM (189, 23.0%) for females.
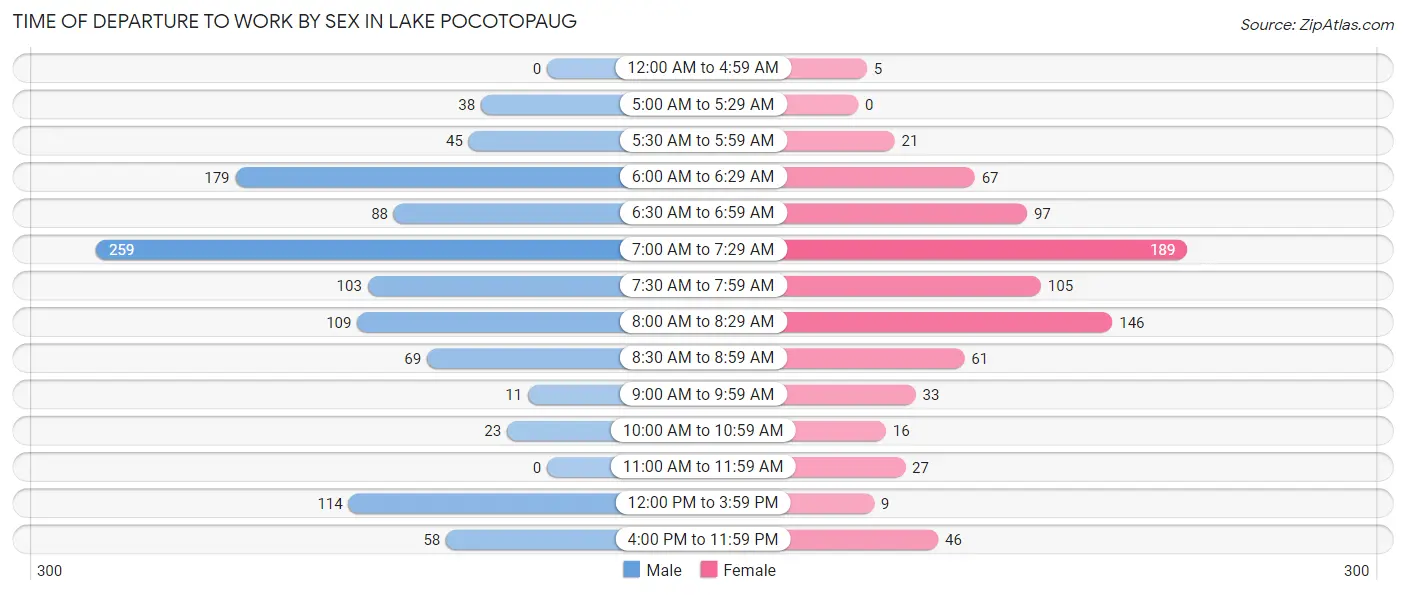
| Time of Departure | Male | Female |
| 12:00 AM to 4:59 AM | 0 (0.0%) | 5 (0.6%) |
| 5:00 AM to 5:29 AM | 38 (3.5%) | 0 (0.0%) |
| 5:30 AM to 5:59 AM | 45 (4.1%) | 21 (2.5%) |
| 6:00 AM to 6:29 AM | 179 (16.3%) | 67 (8.2%) |
| 6:30 AM to 6:59 AM | 88 (8.0%) | 97 (11.8%) |
| 7:00 AM to 7:29 AM | 259 (23.6%) | 189 (23.0%) |
| 7:30 AM to 7:59 AM | 103 (9.4%) | 105 (12.8%) |
| 8:00 AM to 8:29 AM | 109 (10.0%) | 146 (17.8%) |
| 8:30 AM to 8:59 AM | 69 (6.3%) | 61 (7.4%) |
| 9:00 AM to 9:59 AM | 11 (1.0%) | 33 (4.0%) |
| 10:00 AM to 10:59 AM | 23 (2.1%) | 16 (1.9%) |
| 11:00 AM to 11:59 AM | 0 (0.0%) | 27 (3.3%) |
| 12:00 PM to 3:59 PM | 114 (10.4%) | 9 (1.1%) |
| 4:00 PM to 11:59 PM | 58 (5.3%) | 46 (5.6%) |
| Total | 1,096 (100.0%) | 822 (100.0%) |
Housing Occupancy in Lake Pocotopaug
Occupancy by Ownership in Lake Pocotopaug
Of the total 1,963 dwellings in Lake Pocotopaug, owner-occupied units account for 1,632 (83.1%), while renter-occupied units make up 331 (16.9%).
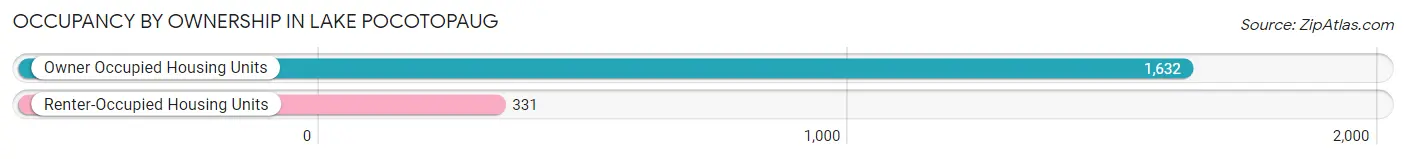
| Occupancy | # Housing Units | % Housing Units |
| Owner Occupied Housing Units | 1,632 | 83.1% |
| Renter-Occupied Housing Units | 331 | 16.9% |
| Total Occupied Housing Units | 1,963 | 100.0% |
Occupancy by Household Size in Lake Pocotopaug
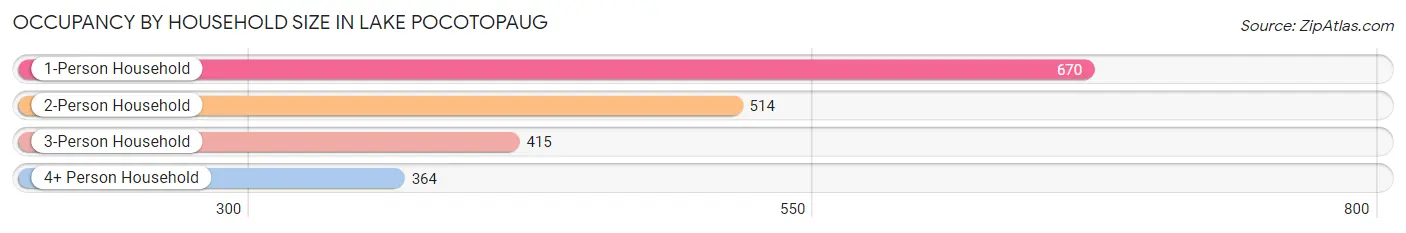
| Household Size | # Housing Units | % Housing Units |
| 1-Person Household | 670 | 34.1% |
| 2-Person Household | 514 | 26.2% |
| 3-Person Household | 415 | 21.1% |
| 4+ Person Household | 364 | 18.5% |
| Total Housing Units | 1,963 | 100.0% |
Occupancy by Ownership by Household Size in Lake Pocotopaug
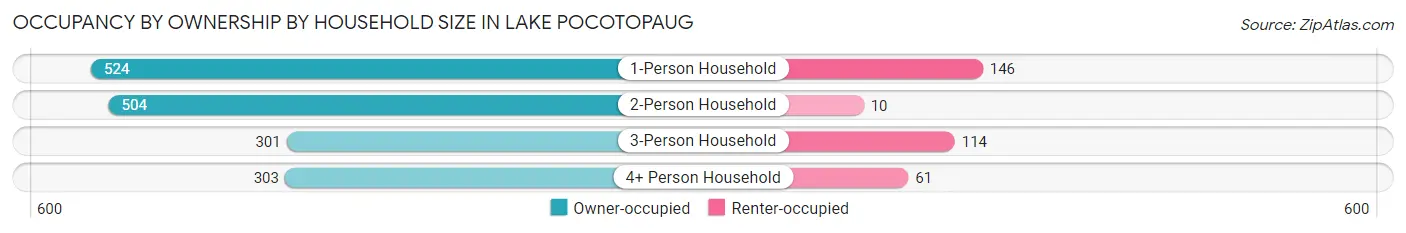
| Household Size | Owner-occupied | Renter-occupied |
| 1-Person Household | 524 (78.2%) | 146 (21.8%) |
| 2-Person Household | 504 (98.1%) | 10 (1.9%) |
| 3-Person Household | 301 (72.5%) | 114 (27.5%) |
| 4+ Person Household | 303 (83.2%) | 61 (16.8%) |
| Total Housing Units | 1,632 (83.1%) | 331 (16.9%) |
Occupancy by Educational Attainment in Lake Pocotopaug
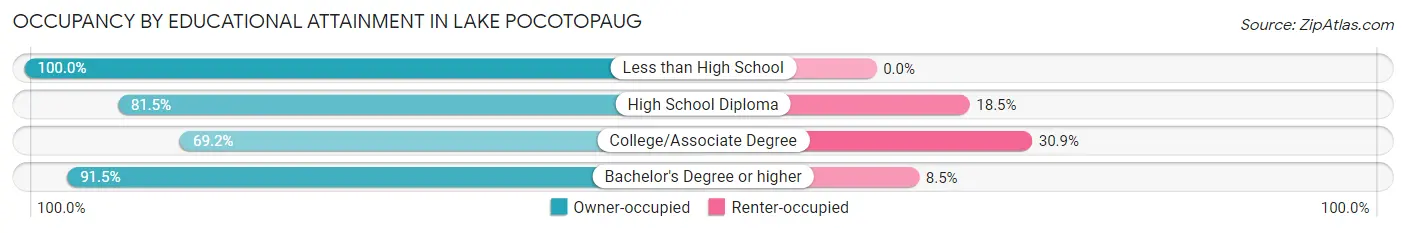
| Household Size | Owner-occupied | Renter-occupied |
| Less than High School | 77 (100.0%) | 0 (0.0%) |
| High School Diploma | 344 (81.5%) | 78 (18.5%) |
| College/Associate Degree | 399 (69.2%) | 178 (30.8%) |
| Bachelor's Degree or higher | 812 (91.5%) | 75 (8.5%) |
Occupancy by Age of Householder in Lake Pocotopaug
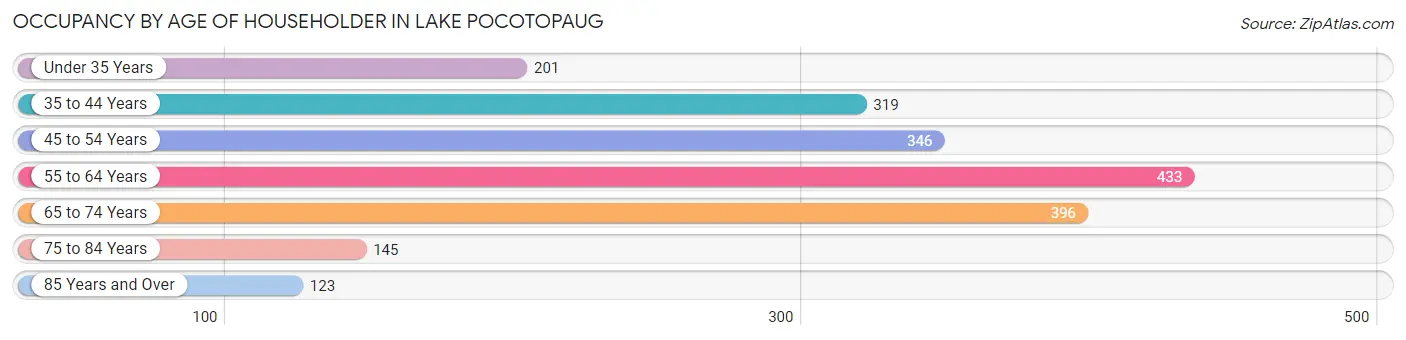
| Age Bracket | # Households | % Households |
| Under 35 Years | 201 | 10.2% |
| 35 to 44 Years | 319 | 16.3% |
| 45 to 54 Years | 346 | 17.6% |
| 55 to 64 Years | 433 | 22.1% |
| 65 to 74 Years | 396 | 20.2% |
| 75 to 84 Years | 145 | 7.4% |
| 85 Years and Over | 123 | 6.3% |
| Total | 1,963 | 100.0% |
Housing Finances in Lake Pocotopaug
Median Income by Occupancy in Lake Pocotopaug
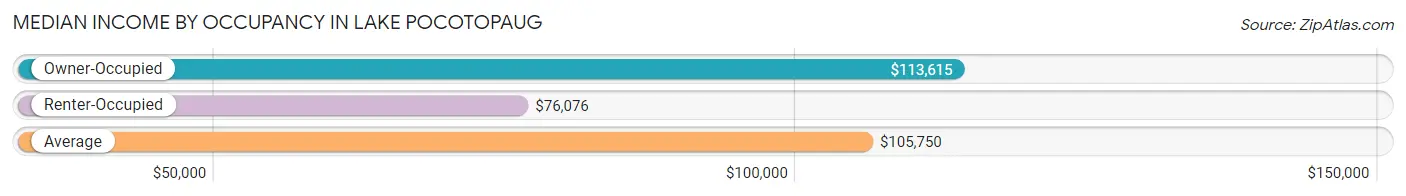
| Occupancy Type | # Households | Median Income |
| Owner-Occupied | 1,632 (83.1%) | $113,615 |
| Renter-Occupied | 331 (16.9%) | $76,076 |
| Average | 1,963 (100.0%) | $105,750 |
Occupancy by Householder Income Bracket in Lake Pocotopaug
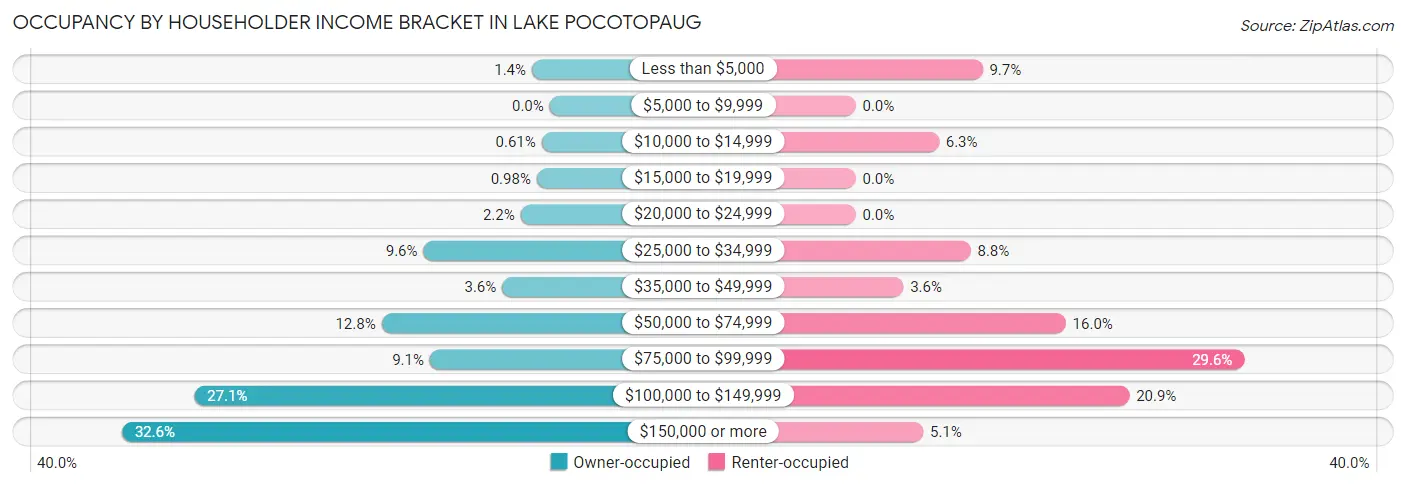
| Income Bracket | Owner-occupied | Renter-occupied |
| Less than $5,000 | 22 (1.3%) | 32 (9.7%) |
| $5,000 to $9,999 | 0 (0.0%) | 0 (0.0%) |
| $10,000 to $14,999 | 10 (0.6%) | 21 (6.3%) |
| $15,000 to $19,999 | 16 (1.0%) | 0 (0.0%) |
| $20,000 to $24,999 | 36 (2.2%) | 0 (0.0%) |
| $25,000 to $34,999 | 157 (9.6%) | 29 (8.8%) |
| $35,000 to $49,999 | 59 (3.6%) | 12 (3.6%) |
| $50,000 to $74,999 | 209 (12.8%) | 53 (16.0%) |
| $75,000 to $99,999 | 149 (9.1%) | 98 (29.6%) |
| $100,000 to $149,999 | 442 (27.1%) | 69 (20.8%) |
| $150,000 or more | 532 (32.6%) | 17 (5.1%) |
| Total | 1,632 (100.0%) | 331 (100.0%) |
Monthly Housing Cost Tiers in Lake Pocotopaug
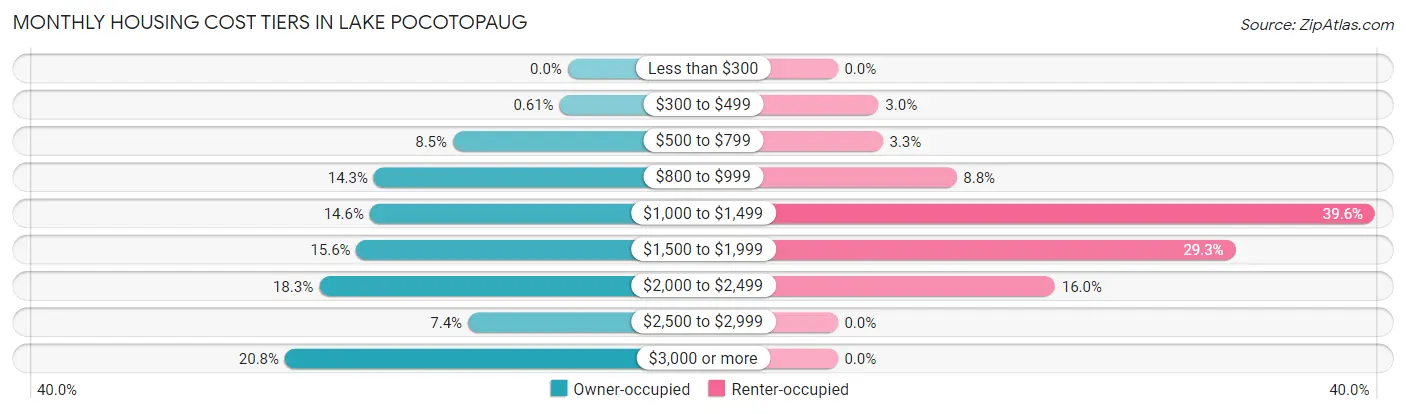
| Monthly Cost | Owner-occupied | Renter-occupied |
| Less than $300 | 0 (0.0%) | 0 (0.0%) |
| $300 to $499 | 10 (0.6%) | 10 (3.0%) |
| $500 to $799 | 138 (8.5%) | 11 (3.3%) |
| $800 to $999 | 233 (14.3%) | 29 (8.8%) |
| $1,000 to $1,499 | 238 (14.6%) | 131 (39.6%) |
| $1,500 to $1,999 | 254 (15.6%) | 97 (29.3%) |
| $2,000 to $2,499 | 299 (18.3%) | 53 (16.0%) |
| $2,500 to $2,999 | 120 (7.3%) | 0 (0.0%) |
| $3,000 or more | 340 (20.8%) | 0 (0.0%) |
| Total | 1,632 (100.0%) | 331 (100.0%) |
Physical Housing Characteristics in Lake Pocotopaug
Housing Structures in Lake Pocotopaug
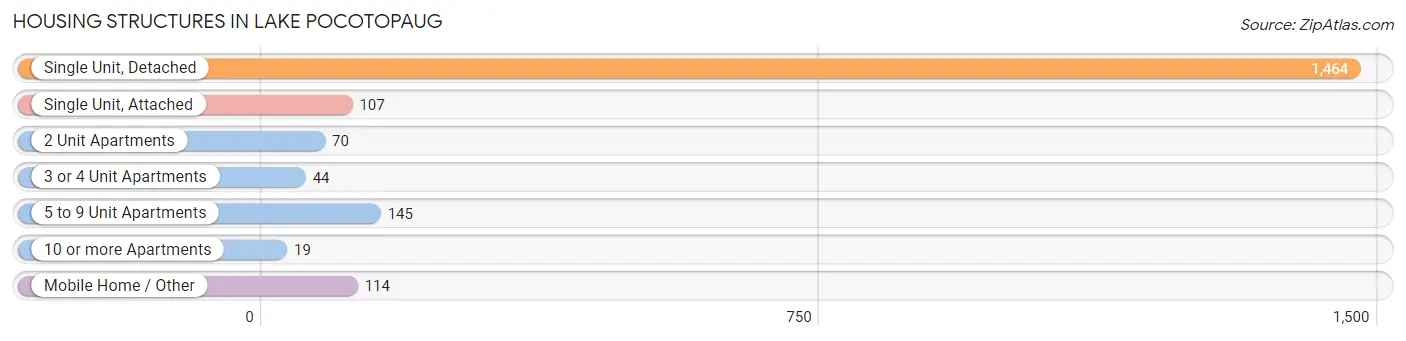
| Structure Type | # Housing Units | % Housing Units |
| Single Unit, Detached | 1,464 | 74.6% |
| Single Unit, Attached | 107 | 5.4% |
| 2 Unit Apartments | 70 | 3.6% |
| 3 or 4 Unit Apartments | 44 | 2.2% |
| 5 to 9 Unit Apartments | 145 | 7.4% |
| 10 or more Apartments | 19 | 1.0% |
| Mobile Home / Other | 114 | 5.8% |
| Total | 1,963 | 100.0% |
Housing Structures by Occupancy in Lake Pocotopaug
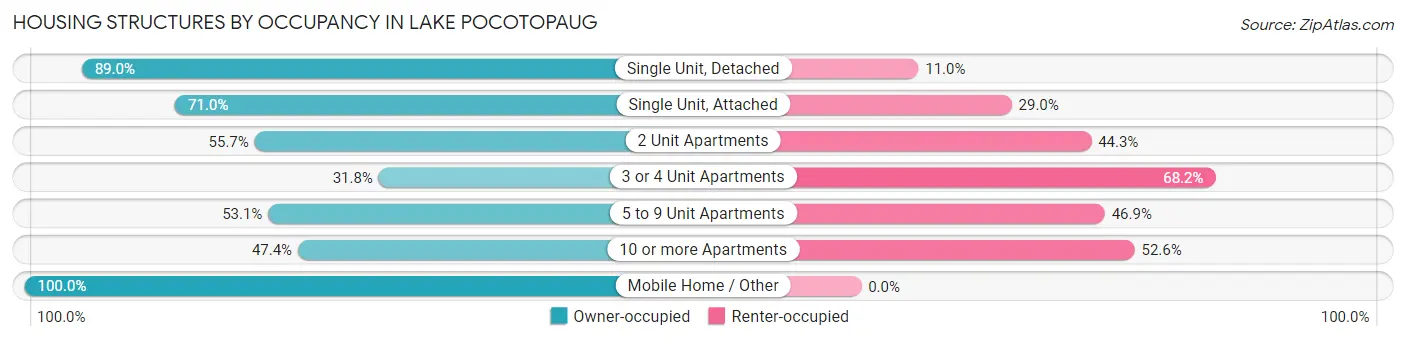
| Structure Type | Owner-occupied | Renter-occupied |
| Single Unit, Detached | 1,303 (89.0%) | 161 (11.0%) |
| Single Unit, Attached | 76 (71.0%) | 31 (29.0%) |
| 2 Unit Apartments | 39 (55.7%) | 31 (44.3%) |
| 3 or 4 Unit Apartments | 14 (31.8%) | 30 (68.2%) |
| 5 to 9 Unit Apartments | 77 (53.1%) | 68 (46.9%) |
| 10 or more Apartments | 9 (47.4%) | 10 (52.6%) |
| Mobile Home / Other | 114 (100.0%) | 0 (0.0%) |
| Total | 1,632 (83.1%) | 331 (16.9%) |
Housing Structures by Number of Rooms in Lake Pocotopaug
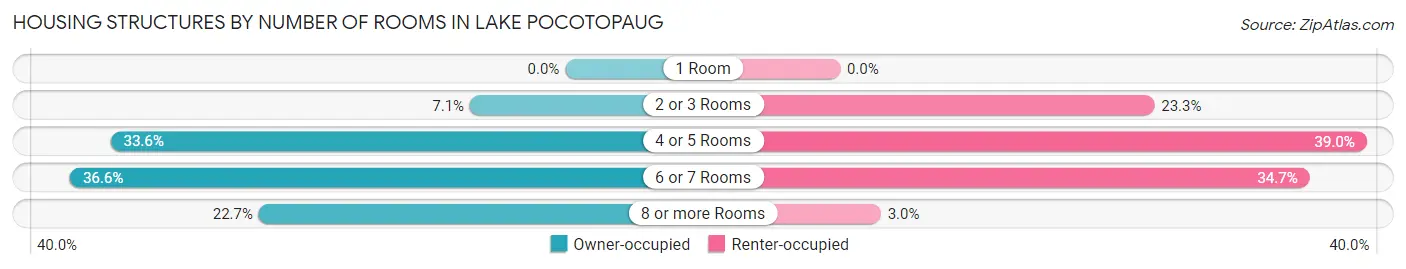
| Number of Rooms | Owner-occupied | Renter-occupied |
| 1 Room | 0 (0.0%) | 0 (0.0%) |
| 2 or 3 Rooms | 115 (7.0%) | 77 (23.3%) |
| 4 or 5 Rooms | 549 (33.6%) | 129 (39.0%) |
| 6 or 7 Rooms | 598 (36.6%) | 115 (34.7%) |
| 8 or more Rooms | 370 (22.7%) | 10 (3.0%) |
| Total | 1,632 (100.0%) | 331 (100.0%) |
Housing Structure by Heating Type in Lake Pocotopaug
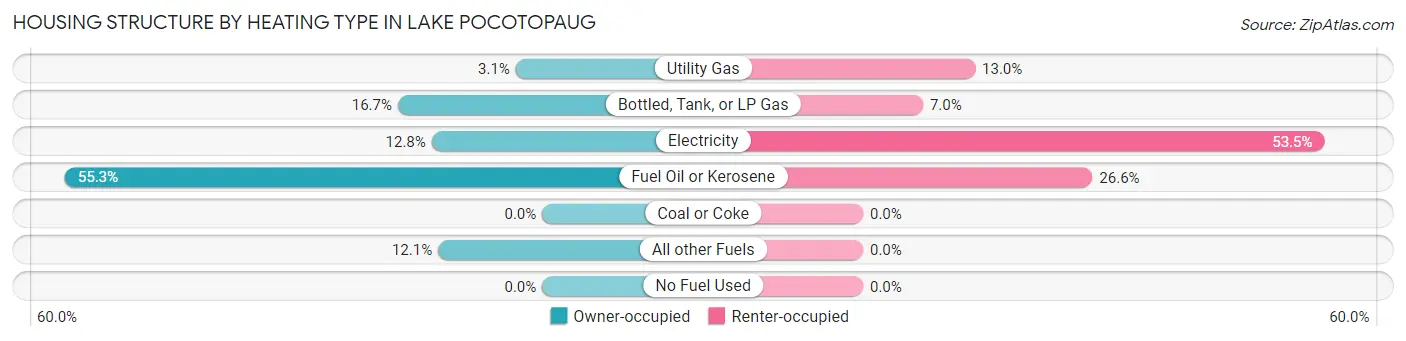
| Heating Type | Owner-occupied | Renter-occupied |
| Utility Gas | 50 (3.1%) | 43 (13.0%) |
| Bottled, Tank, or LP Gas | 273 (16.7%) | 23 (7.0%) |
| Electricity | 209 (12.8%) | 177 (53.5%) |
| Fuel Oil or Kerosene | 903 (55.3%) | 88 (26.6%) |
| Coal or Coke | 0 (0.0%) | 0 (0.0%) |
| All other Fuels | 197 (12.1%) | 0 (0.0%) |
| No Fuel Used | 0 (0.0%) | 0 (0.0%) |
| Total | 1,632 (100.0%) | 331 (100.0%) |
Household Vehicle Usage in Lake Pocotopaug
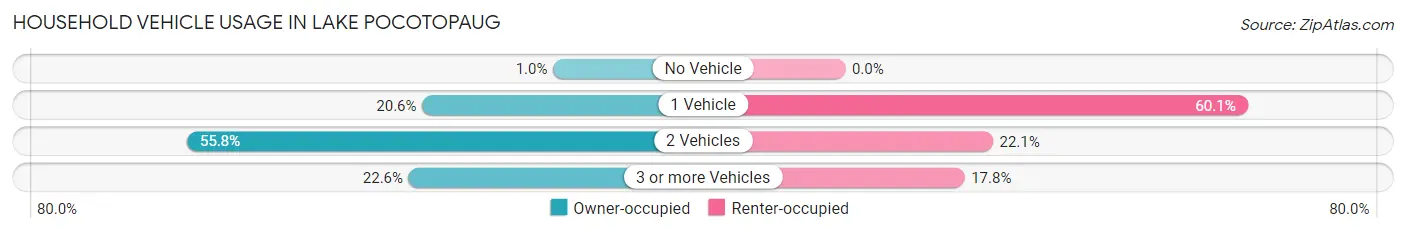
| Vehicles per Household | Owner-occupied | Renter-occupied |
| No Vehicle | 17 (1.0%) | 0 (0.0%) |
| 1 Vehicle | 336 (20.6%) | 199 (60.1%) |
| 2 Vehicles | 910 (55.8%) | 73 (22.1%) |
| 3 or more Vehicles | 369 (22.6%) | 59 (17.8%) |
| Total | 1,632 (100.0%) | 331 (100.0%) |
Real Estate & Mortgages in Lake Pocotopaug
Real Estate and Mortgage Overview in Lake Pocotopaug
| Characteristic | Without Mortgage | With Mortgage |
| Housing Units | 523 | 1,109 |
| Median Property Value | $218,200 | $329,200 |
| Median Household Income | - | - |
| Monthly Housing Costs | $917 | $331 |
| Real Estate Taxes | $5,266 | $0 |
Property Value by Mortgage Status in Lake Pocotopaug
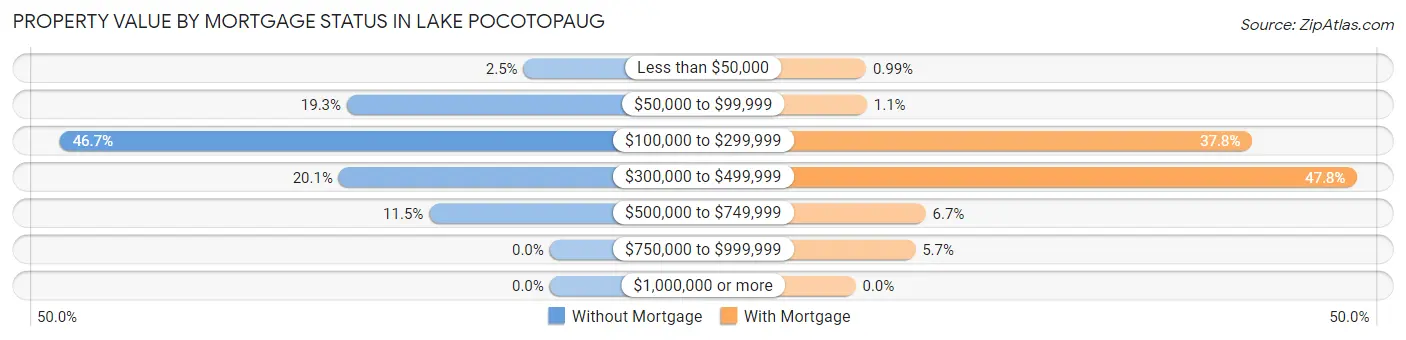
| Property Value | Without Mortgage | With Mortgage |
| Less than $50,000 | 13 (2.5%) | 11 (1.0%) |
| $50,000 to $99,999 | 101 (19.3%) | 12 (1.1%) |
| $100,000 to $299,999 | 244 (46.7%) | 419 (37.8%) |
| $300,000 to $499,999 | 105 (20.1%) | 530 (47.8%) |
| $500,000 to $749,999 | 60 (11.5%) | 74 (6.7%) |
| $750,000 to $999,999 | 0 (0.0%) | 63 (5.7%) |
| $1,000,000 or more | 0 (0.0%) | 0 (0.0%) |
| Total | 523 (100.0%) | 1,109 (100.0%) |
Household Income by Mortgage Status in Lake Pocotopaug
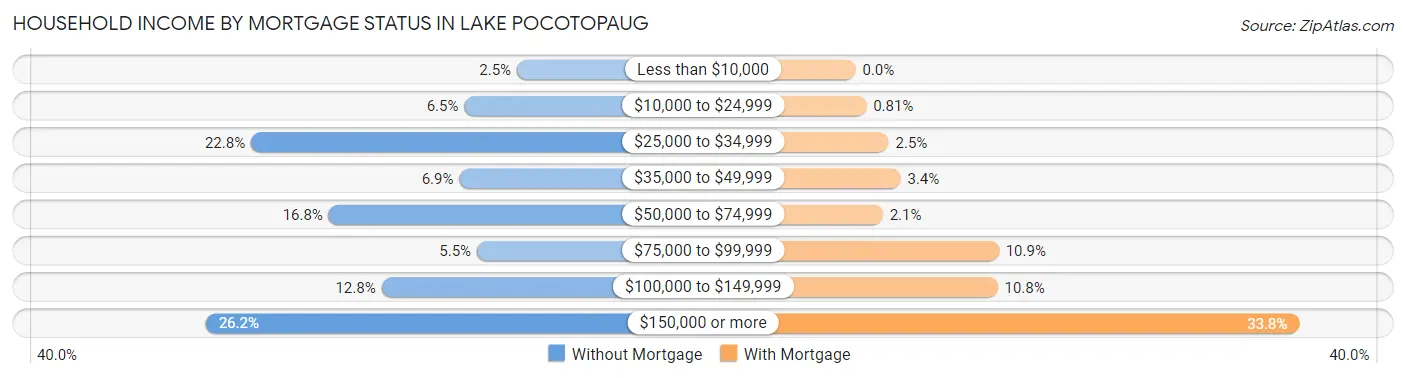
| Household Income | Without Mortgage | With Mortgage |
| Less than $10,000 | 13 (2.5%) | 0 (0.0%) |
| $10,000 to $24,999 | 34 (6.5%) | 9 (0.8%) |
| $25,000 to $34,999 | 119 (22.8%) | 28 (2.5%) |
| $35,000 to $49,999 | 36 (6.9%) | 38 (3.4%) |
| $50,000 to $74,999 | 88 (16.8%) | 23 (2.1%) |
| $75,000 to $99,999 | 29 (5.5%) | 121 (10.9%) |
| $100,000 to $149,999 | 67 (12.8%) | 120 (10.8%) |
| $150,000 or more | 137 (26.2%) | 375 (33.8%) |
| Total | 523 (100.0%) | 1,109 (100.0%) |
Property Value to Household Income Ratio in Lake Pocotopaug
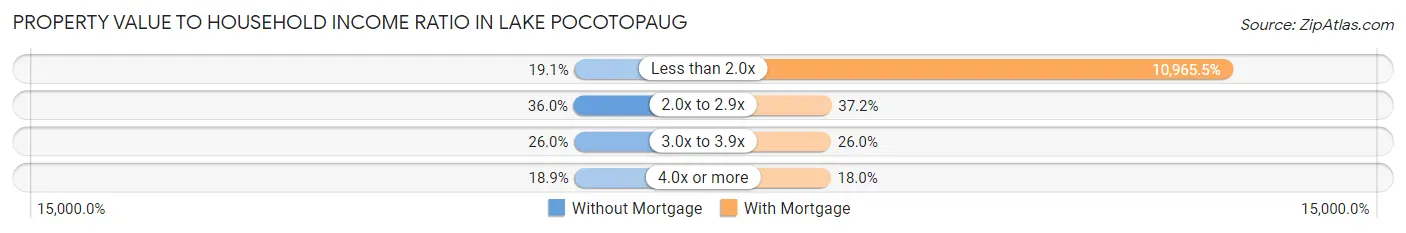
| Value-to-Income Ratio | Without Mortgage | With Mortgage |
| Less than 2.0x | 100 (19.1%) | 121,607 (10,965.5%) |
| 2.0x to 2.9x | 188 (35.9%) | 412 (37.1%) |
| 3.0x to 3.9x | 136 (26.0%) | 288 (26.0%) |
| 4.0x or more | 99 (18.9%) | 200 (18.0%) |
| Total | 523 (100.0%) | 1,109 (100.0%) |
Real Estate Taxes by Mortgage Status in Lake Pocotopaug
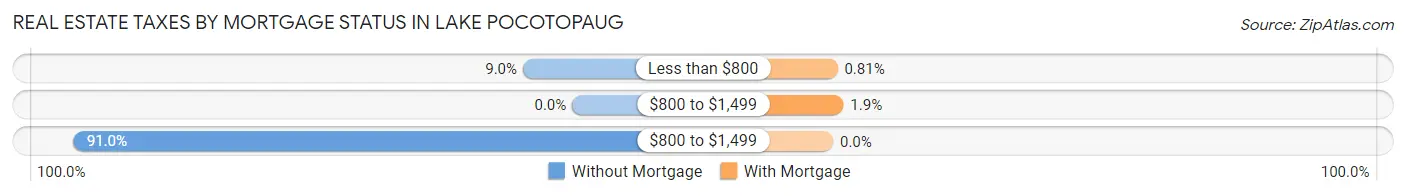
| Property Taxes | Without Mortgage | With Mortgage |
| Less than $800 | 47 (9.0%) | 9 (0.8%) |
| $800 to $1,499 | 0 (0.0%) | 21 (1.9%) |
| $800 to $1,499 | 476 (91.0%) | 0 (0.0%) |
| Total | 523 (100.0%) | 1,109 (100.0%) |
Health & Disability in Lake Pocotopaug
Health Insurance Coverage by Age in Lake Pocotopaug
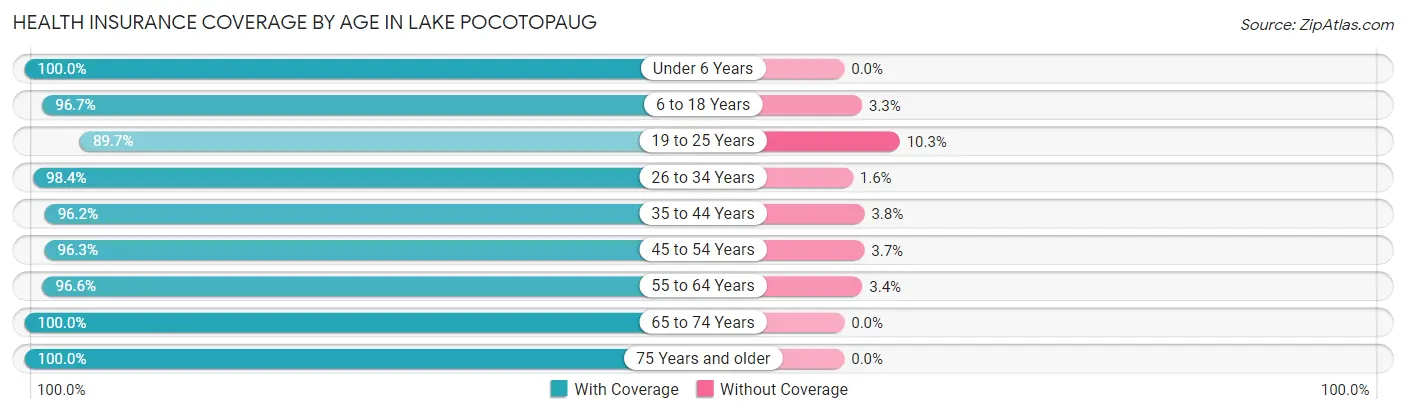
| Age Bracket | With Coverage | Without Coverage |
| Under 6 Years | 458 (100.0%) | 0 (0.0%) |
| 6 to 18 Years | 672 (96.7%) | 23 (3.3%) |
| 19 to 25 Years | 191 (89.7%) | 22 (10.3%) |
| 26 to 34 Years | 430 (98.4%) | 7 (1.6%) |
| 35 to 44 Years | 588 (96.2%) | 23 (3.8%) |
| 45 to 54 Years | 618 (96.3%) | 24 (3.7%) |
| 55 to 64 Years | 689 (96.6%) | 24 (3.4%) |
| 65 to 74 Years | 614 (100.0%) | 0 (0.0%) |
| 75 Years and older | 378 (100.0%) | 0 (0.0%) |
| Total | 4,638 (97.4%) | 123 (2.6%) |
Health Insurance Coverage by Citizenship Status in Lake Pocotopaug
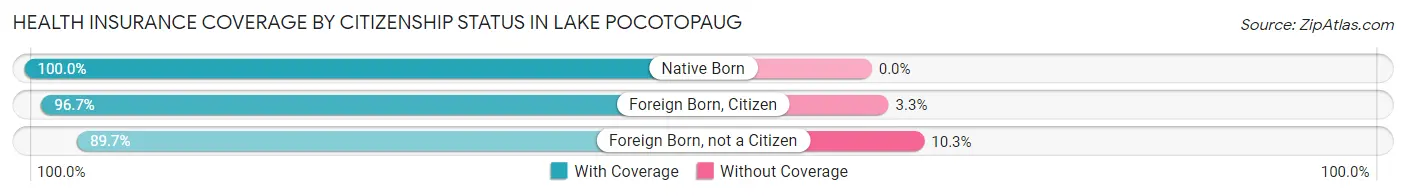
| Citizenship Status | With Coverage | Without Coverage |
| Native Born | 458 (100.0%) | 0 (0.0%) |
| Foreign Born, Citizen | 672 (96.7%) | 23 (3.3%) |
| Foreign Born, not a Citizen | 191 (89.7%) | 22 (10.3%) |
Health Insurance Coverage by Household Income in Lake Pocotopaug
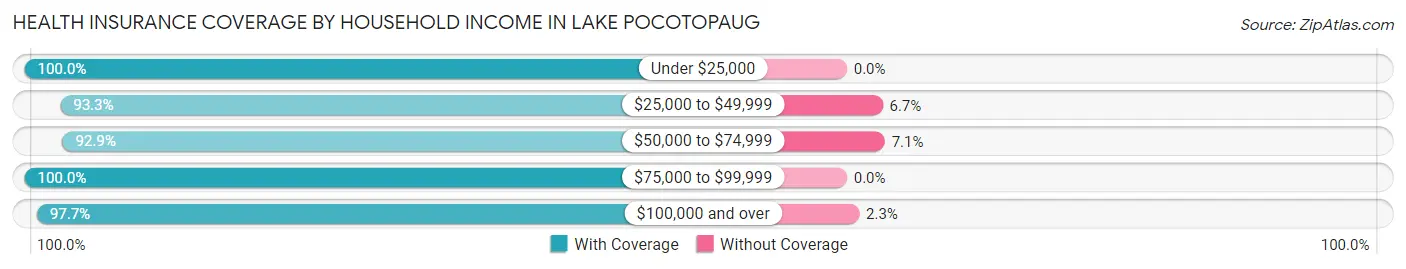
| Household Income | With Coverage | Without Coverage |
| Under $25,000 | 205 (100.0%) | 0 (0.0%) |
| $25,000 to $49,999 | 335 (93.3%) | 24 (6.7%) |
| $50,000 to $74,999 | 288 (92.9%) | 22 (7.1%) |
| $75,000 to $99,999 | 543 (100.0%) | 0 (0.0%) |
| $100,000 and over | 3,262 (97.7%) | 77 (2.3%) |
Public vs Private Health Insurance Coverage by Age in Lake Pocotopaug
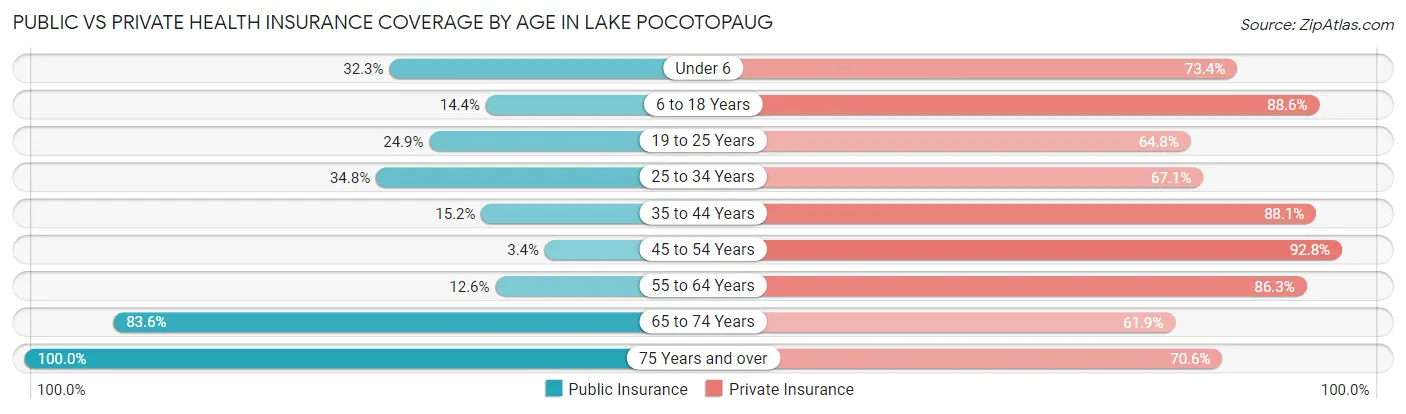
| Age Bracket | Public Insurance | Private Insurance |
| Under 6 | 148 (32.3%) | 336 (73.4%) |
| 6 to 18 Years | 100 (14.4%) | 616 (88.6%) |
| 19 to 25 Years | 53 (24.9%) | 138 (64.8%) |
| 25 to 34 Years | 152 (34.8%) | 293 (67.0%) |
| 35 to 44 Years | 93 (15.2%) | 538 (88.0%) |
| 45 to 54 Years | 22 (3.4%) | 596 (92.8%) |
| 55 to 64 Years | 90 (12.6%) | 615 (86.3%) |
| 65 to 74 Years | 513 (83.6%) | 380 (61.9%) |
| 75 Years and over | 378 (100.0%) | 267 (70.6%) |
| Total | 1,549 (32.5%) | 3,779 (79.4%) |
Disability Status by Sex by Age in Lake Pocotopaug
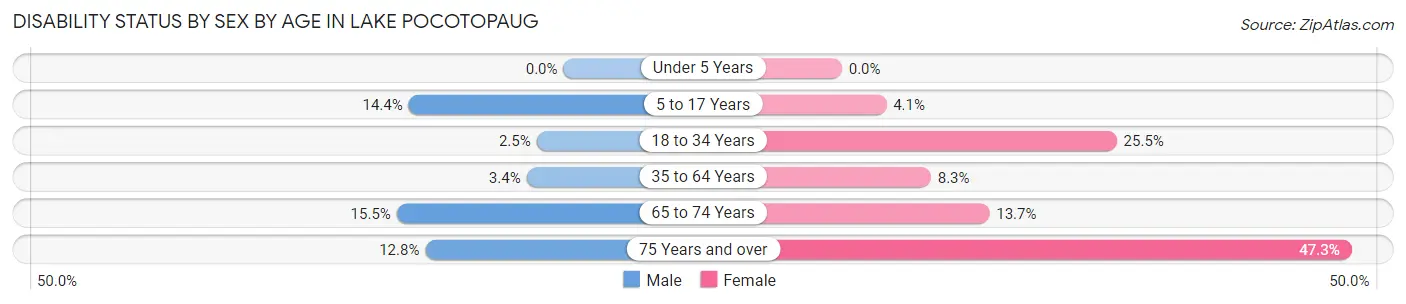
| Age Bracket | Male | Female |
| Under 5 Years | 0 (0.0%) | 0 (0.0%) |
| 5 to 17 Years | 50 (14.4%) | 15 (4.1%) |
| 18 to 34 Years | 8 (2.5%) | 101 (25.5%) |
| 35 to 64 Years | 35 (3.4%) | 78 (8.3%) |
| 65 to 74 Years | 43 (15.5%) | 46 (13.7%) |
| 75 Years and over | 20 (12.8%) | 105 (47.3%) |
Disability Class by Sex by Age in Lake Pocotopaug
Disability Class: Hearing Difficulty
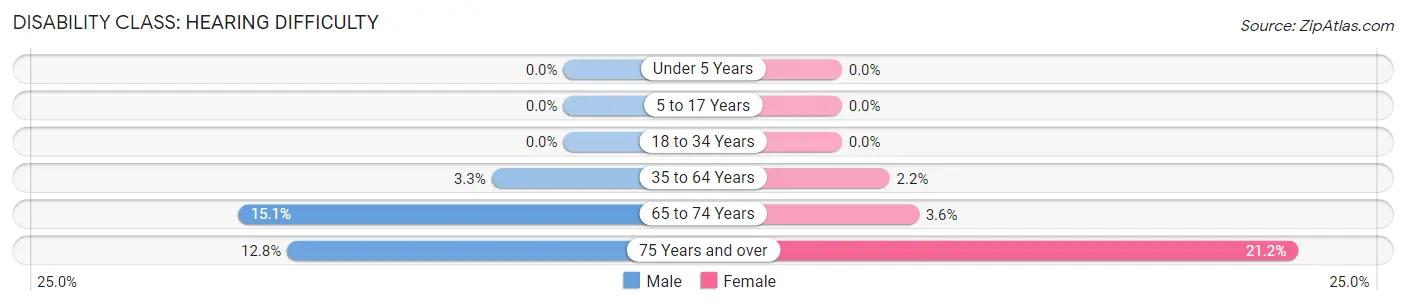
| Age Bracket | Male | Female |
| Under 5 Years | 0 (0.0%) | 0 (0.0%) |
| 5 to 17 Years | 0 (0.0%) | 0 (0.0%) |
| 18 to 34 Years | 0 (0.0%) | 0 (0.0%) |
| 35 to 64 Years | 34 (3.3%) | 21 (2.2%) |
| 65 to 74 Years | 42 (15.1%) | 12 (3.6%) |
| 75 Years and over | 20 (12.8%) | 47 (21.2%) |
Disability Class: Vision Difficulty
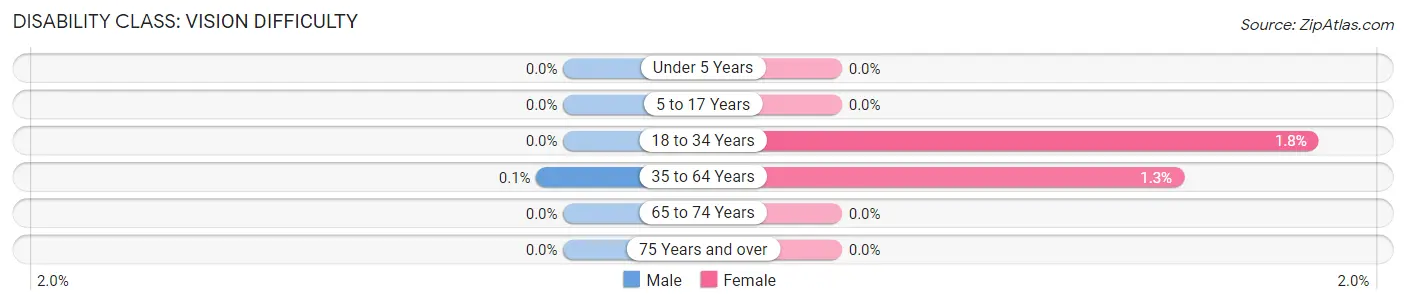
| Age Bracket | Male | Female |
| Under 5 Years | 0 (0.0%) | 0 (0.0%) |
| 5 to 17 Years | 0 (0.0%) | 0 (0.0%) |
| 18 to 34 Years | 0 (0.0%) | 7 (1.8%) |
| 35 to 64 Years | 1 (0.1%) | 12 (1.3%) |
| 65 to 74 Years | 0 (0.0%) | 0 (0.0%) |
| 75 Years and over | 0 (0.0%) | 0 (0.0%) |
Disability Class: Cognitive Difficulty
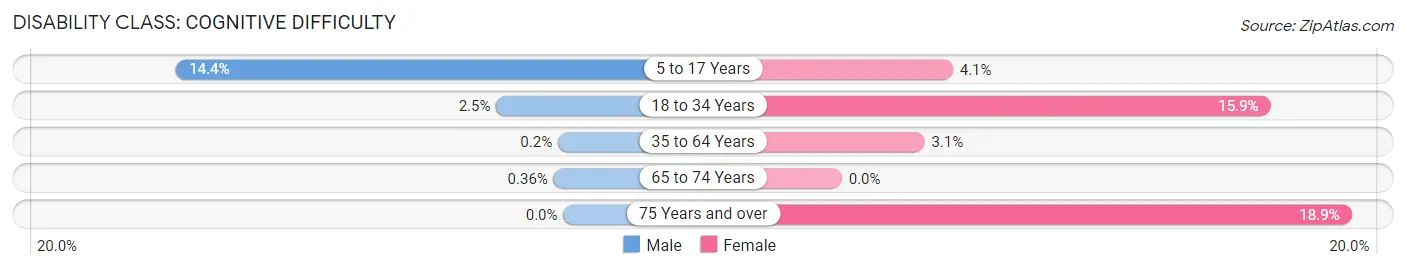
| Age Bracket | Male | Female |
| 5 to 17 Years | 50 (14.4%) | 15 (4.1%) |
| 18 to 34 Years | 8 (2.5%) | 63 (15.9%) |
| 35 to 64 Years | 2 (0.2%) | 29 (3.1%) |
| 65 to 74 Years | 1 (0.4%) | 0 (0.0%) |
| 75 Years and over | 0 (0.0%) | 42 (18.9%) |
Disability Class: Ambulatory Difficulty
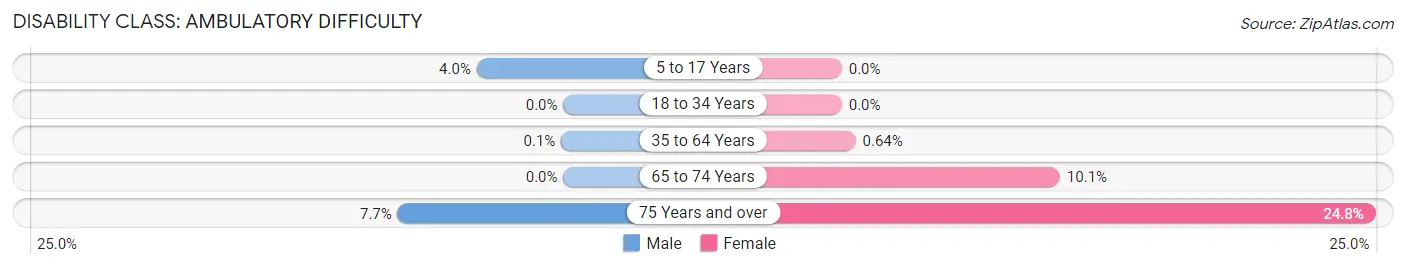
| Age Bracket | Male | Female |
| 5 to 17 Years | 14 (4.0%) | 0 (0.0%) |
| 18 to 34 Years | 0 (0.0%) | 0 (0.0%) |
| 35 to 64 Years | 1 (0.1%) | 6 (0.6%) |
| 65 to 74 Years | 0 (0.0%) | 34 (10.1%) |
| 75 Years and over | 12 (7.7%) | 55 (24.8%) |
Disability Class: Self-Care Difficulty
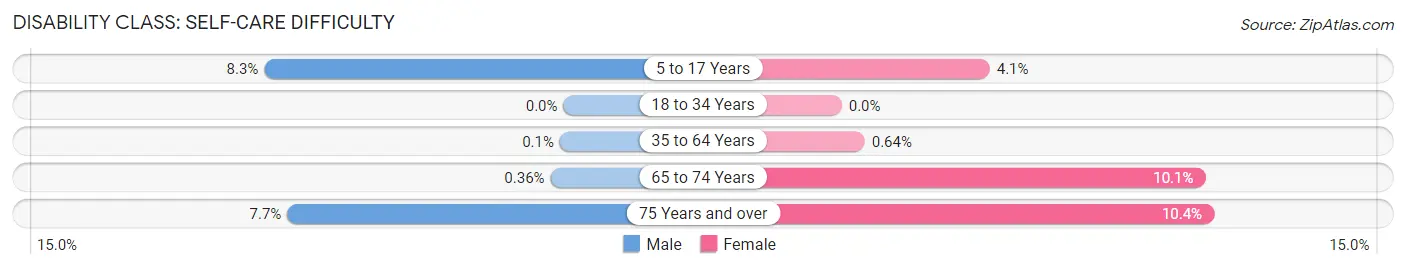
| Age Bracket | Male | Female |
| 5 to 17 Years | 29 (8.3%) | 15 (4.1%) |
| 18 to 34 Years | 0 (0.0%) | 0 (0.0%) |
| 35 to 64 Years | 1 (0.1%) | 6 (0.6%) |
| 65 to 74 Years | 1 (0.4%) | 34 (10.1%) |
| 75 Years and over | 12 (7.7%) | 23 (10.4%) |
Technology Access in Lake Pocotopaug
Computing Device Access in Lake Pocotopaug
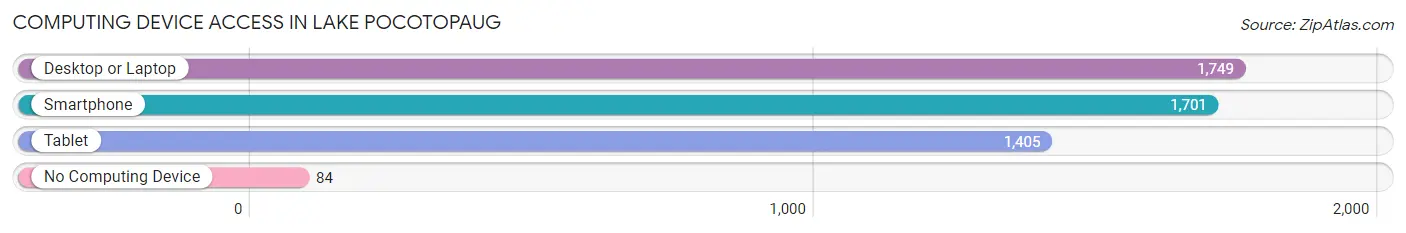
| Device Type | # Households | % Households |
| Desktop or Laptop | 1,749 | 89.1% |
| Smartphone | 1,701 | 86.7% |
| Tablet | 1,405 | 71.6% |
| No Computing Device | 84 | 4.3% |
| Total | 1,963 | 100.0% |
Internet Access in Lake Pocotopaug
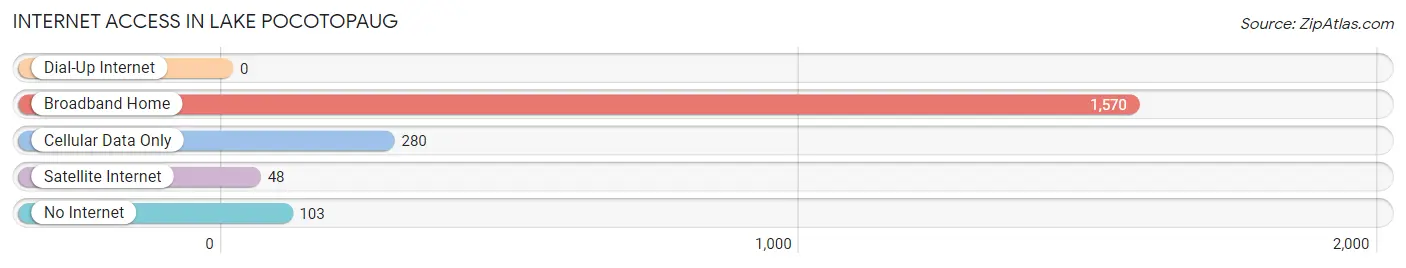
| Internet Type | # Households | % Households |
| Dial-Up Internet | 0 | 0.0% |
| Broadband Home | 1,570 | 80.0% |
| Cellular Data Only | 280 | 14.3% |
| Satellite Internet | 48 | 2.5% |
| No Internet | 103 | 5.2% |
| Total | 1,963 | 100.0% |
Lake Pocotopaug Summary
Lake Pocotopaug is a lake located in the town of East Hampton, Connecticut. It is the largest natural lake in the state and is a popular destination for fishing, swimming, and boating. The lake is also home to a variety of wildlife, including bald eagles, ospreys, and beavers.
History
The lake was formed by a glacier during the last ice age, approximately 12,000 years ago. The lake was originally known as Pocotopaug Pond, and was used by the local Native American tribes for fishing and hunting. The first European settlers arrived in the area in the late 1600s, and the lake was used for farming and logging. In the late 1800s, the lake was used for recreational activities such as swimming and boating.
Geography
Lake Pocotopaug is located in the town of East Hampton, Connecticut. It is the largest natural lake in the state, covering an area of 1,100 acres. The lake is fed by several small streams, including the Salmon River, and is drained by the Moodus River. The lake has a maximum depth of 40 feet and an average depth of 15 feet. The lake is surrounded by several small towns, including East Hampton, Marlborough, and Hebron.
Economy
The lake is a popular destination for fishing, swimming, and boating. The lake is home to a variety of fish species, including largemouth bass, smallmouth bass, northern pike, and walleye. The lake is also home to several marinas, boat launches, and campgrounds. The lake is also a popular destination for bird watching, as it is home to a variety of waterfowl, including bald eagles, ospreys, and beavers.
Demographics
As of the 2010 census, the population of East Hampton was 12,959. The median household income was $68,944, and the median age was 43. The population is predominantly white (94.3%), with small percentages of African American (2.2%), Asian (1.2%), and Hispanic (1.2%) residents. The town is home to several small businesses, including restaurants, retail stores, and marinas.
Conclusion
Lake Pocotopaug is a popular destination for fishing, swimming, and boating. The lake is home to a variety of wildlife, including bald eagles, ospreys, and beavers. The lake is located in the town of East Hampton, Connecticut, and is the largest natural lake in the state. The lake is surrounded by several small towns, and is a popular destination for bird watching. The population of East Hampton is predominantly white, with small percentages of African American, Asian, and Hispanic residents. The lake is home to several marinas, boat launches, and campgrounds, and is a popular destination for fishing, swimming, and boating.
Common Questions
What is Per Capita Income in Lake Pocotopaug?
Per Capita income in Lake Pocotopaug is $50,124.
What is the Median Family Income in Lake Pocotopaug?
Median Family Income in Lake Pocotopaug is $122,232.
What is the Median Household income in Lake Pocotopaug?
Median Household Income in Lake Pocotopaug is $105,750.
What is Income or Wage Gap in Lake Pocotopaug?
Income or Wage Gap in Lake Pocotopaug is 30.5%.
Women in Lake Pocotopaug earn 69.5 cents for every dollar earned by a man.
What is Inequality or Gini Index in Lake Pocotopaug?
Inequality or Gini Index in Lake Pocotopaug is 0.39.
What is the Total Population of Lake Pocotopaug?
Total Population of Lake Pocotopaug is 4,761.
What is the Total Male Population of Lake Pocotopaug?
Total Male Population of Lake Pocotopaug is 2,214.
What is the Total Female Population of Lake Pocotopaug?
Total Female Population of Lake Pocotopaug is 2,547.
What is the Ratio of Males per 100 Females in Lake Pocotopaug?
There are 86.93 Males per 100 Females in Lake Pocotopaug.
What is the Ratio of Females per 100 Males in Lake Pocotopaug?
There are 115.04 Females per 100 Males in Lake Pocotopaug.
What is the Median Population Age in Lake Pocotopaug?
Median Population Age in Lake Pocotopaug is 43.8 Years.
What is the Average Family Size in Lake Pocotopaug
Average Family Size in Lake Pocotopaug is 3.1 People.
What is the Average Household Size in Lake Pocotopaug
Average Household Size in Lake Pocotopaug is 2.4 People.
How Large is the Labor Force in Lake Pocotopaug?
There are 2,460 People in the Labor Forcein in Lake Pocotopaug.
What is the Percentage of People in the Labor Force in Lake Pocotopaug?
64.0% of People are in the Labor Force in Lake Pocotopaug.
What is the Unemployment Rate in Lake Pocotopaug?
Unemployment Rate in Lake Pocotopaug is 5.3%.