New Haven, CT Map & Demographics
New Haven Map
New Haven Overview
$33,449
PER CAPITA INCOME
$62,870
AVG FAMILY INCOME
$54,305
AVG HOUSEHOLD INCOME
15.9%
WAGE / INCOME GAP [ % ]
84.1¢/ $1
WAGE / INCOME GAP [ $ ]
$11,990
FAMILY INCOME DEFICIT
0.53
INEQUALITY / GINI INDEX
135,736
TOTAL POPULATION
63,821
MALE POPULATION
71,915
FEMALE POPULATION
88.75
MALES / 100 FEMALES
112.68
FEMALES / 100 MALES
31.0
MEDIAN AGE
3.2
AVG FAMILY SIZE
2.4
AVG HOUSEHOLD SIZE
70,691
LABOR FORCE [ PEOPLE ]
64.6%
PERCENT IN LABOR FORCE
7.8%
UNEMPLOYMENT RATE
Income in New Haven
Income Overview in New Haven
Per Capita Income in New Haven is $33,449, while median incomes of families and households are $62,870 and $54,305 respectively.
| Characteristic | Number | Measure |
| Per Capita Income | 135,736 | $33,449 |
| Median Family Income | 26,777 | $62,870 |
| Mean Family Income | 26,777 | $99,563 |
| Median Household Income | 52,977 | $54,305 |
| Mean Household Income | 52,977 | $82,869 |
| Income Deficit | 26,777 | $11,990 |
| Wage / Income Gap (%) | 135,736 | 15.91% |
| Wage / Income Gap ($) | 135,736 | 84.09¢ per $1 |
| Gini / Inequality Index | 135,736 | 0.53 |
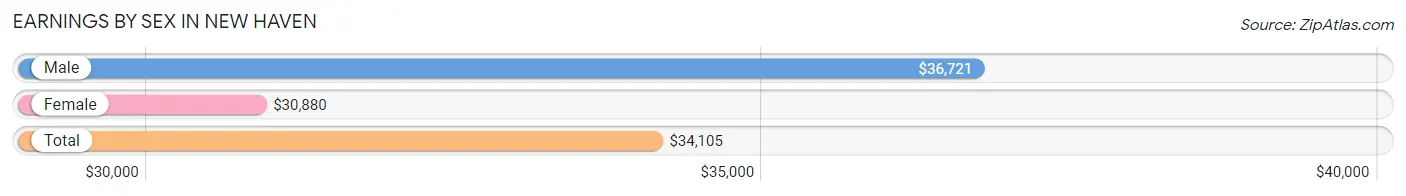
Earnings by Sex in New Haven
Average Earnings in New Haven are $34,105, $36,721 for men and $30,880 for women, a difference of 15.9%.
| Sex | Number | Average Earnings |
| Male | 35,255 (47.3%) | $36,721 |
| Female | 39,253 (52.7%) | $30,880 |
| Total | 74,508 (100.0%) | $34,105 |
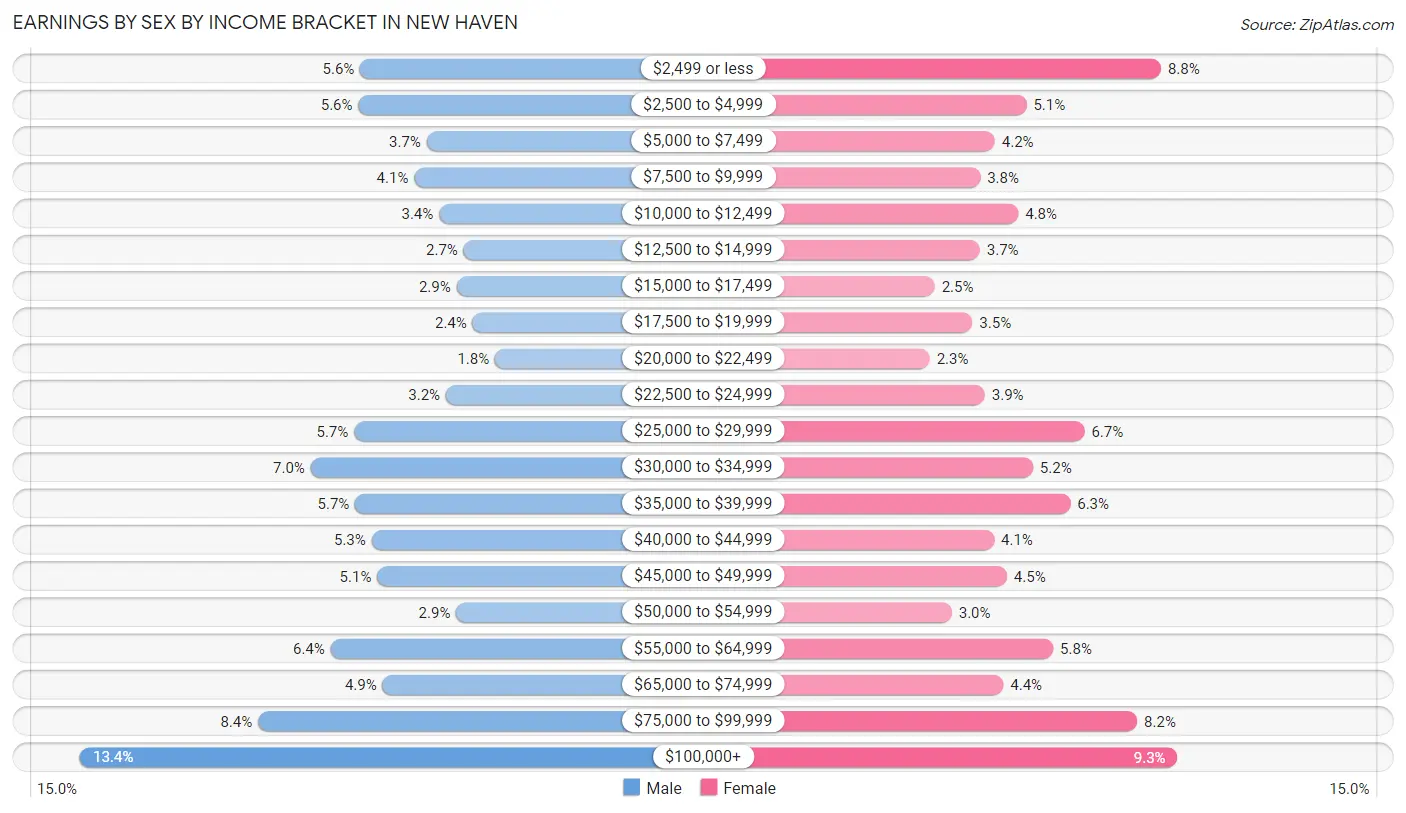
Earnings by Sex by Income Bracket in New Haven
The most common earnings brackets in New Haven are $100,000+ for men (4,739 | 13.4%) and $100,000+ for women (3,646 | 9.3%).
| Income | Male | Female |
| $2,499 or less | 1,964 (5.6%) | 3,467 (8.8%) |
| $2,500 to $4,999 | 1,981 (5.6%) | 1,981 (5.1%) |
| $5,000 to $7,499 | 1,306 (3.7%) | 1,632 (4.2%) |
| $7,500 to $9,999 | 1,428 (4.1%) | 1,472 (3.7%) |
| $10,000 to $12,499 | 1,181 (3.4%) | 1,893 (4.8%) |
| $12,500 to $14,999 | 937 (2.7%) | 1,468 (3.7%) |
| $15,000 to $17,499 | 1,008 (2.9%) | 968 (2.5%) |
| $17,500 to $19,999 | 849 (2.4%) | 1,387 (3.5%) |
| $20,000 to $22,499 | 626 (1.8%) | 916 (2.3%) |
| $22,500 to $24,999 | 1,114 (3.2%) | 1,522 (3.9%) |
| $25,000 to $29,999 | 2,025 (5.7%) | 2,624 (6.7%) |
| $30,000 to $34,999 | 2,452 (7.0%) | 2,051 (5.2%) |
| $35,000 to $39,999 | 2,014 (5.7%) | 2,466 (6.3%) |
| $40,000 to $44,999 | 1,852 (5.2%) | 1,626 (4.1%) |
| $45,000 to $49,999 | 1,793 (5.1%) | 1,767 (4.5%) |
| $50,000 to $54,999 | 1,011 (2.9%) | 1,157 (2.9%) |
| $55,000 to $64,999 | 2,256 (6.4%) | 2,276 (5.8%) |
| $65,000 to $74,999 | 1,742 (4.9%) | 1,729 (4.4%) |
| $75,000 to $99,999 | 2,977 (8.4%) | 3,205 (8.2%) |
| $100,000+ | 4,739 (13.4%) | 3,646 (9.3%) |
| Total | 35,255 (100.0%) | 39,253 (100.0%) |
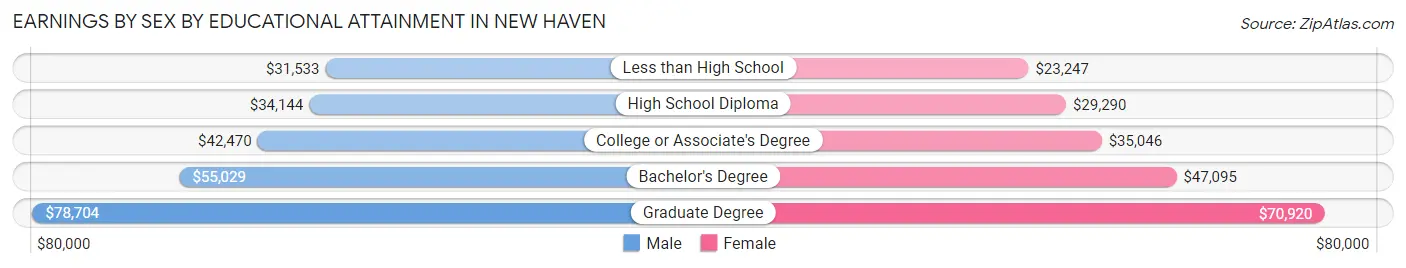
Earnings by Sex by Educational Attainment in New Haven
Average earnings in New Haven are $44,418 for men and $39,236 for women, a difference of 11.7%. Men with an educational attainment of graduate degree enjoy the highest average annual earnings of $78,704, while those with less than high school education earn the least with $31,533. Women with an educational attainment of graduate degree earn the most with the average annual earnings of $70,920, while those with less than high school education have the smallest earnings of $23,247.
| Educational Attainment | Male Income | Female Income |
| Less than High School | $31,533 | $23,247 |
| High School Diploma | $34,144 | $29,290 |
| College or Associate's Degree | $42,470 | $35,046 |
| Bachelor's Degree | $55,029 | $47,095 |
| Graduate Degree | $78,704 | $70,920 |
| Total | $44,418 | $39,236 |
Family Income in New Haven
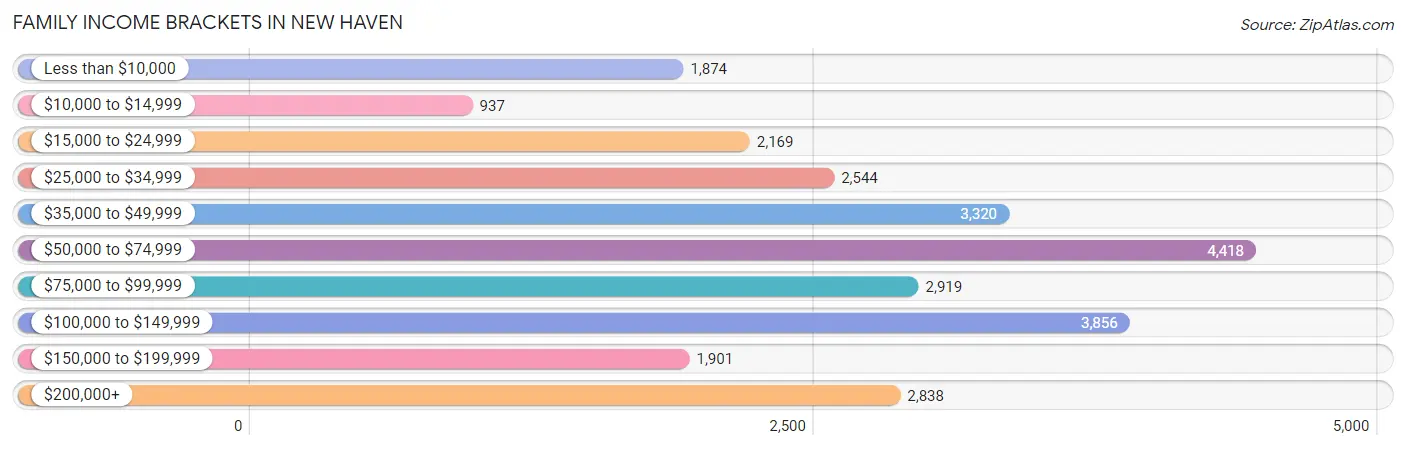
Family Income Brackets in New Haven
According to the New Haven family income data, there are 4,418 families falling into the $50,000 to $74,999 income range, which is the most common income bracket and makes up 16.5% of all families. Conversely, the $10,000 to $14,999 income bracket is the least frequent group with only 937 families (3.5%) belonging to this category.
| Income Bracket | # Families | % Families |
| Less than $10,000 | 1,874 | 7.0% |
| $10,000 to $14,999 | 937 | 3.5% |
| $15,000 to $24,999 | 2,169 | 8.1% |
| $25,000 to $34,999 | 2,544 | 9.5% |
| $35,000 to $49,999 | 3,320 | 12.4% |
| $50,000 to $74,999 | 4,418 | 16.5% |
| $75,000 to $99,999 | 2,919 | 10.9% |
| $100,000 to $149,999 | 3,856 | 14.4% |
| $150,000 to $199,999 | 1,901 | 7.1% |
| $200,000+ | 2,838 | 10.6% |
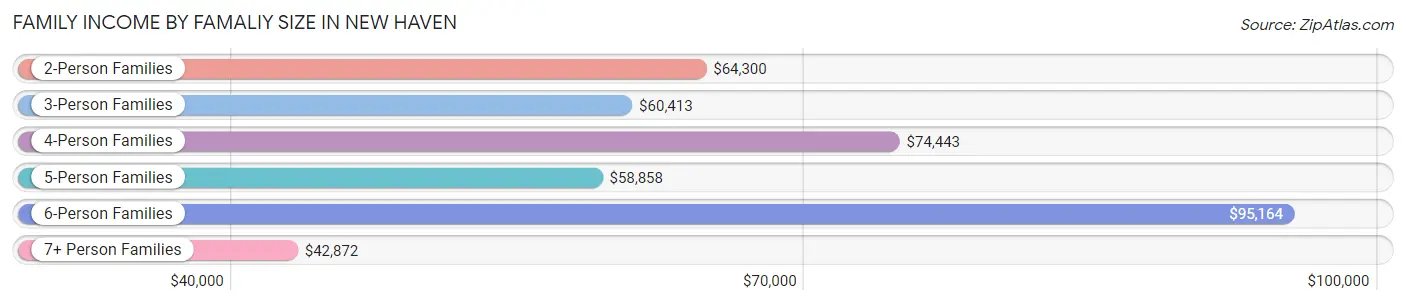
Family Income by Famaliy Size in New Haven
6-person families (789 | 2.9%) account for the highest median family income in New Haven with $95,164 per family, while 2-person families (11,632 | 43.4%) have the highest median income of $32,150 per family member.
| Income Bracket | # Families | Median Income |
| 2-Person Families | 11,632 (43.4%) | $64,300 |
| 3-Person Families | 7,416 (27.7%) | $60,413 |
| 4-Person Families | 4,169 (15.6%) | $74,443 |
| 5-Person Families | 2,200 (8.2%) | $58,858 |
| 6-Person Families | 789 (2.9%) | $95,164 |
| 7+ Person Families | 571 (2.1%) | $42,872 |
| Total | 26,777 (100.0%) | $62,870 |
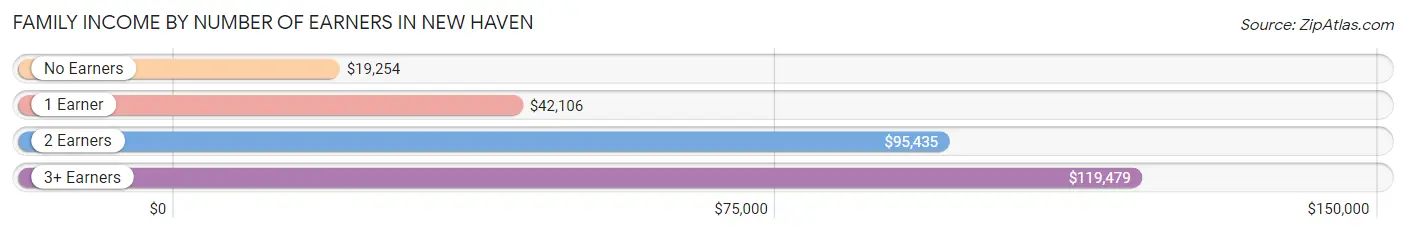
Family Income by Number of Earners in New Haven
The median family income in New Haven is $62,870, with families comprising 3+ earners (2,672) having the highest median family income of $119,479, while families with no earners (3,992) have the lowest median family income of $19,254, accounting for 10.0% and 14.9% of families, respectively.
| Number of Earners | # Families | Median Income |
| No Earners | 3,992 (14.9%) | $19,254 |
| 1 Earner | 9,451 (35.3%) | $42,106 |
| 2 Earners | 10,662 (39.8%) | $95,435 |
| 3+ Earners | 2,672 (10.0%) | $119,479 |
| Total | 26,777 (100.0%) | $62,870 |
Household Income in New Haven
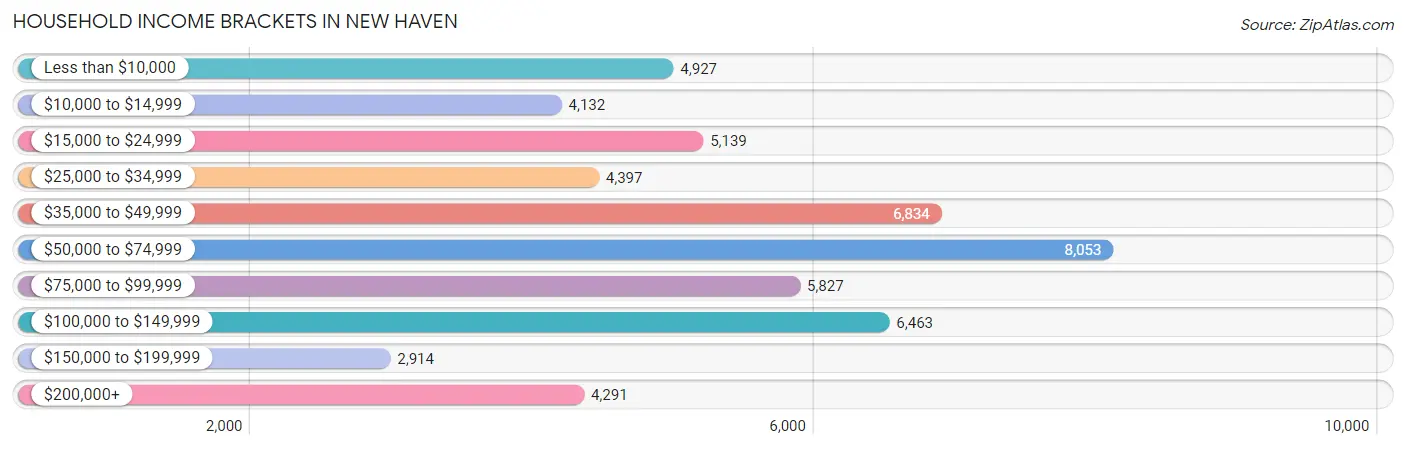
Household Income Brackets in New Haven
With 8,053 households falling in the category, the $50,000 to $74,999 income range is the most frequent in New Haven, accounting for 15.2% of all households. In contrast, only 2,914 households (5.5%) fall into the $150,000 to $199,999 income bracket, making it the least populous group.
| Income Bracket | # Households | % Households |
| Less than $10,000 | 4,927 | 9.3% |
| $10,000 to $14,999 | 4,132 | 7.8% |
| $15,000 to $24,999 | 5,139 | 9.7% |
| $25,000 to $34,999 | 4,397 | 8.3% |
| $35,000 to $49,999 | 6,834 | 12.9% |
| $50,000 to $74,999 | 8,053 | 15.2% |
| $75,000 to $99,999 | 5,827 | 11.0% |
| $100,000 to $149,999 | 6,463 | 12.2% |
| $150,000 to $199,999 | 2,914 | 5.5% |
| $200,000+ | 4,291 | 8.1% |
Household Income by Householder Age in New Haven
The median household income in New Haven is $54,305, with the highest median household income of $60,146 found in the 45 to 64 years age bracket for the primary householder. A total of 17,724 households (33.5%) fall into this category. Meanwhile, the 65+ years age bracket for the primary householder has the lowest median household income of $39,387, with 9,809 households (18.5%) in this group.
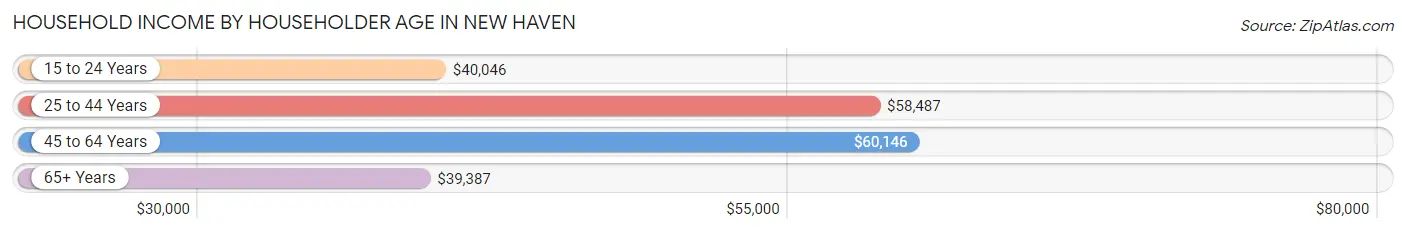
| Income Bracket | # Households | Median Income |
| 15 to 24 Years | 3,563 (6.7%) | $40,046 |
| 25 to 44 Years | 21,881 (41.3%) | $58,487 |
| 45 to 64 Years | 17,724 (33.5%) | $60,146 |
| 65+ Years | 9,809 (18.5%) | $39,387 |
| Total | 52,977 (100.0%) | $54,305 |
Poverty in New Haven
Income Below Poverty by Sex and Age in New Haven
With 23.8% poverty level for males and 26.6% for females among the residents of New Haven, 6 to 11 year old males and under 5 year old females are the most vulnerable to poverty, with 1,832 males (42.3%) and 1,731 females (40.8%) in their respective age groups living below the poverty level.
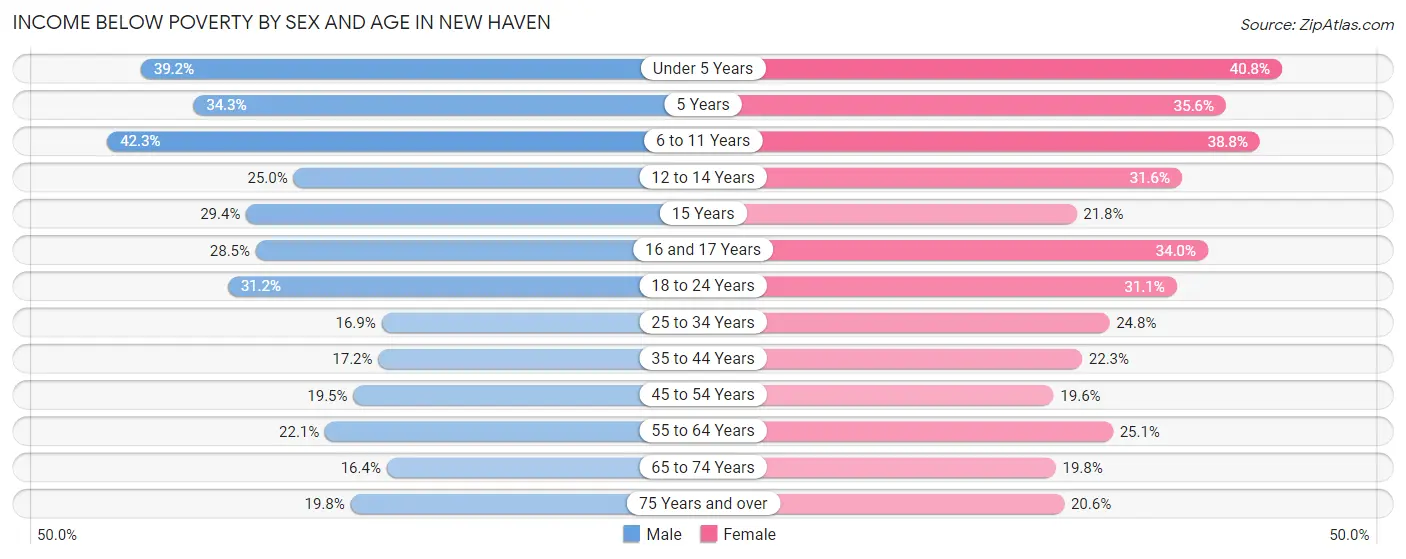
| Age Bracket | Male | Female |
| Under 5 Years | 1,541 (39.2%) | 1,731 (40.8%) |
| 5 Years | 283 (34.3%) | 247 (35.6%) |
| 6 to 11 Years | 1,832 (42.3%) | 1,840 (38.8%) |
| 12 to 14 Years | 702 (25.0%) | 838 (31.6%) |
| 15 Years | 279 (29.4%) | 163 (21.8%) |
| 16 and 17 Years | 457 (28.5%) | 623 (34.0%) |
| 18 to 24 Years | 2,030 (31.1%) | 2,163 (31.1%) |
| 25 to 34 Years | 1,952 (16.9%) | 3,323 (24.8%) |
| 35 to 44 Years | 1,453 (17.2%) | 1,961 (22.3%) |
| 45 to 54 Years | 1,257 (19.5%) | 1,689 (19.6%) |
| 55 to 64 Years | 1,238 (22.1%) | 1,630 (25.1%) |
| 65 to 74 Years | 671 (16.4%) | 946 (19.8%) |
| 75 Years and over | 435 (19.8%) | 643 (20.6%) |
| Total | 14,130 (23.8%) | 17,797 (26.6%) |
Income Above Poverty by Sex and Age in New Haven
According to the poverty statistics in New Haven, males aged 65 to 74 years and females aged 45 to 54 years are the age groups that are most secure financially, with 83.6% of males and 80.4% of females in these age groups living above the poverty line.
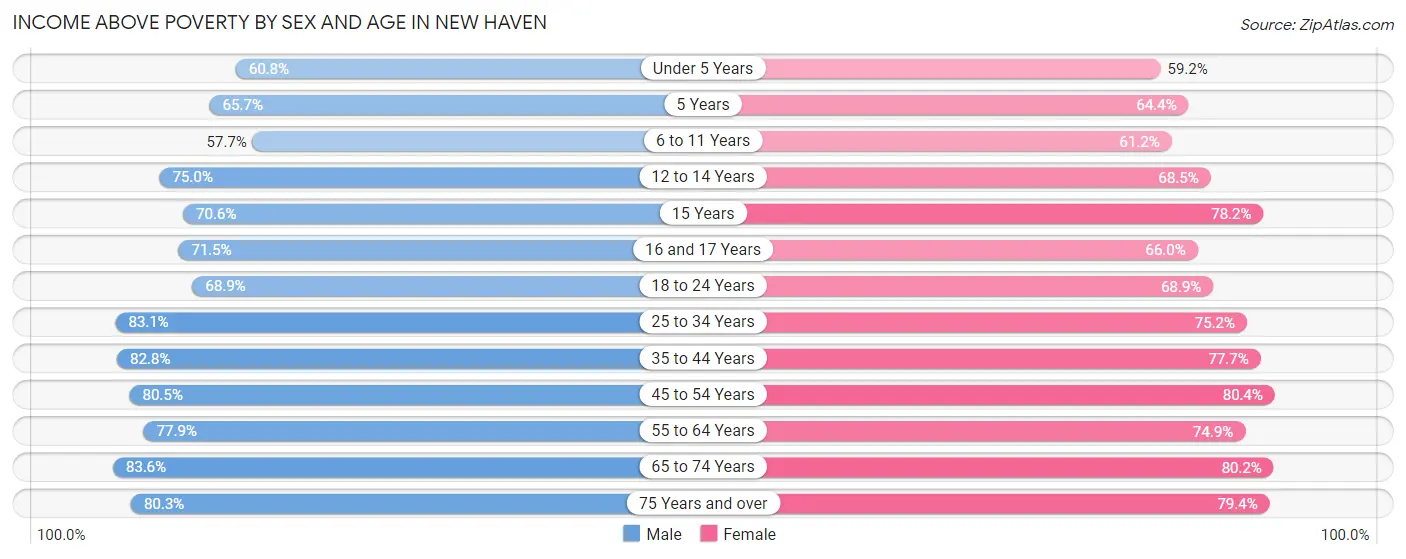
| Age Bracket | Male | Female |
| Under 5 Years | 2,389 (60.8%) | 2,508 (59.2%) |
| 5 Years | 541 (65.7%) | 446 (64.4%) |
| 6 to 11 Years | 2,496 (57.7%) | 2,903 (61.2%) |
| 12 to 14 Years | 2,101 (75.0%) | 1,818 (68.4%) |
| 15 Years | 669 (70.6%) | 586 (78.2%) |
| 16 and 17 Years | 1,144 (71.5%) | 1,211 (66.0%) |
| 18 to 24 Years | 4,486 (68.9%) | 4,798 (68.9%) |
| 25 to 34 Years | 9,621 (83.1%) | 10,066 (75.2%) |
| 35 to 44 Years | 7,011 (82.8%) | 6,842 (77.7%) |
| 45 to 54 Years | 5,194 (80.5%) | 6,909 (80.4%) |
| 55 to 64 Years | 4,362 (77.9%) | 4,854 (74.9%) |
| 65 to 74 Years | 3,422 (83.6%) | 3,821 (80.2%) |
| 75 Years and over | 1,767 (80.2%) | 2,475 (79.4%) |
| Total | 45,203 (76.2%) | 49,237 (73.5%) |
Income Below Poverty Among Married-Couple Families in New Haven
The poverty statistics for married-couple families in New Haven show that 8.6% or 1,133 of the total 13,191 families live below the poverty line. Families with 5 or more children have the highest poverty rate of 76.3%, comprising of 90 families. On the other hand, families with no children have the lowest poverty rate of 5.4%, which includes 410 families.
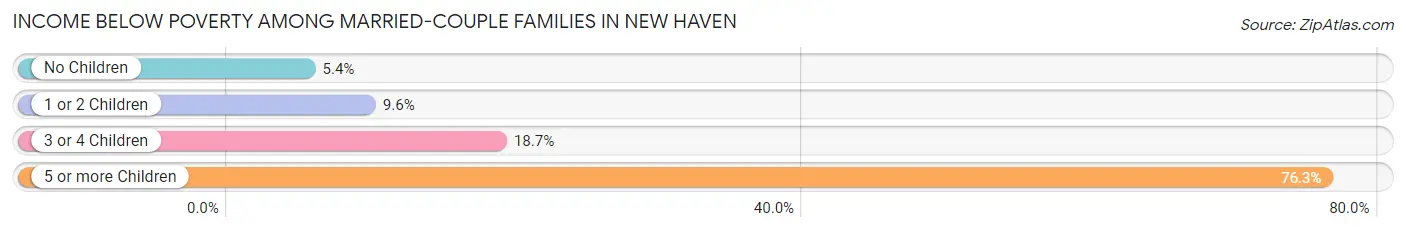
| Children | Above Poverty | Below Poverty |
| No Children | 7,181 (94.6%) | 410 (5.4%) |
| 1 or 2 Children | 3,899 (90.4%) | 414 (9.6%) |
| 3 or 4 Children | 950 (81.3%) | 219 (18.7%) |
| 5 or more Children | 28 (23.7%) | 90 (76.3%) |
| Total | 12,058 (91.4%) | 1,133 (8.6%) |
Income Below Poverty Among Single-Parent Households in New Haven
According to the poverty data in New Haven, 15.4% or 429 single-father households and 31.5% or 3,405 single-mother households are living below the poverty line. Among single-father households, those with 5 or more children have the highest poverty rate, with 14 households (100.0%) experiencing poverty. Likewise, among single-mother households, those with 5 or more children have the highest poverty rate, with 153 households (79.3%) falling below the poverty line.
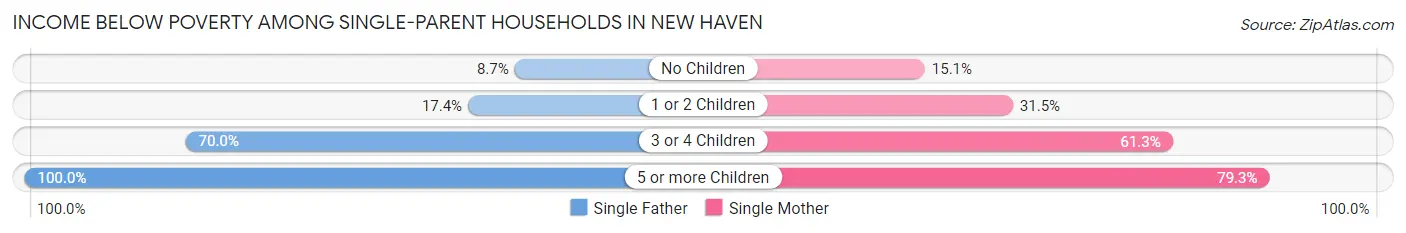
| Children | Single Father | Single Mother |
| No Children | 116 (8.7%) | 501 (15.1%) |
| 1 or 2 Children | 236 (17.4%) | 1,820 (31.5%) |
| 3 or 4 Children | 63 (70.0%) | 931 (61.3%) |
| 5 or more Children | 14 (100.0%) | 153 (79.3%) |
| Total | 429 (15.4%) | 3,405 (31.5%) |
Income Below Poverty Among Married-Couple vs Single-Parent Households in New Haven
The poverty data for New Haven shows that 1,133 of the married-couple family households (8.6%) and 3,834 of the single-parent households (28.2%) are living below the poverty level. Within the married-couple family households, those with 5 or more children have the highest poverty rate, with 90 households (76.3%) falling below the poverty line. Among the single-parent households, those with 5 or more children have the highest poverty rate, with 167 household (80.7%) living below poverty.
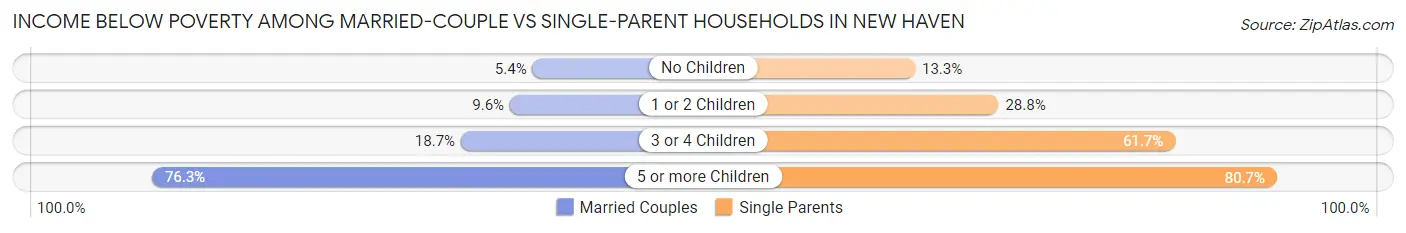
| Children | Married-Couple Families | Single-Parent Households |
| No Children | 410 (5.4%) | 617 (13.3%) |
| 1 or 2 Children | 414 (9.6%) | 2,056 (28.8%) |
| 3 or 4 Children | 219 (18.7%) | 994 (61.7%) |
| 5 or more Children | 90 (76.3%) | 167 (80.7%) |
| Total | 1,133 (8.6%) | 3,834 (28.2%) |
Race in New Haven
The most populous races in New Haven are White / Caucasian (56,867 | 41.9%), Hispanic or Latino (41,631 | 30.7%), and Black / African American (40,592 | 29.9%).
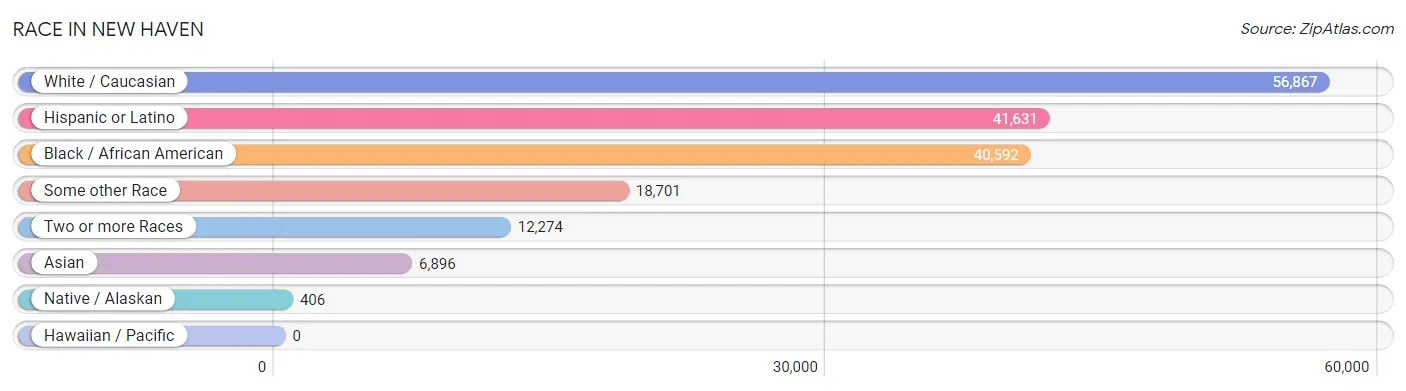
| Race | # Population | % Population |
| Asian | 6,896 | 5.1% |
| Black / African American | 40,592 | 29.9% |
| Hawaiian / Pacific | 0 | 0.0% |
| Hispanic or Latino | 41,631 | 30.7% |
| Native / Alaskan | 406 | 0.3% |
| White / Caucasian | 56,867 | 41.9% |
| Two or more Races | 12,274 | 9.0% |
| Some other Race | 18,701 | 13.8% |
| Total | 135,736 | 100.0% |
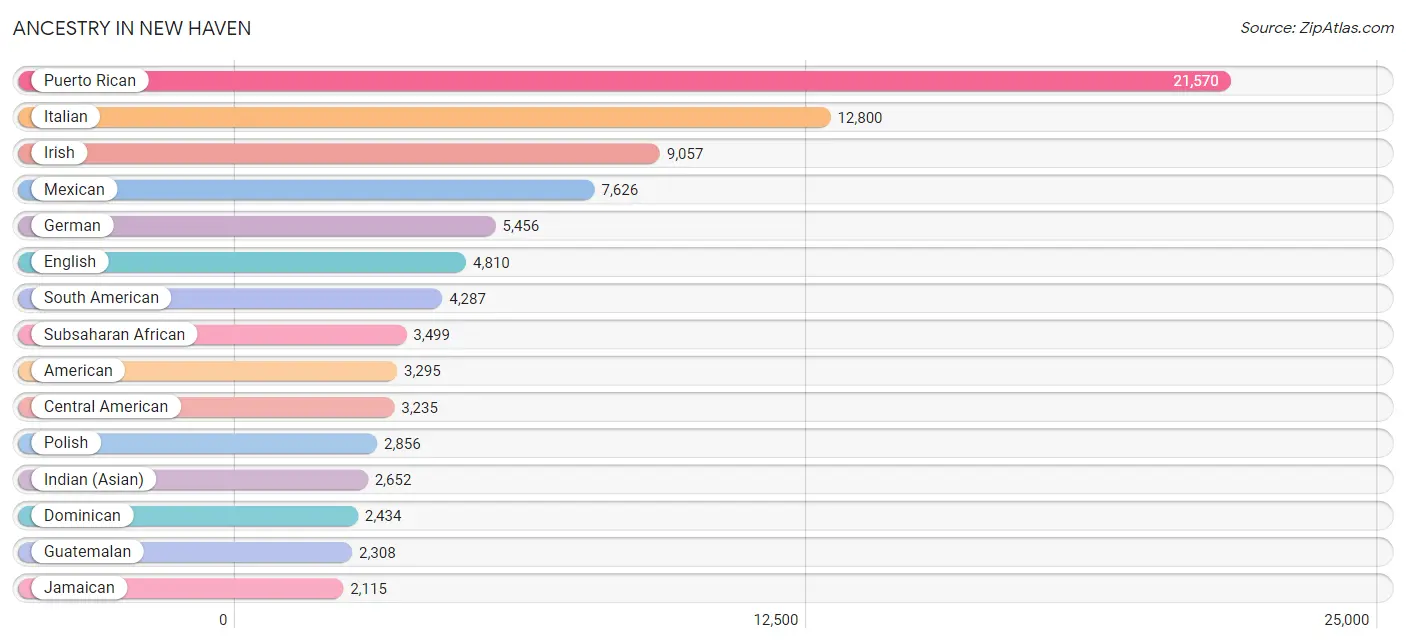
Ancestry in New Haven
The most populous ancestries reported in New Haven are Puerto Rican (21,570 | 15.9%), Italian (12,800 | 9.4%), Irish (9,057 | 6.7%), Mexican (7,626 | 5.6%), and German (5,456 | 4.0%), together accounting for 41.6% of all New Haven residents.
| Ancestry | # Population | % Population |
| Afghan | 1,179 | 0.9% |
| African | 1,838 | 1.3% |
| Albanian | 46 | 0.0% |
| Alsatian | 13 | 0.0% |
| American | 3,295 | 2.4% |
| Arab | 1,462 | 1.1% |
| Argentinean | 502 | 0.4% |
| Armenian | 77 | 0.1% |
| Australian | 10 | 0.0% |
| Austrian | 166 | 0.1% |
| Bahamian | 1 | 0.0% |
| Barbadian | 11 | 0.0% |
| Basque | 17 | 0.0% |
| Belgian | 51 | 0.0% |
| Bermudan | 12 | 0.0% |
| Bhutanese | 238 | 0.2% |
| Blackfeet | 104 | 0.1% |
| Bolivian | 107 | 0.1% |
| Brazilian | 171 | 0.1% |
| British | 870 | 0.6% |
| British West Indian | 71 | 0.1% |
| Bulgarian | 107 | 0.1% |
| Burmese | 795 | 0.6% |
| Cajun | 10 | 0.0% |
| Cambodian | 27 | 0.0% |
| Canadian | 254 | 0.2% |
| Cape Verdean | 117 | 0.1% |
| Central American | 3,235 | 2.4% |
| Central American Indian | 640 | 0.5% |
| Cherokee | 285 | 0.2% |
| Chilean | 129 | 0.1% |
| Chippewa | 8 | 0.0% |
| Choctaw | 45 | 0.0% |
| Colombian | 857 | 0.6% |
| Costa Rican | 14 | 0.0% |
| Croatian | 148 | 0.1% |
| Cuban | 806 | 0.6% |
| Czech | 167 | 0.1% |
| Czechoslovakian | 6 | 0.0% |
| Danish | 528 | 0.4% |
| Dominican | 2,434 | 1.8% |
| Dutch | 688 | 0.5% |
| Eastern European | 371 | 0.3% |
| Ecuadorian | 1,950 | 1.4% |
| Egyptian | 66 | 0.1% |
| English | 4,810 | 3.5% |
| Ethiopian | 174 | 0.1% |
| European | 807 | 0.6% |
| Filipino | 77 | 0.1% |
| Finnish | 62 | 0.1% |
| French | 1,594 | 1.2% |
| French American Indian | 6 | 0.0% |
| French Canadian | 730 | 0.5% |
| German | 5,456 | 4.0% |
| Ghanaian | 191 | 0.1% |
| Greek | 572 | 0.4% |
| Guatemalan | 2,308 | 1.7% |
| Guyanese | 112 | 0.1% |
| Haitian | 489 | 0.4% |
| Hmong | 15 | 0.0% |
| Honduran | 158 | 0.1% |
| Hungarian | 634 | 0.5% |
| Icelander | 6 | 0.0% |
| Indian (Asian) | 2,652 | 1.9% |
| Indonesian | 5 | 0.0% |
| Inupiat | 3 | 0.0% |
| Iranian | 63 | 0.1% |
| Iraqi | 110 | 0.1% |
| Irish | 9,057 | 6.7% |
| Iroquois | 1 | 0.0% |
| Israeli | 94 | 0.1% |
| Italian | 12,800 | 9.4% |
| Jamaican | 2,115 | 1.6% |
| Japanese | 59 | 0.0% |
| Jordanian | 6 | 0.0% |
| Kenyan | 127 | 0.1% |
| Korean | 426 | 0.3% |
| Laotian | 77 | 0.1% |
| Latvian | 132 | 0.1% |
| Lebanese | 112 | 0.1% |
| Liberian | 36 | 0.0% |
| Lithuanian | 395 | 0.3% |
| Macedonian | 1 | 0.0% |
| Malaysian | 80 | 0.1% |
| Mexican | 7,626 | 5.6% |
| Mexican American Indian | 200 | 0.2% |
| Mongolian | 6 | 0.0% |
| Moroccan | 157 | 0.1% |
| Native Hawaiian | 32 | 0.0% |
| Navajo | 14 | 0.0% |
| Nicaraguan | 82 | 0.1% |
| Nigerian | 172 | 0.1% |
| Northern European | 79 | 0.1% |
| Norwegian | 389 | 0.3% |
| Osage | 1 | 0.0% |
| Pakistani | 100 | 0.1% |
| Palestinian | 15 | 0.0% |
| Panamanian | 151 | 0.1% |
| Pennsylvania German | 31 | 0.0% |
| Peruvian | 528 | 0.4% |
| Polish | 2,856 | 2.1% |
| Portuguese | 847 | 0.6% |
| Puerto Rican | 21,570 | 15.9% |
| Romanian | 124 | 0.1% |
| Russian | 1,564 | 1.1% |
| Salvadoran | 522 | 0.4% |
| Samoan | 8 | 0.0% |
| Scandinavian | 195 | 0.1% |
| Scotch-Irish | 254 | 0.2% |
| Scottish | 956 | 0.7% |
| Serbian | 217 | 0.2% |
| Slavic | 35 | 0.0% |
| Slovak | 224 | 0.2% |
| Slovene | 35 | 0.0% |
| South African | 51 | 0.0% |
| South American | 4,287 | 3.2% |
| South American Indian | 113 | 0.1% |
| Spaniard | 322 | 0.2% |
| Spanish | 130 | 0.1% |
| Sri Lankan | 385 | 0.3% |
| Subsaharan African | 3,499 | 2.6% |
| Sudanese | 8 | 0.0% |
| Swedish | 761 | 0.6% |
| Swiss | 116 | 0.1% |
| Syrian | 451 | 0.3% |
| Thai | 1,426 | 1.1% |
| Trinidadian and Tobagonian | 330 | 0.2% |
| Turkish | 75 | 0.1% |
| U.S. Virgin Islander | 31 | 0.0% |
| Ukrainian | 358 | 0.3% |
| Uruguayan | 46 | 0.0% |
| Venezuelan | 156 | 0.1% |
| Vietnamese | 40 | 0.0% |
| Welsh | 337 | 0.3% |
| West Indian | 110 | 0.1% |
| Yaqui | 8 | 0.0% |
| Yugoslavian | 110 | 0.1% |
| Zimbabwean | 37 | 0.0% | View All 138 Rows |
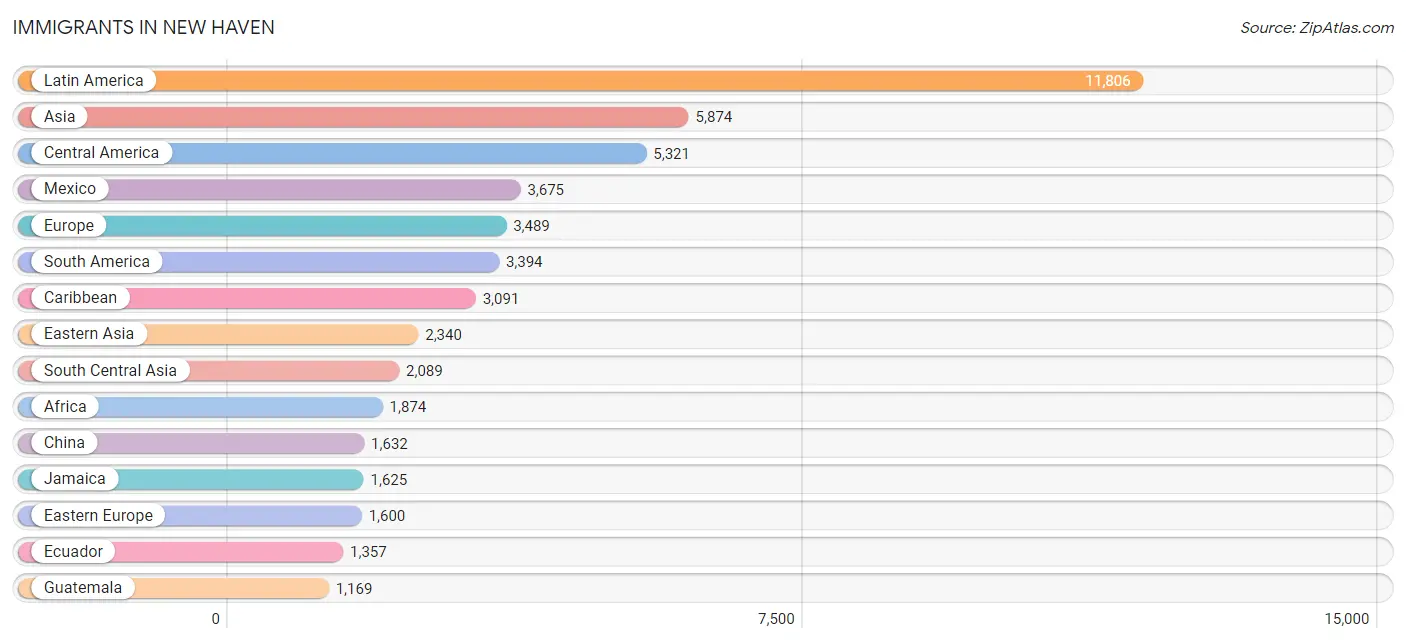
Immigrants in New Haven
The most numerous immigrant groups reported in New Haven came from Latin America (11,806 | 8.7%), Asia (5,874 | 4.3%), Central America (5,321 | 3.9%), Mexico (3,675 | 2.7%), and Europe (3,489 | 2.6%), together accounting for 22.2% of all New Haven residents.
| Immigration Origin | # Population | % Population |
| Afghanistan | 1,053 | 0.8% |
| Africa | 1,874 | 1.4% |
| Argentina | 276 | 0.2% |
| Asia | 5,874 | 4.3% |
| Australia | 51 | 0.0% |
| Austria | 21 | 0.0% |
| Bahamas | 1 | 0.0% |
| Bangladesh | 6 | 0.0% |
| Belarus | 28 | 0.0% |
| Belgium | 2 | 0.0% |
| Bolivia | 59 | 0.0% |
| Brazil | 242 | 0.2% |
| Bulgaria | 9 | 0.0% |
| Cambodia | 19 | 0.0% |
| Cameroon | 23 | 0.0% |
| Canada | 538 | 0.4% |
| Caribbean | 3,091 | 2.3% |
| Central America | 5,321 | 3.9% |
| Chile | 93 | 0.1% |
| China | 1,632 | 1.2% |
| Colombia | 749 | 0.5% |
| Congo | 68 | 0.1% |
| Costa Rica | 10 | 0.0% |
| Croatia | 78 | 0.1% |
| Cuba | 137 | 0.1% |
| Czechoslovakia | 74 | 0.1% |
| Denmark | 258 | 0.2% |
| Dominica | 55 | 0.0% |
| Dominican Republic | 769 | 0.6% |
| Eastern Africa | 559 | 0.4% |
| Eastern Asia | 2,340 | 1.7% |
| Eastern Europe | 1,600 | 1.2% |
| Ecuador | 1,357 | 1.0% |
| Egypt | 25 | 0.0% |
| El Salvador | 243 | 0.2% |
| England | 129 | 0.1% |
| Eritrea | 11 | 0.0% |
| Ethiopia | 150 | 0.1% |
| Europe | 3,489 | 2.6% |
| France | 152 | 0.1% |
| Germany | 301 | 0.2% |
| Ghana | 176 | 0.1% |
| Greece | 56 | 0.0% |
| Guatemala | 1,169 | 0.9% |
| Guyana | 92 | 0.1% |
| Haiti | 166 | 0.1% |
| Honduras | 153 | 0.1% |
| Hong Kong | 78 | 0.1% |
| Hungary | 34 | 0.0% |
| India | 707 | 0.5% |
| Indonesia | 66 | 0.1% |
| Iran | 83 | 0.1% |
| Iraq | 131 | 0.1% |
| Ireland | 47 | 0.0% |
| Israel | 155 | 0.1% |
| Italy | 271 | 0.2% |
| Jamaica | 1,625 | 1.2% |
| Japan | 149 | 0.1% |
| Jordan | 86 | 0.1% |
| Kazakhstan | 18 | 0.0% |
| Kenya | 75 | 0.1% |
| Korea | 552 | 0.4% |
| Kuwait | 15 | 0.0% |
| Laos | 51 | 0.0% |
| Latin America | 11,806 | 8.7% |
| Latvia | 33 | 0.0% |
| Lebanon | 29 | 0.0% |
| Liberia | 9 | 0.0% |
| Malaysia | 11 | 0.0% |
| Mexico | 3,675 | 2.7% |
| Middle Africa | 304 | 0.2% |
| Moldova | 42 | 0.0% |
| Morocco | 75 | 0.1% |
| Nepal | 2 | 0.0% |
| Netherlands | 11 | 0.0% |
| Nicaragua | 71 | 0.1% |
| Nigeria | 310 | 0.2% |
| North Macedonia | 21 | 0.0% |
| Northern Africa | 165 | 0.1% |
| Northern Europe | 852 | 0.6% |
| Norway | 4 | 0.0% |
| Oceania | 166 | 0.1% |
| Pakistan | 170 | 0.1% |
| Peru | 276 | 0.2% |
| Philippines | 203 | 0.2% |
| Poland | 265 | 0.2% |
| Portugal | 22 | 0.0% |
| Romania | 68 | 0.1% |
| Russia | 577 | 0.4% |
| Saudi Arabia | 31 | 0.0% |
| Scotland | 29 | 0.0% |
| Serbia | 137 | 0.1% |
| Singapore | 49 | 0.0% |
| South Africa | 46 | 0.0% |
| South America | 3,394 | 2.5% |
| South Central Asia | 2,089 | 1.5% |
| South Eastern Asia | 555 | 0.4% |
| Southern Europe | 524 | 0.4% |
| Spain | 175 | 0.1% |
| Sri Lanka | 50 | 0.0% |
| Sudan | 44 | 0.0% |
| Sweden | 78 | 0.1% |
| Switzerland | 26 | 0.0% |
| Syria | 352 | 0.3% |
| Taiwan | 92 | 0.1% |
| Thailand | 85 | 0.1% |
| Trinidad and Tobago | 184 | 0.1% |
| Turkey | 29 | 0.0% |
| Ukraine | 12 | 0.0% |
| Uruguay | 14 | 0.0% |
| Venezuela | 206 | 0.2% |
| Vietnam | 66 | 0.1% |
| Western Africa | 618 | 0.5% |
| Western Asia | 890 | 0.7% |
| Western Europe | 513 | 0.4% |
| Yemen | 25 | 0.0% |
| Zaire | 132 | 0.1% |
| Zimbabwe | 37 | 0.0% | View All 118 Rows |
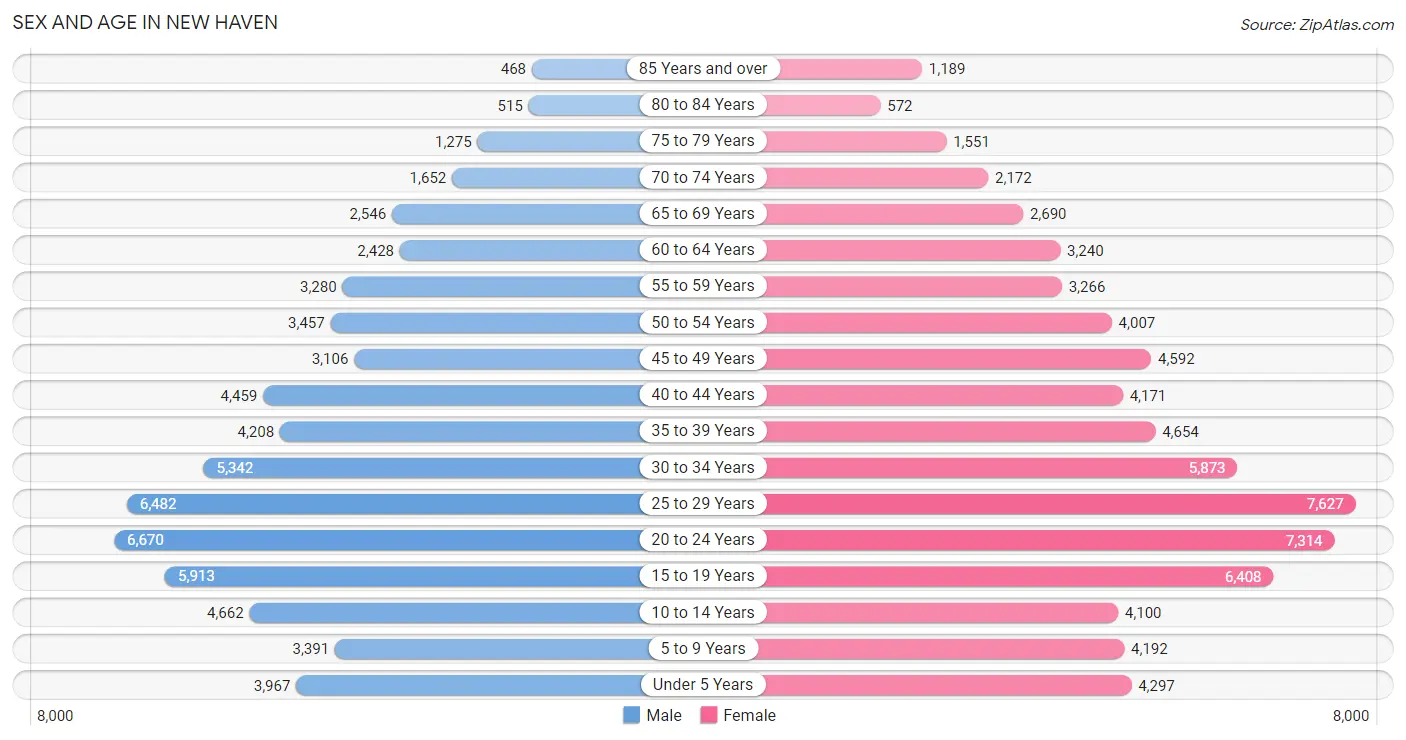
Sex and Age in New Haven
Sex and Age in New Haven
The most populous age groups in New Haven are 20 to 24 Years (6,670 | 10.4%) for men and 25 to 29 Years (7,627 | 10.6%) for women.
| Age Bracket | Male | Female |
| Under 5 Years | 3,967 (6.2%) | 4,297 (6.0%) |
| 5 to 9 Years | 3,391 (5.3%) | 4,192 (5.8%) |
| 10 to 14 Years | 4,662 (7.3%) | 4,100 (5.7%) |
| 15 to 19 Years | 5,913 (9.3%) | 6,408 (8.9%) |
| 20 to 24 Years | 6,670 (10.4%) | 7,314 (10.2%) |
| 25 to 29 Years | 6,482 (10.2%) | 7,627 (10.6%) |
| 30 to 34 Years | 5,342 (8.4%) | 5,873 (8.2%) |
| 35 to 39 Years | 4,208 (6.6%) | 4,654 (6.5%) |
| 40 to 44 Years | 4,459 (7.0%) | 4,171 (5.8%) |
| 45 to 49 Years | 3,106 (4.9%) | 4,592 (6.4%) |
| 50 to 54 Years | 3,457 (5.4%) | 4,007 (5.6%) |
| 55 to 59 Years | 3,280 (5.1%) | 3,266 (4.5%) |
| 60 to 64 Years | 2,428 (3.8%) | 3,240 (4.5%) |
| 65 to 69 Years | 2,546 (4.0%) | 2,690 (3.7%) |
| 70 to 74 Years | 1,652 (2.6%) | 2,172 (3.0%) |
| 75 to 79 Years | 1,275 (2.0%) | 1,551 (2.2%) |
| 80 to 84 Years | 515 (0.8%) | 572 (0.8%) |
| 85 Years and over | 468 (0.7%) | 1,189 (1.7%) |
| Total | 63,821 (100.0%) | 71,915 (100.0%) |
Families and Households in New Haven
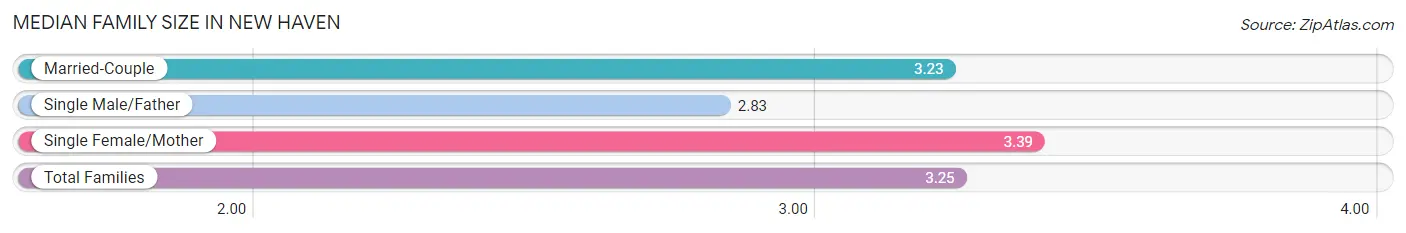
Median Family Size in New Haven
The median family size in New Haven is 3.25 persons per family, with single female/mother families (10,800 | 40.3%) accounting for the largest median family size of 3.39 persons per family. On the other hand, single male/father families (2,786 | 10.4%) represent the smallest median family size with 2.83 persons per family.
| Family Type | # Families | Family Size |
| Married-Couple | 13,191 (49.3%) | 3.23 |
| Single Male/Father | 2,786 (10.4%) | 2.83 |
| Single Female/Mother | 10,800 (40.3%) | 3.39 |
| Total Families | 26,777 (100.0%) | 3.25 |
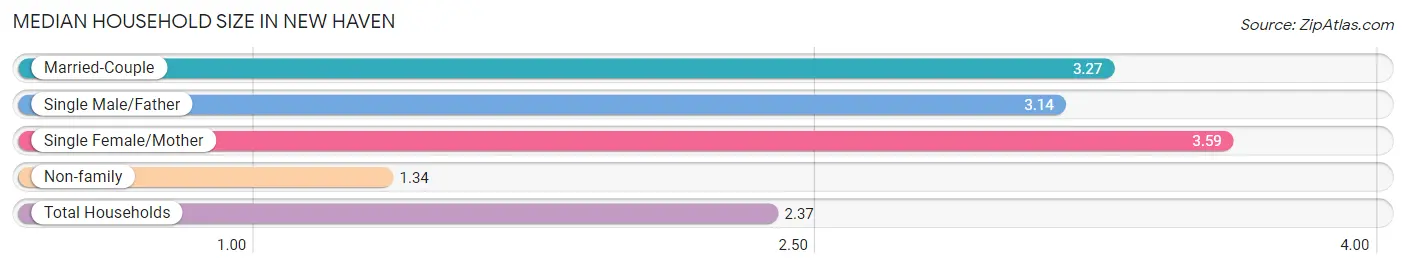
Median Household Size in New Haven
The median household size in New Haven is 2.37 persons per household, with single female/mother households (10,800 | 20.4%) accounting for the largest median household size of 3.59 persons per household. non-family households (26,200 | 49.5%) represent the smallest median household size with 1.34 persons per household.
| Household Type | # Households | Household Size |
| Married-Couple | 13,191 (24.9%) | 3.27 |
| Single Male/Father | 2,786 (5.3%) | 3.14 |
| Single Female/Mother | 10,800 (20.4%) | 3.59 |
| Non-family | 26,200 (49.5%) | 1.34 |
| Total Households | 52,977 (100.0%) | 2.37 |
Household Size by Marriage Status in New Haven
Out of a total of 52,977 households in New Haven, 26,777 (50.5%) are family households, while 26,200 (49.5%) are nonfamily households. The most numerous type of family households are 2-person households, comprising 10,387, and the most common type of nonfamily households are 1-person households, comprising 20,101.
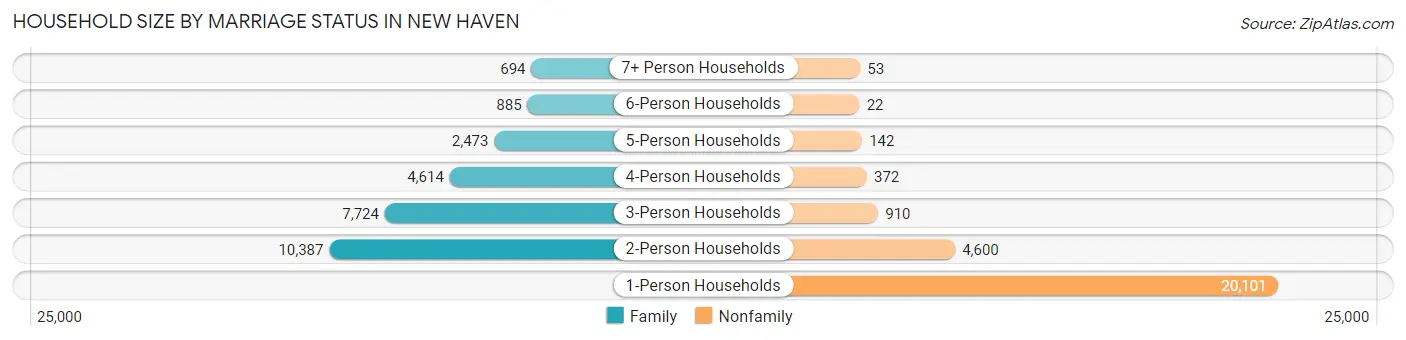
| Household Size | Family Households | Nonfamily Households |
| 1-Person Households | - | 20,101 (37.9%) |
| 2-Person Households | 10,387 (19.6%) | 4,600 (8.7%) |
| 3-Person Households | 7,724 (14.6%) | 910 (1.7%) |
| 4-Person Households | 4,614 (8.7%) | 372 (0.7%) |
| 5-Person Households | 2,473 (4.7%) | 142 (0.3%) |
| 6-Person Households | 885 (1.7%) | 22 (0.0%) |
| 7+ Person Households | 694 (1.3%) | 53 (0.1%) |
| Total | 26,777 (50.5%) | 26,200 (49.5%) |
Female Fertility in New Haven
Fertility by Age in New Haven
Average fertility rate in New Haven is 24.0 births per 1,000 women. Women in the age bracket of 20 to 34 years have the highest fertility rate with 32.0 births per 1,000 women. Women in the age bracket of 20 to 34 years acount for 67.2% of all women with births.
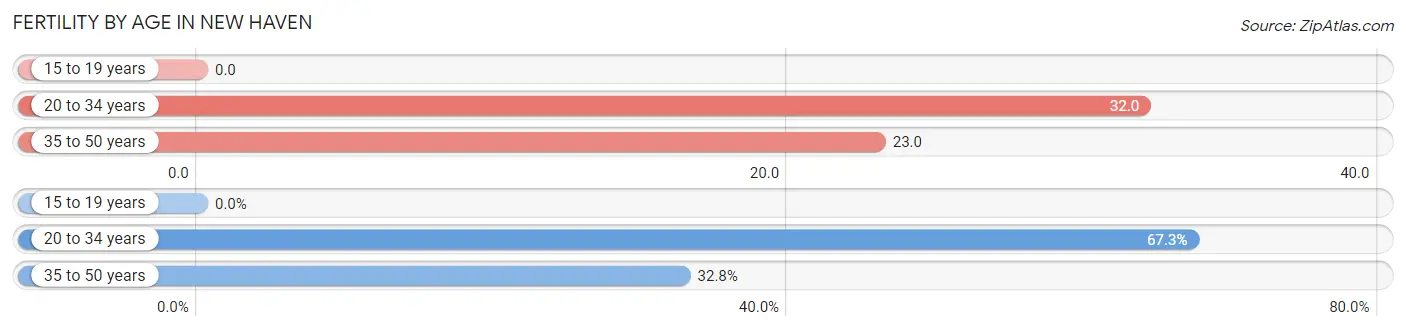
| Age Bracket | Women with Births | Births / 1,000 Women |
| 15 to 19 years | 0 (0.0%) | 0.0 |
| 20 to 34 years | 657 (67.2%) | 32.0 |
| 35 to 50 years | 320 (32.8%) | 23.0 |
| Total | 977 (100.0%) | 24.0 |
Fertility by Age by Marriage Status in New Haven
66.8% of women with births (977) in New Haven are married. The highest percentage of unmarried women with births falls into 20 to 34 years age bracket with 36.4% of them unmarried at the time of birth, while the lowest percentage of unmarried women with births belong to 35 to 50 years age bracket with 26.6% of them unmarried.
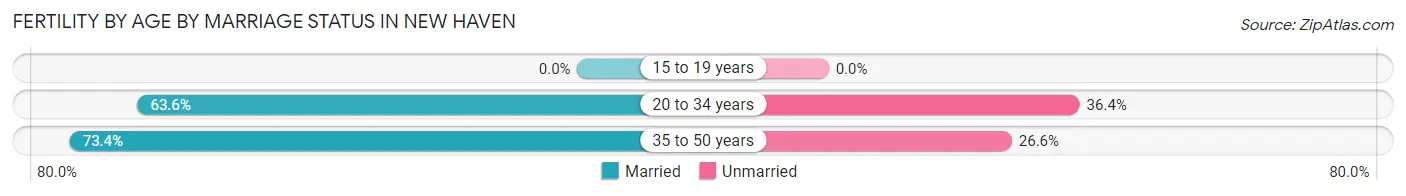
| Age Bracket | Married | Unmarried |
| 15 to 19 years | 0 (0.0%) | 0 (0.0%) |
| 20 to 34 years | 418 (63.6%) | 239 (36.4%) |
| 35 to 50 years | 235 (73.4%) | 85 (26.6%) |
| Total | 653 (66.8%) | 324 (33.2%) |
Fertility by Education in New Haven
Average fertility rate in New Haven is 24.0 births per 1,000 women. Women with the education attainment of graduate degree have the highest fertility rate of 33.0 births per 1,000 women, while women with the education attainment of less than high school have the lowest fertility at 17.0 births per 1,000 women. Women with the education attainment of college or associate's degree represent 27.1% of all women with births.
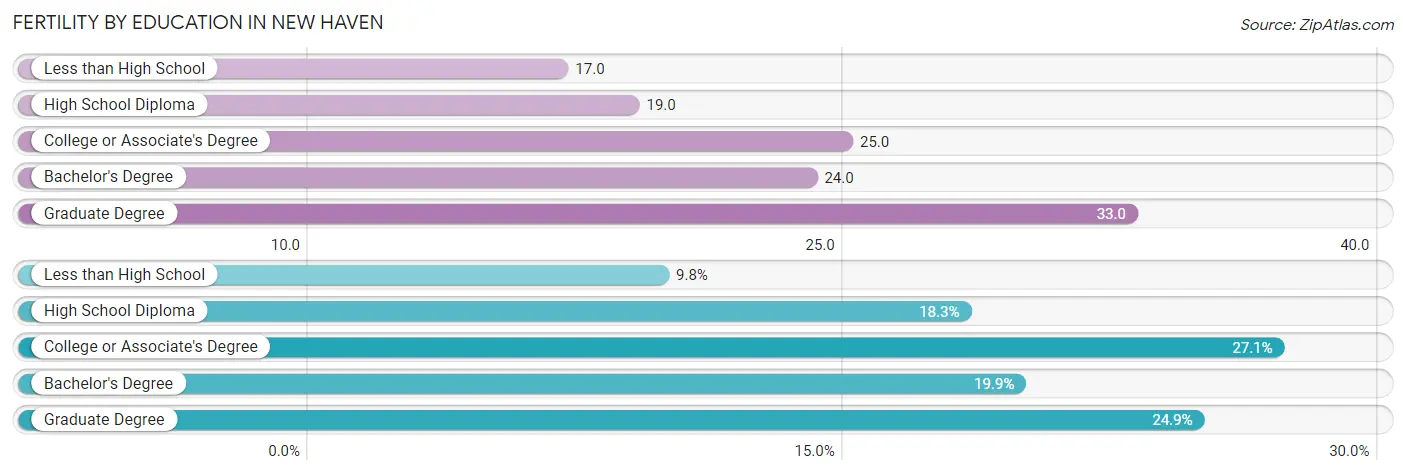
| Educational Attainment | Women with Births | Births / 1,000 Women |
| Less than High School | 96 (9.8%) | 17.0 |
| High School Diploma | 179 (18.3%) | 19.0 |
| College or Associate's Degree | 265 (27.1%) | 25.0 |
| Bachelor's Degree | 194 (19.9%) | 24.0 |
| Graduate Degree | 243 (24.9%) | 33.0 |
| Total | 977 (100.0%) | 24.0 |
Fertility by Education by Marriage Status in New Haven
33.2% of women with births in New Haven are unmarried. Women with the educational attainment of graduate degree are most likely to be married with 89.7% of them married at childbirth, while women with the educational attainment of high school diploma are least likely to be married with 69.8% of them unmarried at childbirth.
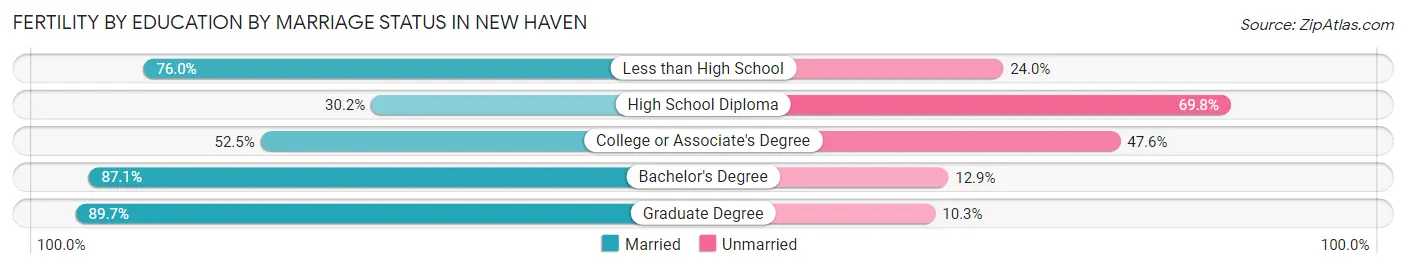
| Educational Attainment | Married | Unmarried |
| Less than High School | 73 (76.0%) | 23 (24.0%) |
| High School Diploma | 54 (30.2%) | 125 (69.8%) |
| College or Associate's Degree | 139 (52.4%) | 126 (47.5%) |
| Bachelor's Degree | 169 (87.1%) | 25 (12.9%) |
| Graduate Degree | 218 (89.7%) | 25 (10.3%) |
| Total | 653 (66.8%) | 324 (33.2%) |
Employment Characteristics in New Haven
Employment by Class of Employer in New Haven
Among the 63,696 employed individuals in New Haven, private company employees (38,248 | 60.1%), not-for-profit organizations (14,609 | 22.9%), and local government employees (3,271 | 5.1%) make up the most common classes of employment.
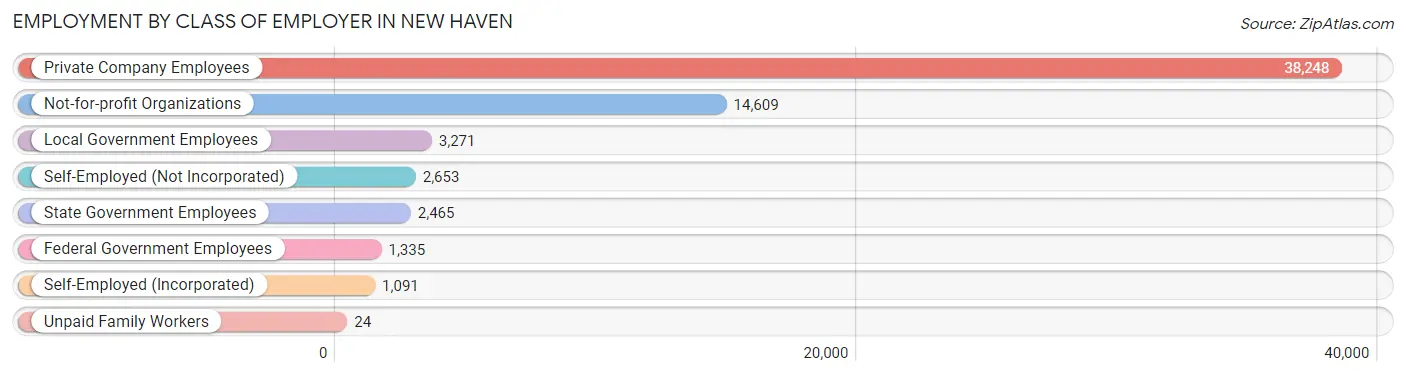
| Employer Class | # Employees | % Employees |
| Private Company Employees | 38,248 | 60.1% |
| Self-Employed (Incorporated) | 1,091 | 1.7% |
| Self-Employed (Not Incorporated) | 2,653 | 4.2% |
| Not-for-profit Organizations | 14,609 | 22.9% |
| Local Government Employees | 3,271 | 5.1% |
| State Government Employees | 2,465 | 3.9% |
| Federal Government Employees | 1,335 | 2.1% |
| Unpaid Family Workers | 24 | 0.0% |
| Total | 63,696 | 100.0% |
Employment Status by Age in New Haven
According to the labor force statistics for New Haven, out of the total population over 16 years of age (109,429), 64.6% or 70,691 individuals are in the labor force, with 7.8% or 5,514 of them unemployed. The age group with the highest labor force participation rate is 35 to 44 years, with 83.6% or 14,623 individuals in the labor force. Within the labor force, the 16 to 19 years age range has the highest percentage of unemployed individuals, with 16.2% or 683 of them being unemployed.
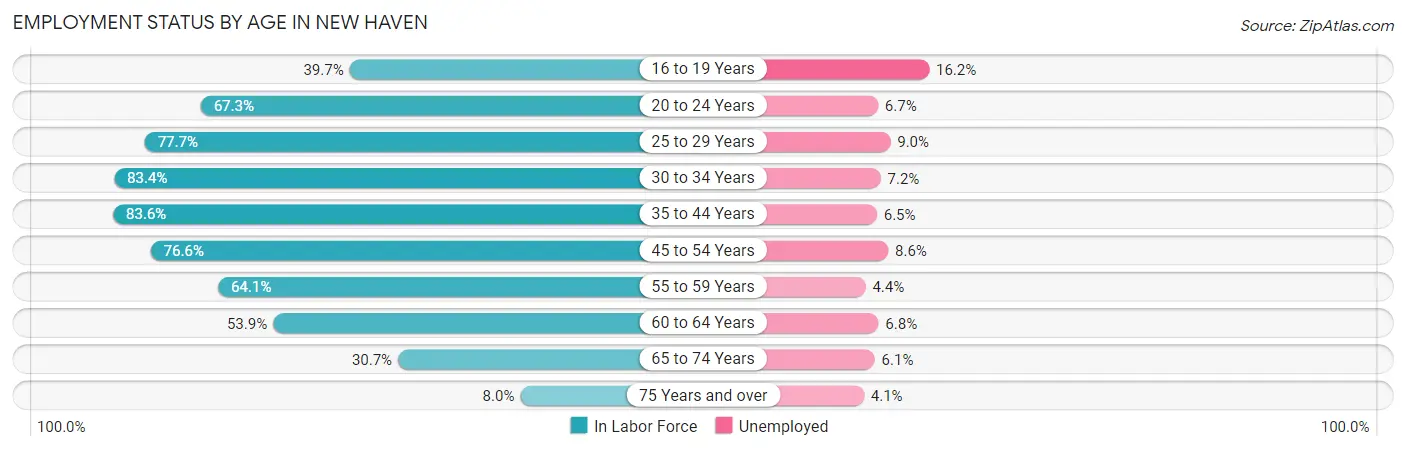
| Age Bracket | In Labor Force | Unemployed |
| 16 to 19 Years | 4,217 (39.7%) | 683 (16.2%) |
| 20 to 24 Years | 9,411 (67.3%) | 631 (6.7%) |
| 25 to 29 Years | 10,963 (77.7%) | 987 (9.0%) |
| 30 to 34 Years | 9,353 (83.4%) | 673 (7.2%) |
| 35 to 44 Years | 14,623 (83.6%) | 950 (6.5%) |
| 45 to 54 Years | 11,614 (76.6%) | 999 (8.6%) |
| 55 to 59 Years | 4,196 (64.1%) | 185 (4.4%) |
| 60 to 64 Years | 3,055 (53.9%) | 208 (6.8%) |
| 65 to 74 Years | 2,781 (30.7%) | 170 (6.1%) |
| 75 Years and over | 446 (8.0%) | 18 (4.1%) |
| Total | 70,691 (64.6%) | 5,514 (7.8%) |
Employment Status by Educational Attainment in New Haven
According to labor force statistics for New Haven, 76.6% of individuals (53,767) out of the total population between 25 and 64 years of age (70,192) are in the labor force, with 7.4% or 3,979 of them being unemployed. The group with the highest labor force participation rate are those with the educational attainment of bachelor's degree or higher, with 84.5% or 23,331 individuals in the labor force. Within the labor force, individuals with high school diploma education have the highest percentage of unemployment, with 12.9% or 2,025 of them being unemployed.
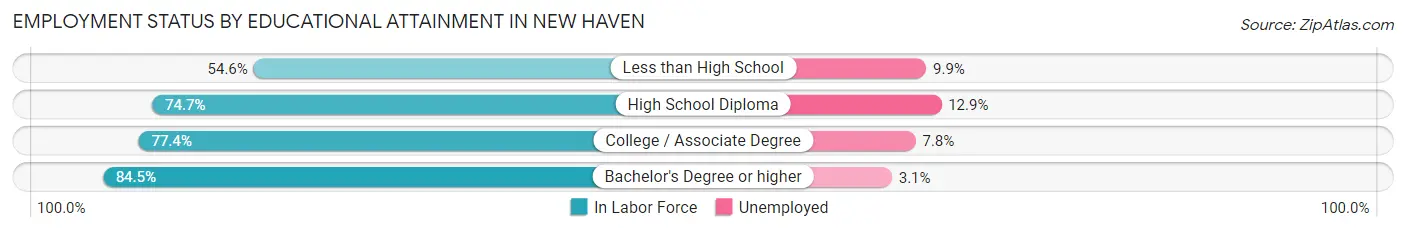
| Educational Attainment | In Labor Force | Unemployed |
| Less than High School | 4,633 (54.6%) | 840 (9.9%) |
| High School Diploma | 15,694 (74.7%) | 2,710 (12.9%) |
| College / Associate Degree | 10,129 (77.4%) | 1,021 (7.8%) |
| Bachelor's Degree or higher | 23,331 (84.5%) | 856 (3.1%) |
| Total | 53,767 (76.6%) | 5,194 (7.4%) |
Employment Occupations by Sex in New Haven
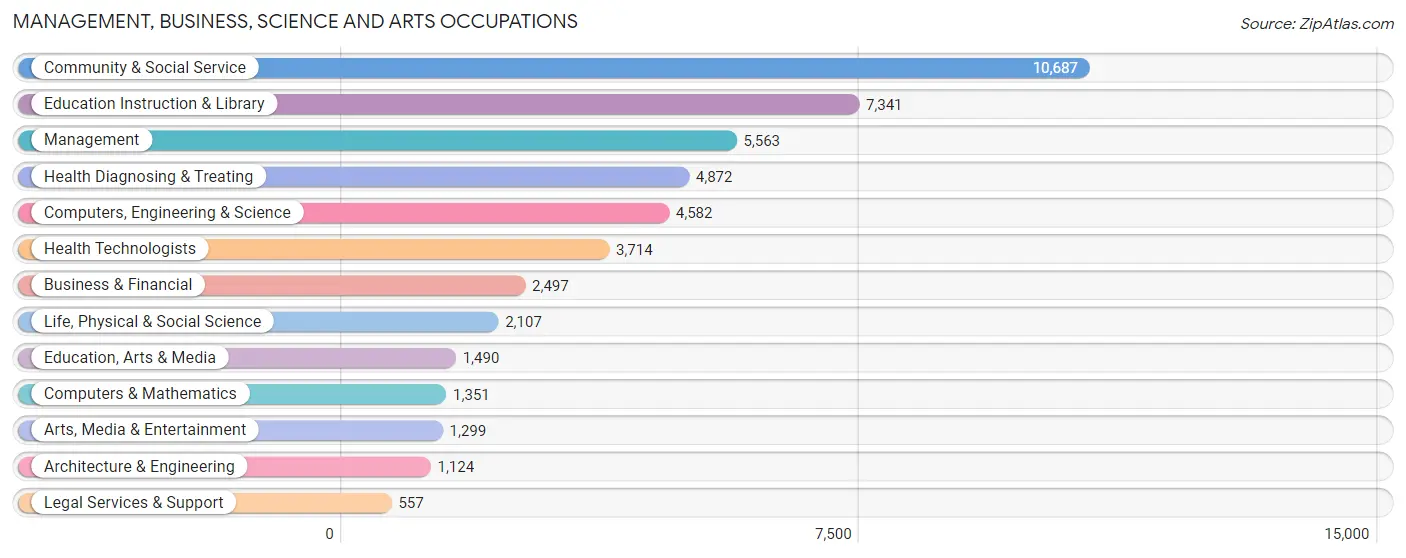
Management, Business, Science and Arts Occupations
The most common Management, Business, Science and Arts occupations in New Haven are Community & Social Service (10,687 | 16.4%), Education Instruction & Library (7,341 | 11.3%), Management (5,563 | 8.6%), Health Diagnosing & Treating (4,872 | 7.5%), and Computers, Engineering & Science (4,582 | 7.0%).
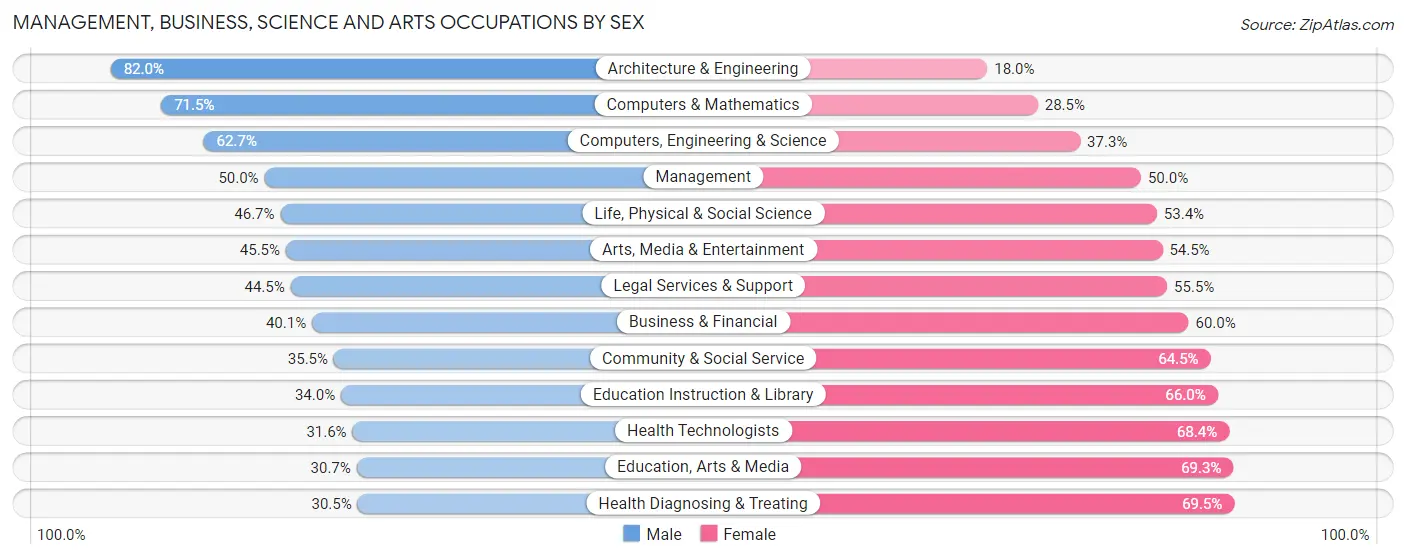
Management, Business, Science and Arts Occupations by Sex
Within the Management, Business, Science and Arts occupations in New Haven, the most male-oriented occupations are Architecture & Engineering (82.0%), Computers & Mathematics (71.5%), and Computers, Engineering & Science (62.7%), while the most female-oriented occupations are Health Diagnosing & Treating (69.5%), Education, Arts & Media (69.3%), and Health Technologists (68.4%).
| Occupation | Male | Female |
| Management | 2,780 (50.0%) | 2,783 (50.0%) |
| Business & Financial | 1,000 (40.1%) | 1,497 (60.0%) |
| Computers, Engineering & Science | 2,871 (62.7%) | 1,711 (37.3%) |
| Computers & Mathematics | 966 (71.5%) | 385 (28.5%) |
| Architecture & Engineering | 922 (82.0%) | 202 (18.0%) |
| Life, Physical & Social Science | 983 (46.7%) | 1,124 (53.3%) |
| Community & Social Service | 3,793 (35.5%) | 6,894 (64.5%) |
| Education, Arts & Media | 458 (30.7%) | 1,032 (69.3%) |
| Legal Services & Support | 248 (44.5%) | 309 (55.5%) |
| Education Instruction & Library | 2,496 (34.0%) | 4,845 (66.0%) |
| Arts, Media & Entertainment | 591 (45.5%) | 708 (54.5%) |
| Health Diagnosing & Treating | 1,488 (30.5%) | 3,384 (69.5%) |
| Health Technologists | 1,174 (31.6%) | 2,540 (68.4%) |
| Total (Category) | 11,932 (42.3%) | 16,269 (57.7%) |
| Total (Overall) | 30,701 (47.2%) | 34,385 (52.8%) |
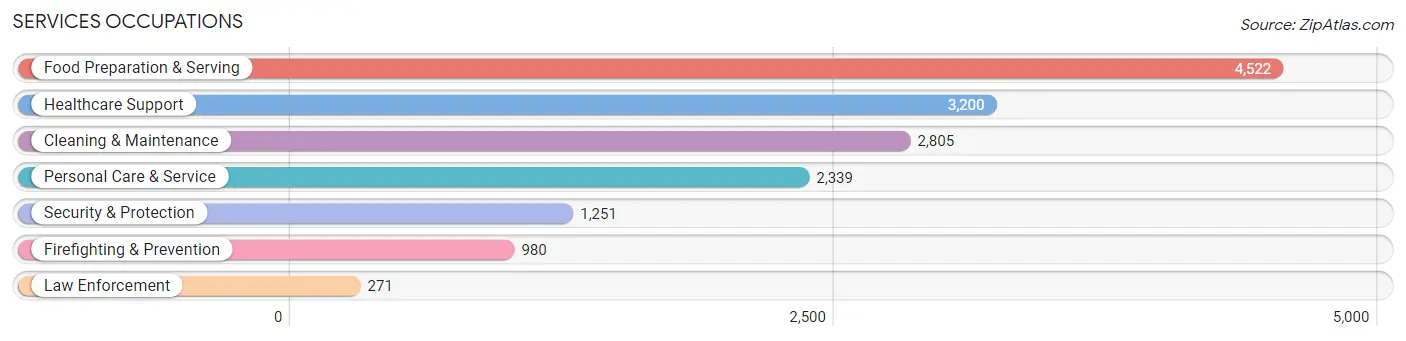
Services Occupations
The most common Services occupations in New Haven are Food Preparation & Serving (4,522 | 7.0%), Healthcare Support (3,200 | 4.9%), Cleaning & Maintenance (2,805 | 4.3%), Personal Care & Service (2,339 | 3.6%), and Security & Protection (1,251 | 1.9%).
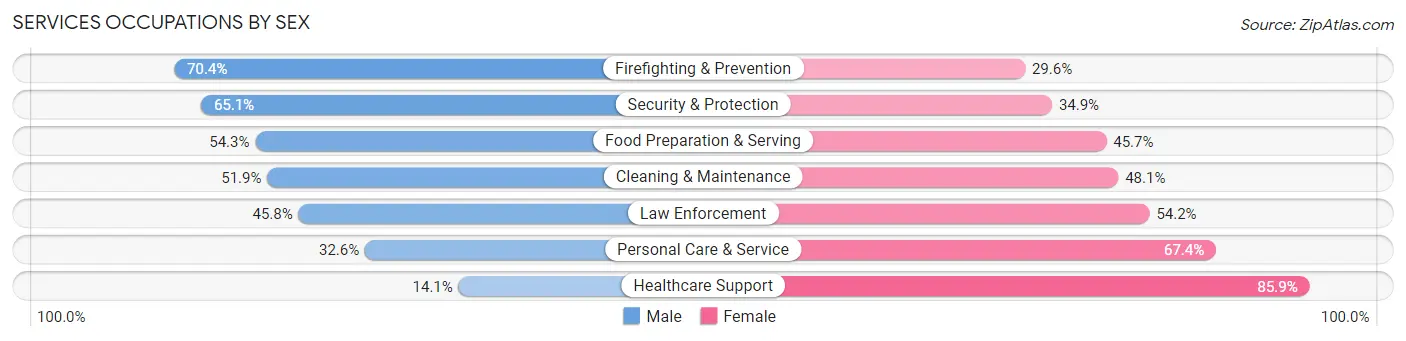
Services Occupations by Sex
Within the Services occupations in New Haven, the most male-oriented occupations are Firefighting & Prevention (70.4%), Security & Protection (65.1%), and Food Preparation & Serving (54.3%), while the most female-oriented occupations are Healthcare Support (85.9%), Personal Care & Service (67.4%), and Law Enforcement (54.2%).
| Occupation | Male | Female |
| Healthcare Support | 450 (14.1%) | 2,750 (85.9%) |
| Security & Protection | 814 (65.1%) | 437 (34.9%) |
| Firefighting & Prevention | 690 (70.4%) | 290 (29.6%) |
| Law Enforcement | 124 (45.8%) | 147 (54.2%) |
| Food Preparation & Serving | 2,456 (54.3%) | 2,066 (45.7%) |
| Cleaning & Maintenance | 1,457 (51.9%) | 1,348 (48.1%) |
| Personal Care & Service | 762 (32.6%) | 1,577 (67.4%) |
| Total (Category) | 5,939 (42.1%) | 8,178 (57.9%) |
| Total (Overall) | 30,701 (47.2%) | 34,385 (52.8%) |
Sales and Office Occupations
The most common Sales and Office occupations in New Haven are Office & Administration (5,957 | 9.1%), and Sales & Related (4,463 | 6.9%).

Sales and Office Occupations by Sex
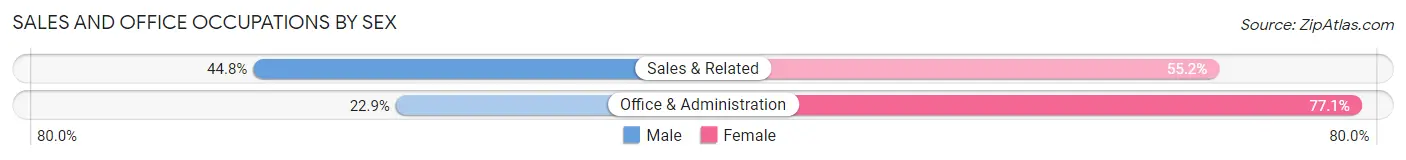
| Occupation | Male | Female |
| Sales & Related | 2,001 (44.8%) | 2,462 (55.2%) |
| Office & Administration | 1,365 (22.9%) | 4,592 (77.1%) |
| Total (Category) | 3,366 (32.3%) | 7,054 (67.7%) |
| Total (Overall) | 30,701 (47.2%) | 34,385 (52.8%) |
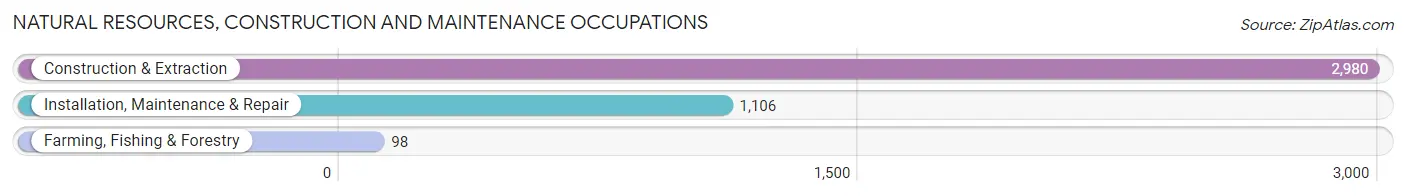
Natural Resources, Construction and Maintenance Occupations
The most common Natural Resources, Construction and Maintenance occupations in New Haven are Construction & Extraction (2,980 | 4.6%), Installation, Maintenance & Repair (1,106 | 1.7%), and Farming, Fishing & Forestry (98 | 0.2%).
Natural Resources, Construction and Maintenance Occupations by Sex
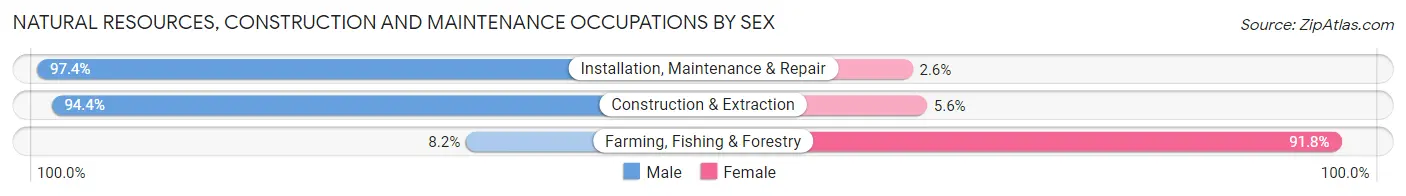
| Occupation | Male | Female |
| Farming, Fishing & Forestry | 8 (8.2%) | 90 (91.8%) |
| Construction & Extraction | 2,813 (94.4%) | 167 (5.6%) |
| Installation, Maintenance & Repair | 1,077 (97.4%) | 29 (2.6%) |
| Total (Category) | 3,898 (93.2%) | 286 (6.8%) |
| Total (Overall) | 30,701 (47.2%) | 34,385 (52.8%) |
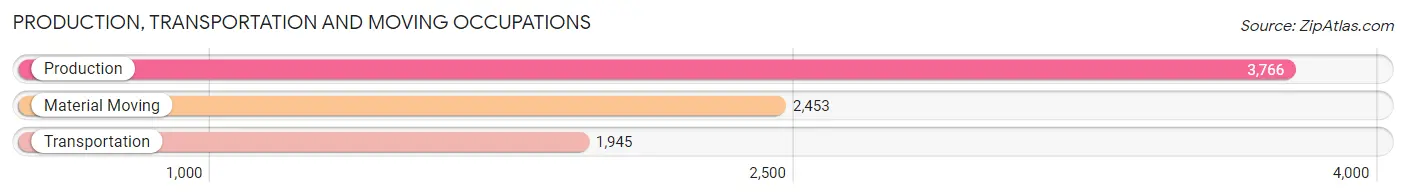
Production, Transportation and Moving Occupations
The most common Production, Transportation and Moving occupations in New Haven are Production (3,766 | 5.8%), Material Moving (2,453 | 3.8%), and Transportation (1,945 | 3.0%).
Production, Transportation and Moving Occupations by Sex
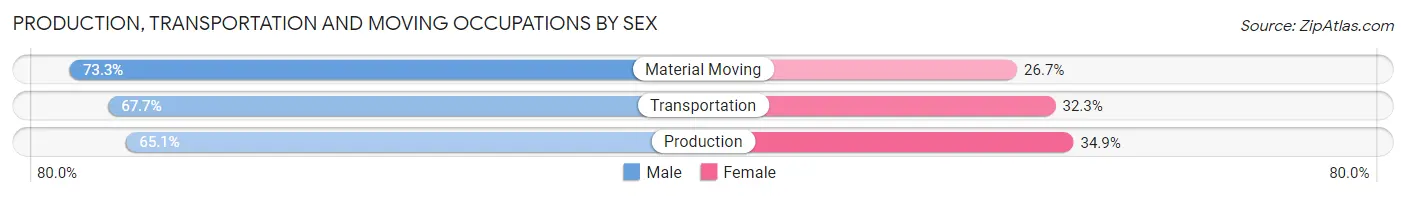
| Occupation | Male | Female |
| Production | 2,450 (65.1%) | 1,316 (34.9%) |
| Transportation | 1,317 (67.7%) | 628 (32.3%) |
| Material Moving | 1,799 (73.3%) | 654 (26.7%) |
| Total (Category) | 5,566 (68.2%) | 2,598 (31.8%) |
| Total (Overall) | 30,701 (47.2%) | 34,385 (52.8%) |
Employment Industries by Sex in New Haven
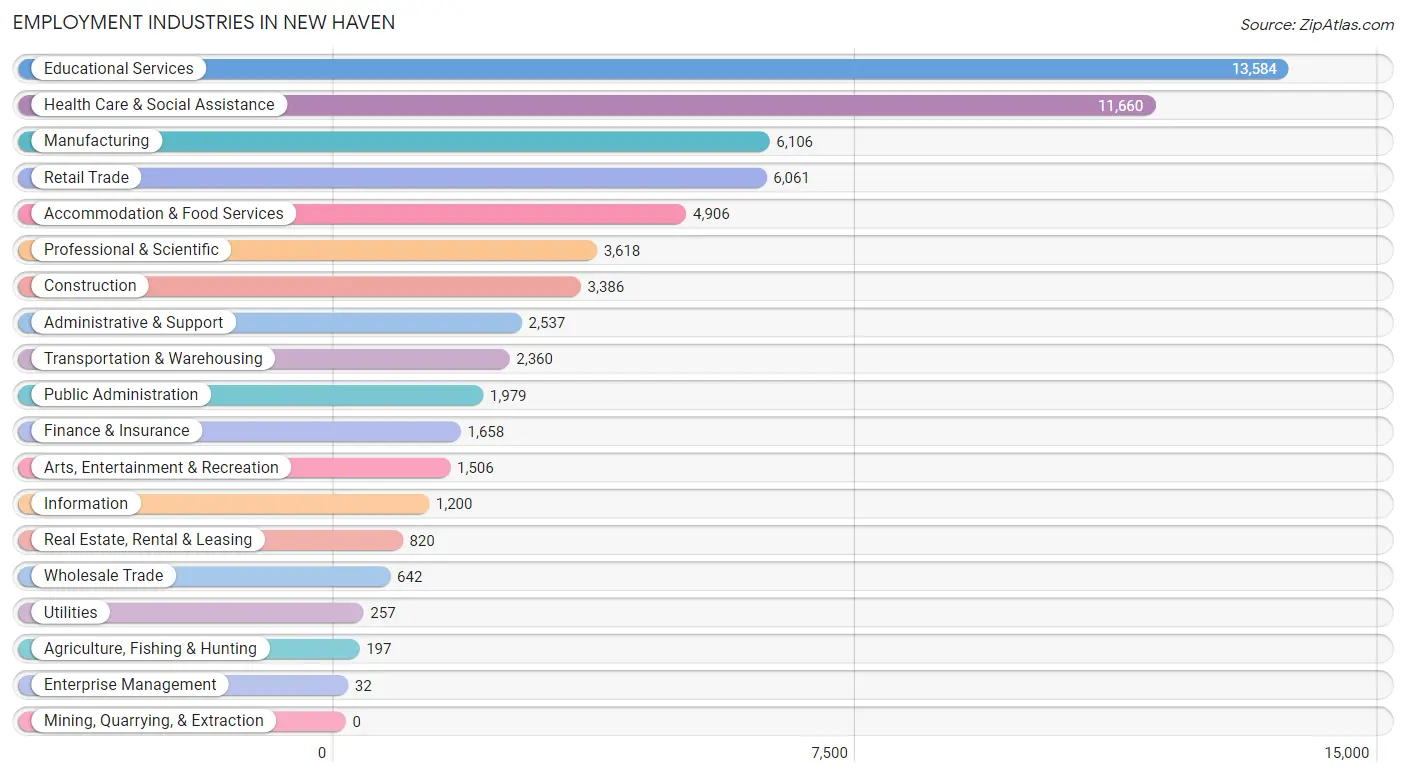
Employment Industries in New Haven
The major employment industries in New Haven include Educational Services (13,584 | 20.9%), Health Care & Social Assistance (11,660 | 17.9%), Manufacturing (6,106 | 9.4%), Retail Trade (6,061 | 9.3%), and Accommodation & Food Services (4,906 | 7.5%).
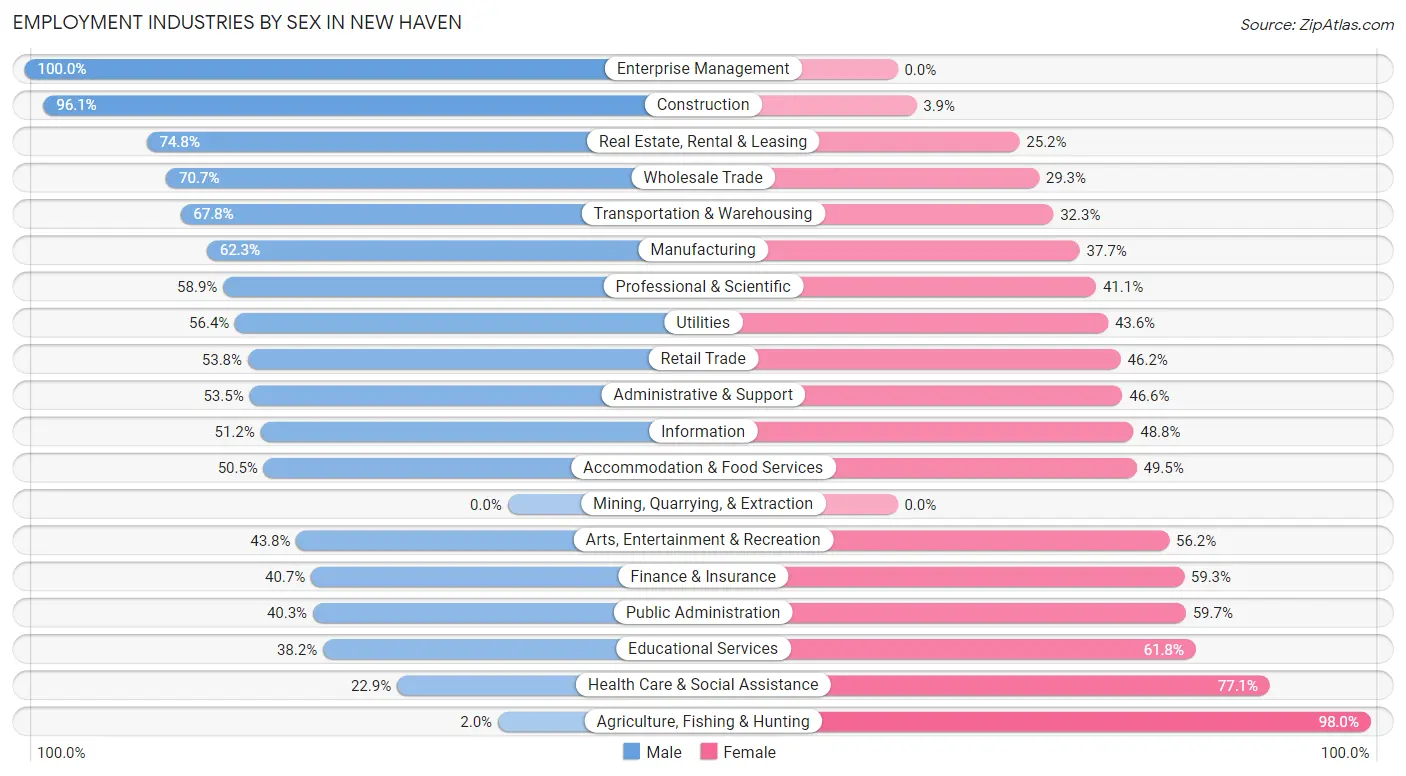
Employment Industries by Sex in New Haven
The New Haven industries that see more men than women are Enterprise Management (100.0%), Construction (96.1%), and Real Estate, Rental & Leasing (74.8%), whereas the industries that tend to have a higher number of women are Agriculture, Fishing & Hunting (98.0%), Health Care & Social Assistance (77.1%), and Educational Services (61.8%).
| Industry | Male | Female |
| Agriculture, Fishing & Hunting | 4 (2.0%) | 193 (98.0%) |
| Mining, Quarrying, & Extraction | 0 (0.0%) | 0 (0.0%) |
| Construction | 3,254 (96.1%) | 132 (3.9%) |
| Manufacturing | 3,803 (62.3%) | 2,303 (37.7%) |
| Wholesale Trade | 454 (70.7%) | 188 (29.3%) |
| Retail Trade | 3,260 (53.8%) | 2,801 (46.2%) |
| Transportation & Warehousing | 1,599 (67.7%) | 761 (32.3%) |
| Utilities | 145 (56.4%) | 112 (43.6%) |
| Information | 614 (51.2%) | 586 (48.8%) |
| Finance & Insurance | 675 (40.7%) | 983 (59.3%) |
| Real Estate, Rental & Leasing | 613 (74.8%) | 207 (25.2%) |
| Professional & Scientific | 2,131 (58.9%) | 1,487 (41.1%) |
| Enterprise Management | 32 (100.0%) | 0 (0.0%) |
| Administrative & Support | 1,356 (53.4%) | 1,181 (46.6%) |
| Educational Services | 5,194 (38.2%) | 8,390 (61.8%) |
| Health Care & Social Assistance | 2,673 (22.9%) | 8,987 (77.1%) |
| Arts, Entertainment & Recreation | 659 (43.8%) | 847 (56.2%) |
| Accommodation & Food Services | 2,478 (50.5%) | 2,428 (49.5%) |
| Public Administration | 798 (40.3%) | 1,181 (59.7%) |
| Total | 30,701 (47.2%) | 34,385 (52.8%) |
Education in New Haven
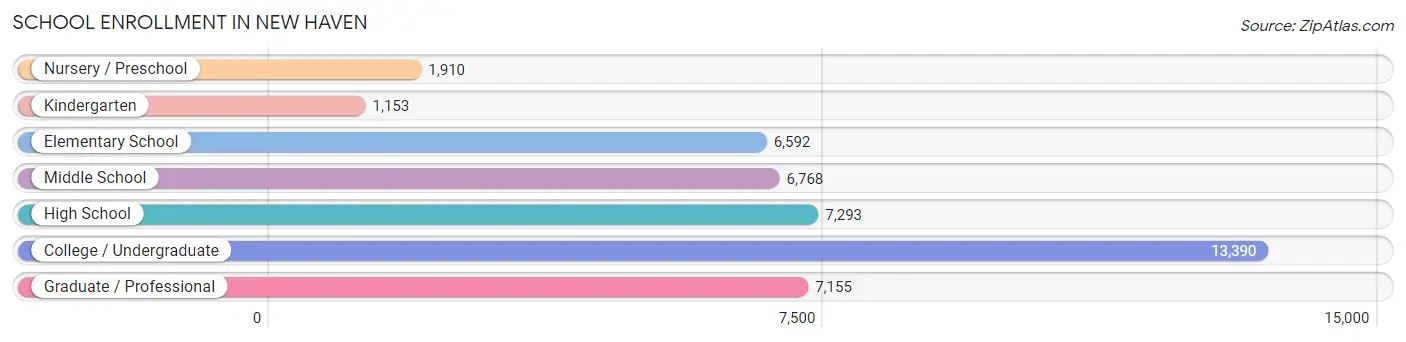
School Enrollment in New Haven
The most common levels of schooling among the 44,261 students in New Haven are college / undergraduate (13,390 | 30.2%), high school (7,293 | 16.5%), and graduate / professional (7,155 | 16.2%).
| School Level | # Students | % Students |
| Nursery / Preschool | 1,910 | 4.3% |
| Kindergarten | 1,153 | 2.6% |
| Elementary School | 6,592 | 14.9% |
| Middle School | 6,768 | 15.3% |
| High School | 7,293 | 16.5% |
| College / Undergraduate | 13,390 | 30.2% |
| Graduate / Professional | 7,155 | 16.2% |
| Total | 44,261 | 100.0% |
School Enrollment by Age by Funding Source in New Haven
Out of a total of 44,261 students who are enrolled in schools in New Haven, 14,783 (33.4%) attend a private institution, while the remaining 29,478 (66.6%) are enrolled in public schools. The age group of 25 to 34 year olds has the highest likelihood of being enrolled in private schools, with 4,217 (74.9% in the age bracket) enrolled. Conversely, the age group of 5 to 9 year old has the lowest likelihood of being enrolled in a private school, with 6,723 (94.2% in the age bracket) attending a public institution.
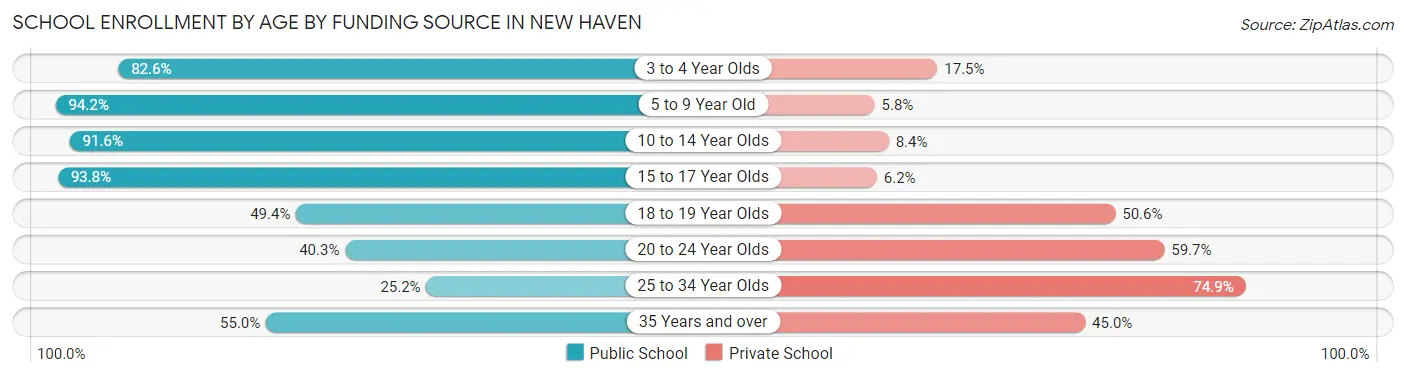
| Age Bracket | Public School | Private School |
| 3 to 4 Year Olds | 1,452 (82.6%) | 307 (17.4%) |
| 5 to 9 Year Old | 6,723 (94.2%) | 411 (5.8%) |
| 10 to 14 Year Olds | 7,893 (91.6%) | 723 (8.4%) |
| 15 to 17 Year Olds | 4,770 (93.8%) | 314 (6.2%) |
| 18 to 19 Year Olds | 3,104 (49.4%) | 3,180 (50.6%) |
| 20 to 24 Year Olds | 3,374 (40.3%) | 5,002 (59.7%) |
| 25 to 34 Year Olds | 1,417 (25.2%) | 4,217 (74.9%) |
| 35 Years and over | 756 (55.0%) | 618 (45.0%) |
| Total | 29,478 (66.6%) | 14,783 (33.4%) |
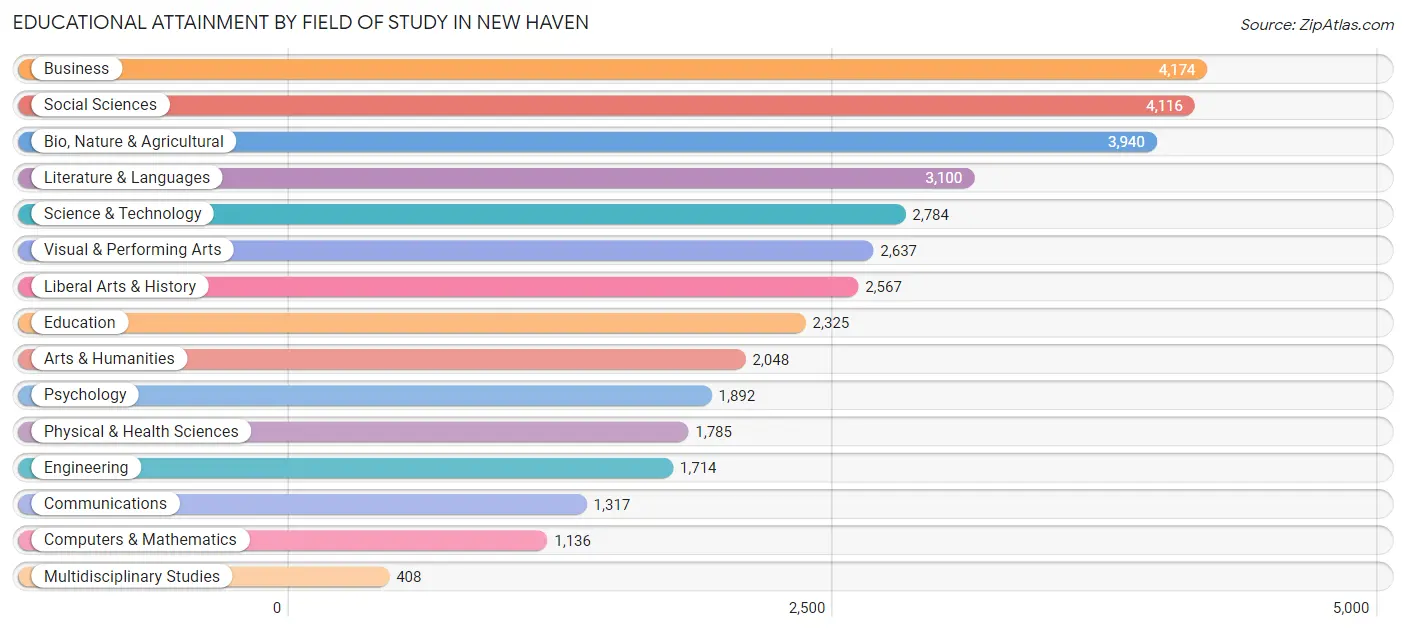
Educational Attainment by Field of Study in New Haven
Business (4,174 | 11.6%), social sciences (4,116 | 11.5%), bio, nature & agricultural (3,940 | 11.0%), literature & languages (3,100 | 8.6%), and science & technology (2,784 | 7.7%) are the most common fields of study among 35,943 individuals in New Haven who have obtained a bachelor's degree or higher.
| Field of Study | # Graduates | % Graduates |
| Computers & Mathematics | 1,136 | 3.2% |
| Bio, Nature & Agricultural | 3,940 | 11.0% |
| Physical & Health Sciences | 1,785 | 5.0% |
| Psychology | 1,892 | 5.3% |
| Social Sciences | 4,116 | 11.5% |
| Engineering | 1,714 | 4.8% |
| Multidisciplinary Studies | 408 | 1.1% |
| Science & Technology | 2,784 | 7.7% |
| Business | 4,174 | 11.6% |
| Education | 2,325 | 6.5% |
| Literature & Languages | 3,100 | 8.6% |
| Liberal Arts & History | 2,567 | 7.1% |
| Visual & Performing Arts | 2,637 | 7.3% |
| Communications | 1,317 | 3.7% |
| Arts & Humanities | 2,048 | 5.7% |
| Total | 35,943 | 100.0% |
Transportation & Commute in New Haven
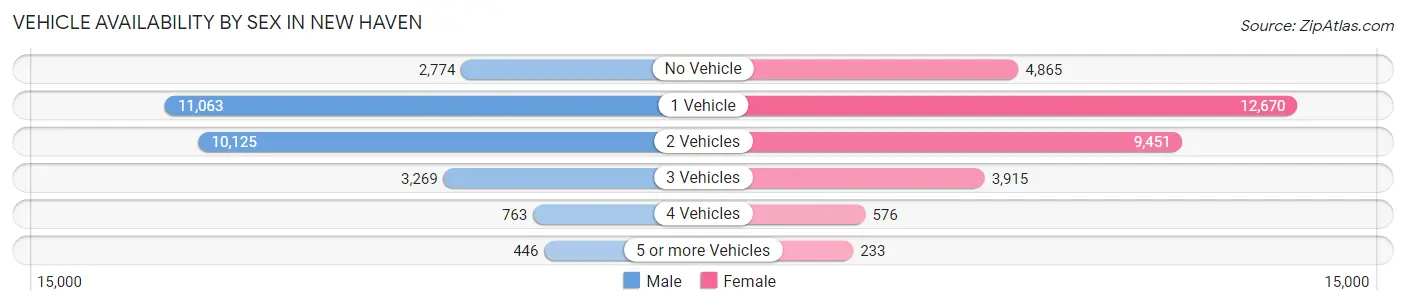
Vehicle Availability by Sex in New Haven
The most prevalent vehicle ownership categories in New Haven are males with 1 vehicle (11,063, accounting for 38.9%) and females with 1 vehicle (12,670, making up 34.9%).
| Vehicles Available | Male | Female |
| No Vehicle | 2,774 (9.8%) | 4,865 (15.3%) |
| 1 Vehicle | 11,063 (38.9%) | 12,670 (40.0%) |
| 2 Vehicles | 10,125 (35.6%) | 9,451 (29.8%) |
| 3 Vehicles | 3,269 (11.5%) | 3,915 (12.3%) |
| 4 Vehicles | 763 (2.7%) | 576 (1.8%) |
| 5 or more Vehicles | 446 (1.6%) | 233 (0.7%) |
| Total | 28,440 (100.0%) | 31,710 (100.0%) |
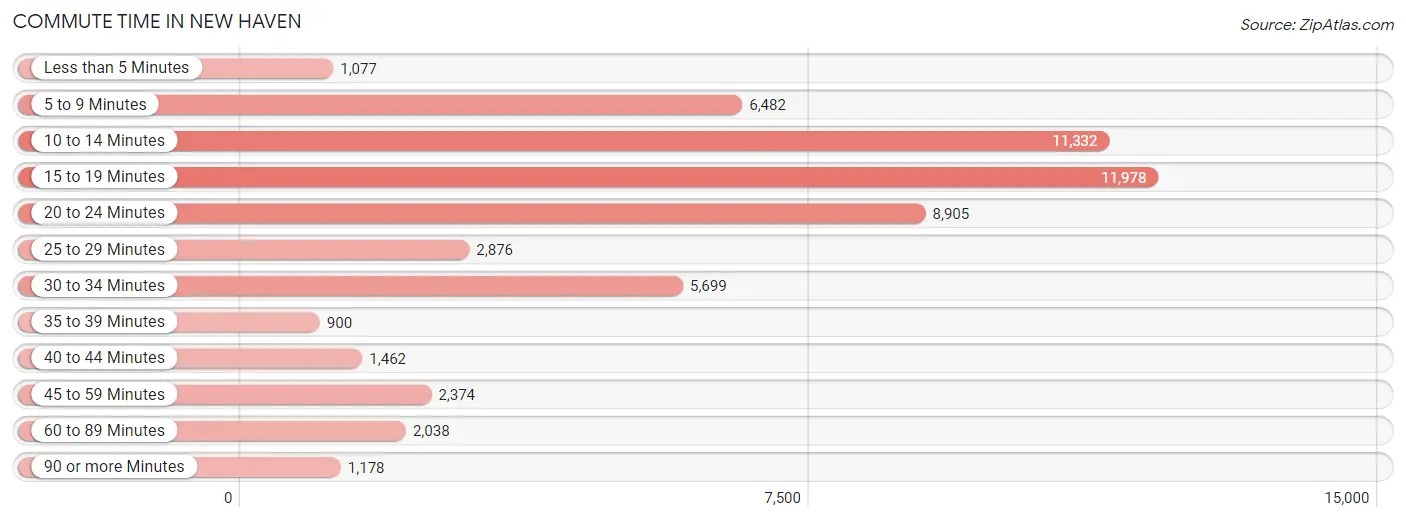
Commute Time in New Haven
The most frequently occuring commute durations in New Haven are 15 to 19 minutes (11,978 commuters, 21.3%), 10 to 14 minutes (11,332 commuters, 20.1%), and 20 to 24 minutes (8,905 commuters, 15.8%).
| Commute Time | # Commuters | % Commuters |
| Less than 5 Minutes | 1,077 | 1.9% |
| 5 to 9 Minutes | 6,482 | 11.5% |
| 10 to 14 Minutes | 11,332 | 20.1% |
| 15 to 19 Minutes | 11,978 | 21.3% |
| 20 to 24 Minutes | 8,905 | 15.8% |
| 25 to 29 Minutes | 2,876 | 5.1% |
| 30 to 34 Minutes | 5,699 | 10.1% |
| 35 to 39 Minutes | 900 | 1.6% |
| 40 to 44 Minutes | 1,462 | 2.6% |
| 45 to 59 Minutes | 2,374 | 4.2% |
| 60 to 89 Minutes | 2,038 | 3.6% |
| 90 or more Minutes | 1,178 | 2.1% |
Commute Time by Sex in New Haven
The most common commute times in New Haven are 15 to 19 minutes (4,899 commuters, 18.3%) for males and 15 to 19 minutes (7,079 commuters, 23.9%) for females.
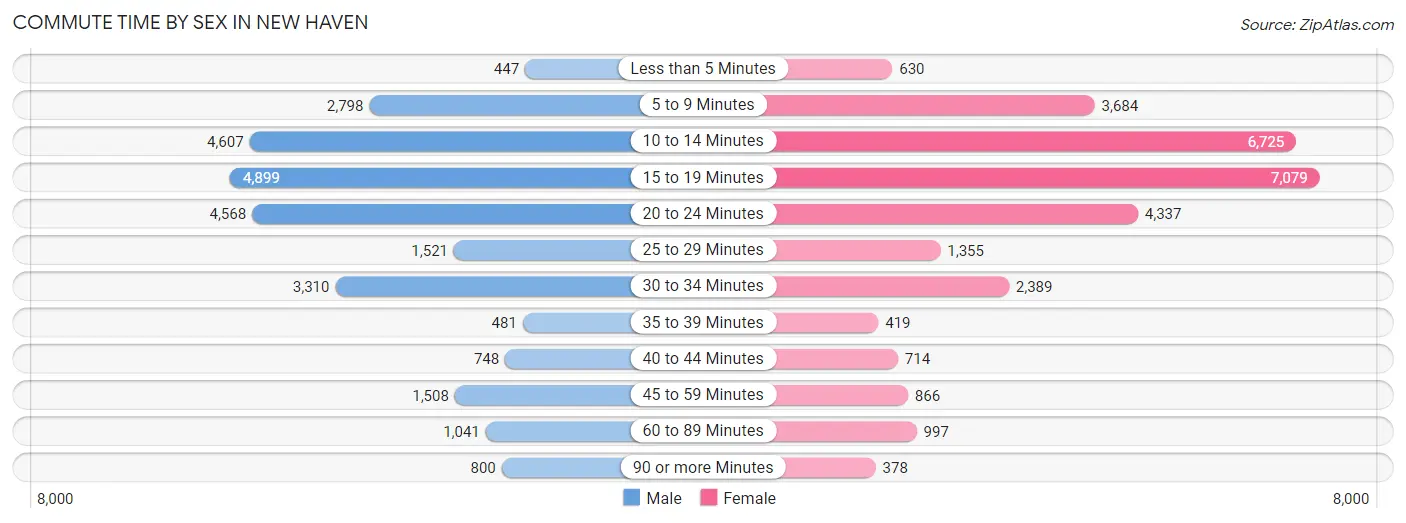
| Commute Time | Male | Female |
| Less than 5 Minutes | 447 (1.7%) | 630 (2.1%) |
| 5 to 9 Minutes | 2,798 (10.5%) | 3,684 (12.5%) |
| 10 to 14 Minutes | 4,607 (17.2%) | 6,725 (22.7%) |
| 15 to 19 Minutes | 4,899 (18.3%) | 7,079 (23.9%) |
| 20 to 24 Minutes | 4,568 (17.1%) | 4,337 (14.7%) |
| 25 to 29 Minutes | 1,521 (5.7%) | 1,355 (4.6%) |
| 30 to 34 Minutes | 3,310 (12.4%) | 2,389 (8.1%) |
| 35 to 39 Minutes | 481 (1.8%) | 419 (1.4%) |
| 40 to 44 Minutes | 748 (2.8%) | 714 (2.4%) |
| 45 to 59 Minutes | 1,508 (5.6%) | 866 (2.9%) |
| 60 to 89 Minutes | 1,041 (3.9%) | 997 (3.4%) |
| 90 or more Minutes | 800 (3.0%) | 378 (1.3%) |
Time of Departure to Work by Sex in New Haven
The most frequent times of departure to work in New Haven are 7:00 AM to 7:29 AM (2,916, 10.9%) for males and 8:00 AM to 8:29 AM (4,678, 15.8%) for females.
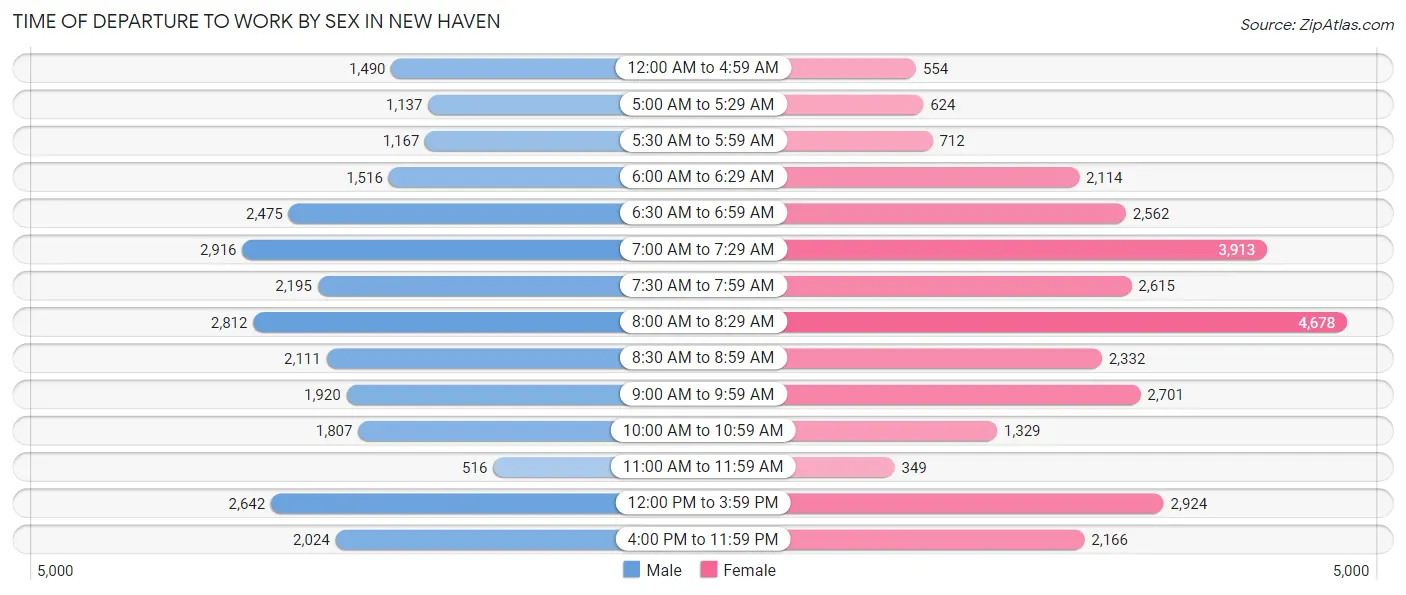
| Time of Departure | Male | Female |
| 12:00 AM to 4:59 AM | 1,490 (5.6%) | 554 (1.9%) |
| 5:00 AM to 5:29 AM | 1,137 (4.3%) | 624 (2.1%) |
| 5:30 AM to 5:59 AM | 1,167 (4.4%) | 712 (2.4%) |
| 6:00 AM to 6:29 AM | 1,516 (5.7%) | 2,114 (7.1%) |
| 6:30 AM to 6:59 AM | 2,475 (9.3%) | 2,562 (8.7%) |
| 7:00 AM to 7:29 AM | 2,916 (10.9%) | 3,913 (13.2%) |
| 7:30 AM to 7:59 AM | 2,195 (8.2%) | 2,615 (8.8%) |
| 8:00 AM to 8:29 AM | 2,812 (10.5%) | 4,678 (15.8%) |
| 8:30 AM to 8:59 AM | 2,111 (7.9%) | 2,332 (7.9%) |
| 9:00 AM to 9:59 AM | 1,920 (7.2%) | 2,701 (9.1%) |
| 10:00 AM to 10:59 AM | 1,807 (6.8%) | 1,329 (4.5%) |
| 11:00 AM to 11:59 AM | 516 (1.9%) | 349 (1.2%) |
| 12:00 PM to 3:59 PM | 2,642 (9.9%) | 2,924 (9.9%) |
| 4:00 PM to 11:59 PM | 2,024 (7.6%) | 2,166 (7.3%) |
| Total | 26,728 (100.0%) | 29,573 (100.0%) |
Housing Occupancy in New Haven
Occupancy by Ownership in New Haven
Of the total 52,977 dwellings in New Haven, owner-occupied units account for 15,168 (28.6%), while renter-occupied units make up 37,809 (71.4%).
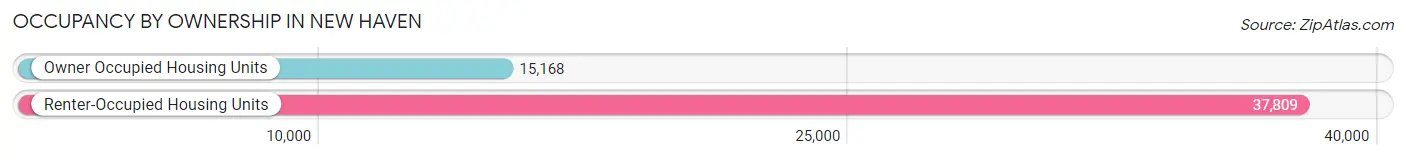
| Occupancy | # Housing Units | % Housing Units |
| Owner Occupied Housing Units | 15,168 | 28.6% |
| Renter-Occupied Housing Units | 37,809 | 71.4% |
| Total Occupied Housing Units | 52,977 | 100.0% |
Occupancy by Household Size in New Haven
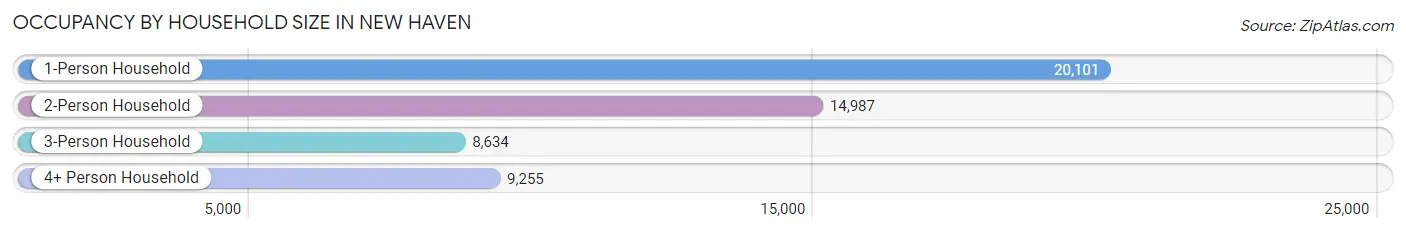
| Household Size | # Housing Units | % Housing Units |
| 1-Person Household | 20,101 | 37.9% |
| 2-Person Household | 14,987 | 28.3% |
| 3-Person Household | 8,634 | 16.3% |
| 4+ Person Household | 9,255 | 17.5% |
| Total Housing Units | 52,977 | 100.0% |
Occupancy by Ownership by Household Size in New Haven
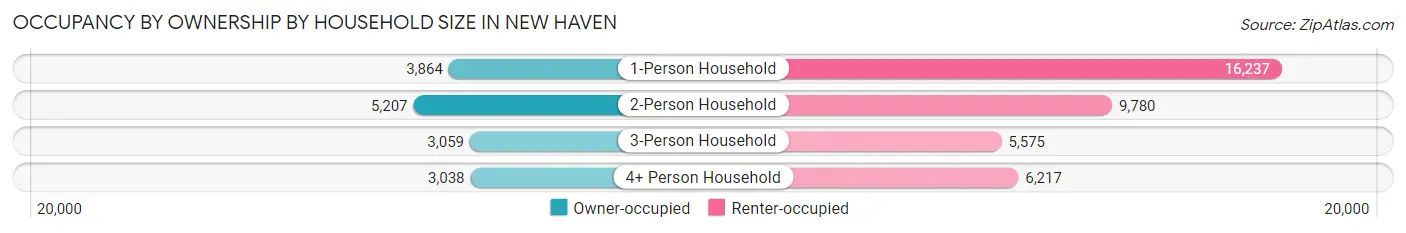
| Household Size | Owner-occupied | Renter-occupied |
| 1-Person Household | 3,864 (19.2%) | 16,237 (80.8%) |
| 2-Person Household | 5,207 (34.7%) | 9,780 (65.3%) |
| 3-Person Household | 3,059 (35.4%) | 5,575 (64.6%) |
| 4+ Person Household | 3,038 (32.8%) | 6,217 (67.2%) |
| Total Housing Units | 15,168 (28.6%) | 37,809 (71.4%) |
Occupancy by Educational Attainment in New Haven
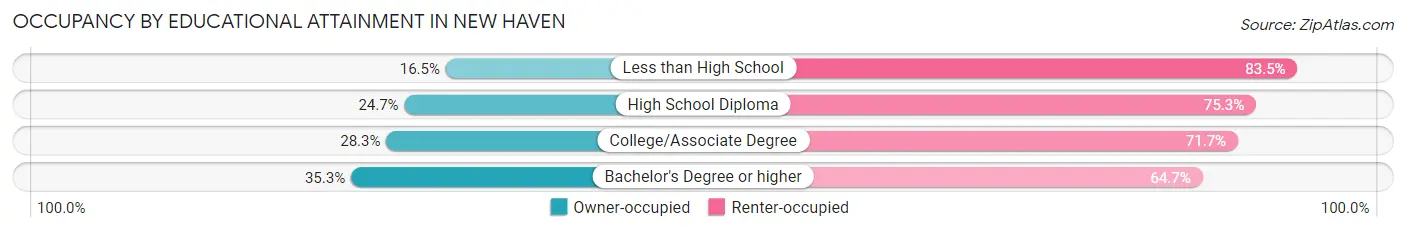
| Household Size | Owner-occupied | Renter-occupied |
| Less than High School | 1,226 (16.5%) | 6,210 (83.5%) |
| High School Diploma | 3,375 (24.7%) | 10,294 (75.3%) |
| College/Associate Degree | 2,757 (28.3%) | 6,987 (71.7%) |
| Bachelor's Degree or higher | 7,810 (35.3%) | 14,318 (64.7%) |
Occupancy by Age of Householder in New Haven
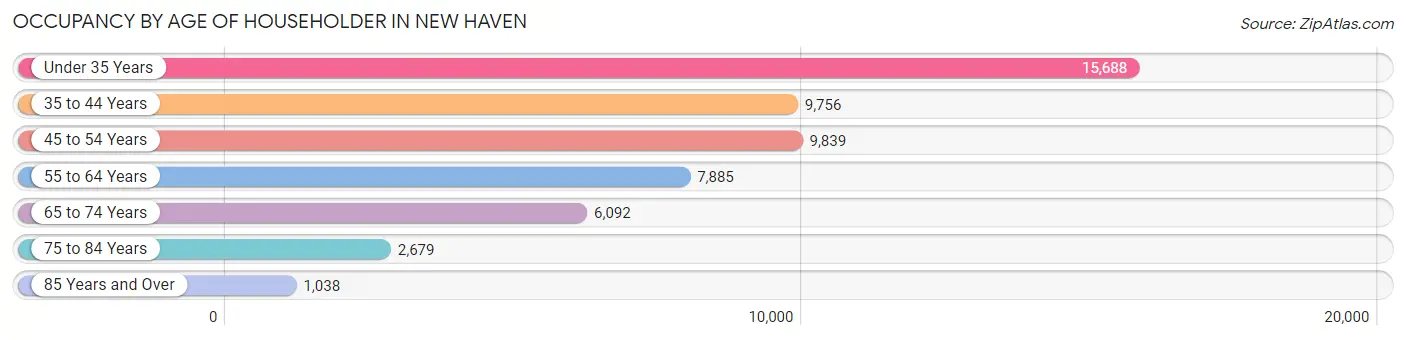
| Age Bracket | # Households | % Households |
| Under 35 Years | 15,688 | 29.6% |
| 35 to 44 Years | 9,756 | 18.4% |
| 45 to 54 Years | 9,839 | 18.6% |
| 55 to 64 Years | 7,885 | 14.9% |
| 65 to 74 Years | 6,092 | 11.5% |
| 75 to 84 Years | 2,679 | 5.1% |
| 85 Years and Over | 1,038 | 2.0% |
| Total | 52,977 | 100.0% |
Housing Finances in New Haven
Median Income by Occupancy in New Haven
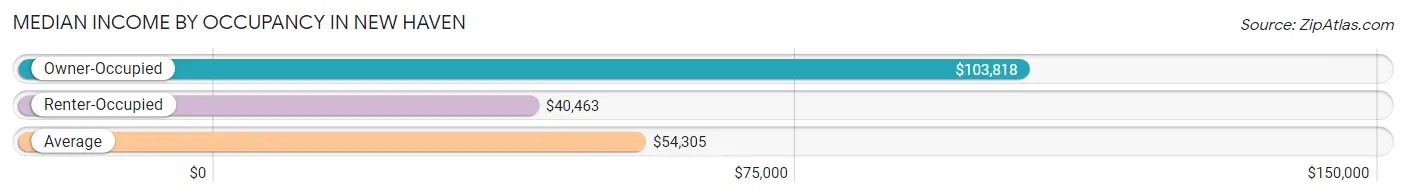
| Occupancy Type | # Households | Median Income |
| Owner-Occupied | 15,168 (28.6%) | $103,818 |
| Renter-Occupied | 37,809 (71.4%) | $40,463 |
| Average | 52,977 (100.0%) | $54,305 |
Occupancy by Householder Income Bracket in New Haven
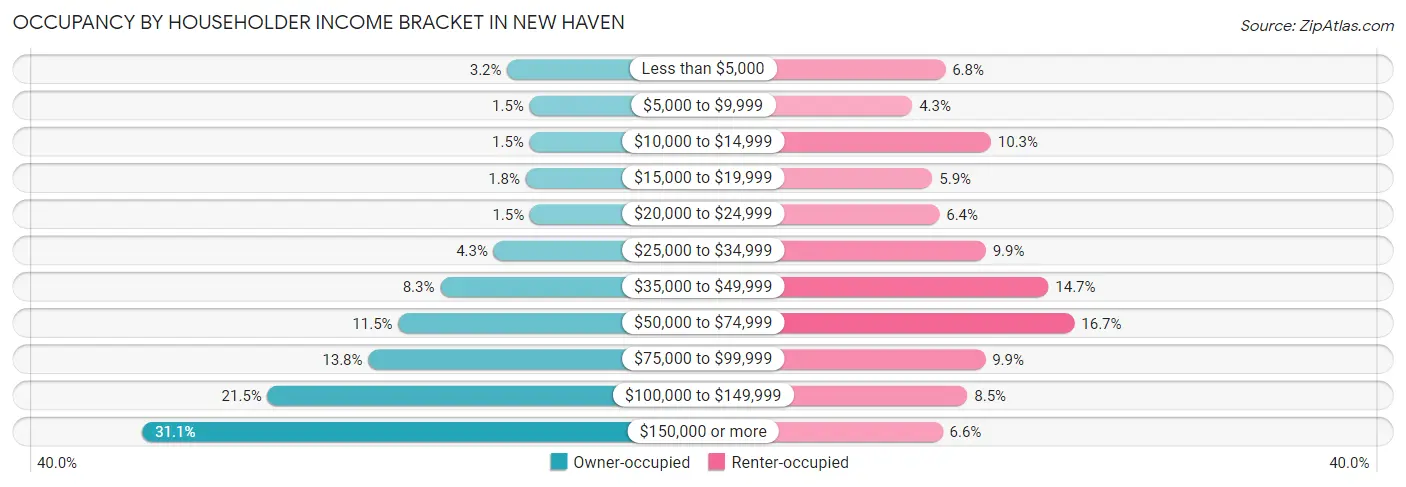
| Income Bracket | Owner-occupied | Renter-occupied |
| Less than $5,000 | 488 (3.2%) | 2,583 (6.8%) |
| $5,000 to $9,999 | 231 (1.5%) | 1,635 (4.3%) |
| $10,000 to $14,999 | 231 (1.5%) | 3,898 (10.3%) |
| $15,000 to $19,999 | 274 (1.8%) | 2,213 (5.9%) |
| $20,000 to $24,999 | 226 (1.5%) | 2,412 (6.4%) |
| $25,000 to $34,999 | 645 (4.3%) | 3,751 (9.9%) |
| $35,000 to $49,999 | 1,264 (8.3%) | 5,556 (14.7%) |
| $50,000 to $74,999 | 1,747 (11.5%) | 6,301 (16.7%) |
| $75,000 to $99,999 | 2,094 (13.8%) | 3,735 (9.9%) |
| $100,000 to $149,999 | 3,258 (21.5%) | 3,220 (8.5%) |
| $150,000 or more | 4,710 (31.0%) | 2,505 (6.6%) |
| Total | 15,168 (100.0%) | 37,809 (100.0%) |
Monthly Housing Cost Tiers in New Haven
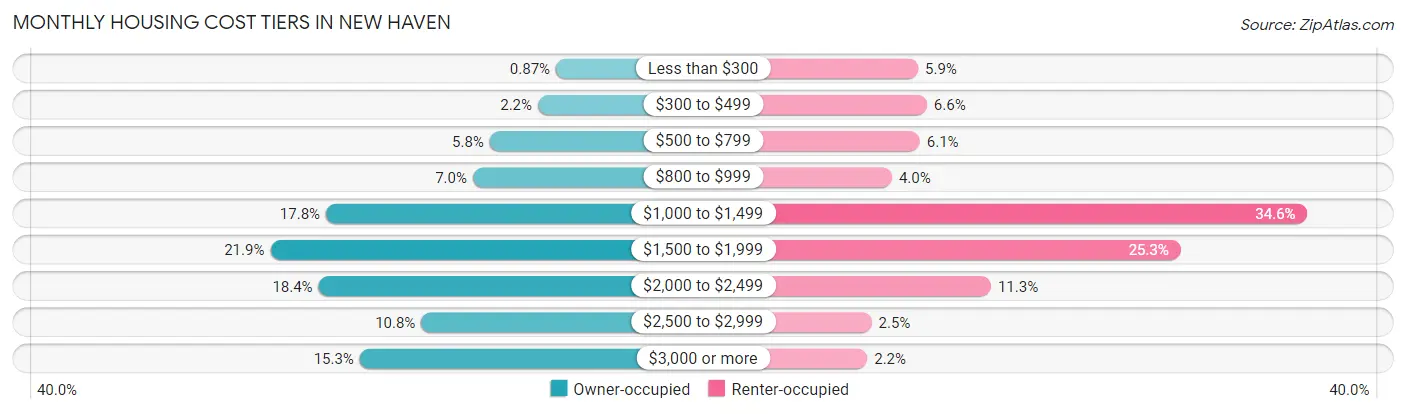
| Monthly Cost | Owner-occupied | Renter-occupied |
| Less than $300 | 132 (0.9%) | 2,245 (5.9%) |
| $300 to $499 | 333 (2.2%) | 2,493 (6.6%) |
| $500 to $799 | 872 (5.8%) | 2,294 (6.1%) |
| $800 to $999 | 1,060 (7.0%) | 1,520 (4.0%) |
| $1,000 to $1,499 | 2,702 (17.8%) | 13,087 (34.6%) |
| $1,500 to $1,999 | 3,324 (21.9%) | 9,559 (25.3%) |
| $2,000 to $2,499 | 2,785 (18.4%) | 4,276 (11.3%) |
| $2,500 to $2,999 | 1,636 (10.8%) | 953 (2.5%) |
| $3,000 or more | 2,324 (15.3%) | 830 (2.2%) |
| Total | 15,168 (100.0%) | 37,809 (100.0%) |
Physical Housing Characteristics in New Haven
Housing Structures in New Haven
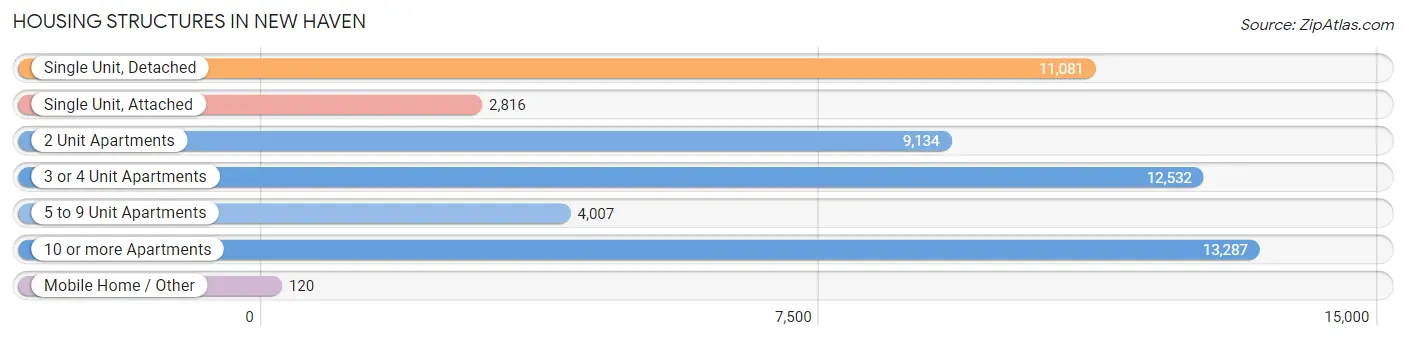
| Structure Type | # Housing Units | % Housing Units |
| Single Unit, Detached | 11,081 | 20.9% |
| Single Unit, Attached | 2,816 | 5.3% |
| 2 Unit Apartments | 9,134 | 17.2% |
| 3 or 4 Unit Apartments | 12,532 | 23.7% |
| 5 to 9 Unit Apartments | 4,007 | 7.6% |
| 10 or more Apartments | 13,287 | 25.1% |
| Mobile Home / Other | 120 | 0.2% |
| Total | 52,977 | 100.0% |
Housing Structures by Occupancy in New Haven
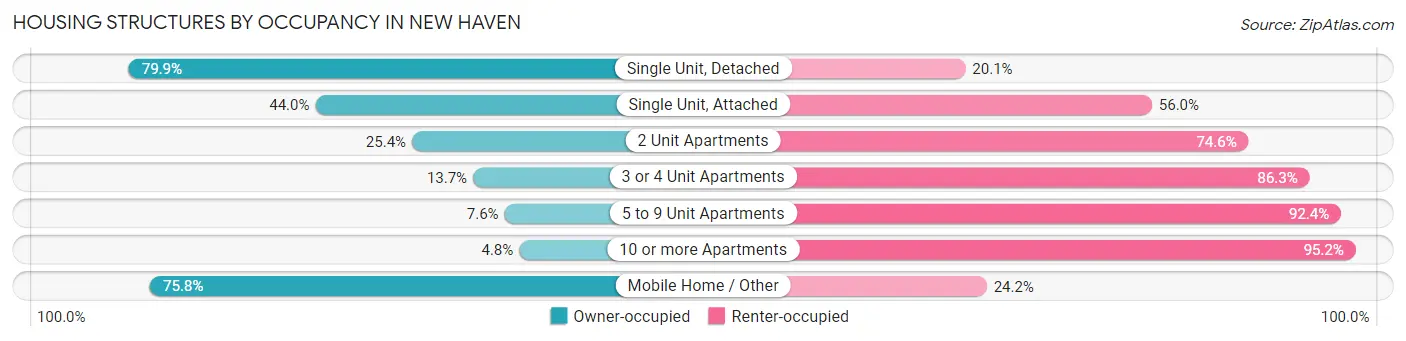
| Structure Type | Owner-occupied | Renter-occupied |
| Single Unit, Detached | 8,857 (79.9%) | 2,224 (20.1%) |
| Single Unit, Attached | 1,240 (44.0%) | 1,576 (56.0%) |
| 2 Unit Apartments | 2,323 (25.4%) | 6,811 (74.6%) |
| 3 or 4 Unit Apartments | 1,715 (13.7%) | 10,817 (86.3%) |
| 5 to 9 Unit Apartments | 305 (7.6%) | 3,702 (92.4%) |
| 10 or more Apartments | 637 (4.8%) | 12,650 (95.2%) |
| Mobile Home / Other | 91 (75.8%) | 29 (24.2%) |
| Total | 15,168 (28.6%) | 37,809 (71.4%) |
Housing Structures by Number of Rooms in New Haven
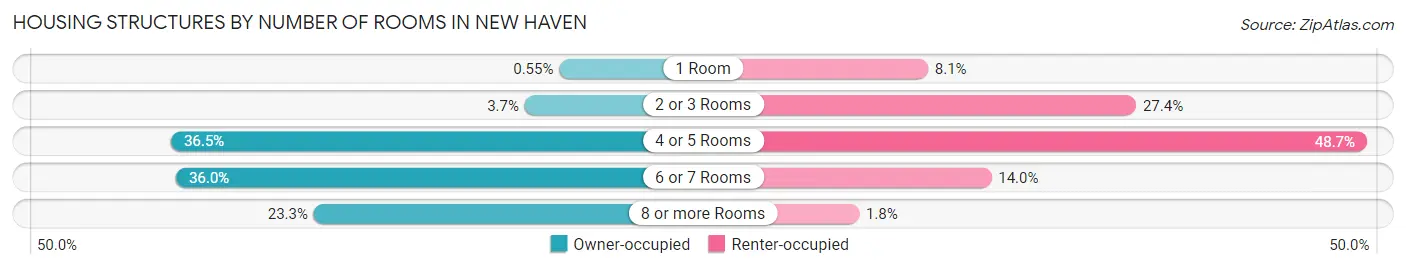
| Number of Rooms | Owner-occupied | Renter-occupied |
| 1 Room | 83 (0.5%) | 3,075 (8.1%) |
| 2 or 3 Rooms | 567 (3.7%) | 10,351 (27.4%) |
| 4 or 5 Rooms | 5,530 (36.5%) | 18,425 (48.7%) |
| 6 or 7 Rooms | 5,461 (36.0%) | 5,292 (14.0%) |
| 8 or more Rooms | 3,527 (23.3%) | 666 (1.8%) |
| Total | 15,168 (100.0%) | 37,809 (100.0%) |
Housing Structure by Heating Type in New Haven
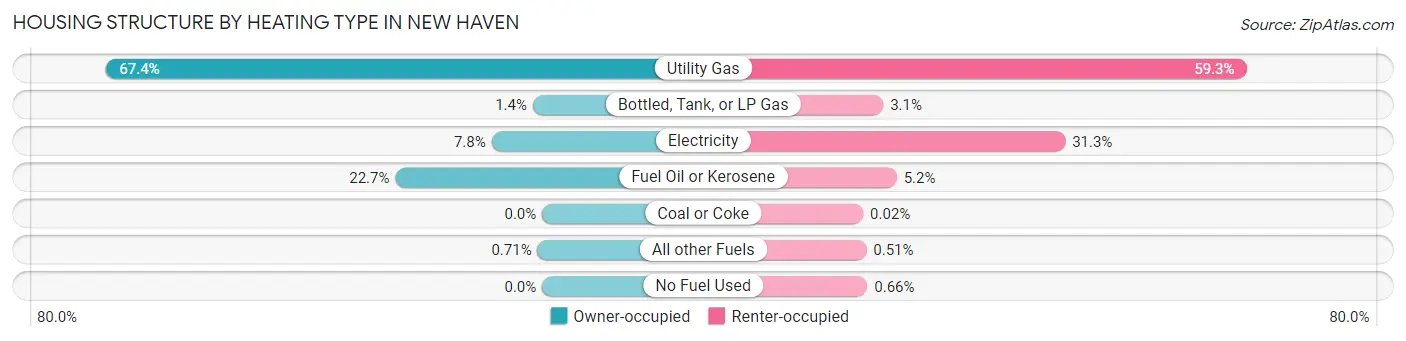
| Heating Type | Owner-occupied | Renter-occupied |
| Utility Gas | 10,215 (67.3%) | 22,400 (59.3%) |
| Bottled, Tank, or LP Gas | 218 (1.4%) | 1,181 (3.1%) |
| Electricity | 1,186 (7.8%) | 11,814 (31.2%) |
| Fuel Oil or Kerosene | 3,442 (22.7%) | 1,965 (5.2%) |
| Coal or Coke | 0 (0.0%) | 7 (0.0%) |
| All other Fuels | 107 (0.7%) | 192 (0.5%) |
| No Fuel Used | 0 (0.0%) | 250 (0.7%) |
| Total | 15,168 (100.0%) | 37,809 (100.0%) |
Household Vehicle Usage in New Haven
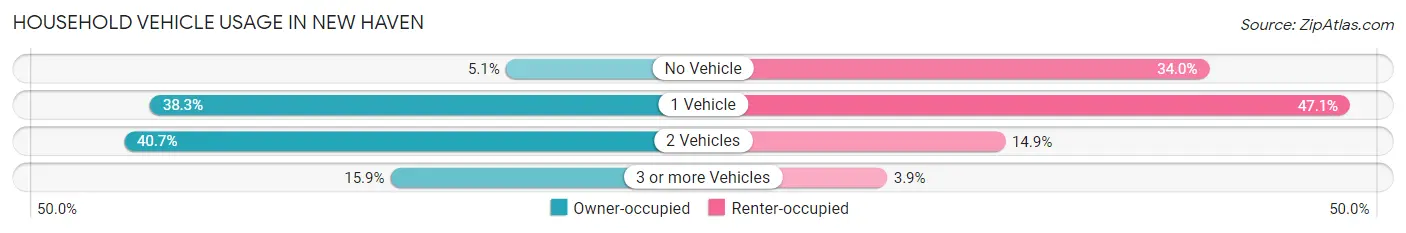
| Vehicles per Household | Owner-occupied | Renter-occupied |
| No Vehicle | 774 (5.1%) | 12,859 (34.0%) |
| 1 Vehicle | 5,811 (38.3%) | 17,823 (47.1%) |
| 2 Vehicles | 6,177 (40.7%) | 5,649 (14.9%) |
| 3 or more Vehicles | 2,406 (15.9%) | 1,478 (3.9%) |
| Total | 15,168 (100.0%) | 37,809 (100.0%) |
Real Estate & Mortgages in New Haven
Real Estate and Mortgage Overview in New Haven
| Characteristic | Without Mortgage | With Mortgage |
| Housing Units | 4,864 | 10,304 |
| Median Property Value | $232,400 | $237,900 |
| Median Household Income | $81,985 | $3,464 |
| Monthly Housing Costs | $1,103 | $2,160 |
| Real Estate Taxes | $5,802 | $181 |
Property Value by Mortgage Status in New Haven
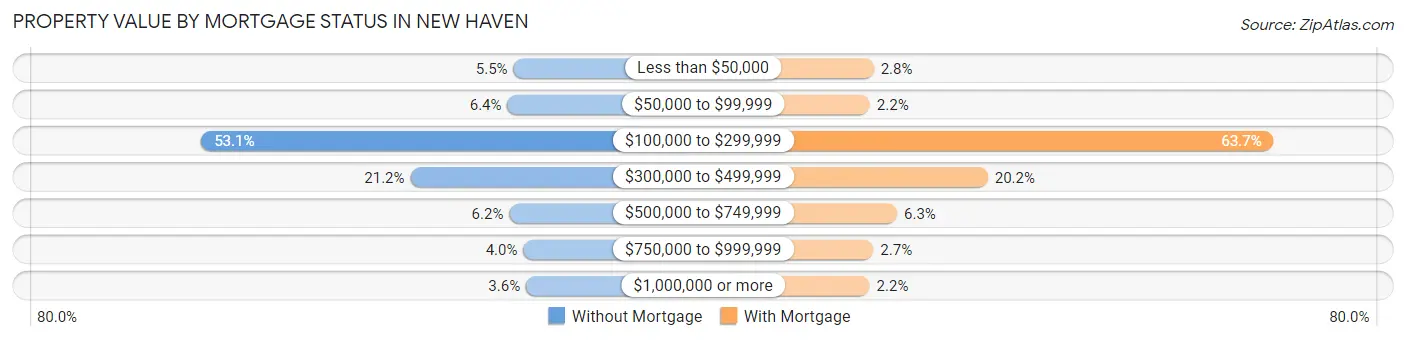
| Property Value | Without Mortgage | With Mortgage |
| Less than $50,000 | 268 (5.5%) | 285 (2.8%) |
| $50,000 to $99,999 | 313 (6.4%) | 226 (2.2%) |
| $100,000 to $299,999 | 2,582 (53.1%) | 6,563 (63.7%) |
| $300,000 to $499,999 | 1,032 (21.2%) | 2,076 (20.2%) |
| $500,000 to $749,999 | 299 (6.1%) | 652 (6.3%) |
| $750,000 to $999,999 | 195 (4.0%) | 280 (2.7%) |
| $1,000,000 or more | 175 (3.6%) | 222 (2.1%) |
| Total | 4,864 (100.0%) | 10,304 (100.0%) |
Household Income by Mortgage Status in New Haven
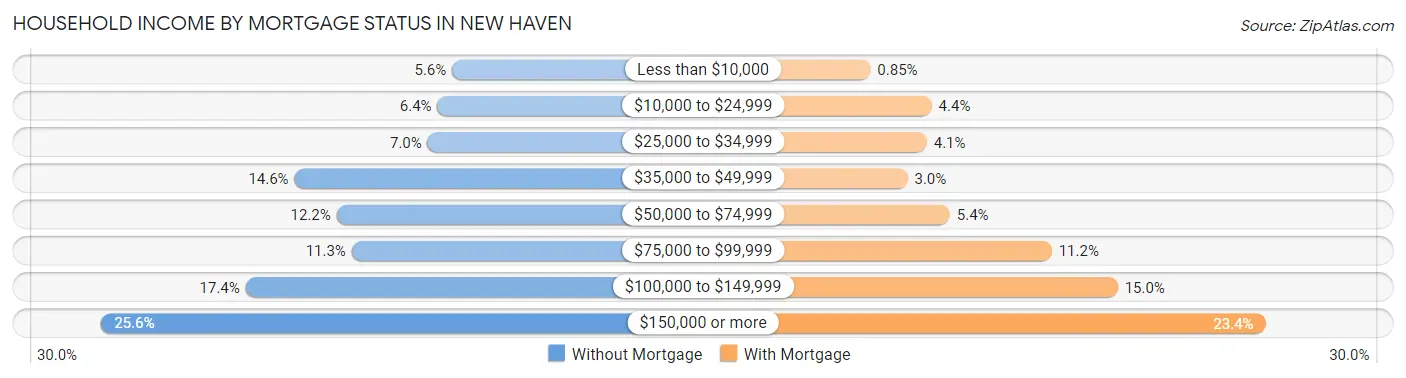
| Household Income | Without Mortgage | With Mortgage |
| Less than $10,000 | 271 (5.6%) | 88 (0.9%) |
| $10,000 to $24,999 | 312 (6.4%) | 448 (4.3%) |
| $25,000 to $34,999 | 339 (7.0%) | 419 (4.1%) |
| $35,000 to $49,999 | 709 (14.6%) | 306 (3.0%) |
| $50,000 to $74,999 | 592 (12.2%) | 555 (5.4%) |
| $75,000 to $99,999 | 550 (11.3%) | 1,155 (11.2%) |
| $100,000 to $149,999 | 845 (17.4%) | 1,544 (15.0%) |
| $150,000 or more | 1,246 (25.6%) | 2,413 (23.4%) |
| Total | 4,864 (100.0%) | 10,304 (100.0%) |
Property Value to Household Income Ratio in New Haven
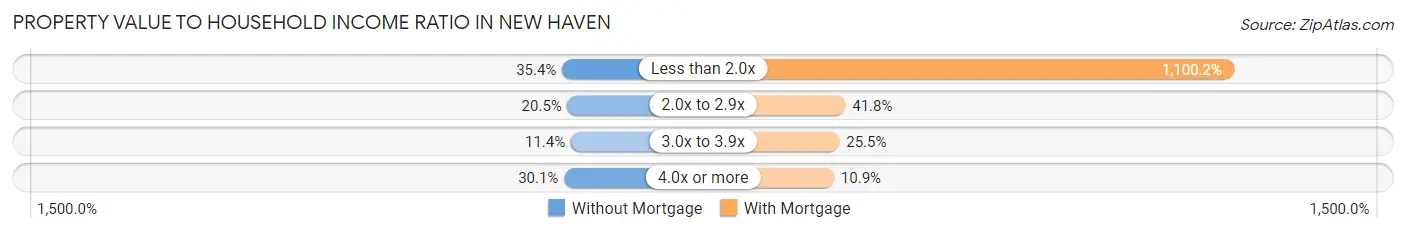
| Value-to-Income Ratio | Without Mortgage | With Mortgage |
| Less than 2.0x | 1,724 (35.4%) | 113,365 (1,100.2%) |
| 2.0x to 2.9x | 999 (20.5%) | 4,309 (41.8%) |
| 3.0x to 3.9x | 552 (11.4%) | 2,630 (25.5%) |
| 4.0x or more | 1,463 (30.1%) | 1,122 (10.9%) |
| Total | 4,864 (100.0%) | 10,304 (100.0%) |
Real Estate Taxes by Mortgage Status in New Haven
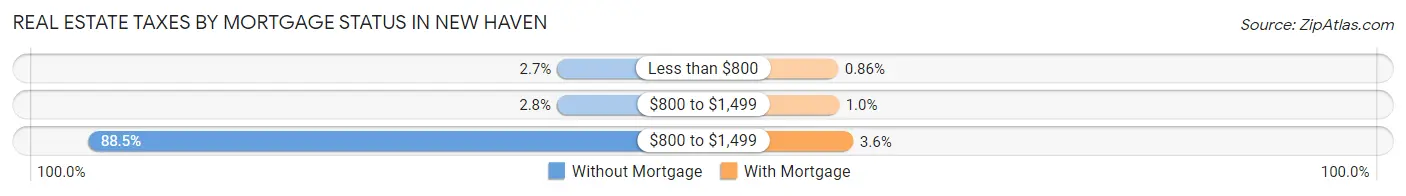
| Property Taxes | Without Mortgage | With Mortgage |
| Less than $800 | 133 (2.7%) | 89 (0.9%) |
| $800 to $1,499 | 135 (2.8%) | 107 (1.0%) |
| $800 to $1,499 | 4,302 (88.4%) | 374 (3.6%) |
| Total | 4,864 (100.0%) | 10,304 (100.0%) |
Health & Disability in New Haven
Health Insurance Coverage by Age in New Haven
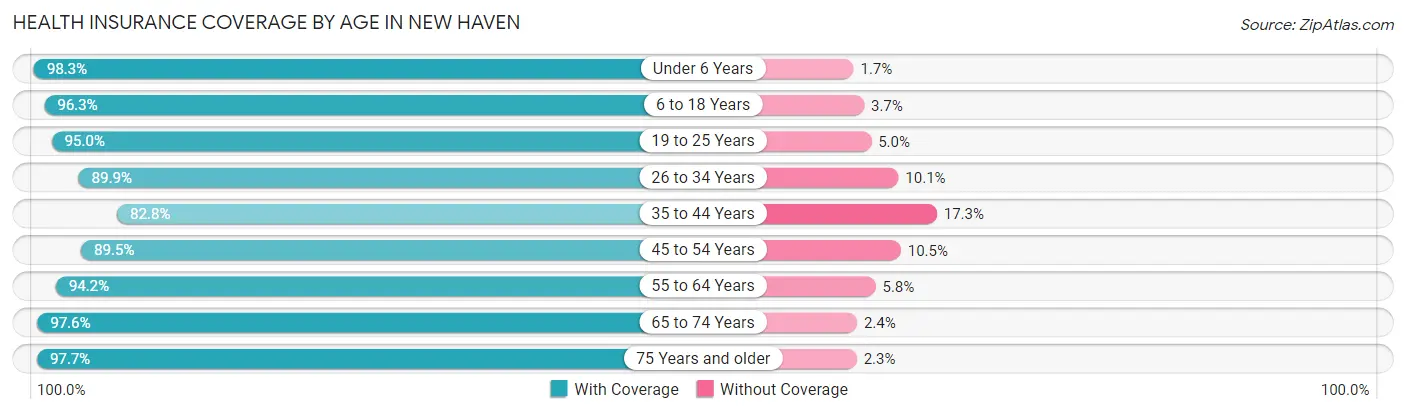
| Age Bracket | With Coverage | Without Coverage |
| Under 6 Years | 9,613 (98.3%) | 168 (1.7%) |
| 6 to 18 Years | 22,073 (96.3%) | 844 (3.7%) |
| 19 to 25 Years | 19,553 (95.0%) | 1,034 (5.0%) |
| 26 to 34 Years | 20,289 (89.9%) | 2,278 (10.1%) |
| 35 to 44 Years | 14,314 (82.8%) | 2,984 (17.2%) |
| 45 to 54 Years | 13,463 (89.5%) | 1,586 (10.5%) |
| 55 to 64 Years | 11,385 (94.2%) | 705 (5.8%) |
| 65 to 74 Years | 8,650 (97.6%) | 210 (2.4%) |
| 75 Years and older | 5,197 (97.7%) | 123 (2.3%) |
| Total | 124,537 (92.6%) | 9,932 (7.4%) |
Health Insurance Coverage by Citizenship Status in New Haven
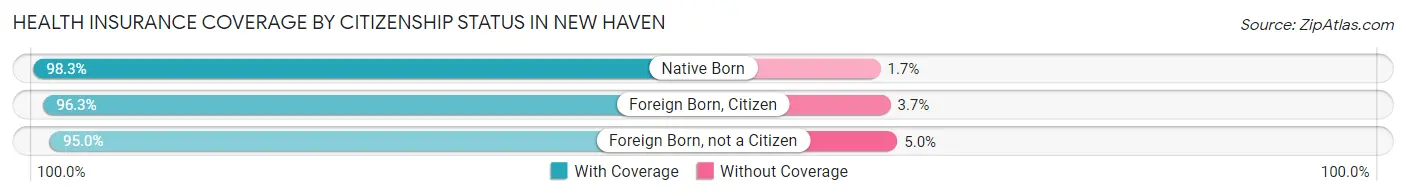
| Citizenship Status | With Coverage | Without Coverage |
| Native Born | 9,613 (98.3%) | 168 (1.7%) |
| Foreign Born, Citizen | 22,073 (96.3%) | 844 (3.7%) |
| Foreign Born, not a Citizen | 19,553 (95.0%) | 1,034 (5.0%) |
Health Insurance Coverage by Household Income in New Haven
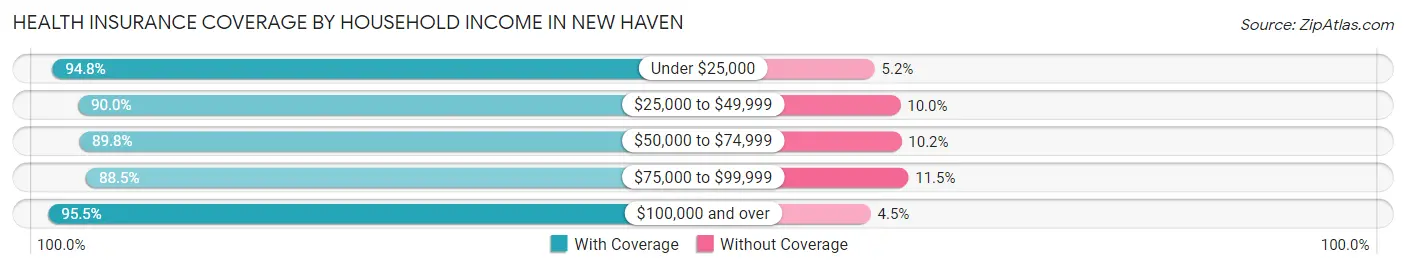
| Household Income | With Coverage | Without Coverage |
| Under $25,000 | 24,600 (94.8%) | 1,352 (5.2%) |
| $25,000 to $49,999 | 23,778 (90.0%) | 2,652 (10.0%) |
| $50,000 to $74,999 | 18,145 (89.8%) | 2,066 (10.2%) |
| $75,000 to $99,999 | 12,948 (88.5%) | 1,688 (11.5%) |
| $100,000 and over | 36,673 (95.5%) | 1,713 (4.5%) |
Public vs Private Health Insurance Coverage by Age in New Haven
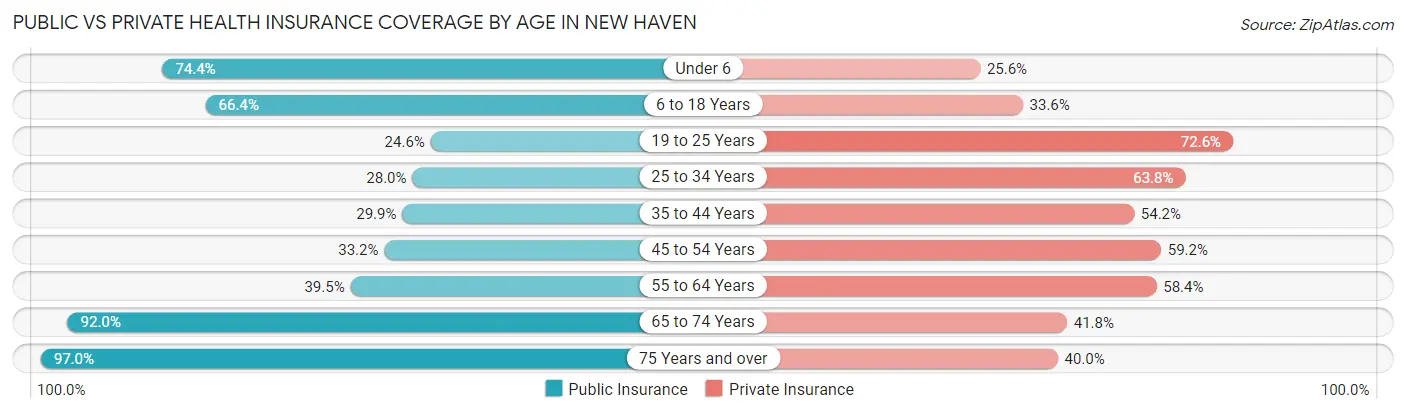
| Age Bracket | Public Insurance | Private Insurance |
| Under 6 | 7,278 (74.4%) | 2,508 (25.6%) |
| 6 to 18 Years | 15,218 (66.4%) | 7,692 (33.6%) |
| 19 to 25 Years | 5,071 (24.6%) | 14,945 (72.6%) |
| 25 to 34 Years | 6,324 (28.0%) | 14,386 (63.7%) |
| 35 to 44 Years | 5,170 (29.9%) | 9,377 (54.2%) |
| 45 to 54 Years | 5,002 (33.2%) | 8,910 (59.2%) |
| 55 to 64 Years | 4,777 (39.5%) | 7,057 (58.4%) |
| 65 to 74 Years | 8,152 (92.0%) | 3,701 (41.8%) |
| 75 Years and over | 5,160 (97.0%) | 2,130 (40.0%) |
| Total | 62,152 (46.2%) | 70,706 (52.6%) |
Disability Status by Sex by Age in New Haven
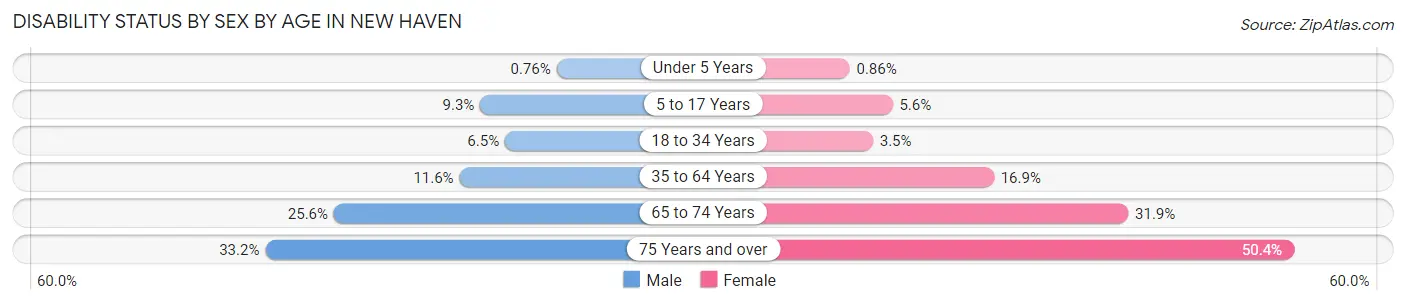
| Age Bracket | Male | Female |
| Under 5 Years | 30 (0.8%) | 37 (0.9%) |
| 5 to 17 Years | 986 (9.3%) | 616 (5.6%) |
| 18 to 34 Years | 1,396 (6.5%) | 848 (3.5%) |
| 35 to 64 Years | 2,376 (11.6%) | 4,044 (16.9%) |
| 65 to 74 Years | 1,046 (25.6%) | 1,520 (31.9%) |
| 75 Years and over | 731 (33.2%) | 1,570 (50.3%) |
Disability Class by Sex by Age in New Haven
Disability Class: Hearing Difficulty
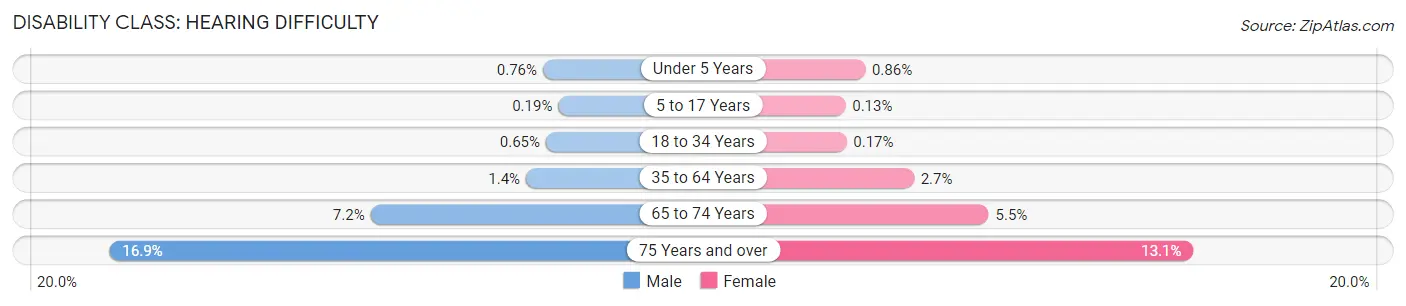
| Age Bracket | Male | Female |
| Under 5 Years | 30 (0.8%) | 37 (0.9%) |
| 5 to 17 Years | 20 (0.2%) | 14 (0.1%) |
| 18 to 34 Years | 139 (0.6%) | 42 (0.2%) |
| 35 to 64 Years | 285 (1.4%) | 637 (2.7%) |
| 65 to 74 Years | 293 (7.2%) | 260 (5.4%) |
| 75 Years and over | 371 (16.9%) | 407 (13.1%) |
Disability Class: Vision Difficulty
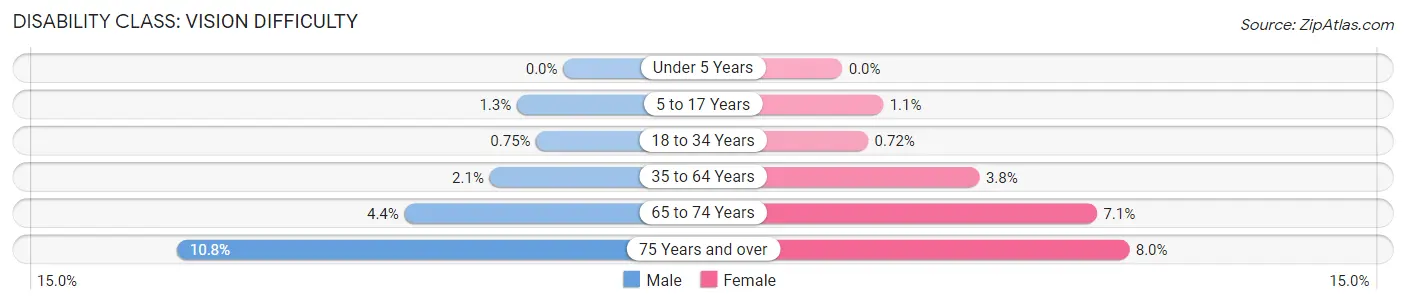
| Age Bracket | Male | Female |
| Under 5 Years | 0 (0.0%) | 0 (0.0%) |
| 5 to 17 Years | 137 (1.3%) | 125 (1.1%) |
| 18 to 34 Years | 162 (0.7%) | 176 (0.7%) |
| 35 to 64 Years | 421 (2.1%) | 913 (3.8%) |
| 65 to 74 Years | 181 (4.4%) | 338 (7.1%) |
| 75 Years and over | 237 (10.8%) | 249 (8.0%) |
Disability Class: Cognitive Difficulty
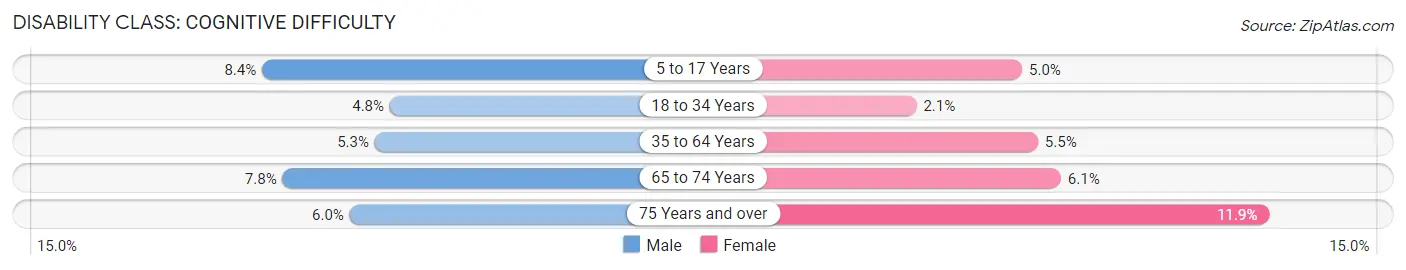
| Age Bracket | Male | Female |
| 5 to 17 Years | 893 (8.4%) | 548 (5.0%) |
| 18 to 34 Years | 1,037 (4.8%) | 510 (2.1%) |
| 35 to 64 Years | 1,078 (5.2%) | 1,304 (5.5%) |
| 65 to 74 Years | 320 (7.8%) | 291 (6.1%) |
| 75 Years and over | 131 (5.9%) | 371 (11.9%) |
Disability Class: Ambulatory Difficulty
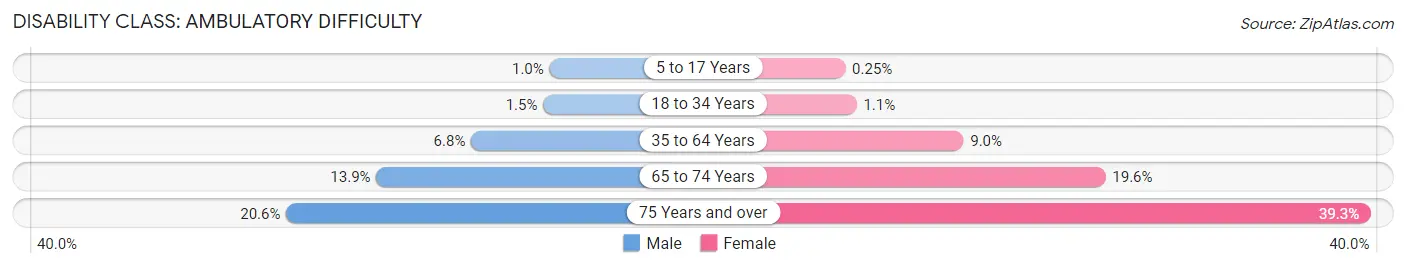
| Age Bracket | Male | Female |
| 5 to 17 Years | 109 (1.0%) | 27 (0.3%) |
| 18 to 34 Years | 321 (1.5%) | 268 (1.1%) |
| 35 to 64 Years | 1,405 (6.8%) | 2,156 (9.0%) |
| 65 to 74 Years | 568 (13.9%) | 933 (19.6%) |
| 75 Years and over | 453 (20.6%) | 1,225 (39.3%) |
Disability Class: Self-Care Difficulty
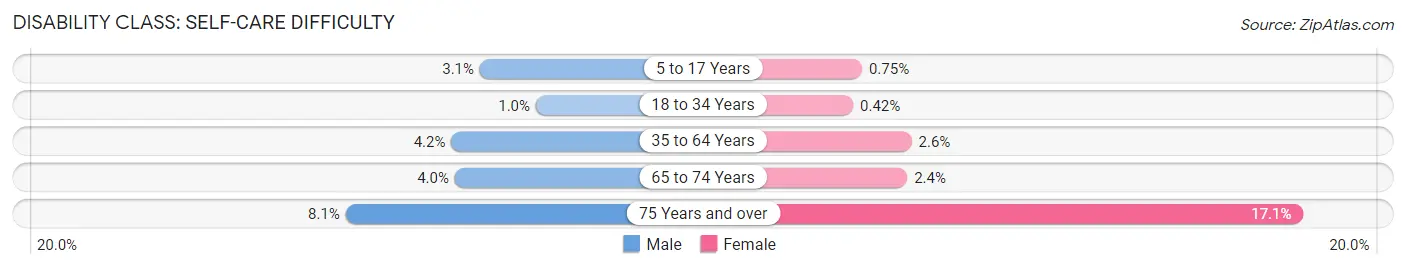
| Age Bracket | Male | Female |
| 5 to 17 Years | 330 (3.1%) | 82 (0.7%) |
| 18 to 34 Years | 220 (1.0%) | 103 (0.4%) |
| 35 to 64 Years | 855 (4.2%) | 618 (2.6%) |
| 65 to 74 Years | 165 (4.0%) | 116 (2.4%) |
| 75 Years and over | 178 (8.1%) | 534 (17.1%) |
Technology Access in New Haven
Computing Device Access in New Haven
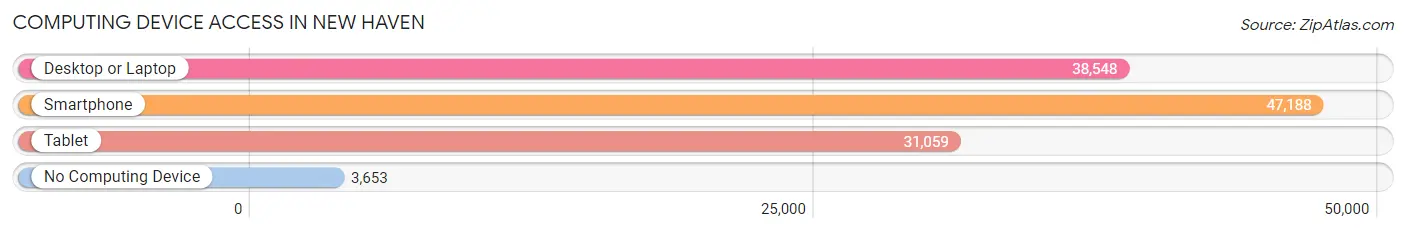
| Device Type | # Households | % Households |
| Desktop or Laptop | 38,548 | 72.8% |
| Smartphone | 47,188 | 89.1% |
| Tablet | 31,059 | 58.6% |
| No Computing Device | 3,653 | 6.9% |
| Total | 52,977 | 100.0% |
Internet Access in New Haven
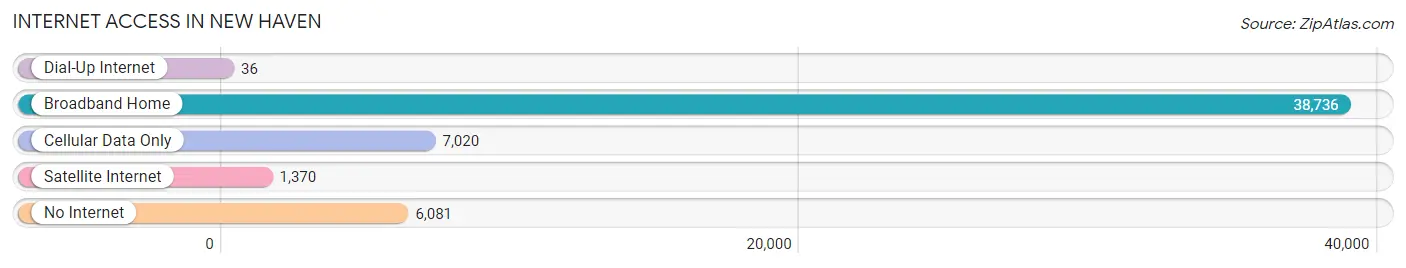
| Internet Type | # Households | % Households |
| Dial-Up Internet | 36 | 0.1% |
| Broadband Home | 38,736 | 73.1% |
| Cellular Data Only | 7,020 | 13.3% |
| Satellite Internet | 1,370 | 2.6% |
| No Internet | 6,081 | 11.5% |
| Total | 52,977 | 100.0% |
New Haven Summary
New Haven, Connecticut is a city located in the southern part of the state, on the northern shore of Long Island Sound. It is the second-largest city in Connecticut, after Bridgeport, and the sixth-largest in New England. The city has a population of 129,779 as of the 2010 census, making it the sixth-largest city in the state.
New Haven was founded in 1638 by English Puritans, and was the first planned city in the United States. It was originally called Quinnipiac, after the local Native American tribe, but was renamed New Haven in 1640. The city was an important center of trade and commerce in colonial times, and was the home of Yale University, which was founded in 1701.
Geography
New Haven is located in New Haven County, Connecticut, on the northern shore of Long Island Sound. It is bordered by the towns of East Haven, North Haven, Hamden, and Woodbridge. The city covers an area of 22.6 square miles, and has a population density of 5,717 people per square mile.
The city is situated at the mouth of the Quinnipiac River, which flows into Long Island Sound. The city is located at the intersection of two major highways, Interstate 95 and Interstate 91.
Climate
New Haven has a humid continental climate, with hot, humid summers and cold, snowy winters. The average high temperature in July is 81°F, and the average low temperature in January is 19°F. The city receives an average of 44 inches of precipitation per year, with the most occurring in May and June.
Demographics
As of the 2010 census, New Haven had a population of 129,779. The racial makeup of the city was 57.2% White, 28.3% African American, 0.4% Native American, 8.2% Asian, 0.1% Pacific Islander, and 5.8% from other races. Hispanic or Latino of any race were 20.8% of the population.
The median household income in New Haven was $37,817, and the median family income was $45,837. The per capita income was $21,845. About 20.2% of the population was below the poverty line.
Economy
New Haven is a major center of education, healthcare, and research. Yale University is the city's largest employer, with over 11,000 employees. Other major employers include Yale-New Haven Hospital, the City of New Haven, and Southern Connecticut State University.
The city is also home to several major corporations, including Alexion Pharmaceuticals, Aetna, and United Illuminating. The city's port is a major hub for shipping and transportation, and the city is home to several major manufacturing companies, including Olin Corporation and the New Haven Clock Company.
New Haven is also a major tourist destination, with attractions such as the Yale University Art Gallery, the Peabody Museum of Natural History, and the Shubert Theater. The city is also home to several major festivals, including the International Festival of Arts and Ideas and the New Haven Jazz Festival.
Conclusion
New Haven, Connecticut is a city with a rich history and a vibrant economy. It is home to Yale University, one of the most prestigious universities in the world, and is a major center of education, healthcare, and research. The city is also a major tourist destination, with attractions such as the Yale University Art Gallery, the Peabody Museum of Natural History, and the Shubert Theater. New Haven is a diverse city, with a population that is 57.2% White, 28.3% African American, 8.2% Asian, and 20.8% Hispanic or Latino. The city is a major hub for shipping and transportation, and is home to several major corporations, including Alexion Pharmaceuticals, Aetna, and United Illuminating.
Common Questions
What is Per Capita Income in New Haven?
Per Capita income in New Haven is $33,449.
What is the Median Family Income in New Haven?
Median Family Income in New Haven is $62,870.
What is the Median Household income in New Haven?
Median Household Income in New Haven is $54,305.
What is Income or Wage Gap in New Haven?
Income or Wage Gap in New Haven is 15.9%.
Women in New Haven earn 84.1 cents for every dollar earned by a man.
What is Family Income Deficit in New Haven?
Family Income Deficit in New Haven is $11,990.
Families that are below poverty line in New Haven earn $11,990 less on average than the poverty threshold level.
What is Inequality or Gini Index in New Haven?
Inequality or Gini Index in New Haven is 0.53.
What is the Total Population of New Haven?
Total Population of New Haven is 135,736.
What is the Total Male Population of New Haven?
Total Male Population of New Haven is 63,821.
What is the Total Female Population of New Haven?
Total Female Population of New Haven is 71,915.
What is the Ratio of Males per 100 Females in New Haven?
There are 88.75 Males per 100 Females in New Haven.
What is the Ratio of Females per 100 Males in New Haven?
There are 112.68 Females per 100 Males in New Haven.
What is the Median Population Age in New Haven?
Median Population Age in New Haven is 31.0 Years.
What is the Average Family Size in New Haven
Average Family Size in New Haven is 3.2 People.
What is the Average Household Size in New Haven
Average Household Size in New Haven is 2.4 People.
How Large is the Labor Force in New Haven?
There are 70,691 People in the Labor Forcein in New Haven.
What is the Percentage of People in the Labor Force in New Haven?
64.6% of People are in the Labor Force in New Haven.
What is the Unemployment Rate in New Haven?
Unemployment Rate in New Haven is 7.8%.