South Coventry, CT Map & Demographics
South Coventry Map
South Coventry Overview
$46,518
PER CAPITA INCOME
$100,984
AVG FAMILY INCOME
$100,145
AVG HOUSEHOLD INCOME
0.39
INEQUALITY / GINI INDEX
1,468
TOTAL POPULATION
578
MALE POPULATION
890
FEMALE POPULATION
64.94
MALES / 100 FEMALES
153.98
FEMALES / 100 MALES
56.5
MEDIAN AGE
2.4
AVG FAMILY SIZE
2.2
AVG HOUSEHOLD SIZE
588
LABOR FORCE [ PEOPLE ]
45.7%
PERCENT IN LABOR FORCE
2.7%
UNEMPLOYMENT RATE
Income in South Coventry
Income Overview in South Coventry
Per Capita Income in South Coventry is $46,518, while median incomes of families and households are $100,984 and $100,145 respectively.
| Characteristic | Number | Measure |
| Per Capita Income | 1,468 | $46,518 |
| Median Family Income | 544 | $100,984 |
| Mean Family Income | 544 | $121,983 |
| Median Household Income | 648 | $100,145 |
| Mean Household Income | 648 | $106,227 |
| Income Deficit | 544 | $0 |
| Wage / Income Gap (%) | 1,468 | 0.00% |
| Wage / Income Gap ($) | 1,468 | 100.00¢ per $1 |
| Gini / Inequality Index | 1,468 | 0.39 |
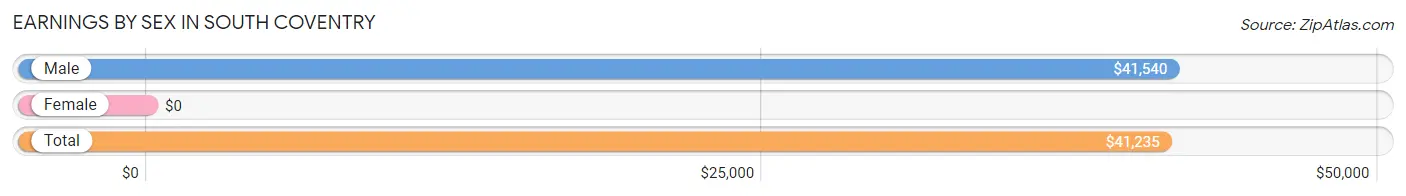
Earnings by Sex in South Coventry
| Sex | Number | Average Earnings |
| Male | 371 (41.9%) | $41,540 |
| Female | 515 (58.1%) | $0 |
| Total | 886 (100.0%) | $41,235 |
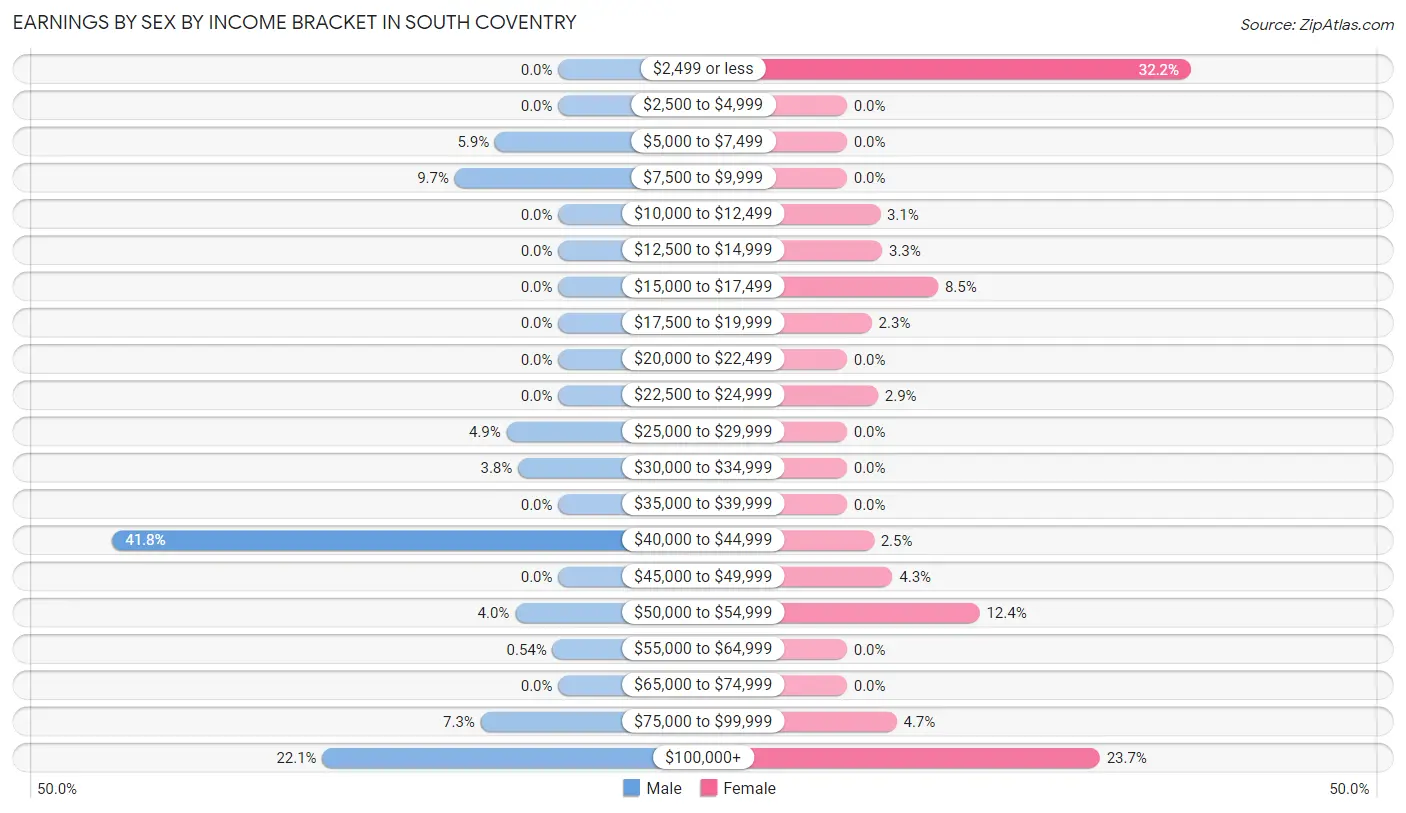
Earnings by Sex by Income Bracket in South Coventry
The most common earnings brackets in South Coventry are $40,000 to $44,999 for men (155 | 41.8%) and $2,499 or less for women (166 | 32.2%).
| Income | Male | Female |
| $2,499 or less | 0 (0.0%) | 166 (32.2%) |
| $2,500 to $4,999 | 0 (0.0%) | 0 (0.0%) |
| $5,000 to $7,499 | 22 (5.9%) | 0 (0.0%) |
| $7,500 to $9,999 | 36 (9.7%) | 0 (0.0%) |
| $10,000 to $12,499 | 0 (0.0%) | 16 (3.1%) |
| $12,500 to $14,999 | 0 (0.0%) | 17 (3.3%) |
| $15,000 to $17,499 | 0 (0.0%) | 44 (8.5%) |
| $17,500 to $19,999 | 0 (0.0%) | 12 (2.3%) |
| $20,000 to $22,499 | 0 (0.0%) | 0 (0.0%) |
| $22,500 to $24,999 | 0 (0.0%) | 15 (2.9%) |
| $25,000 to $29,999 | 18 (4.9%) | 0 (0.0%) |
| $30,000 to $34,999 | 14 (3.8%) | 0 (0.0%) |
| $35,000 to $39,999 | 0 (0.0%) | 0 (0.0%) |
| $40,000 to $44,999 | 155 (41.8%) | 13 (2.5%) |
| $45,000 to $49,999 | 0 (0.0%) | 22 (4.3%) |
| $50,000 to $54,999 | 15 (4.0%) | 64 (12.4%) |
| $55,000 to $64,999 | 2 (0.5%) | 0 (0.0%) |
| $65,000 to $74,999 | 0 (0.0%) | 0 (0.0%) |
| $75,000 to $99,999 | 27 (7.3%) | 24 (4.7%) |
| $100,000+ | 82 (22.1%) | 122 (23.7%) |
| Total | 371 (100.0%) | 515 (100.0%) |
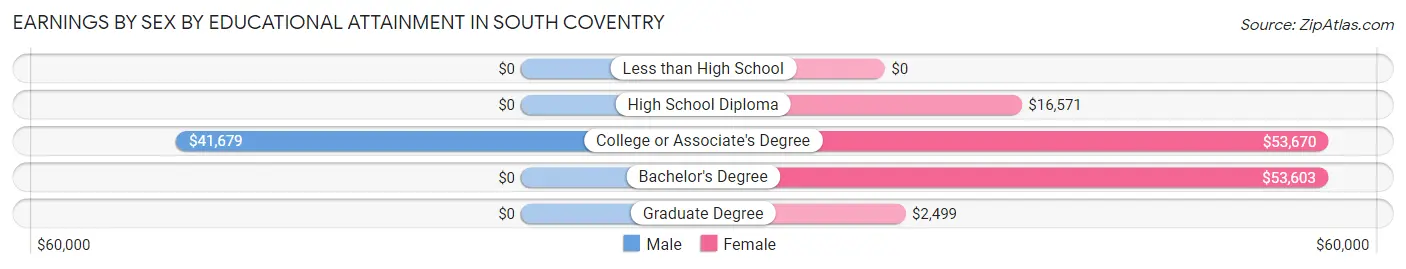
Earnings by Sex by Educational Attainment in South Coventry
| Educational Attainment | Male Income | Female Income |
| Less than High School | - | - |
| High School Diploma | - | - |
| College or Associate's Degree | $41,679 | $53,670 |
| Bachelor's Degree | - | - |
| Graduate Degree | - | - |
| Total | $41,540 | $0 |
Family Income in South Coventry
Family Income Brackets in South Coventry
According to the South Coventry family income data, there are 196 families falling into the $100,000 to $149,999 income range, which is the most common income bracket and makes up 36.0% of all families.
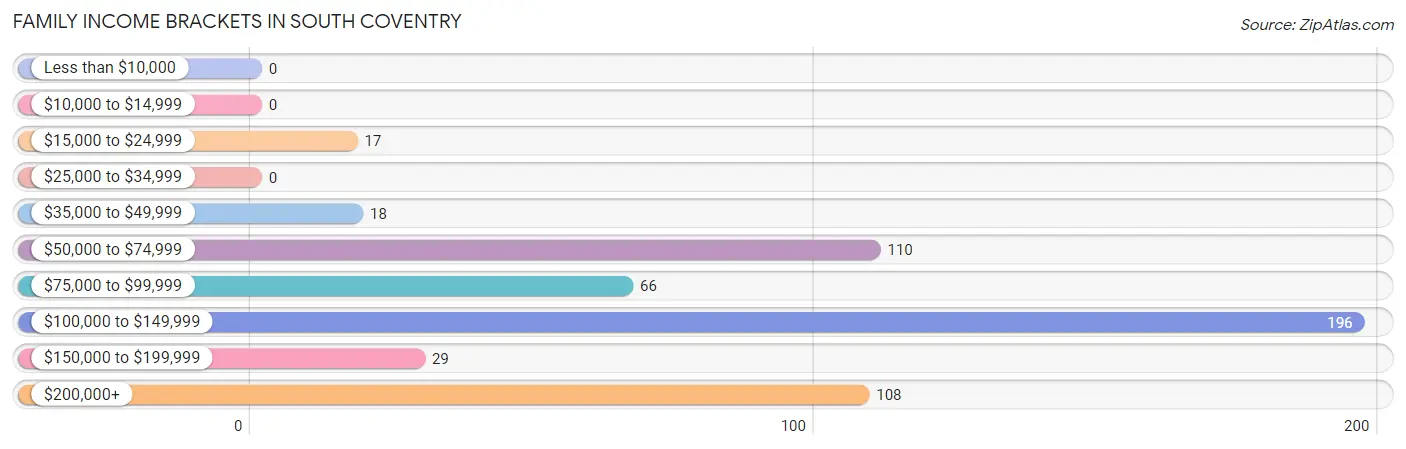
| Income Bracket | # Families | % Families |
| Less than $10,000 | 0 | 0.0% |
| $10,000 to $14,999 | 0 | 0.0% |
| $15,000 to $24,999 | 17 | 3.1% |
| $25,000 to $34,999 | 0 | 0.0% |
| $35,000 to $49,999 | 18 | 3.3% |
| $50,000 to $74,999 | 110 | 20.2% |
| $75,000 to $99,999 | 66 | 12.1% |
| $100,000 to $149,999 | 196 | 36.0% |
| $150,000 to $199,999 | 29 | 5.3% |
| $200,000+ | 108 | 19.9% |
Family Income by Famaliy Size in South Coventry
2-person families (371 | 68.2%) account for the highest median family income in South Coventry with $100,621 per family, while 2-person families (371 | 68.2%) have the highest median income of $50,310 per family member.
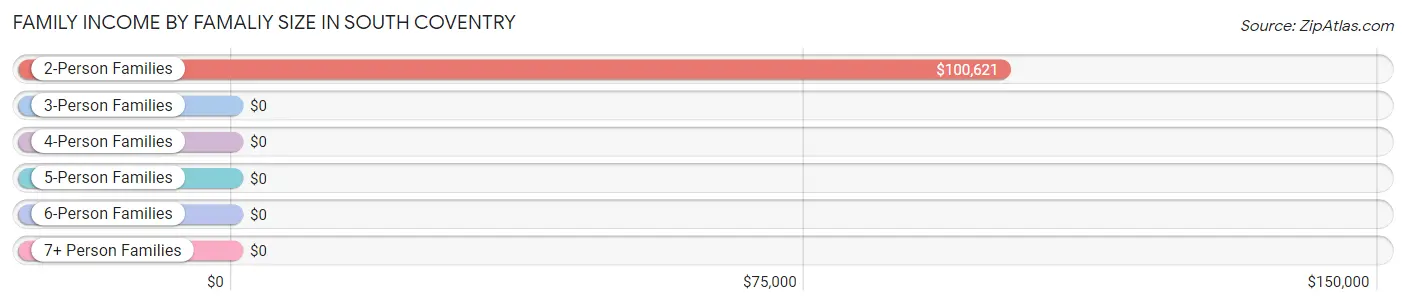
| Income Bracket | # Families | Median Income |
| 2-Person Families | 371 (68.2%) | $100,621 |
| 3-Person Families | 110 (20.2%) | $0 |
| 4-Person Families | 29 (5.3%) | $0 |
| 5-Person Families | 34 (6.2%) | $0 |
| 6-Person Families | 0 (0.0%) | $0 |
| 7+ Person Families | 0 (0.0%) | $0 |
| Total | 544 (100.0%) | $100,984 |
Family Income by Number of Earners in South Coventry
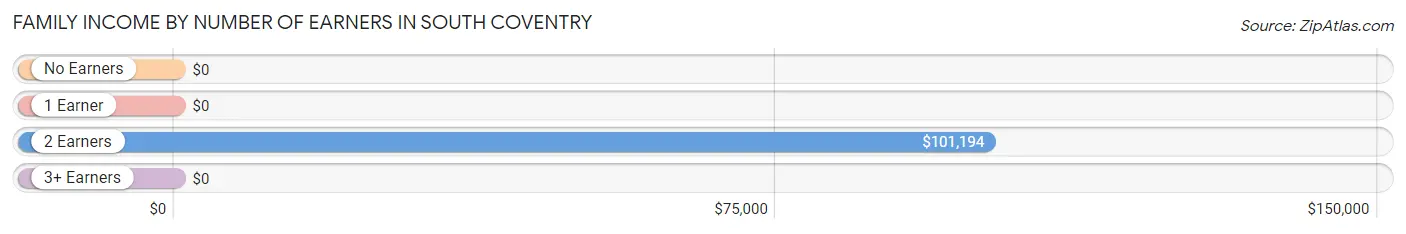
| Number of Earners | # Families | Median Income |
| No Earners | 48 (8.8%) | $0 |
| 1 Earner | 146 (26.8%) | $0 |
| 2 Earners | 350 (64.3%) | $101,194 |
| 3+ Earners | 0 (0.0%) | $0 |
| Total | 544 (100.0%) | $100,984 |
Household Income in South Coventry
Household Income Brackets in South Coventry
With 196 households falling in the category, the $100,000 to $149,999 income range is the most frequent in South Coventry, accounting for 30.2% of all households.
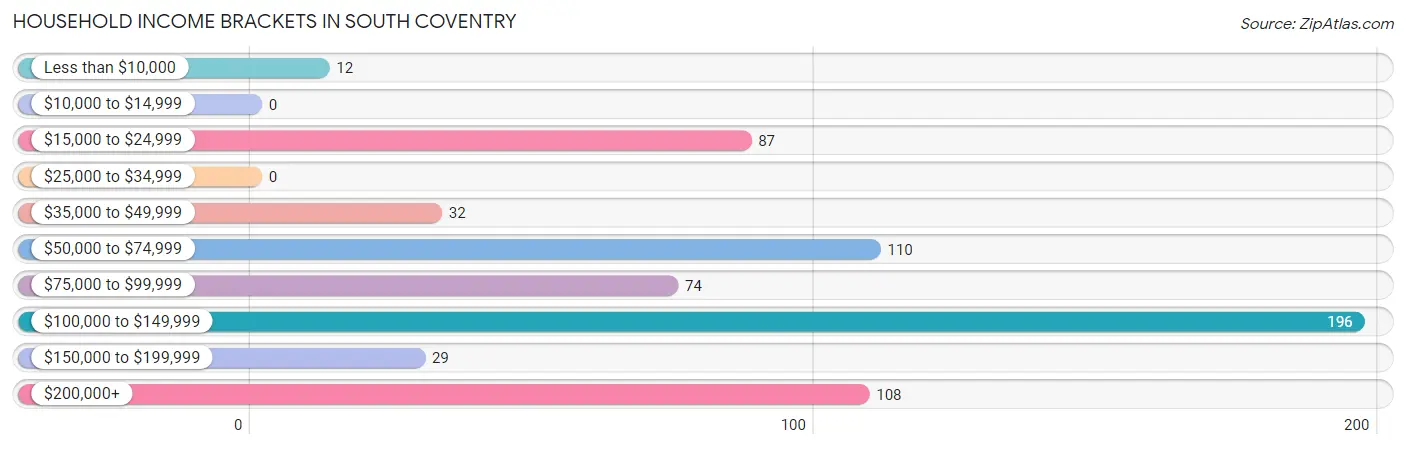
| Income Bracket | # Households | % Households |
| Less than $10,000 | 12 | 1.9% |
| $10,000 to $14,999 | 0 | 0.0% |
| $15,000 to $24,999 | 87 | 13.4% |
| $25,000 to $34,999 | 0 | 0.0% |
| $35,000 to $49,999 | 32 | 4.9% |
| $50,000 to $74,999 | 110 | 17.0% |
| $75,000 to $99,999 | 74 | 11.4% |
| $100,000 to $149,999 | 196 | 30.2% |
| $150,000 to $199,999 | 29 | 4.5% |
| $200,000+ | 108 | 16.7% |
Household Income by Householder Age in South Coventry
The median household income in South Coventry is $100,145, with the highest median household income of $237,426 found in the 25 to 44 years age bracket for the primary householder. A total of 125 households (19.3%) fall into this category.
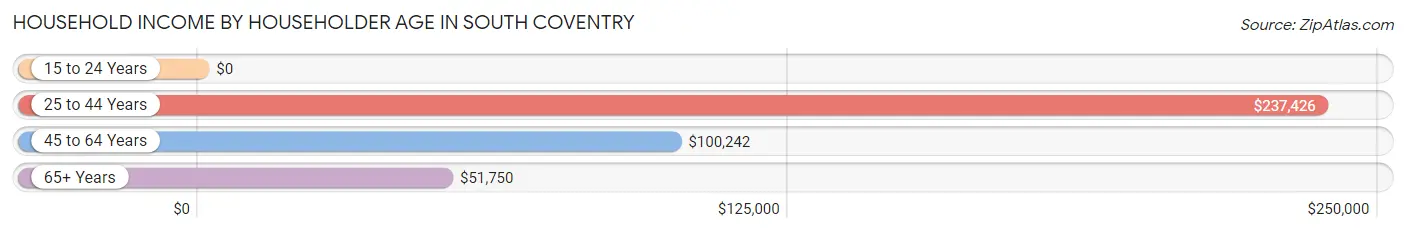
| Income Bracket | # Households | Median Income |
| 15 to 24 Years | 0 (0.0%) | $0 |
| 25 to 44 Years | 125 (19.3%) | $237,426 |
| 45 to 64 Years | 396 (61.1%) | $100,242 |
| 65+ Years | 127 (19.6%) | $51,750 |
| Total | 648 (100.0%) | $100,145 |
Poverty in South Coventry
Income Below Poverty by Sex and Age in South Coventry
With 8.1% poverty level for males and 10.2% for females among the residents of South Coventry, 55 to 64 year old males and 16 and 17 year old females are the most vulnerable to poverty, with 15 males (18.5%) and 43 females (49.4%) in their respective age groups living below the poverty level.
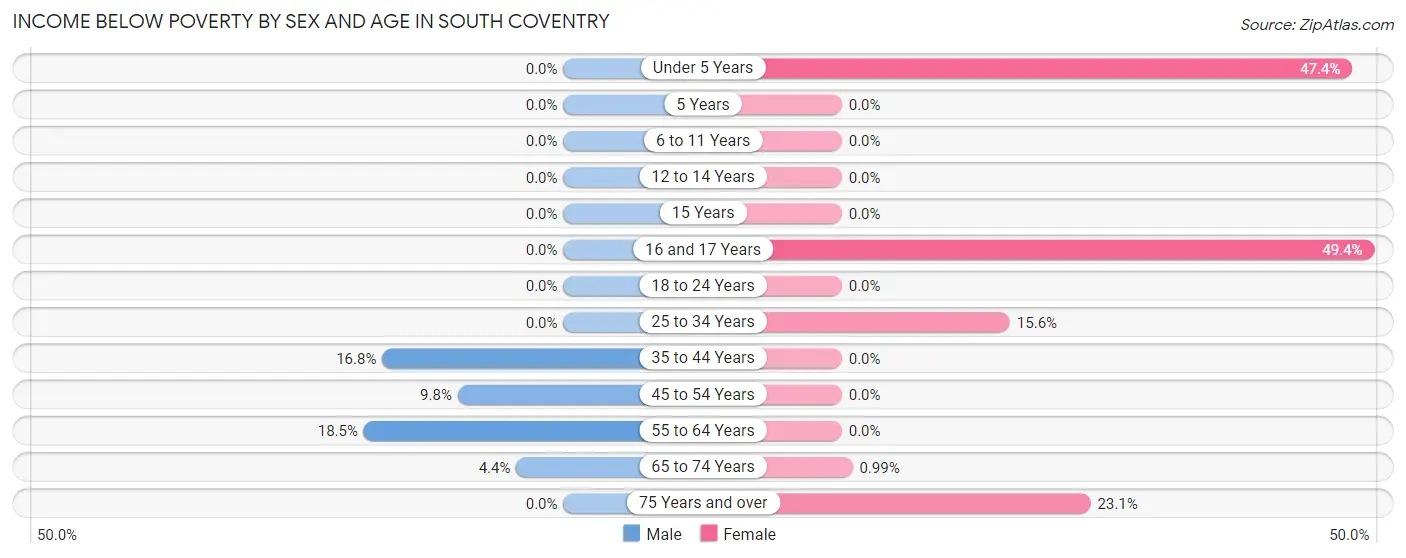
| Age Bracket | Male | Female |
| Under 5 Years | 0 (0.0%) | 18 (47.4%) |
| 5 Years | 0 (0.0%) | 0 (0.0%) |
| 6 to 11 Years | 0 (0.0%) | 0 (0.0%) |
| 12 to 14 Years | 0 (0.0%) | 0 (0.0%) |
| 15 Years | 0 (0.0%) | 0 (0.0%) |
| 16 and 17 Years | 0 (0.0%) | 43 (49.4%) |
| 18 to 24 Years | 0 (0.0%) | 0 (0.0%) |
| 25 to 34 Years | 0 (0.0%) | 17 (15.6%) |
| 35 to 44 Years | 19 (16.8%) | 0 (0.0%) |
| 45 to 54 Years | 5 (9.8%) | 0 (0.0%) |
| 55 to 64 Years | 15 (18.5%) | 0 (0.0%) |
| 65 to 74 Years | 8 (4.4%) | 1 (1.0%) |
| 75 Years and over | 0 (0.0%) | 12 (23.1%) |
| Total | 47 (8.1%) | 91 (10.2%) |
Income Above Poverty by Sex and Age in South Coventry
According to the poverty statistics in South Coventry, males aged under 5 years and females aged 5 years are the age groups that are most secure financially, with 100.0% of males and 100.0% of females in these age groups living above the poverty line.
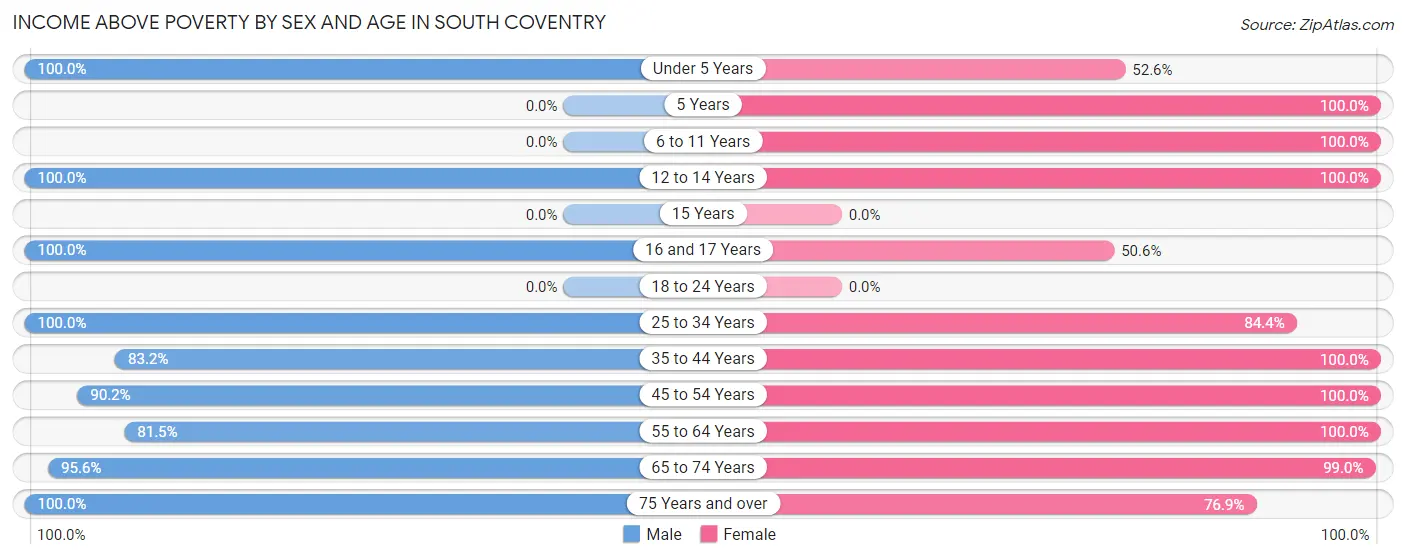
| Age Bracket | Male | Female |
| Under 5 Years | 20 (100.0%) | 20 (52.6%) |
| 5 Years | 0 (0.0%) | 12 (100.0%) |
| 6 to 11 Years | 0 (0.0%) | 51 (100.0%) |
| 12 to 14 Years | 44 (100.0%) | 16 (100.0%) |
| 15 Years | 0 (0.0%) | 0 (0.0%) |
| 16 and 17 Years | 18 (100.0%) | 44 (50.6%) |
| 18 to 24 Years | 0 (0.0%) | 0 (0.0%) |
| 25 to 34 Years | 17 (100.0%) | 92 (84.4%) |
| 35 to 44 Years | 94 (83.2%) | 45 (100.0%) |
| 45 to 54 Years | 46 (90.2%) | 98 (100.0%) |
| 55 to 64 Years | 66 (81.5%) | 281 (100.0%) |
| 65 to 74 Years | 175 (95.6%) | 100 (99.0%) |
| 75 Years and over | 51 (100.0%) | 40 (76.9%) |
| Total | 531 (91.9%) | 799 (89.8%) |
Income Below Poverty Among Married-Couple Families in South Coventry
The poverty statistics for married-couple families in South Coventry show that 3.7% or 17 of the total 465 families live below the poverty line. Families with 1 or 2 children have the highest poverty rate of 37.0%, comprising of 17 families. On the other hand, families with no children have the lowest poverty rate of 0.0%, which includes 0 families.
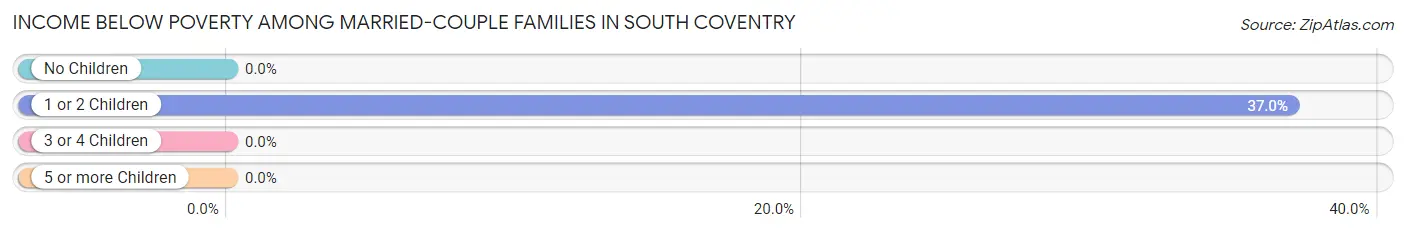
| Children | Above Poverty | Below Poverty |
| No Children | 385 (100.0%) | 0 (0.0%) |
| 1 or 2 Children | 29 (63.0%) | 17 (37.0%) |
| 3 or 4 Children | 34 (100.0%) | 0 (0.0%) |
| 5 or more Children | 0 (0.0%) | 0 (0.0%) |
| Total | 448 (96.3%) | 17 (3.7%) |
Income Below Poverty Among Single-Parent Households in South Coventry
| Children | Single Father | Single Mother |
| No Children | 0 (0.0%) | 0 (0.0%) |
| 1 or 2 Children | 0 (0.0%) | 0 (0.0%) |
| 3 or 4 Children | 0 (0.0%) | 0 (0.0%) |
| 5 or more Children | 0 (0.0%) | 0 (0.0%) |
| Total | 0 (0.0%) | 0 (0.0%) |
Income Below Poverty Among Married-Couple vs Single-Parent Households in South Coventry
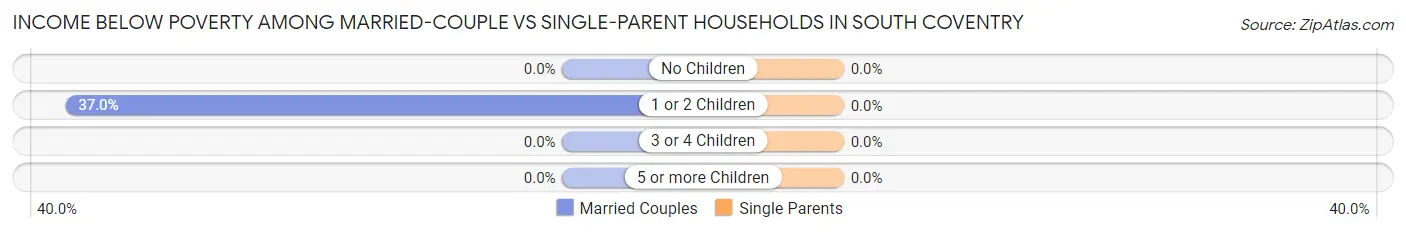
| Children | Married-Couple Families | Single-Parent Households |
| No Children | 0 (0.0%) | 0 (0.0%) |
| 1 or 2 Children | 17 (37.0%) | 0 (0.0%) |
| 3 or 4 Children | 0 (0.0%) | 0 (0.0%) |
| 5 or more Children | 0 (0.0%) | 0 (0.0%) |
| Total | 17 (3.7%) | 0 (0.0%) |
Race in South Coventry
The most populous races in South Coventry are White / Caucasian (1,339 | 91.2%), and Asian (129 | 8.8%).
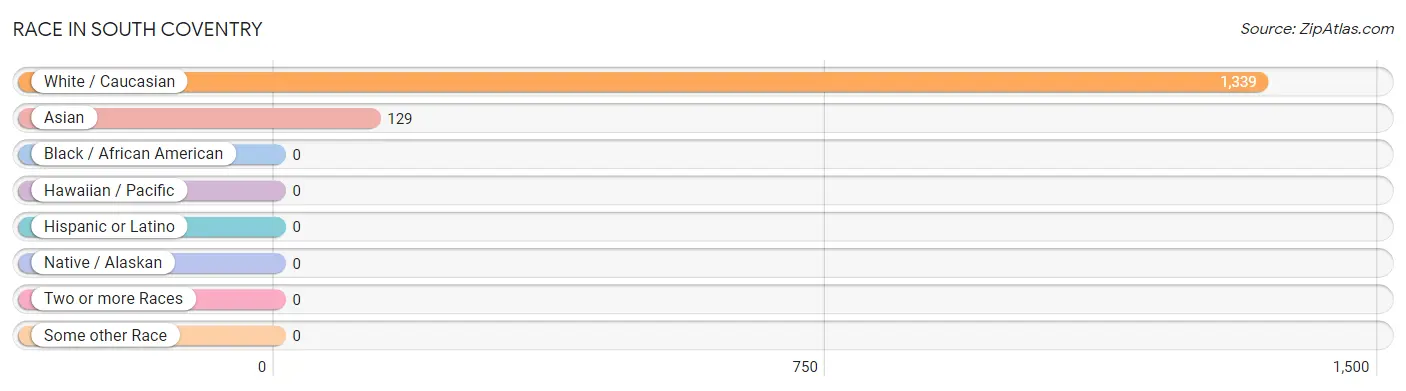
| Race | # Population | % Population |
| Asian | 129 | 8.8% |
| Black / African American | 0 | 0.0% |
| Hawaiian / Pacific | 0 | 0.0% |
| Hispanic or Latino | 0 | 0.0% |
| Native / Alaskan | 0 | 0.0% |
| White / Caucasian | 1,339 | 91.2% |
| Two or more Races | 0 | 0.0% |
| Some other Race | 0 | 0.0% |
| Total | 1,468 | 100.0% |
Ancestry in South Coventry
The most populous ancestries reported in South Coventry are Italian (283 | 19.3%), American (205 | 14.0%), German (193 | 13.2%), French Canadian (140 | 9.5%), and Burmese (129 | 8.8%), together accounting for 64.7% of all South Coventry residents.
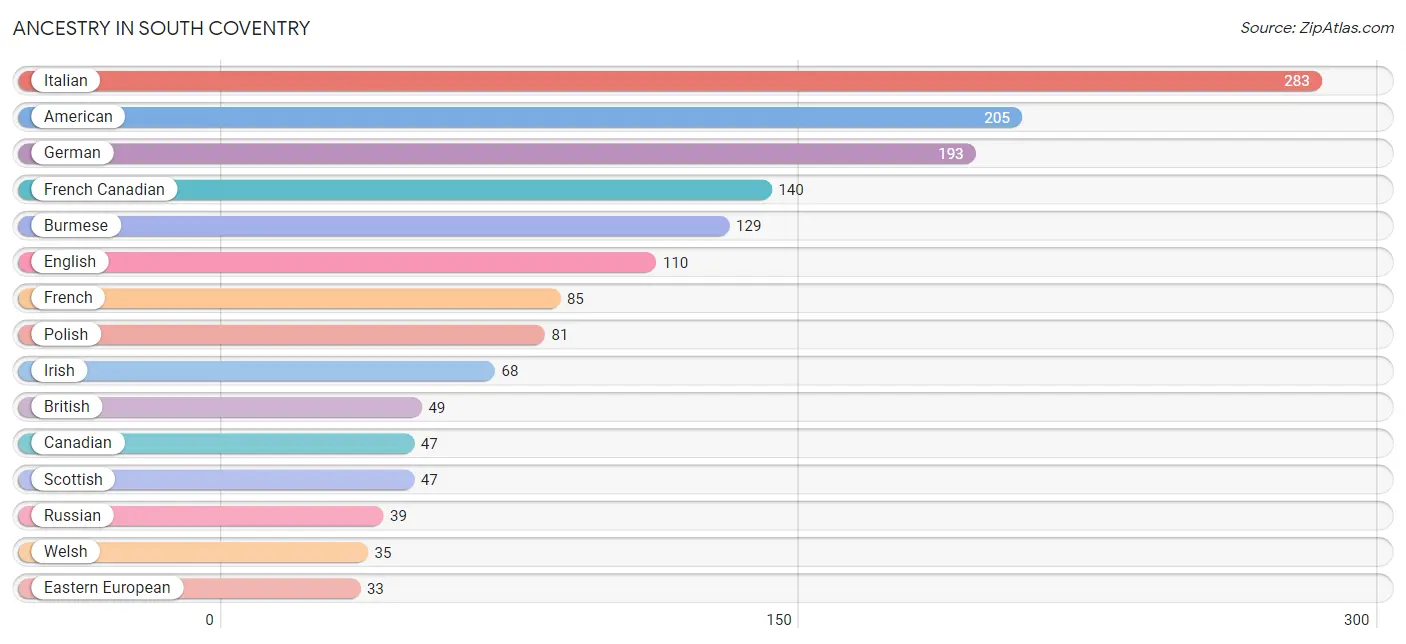
| Ancestry | # Population | % Population |
| American | 205 | 14.0% |
| Assyrian / Chaldean / Syriac | 12 | 0.8% |
| British | 49 | 3.3% |
| Burmese | 129 | 8.8% |
| Canadian | 47 | 3.2% |
| Eastern European | 33 | 2.2% |
| English | 110 | 7.5% |
| French | 85 | 5.8% |
| French Canadian | 140 | 9.5% |
| German | 193 | 13.2% |
| Irish | 68 | 4.6% |
| Italian | 283 | 19.3% |
| Pennsylvania German | 13 | 0.9% |
| Polish | 81 | 5.5% |
| Portuguese | 2 | 0.1% |
| Russian | 39 | 2.7% |
| Scottish | 47 | 3.2% |
| Swedish | 29 | 2.0% |
| Welsh | 35 | 2.4% | View All 19 Rows |
Immigrants in South Coventry
The most numerous immigrant groups reported in South Coventry came from Asia (129 | 8.8%), India (49 | 3.3%), South Central Asia (49 | 3.3%), China (46 | 3.1%), and Eastern Asia (46 | 3.1%), together accounting for 21.7% of all South Coventry residents.
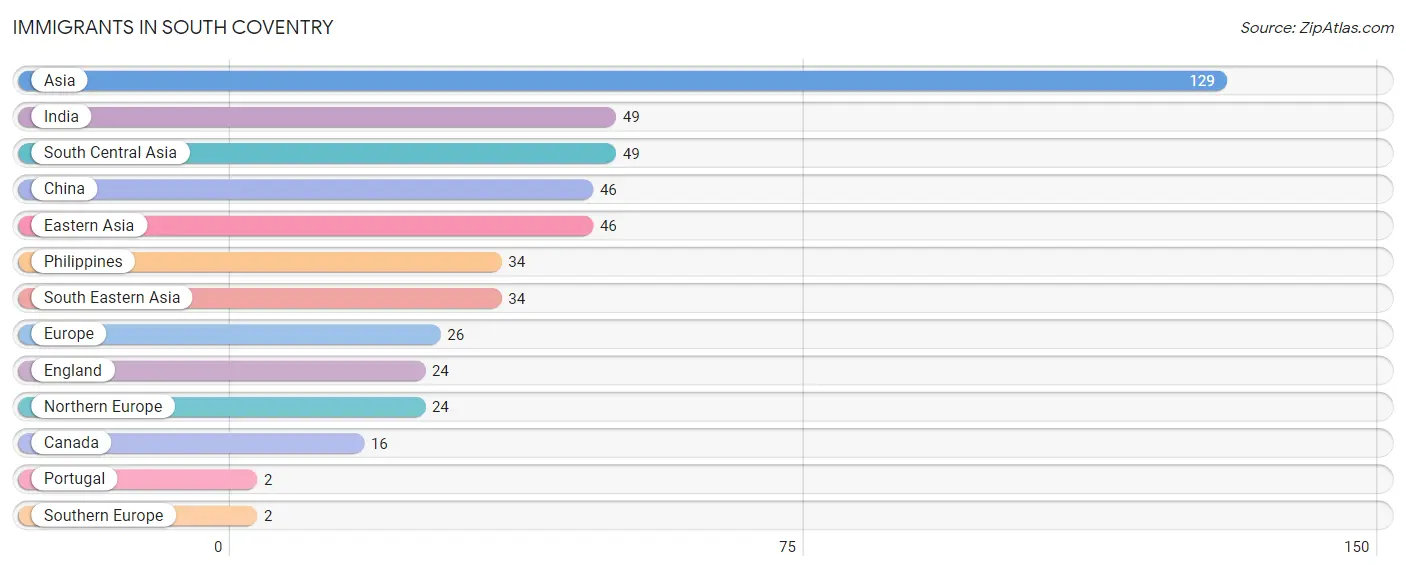
| Immigration Origin | # Population | % Population |
| Asia | 129 | 8.8% |
| Canada | 16 | 1.1% |
| China | 46 | 3.1% |
| Eastern Asia | 46 | 3.1% |
| England | 24 | 1.6% |
| Europe | 26 | 1.8% |
| India | 49 | 3.3% |
| Northern Europe | 24 | 1.6% |
| Philippines | 34 | 2.3% |
| Portugal | 2 | 0.1% |
| South Central Asia | 49 | 3.3% |
| South Eastern Asia | 34 | 2.3% |
| Southern Europe | 2 | 0.1% | View All 13 Rows |
Sex and Age in South Coventry
Sex and Age in South Coventry
The most populous age groups in South Coventry are 70 to 74 Years (159 | 27.5%) for men and 60 to 64 Years (266 | 29.9%) for women.
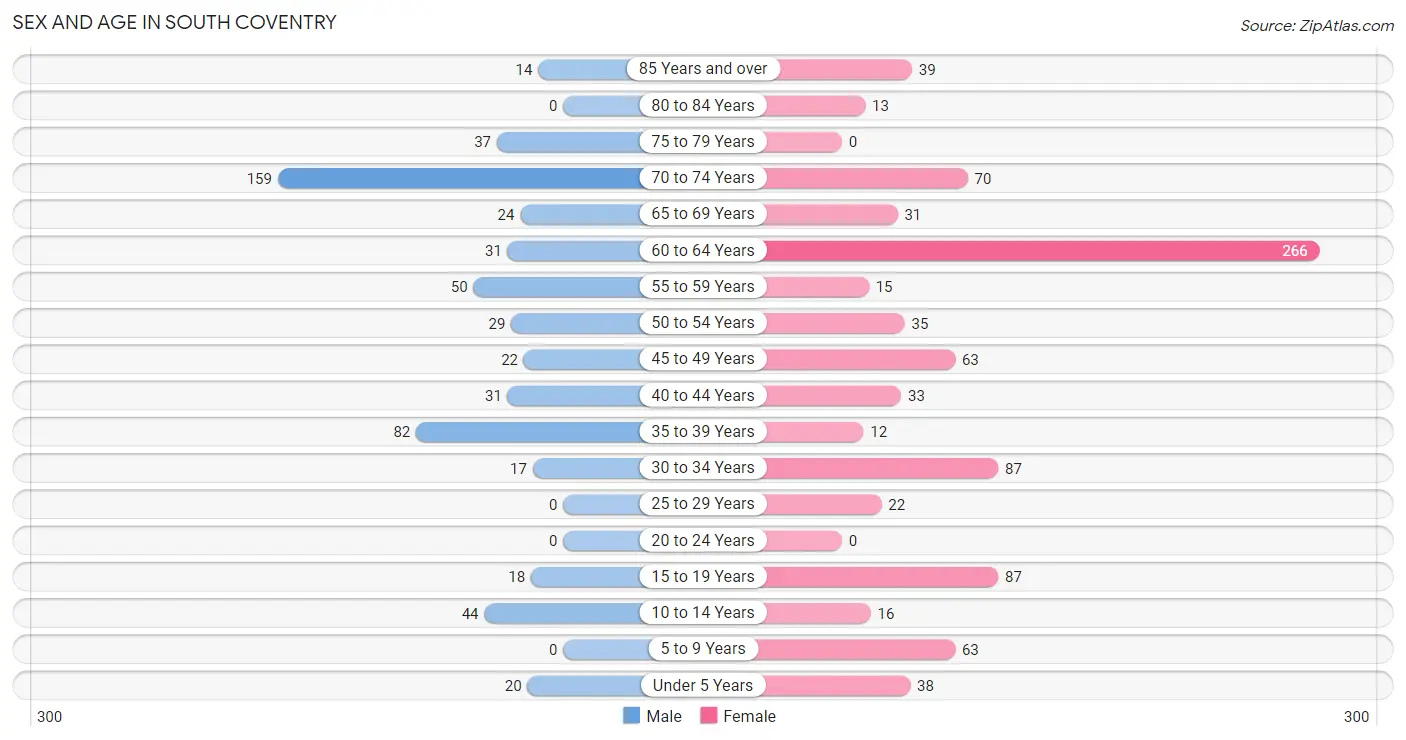
| Age Bracket | Male | Female |
| Under 5 Years | 20 (3.5%) | 38 (4.3%) |
| 5 to 9 Years | 0 (0.0%) | 63 (7.1%) |
| 10 to 14 Years | 44 (7.6%) | 16 (1.8%) |
| 15 to 19 Years | 18 (3.1%) | 87 (9.8%) |
| 20 to 24 Years | 0 (0.0%) | 0 (0.0%) |
| 25 to 29 Years | 0 (0.0%) | 22 (2.5%) |
| 30 to 34 Years | 17 (2.9%) | 87 (9.8%) |
| 35 to 39 Years | 82 (14.2%) | 12 (1.3%) |
| 40 to 44 Years | 31 (5.4%) | 33 (3.7%) |
| 45 to 49 Years | 22 (3.8%) | 63 (7.1%) |
| 50 to 54 Years | 29 (5.0%) | 35 (3.9%) |
| 55 to 59 Years | 50 (8.6%) | 15 (1.7%) |
| 60 to 64 Years | 31 (5.4%) | 266 (29.9%) |
| 65 to 69 Years | 24 (4.2%) | 31 (3.5%) |
| 70 to 74 Years | 159 (27.5%) | 70 (7.9%) |
| 75 to 79 Years | 37 (6.4%) | 0 (0.0%) |
| 80 to 84 Years | 0 (0.0%) | 13 (1.5%) |
| 85 Years and over | 14 (2.4%) | 39 (4.4%) |
| Total | 578 (100.0%) | 890 (100.0%) |
Families and Households in South Coventry
Median Family Size in South Coventry
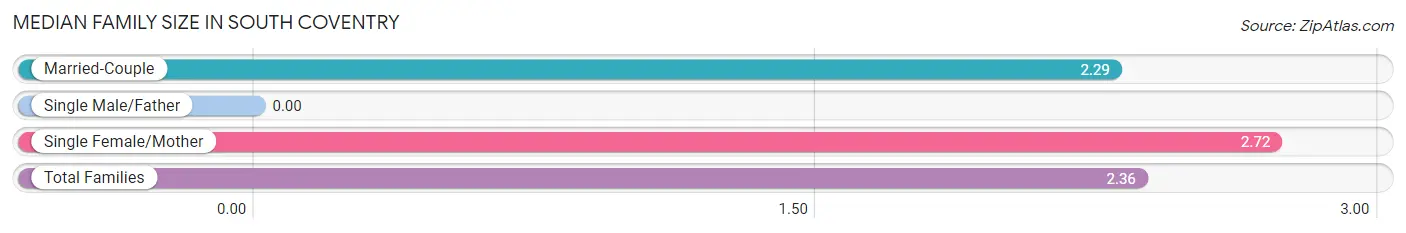
| Family Type | # Families | Family Size |
| Married-Couple | 465 (85.5%) | 2.29 |
| Single Male/Father | 0 (0.0%) | - |
| Single Female/Mother | 79 (14.5%) | 2.72 |
| Total Families | 544 (100.0%) | 2.36 |
Median Household Size in South Coventry
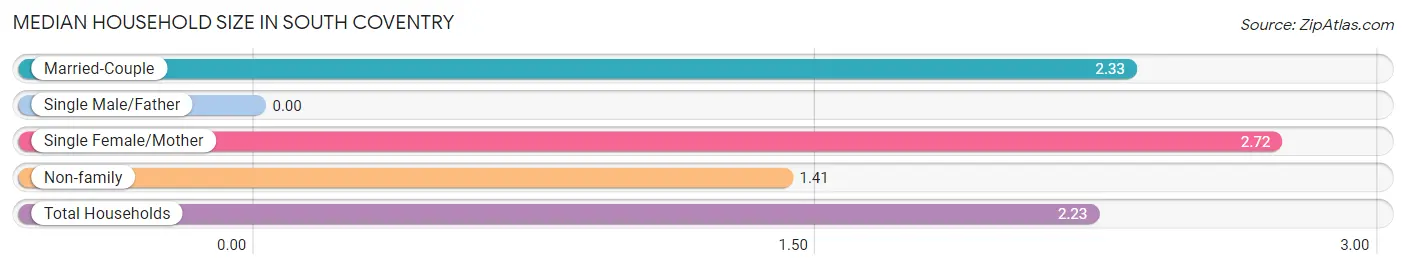
| Household Type | # Households | Household Size |
| Married-Couple | 465 (71.8%) | 2.33 |
| Single Male/Father | 0 (0.0%) | - |
| Single Female/Mother | 79 (12.2%) | 2.72 |
| Non-family | 104 (16.1%) | 1.41 |
| Total Households | 648 (100.0%) | 2.23 |
Household Size by Marriage Status in South Coventry
Out of a total of 648 households in South Coventry, 544 (84.0%) are family households, while 104 (16.1%) are nonfamily households. The most numerous type of family households are 2-person households, comprising 371, and the most common type of nonfamily households are 1-person households, comprising 65.
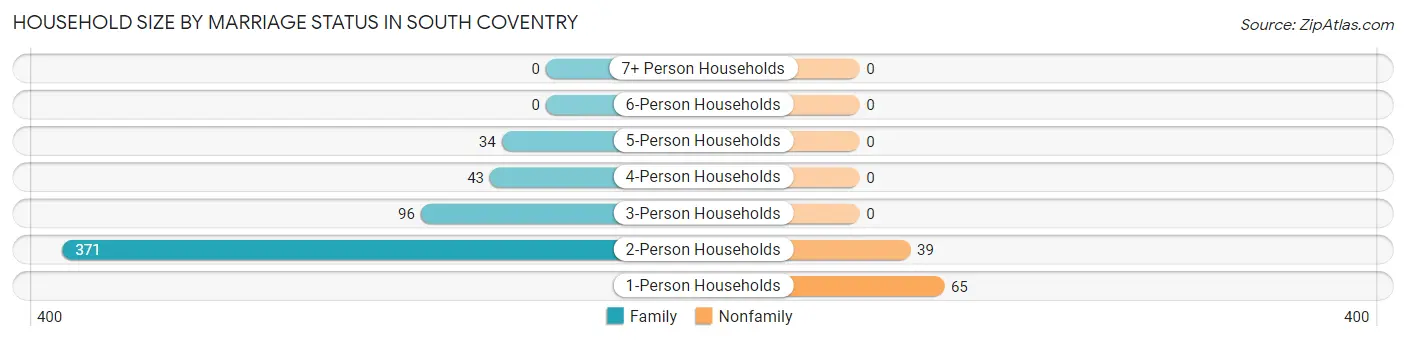
| Household Size | Family Households | Nonfamily Households |
| 1-Person Households | - | 65 (10.0%) |
| 2-Person Households | 371 (57.3%) | 39 (6.0%) |
| 3-Person Households | 96 (14.8%) | 0 (0.0%) |
| 4-Person Households | 43 (6.6%) | 0 (0.0%) |
| 5-Person Households | 34 (5.2%) | 0 (0.0%) |
| 6-Person Households | 0 (0.0%) | 0 (0.0%) |
| 7+ Person Households | 0 (0.0%) | 0 (0.0%) |
| Total | 544 (84.0%) | 104 (16.1%) |
Female Fertility in South Coventry
Fertility by Age in South Coventry
Average fertility rate in South Coventry is 151.0 births per 1,000 women. Women in the age bracket of 20 to 34 years have the highest fertility rate with 422.0 births per 1,000 women. Women in the age bracket of 20 to 34 years acount for 100.0% of all women with births.
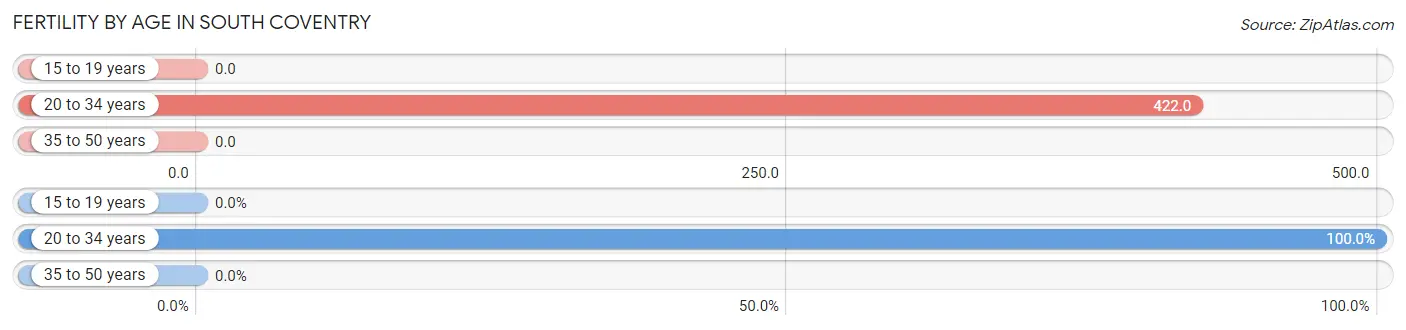
| Age Bracket | Women with Births | Births / 1,000 Women |
| 15 to 19 years | 0 (0.0%) | 0.0 |
| 20 to 34 years | 46 (100.0%) | 422.0 |
| 35 to 50 years | 0 (0.0%) | 0.0 |
| Total | 46 (100.0%) | 151.0 |
Fertility by Age by Marriage Status in South Coventry
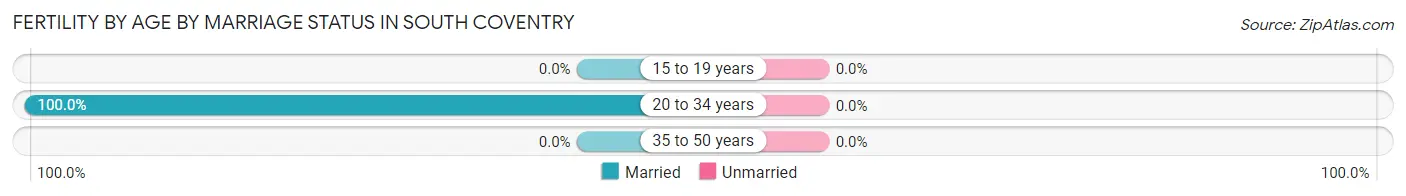
| Age Bracket | Married | Unmarried |
| 15 to 19 years | 0 (0.0%) | 0 (0.0%) |
| 20 to 34 years | 46 (100.0%) | 0 (0.0%) |
| 35 to 50 years | 0 (0.0%) | 0 (0.0%) |
| Total | 46 (100.0%) | 0 (0.0%) |
Fertility by Education in South Coventry
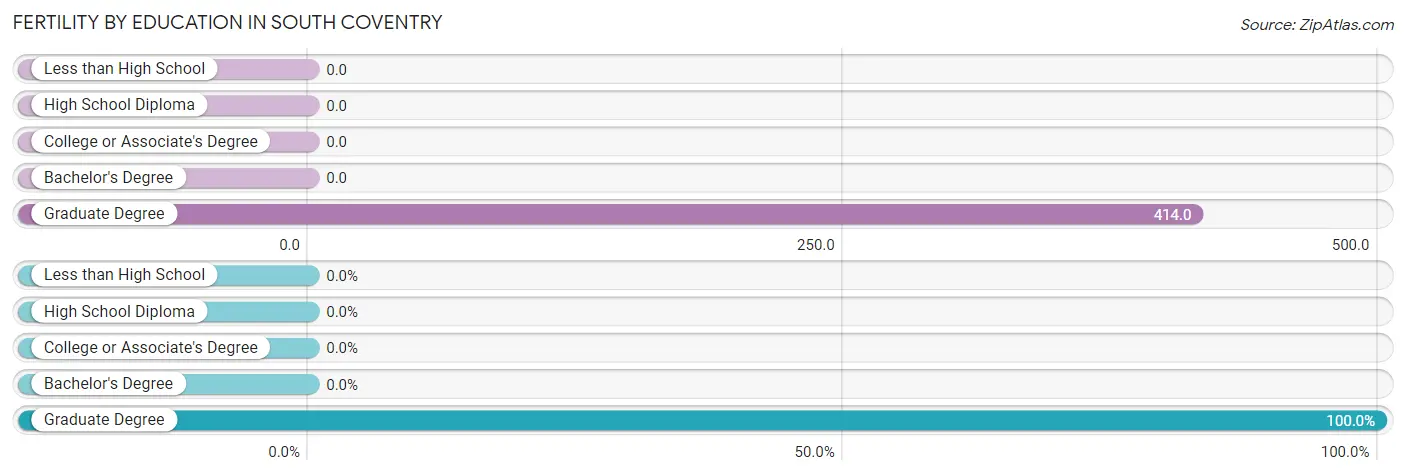
| Educational Attainment | Women with Births | Births / 1,000 Women |
| Less than High School | 0 (0.0%) | 0.0 |
| High School Diploma | 0 (0.0%) | 0.0 |
| College or Associate's Degree | 0 (0.0%) | 0.0 |
| Bachelor's Degree | 0 (0.0%) | 0.0 |
| Graduate Degree | 46 (100.0%) | 414.0 |
| Total | 46 (100.0%) | 151.0 |
Fertility by Education by Marriage Status in South Coventry
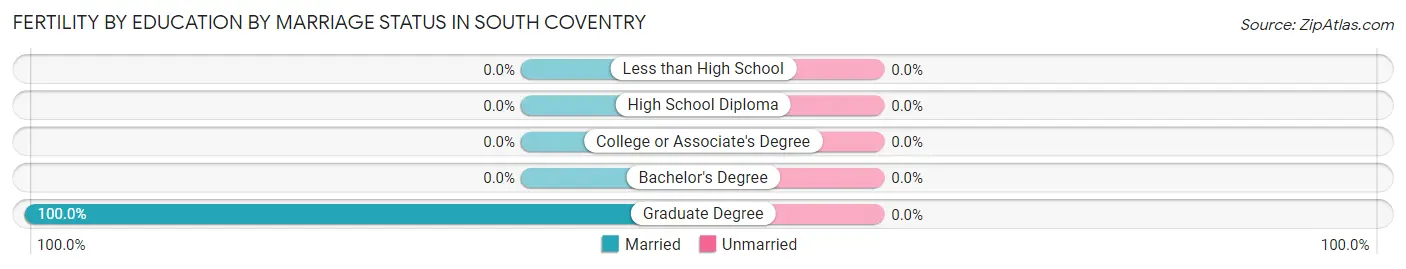
| Educational Attainment | Married | Unmarried |
| Less than High School | 0 (0.0%) | 0 (0.0%) |
| High School Diploma | 0 (0.0%) | 0 (0.0%) |
| College or Associate's Degree | 0 (0.0%) | 0 (0.0%) |
| Bachelor's Degree | 0 (0.0%) | 0 (0.0%) |
| Graduate Degree | 46 (100.0%) | 0 (0.0%) |
| Total | 46 (100.0%) | 0 (0.0%) |
Employment Characteristics in South Coventry
Employment by Class of Employer in South Coventry
Among the 572 employed individuals in South Coventry, private company employees (388 | 67.8%), not-for-profit organizations (72 | 12.6%), and self-employed (incorporated) (46 | 8.0%) make up the most common classes of employment.
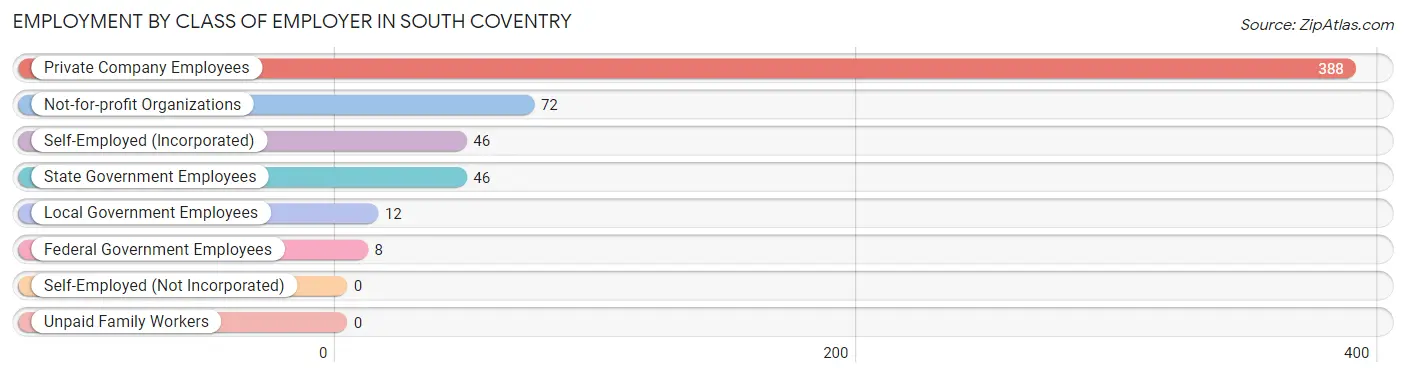
| Employer Class | # Employees | % Employees |
| Private Company Employees | 388 | 67.8% |
| Self-Employed (Incorporated) | 46 | 8.0% |
| Self-Employed (Not Incorporated) | 0 | 0.0% |
| Not-for-profit Organizations | 72 | 12.6% |
| Local Government Employees | 12 | 2.1% |
| State Government Employees | 46 | 8.0% |
| Federal Government Employees | 8 | 1.4% |
| Unpaid Family Workers | 0 | 0.0% |
| Total | 572 | 100.0% |
Employment Status by Age in South Coventry
According to the labor force statistics for South Coventry, out of the total population over 16 years of age (1,287), 45.7% or 588 individuals are in the labor force, with 2.7% or 16 of them unemployed. The age group with the highest labor force participation rate is 25 to 29 years, with 100.0% or 22 individuals in the labor force. Within the labor force, the 60 to 64 years age range has the highest percentage of unemployed individuals, with 16.5% or 16 of them being unemployed.
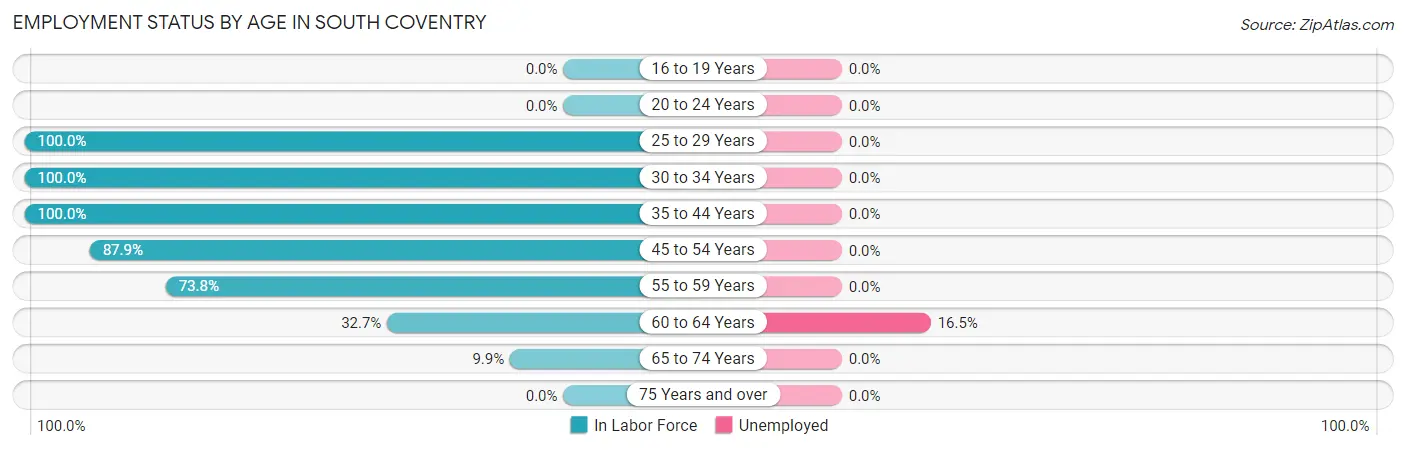
| Age Bracket | In Labor Force | Unemployed |
| 16 to 19 Years | 0 (0.0%) | 0 (0.0%) |
| 20 to 24 Years | 0 (0.0%) | 0 (0.0%) |
| 25 to 29 Years | 22 (100.0%) | 0 (0.0%) |
| 30 to 34 Years | 104 (100.0%) | 0 (0.0%) |
| 35 to 44 Years | 158 (100.0%) | 0 (0.0%) |
| 45 to 54 Years | 131 (87.9%) | 0 (0.0%) |
| 55 to 59 Years | 48 (73.8%) | 0 (0.0%) |
| 60 to 64 Years | 97 (32.7%) | 16 (16.5%) |
| 65 to 74 Years | 28 (9.9%) | 0 (0.0%) |
| 75 Years and over | 0 (0.0%) | 0 (0.0%) |
| Total | 588 (45.7%) | 16 (2.7%) |
Employment Status by Educational Attainment in South Coventry
According to labor force statistics for South Coventry, 70.4% of individuals (560) out of the total population between 25 and 64 years of age (795) are in the labor force, with 2.9% or 16 of them being unemployed. The group with the highest labor force participation rate are those with the educational attainment of college / associate degree, with 91.3% or 137 individuals in the labor force. Within the labor force, individuals with bachelor's degree or higher education have the highest percentage of unemployment, with 5.1% or 16 of them being unemployed.
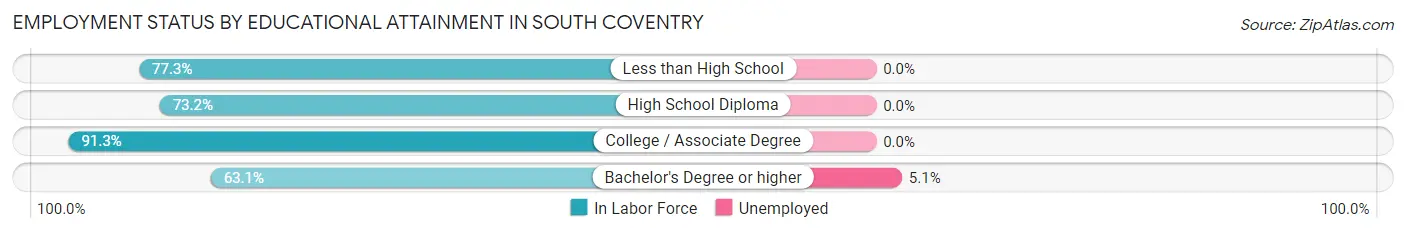
| Educational Attainment | In Labor Force | Unemployed |
| Less than High School | 17 (77.3%) | 0 (0.0%) |
| High School Diploma | 93 (73.2%) | 0 (0.0%) |
| College / Associate Degree | 137 (91.3%) | 0 (0.0%) |
| Bachelor's Degree or higher | 313 (63.1%) | 25 (5.1%) |
| Total | 560 (70.4%) | 23 (2.9%) |
Employment Occupations by Sex in South Coventry
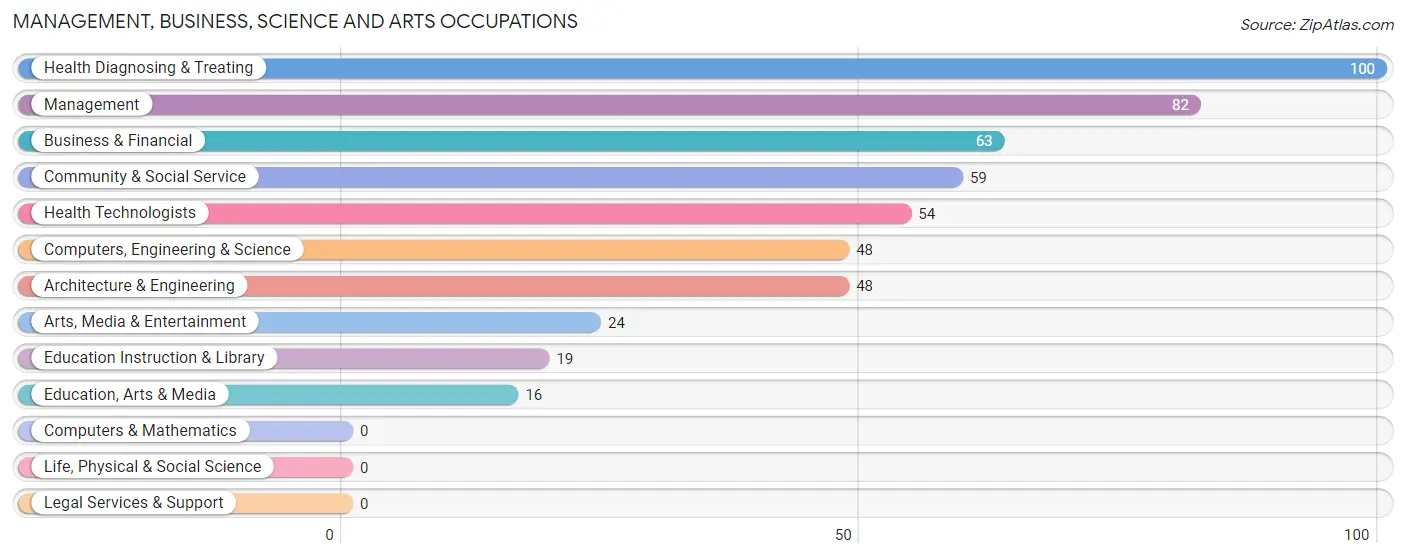
Management, Business, Science and Arts Occupations
The most common Management, Business, Science and Arts occupations in South Coventry are Health Diagnosing & Treating (100 | 17.5%), Management (82 | 14.3%), Business & Financial (63 | 11.0%), Community & Social Service (59 | 10.3%), and Health Technologists (54 | 9.4%).
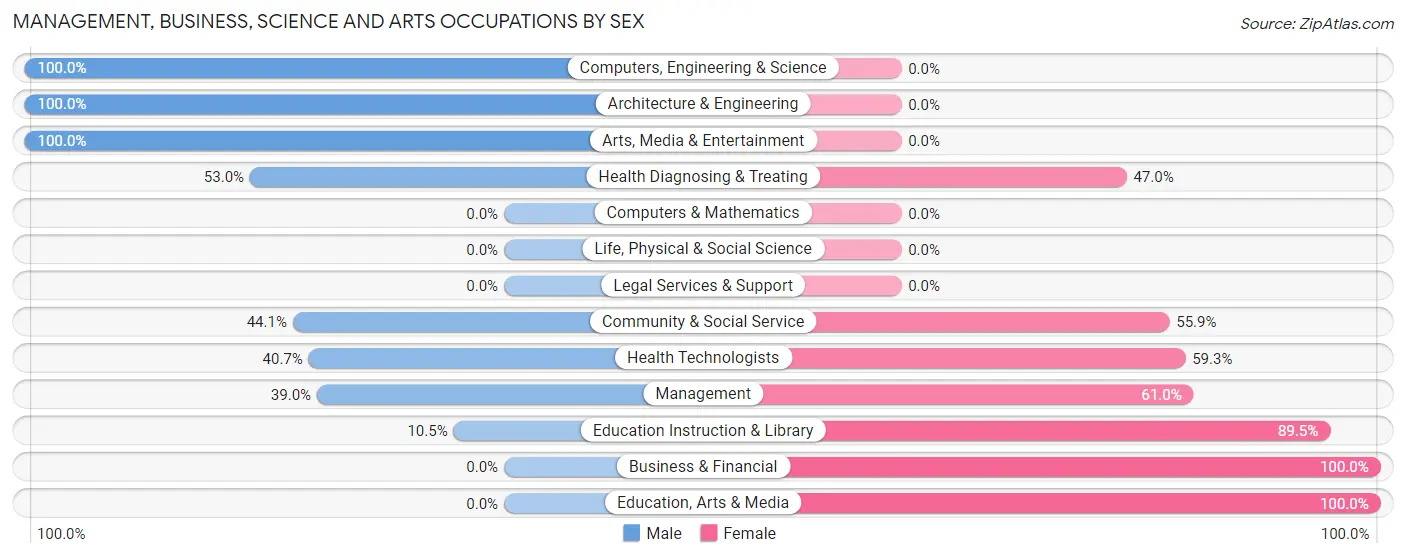
Management, Business, Science and Arts Occupations by Sex
Within the Management, Business, Science and Arts occupations in South Coventry, the most male-oriented occupations are Computers, Engineering & Science (100.0%), Architecture & Engineering (100.0%), and Arts, Media & Entertainment (100.0%), while the most female-oriented occupations are Business & Financial (100.0%), Education, Arts & Media (100.0%), and Education Instruction & Library (89.5%).
| Occupation | Male | Female |
| Management | 32 (39.0%) | 50 (61.0%) |
| Business & Financial | 0 (0.0%) | 63 (100.0%) |
| Computers, Engineering & Science | 48 (100.0%) | 0 (0.0%) |
| Computers & Mathematics | 0 (0.0%) | 0 (0.0%) |
| Architecture & Engineering | 48 (100.0%) | 0 (0.0%) |
| Life, Physical & Social Science | 0 (0.0%) | 0 (0.0%) |
| Community & Social Service | 26 (44.1%) | 33 (55.9%) |
| Education, Arts & Media | 0 (0.0%) | 16 (100.0%) |
| Legal Services & Support | 0 (0.0%) | 0 (0.0%) |
| Education Instruction & Library | 2 (10.5%) | 17 (89.5%) |
| Arts, Media & Entertainment | 24 (100.0%) | 0 (0.0%) |
| Health Diagnosing & Treating | 53 (53.0%) | 47 (47.0%) |
| Health Technologists | 22 (40.7%) | 32 (59.3%) |
| Total (Category) | 159 (45.2%) | 193 (54.8%) |
| Total (Overall) | 238 (41.6%) | 334 (58.4%) |
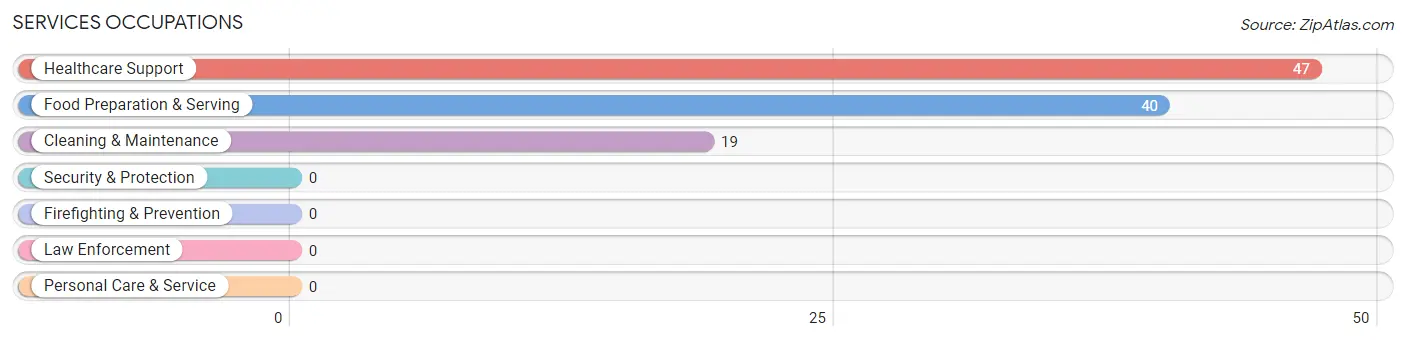
Services Occupations
The most common Services occupations in South Coventry are Healthcare Support (47 | 8.2%), Food Preparation & Serving (40 | 7.0%), and Cleaning & Maintenance (19 | 3.3%).
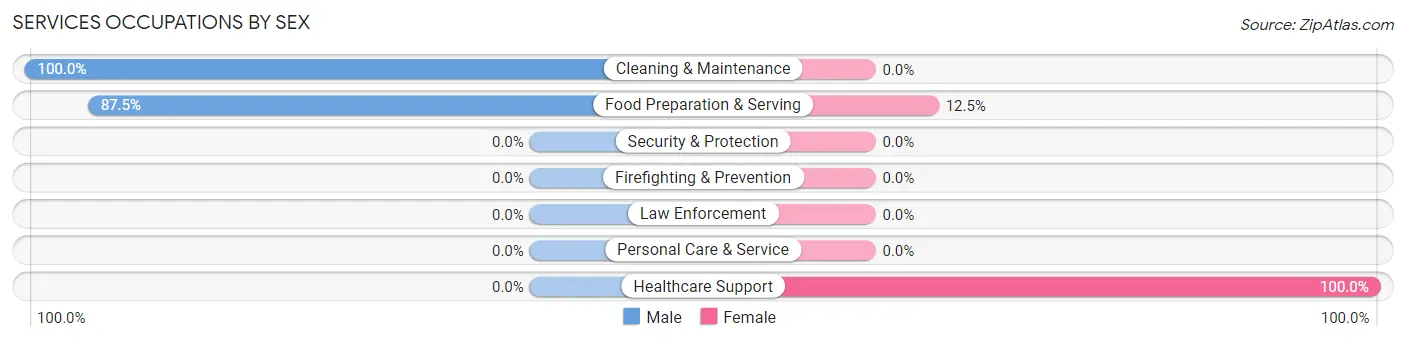
Services Occupations by Sex
Within the Services occupations in South Coventry, the most male-oriented occupations are Cleaning & Maintenance (100.0%), and Food Preparation & Serving (87.5%), while the most female-oriented occupations are Healthcare Support (100.0%), and Food Preparation & Serving (12.5%).
| Occupation | Male | Female |
| Healthcare Support | 0 (0.0%) | 47 (100.0%) |
| Security & Protection | 0 (0.0%) | 0 (0.0%) |
| Firefighting & Prevention | 0 (0.0%) | 0 (0.0%) |
| Law Enforcement | 0 (0.0%) | 0 (0.0%) |
| Food Preparation & Serving | 35 (87.5%) | 5 (12.5%) |
| Cleaning & Maintenance | 19 (100.0%) | 0 (0.0%) |
| Personal Care & Service | 0 (0.0%) | 0 (0.0%) |
| Total (Category) | 54 (50.9%) | 52 (49.1%) |
| Total (Overall) | 238 (41.6%) | 334 (58.4%) |
Sales and Office Occupations
The most common Sales and Office occupations in South Coventry are , and Office & Administration (37 | 6.5%).
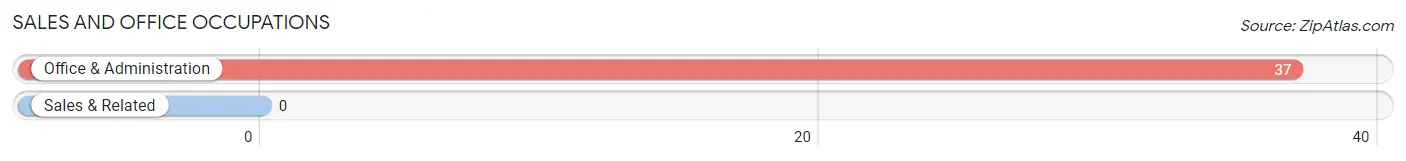
Sales and Office Occupations by Sex
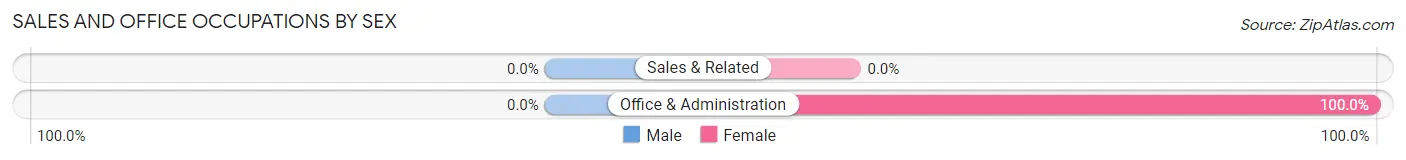
| Occupation | Male | Female |
| Sales & Related | 0 (0.0%) | 0 (0.0%) |
| Office & Administration | 0 (0.0%) | 37 (100.0%) |
| Total (Category) | 0 (0.0%) | 37 (100.0%) |
| Total (Overall) | 238 (41.6%) | 334 (58.4%) |
Natural Resources, Construction and Maintenance Occupations
The most common Natural Resources, Construction and Maintenance occupations in South Coventry are , and Installation, Maintenance & Repair (13 | 2.3%).
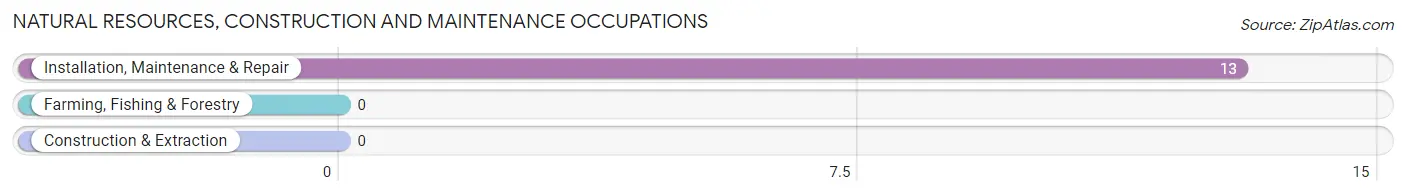
Natural Resources, Construction and Maintenance Occupations by Sex
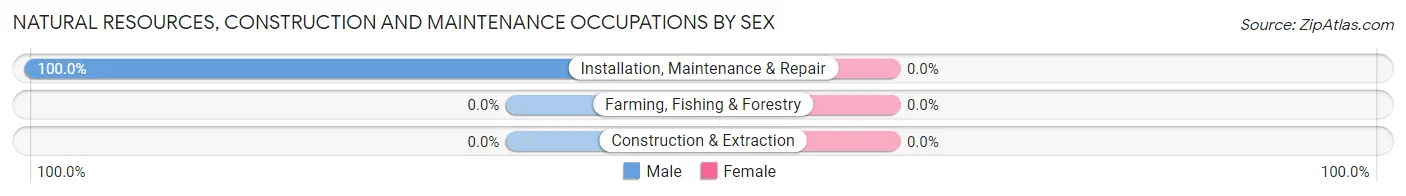
| Occupation | Male | Female |
| Farming, Fishing & Forestry | 0 (0.0%) | 0 (0.0%) |
| Construction & Extraction | 0 (0.0%) | 0 (0.0%) |
| Installation, Maintenance & Repair | 13 (100.0%) | 0 (0.0%) |
| Total (Category) | 13 (100.0%) | 0 (0.0%) |
| Total (Overall) | 238 (41.6%) | 334 (58.4%) |
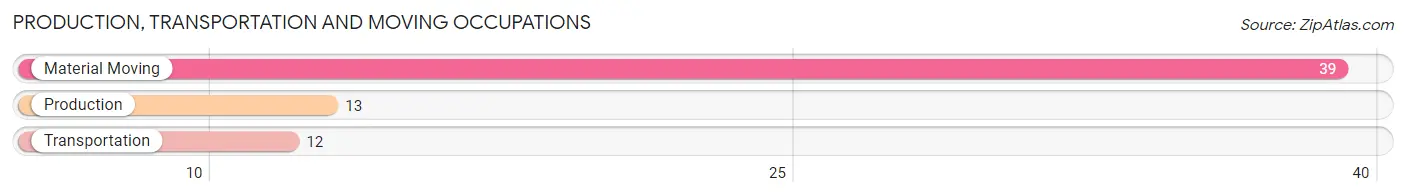
Production, Transportation and Moving Occupations
The most common Production, Transportation and Moving occupations in South Coventry are Material Moving (39 | 6.8%), Production (13 | 2.3%), and Transportation (12 | 2.1%).
Production, Transportation and Moving Occupations by Sex
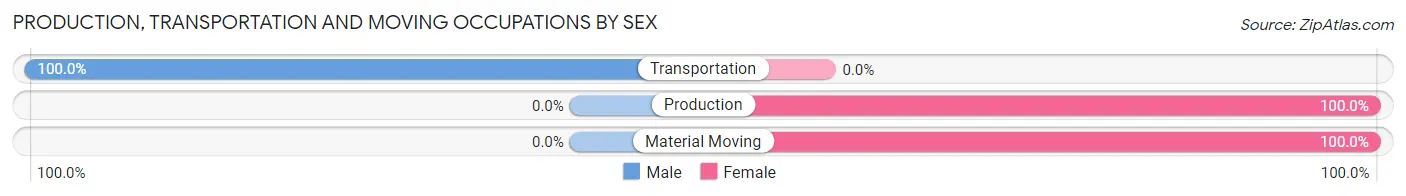
| Occupation | Male | Female |
| Production | 0 (0.0%) | 13 (100.0%) |
| Transportation | 12 (100.0%) | 0 (0.0%) |
| Material Moving | 0 (0.0%) | 39 (100.0%) |
| Total (Category) | 12 (18.8%) | 52 (81.2%) |
| Total (Overall) | 238 (41.6%) | 334 (58.4%) |
Employment Industries by Sex in South Coventry
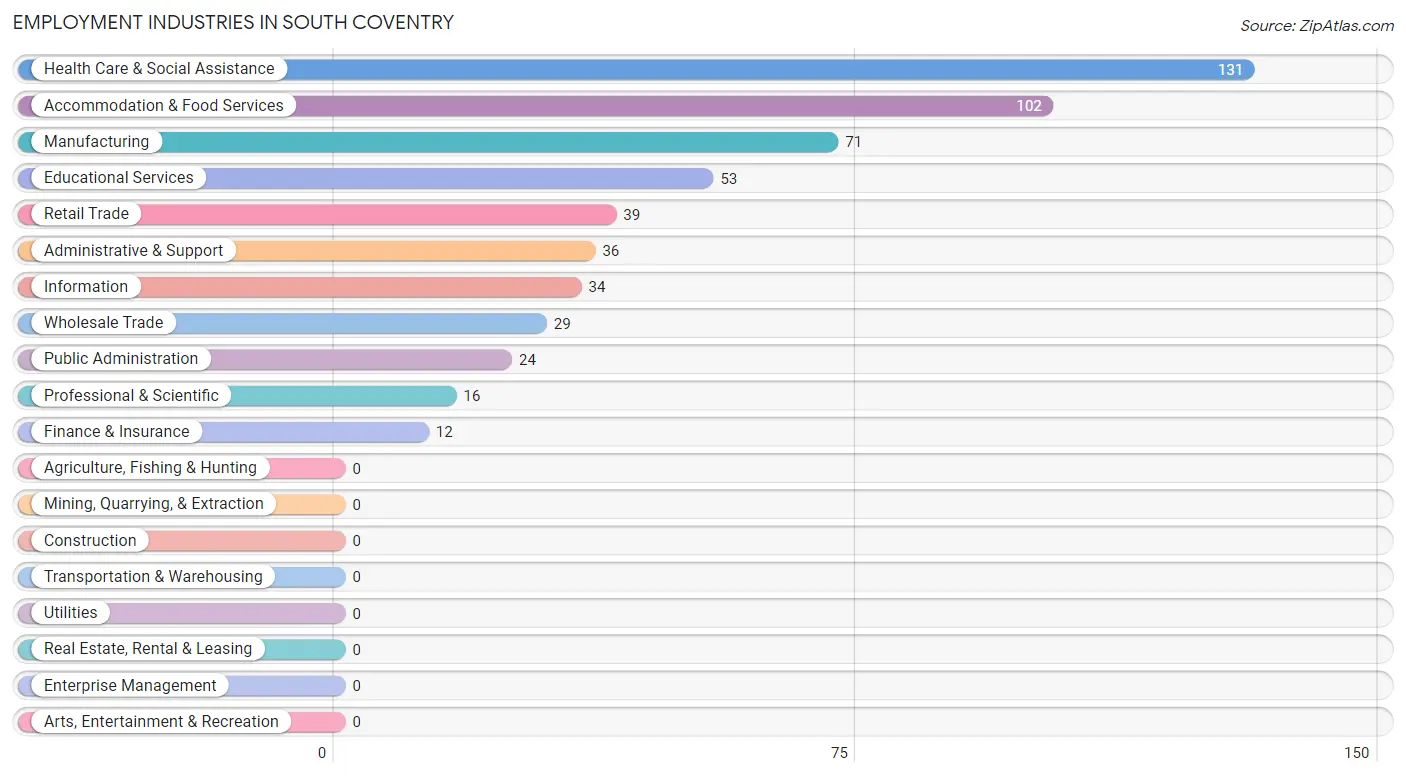
Employment Industries in South Coventry
The major employment industries in South Coventry include Health Care & Social Assistance (131 | 22.9%), Accommodation & Food Services (102 | 17.8%), Manufacturing (71 | 12.4%), Educational Services (53 | 9.3%), and Retail Trade (39 | 6.8%).
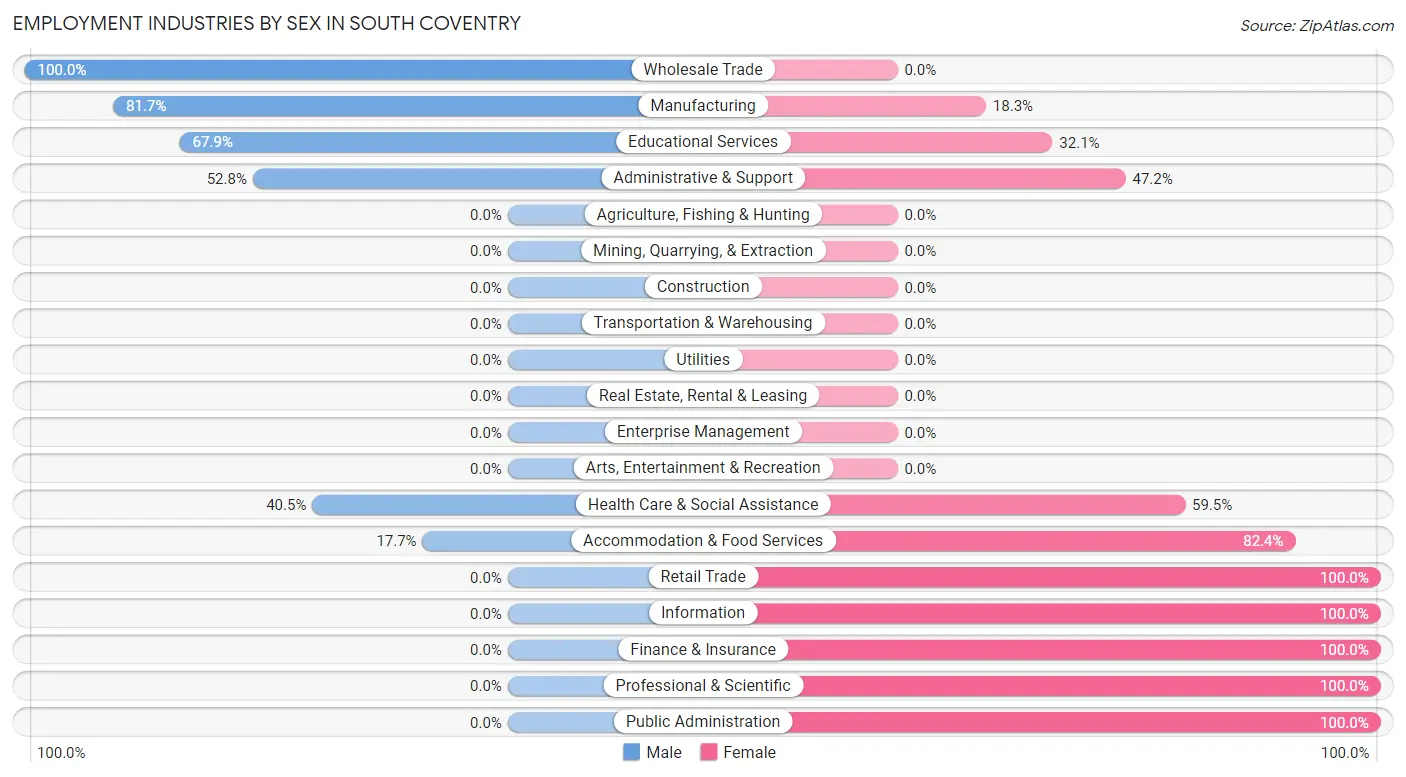
Employment Industries by Sex in South Coventry
The South Coventry industries that see more men than women are Wholesale Trade (100.0%), Manufacturing (81.7%), and Educational Services (67.9%), whereas the industries that tend to have a higher number of women are Retail Trade (100.0%), Information (100.0%), and Finance & Insurance (100.0%).
| Industry | Male | Female |
| Agriculture, Fishing & Hunting | 0 (0.0%) | 0 (0.0%) |
| Mining, Quarrying, & Extraction | 0 (0.0%) | 0 (0.0%) |
| Construction | 0 (0.0%) | 0 (0.0%) |
| Manufacturing | 58 (81.7%) | 13 (18.3%) |
| Wholesale Trade | 29 (100.0%) | 0 (0.0%) |
| Retail Trade | 0 (0.0%) | 39 (100.0%) |
| Transportation & Warehousing | 0 (0.0%) | 0 (0.0%) |
| Utilities | 0 (0.0%) | 0 (0.0%) |
| Information | 0 (0.0%) | 34 (100.0%) |
| Finance & Insurance | 0 (0.0%) | 12 (100.0%) |
| Real Estate, Rental & Leasing | 0 (0.0%) | 0 (0.0%) |
| Professional & Scientific | 0 (0.0%) | 16 (100.0%) |
| Enterprise Management | 0 (0.0%) | 0 (0.0%) |
| Administrative & Support | 19 (52.8%) | 17 (47.2%) |
| Educational Services | 36 (67.9%) | 17 (32.1%) |
| Health Care & Social Assistance | 53 (40.5%) | 78 (59.5%) |
| Arts, Entertainment & Recreation | 0 (0.0%) | 0 (0.0%) |
| Accommodation & Food Services | 18 (17.6%) | 84 (82.4%) |
| Public Administration | 0 (0.0%) | 24 (100.0%) |
| Total | 238 (41.6%) | 334 (58.4%) |
Education in South Coventry
School Enrollment in South Coventry
The most common levels of schooling among the 279 students in South Coventry are high school (121 | 43.4%), elementary school (51 | 18.3%), and college / undergraduate (51 | 18.3%).
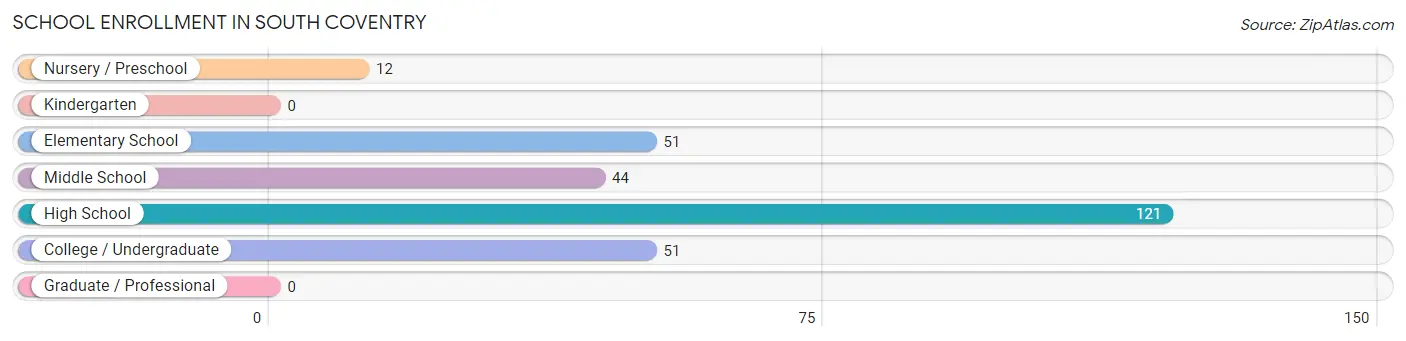
| School Level | # Students | % Students |
| Nursery / Preschool | 12 | 4.3% |
| Kindergarten | 0 | 0.0% |
| Elementary School | 51 | 18.3% |
| Middle School | 44 | 15.8% |
| High School | 121 | 43.4% |
| College / Undergraduate | 51 | 18.3% |
| Graduate / Professional | 0 | 0.0% |
| Total | 279 | 100.0% |
School Enrollment by Age by Funding Source in South Coventry
Out of a total of 279 students who are enrolled in schools in South Coventry, 46 (16.5%) attend a private institution, while the remaining 233 (83.5%) are enrolled in public schools. The age group of 35 years and over has the highest likelihood of being enrolled in private schools, with 34 (100.0% in the age bracket) enrolled. Conversely, the age group of 10 to 14 year olds has the lowest likelihood of being enrolled in a private school, with 60 (100.0% in the age bracket) attending a public institution.
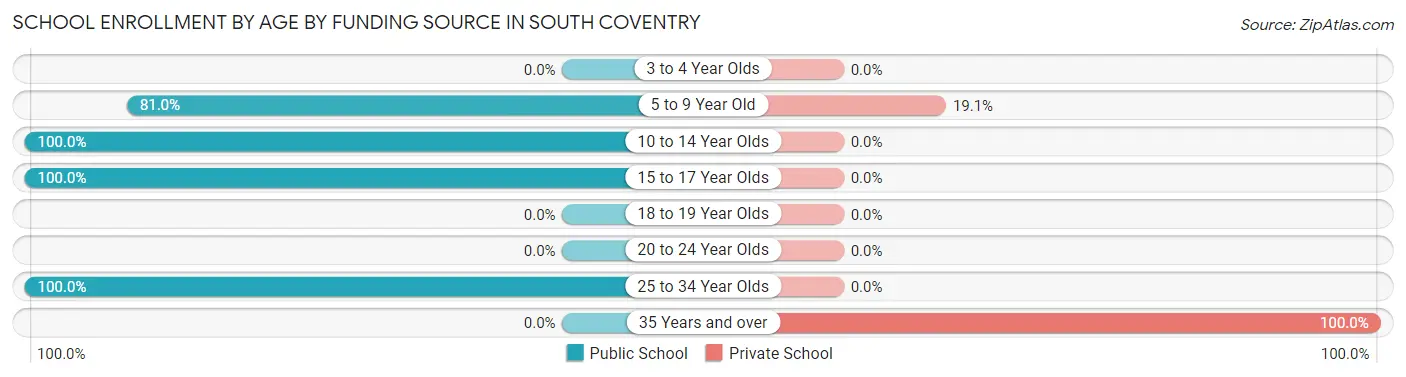
| Age Bracket | Public School | Private School |
| 3 to 4 Year Olds | 0 (0.0%) | 0 (0.0%) |
| 5 to 9 Year Old | 51 (80.9%) | 12 (19.1%) |
| 10 to 14 Year Olds | 60 (100.0%) | 0 (0.0%) |
| 15 to 17 Year Olds | 105 (100.0%) | 0 (0.0%) |
| 18 to 19 Year Olds | 0 (0.0%) | 0 (0.0%) |
| 20 to 24 Year Olds | 0 (0.0%) | 0 (0.0%) |
| 25 to 34 Year Olds | 17 (100.0%) | 0 (0.0%) |
| 35 Years and over | 0 (0.0%) | 34 (100.0%) |
| Total | 233 (83.5%) | 46 (16.5%) |
Educational Attainment by Field of Study in South Coventry
Education (243 | 37.9%), business (80 | 12.5%), literature & languages (52 | 8.1%), bio, nature & agricultural (46 | 7.2%), and visual & performing arts (46 | 7.2%) are the most common fields of study among 641 individuals in South Coventry who have obtained a bachelor's degree or higher.
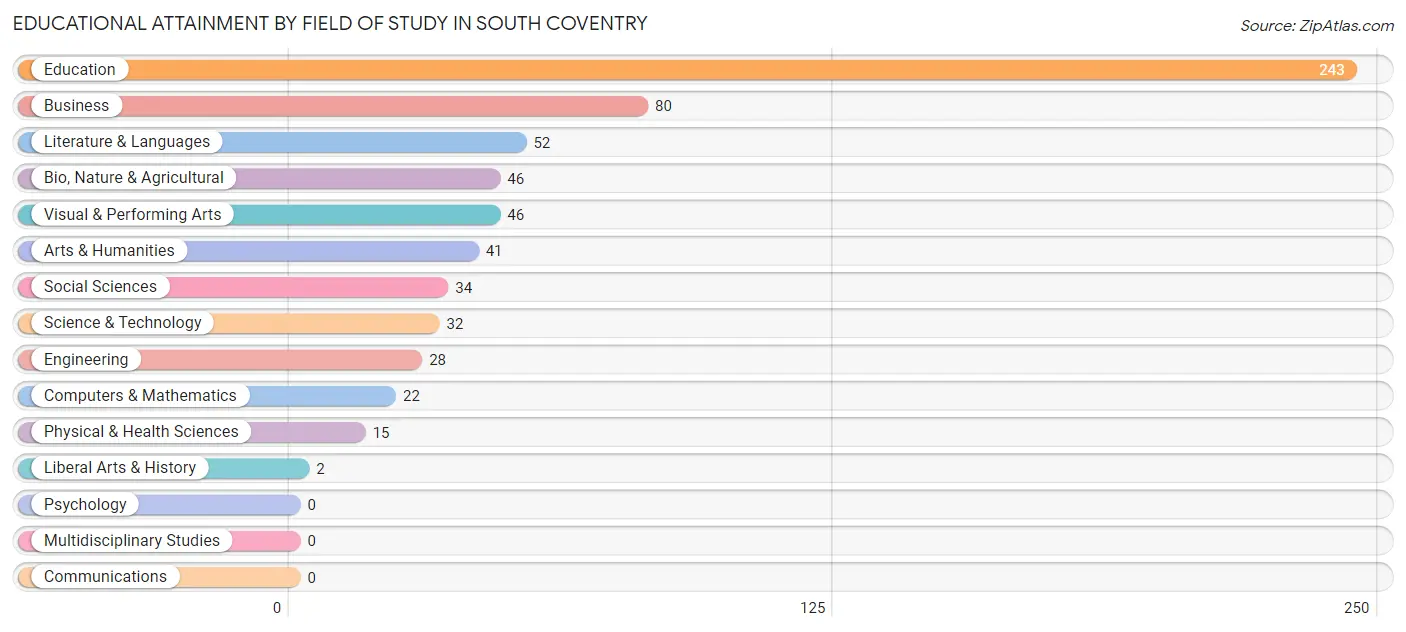
| Field of Study | # Graduates | % Graduates |
| Computers & Mathematics | 22 | 3.4% |
| Bio, Nature & Agricultural | 46 | 7.2% |
| Physical & Health Sciences | 15 | 2.3% |
| Psychology | 0 | 0.0% |
| Social Sciences | 34 | 5.3% |
| Engineering | 28 | 4.4% |
| Multidisciplinary Studies | 0 | 0.0% |
| Science & Technology | 32 | 5.0% |
| Business | 80 | 12.5% |
| Education | 243 | 37.9% |
| Literature & Languages | 52 | 8.1% |
| Liberal Arts & History | 2 | 0.3% |
| Visual & Performing Arts | 46 | 7.2% |
| Communications | 0 | 0.0% |
| Arts & Humanities | 41 | 6.4% |
| Total | 641 | 100.0% |
Transportation & Commute in South Coventry
Vehicle Availability by Sex in South Coventry
The most prevalent vehicle ownership categories in South Coventry are males with 2 vehicles (104, accounting for 44.1%) and females with 2 vehicles (143, making up 31.1%).
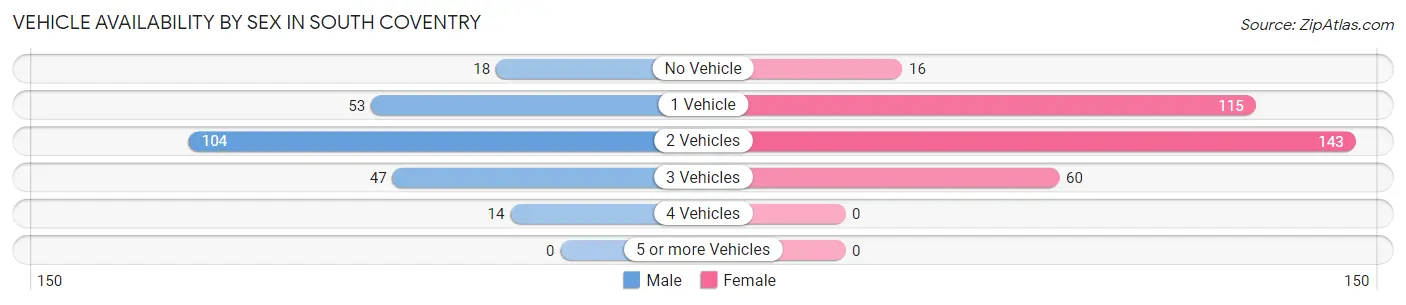
| Vehicles Available | Male | Female |
| No Vehicle | 18 (7.6%) | 16 (4.8%) |
| 1 Vehicle | 53 (22.5%) | 115 (34.4%) |
| 2 Vehicles | 104 (44.1%) | 143 (42.8%) |
| 3 Vehicles | 47 (19.9%) | 60 (18.0%) |
| 4 Vehicles | 14 (5.9%) | 0 (0.0%) |
| 5 or more Vehicles | 0 (0.0%) | 0 (0.0%) |
| Total | 236 (100.0%) | 334 (100.0%) |
Commute Time in South Coventry
The most frequently occuring commute durations in South Coventry are 10 to 14 minutes (114 commuters, 21.3%), 45 to 59 minutes (103 commuters, 19.3%), and 40 to 44 minutes (63 commuters, 11.8%).
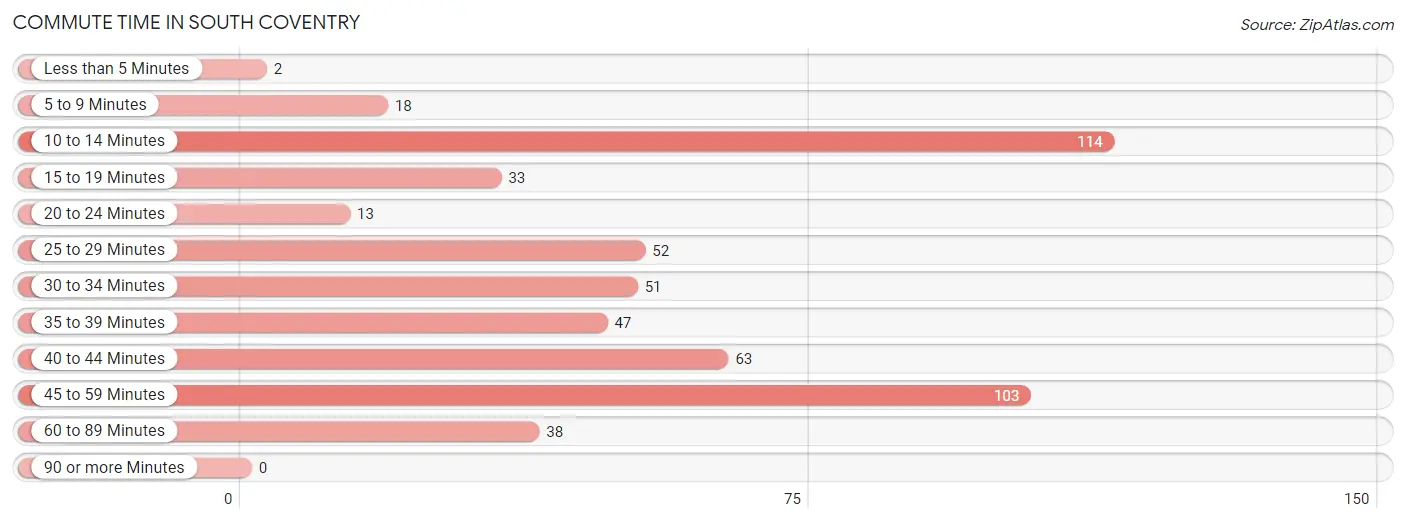
| Commute Time | # Commuters | % Commuters |
| Less than 5 Minutes | 2 | 0.4% |
| 5 to 9 Minutes | 18 | 3.4% |
| 10 to 14 Minutes | 114 | 21.3% |
| 15 to 19 Minutes | 33 | 6.2% |
| 20 to 24 Minutes | 13 | 2.4% |
| 25 to 29 Minutes | 52 | 9.7% |
| 30 to 34 Minutes | 51 | 9.6% |
| 35 to 39 Minutes | 47 | 8.8% |
| 40 to 44 Minutes | 63 | 11.8% |
| 45 to 59 Minutes | 103 | 19.3% |
| 60 to 89 Minutes | 38 | 7.1% |
| 90 or more Minutes | 0 | 0.0% |
Commute Time by Sex in South Coventry
The most common commute times in South Coventry are 30 to 34 minutes (51 commuters, 21.4%) for males and 10 to 14 minutes (114 commuters, 38.5%) for females.
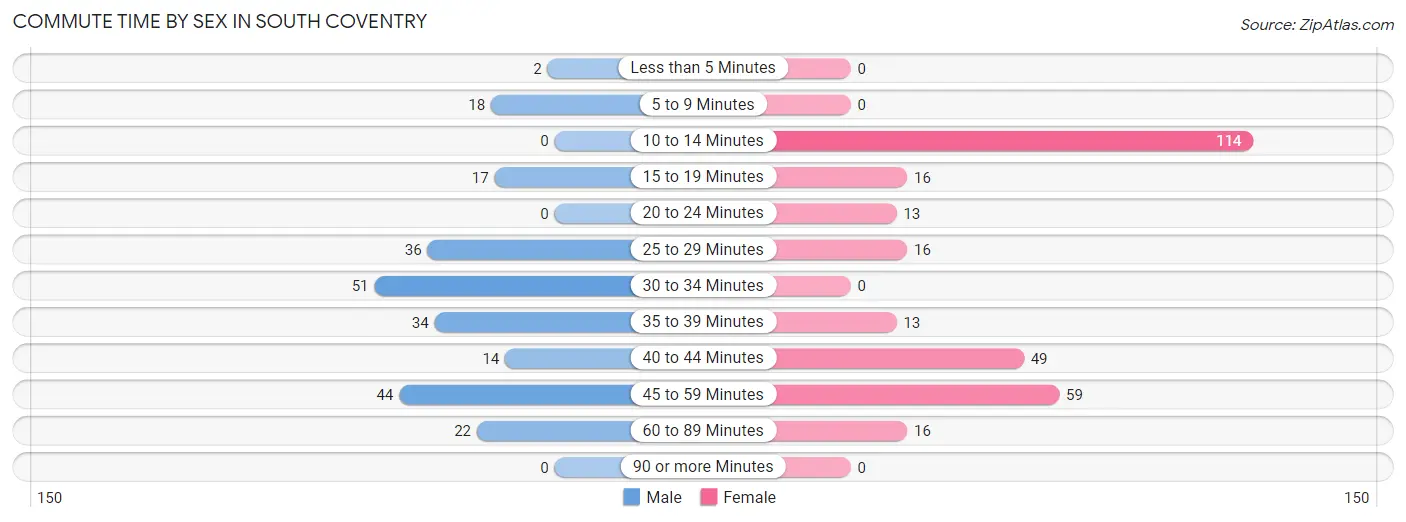
| Commute Time | Male | Female |
| Less than 5 Minutes | 2 (0.8%) | 0 (0.0%) |
| 5 to 9 Minutes | 18 (7.6%) | 0 (0.0%) |
| 10 to 14 Minutes | 0 (0.0%) | 114 (38.5%) |
| 15 to 19 Minutes | 17 (7.1%) | 16 (5.4%) |
| 20 to 24 Minutes | 0 (0.0%) | 13 (4.4%) |
| 25 to 29 Minutes | 36 (15.1%) | 16 (5.4%) |
| 30 to 34 Minutes | 51 (21.4%) | 0 (0.0%) |
| 35 to 39 Minutes | 34 (14.3%) | 13 (4.4%) |
| 40 to 44 Minutes | 14 (5.9%) | 49 (16.6%) |
| 45 to 59 Minutes | 44 (18.5%) | 59 (19.9%) |
| 60 to 89 Minutes | 22 (9.2%) | 16 (5.4%) |
| 90 or more Minutes | 0 (0.0%) | 0 (0.0%) |
Time of Departure to Work by Sex in South Coventry
The most frequent times of departure to work in South Coventry are 6:00 AM to 6:29 AM (64, 26.9%) for males and 8:30 AM to 8:59 AM (64, 21.6%) for females.
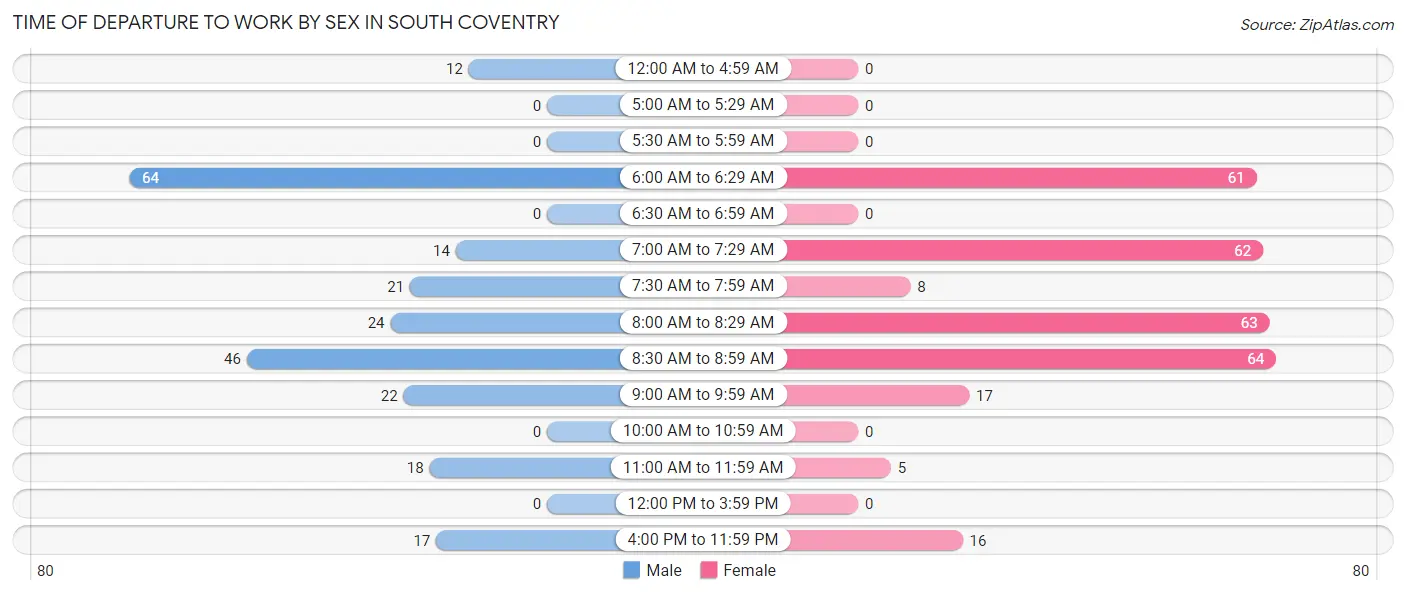
| Time of Departure | Male | Female |
| 12:00 AM to 4:59 AM | 12 (5.0%) | 0 (0.0%) |
| 5:00 AM to 5:29 AM | 0 (0.0%) | 0 (0.0%) |
| 5:30 AM to 5:59 AM | 0 (0.0%) | 0 (0.0%) |
| 6:00 AM to 6:29 AM | 64 (26.9%) | 61 (20.6%) |
| 6:30 AM to 6:59 AM | 0 (0.0%) | 0 (0.0%) |
| 7:00 AM to 7:29 AM | 14 (5.9%) | 62 (20.9%) |
| 7:30 AM to 7:59 AM | 21 (8.8%) | 8 (2.7%) |
| 8:00 AM to 8:29 AM | 24 (10.1%) | 63 (21.3%) |
| 8:30 AM to 8:59 AM | 46 (19.3%) | 64 (21.6%) |
| 9:00 AM to 9:59 AM | 22 (9.2%) | 17 (5.7%) |
| 10:00 AM to 10:59 AM | 0 (0.0%) | 0 (0.0%) |
| 11:00 AM to 11:59 AM | 18 (7.6%) | 5 (1.7%) |
| 12:00 PM to 3:59 PM | 0 (0.0%) | 0 (0.0%) |
| 4:00 PM to 11:59 PM | 17 (7.1%) | 16 (5.4%) |
| Total | 238 (100.0%) | 296 (100.0%) |
Housing Occupancy in South Coventry
Occupancy by Ownership in South Coventry
Of the total 648 dwellings in South Coventry, owner-occupied units account for 528 (81.5%), while renter-occupied units make up 120 (18.5%).
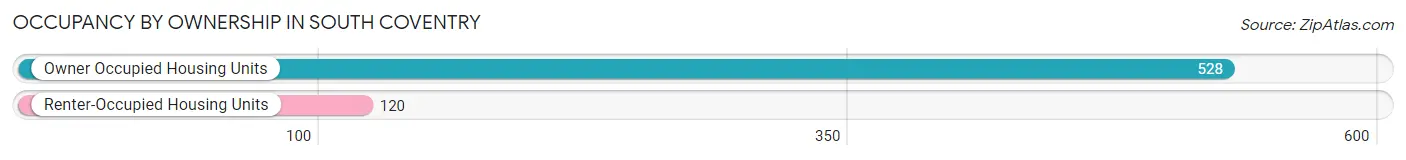
| Occupancy | # Housing Units | % Housing Units |
| Owner Occupied Housing Units | 528 | 81.5% |
| Renter-Occupied Housing Units | 120 | 18.5% |
| Total Occupied Housing Units | 648 | 100.0% |
Occupancy by Household Size in South Coventry
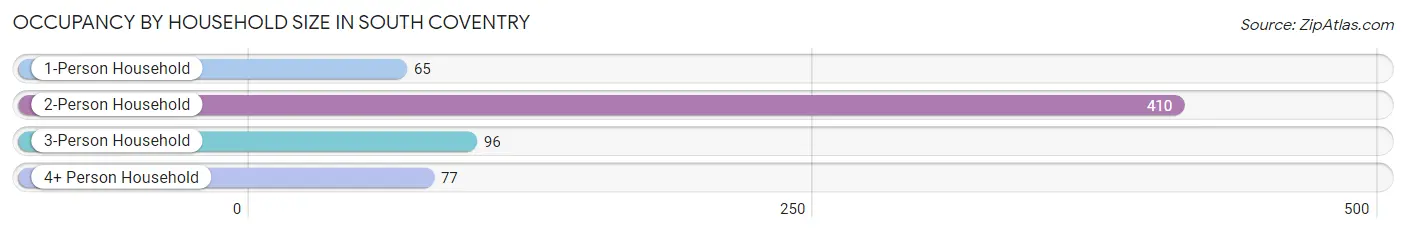
| Household Size | # Housing Units | % Housing Units |
| 1-Person Household | 65 | 10.0% |
| 2-Person Household | 410 | 63.3% |
| 3-Person Household | 96 | 14.8% |
| 4+ Person Household | 77 | 11.9% |
| Total Housing Units | 648 | 100.0% |
Occupancy by Ownership by Household Size in South Coventry
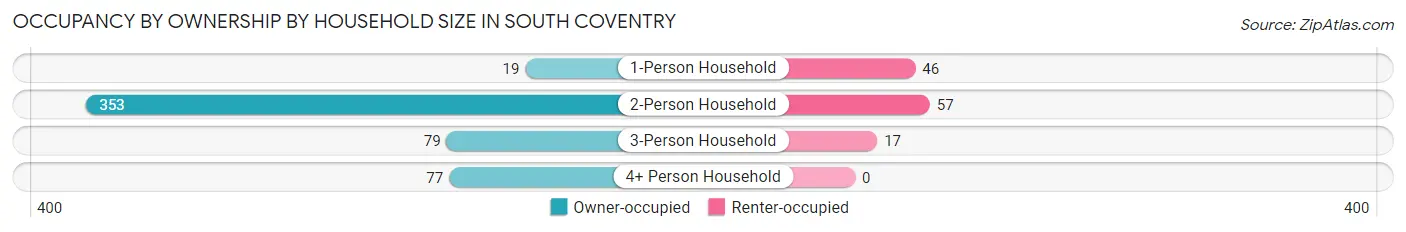
| Household Size | Owner-occupied | Renter-occupied |
| 1-Person Household | 19 (29.2%) | 46 (70.8%) |
| 2-Person Household | 353 (86.1%) | 57 (13.9%) |
| 3-Person Household | 79 (82.3%) | 17 (17.7%) |
| 4+ Person Household | 77 (100.0%) | 0 (0.0%) |
| Total Housing Units | 528 (81.5%) | 120 (18.5%) |
Occupancy by Educational Attainment in South Coventry
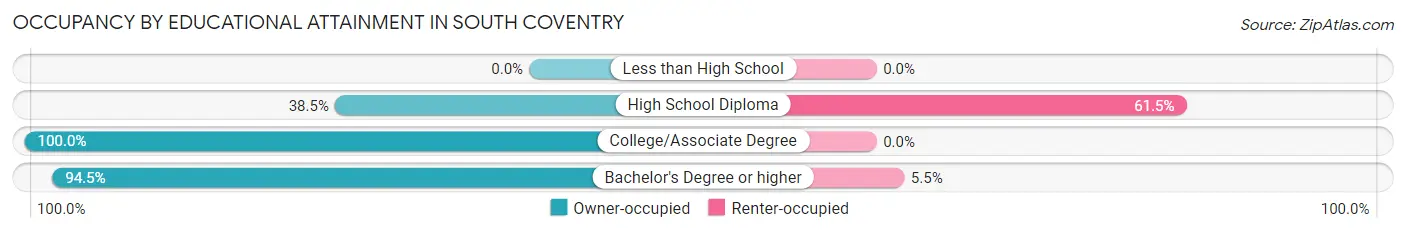
| Household Size | Owner-occupied | Renter-occupied |
| Less than High School | 0 (0.0%) | 0 (0.0%) |
| High School Diploma | 62 (38.5%) | 99 (61.5%) |
| College/Associate Degree | 105 (100.0%) | 0 (0.0%) |
| Bachelor's Degree or higher | 361 (94.5%) | 21 (5.5%) |
Occupancy by Age of Householder in South Coventry
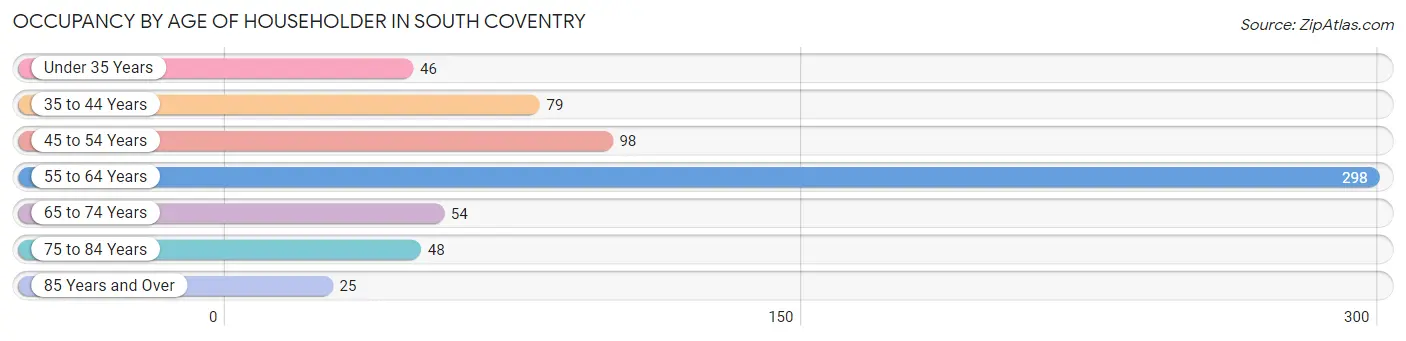
| Age Bracket | # Households | % Households |
| Under 35 Years | 46 | 7.1% |
| 35 to 44 Years | 79 | 12.2% |
| 45 to 54 Years | 98 | 15.1% |
| 55 to 64 Years | 298 | 46.0% |
| 65 to 74 Years | 54 | 8.3% |
| 75 to 84 Years | 48 | 7.4% |
| 85 Years and Over | 25 | 3.9% |
| Total | 648 | 100.0% |
Housing Finances in South Coventry
Median Income by Occupancy in South Coventry
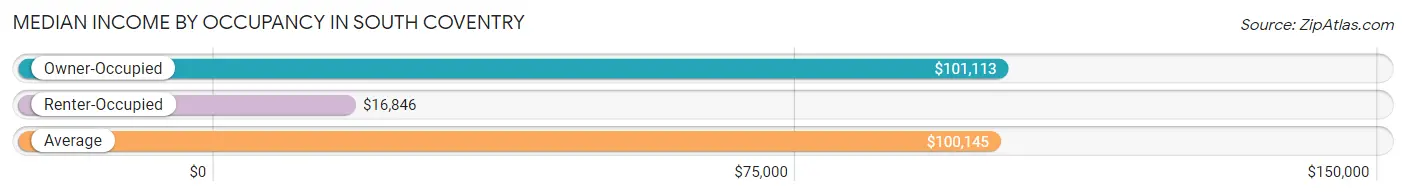
| Occupancy Type | # Households | Median Income |
| Owner-Occupied | 528 (81.5%) | $101,113 |
| Renter-Occupied | 120 (18.5%) | $16,846 |
| Average | 648 (100.0%) | $100,145 |
Occupancy by Householder Income Bracket in South Coventry
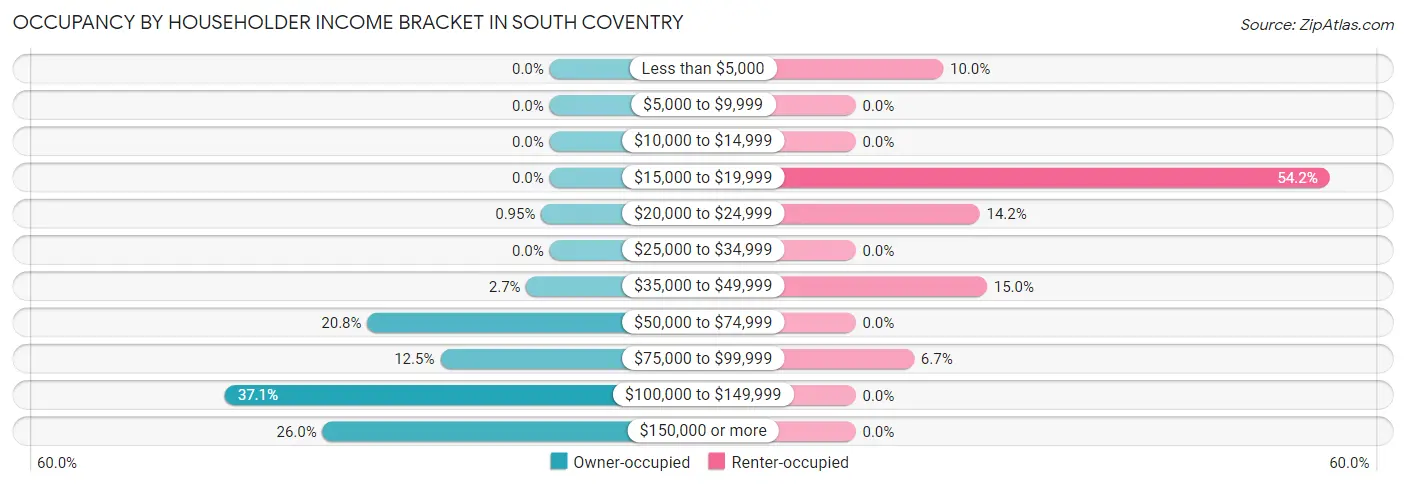
| Income Bracket | Owner-occupied | Renter-occupied |
| Less than $5,000 | 0 (0.0%) | 12 (10.0%) |
| $5,000 to $9,999 | 0 (0.0%) | 0 (0.0%) |
| $10,000 to $14,999 | 0 (0.0%) | 0 (0.0%) |
| $15,000 to $19,999 | 0 (0.0%) | 65 (54.2%) |
| $20,000 to $24,999 | 5 (0.9%) | 17 (14.2%) |
| $25,000 to $34,999 | 0 (0.0%) | 0 (0.0%) |
| $35,000 to $49,999 | 14 (2.6%) | 18 (15.0%) |
| $50,000 to $74,999 | 110 (20.8%) | 0 (0.0%) |
| $75,000 to $99,999 | 66 (12.5%) | 8 (6.7%) |
| $100,000 to $149,999 | 196 (37.1%) | 0 (0.0%) |
| $150,000 or more | 137 (26.0%) | 0 (0.0%) |
| Total | 528 (100.0%) | 120 (100.0%) |
Monthly Housing Cost Tiers in South Coventry
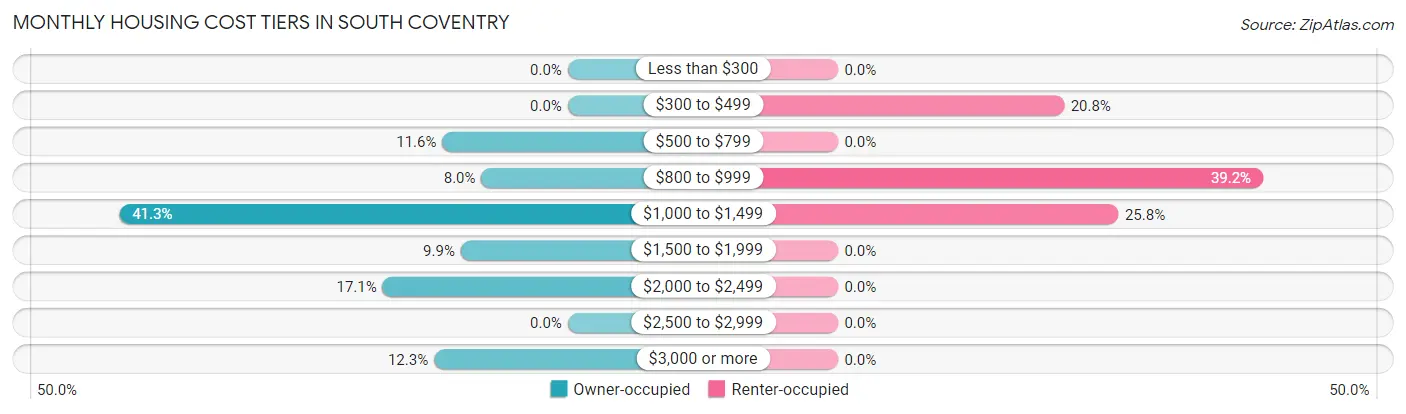
| Monthly Cost | Owner-occupied | Renter-occupied |
| Less than $300 | 0 (0.0%) | 0 (0.0%) |
| $300 to $499 | 0 (0.0%) | 25 (20.8%) |
| $500 to $799 | 61 (11.6%) | 0 (0.0%) |
| $800 to $999 | 42 (8.0%) | 47 (39.2%) |
| $1,000 to $1,499 | 218 (41.3%) | 31 (25.8%) |
| $1,500 to $1,999 | 52 (9.9%) | 0 (0.0%) |
| $2,000 to $2,499 | 90 (17.1%) | 0 (0.0%) |
| $2,500 to $2,999 | 0 (0.0%) | 0 (0.0%) |
| $3,000 or more | 65 (12.3%) | 0 (0.0%) |
| Total | 528 (100.0%) | 120 (100.0%) |
Physical Housing Characteristics in South Coventry
Housing Structures in South Coventry
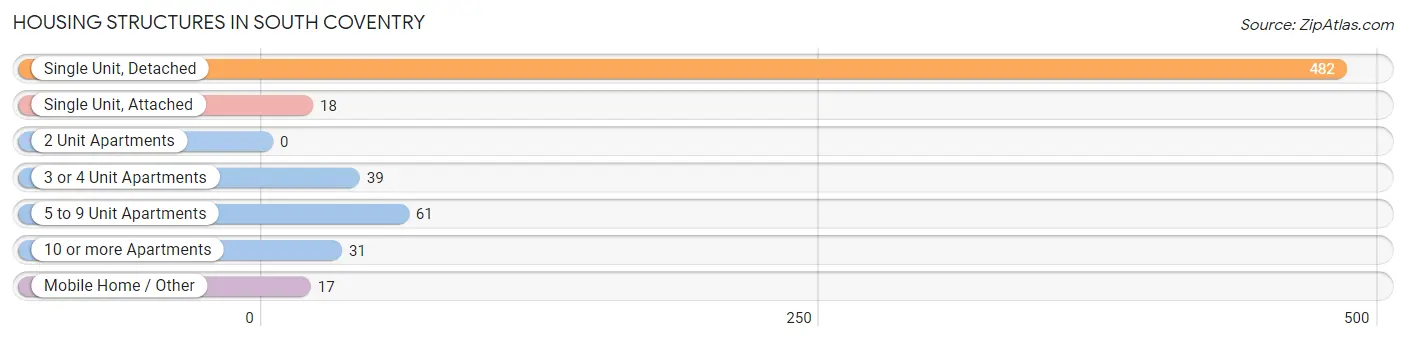
| Structure Type | # Housing Units | % Housing Units |
| Single Unit, Detached | 482 | 74.4% |
| Single Unit, Attached | 18 | 2.8% |
| 2 Unit Apartments | 0 | 0.0% |
| 3 or 4 Unit Apartments | 39 | 6.0% |
| 5 to 9 Unit Apartments | 61 | 9.4% |
| 10 or more Apartments | 31 | 4.8% |
| Mobile Home / Other | 17 | 2.6% |
| Total | 648 | 100.0% |
Housing Structures by Occupancy in South Coventry
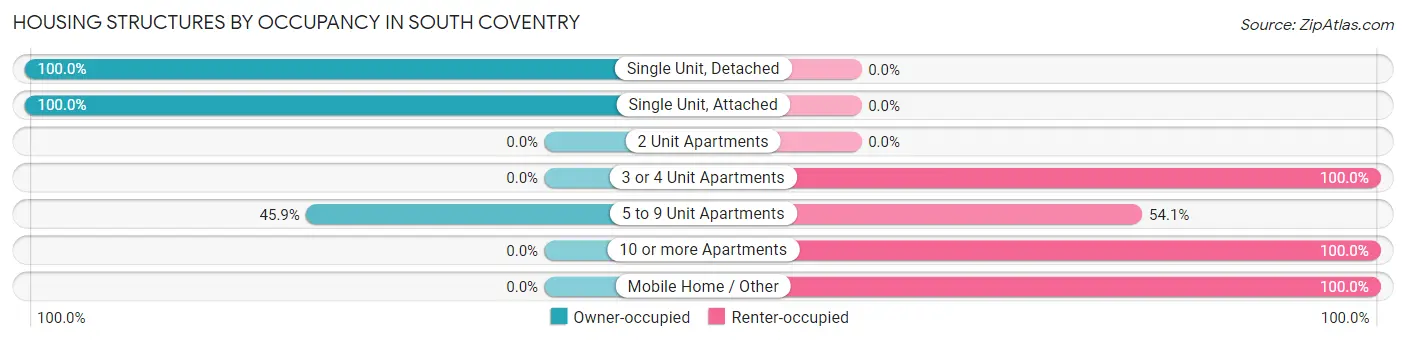
| Structure Type | Owner-occupied | Renter-occupied |
| Single Unit, Detached | 482 (100.0%) | 0 (0.0%) |
| Single Unit, Attached | 18 (100.0%) | 0 (0.0%) |
| 2 Unit Apartments | 0 (0.0%) | 0 (0.0%) |
| 3 or 4 Unit Apartments | 0 (0.0%) | 39 (100.0%) |
| 5 to 9 Unit Apartments | 28 (45.9%) | 33 (54.1%) |
| 10 or more Apartments | 0 (0.0%) | 31 (100.0%) |
| Mobile Home / Other | 0 (0.0%) | 17 (100.0%) |
| Total | 528 (81.5%) | 120 (18.5%) |
Housing Structures by Number of Rooms in South Coventry
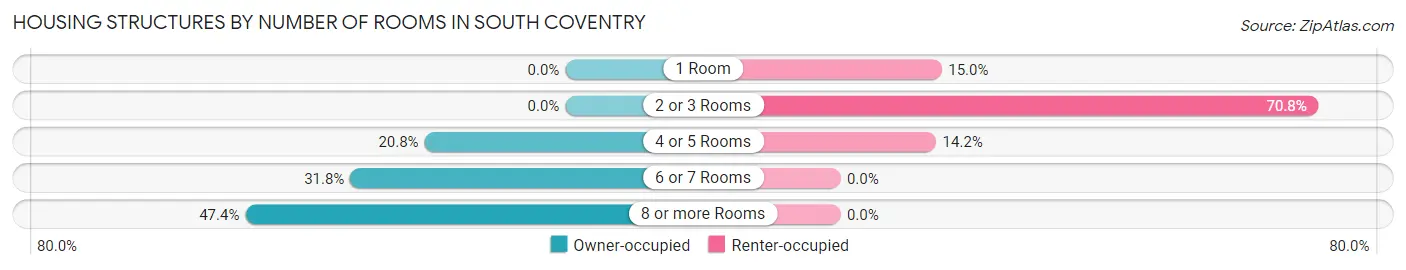
| Number of Rooms | Owner-occupied | Renter-occupied |
| 1 Room | 0 (0.0%) | 18 (15.0%) |
| 2 or 3 Rooms | 0 (0.0%) | 85 (70.8%) |
| 4 or 5 Rooms | 110 (20.8%) | 17 (14.2%) |
| 6 or 7 Rooms | 168 (31.8%) | 0 (0.0%) |
| 8 or more Rooms | 250 (47.3%) | 0 (0.0%) |
| Total | 528 (100.0%) | 120 (100.0%) |
Housing Structure by Heating Type in South Coventry
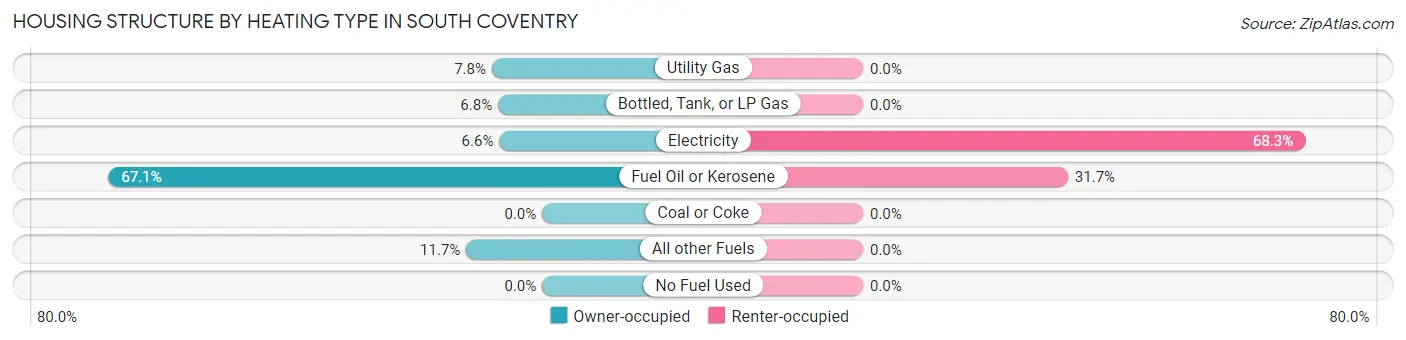
| Heating Type | Owner-occupied | Renter-occupied |
| Utility Gas | 41 (7.8%) | 0 (0.0%) |
| Bottled, Tank, or LP Gas | 36 (6.8%) | 0 (0.0%) |
| Electricity | 35 (6.6%) | 82 (68.3%) |
| Fuel Oil or Kerosene | 354 (67.0%) | 38 (31.7%) |
| Coal or Coke | 0 (0.0%) | 0 (0.0%) |
| All other Fuels | 62 (11.7%) | 0 (0.0%) |
| No Fuel Used | 0 (0.0%) | 0 (0.0%) |
| Total | 528 (100.0%) | 120 (100.0%) |
Household Vehicle Usage in South Coventry
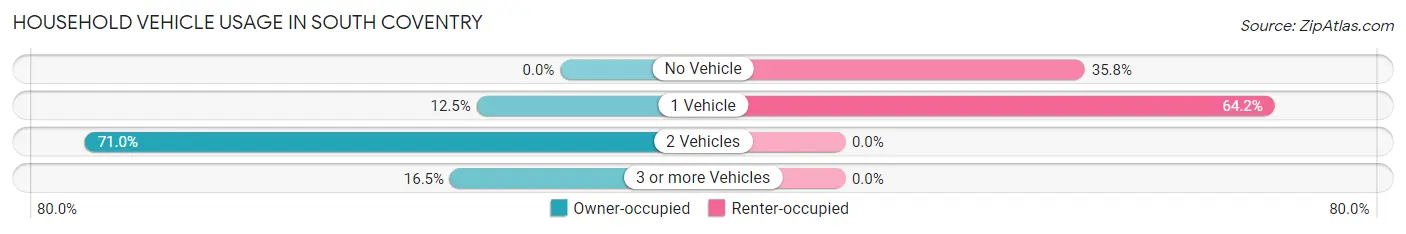
| Vehicles per Household | Owner-occupied | Renter-occupied |
| No Vehicle | 0 (0.0%) | 43 (35.8%) |
| 1 Vehicle | 66 (12.5%) | 77 (64.2%) |
| 2 Vehicles | 375 (71.0%) | 0 (0.0%) |
| 3 or more Vehicles | 87 (16.5%) | 0 (0.0%) |
| Total | 528 (100.0%) | 120 (100.0%) |
Real Estate & Mortgages in South Coventry
Real Estate and Mortgage Overview in South Coventry
| Characteristic | Without Mortgage | With Mortgage |
| Housing Units | 292 | 236 |
| Median Property Value | $337,400 | $240,800 |
| Median Household Income | $101,129 | $88 |
| Monthly Housing Costs | $1,023 | $65 |
| Real Estate Taxes | $5,962 | $0 |
Property Value by Mortgage Status in South Coventry
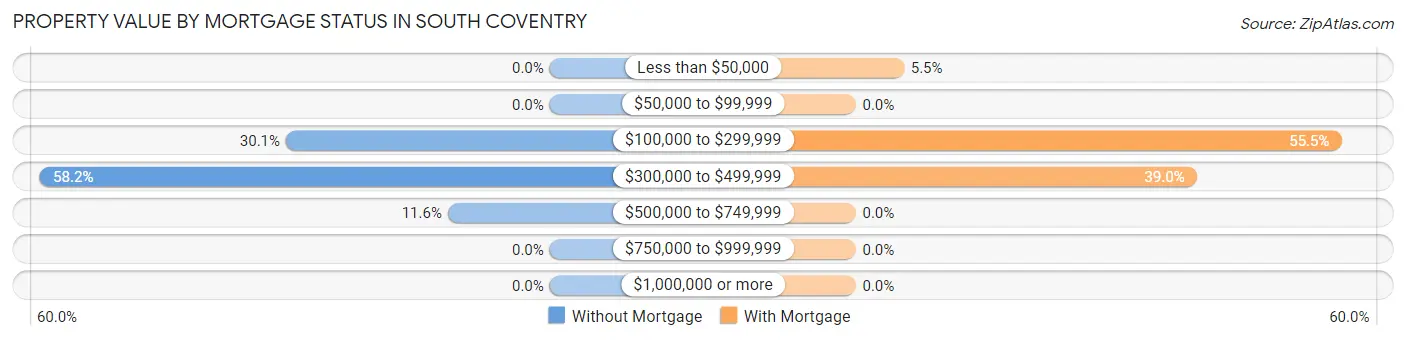
| Property Value | Without Mortgage | With Mortgage |
| Less than $50,000 | 0 (0.0%) | 13 (5.5%) |
| $50,000 to $99,999 | 0 (0.0%) | 0 (0.0%) |
| $100,000 to $299,999 | 88 (30.1%) | 131 (55.5%) |
| $300,000 to $499,999 | 170 (58.2%) | 92 (39.0%) |
| $500,000 to $749,999 | 34 (11.6%) | 0 (0.0%) |
| $750,000 to $999,999 | 0 (0.0%) | 0 (0.0%) |
| $1,000,000 or more | 0 (0.0%) | 0 (0.0%) |
| Total | 292 (100.0%) | 236 (100.0%) |
Household Income by Mortgage Status in South Coventry
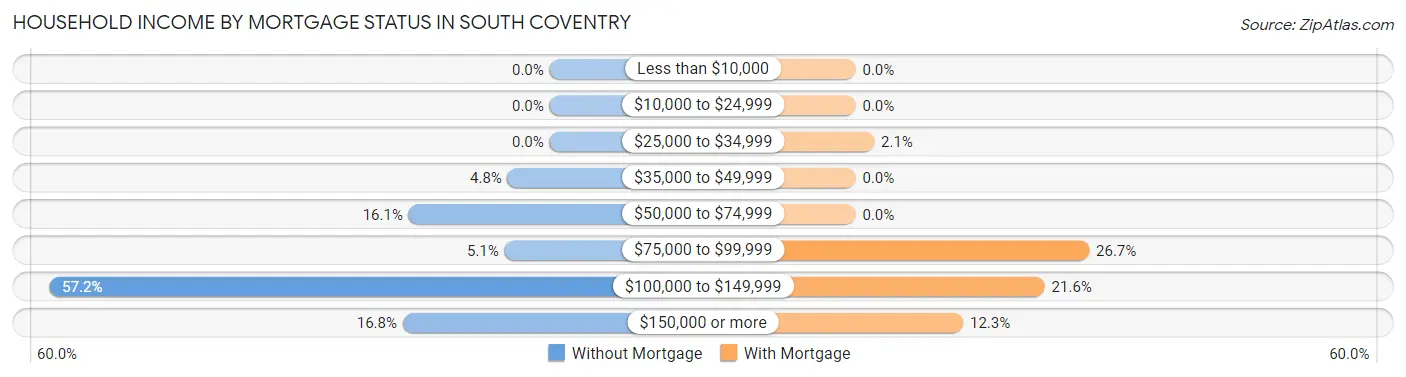
| Household Income | Without Mortgage | With Mortgage |
| Less than $10,000 | 0 (0.0%) | 0 (0.0%) |
| $10,000 to $24,999 | 0 (0.0%) | 0 (0.0%) |
| $25,000 to $34,999 | 0 (0.0%) | 5 (2.1%) |
| $35,000 to $49,999 | 14 (4.8%) | 0 (0.0%) |
| $50,000 to $74,999 | 47 (16.1%) | 0 (0.0%) |
| $75,000 to $99,999 | 15 (5.1%) | 63 (26.7%) |
| $100,000 to $149,999 | 167 (57.2%) | 51 (21.6%) |
| $150,000 or more | 49 (16.8%) | 29 (12.3%) |
| Total | 292 (100.0%) | 236 (100.0%) |
Property Value to Household Income Ratio in South Coventry
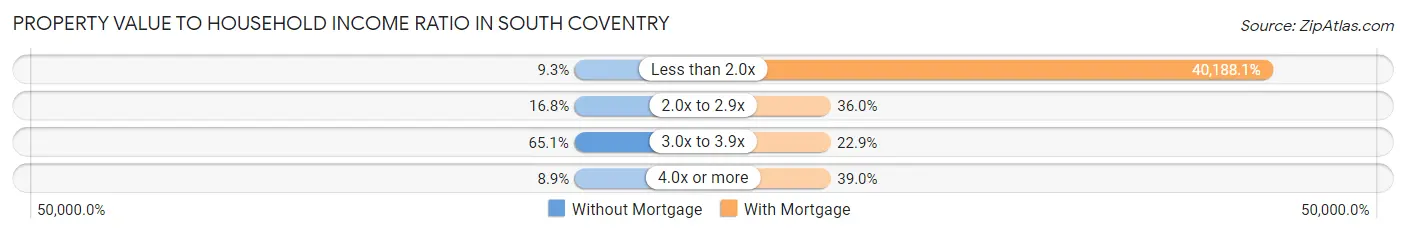
| Value-to-Income Ratio | Without Mortgage | With Mortgage |
| Less than 2.0x | 27 (9.2%) | 94,844 (40,188.1%) |
| 2.0x to 2.9x | 49 (16.8%) | 85 (36.0%) |
| 3.0x to 3.9x | 190 (65.1%) | 54 (22.9%) |
| 4.0x or more | 26 (8.9%) | 92 (39.0%) |
| Total | 292 (100.0%) | 236 (100.0%) |
Real Estate Taxes by Mortgage Status in South Coventry
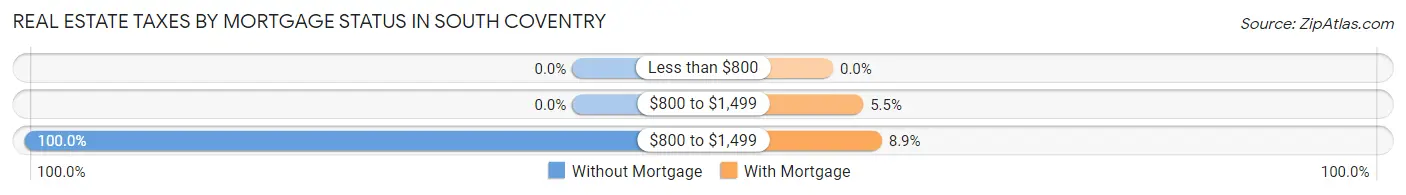
| Property Taxes | Without Mortgage | With Mortgage |
| Less than $800 | 0 (0.0%) | 0 (0.0%) |
| $800 to $1,499 | 0 (0.0%) | 13 (5.5%) |
| $800 to $1,499 | 292 (100.0%) | 21 (8.9%) |
| Total | 292 (100.0%) | 236 (100.0%) |
Health & Disability in South Coventry
Health Insurance Coverage by Age in South Coventry
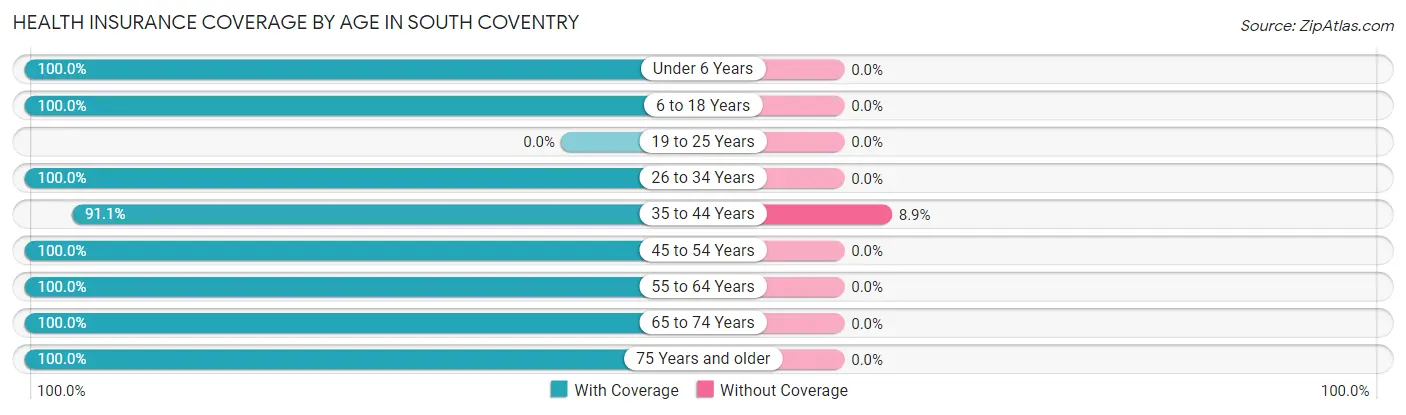
| Age Bracket | With Coverage | Without Coverage |
| Under 6 Years | 70 (100.0%) | 0 (0.0%) |
| 6 to 18 Years | 216 (100.0%) | 0 (0.0%) |
| 19 to 25 Years | 0 (0.0%) | 0 (0.0%) |
| 26 to 34 Years | 126 (100.0%) | 0 (0.0%) |
| 35 to 44 Years | 144 (91.1%) | 14 (8.9%) |
| 45 to 54 Years | 149 (100.0%) | 0 (0.0%) |
| 55 to 64 Years | 362 (100.0%) | 0 (0.0%) |
| 65 to 74 Years | 284 (100.0%) | 0 (0.0%) |
| 75 Years and older | 103 (100.0%) | 0 (0.0%) |
| Total | 1,454 (99.1%) | 14 (0.9%) |
Health Insurance Coverage by Citizenship Status in South Coventry
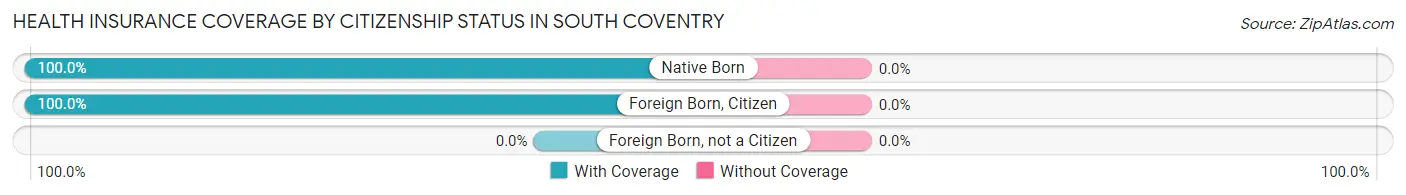
| Citizenship Status | With Coverage | Without Coverage |
| Native Born | 70 (100.0%) | 0 (0.0%) |
| Foreign Born, Citizen | 216 (100.0%) | 0 (0.0%) |
| Foreign Born, not a Citizen | 0 (0.0%) | 0 (0.0%) |
Health Insurance Coverage by Household Income in South Coventry
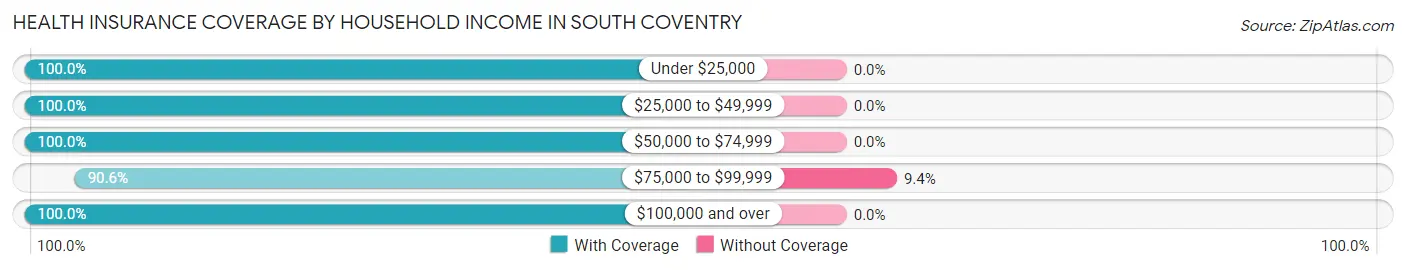
| Household Income | With Coverage | Without Coverage |
| Under $25,000 | 179 (100.0%) | 0 (0.0%) |
| $25,000 to $49,999 | 48 (100.0%) | 0 (0.0%) |
| $50,000 to $74,999 | 259 (100.0%) | 0 (0.0%) |
| $75,000 to $99,999 | 135 (90.6%) | 14 (9.4%) |
| $100,000 and over | 809 (100.0%) | 0 (0.0%) |
Public vs Private Health Insurance Coverage by Age in South Coventry
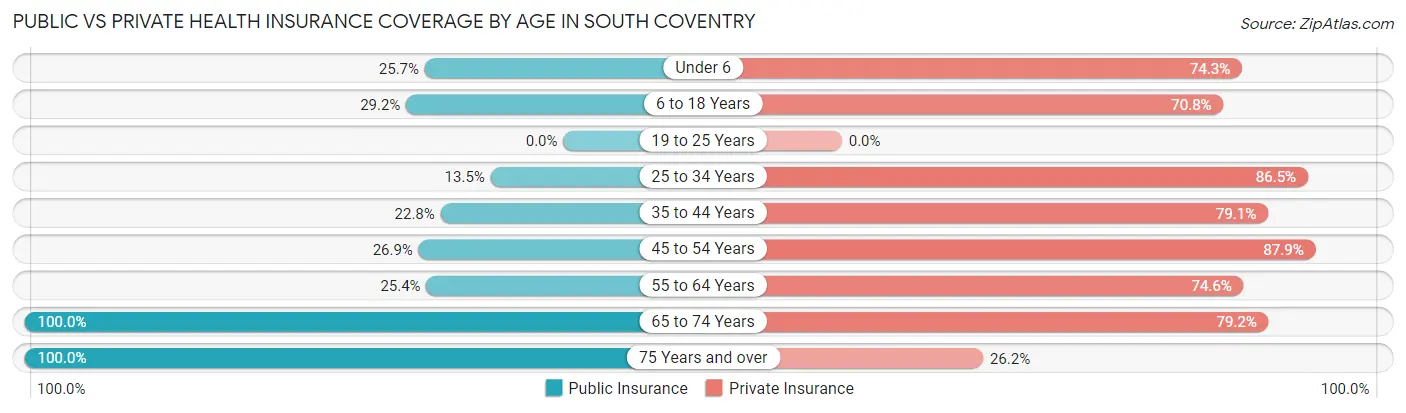
| Age Bracket | Public Insurance | Private Insurance |
| Under 6 | 18 (25.7%) | 52 (74.3%) |
| 6 to 18 Years | 63 (29.2%) | 153 (70.8%) |
| 19 to 25 Years | 0 (0.0%) | 0 (0.0%) |
| 25 to 34 Years | 17 (13.5%) | 109 (86.5%) |
| 35 to 44 Years | 36 (22.8%) | 125 (79.1%) |
| 45 to 54 Years | 40 (26.9%) | 131 (87.9%) |
| 55 to 64 Years | 92 (25.4%) | 270 (74.6%) |
| 65 to 74 Years | 284 (100.0%) | 225 (79.2%) |
| 75 Years and over | 103 (100.0%) | 27 (26.2%) |
| Total | 653 (44.5%) | 1,092 (74.4%) |
Disability Status by Sex by Age in South Coventry
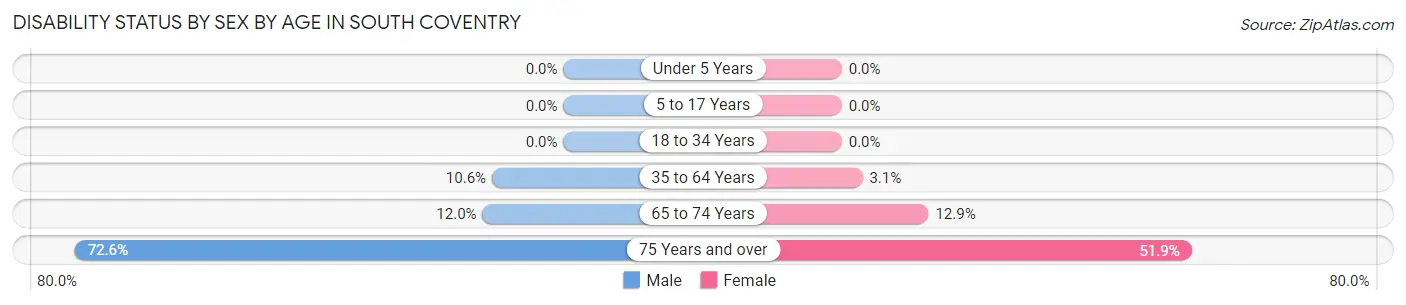
| Age Bracket | Male | Female |
| Under 5 Years | 0 (0.0%) | 0 (0.0%) |
| 5 to 17 Years | 0 (0.0%) | 0 (0.0%) |
| 18 to 34 Years | 0 (0.0%) | 0 (0.0%) |
| 35 to 64 Years | 26 (10.6%) | 13 (3.1%) |
| 65 to 74 Years | 22 (12.0%) | 13 (12.9%) |
| 75 Years and over | 37 (72.6%) | 27 (51.9%) |
Disability Class by Sex by Age in South Coventry
Disability Class: Hearing Difficulty
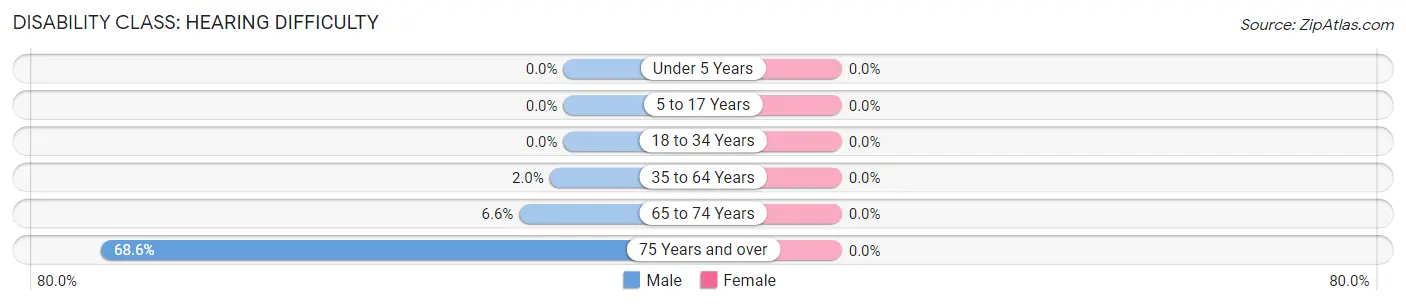
| Age Bracket | Male | Female |
| Under 5 Years | 0 (0.0%) | 0 (0.0%) |
| 5 to 17 Years | 0 (0.0%) | 0 (0.0%) |
| 18 to 34 Years | 0 (0.0%) | 0 (0.0%) |
| 35 to 64 Years | 5 (2.0%) | 0 (0.0%) |
| 65 to 74 Years | 12 (6.6%) | 0 (0.0%) |
| 75 Years and over | 35 (68.6%) | 0 (0.0%) |
Disability Class: Vision Difficulty
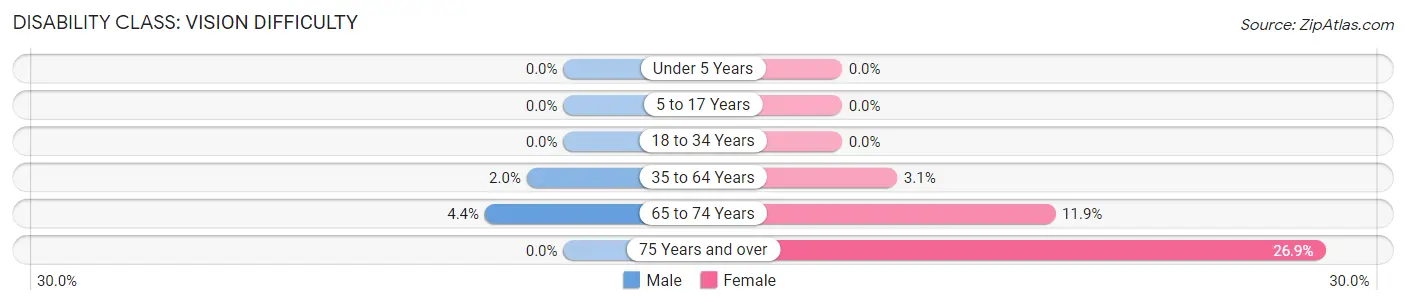
| Age Bracket | Male | Female |
| Under 5 Years | 0 (0.0%) | 0 (0.0%) |
| 5 to 17 Years | 0 (0.0%) | 0 (0.0%) |
| 18 to 34 Years | 0 (0.0%) | 0 (0.0%) |
| 35 to 64 Years | 5 (2.0%) | 13 (3.1%) |
| 65 to 74 Years | 8 (4.4%) | 12 (11.9%) |
| 75 Years and over | 0 (0.0%) | 14 (26.9%) |
Disability Class: Cognitive Difficulty
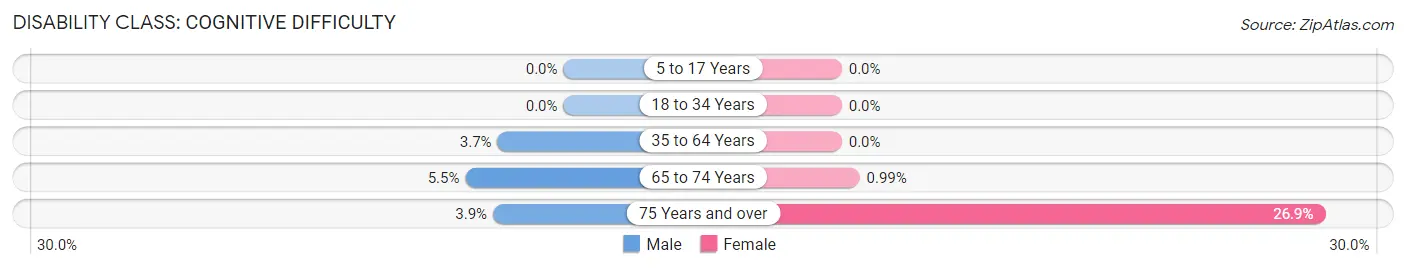
| Age Bracket | Male | Female |
| 5 to 17 Years | 0 (0.0%) | 0 (0.0%) |
| 18 to 34 Years | 0 (0.0%) | 0 (0.0%) |
| 35 to 64 Years | 9 (3.7%) | 0 (0.0%) |
| 65 to 74 Years | 10 (5.5%) | 1 (1.0%) |
| 75 Years and over | 2 (3.9%) | 14 (26.9%) |
Disability Class: Ambulatory Difficulty
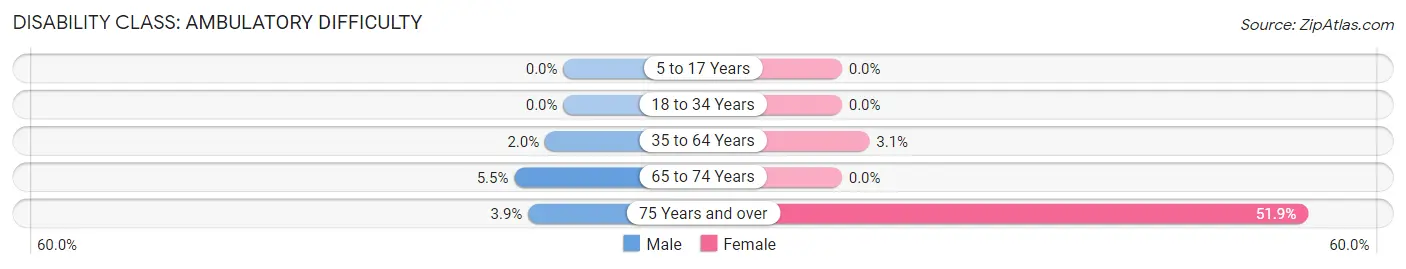
| Age Bracket | Male | Female |
| 5 to 17 Years | 0 (0.0%) | 0 (0.0%) |
| 18 to 34 Years | 0 (0.0%) | 0 (0.0%) |
| 35 to 64 Years | 5 (2.0%) | 13 (3.1%) |
| 65 to 74 Years | 10 (5.5%) | 0 (0.0%) |
| 75 Years and over | 2 (3.9%) | 27 (51.9%) |
Disability Class: Self-Care Difficulty
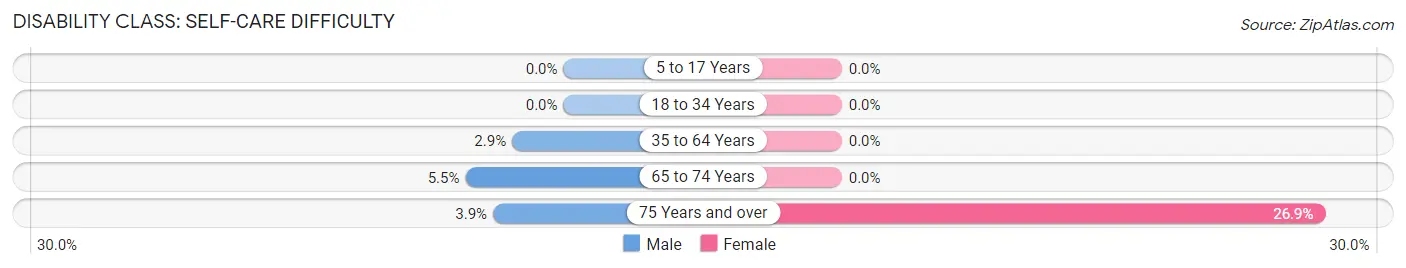
| Age Bracket | Male | Female |
| 5 to 17 Years | 0 (0.0%) | 0 (0.0%) |
| 18 to 34 Years | 0 (0.0%) | 0 (0.0%) |
| 35 to 64 Years | 7 (2.9%) | 0 (0.0%) |
| 65 to 74 Years | 10 (5.5%) | 0 (0.0%) |
| 75 Years and over | 2 (3.9%) | 14 (26.9%) |
Technology Access in South Coventry
Computing Device Access in South Coventry
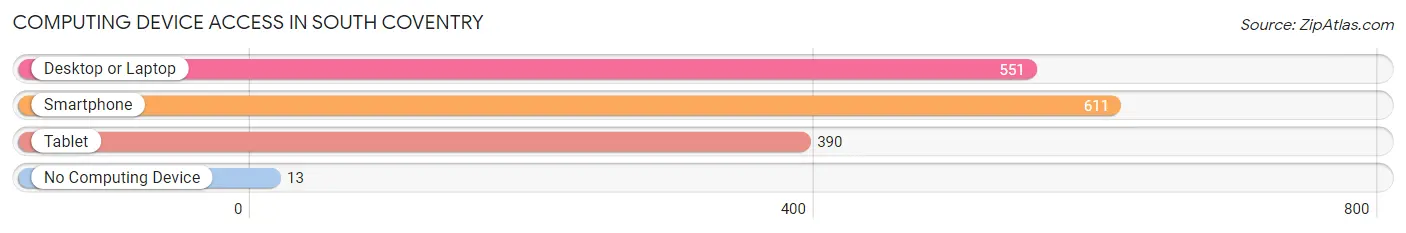
| Device Type | # Households | % Households |
| Desktop or Laptop | 551 | 85.0% |
| Smartphone | 611 | 94.3% |
| Tablet | 390 | 60.2% |
| No Computing Device | 13 | 2.0% |
| Total | 648 | 100.0% |
Internet Access in South Coventry
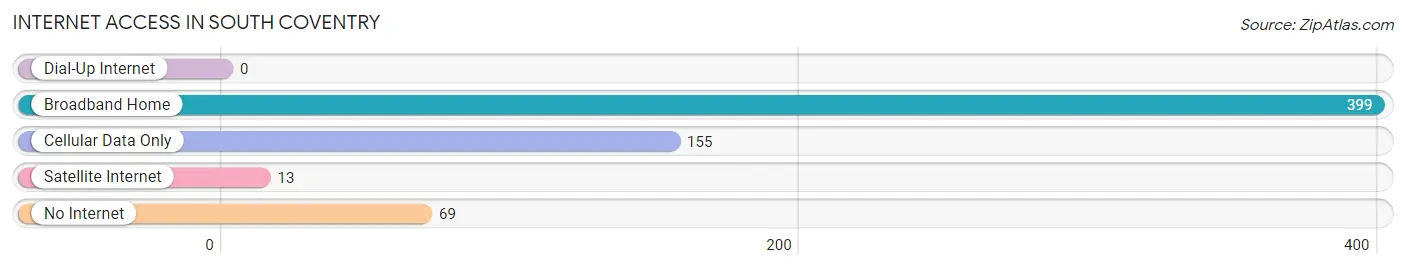
| Internet Type | # Households | % Households |
| Dial-Up Internet | 0 | 0.0% |
| Broadband Home | 399 | 61.6% |
| Cellular Data Only | 155 | 23.9% |
| Satellite Internet | 13 | 2.0% |
| No Internet | 69 | 10.6% |
| Total | 648 | 100.0% |
South Coventry Summary
History
South Coventry is a town located in Tolland County, Connecticut. It was originally part of Coventry, which was incorporated in 1712. In 1786, the town of Coventry was divided into two parts, North Coventry and South Coventry. South Coventry was officially incorporated in 1806.
The town was originally a farming community, with many of the original settlers coming from Coventry, Rhode Island. The town was known for its dairy farms and apple orchards. In the late 19th century, the town began to industrialize, with the opening of several factories. The most notable of these was the Coventry Manufacturing Company, which produced woolen goods. The company was in operation until the early 20th century.
The town has a rich history of involvement in the Revolutionary War. In 1777, the town was the site of a battle between the British and American forces. The battle was a victory for the Americans, and the town was later used as a supply depot for the Continental Army.
Geography
South Coventry is located in the eastern part of Tolland County, Connecticut. It is bordered by the towns of Coventry to the north, Mansfield to the east, Willington to the south, and Ashford to the west. The town is located in the Connecticut River Valley, and is home to several small rivers and streams, including the Fenton River and the Skungamaug River.
The town has a total area of 24.3 square miles, of which 24.2 square miles is land and 0.1 square miles is water. The highest point in the town is the summit of Bald Mountain, which has an elevation of 1,068 feet.
Economy
The economy of South Coventry is largely based on agriculture and manufacturing. The town is home to several farms, which produce dairy products, fruits, vegetables, and other agricultural products. The town is also home to several small manufacturing companies, which produce a variety of products, including furniture, textiles, and electronics.
The town is also home to several small businesses, including restaurants, retail stores, and service providers. The town is also home to several small tourist attractions, including the Coventry Historical Society Museum and the Coventry Farmers Market.
Demographics
As of the 2010 census, the town of South Coventry had a population of 4,717. The racial makeup of the town was 95.3% White, 0.9% African American, 0.4% Native American, 0.7% Asian, 0.1% Pacific Islander, 0.7% from other races, and 1.9% from two or more races. Hispanic or Latino of any race were 2.7% of the population.
The median household income in the town was $68,958, and the median family income was $77,917. The per capita income for the town was $30,945. About 4.3% of families and 5.3% of the population were below the poverty line, including 6.2% of those under age 18 and 4.2% of those age 65 or over.
Common Questions
What is Per Capita Income in South Coventry?
Per Capita income in South Coventry is $46,518.
What is the Median Family Income in South Coventry?
Median Family Income in South Coventry is $100,984.
What is the Median Household income in South Coventry?
Median Household Income in South Coventry is $100,145.
What is Inequality or Gini Index in South Coventry?
Inequality or Gini Index in South Coventry is 0.39.
What is the Total Population of South Coventry?
Total Population of South Coventry is 1,468.
What is the Total Male Population of South Coventry?
Total Male Population of South Coventry is 578.
What is the Total Female Population of South Coventry?
Total Female Population of South Coventry is 890.
What is the Ratio of Males per 100 Females in South Coventry?
There are 64.94 Males per 100 Females in South Coventry.
What is the Ratio of Females per 100 Males in South Coventry?
There are 153.98 Females per 100 Males in South Coventry.
What is the Median Population Age in South Coventry?
Median Population Age in South Coventry is 56.5 Years.
What is the Average Family Size in South Coventry
Average Family Size in South Coventry is 2.4 People.
What is the Average Household Size in South Coventry
Average Household Size in South Coventry is 2.2 People.
How Large is the Labor Force in South Coventry?
There are 588 People in the Labor Forcein in South Coventry.
What is the Percentage of People in the Labor Force in South Coventry?
45.7% of People are in the Labor Force in South Coventry.
What is the Unemployment Rate in South Coventry?
Unemployment Rate in South Coventry is 2.7%.