Willimantic, CT Map & Demographics
Willimantic Map
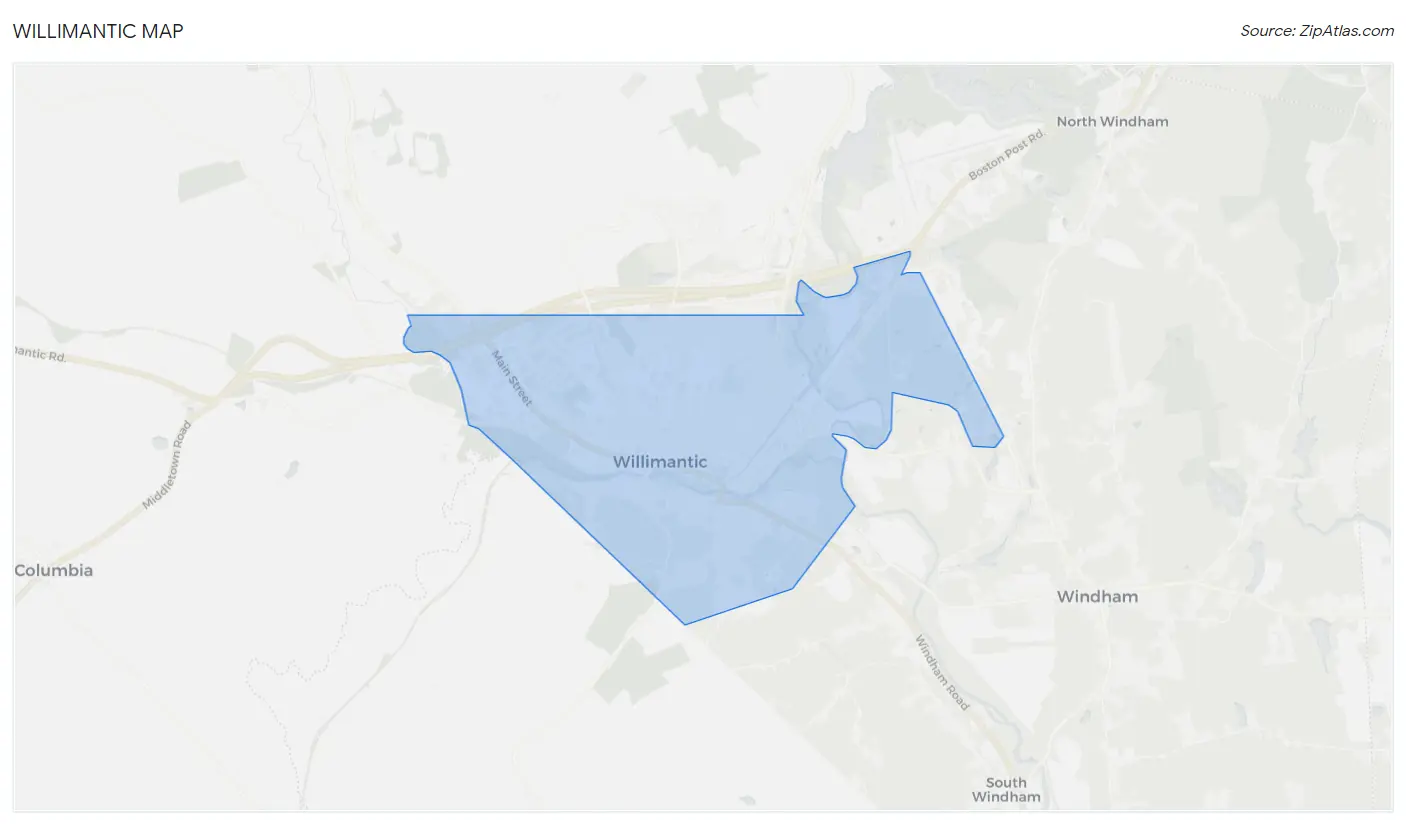
Willimantic Overview
$22,953
PER CAPITA INCOME
$54,489
AVG FAMILY INCOME
$45,723
AVG HOUSEHOLD INCOME
28.7%
WAGE / INCOME GAP [ % ]
71.3¢/ $1
WAGE / INCOME GAP [ $ ]
0.47
INEQUALITY / GINI INDEX
17,762
TOTAL POPULATION
8,557
MALE POPULATION
9,205
FEMALE POPULATION
92.96
MALES / 100 FEMALES
107.57
FEMALES / 100 MALES
30.5
MEDIAN AGE
2.9
AVG FAMILY SIZE
2.3
AVG HOUSEHOLD SIZE
8,958
LABOR FORCE [ PEOPLE ]
57.4%
PERCENT IN LABOR FORCE
8.2%
UNEMPLOYMENT RATE
Willimantic Zip Codes
Willimantic Area Codes
Income in Willimantic
Income Overview in Willimantic
Per Capita Income in Willimantic is $22,953, while median incomes of families and households are $54,489 and $45,723 respectively.
| Characteristic | Number | Measure |
| Per Capita Income | 17,762 | $22,953 |
| Median Family Income | 3,161 | $54,489 |
| Mean Family Income | 3,161 | $72,097 |
| Median Household Income | 6,379 | $45,723 |
| Mean Household Income | 6,379 | $60,077 |
| Income Deficit | 3,161 | $0 |
| Wage / Income Gap (%) | 17,762 | 28.65% |
| Wage / Income Gap ($) | 17,762 | 71.35¢ per $1 |
| Gini / Inequality Index | 17,762 | 0.47 |
Earnings by Sex in Willimantic
Average Earnings in Willimantic are $21,191, $17,076 for men and $23,933 for women, a difference of 28.6%.
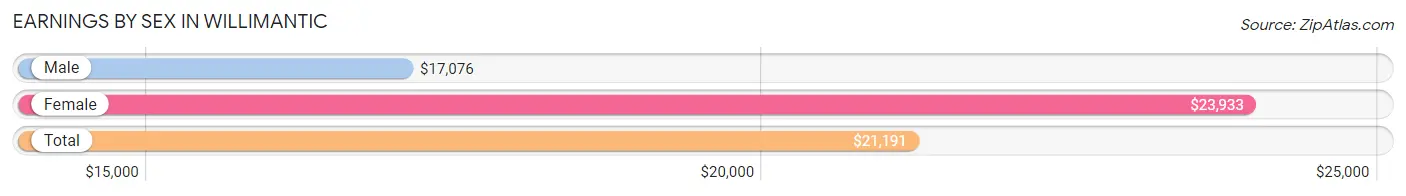
| Sex | Number | Average Earnings |
| Male | 4,834 (49.5%) | $17,076 |
| Female | 4,936 (50.5%) | $23,933 |
| Total | 9,770 (100.0%) | $21,191 |
Earnings by Sex by Income Bracket in Willimantic
The most common earnings brackets in Willimantic are $2,499 or less for men (493 | 10.2%) and $2,499 or less for women (594 | 12.0%).
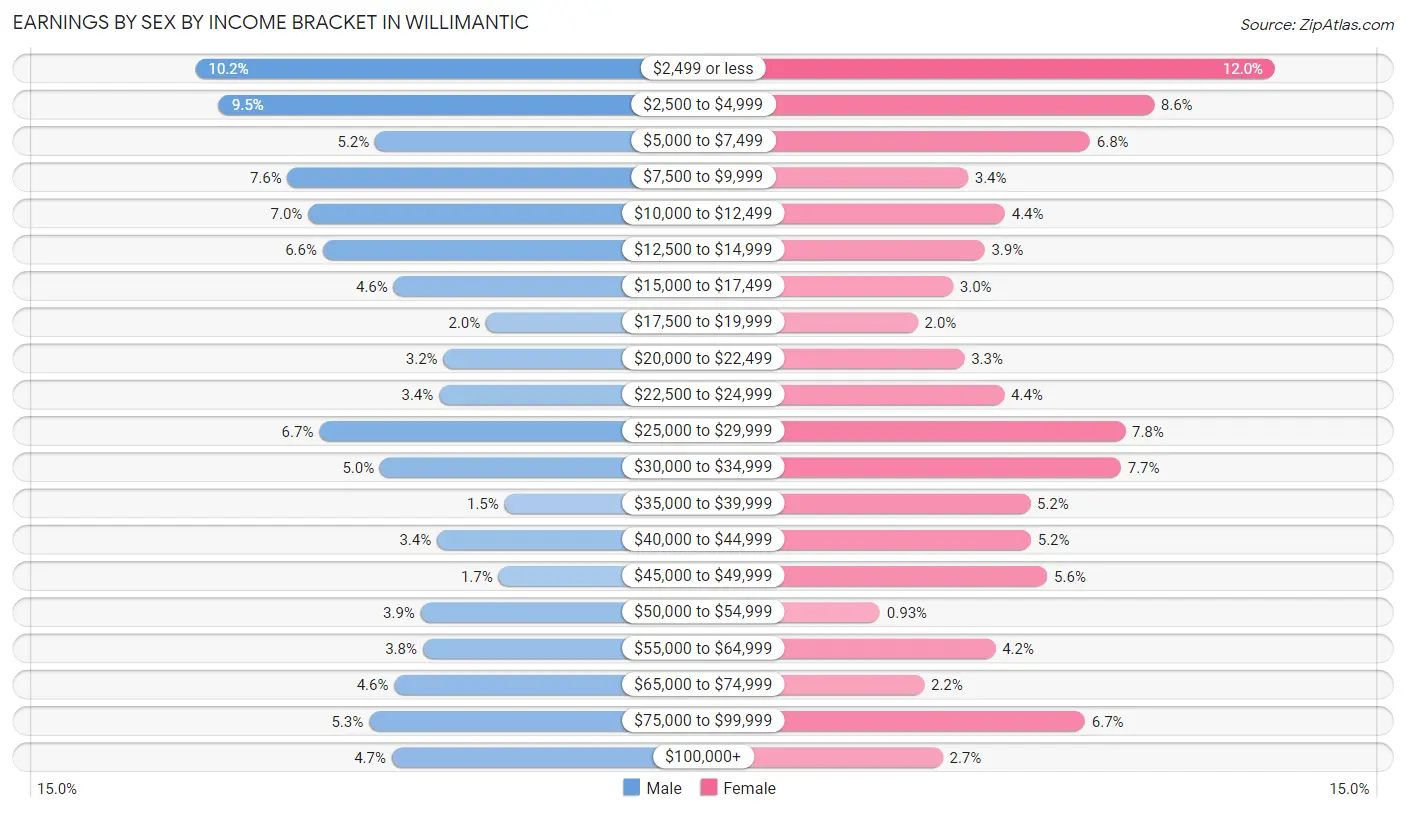
| Income | Male | Female |
| $2,499 or less | 493 (10.2%) | 594 (12.0%) |
| $2,500 to $4,999 | 461 (9.5%) | 426 (8.6%) |
| $5,000 to $7,499 | 249 (5.1%) | 337 (6.8%) |
| $7,500 to $9,999 | 368 (7.6%) | 168 (3.4%) |
| $10,000 to $12,499 | 340 (7.0%) | 219 (4.4%) |
| $12,500 to $14,999 | 320 (6.6%) | 191 (3.9%) |
| $15,000 to $17,499 | 224 (4.6%) | 147 (3.0%) |
| $17,500 to $19,999 | 98 (2.0%) | 98 (2.0%) |
| $20,000 to $22,499 | 156 (3.2%) | 163 (3.3%) |
| $22,500 to $24,999 | 162 (3.4%) | 218 (4.4%) |
| $25,000 to $29,999 | 325 (6.7%) | 386 (7.8%) |
| $30,000 to $34,999 | 242 (5.0%) | 380 (7.7%) |
| $35,000 to $39,999 | 73 (1.5%) | 254 (5.1%) |
| $40,000 to $44,999 | 165 (3.4%) | 255 (5.2%) |
| $45,000 to $49,999 | 81 (1.7%) | 278 (5.6%) |
| $50,000 to $54,999 | 187 (3.9%) | 46 (0.9%) |
| $55,000 to $64,999 | 184 (3.8%) | 206 (4.2%) |
| $65,000 to $74,999 | 223 (4.6%) | 107 (2.2%) |
| $75,000 to $99,999 | 257 (5.3%) | 330 (6.7%) |
| $100,000+ | 226 (4.7%) | 133 (2.7%) |
| Total | 4,834 (100.0%) | 4,936 (100.0%) |
Earnings by Sex by Educational Attainment in Willimantic
Average earnings in Willimantic are $35,673 for men and $34,801 for women, a difference of 2.4%. Men with an educational attainment of graduate degree enjoy the highest average annual earnings of $61,836, while those with high school diploma education earn the least with $29,714. Women with an educational attainment of graduate degree earn the most with the average annual earnings of $61,429, while those with less than high school education have the smallest earnings of $24,235.
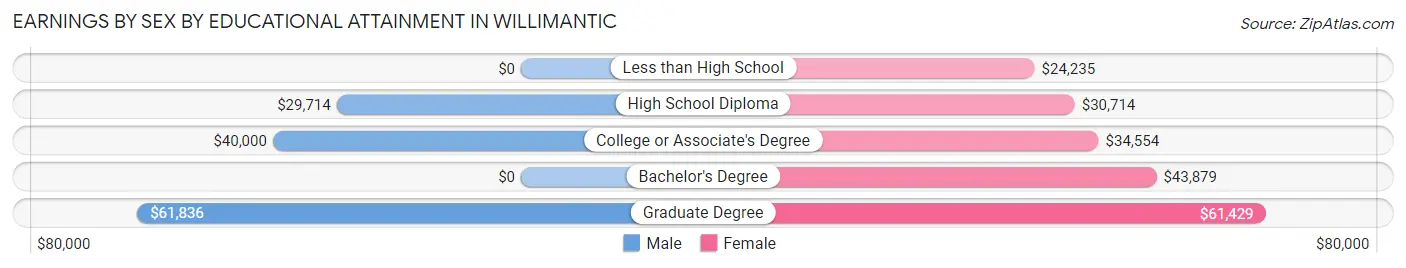
| Educational Attainment | Male Income | Female Income |
| Less than High School | - | - |
| High School Diploma | $29,714 | $30,714 |
| College or Associate's Degree | $40,000 | $34,554 |
| Bachelor's Degree | - | - |
| Graduate Degree | $61,836 | $61,429 |
| Total | $35,673 | $34,801 |
Family Income in Willimantic
Family Income Brackets in Willimantic
According to the Willimantic family income data, there are 591 families falling into the $25,000 to $34,999 income range, which is the most common income bracket and makes up 18.7% of all families. Conversely, the less than $10,000 income bracket is the least frequent group with only 126 families (4.0%) belonging to this category.
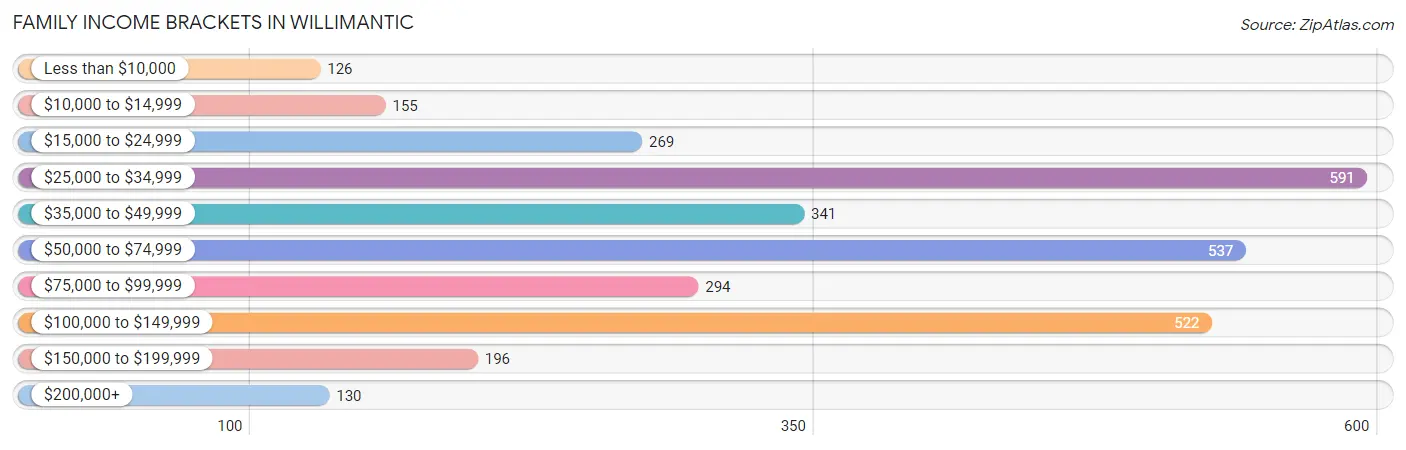
| Income Bracket | # Families | % Families |
| Less than $10,000 | 126 | 4.0% |
| $10,000 to $14,999 | 155 | 4.9% |
| $15,000 to $24,999 | 269 | 8.5% |
| $25,000 to $34,999 | 591 | 18.7% |
| $35,000 to $49,999 | 341 | 10.8% |
| $50,000 to $74,999 | 537 | 17.0% |
| $75,000 to $99,999 | 294 | 9.3% |
| $100,000 to $149,999 | 522 | 16.5% |
| $150,000 to $199,999 | 196 | 6.2% |
| $200,000+ | 130 | 4.1% |
Family Income by Famaliy Size in Willimantic
5-person families (207 | 6.6%) account for the highest median family income in Willimantic with $84,282 per family, while 2-person families (1,355 | 42.9%) have the highest median income of $28,380 per family member.
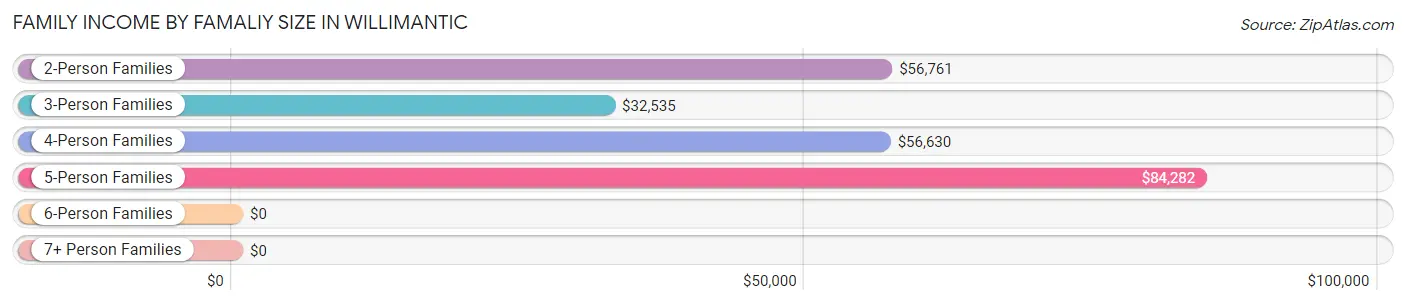
| Income Bracket | # Families | Median Income |
| 2-Person Families | 1,355 (42.9%) | $56,761 |
| 3-Person Families | 875 (27.7%) | $32,535 |
| 4-Person Families | 680 (21.5%) | $56,630 |
| 5-Person Families | 207 (6.6%) | $84,282 |
| 6-Person Families | 35 (1.1%) | $0 |
| 7+ Person Families | 9 (0.3%) | $0 |
| Total | 3,161 (100.0%) | $54,489 |
Family Income by Number of Earners in Willimantic
The median family income in Willimantic is $54,489, with families comprising 3+ earners (305) having the highest median family income of $157,961, while families with no earners (747) have the lowest median family income of $30,966, accounting for 9.7% and 23.6% of families, respectively.
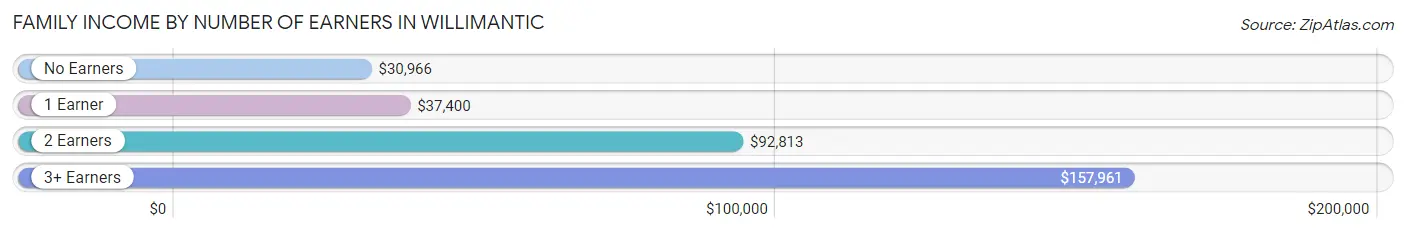
| Number of Earners | # Families | Median Income |
| No Earners | 747 (23.6%) | $30,966 |
| 1 Earner | 1,222 (38.7%) | $37,400 |
| 2 Earners | 887 (28.1%) | $92,813 |
| 3+ Earners | 305 (9.7%) | $157,961 |
| Total | 3,161 (100.0%) | $54,489 |
Household Income in Willimantic
Household Income Brackets in Willimantic
With 1,072 households falling in the category, the $50,000 to $74,999 income range is the most frequent in Willimantic, accounting for 16.8% of all households. In contrast, only 166 households (2.6%) fall into the $200,000+ income bracket, making it the least populous group.
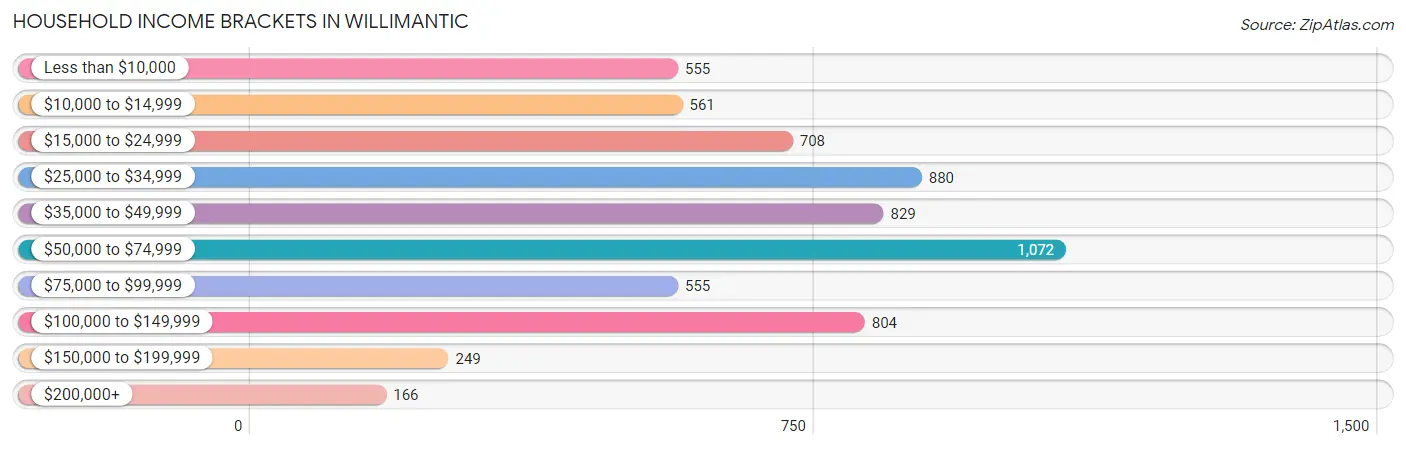
| Income Bracket | # Households | % Households |
| Less than $10,000 | 555 | 8.7% |
| $10,000 to $14,999 | 561 | 8.8% |
| $15,000 to $24,999 | 708 | 11.1% |
| $25,000 to $34,999 | 880 | 13.8% |
| $35,000 to $49,999 | 829 | 13.0% |
| $50,000 to $74,999 | 1,072 | 16.8% |
| $75,000 to $99,999 | 555 | 8.7% |
| $100,000 to $149,999 | 804 | 12.6% |
| $150,000 to $199,999 | 249 | 3.9% |
| $200,000+ | 166 | 2.6% |
Household Income by Householder Age in Willimantic
The median household income in Willimantic is $45,723, with the highest median household income of $53,286 found in the 65+ years age bracket for the primary householder. A total of 1,404 households (22.0%) fall into this category. Meanwhile, the 15 to 24 years age bracket for the primary householder has the lowest median household income of $24,360, with 488 households (7.6%) in this group.
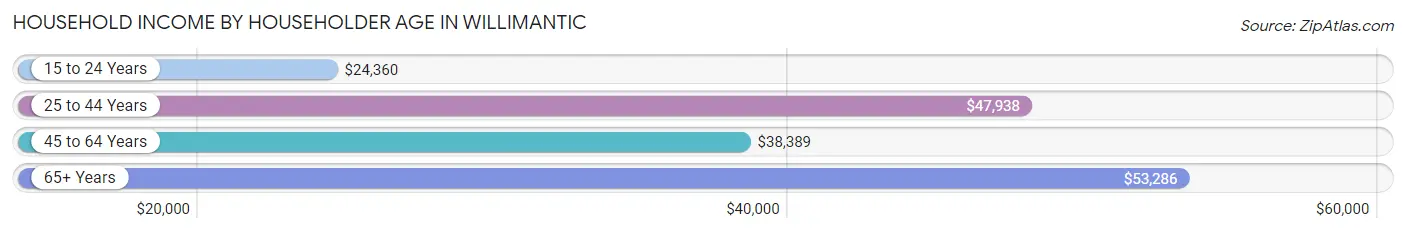
| Income Bracket | # Households | Median Income |
| 15 to 24 Years | 488 (7.6%) | $24,360 |
| 25 to 44 Years | 2,093 (32.8%) | $47,938 |
| 45 to 64 Years | 2,394 (37.5%) | $38,389 |
| 65+ Years | 1,404 (22.0%) | $53,286 |
| Total | 6,379 (100.0%) | $45,723 |
Poverty in Willimantic
Income Below Poverty by Sex and Age in Willimantic
With 25.8% poverty level for males and 28.7% for females among the residents of Willimantic, 5 year old males and 18 to 24 year old females are the most vulnerable to poverty, with 32 males (54.2%) and 487 females (61.1%) in their respective age groups living below the poverty level.
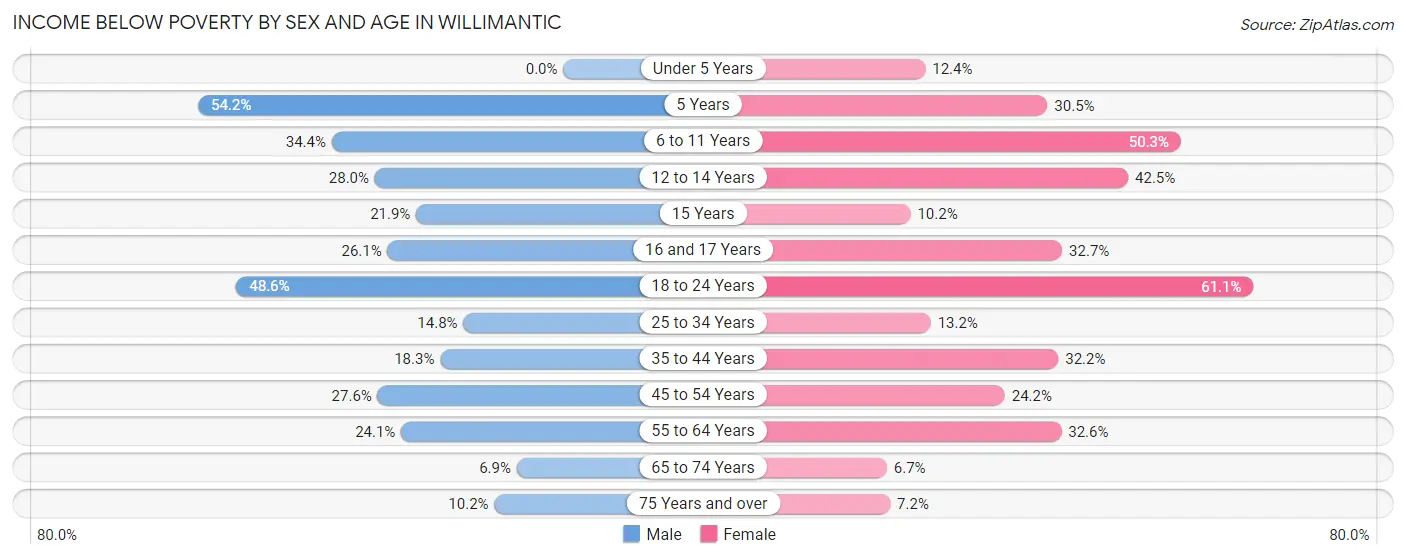
| Age Bracket | Male | Female |
| Under 5 Years | 0 (0.0%) | 15 (12.4%) |
| 5 Years | 32 (54.2%) | 29 (30.5%) |
| 6 to 11 Years | 164 (34.4%) | 221 (50.3%) |
| 12 to 14 Years | 82 (28.0%) | 108 (42.5%) |
| 15 Years | 26 (21.8%) | 10 (10.2%) |
| 16 and 17 Years | 59 (26.1%) | 106 (32.7%) |
| 18 to 24 Years | 669 (48.5%) | 487 (61.1%) |
| 25 to 34 Years | 103 (14.8%) | 147 (13.2%) |
| 35 to 44 Years | 162 (18.3%) | 370 (32.2%) |
| 45 to 54 Years | 193 (27.6%) | 231 (24.2%) |
| 55 to 64 Years | 241 (24.1%) | 364 (32.6%) |
| 65 to 74 Years | 46 (6.9%) | 38 (6.7%) |
| 75 Years and over | 34 (10.2%) | 37 (7.2%) |
| Total | 1,811 (25.8%) | 2,163 (28.7%) |
Income Above Poverty by Sex and Age in Willimantic
According to the poverty statistics in Willimantic, males aged under 5 years and females aged 65 to 74 years are the age groups that are most secure financially, with 100.0% of males and 93.3% of females in these age groups living above the poverty line.
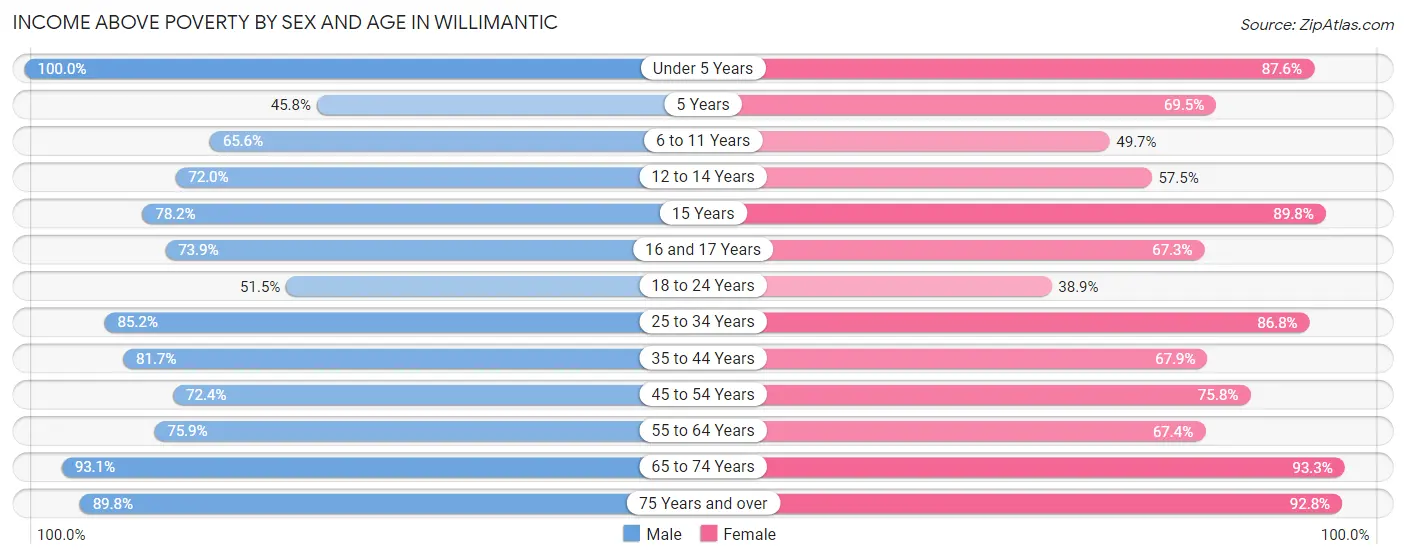
| Age Bracket | Male | Female |
| Under 5 Years | 200 (100.0%) | 106 (87.6%) |
| 5 Years | 27 (45.8%) | 66 (69.5%) |
| 6 to 11 Years | 313 (65.6%) | 218 (49.7%) |
| 12 to 14 Years | 211 (72.0%) | 146 (57.5%) |
| 15 Years | 93 (78.1%) | 88 (89.8%) |
| 16 and 17 Years | 167 (73.9%) | 218 (67.3%) |
| 18 to 24 Years | 709 (51.4%) | 310 (38.9%) |
| 25 to 34 Years | 591 (85.2%) | 967 (86.8%) |
| 35 to 44 Years | 724 (81.7%) | 781 (67.8%) |
| 45 to 54 Years | 507 (72.4%) | 723 (75.8%) |
| 55 to 64 Years | 760 (75.9%) | 753 (67.4%) |
| 65 to 74 Years | 620 (93.1%) | 530 (93.3%) |
| 75 Years and over | 298 (89.8%) | 478 (92.8%) |
| Total | 5,220 (74.2%) | 5,384 (71.3%) |
Income Below Poverty Among Married-Couple Families in Willimantic
The poverty statistics for married-couple families in Willimantic show that 5.0% or 89 of the total 1,782 families live below the poverty line. Families with 1 or 2 children have the highest poverty rate of 12.7%, comprising of 65 families. On the other hand, families with 3 or 4 children have the lowest poverty rate of 0.0%, which includes 0 families.
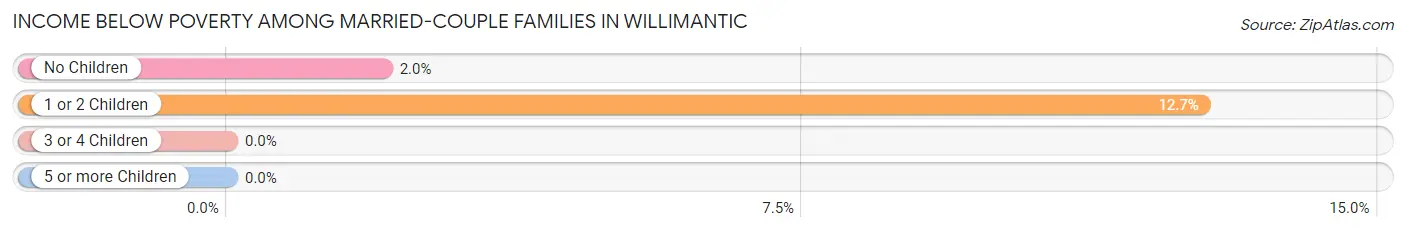
| Children | Above Poverty | Below Poverty |
| No Children | 1,166 (98.0%) | 24 (2.0%) |
| 1 or 2 Children | 447 (87.3%) | 65 (12.7%) |
| 3 or 4 Children | 80 (100.0%) | 0 (0.0%) |
| 5 or more Children | 0 (0.0%) | 0 (0.0%) |
| Total | 1,693 (95.0%) | 89 (5.0%) |
Income Below Poverty Among Single-Parent Households in Willimantic
According to the poverty data in Willimantic, 12.8% or 26 single-father households and 39.8% or 468 single-mother households are living below the poverty line. Among single-father households, those with 3 or 4 children have the highest poverty rate, with 18 households (45.0%) experiencing poverty. Likewise, among single-mother households, those with 3 or 4 children have the highest poverty rate, with 72 households (56.7%) falling below the poverty line.
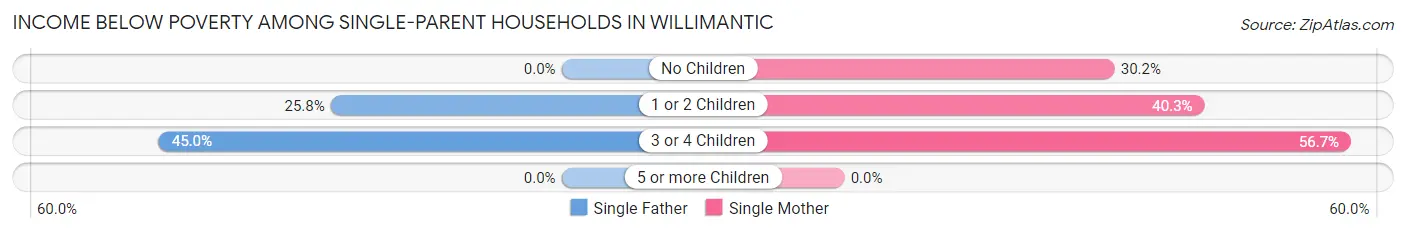
| Children | Single Father | Single Mother |
| No Children | 0 (0.0%) | 80 (30.2%) |
| 1 or 2 Children | 8 (25.8%) | 316 (40.3%) |
| 3 or 4 Children | 18 (45.0%) | 72 (56.7%) |
| 5 or more Children | 0 (0.0%) | 0 (0.0%) |
| Total | 26 (12.8%) | 468 (39.8%) |
Income Below Poverty Among Married-Couple vs Single-Parent Households in Willimantic
The poverty data for Willimantic shows that 89 of the married-couple family households (5.0%) and 494 of the single-parent households (35.8%) are living below the poverty level. Within the married-couple family households, those with 1 or 2 children have the highest poverty rate, with 65 households (12.7%) falling below the poverty line. Among the single-parent households, those with 3 or 4 children have the highest poverty rate, with 90 household (53.9%) living below poverty.
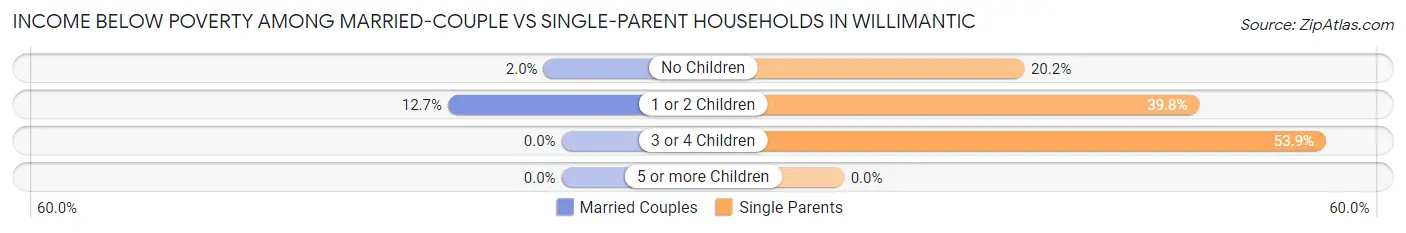
| Children | Married-Couple Families | Single-Parent Households |
| No Children | 24 (2.0%) | 80 (20.2%) |
| 1 or 2 Children | 65 (12.7%) | 324 (39.8%) |
| 3 or 4 Children | 0 (0.0%) | 90 (53.9%) |
| 5 or more Children | 0 (0.0%) | 0 (0.0%) |
| Total | 89 (5.0%) | 494 (35.8%) |
Race in Willimantic
The most populous races in Willimantic are White / Caucasian (12,118 | 68.2%), Hispanic or Latino (6,367 | 35.8%), and Two or more Races (2,567 | 14.4%).
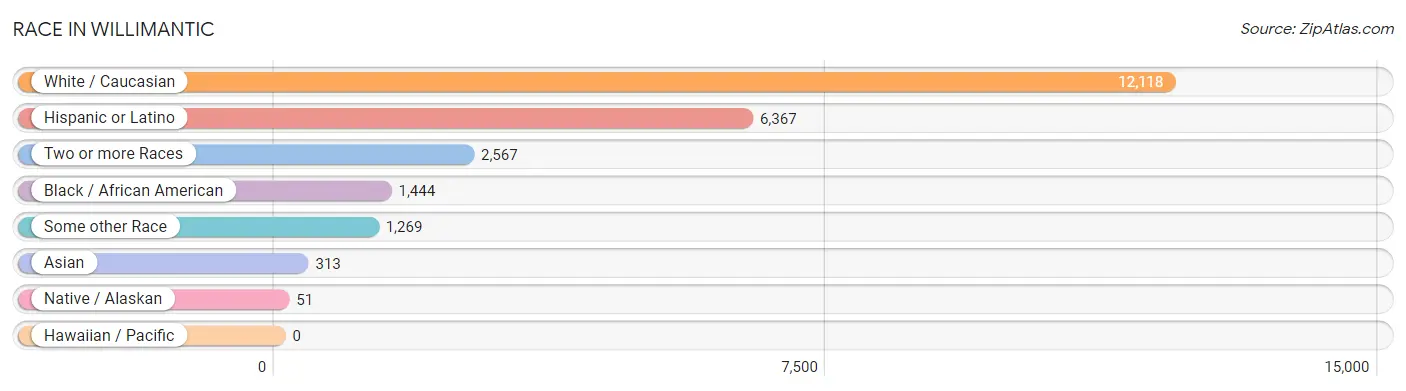
| Race | # Population | % Population |
| Asian | 313 | 1.8% |
| Black / African American | 1,444 | 8.1% |
| Hawaiian / Pacific | 0 | 0.0% |
| Hispanic or Latino | 6,367 | 35.8% |
| Native / Alaskan | 51 | 0.3% |
| White / Caucasian | 12,118 | 68.2% |
| Two or more Races | 2,567 | 14.4% |
| Some other Race | 1,269 | 7.1% |
| Total | 17,762 | 100.0% |
Ancestry in Willimantic
The most populous ancestries reported in Willimantic are Puerto Rican (4,283 | 24.1%), Irish (1,939 | 10.9%), Italian (1,583 | 8.9%), Mexican (1,457 | 8.2%), and German (1,188 | 6.7%), together accounting for 58.8% of all Willimantic residents.
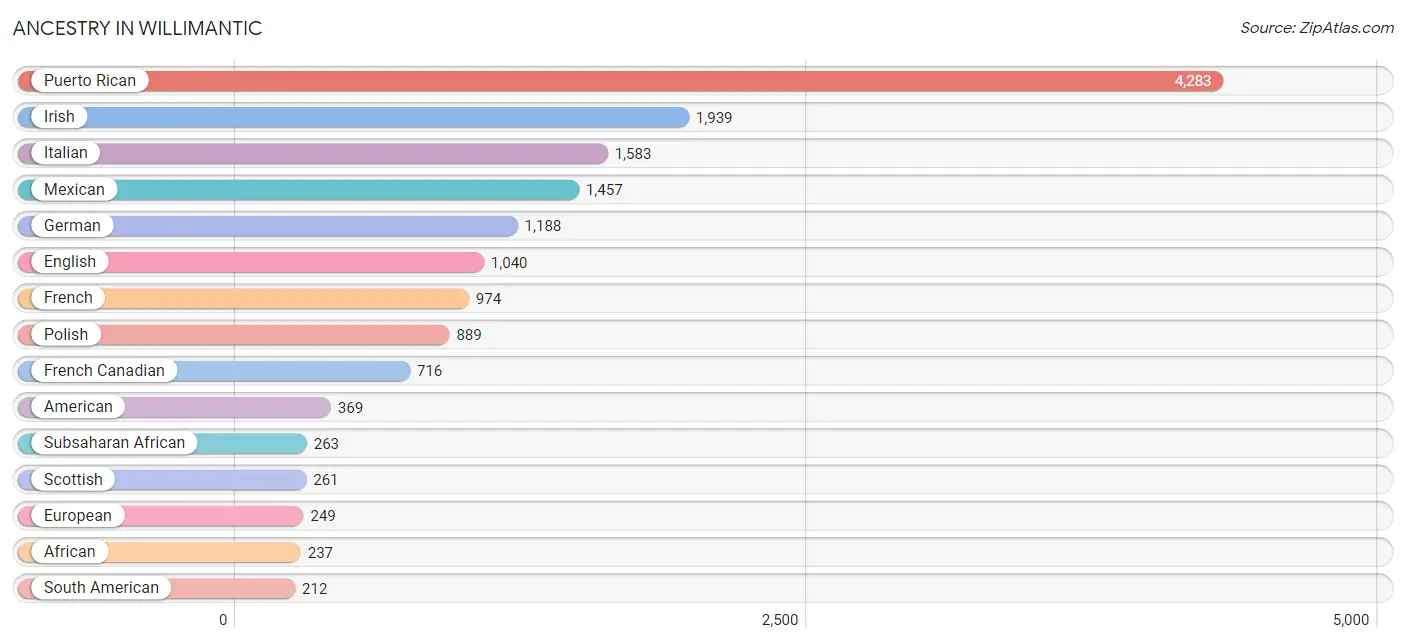
| Ancestry | # Population | % Population |
| African | 237 | 1.3% |
| American | 369 | 2.1% |
| Arab | 147 | 0.8% |
| Argentinean | 60 | 0.3% |
| Austrian | 23 | 0.1% |
| Blackfeet | 17 | 0.1% |
| Brazilian | 48 | 0.3% |
| British | 34 | 0.2% |
| Burmese | 55 | 0.3% |
| Canadian | 179 | 1.0% |
| Cape Verdean | 3 | 0.0% |
| Central American | 211 | 1.2% |
| Central American Indian | 95 | 0.5% |
| Colombian | 27 | 0.2% |
| Costa Rican | 9 | 0.1% |
| Cuban | 39 | 0.2% |
| Czech | 15 | 0.1% |
| Danish | 5 | 0.0% |
| Dominican | 117 | 0.7% |
| Dutch | 43 | 0.2% |
| Eastern European | 43 | 0.2% |
| Ecuadorian | 57 | 0.3% |
| Egyptian | 97 | 0.5% |
| English | 1,040 | 5.9% |
| European | 249 | 1.4% |
| Finnish | 18 | 0.1% |
| French | 974 | 5.5% |
| French Canadian | 716 | 4.0% |
| German | 1,188 | 6.7% |
| Ghanaian | 8 | 0.1% |
| Greek | 121 | 0.7% |
| Guatemalan | 167 | 0.9% |
| Haitian | 52 | 0.3% |
| Indian (Asian) | 192 | 1.1% |
| Iraqi | 42 | 0.2% |
| Irish | 1,939 | 10.9% |
| Italian | 1,583 | 8.9% |
| Jamaican | 153 | 0.9% |
| Korean | 23 | 0.1% |
| Laotian | 108 | 0.6% |
| Latvian | 64 | 0.4% |
| Lebanese | 8 | 0.1% |
| Lithuanian | 28 | 0.2% |
| Mexican | 1,457 | 8.2% |
| Mexican American Indian | 35 | 0.2% |
| Nicaraguan | 28 | 0.2% |
| Northern European | 43 | 0.2% |
| Norwegian | 41 | 0.2% |
| Pakistani | 3 | 0.0% |
| Panamanian | 7 | 0.0% |
| Peruvian | 59 | 0.3% |
| Polish | 889 | 5.0% |
| Portuguese | 202 | 1.1% |
| Puerto Rican | 4,283 | 24.1% |
| Russian | 157 | 0.9% |
| Scotch-Irish | 92 | 0.5% |
| Scottish | 261 | 1.5% |
| Sioux | 7 | 0.0% |
| Slovak | 74 | 0.4% |
| Slovene | 12 | 0.1% |
| South American | 212 | 1.2% |
| Spaniard | 12 | 0.1% |
| Sri Lankan | 74 | 0.4% |
| Subsaharan African | 263 | 1.5% |
| Swedish | 129 | 0.7% |
| Swiss | 9 | 0.1% |
| Thai | 99 | 0.6% |
| Trinidadian and Tobagonian | 21 | 0.1% |
| Turkish | 16 | 0.1% |
| Ukrainian | 111 | 0.6% |
| Venezuelan | 9 | 0.1% |
| Welsh | 23 | 0.1% |
| West Indian | 11 | 0.1% | View All 73 Rows |
Immigrants in Willimantic
The most numerous immigrant groups reported in Willimantic came from Latin America (991 | 5.6%), Central America (765 | 4.3%), Mexico (555 | 3.1%), Asia (371 | 2.1%), and Europe (199 | 1.1%), together accounting for 16.2% of all Willimantic residents.
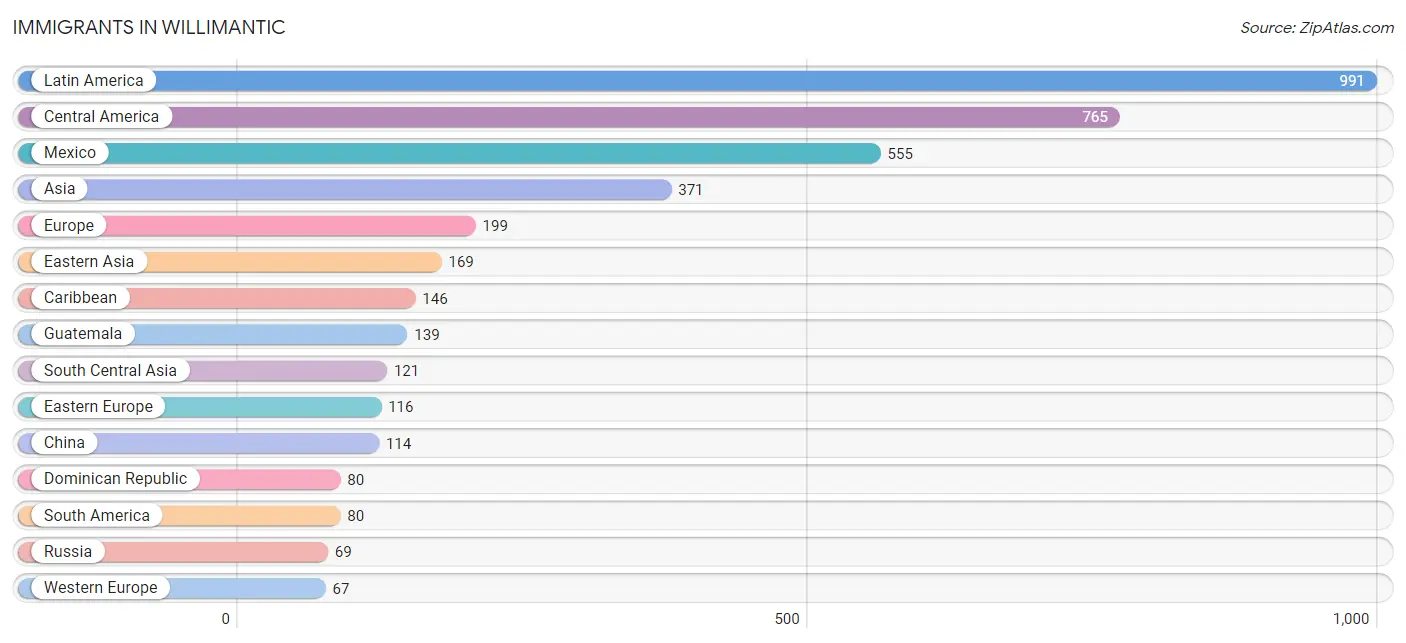
| Immigration Origin | # Population | % Population |
| Africa | 28 | 0.2% |
| Argentina | 12 | 0.1% |
| Asia | 371 | 2.1% |
| Brazil | 27 | 0.2% |
| Canada | 53 | 0.3% |
| Caribbean | 146 | 0.8% |
| Central America | 765 | 4.3% |
| China | 114 | 0.6% |
| Colombia | 5 | 0.0% |
| Costa Rica | 41 | 0.2% |
| Cuba | 7 | 0.0% |
| Denmark | 5 | 0.0% |
| Dominican Republic | 80 | 0.4% |
| Eastern Africa | 21 | 0.1% |
| Eastern Asia | 169 | 0.9% |
| Eastern Europe | 116 | 0.6% |
| Ecuador | 8 | 0.1% |
| El Salvador | 8 | 0.1% |
| Europe | 199 | 1.1% |
| France | 32 | 0.2% |
| Germany | 29 | 0.2% |
| Guatemala | 139 | 0.8% |
| Guyana | 8 | 0.1% |
| Haiti | 46 | 0.3% |
| India | 46 | 0.3% |
| Indonesia | 20 | 0.1% |
| Iraq | 42 | 0.2% |
| Italy | 11 | 0.1% |
| Jamaica | 7 | 0.0% |
| Korea | 55 | 0.3% |
| Latin America | 991 | 5.6% |
| Latvia | 26 | 0.2% |
| Mexico | 555 | 3.1% |
| Nepal | 16 | 0.1% |
| Netherlands | 6 | 0.0% |
| Nicaragua | 15 | 0.1% |
| Nigeria | 7 | 0.0% |
| Northern Europe | 5 | 0.0% |
| Panama | 7 | 0.0% |
| Peru | 20 | 0.1% |
| Poland | 21 | 0.1% |
| Russia | 69 | 0.4% |
| South America | 80 | 0.4% |
| South Central Asia | 121 | 0.7% |
| South Eastern Asia | 23 | 0.1% |
| Southern Europe | 11 | 0.1% |
| Sri Lanka | 30 | 0.2% |
| Thailand | 3 | 0.0% |
| Turkey | 16 | 0.1% |
| Uzbekistan | 29 | 0.2% |
| Western Africa | 7 | 0.0% |
| Western Asia | 58 | 0.3% |
| Western Europe | 67 | 0.4% | View All 53 Rows |
Sex and Age in Willimantic
Sex and Age in Willimantic
The most populous age groups in Willimantic are 20 to 24 Years (1,847 | 21.6%) for men and 15 to 19 Years (1,481 | 16.1%) for women.
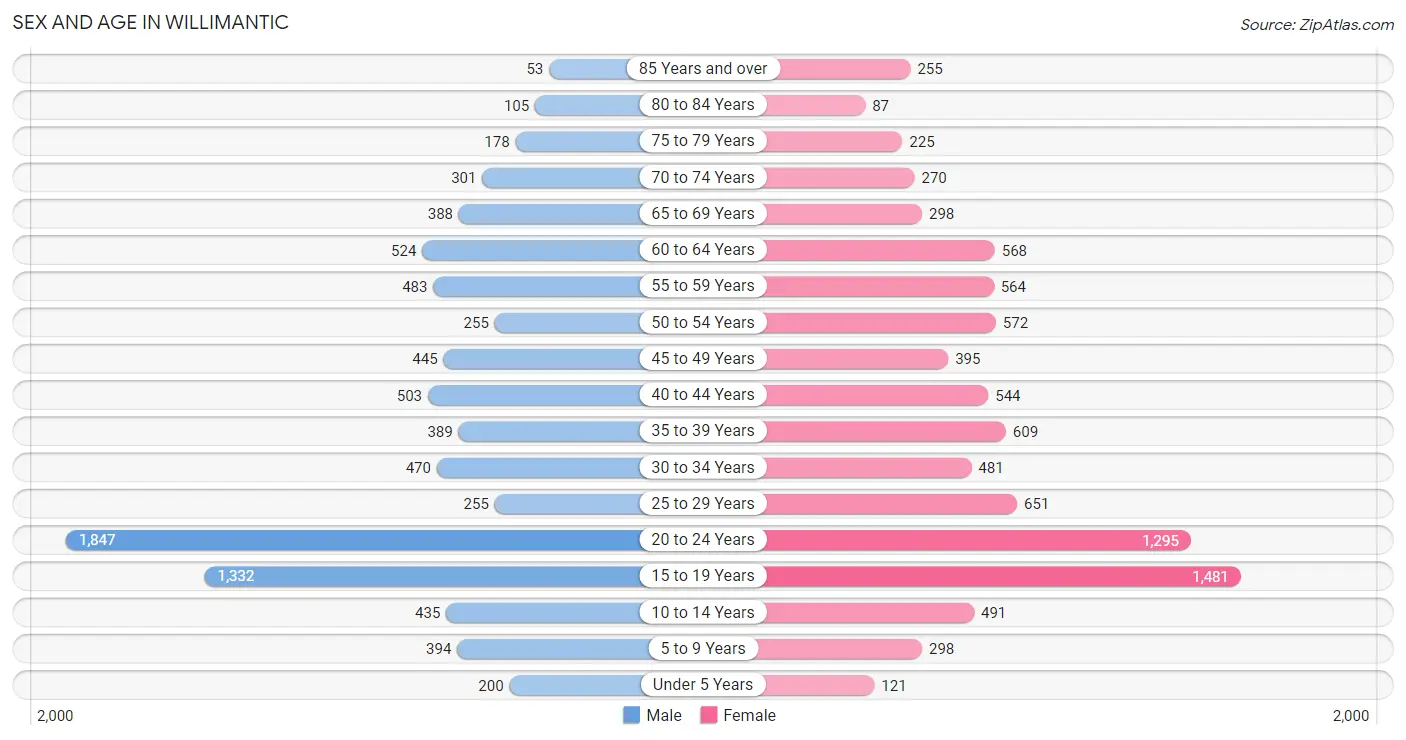
| Age Bracket | Male | Female |
| Under 5 Years | 200 (2.3%) | 121 (1.3%) |
| 5 to 9 Years | 394 (4.6%) | 298 (3.2%) |
| 10 to 14 Years | 435 (5.1%) | 491 (5.3%) |
| 15 to 19 Years | 1,332 (15.6%) | 1,481 (16.1%) |
| 20 to 24 Years | 1,847 (21.6%) | 1,295 (14.1%) |
| 25 to 29 Years | 255 (3.0%) | 651 (7.1%) |
| 30 to 34 Years | 470 (5.5%) | 481 (5.2%) |
| 35 to 39 Years | 389 (4.5%) | 609 (6.6%) |
| 40 to 44 Years | 503 (5.9%) | 544 (5.9%) |
| 45 to 49 Years | 445 (5.2%) | 395 (4.3%) |
| 50 to 54 Years | 255 (3.0%) | 572 (6.2%) |
| 55 to 59 Years | 483 (5.6%) | 564 (6.1%) |
| 60 to 64 Years | 524 (6.1%) | 568 (6.2%) |
| 65 to 69 Years | 388 (4.5%) | 298 (3.2%) |
| 70 to 74 Years | 301 (3.5%) | 270 (2.9%) |
| 75 to 79 Years | 178 (2.1%) | 225 (2.4%) |
| 80 to 84 Years | 105 (1.2%) | 87 (0.9%) |
| 85 Years and over | 53 (0.6%) | 255 (2.8%) |
| Total | 8,557 (100.0%) | 9,205 (100.0%) |
Families and Households in Willimantic
Median Family Size in Willimantic
The median family size in Willimantic is 2.94 persons per family, with single male/father families (203 | 6.4%) accounting for the largest median family size of 3.35 persons per family. On the other hand, single female/mother families (1,176 | 37.2%) represent the smallest median family size with 2.83 persons per family.
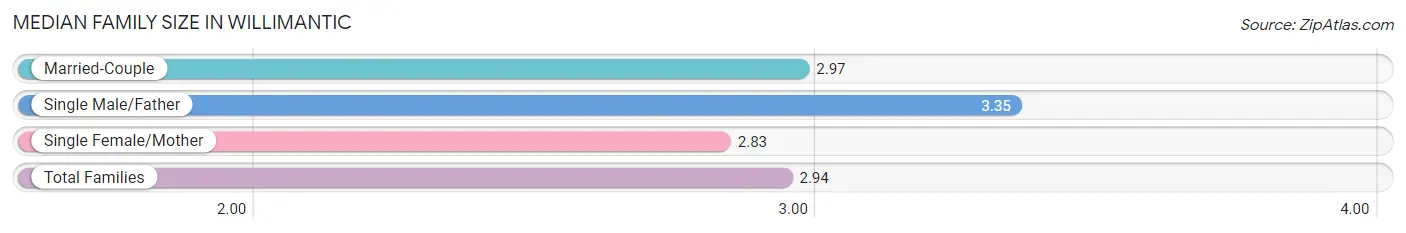
| Family Type | # Families | Family Size |
| Married-Couple | 1,782 (56.4%) | 2.97 |
| Single Male/Father | 203 (6.4%) | 3.35 |
| Single Female/Mother | 1,176 (37.2%) | 2.83 |
| Total Families | 3,161 (100.0%) | 2.94 |
Median Household Size in Willimantic
The median household size in Willimantic is 2.26 persons per household, with single male/father households (203 | 3.2%) accounting for the largest median household size of 3.57 persons per household. non-family households (3,218 | 50.4%) represent the smallest median household size with 1.50 persons per household.
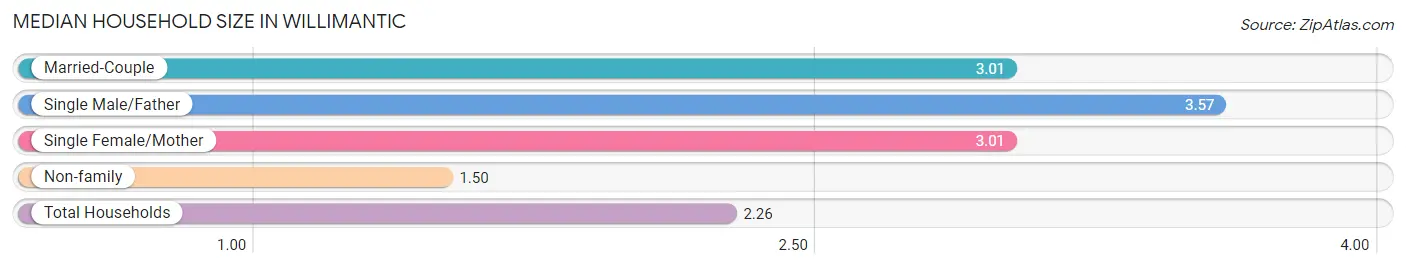
| Household Type | # Households | Household Size |
| Married-Couple | 1,782 (27.9%) | 3.01 |
| Single Male/Father | 203 (3.2%) | 3.57 |
| Single Female/Mother | 1,176 (18.4%) | 3.01 |
| Non-family | 3,218 (50.4%) | 1.50 |
| Total Households | 6,379 (100.0%) | 2.26 |
Household Size by Marriage Status in Willimantic
Out of a total of 6,379 households in Willimantic, 3,161 (49.5%) are family households, while 3,218 (50.4%) are nonfamily households. The most numerous type of family households are 2-person households, comprising 1,198, and the most common type of nonfamily households are 1-person households, comprising 2,364.
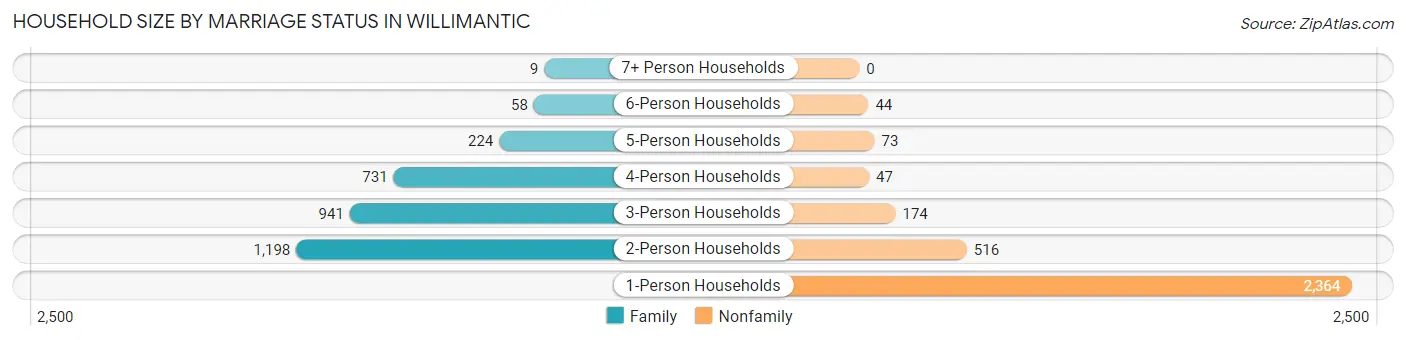
| Household Size | Family Households | Nonfamily Households |
| 1-Person Households | - | 2,364 (37.1%) |
| 2-Person Households | 1,198 (18.8%) | 516 (8.1%) |
| 3-Person Households | 941 (14.7%) | 174 (2.7%) |
| 4-Person Households | 731 (11.5%) | 47 (0.7%) |
| 5-Person Households | 224 (3.5%) | 73 (1.1%) |
| 6-Person Households | 58 (0.9%) | 44 (0.7%) |
| 7+ Person Households | 9 (0.1%) | 0 (0.0%) |
| Total | 3,161 (49.5%) | 3,218 (50.4%) |
Female Fertility in Willimantic
Fertility by Age in Willimantic
Average fertility rate in Willimantic is 16.0 births per 1,000 women. Women in the age bracket of 35 to 50 years have the highest fertility rate with 38.0 births per 1,000 women. Women in the age bracket of 35 to 50 years acount for 73.9% of all women with births.
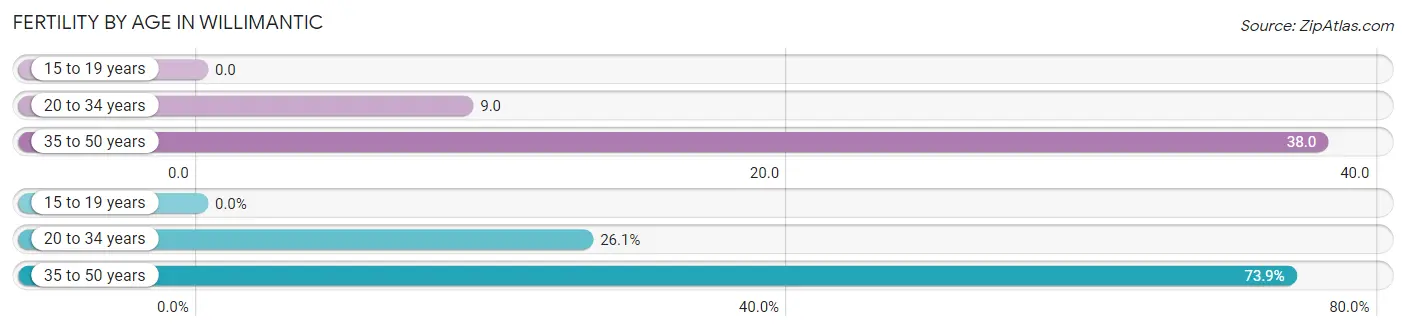
| Age Bracket | Women with Births | Births / 1,000 Women |
| 15 to 19 years | 0 (0.0%) | 0.0 |
| 20 to 34 years | 23 (26.1%) | 9.0 |
| 35 to 50 years | 65 (73.9%) | 38.0 |
| Total | 88 (100.0%) | 16.0 |
Fertility by Age by Marriage Status in Willimantic
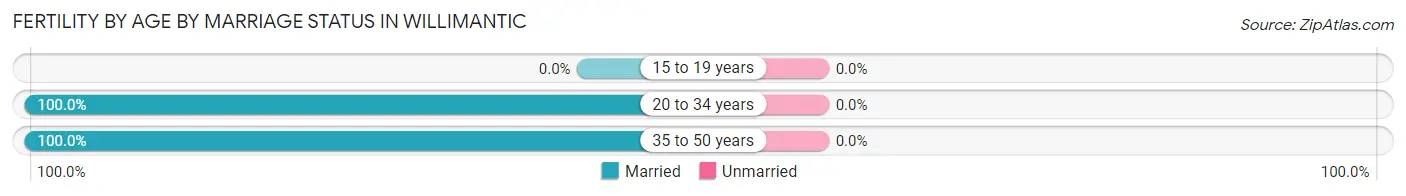
| Age Bracket | Married | Unmarried |
| 15 to 19 years | 0 (0.0%) | 0 (0.0%) |
| 20 to 34 years | 23 (100.0%) | 0 (0.0%) |
| 35 to 50 years | 65 (100.0%) | 0 (0.0%) |
| Total | 88 (100.0%) | 0 (0.0%) |
Fertility by Education in Willimantic
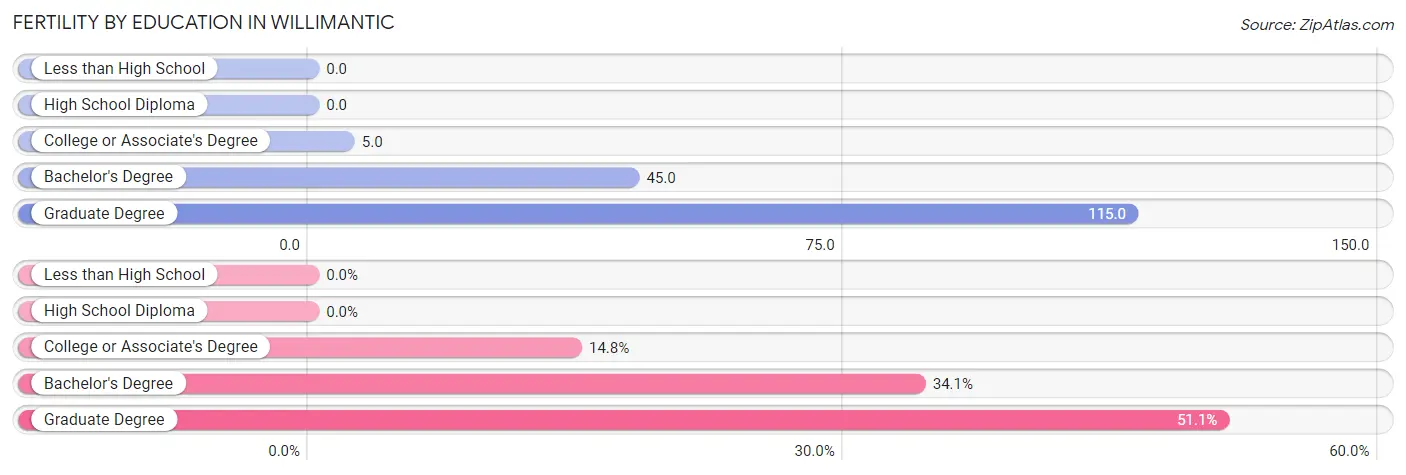
| Educational Attainment | Women with Births | Births / 1,000 Women |
| Less than High School | 0 (0.0%) | 0.0 |
| High School Diploma | 0 (0.0%) | 0.0 |
| College or Associate's Degree | 13 (14.8%) | 5.0 |
| Bachelor's Degree | 30 (34.1%) | 45.0 |
| Graduate Degree | 45 (51.1%) | 115.0 |
| Total | 88 (100.0%) | 16.0 |
Fertility by Education by Marriage Status in Willimantic
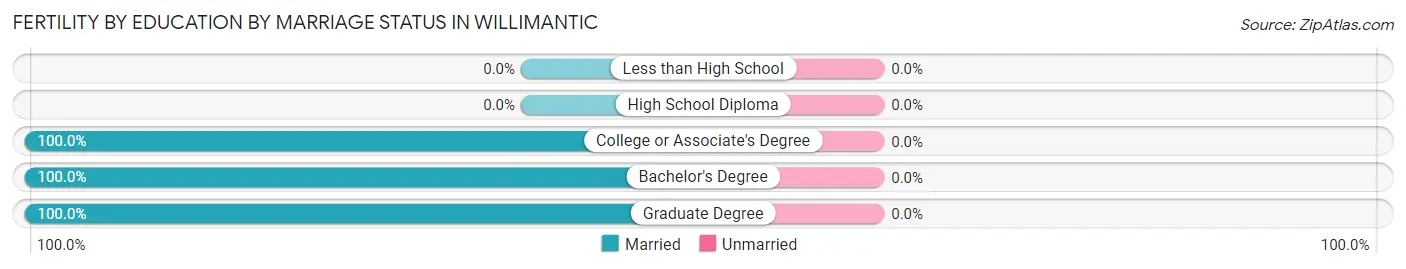
| Educational Attainment | Married | Unmarried |
| Less than High School | 0 (0.0%) | 0 (0.0%) |
| High School Diploma | 0 (0.0%) | 0 (0.0%) |
| College or Associate's Degree | 13 (100.0%) | 0 (0.0%) |
| Bachelor's Degree | 30 (100.0%) | 0 (0.0%) |
| Graduate Degree | 45 (100.0%) | 0 (0.0%) |
| Total | 88 (100.0%) | 0 (0.0%) |
Employment Characteristics in Willimantic
Employment by Class of Employer in Willimantic
Among the 7,348 employed individuals in Willimantic, private company employees (4,532 | 61.7%), state government employees (1,044 | 14.2%), and not-for-profit organizations (800 | 10.9%) make up the most common classes of employment.
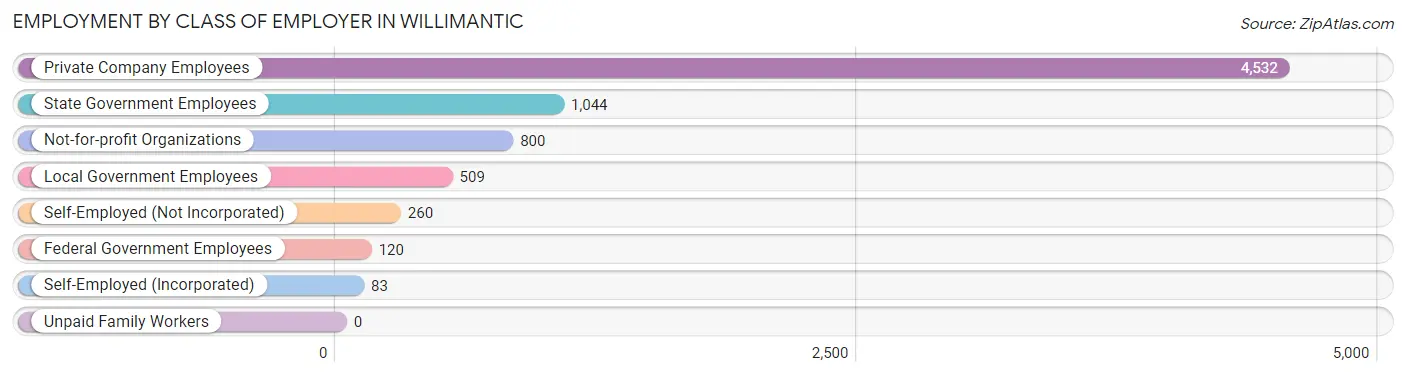
| Employer Class | # Employees | % Employees |
| Private Company Employees | 4,532 | 61.7% |
| Self-Employed (Incorporated) | 83 | 1.1% |
| Self-Employed (Not Incorporated) | 260 | 3.5% |
| Not-for-profit Organizations | 800 | 10.9% |
| Local Government Employees | 509 | 6.9% |
| State Government Employees | 1,044 | 14.2% |
| Federal Government Employees | 120 | 1.6% |
| Unpaid Family Workers | 0 | 0.0% |
| Total | 7,348 | 100.0% |
Employment Status by Age in Willimantic
According to the labor force statistics for Willimantic, out of the total population over 16 years of age (15,606), 57.4% or 8,958 individuals are in the labor force, with 8.2% or 735 of them unemployed. The age group with the highest labor force participation rate is 25 to 29 years, with 82.8% or 750 individuals in the labor force. Within the labor force, the 45 to 54 years age range has the highest percentage of unemployed individuals, with 16.3% or 197 of them being unemployed.
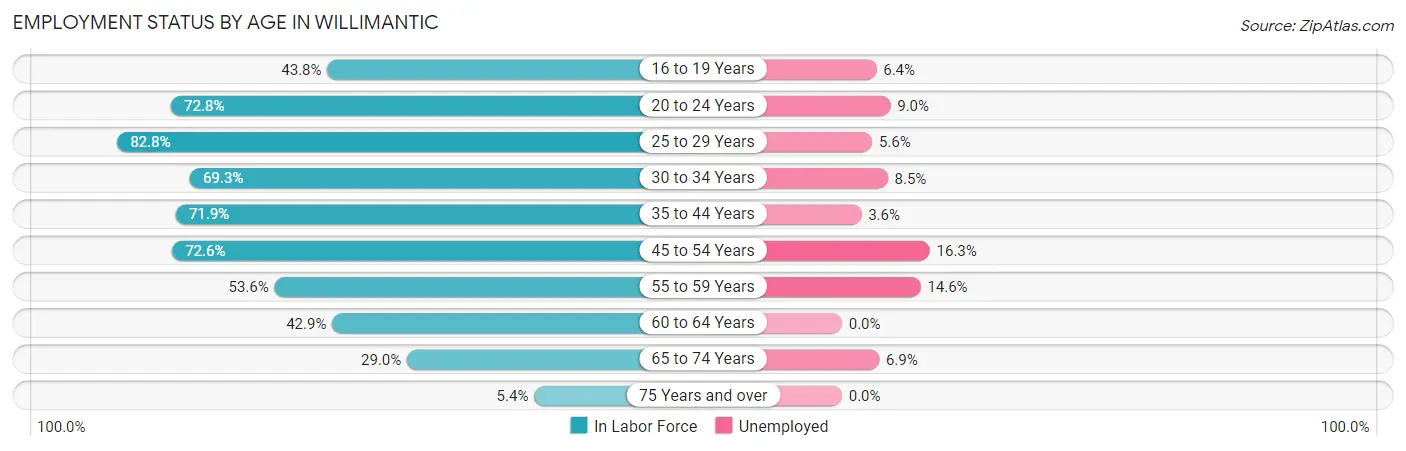
| Age Bracket | In Labor Force | Unemployed |
| 16 to 19 Years | 1,137 (43.8%) | 73 (6.4%) |
| 20 to 24 Years | 2,287 (72.8%) | 206 (9.0%) |
| 25 to 29 Years | 750 (82.8%) | 42 (5.6%) |
| 30 to 34 Years | 659 (69.3%) | 56 (8.5%) |
| 35 to 44 Years | 1,470 (71.9%) | 53 (3.6%) |
| 45 to 54 Years | 1,210 (72.6%) | 197 (16.3%) |
| 55 to 59 Years | 561 (53.6%) | 82 (14.6%) |
| 60 to 64 Years | 468 (42.9%) | 0 (0.0%) |
| 65 to 74 Years | 365 (29.0%) | 25 (6.9%) |
| 75 Years and over | 49 (5.4%) | 0 (0.0%) |
| Total | 8,958 (57.4%) | 735 (8.2%) |
Employment Status by Educational Attainment in Willimantic
According to labor force statistics for Willimantic, 66.4% of individuals (5,118) out of the total population between 25 and 64 years of age (7,708) are in the labor force, with 8.4% or 430 of them being unemployed. The group with the highest labor force participation rate are those with the educational attainment of bachelor's degree or higher, with 78.8% or 1,563 individuals in the labor force. Within the labor force, individuals with high school diploma education have the highest percentage of unemployment, with 11.3% or 179 of them being unemployed.
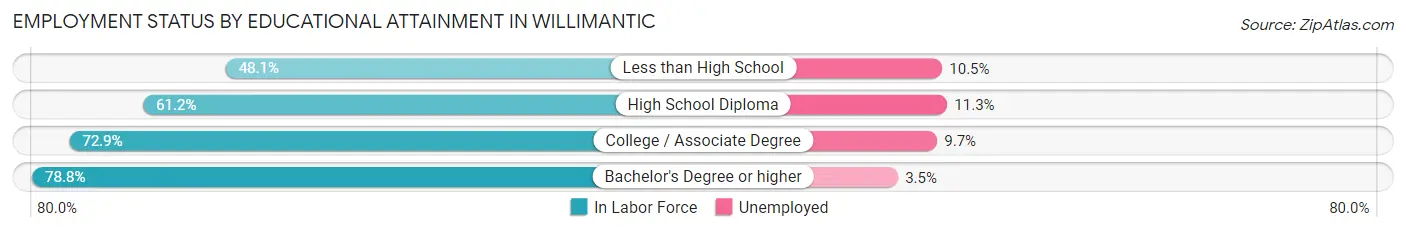
| Educational Attainment | In Labor Force | Unemployed |
| Less than High School | 607 (48.1%) | 133 (10.5%) |
| High School Diploma | 1,583 (61.2%) | 292 (11.3%) |
| College / Associate Degree | 1,368 (72.9%) | 182 (9.7%) |
| Bachelor's Degree or higher | 1,563 (78.8%) | 69 (3.5%) |
| Total | 5,118 (66.4%) | 647 (8.4%) |
Employment Occupations by Sex in Willimantic
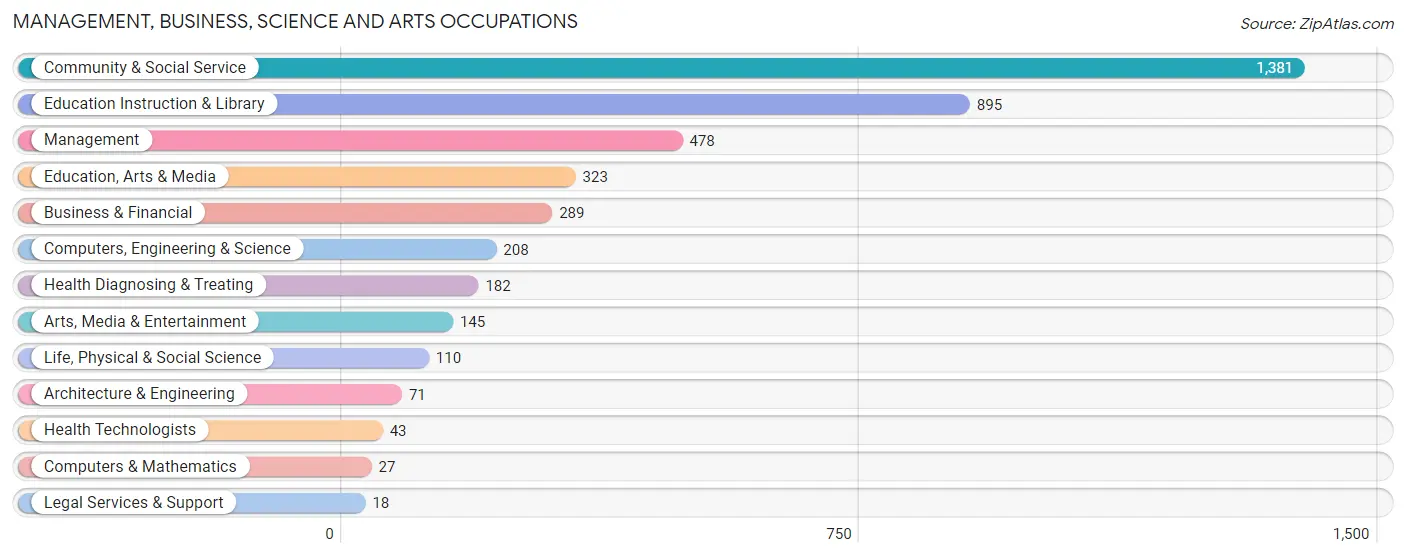
Management, Business, Science and Arts Occupations
The most common Management, Business, Science and Arts occupations in Willimantic are Community & Social Service (1,381 | 16.9%), Education Instruction & Library (895 | 11.0%), Management (478 | 5.9%), Education, Arts & Media (323 | 4.0%), and Business & Financial (289 | 3.5%).
Management, Business, Science and Arts Occupations by Sex
Within the Management, Business, Science and Arts occupations in Willimantic, the most male-oriented occupations are Legal Services & Support (100.0%), Computers & Mathematics (88.9%), and Architecture & Engineering (54.9%), while the most female-oriented occupations are Health Diagnosing & Treating (86.3%), Health Technologists (76.7%), and Education, Arts & Media (72.8%).
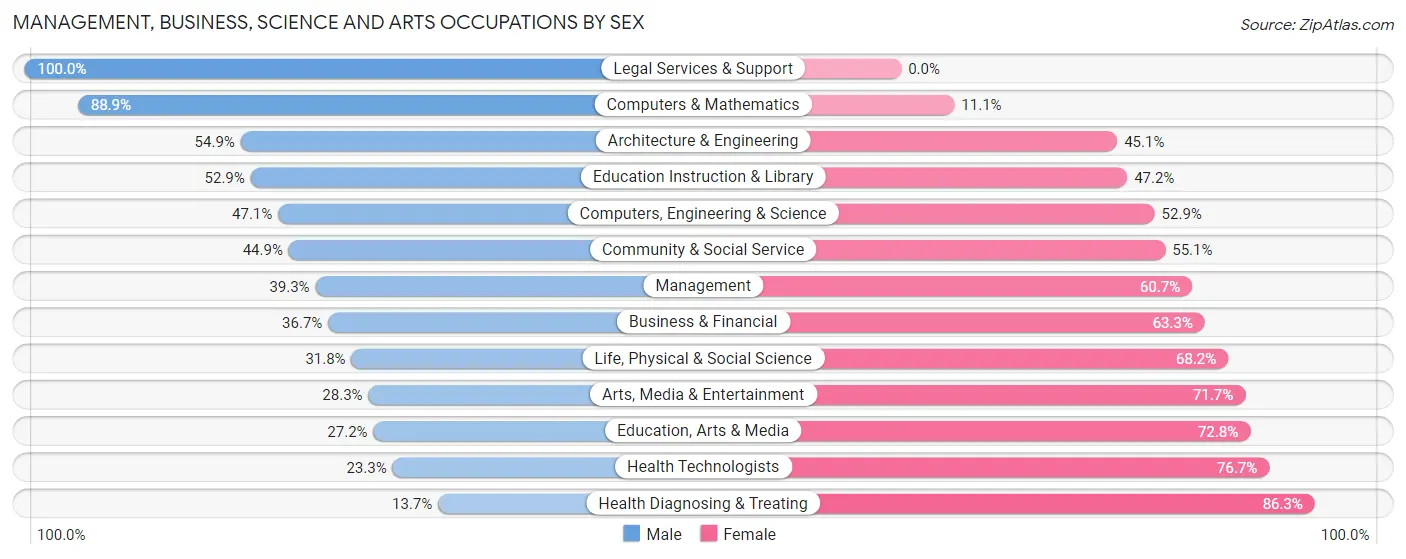
| Occupation | Male | Female |
| Management | 188 (39.3%) | 290 (60.7%) |
| Business & Financial | 106 (36.7%) | 183 (63.3%) |
| Computers, Engineering & Science | 98 (47.1%) | 110 (52.9%) |
| Computers & Mathematics | 24 (88.9%) | 3 (11.1%) |
| Architecture & Engineering | 39 (54.9%) | 32 (45.1%) |
| Life, Physical & Social Science | 35 (31.8%) | 75 (68.2%) |
| Community & Social Service | 620 (44.9%) | 761 (55.1%) |
| Education, Arts & Media | 88 (27.2%) | 235 (72.8%) |
| Legal Services & Support | 18 (100.0%) | 0 (0.0%) |
| Education Instruction & Library | 473 (52.8%) | 422 (47.1%) |
| Arts, Media & Entertainment | 41 (28.3%) | 104 (71.7%) |
| Health Diagnosing & Treating | 25 (13.7%) | 157 (86.3%) |
| Health Technologists | 10 (23.3%) | 33 (76.7%) |
| Total (Category) | 1,037 (40.9%) | 1,501 (59.1%) |
| Total (Overall) | 4,073 (49.8%) | 4,102 (50.2%) |
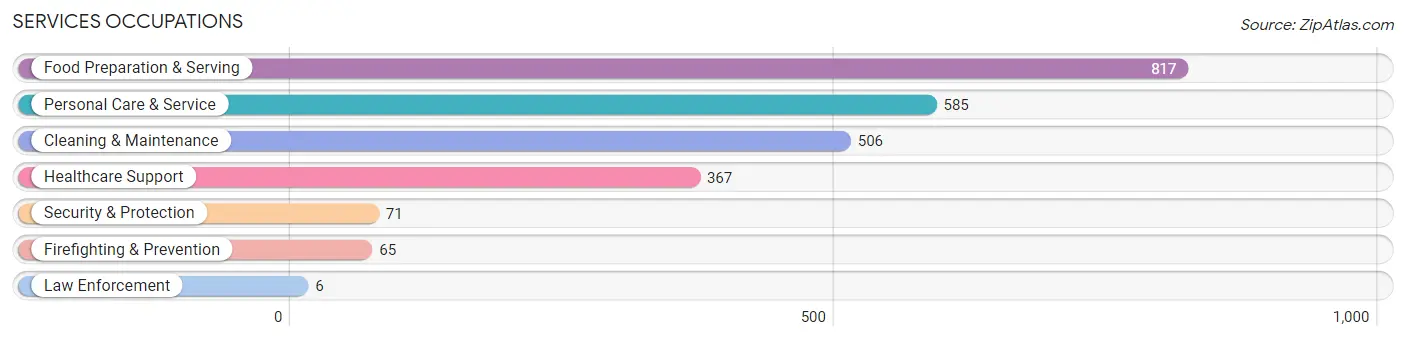
Services Occupations
The most common Services occupations in Willimantic are Food Preparation & Serving (817 | 10.0%), Personal Care & Service (585 | 7.2%), Cleaning & Maintenance (506 | 6.2%), Healthcare Support (367 | 4.5%), and Security & Protection (71 | 0.9%).
Services Occupations by Sex
Within the Services occupations in Willimantic, the most male-oriented occupations are Firefighting & Prevention (100.0%), Security & Protection (91.5%), and Personal Care & Service (64.6%), while the most female-oriented occupations are Law Enforcement (100.0%), Healthcare Support (81.7%), and Food Preparation & Serving (41.6%).
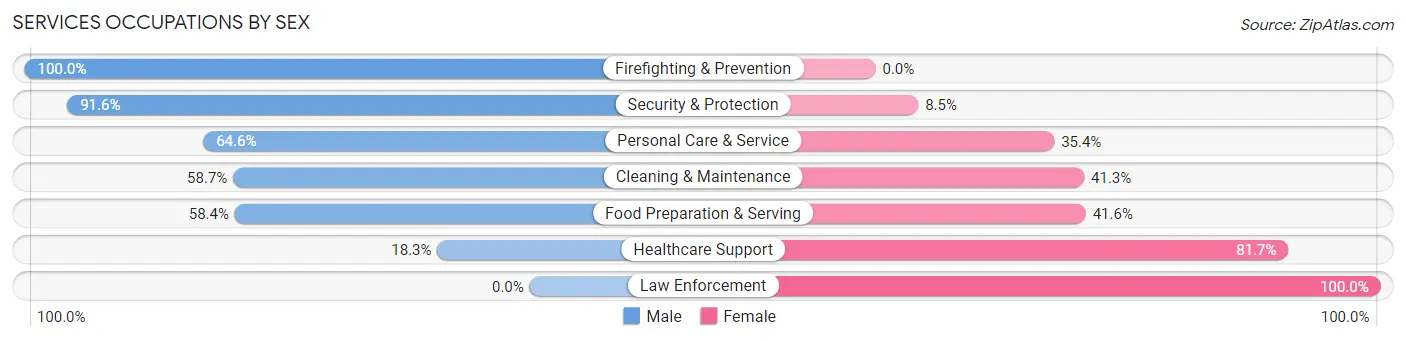
| Occupation | Male | Female |
| Healthcare Support | 67 (18.3%) | 300 (81.7%) |
| Security & Protection | 65 (91.5%) | 6 (8.5%) |
| Firefighting & Prevention | 65 (100.0%) | 0 (0.0%) |
| Law Enforcement | 0 (0.0%) | 6 (100.0%) |
| Food Preparation & Serving | 477 (58.4%) | 340 (41.6%) |
| Cleaning & Maintenance | 297 (58.7%) | 209 (41.3%) |
| Personal Care & Service | 378 (64.6%) | 207 (35.4%) |
| Total (Category) | 1,284 (54.7%) | 1,062 (45.3%) |
| Total (Overall) | 4,073 (49.8%) | 4,102 (50.2%) |
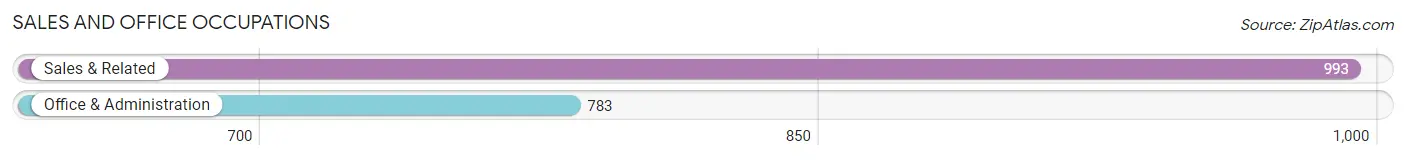
Sales and Office Occupations
The most common Sales and Office occupations in Willimantic are Sales & Related (993 | 12.1%), and Office & Administration (783 | 9.6%).
Sales and Office Occupations by Sex
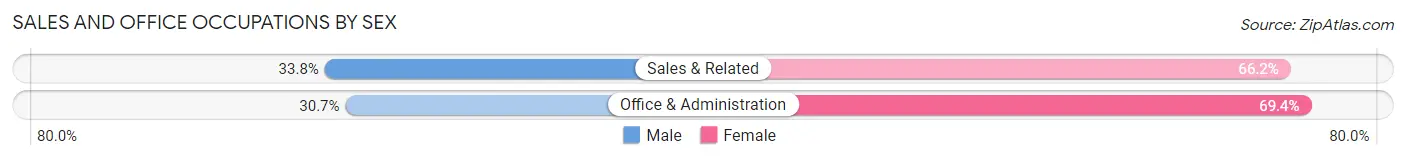
| Occupation | Male | Female |
| Sales & Related | 336 (33.8%) | 657 (66.2%) |
| Office & Administration | 240 (30.6%) | 543 (69.4%) |
| Total (Category) | 576 (32.4%) | 1,200 (67.6%) |
| Total (Overall) | 4,073 (49.8%) | 4,102 (50.2%) |
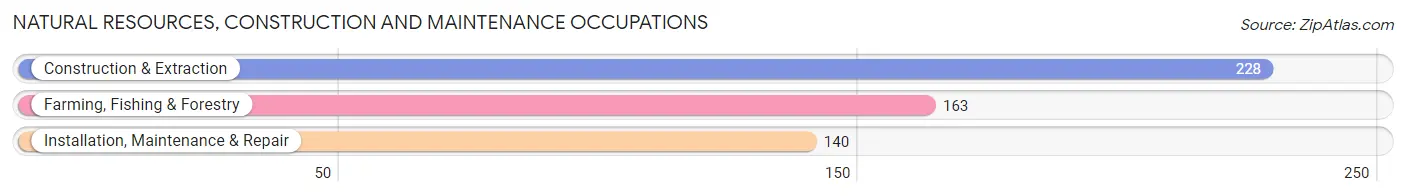
Natural Resources, Construction and Maintenance Occupations
The most common Natural Resources, Construction and Maintenance occupations in Willimantic are Construction & Extraction (228 | 2.8%), Farming, Fishing & Forestry (163 | 2.0%), and Installation, Maintenance & Repair (140 | 1.7%).
Natural Resources, Construction and Maintenance Occupations by Sex
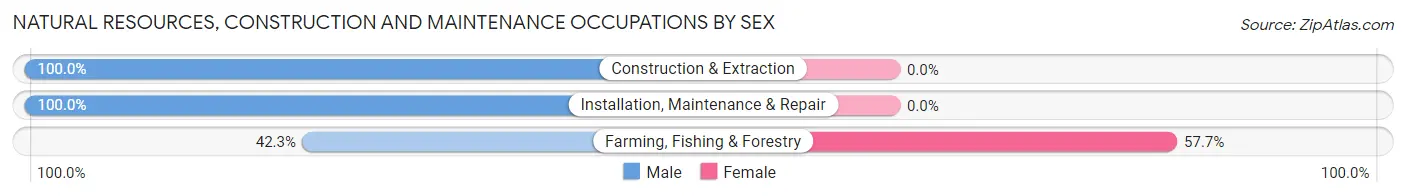
| Occupation | Male | Female |
| Farming, Fishing & Forestry | 69 (42.3%) | 94 (57.7%) |
| Construction & Extraction | 228 (100.0%) | 0 (0.0%) |
| Installation, Maintenance & Repair | 140 (100.0%) | 0 (0.0%) |
| Total (Category) | 437 (82.3%) | 94 (17.7%) |
| Total (Overall) | 4,073 (49.8%) | 4,102 (50.2%) |
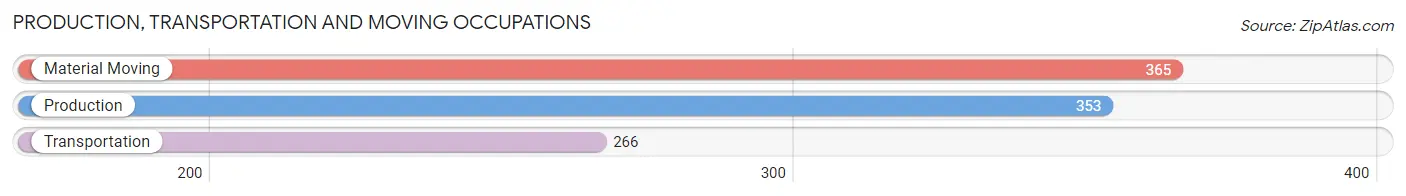
Production, Transportation and Moving Occupations
The most common Production, Transportation and Moving occupations in Willimantic are Material Moving (365 | 4.5%), Production (353 | 4.3%), and Transportation (266 | 3.3%).
Production, Transportation and Moving Occupations by Sex
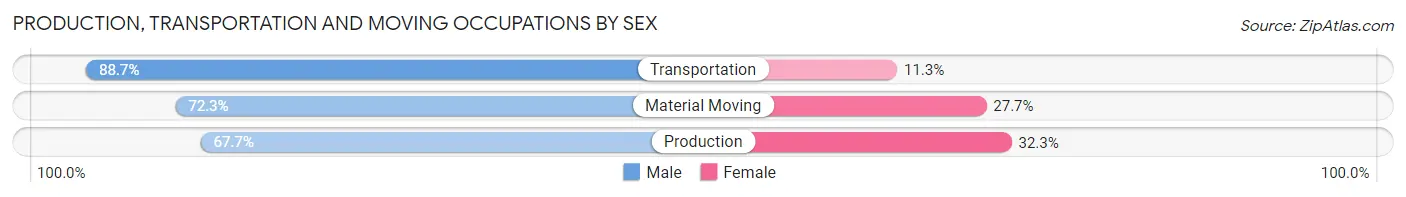
| Occupation | Male | Female |
| Production | 239 (67.7%) | 114 (32.3%) |
| Transportation | 236 (88.7%) | 30 (11.3%) |
| Material Moving | 264 (72.3%) | 101 (27.7%) |
| Total (Category) | 739 (75.1%) | 245 (24.9%) |
| Total (Overall) | 4,073 (49.8%) | 4,102 (50.2%) |
Employment Industries by Sex in Willimantic
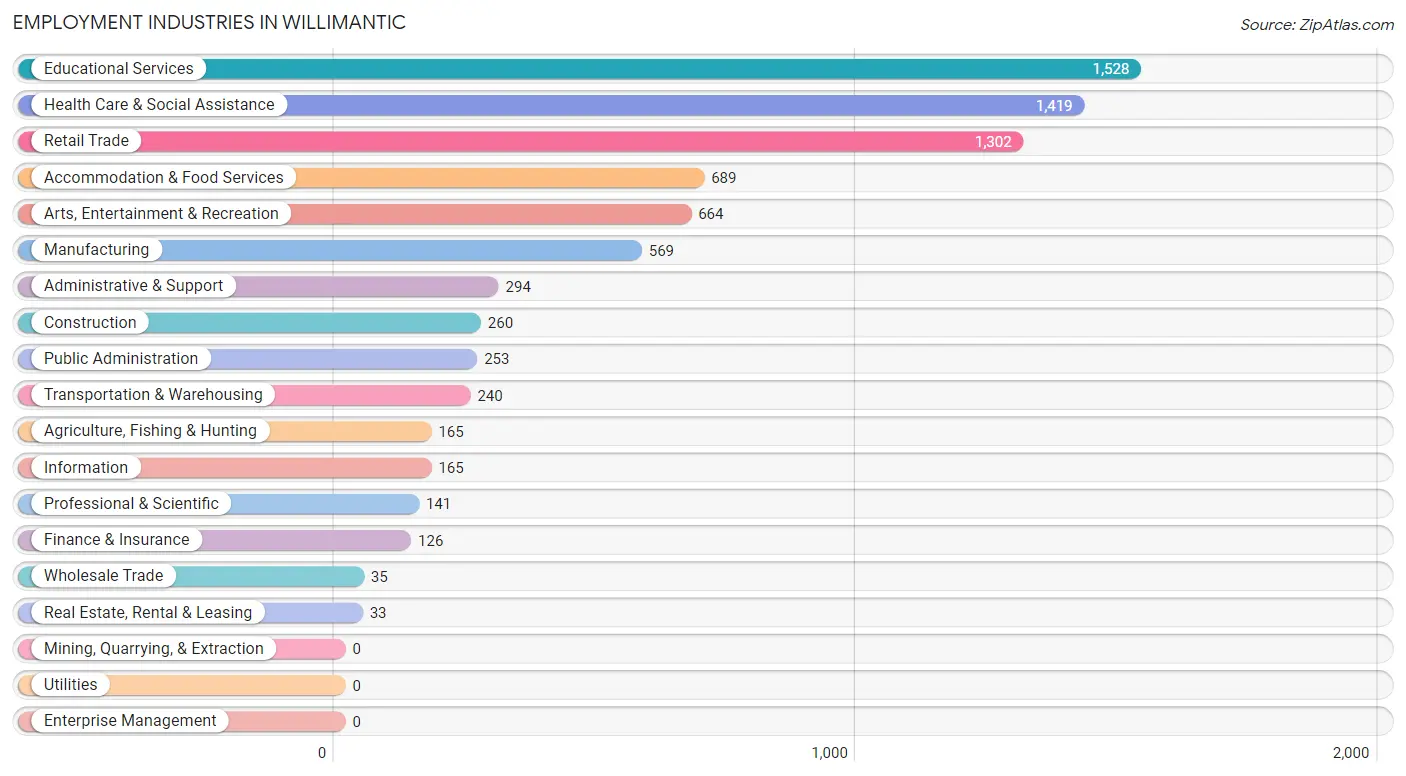
Employment Industries in Willimantic
The major employment industries in Willimantic include Educational Services (1,528 | 18.7%), Health Care & Social Assistance (1,419 | 17.4%), Retail Trade (1,302 | 15.9%), Accommodation & Food Services (689 | 8.4%), and Arts, Entertainment & Recreation (664 | 8.1%).
Employment Industries by Sex in Willimantic
The Willimantic industries that see more men than women are Construction (96.2%), Transportation & Warehousing (81.2%), and Information (81.2%), whereas the industries that tend to have a higher number of women are Health Care & Social Assistance (84.9%), Agriculture, Fishing & Hunting (72.1%), and Public Administration (61.3%).
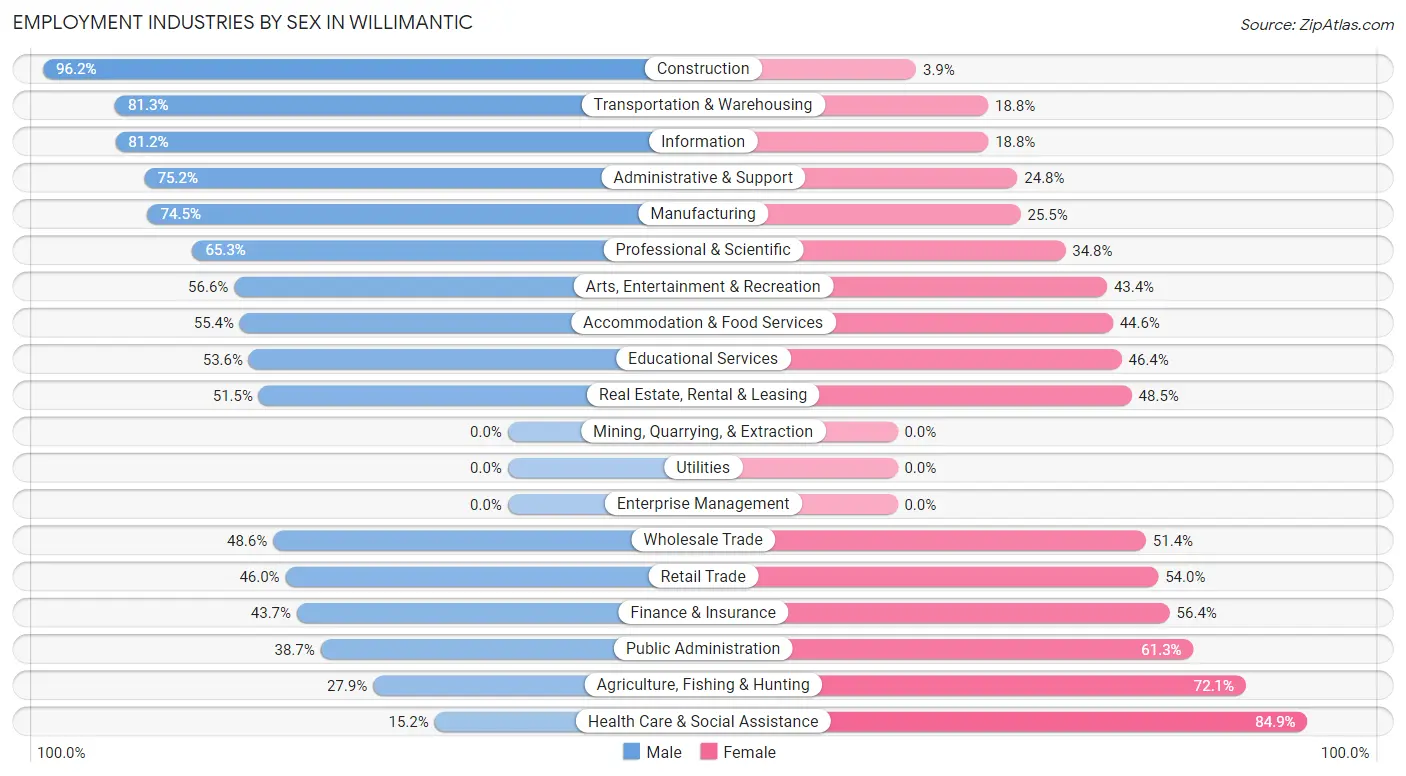
| Industry | Male | Female |
| Agriculture, Fishing & Hunting | 46 (27.9%) | 119 (72.1%) |
| Mining, Quarrying, & Extraction | 0 (0.0%) | 0 (0.0%) |
| Construction | 250 (96.2%) | 10 (3.8%) |
| Manufacturing | 424 (74.5%) | 145 (25.5%) |
| Wholesale Trade | 17 (48.6%) | 18 (51.4%) |
| Retail Trade | 599 (46.0%) | 703 (54.0%) |
| Transportation & Warehousing | 195 (81.2%) | 45 (18.8%) |
| Utilities | 0 (0.0%) | 0 (0.0%) |
| Information | 134 (81.2%) | 31 (18.8%) |
| Finance & Insurance | 55 (43.6%) | 71 (56.4%) |
| Real Estate, Rental & Leasing | 17 (51.5%) | 16 (48.5%) |
| Professional & Scientific | 92 (65.2%) | 49 (34.7%) |
| Enterprise Management | 0 (0.0%) | 0 (0.0%) |
| Administrative & Support | 221 (75.2%) | 73 (24.8%) |
| Educational Services | 819 (53.6%) | 709 (46.4%) |
| Health Care & Social Assistance | 215 (15.1%) | 1,204 (84.9%) |
| Arts, Entertainment & Recreation | 376 (56.6%) | 288 (43.4%) |
| Accommodation & Food Services | 382 (55.4%) | 307 (44.6%) |
| Public Administration | 98 (38.7%) | 155 (61.3%) |
| Total | 4,073 (49.8%) | 4,102 (50.2%) |
Education in Willimantic
School Enrollment in Willimantic
The most common levels of schooling among the 7,490 students in Willimantic are college / undergraduate (4,483 | 59.9%), high school (916 | 12.2%), and middle school (780 | 10.4%).
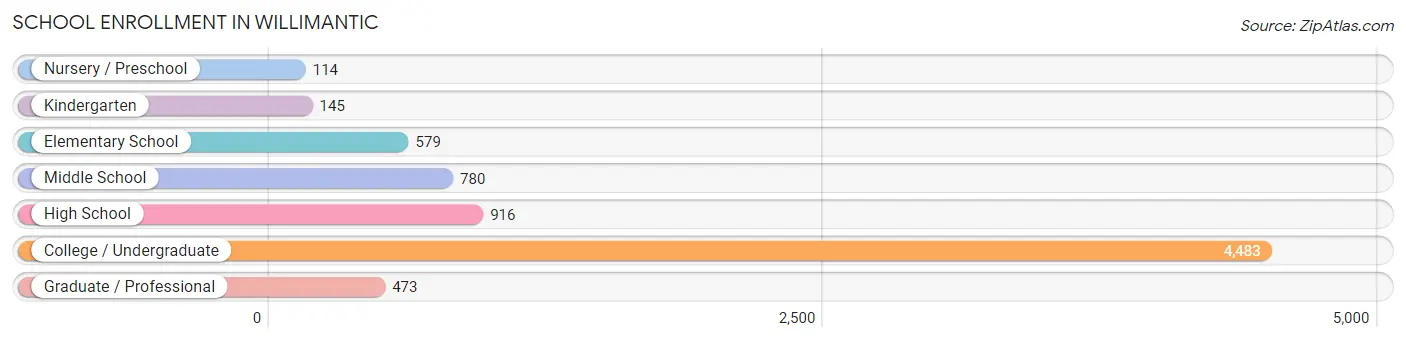
| School Level | # Students | % Students |
| Nursery / Preschool | 114 | 1.5% |
| Kindergarten | 145 | 1.9% |
| Elementary School | 579 | 7.7% |
| Middle School | 780 | 10.4% |
| High School | 916 | 12.2% |
| College / Undergraduate | 4,483 | 59.9% |
| Graduate / Professional | 473 | 6.3% |
| Total | 7,490 | 100.0% |
School Enrollment by Age by Funding Source in Willimantic
Out of a total of 7,490 students who are enrolled in schools in Willimantic, 382 (5.1%) attend a private institution, while the remaining 7,108 (94.9%) are enrolled in public schools. The age group of 35 years and over has the highest likelihood of being enrolled in private schools, with 58 (35.6% in the age bracket) enrolled. Conversely, the age group of 3 to 4 year olds has the lowest likelihood of being enrolled in a private school, with 107 (100.0% in the age bracket) attending a public institution.
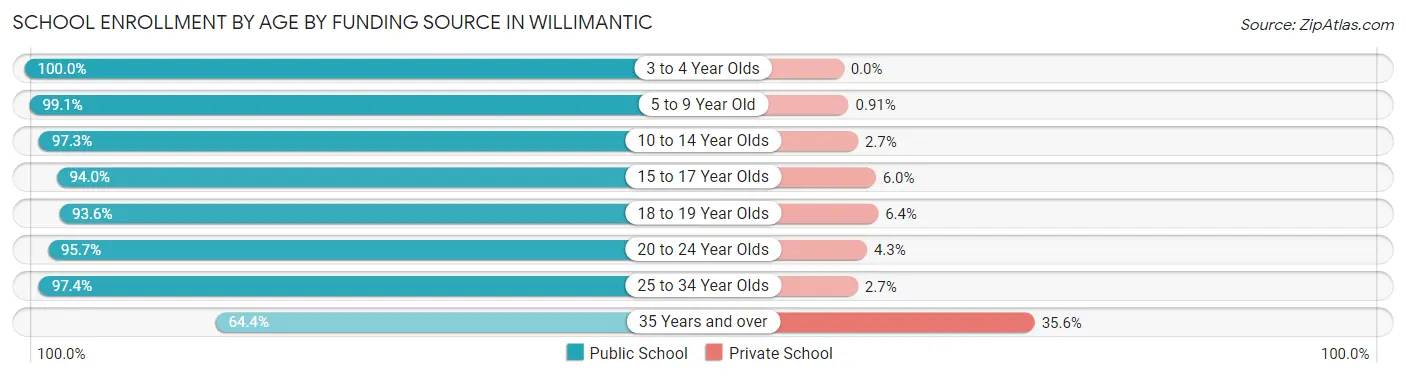
| Age Bracket | Public School | Private School |
| 3 to 4 Year Olds | 107 (100.0%) | 0 (0.0%) |
| 5 to 9 Year Old | 654 (99.1%) | 6 (0.9%) |
| 10 to 14 Year Olds | 878 (97.3%) | 24 (2.7%) |
| 15 to 17 Year Olds | 708 (94.0%) | 45 (6.0%) |
| 18 to 19 Year Olds | 1,835 (93.6%) | 126 (6.4%) |
| 20 to 24 Year Olds | 2,383 (95.7%) | 108 (4.3%) |
| 25 to 34 Year Olds | 441 (97.4%) | 12 (2.6%) |
| 35 Years and over | 105 (64.4%) | 58 (35.6%) |
| Total | 7,108 (94.9%) | 382 (5.1%) |
Educational Attainment by Field of Study in Willimantic
Social sciences (349 | 12.2%), psychology (309 | 10.8%), science & technology (301 | 10.5%), liberal arts & history (281 | 9.9%), and business (255 | 8.9%) are the most common fields of study among 2,852 individuals in Willimantic who have obtained a bachelor's degree or higher.
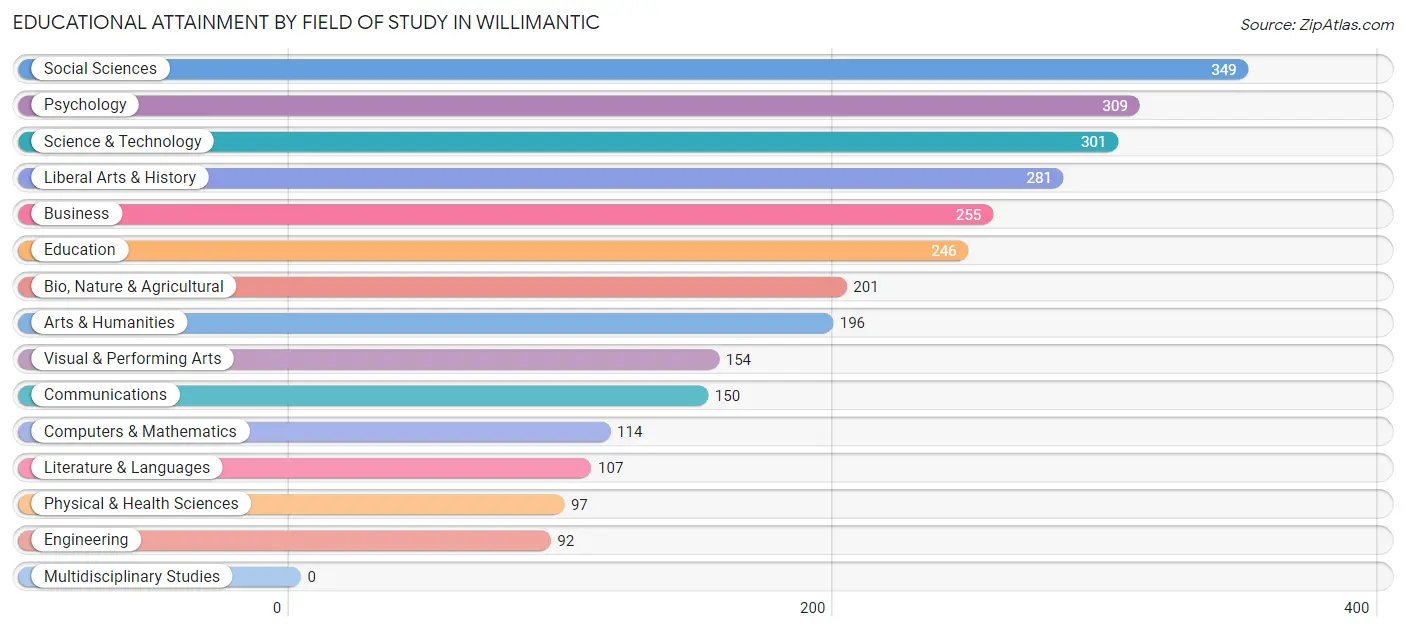
| Field of Study | # Graduates | % Graduates |
| Computers & Mathematics | 114 | 4.0% |
| Bio, Nature & Agricultural | 201 | 7.0% |
| Physical & Health Sciences | 97 | 3.4% |
| Psychology | 309 | 10.8% |
| Social Sciences | 349 | 12.2% |
| Engineering | 92 | 3.2% |
| Multidisciplinary Studies | 0 | 0.0% |
| Science & Technology | 301 | 10.5% |
| Business | 255 | 8.9% |
| Education | 246 | 8.6% |
| Literature & Languages | 107 | 3.7% |
| Liberal Arts & History | 281 | 9.9% |
| Visual & Performing Arts | 154 | 5.4% |
| Communications | 150 | 5.3% |
| Arts & Humanities | 196 | 6.9% |
| Total | 2,852 | 100.0% |
Transportation & Commute in Willimantic
Vehicle Availability by Sex in Willimantic
The most prevalent vehicle ownership categories in Willimantic are males with 2 vehicles (1,173, accounting for 36.9%) and females with 2 vehicles (1,207, making up 37.7%).
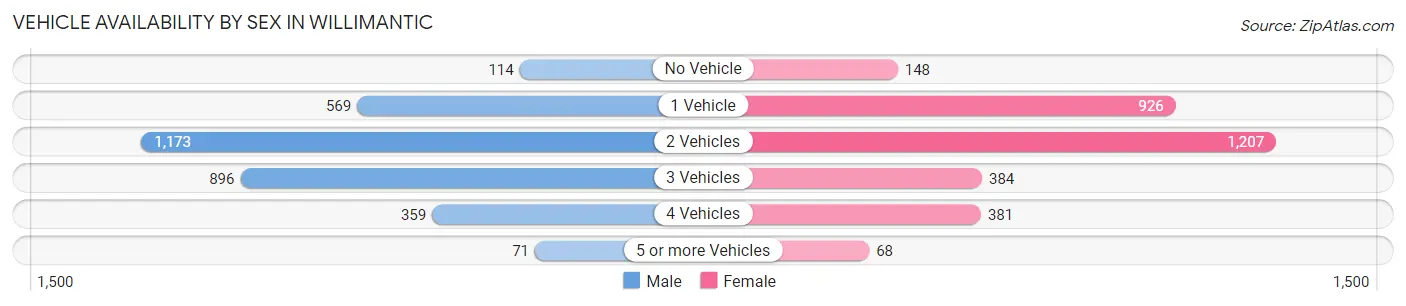
| Vehicles Available | Male | Female |
| No Vehicle | 114 (3.6%) | 148 (4.8%) |
| 1 Vehicle | 569 (17.9%) | 926 (29.7%) |
| 2 Vehicles | 1,173 (36.9%) | 1,207 (38.8%) |
| 3 Vehicles | 896 (28.2%) | 384 (12.3%) |
| 4 Vehicles | 359 (11.3%) | 381 (12.2%) |
| 5 or more Vehicles | 71 (2.2%) | 68 (2.2%) |
| Total | 3,182 (100.0%) | 3,114 (100.0%) |
Commute Time in Willimantic
The most frequently occuring commute durations in Willimantic are 5 to 9 minutes (1,276 commuters, 18.3%), 10 to 14 minutes (1,146 commuters, 16.5%), and 30 to 34 minutes (791 commuters, 11.4%).
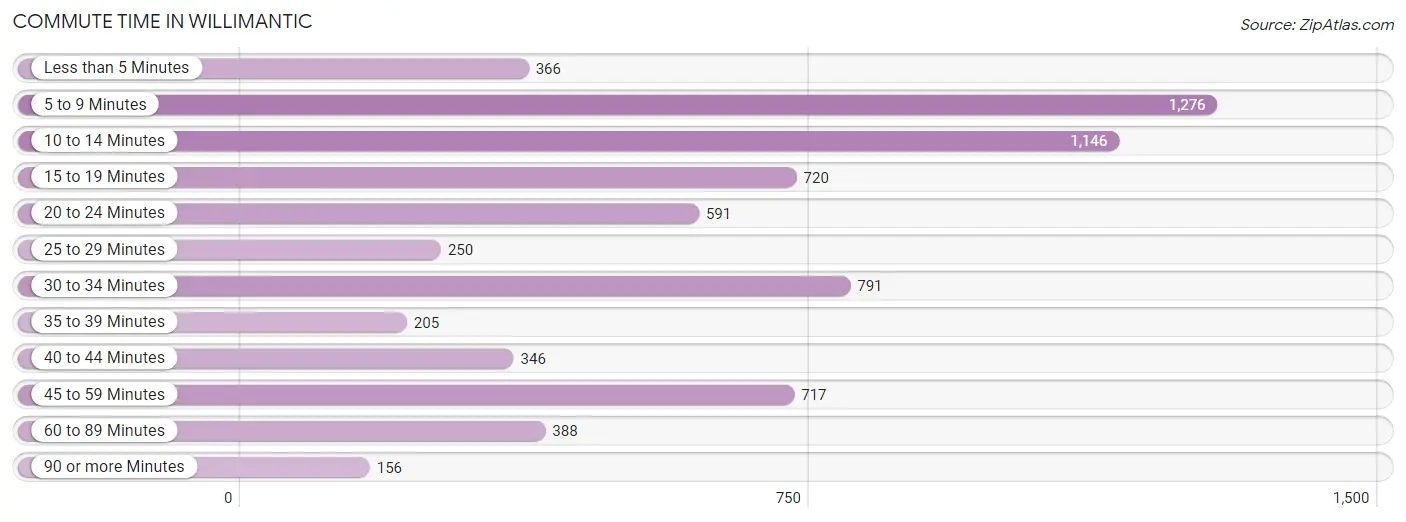
| Commute Time | # Commuters | % Commuters |
| Less than 5 Minutes | 366 | 5.3% |
| 5 to 9 Minutes | 1,276 | 18.3% |
| 10 to 14 Minutes | 1,146 | 16.5% |
| 15 to 19 Minutes | 720 | 10.4% |
| 20 to 24 Minutes | 591 | 8.5% |
| 25 to 29 Minutes | 250 | 3.6% |
| 30 to 34 Minutes | 791 | 11.4% |
| 35 to 39 Minutes | 205 | 2.9% |
| 40 to 44 Minutes | 346 | 5.0% |
| 45 to 59 Minutes | 717 | 10.3% |
| 60 to 89 Minutes | 388 | 5.6% |
| 90 or more Minutes | 156 | 2.2% |
Commute Time by Sex in Willimantic
The most common commute times in Willimantic are 10 to 14 minutes (631 commuters, 17.5%) for males and 5 to 9 minutes (669 commuters, 19.9%) for females.
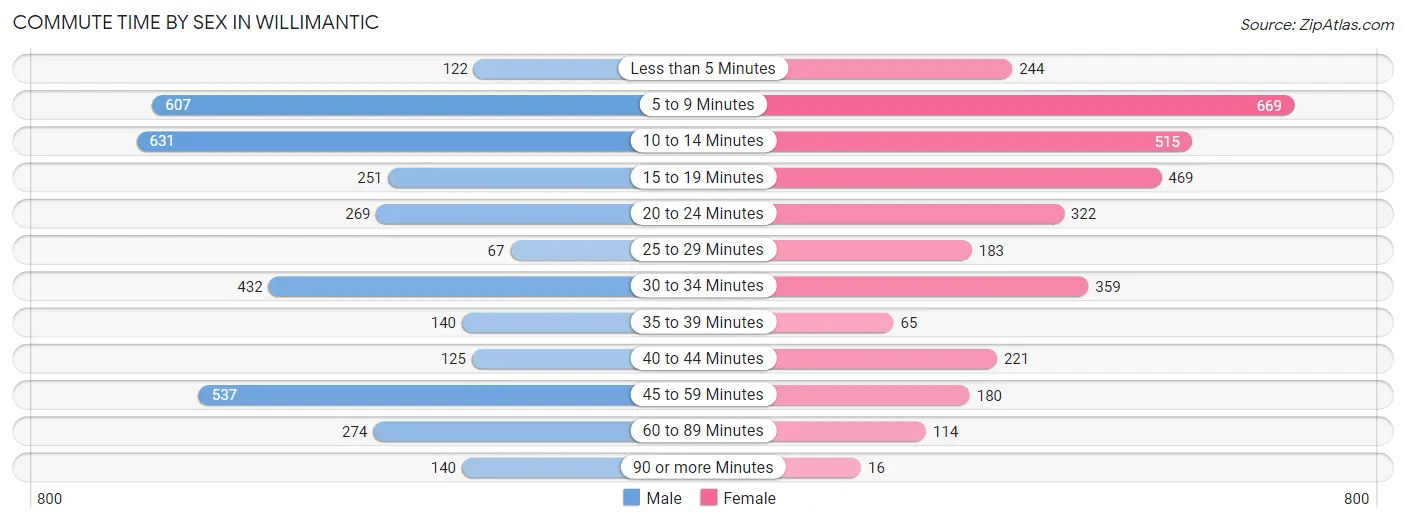
| Commute Time | Male | Female |
| Less than 5 Minutes | 122 (3.4%) | 244 (7.3%) |
| 5 to 9 Minutes | 607 (16.9%) | 669 (19.9%) |
| 10 to 14 Minutes | 631 (17.5%) | 515 (15.3%) |
| 15 to 19 Minutes | 251 (7.0%) | 469 (14.0%) |
| 20 to 24 Minutes | 269 (7.5%) | 322 (9.6%) |
| 25 to 29 Minutes | 67 (1.9%) | 183 (5.4%) |
| 30 to 34 Minutes | 432 (12.0%) | 359 (10.7%) |
| 35 to 39 Minutes | 140 (3.9%) | 65 (1.9%) |
| 40 to 44 Minutes | 125 (3.5%) | 221 (6.6%) |
| 45 to 59 Minutes | 537 (14.9%) | 180 (5.4%) |
| 60 to 89 Minutes | 274 (7.6%) | 114 (3.4%) |
| 90 or more Minutes | 140 (3.9%) | 16 (0.5%) |
Time of Departure to Work by Sex in Willimantic
The most frequent times of departure to work in Willimantic are 12:00 PM to 3:59 PM (794, 22.1%) for males and 7:30 AM to 7:59 AM (527, 15.7%) for females.
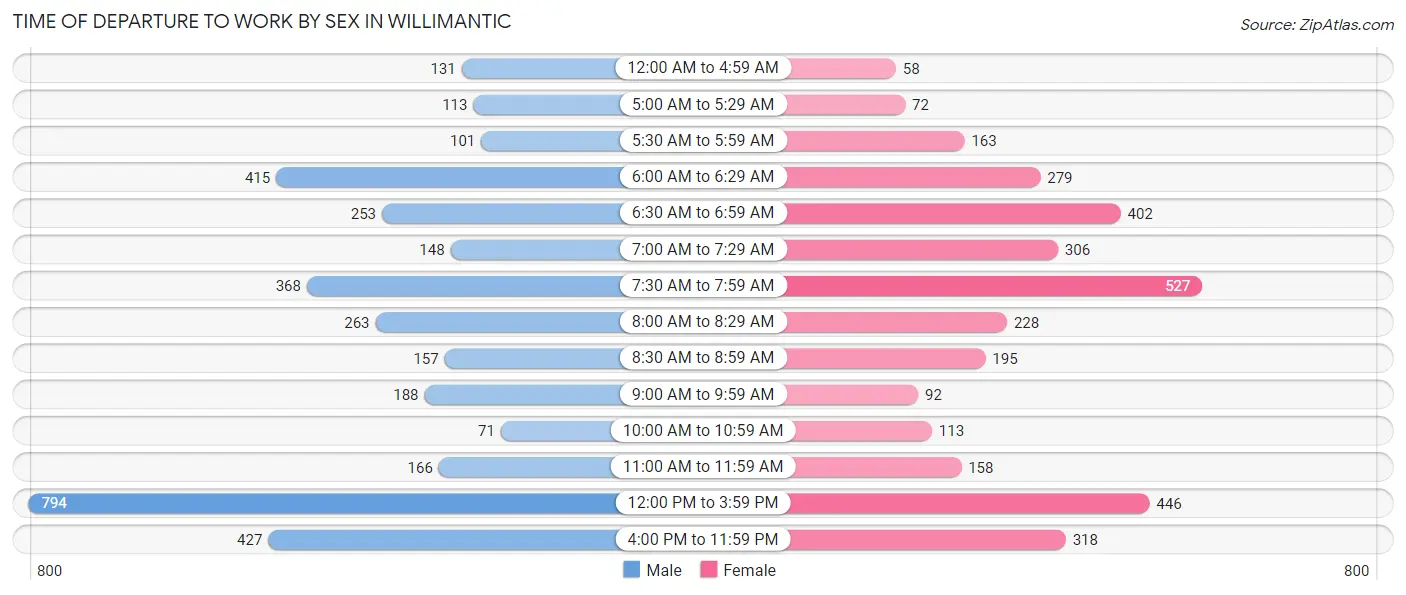
| Time of Departure | Male | Female |
| 12:00 AM to 4:59 AM | 131 (3.6%) | 58 (1.7%) |
| 5:00 AM to 5:29 AM | 113 (3.1%) | 72 (2.1%) |
| 5:30 AM to 5:59 AM | 101 (2.8%) | 163 (4.9%) |
| 6:00 AM to 6:29 AM | 415 (11.5%) | 279 (8.3%) |
| 6:30 AM to 6:59 AM | 253 (7.0%) | 402 (12.0%) |
| 7:00 AM to 7:29 AM | 148 (4.1%) | 306 (9.1%) |
| 7:30 AM to 7:59 AM | 368 (10.2%) | 527 (15.7%) |
| 8:00 AM to 8:29 AM | 263 (7.3%) | 228 (6.8%) |
| 8:30 AM to 8:59 AM | 157 (4.4%) | 195 (5.8%) |
| 9:00 AM to 9:59 AM | 188 (5.2%) | 92 (2.7%) |
| 10:00 AM to 10:59 AM | 71 (2.0%) | 113 (3.4%) |
| 11:00 AM to 11:59 AM | 166 (4.6%) | 158 (4.7%) |
| 12:00 PM to 3:59 PM | 794 (22.1%) | 446 (13.3%) |
| 4:00 PM to 11:59 PM | 427 (11.9%) | 318 (9.5%) |
| Total | 3,595 (100.0%) | 3,357 (100.0%) |
Housing Occupancy in Willimantic
Occupancy by Ownership in Willimantic
Of the total 6,379 dwellings in Willimantic, owner-occupied units account for 2,500 (39.2%), while renter-occupied units make up 3,879 (60.8%).
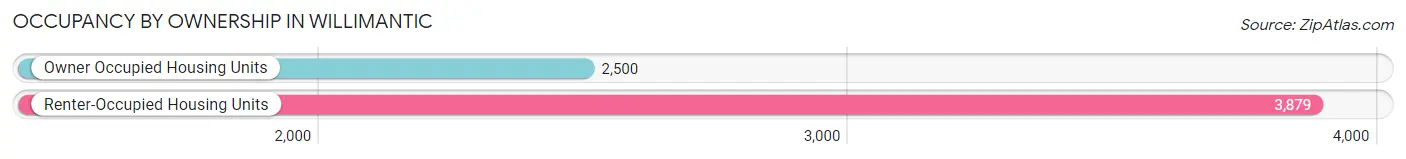
| Occupancy | # Housing Units | % Housing Units |
| Owner Occupied Housing Units | 2,500 | 39.2% |
| Renter-Occupied Housing Units | 3,879 | 60.8% |
| Total Occupied Housing Units | 6,379 | 100.0% |
Occupancy by Household Size in Willimantic
| Household Size | # Housing Units | % Housing Units |
| 1-Person Household | 2,364 | 37.1% |
| 2-Person Household | 1,714 | 26.9% |
| 3-Person Household | 1,115 | 17.5% |
| 4+ Person Household | 1,186 | 18.6% |
| Total Housing Units | 6,379 | 100.0% |
Occupancy by Ownership by Household Size in Willimantic
| Household Size | Owner-occupied | Renter-occupied |
| 1-Person Household | 699 (29.6%) | 1,665 (70.4%) |
| 2-Person Household | 967 (56.4%) | 747 (43.6%) |
| 3-Person Household | 306 (27.4%) | 809 (72.6%) |
| 4+ Person Household | 528 (44.5%) | 658 (55.5%) |
| Total Housing Units | 2,500 (39.2%) | 3,879 (60.8%) |
Occupancy by Educational Attainment in Willimantic
| Household Size | Owner-occupied | Renter-occupied |
| Less than High School | 80 (7.9%) | 935 (92.1%) |
| High School Diploma | 765 (37.1%) | 1,295 (62.9%) |
| College/Associate Degree | 764 (44.3%) | 962 (55.7%) |
| Bachelor's Degree or higher | 891 (56.5%) | 687 (43.5%) |
Occupancy by Age of Householder in Willimantic
| Age Bracket | # Households | % Households |
| Under 35 Years | 1,405 | 22.0% |
| 35 to 44 Years | 1,176 | 18.4% |
| 45 to 54 Years | 990 | 15.5% |
| 55 to 64 Years | 1,404 | 22.0% |
| 65 to 74 Years | 798 | 12.5% |
| 75 to 84 Years | 412 | 6.5% |
| 85 Years and Over | 194 | 3.0% |
| Total | 6,379 | 100.0% |
Housing Finances in Willimantic
Median Income by Occupancy in Willimantic
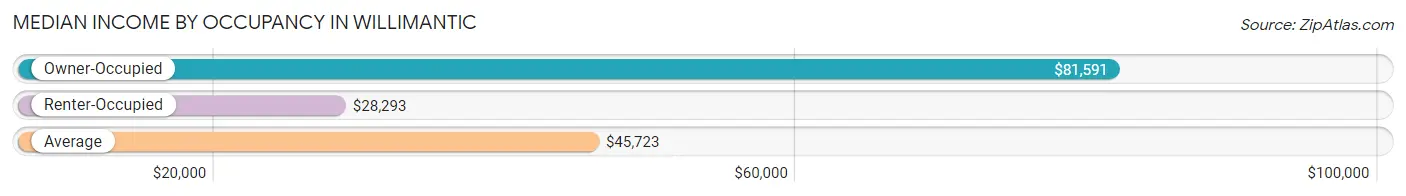
| Occupancy Type | # Households | Median Income |
| Owner-Occupied | 2,500 (39.2%) | $81,591 |
| Renter-Occupied | 3,879 (60.8%) | $28,293 |
| Average | 6,379 (100.0%) | $45,723 |
Occupancy by Householder Income Bracket in Willimantic
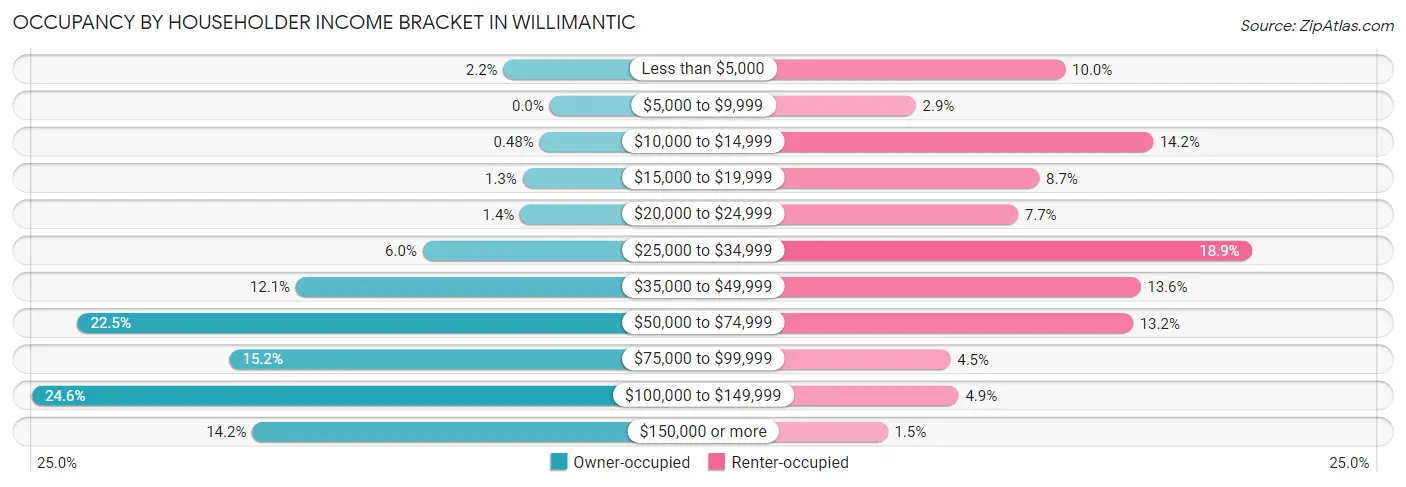
| Income Bracket | Owner-occupied | Renter-occupied |
| Less than $5,000 | 55 (2.2%) | 387 (10.0%) |
| $5,000 to $9,999 | 0 (0.0%) | 111 (2.9%) |
| $10,000 to $14,999 | 12 (0.5%) | 549 (14.1%) |
| $15,000 to $19,999 | 32 (1.3%) | 339 (8.7%) |
| $20,000 to $24,999 | 35 (1.4%) | 300 (7.7%) |
| $25,000 to $34,999 | 151 (6.0%) | 731 (18.9%) |
| $35,000 to $49,999 | 302 (12.1%) | 526 (13.6%) |
| $50,000 to $74,999 | 562 (22.5%) | 512 (13.2%) |
| $75,000 to $99,999 | 381 (15.2%) | 175 (4.5%) |
| $100,000 to $149,999 | 616 (24.6%) | 190 (4.9%) |
| $150,000 or more | 354 (14.2%) | 59 (1.5%) |
| Total | 2,500 (100.0%) | 3,879 (100.0%) |
Monthly Housing Cost Tiers in Willimantic
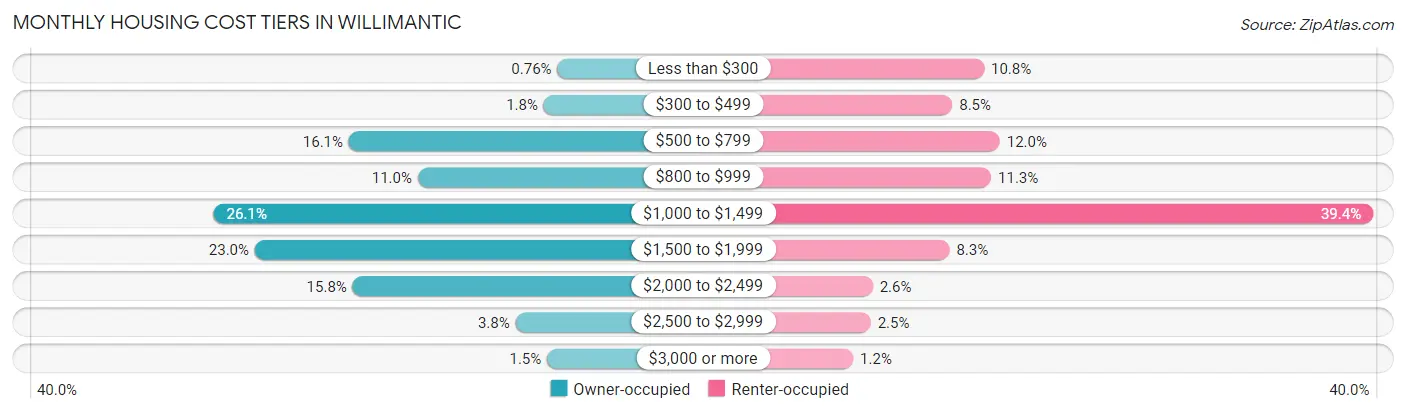
| Monthly Cost | Owner-occupied | Renter-occupied |
| Less than $300 | 19 (0.8%) | 419 (10.8%) |
| $300 to $499 | 44 (1.8%) | 328 (8.5%) |
| $500 to $799 | 403 (16.1%) | 464 (12.0%) |
| $800 to $999 | 276 (11.0%) | 439 (11.3%) |
| $1,000 to $1,499 | 652 (26.1%) | 1,530 (39.4%) |
| $1,500 to $1,999 | 576 (23.0%) | 320 (8.3%) |
| $2,000 to $2,499 | 396 (15.8%) | 101 (2.6%) |
| $2,500 to $2,999 | 96 (3.8%) | 95 (2.5%) |
| $3,000 or more | 38 (1.5%) | 45 (1.2%) |
| Total | 2,500 (100.0%) | 3,879 (100.0%) |
Physical Housing Characteristics in Willimantic
Housing Structures in Willimantic
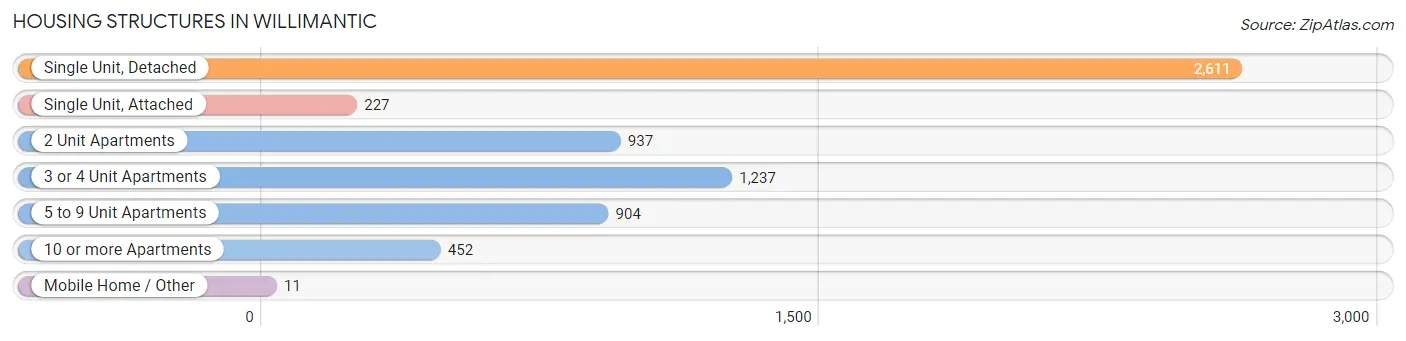
| Structure Type | # Housing Units | % Housing Units |
| Single Unit, Detached | 2,611 | 40.9% |
| Single Unit, Attached | 227 | 3.6% |
| 2 Unit Apartments | 937 | 14.7% |
| 3 or 4 Unit Apartments | 1,237 | 19.4% |
| 5 to 9 Unit Apartments | 904 | 14.2% |
| 10 or more Apartments | 452 | 7.1% |
| Mobile Home / Other | 11 | 0.2% |
| Total | 6,379 | 100.0% |
Housing Structures by Occupancy in Willimantic
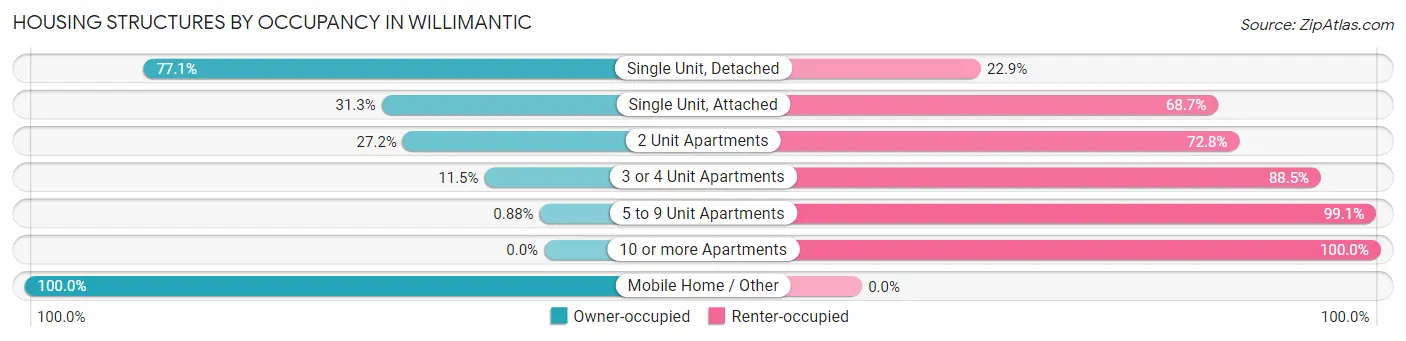
| Structure Type | Owner-occupied | Renter-occupied |
| Single Unit, Detached | 2,013 (77.1%) | 598 (22.9%) |
| Single Unit, Attached | 71 (31.3%) | 156 (68.7%) |
| 2 Unit Apartments | 255 (27.2%) | 682 (72.8%) |
| 3 or 4 Unit Apartments | 142 (11.5%) | 1,095 (88.5%) |
| 5 to 9 Unit Apartments | 8 (0.9%) | 896 (99.1%) |
| 10 or more Apartments | 0 (0.0%) | 452 (100.0%) |
| Mobile Home / Other | 11 (100.0%) | 0 (0.0%) |
| Total | 2,500 (39.2%) | 3,879 (60.8%) |
Housing Structures by Number of Rooms in Willimantic
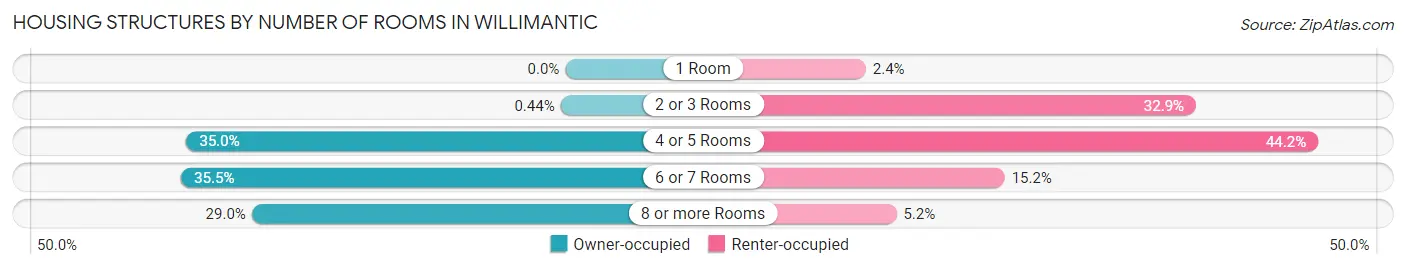
| Number of Rooms | Owner-occupied | Renter-occupied |
| 1 Room | 0 (0.0%) | 93 (2.4%) |
| 2 or 3 Rooms | 11 (0.4%) | 1,277 (32.9%) |
| 4 or 5 Rooms | 876 (35.0%) | 1,715 (44.2%) |
| 6 or 7 Rooms | 888 (35.5%) | 591 (15.2%) |
| 8 or more Rooms | 725 (29.0%) | 203 (5.2%) |
| Total | 2,500 (100.0%) | 3,879 (100.0%) |
Housing Structure by Heating Type in Willimantic
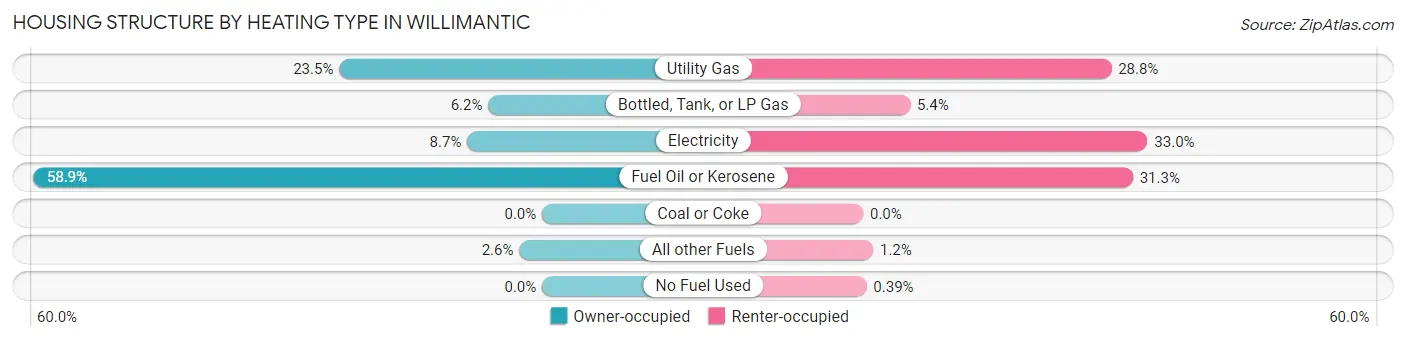
| Heating Type | Owner-occupied | Renter-occupied |
| Utility Gas | 588 (23.5%) | 1,116 (28.8%) |
| Bottled, Tank, or LP Gas | 156 (6.2%) | 211 (5.4%) |
| Electricity | 217 (8.7%) | 1,279 (33.0%) |
| Fuel Oil or Kerosene | 1,473 (58.9%) | 1,213 (31.3%) |
| Coal or Coke | 0 (0.0%) | 0 (0.0%) |
| All other Fuels | 66 (2.6%) | 45 (1.2%) |
| No Fuel Used | 0 (0.0%) | 15 (0.4%) |
| Total | 2,500 (100.0%) | 3,879 (100.0%) |
Household Vehicle Usage in Willimantic
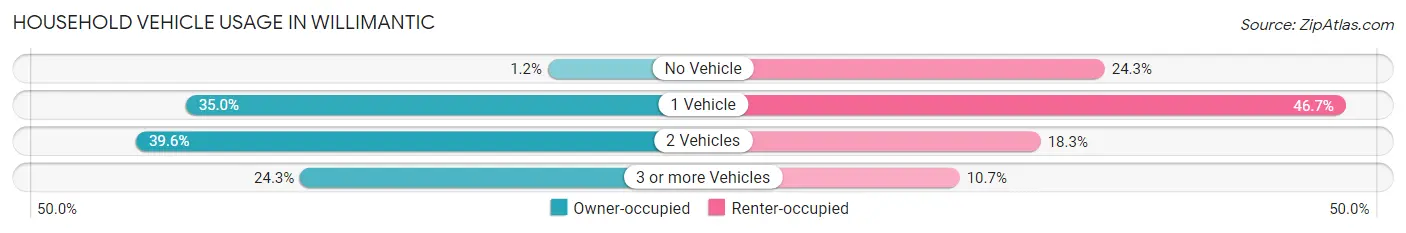
| Vehicles per Household | Owner-occupied | Renter-occupied |
| No Vehicle | 29 (1.2%) | 941 (24.3%) |
| 1 Vehicle | 874 (35.0%) | 1,813 (46.7%) |
| 2 Vehicles | 990 (39.6%) | 709 (18.3%) |
| 3 or more Vehicles | 607 (24.3%) | 416 (10.7%) |
| Total | 2,500 (100.0%) | 3,879 (100.0%) |
Real Estate & Mortgages in Willimantic
Real Estate and Mortgage Overview in Willimantic
| Characteristic | Without Mortgage | With Mortgage |
| Housing Units | 978 | 1,522 |
| Median Property Value | $173,600 | $172,700 |
| Median Household Income | $80,943 | $236 |
| Monthly Housing Costs | $857 | $38 |
| Real Estate Taxes | $4,838 | $8 |
Property Value by Mortgage Status in Willimantic
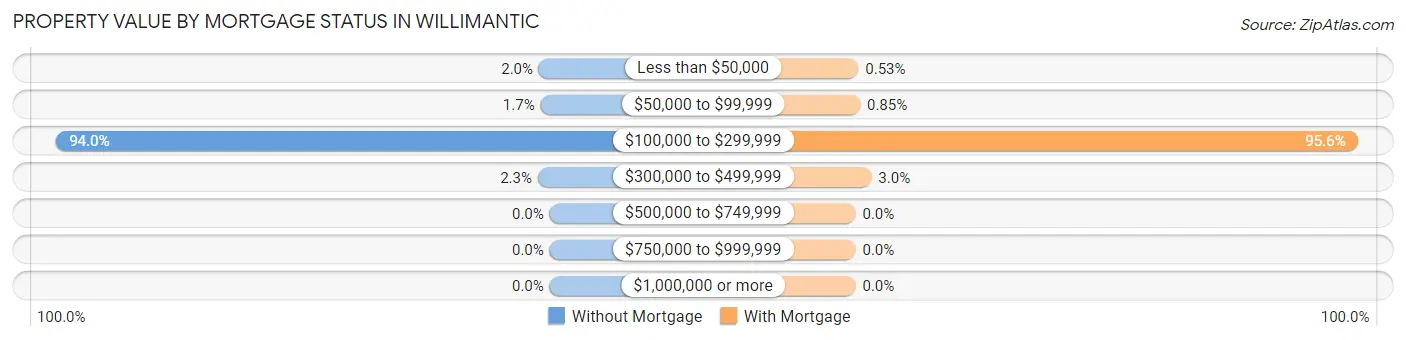
| Property Value | Without Mortgage | With Mortgage |
| Less than $50,000 | 20 (2.0%) | 8 (0.5%) |
| $50,000 to $99,999 | 17 (1.7%) | 13 (0.9%) |
| $100,000 to $299,999 | 919 (94.0%) | 1,455 (95.6%) |
| $300,000 to $499,999 | 22 (2.2%) | 46 (3.0%) |
| $500,000 to $749,999 | 0 (0.0%) | 0 (0.0%) |
| $750,000 to $999,999 | 0 (0.0%) | 0 (0.0%) |
| $1,000,000 or more | 0 (0.0%) | 0 (0.0%) |
| Total | 978 (100.0%) | 1,522 (100.0%) |
Household Income by Mortgage Status in Willimantic
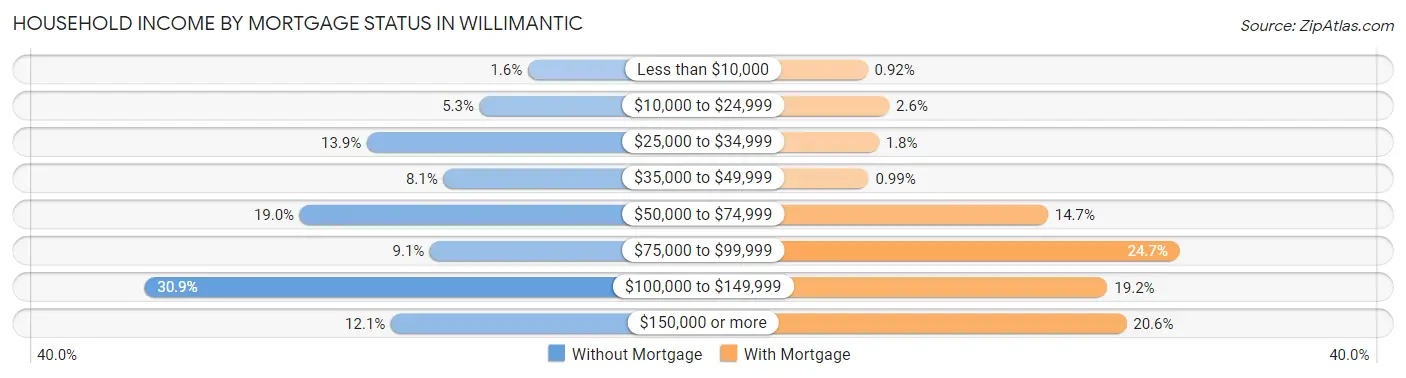
| Household Income | Without Mortgage | With Mortgage |
| Less than $10,000 | 16 (1.6%) | 14 (0.9%) |
| $10,000 to $24,999 | 52 (5.3%) | 39 (2.6%) |
| $25,000 to $34,999 | 136 (13.9%) | 27 (1.8%) |
| $35,000 to $49,999 | 79 (8.1%) | 15 (1.0%) |
| $50,000 to $74,999 | 186 (19.0%) | 223 (14.6%) |
| $75,000 to $99,999 | 89 (9.1%) | 376 (24.7%) |
| $100,000 to $149,999 | 302 (30.9%) | 292 (19.2%) |
| $150,000 or more | 118 (12.1%) | 314 (20.6%) |
| Total | 978 (100.0%) | 1,522 (100.0%) |
Property Value to Household Income Ratio in Willimantic
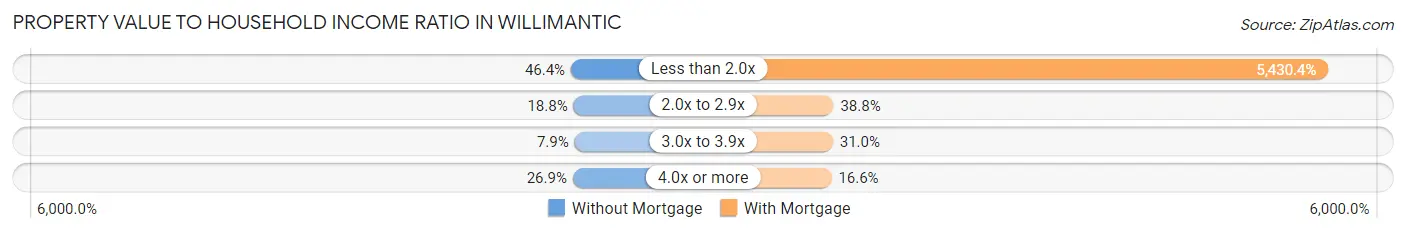
| Value-to-Income Ratio | Without Mortgage | With Mortgage |
| Less than 2.0x | 454 (46.4%) | 82,651 (5,430.4%) |
| 2.0x to 2.9x | 184 (18.8%) | 590 (38.8%) |
| 3.0x to 3.9x | 77 (7.9%) | 471 (30.9%) |
| 4.0x or more | 263 (26.9%) | 253 (16.6%) |
| Total | 978 (100.0%) | 1,522 (100.0%) |
Real Estate Taxes by Mortgage Status in Willimantic
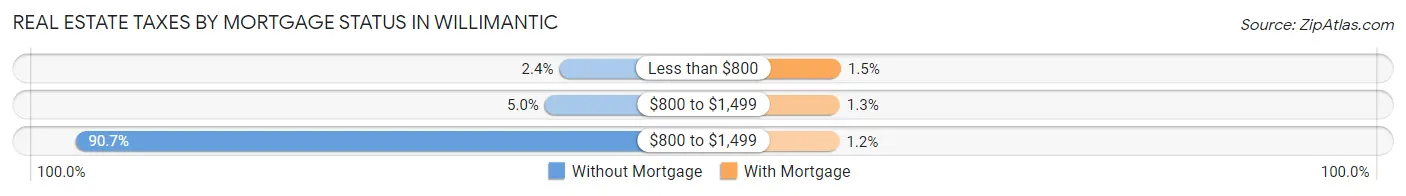
| Property Taxes | Without Mortgage | With Mortgage |
| Less than $800 | 23 (2.4%) | 22 (1.5%) |
| $800 to $1,499 | 49 (5.0%) | 19 (1.3%) |
| $800 to $1,499 | 887 (90.7%) | 18 (1.2%) |
| Total | 978 (100.0%) | 1,522 (100.0%) |
Health & Disability in Willimantic
Health Insurance Coverage by Age in Willimantic
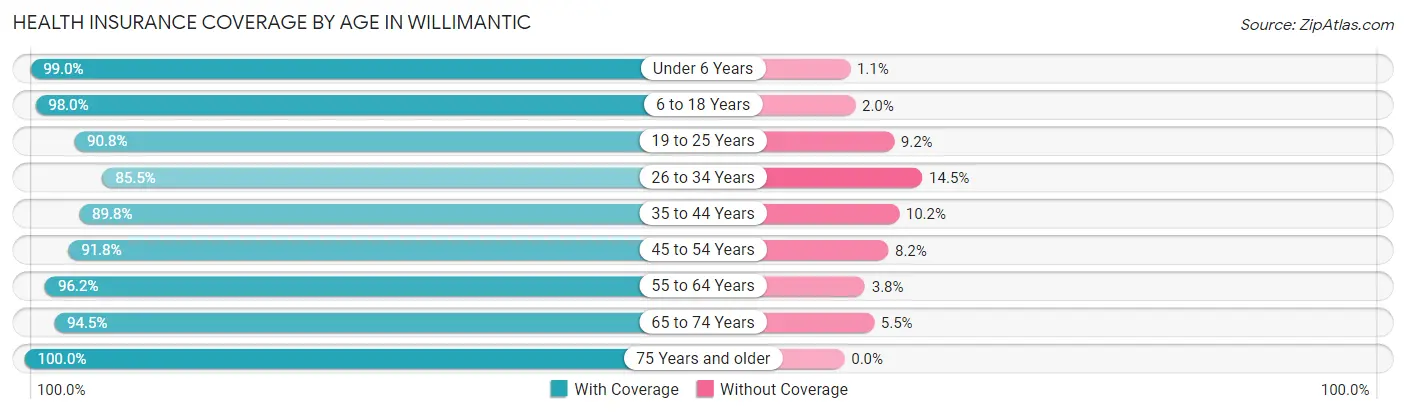
| Age Bracket | With Coverage | Without Coverage |
| Under 6 Years | 470 (99.0%) | 5 (1.1%) |
| 6 to 18 Years | 3,093 (98.0%) | 63 (2.0%) |
| 19 to 25 Years | 3,949 (90.8%) | 402 (9.2%) |
| 26 to 34 Years | 1,460 (85.5%) | 248 (14.5%) |
| 35 to 44 Years | 1,830 (89.8%) | 207 (10.2%) |
| 45 to 54 Years | 1,519 (91.8%) | 135 (8.2%) |
| 55 to 64 Years | 2,037 (96.2%) | 81 (3.8%) |
| 65 to 74 Years | 1,166 (94.5%) | 68 (5.5%) |
| 75 Years and older | 847 (100.0%) | 0 (0.0%) |
| Total | 16,371 (93.1%) | 1,209 (6.9%) |
Health Insurance Coverage by Citizenship Status in Willimantic
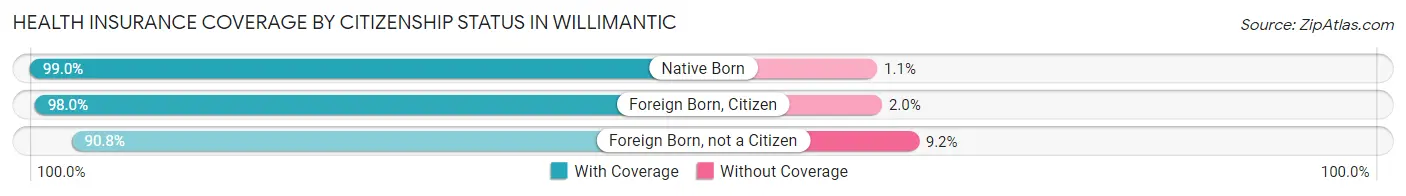
| Citizenship Status | With Coverage | Without Coverage |
| Native Born | 470 (99.0%) | 5 (1.1%) |
| Foreign Born, Citizen | 3,093 (98.0%) | 63 (2.0%) |
| Foreign Born, not a Citizen | 3,949 (90.8%) | 402 (9.2%) |
Health Insurance Coverage by Household Income in Willimantic
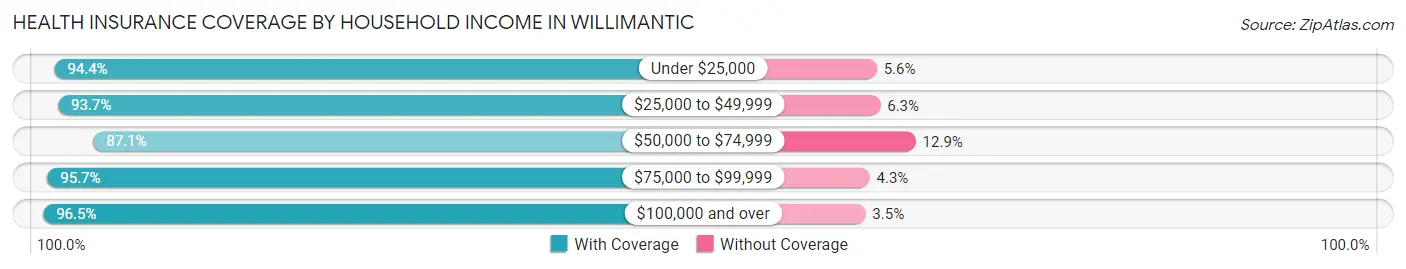
| Household Income | With Coverage | Without Coverage |
| Under $25,000 | 3,019 (94.4%) | 179 (5.6%) |
| $25,000 to $49,999 | 3,585 (93.7%) | 240 (6.3%) |
| $50,000 to $74,999 | 2,045 (87.1%) | 303 (12.9%) |
| $75,000 to $99,999 | 1,614 (95.7%) | 72 (4.3%) |
| $100,000 and over | 3,209 (96.5%) | 116 (3.5%) |
Public vs Private Health Insurance Coverage by Age in Willimantic
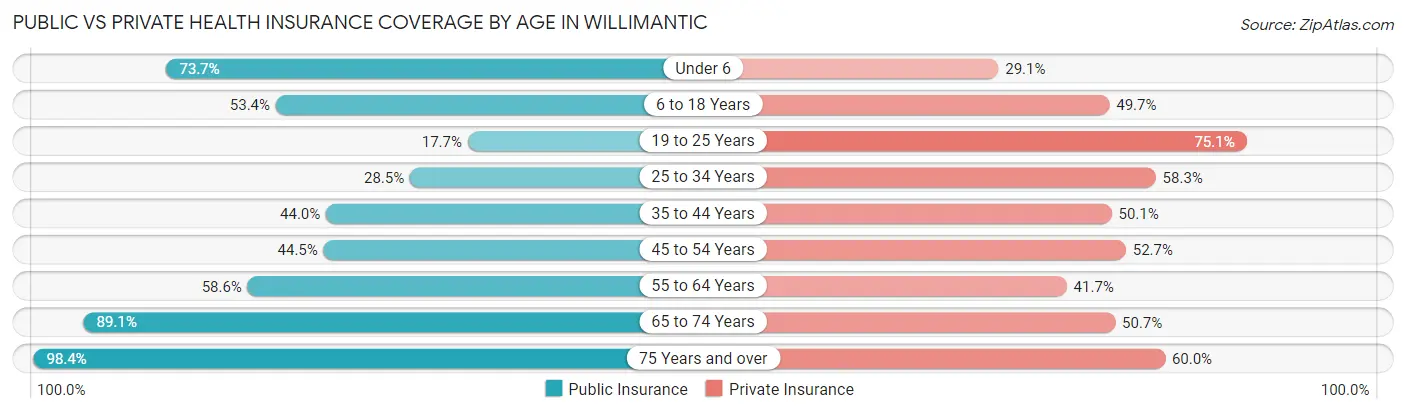
| Age Bracket | Public Insurance | Private Insurance |
| Under 6 | 350 (73.7%) | 138 (29.0%) |
| 6 to 18 Years | 1,684 (53.4%) | 1,567 (49.6%) |
| 19 to 25 Years | 772 (17.7%) | 3,268 (75.1%) |
| 25 to 34 Years | 486 (28.4%) | 995 (58.3%) |
| 35 to 44 Years | 897 (44.0%) | 1,020 (50.1%) |
| 45 to 54 Years | 736 (44.5%) | 872 (52.7%) |
| 55 to 64 Years | 1,241 (58.6%) | 884 (41.7%) |
| 65 to 74 Years | 1,099 (89.1%) | 626 (50.7%) |
| 75 Years and over | 833 (98.4%) | 508 (60.0%) |
| Total | 8,098 (46.1%) | 9,878 (56.2%) |
Disability Status by Sex by Age in Willimantic
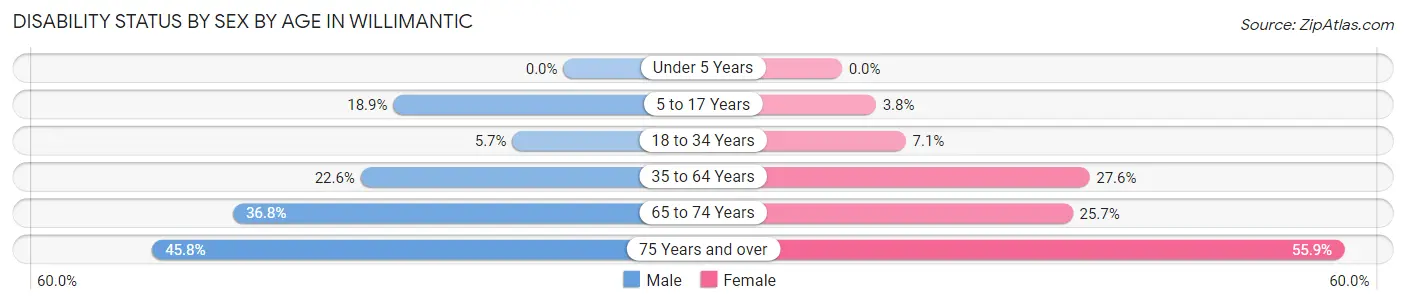
| Age Bracket | Male | Female |
| Under 5 Years | 0 (0.0%) | 0 (0.0%) |
| 5 to 17 Years | 228 (18.9%) | 46 (3.8%) |
| 18 to 34 Years | 198 (5.7%) | 246 (7.1%) |
| 35 to 64 Years | 584 (22.6%) | 888 (27.6%) |
| 65 to 74 Years | 245 (36.8%) | 146 (25.7%) |
| 75 Years and over | 152 (45.8%) | 288 (55.9%) |
Disability Class by Sex by Age in Willimantic
Disability Class: Hearing Difficulty
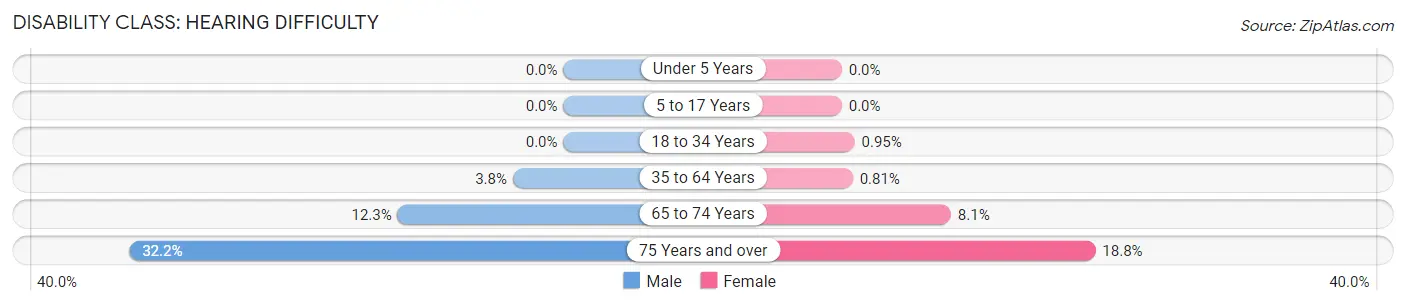
| Age Bracket | Male | Female |
| Under 5 Years | 0 (0.0%) | 0 (0.0%) |
| 5 to 17 Years | 0 (0.0%) | 0 (0.0%) |
| 18 to 34 Years | 0 (0.0%) | 33 (0.9%) |
| 35 to 64 Years | 97 (3.7%) | 26 (0.8%) |
| 65 to 74 Years | 82 (12.3%) | 46 (8.1%) |
| 75 Years and over | 107 (32.2%) | 97 (18.8%) |
Disability Class: Vision Difficulty
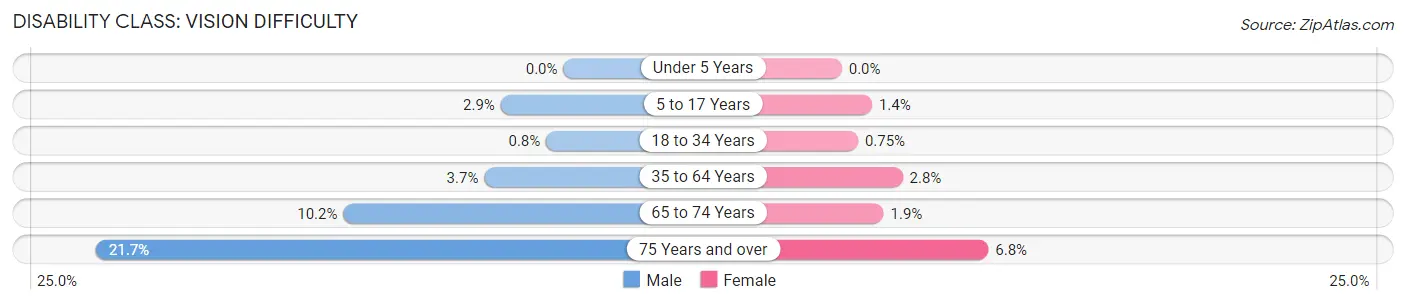
| Age Bracket | Male | Female |
| Under 5 Years | 0 (0.0%) | 0 (0.0%) |
| 5 to 17 Years | 35 (2.9%) | 17 (1.4%) |
| 18 to 34 Years | 28 (0.8%) | 26 (0.7%) |
| 35 to 64 Years | 95 (3.7%) | 91 (2.8%) |
| 65 to 74 Years | 68 (10.2%) | 11 (1.9%) |
| 75 Years and over | 72 (21.7%) | 35 (6.8%) |
Disability Class: Cognitive Difficulty
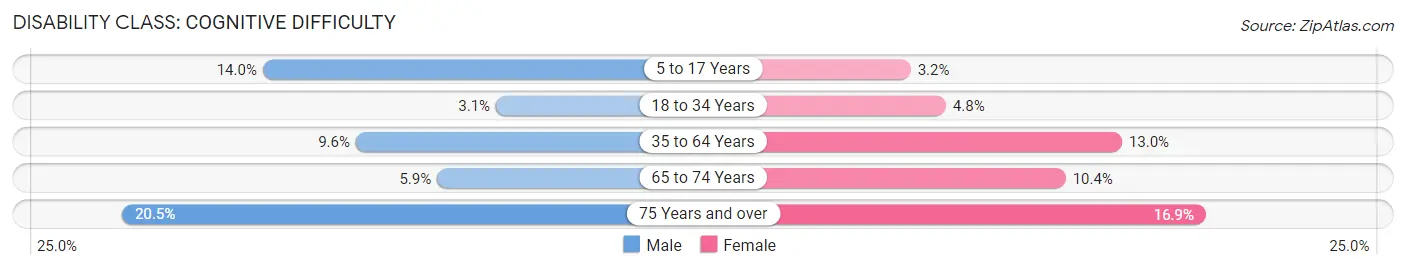
| Age Bracket | Male | Female |
| 5 to 17 Years | 168 (14.0%) | 39 (3.2%) |
| 18 to 34 Years | 109 (3.1%) | 167 (4.8%) |
| 35 to 64 Years | 249 (9.6%) | 419 (13.0%) |
| 65 to 74 Years | 39 (5.9%) | 59 (10.4%) |
| 75 Years and over | 68 (20.5%) | 87 (16.9%) |
Disability Class: Ambulatory Difficulty
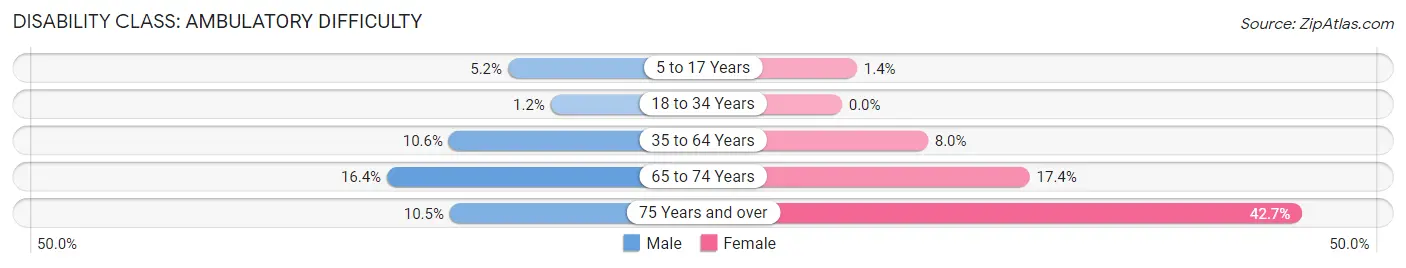
| Age Bracket | Male | Female |
| 5 to 17 Years | 62 (5.1%) | 17 (1.4%) |
| 18 to 34 Years | 41 (1.2%) | 0 (0.0%) |
| 35 to 64 Years | 275 (10.6%) | 257 (8.0%) |
| 65 to 74 Years | 109 (16.4%) | 99 (17.4%) |
| 75 Years and over | 35 (10.5%) | 220 (42.7%) |
Disability Class: Self-Care Difficulty
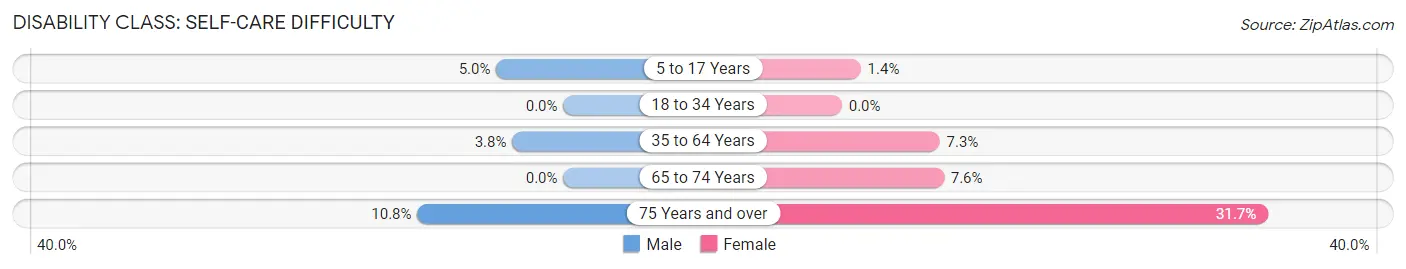
| Age Bracket | Male | Female |
| 5 to 17 Years | 60 (5.0%) | 17 (1.4%) |
| 18 to 34 Years | 0 (0.0%) | 0 (0.0%) |
| 35 to 64 Years | 98 (3.8%) | 234 (7.3%) |
| 65 to 74 Years | 0 (0.0%) | 43 (7.6%) |
| 75 Years and over | 36 (10.8%) | 163 (31.7%) |
Technology Access in Willimantic
Computing Device Access in Willimantic
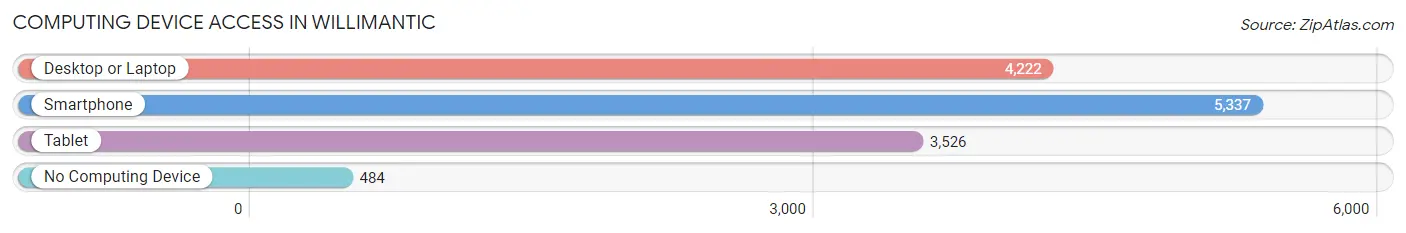
| Device Type | # Households | % Households |
| Desktop or Laptop | 4,222 | 66.2% |
| Smartphone | 5,337 | 83.7% |
| Tablet | 3,526 | 55.3% |
| No Computing Device | 484 | 7.6% |
| Total | 6,379 | 100.0% |
Internet Access in Willimantic
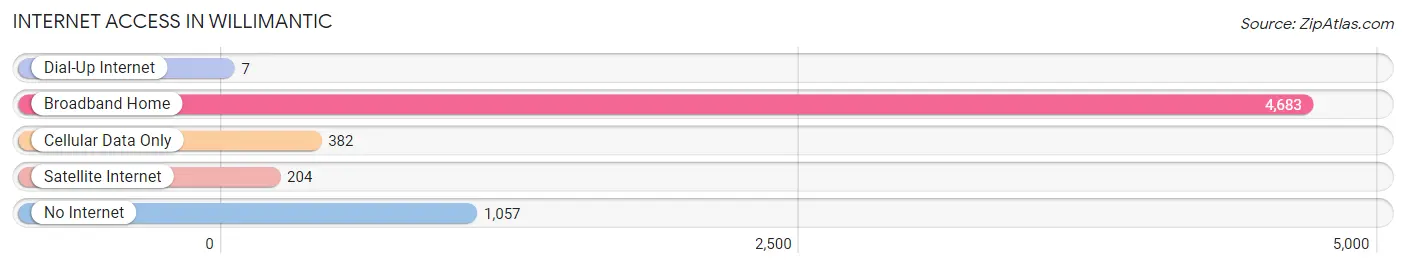
| Internet Type | # Households | % Households |
| Dial-Up Internet | 7 | 0.1% |
| Broadband Home | 4,683 | 73.4% |
| Cellular Data Only | 382 | 6.0% |
| Satellite Internet | 204 | 3.2% |
| No Internet | 1,057 | 16.6% |
| Total | 6,379 | 100.0% |
Willimantic Summary
Willimantic, Connecticut is a small city located in Windham County in the northeastern part of the state. It is situated on the banks of the Willimantic River, which is a tributary of the Thames River. The city is part of the larger Hartford-East Hartford-Middletown metropolitan area. As of the 2010 census, the population of Willimantic was 17,737.
History
Willimantic was first settled in 1692 by settlers from Norwich, Connecticut. The town was originally known as Windham Village, and was incorporated in 1833. The name was changed to Willimantic in 1838, after the Willimantic River. The city was an important center for the production of textiles in the 19th century, and was home to several large mills. The city was also the site of the first telegraph line in Connecticut, which was established in 1846.
Geography
Willimantic is located at 41°41'N, 72°14'W (41.6833, -72.2333). The city has a total area of 4.3 square miles, of which 4.2 square miles is land and 0.1 square miles is water. The city is located in the eastern part of Connecticut, and is bordered by the towns of Windham, Mansfield, Hampton, and Coventry.
Economy
Willimantic is home to several large employers, including Eastern Connecticut State University, Windham Hospital, and the Willimantic Waste Paper Company. The city is also home to several small businesses, including restaurants, retail stores, and service providers. The city is also home to several industrial parks, which provide employment opportunities for local residents.
Demographics
As of the 2010 census, the population of Willimantic was 17,737. The racial makeup of the city was 79.2% White, 8.3% African American, 0.4% Native American, 3.2% Asian, 0.1% Pacific Islander, 5.7% from other races, and 2.4% from two or more races. Hispanic or Latino of any race were 16.2% of the population.
The median income for a household in the city was $37,945, and the median income for a family was $45,945. The per capita income for the city was $19,945. About 17.2% of families and 22.2% of the population were below the poverty line, including 33.3% of those under age 18 and 11.2% of those age 65 or over.
Common Questions
What is Per Capita Income in Willimantic?
Per Capita income in Willimantic is $22,953.
What is the Median Family Income in Willimantic?
Median Family Income in Willimantic is $54,489.
What is the Median Household income in Willimantic?
Median Household Income in Willimantic is $45,723.
What is Income or Wage Gap in Willimantic?
Income or Wage Gap in Willimantic is 28.7%.
Women in Willimantic earn 71.3 cents for every dollar earned by a man.
What is Inequality or Gini Index in Willimantic?
Inequality or Gini Index in Willimantic is 0.47.
What is the Total Population of Willimantic?
Total Population of Willimantic is 17,762.
What is the Total Male Population of Willimantic?
Total Male Population of Willimantic is 8,557.
What is the Total Female Population of Willimantic?
Total Female Population of Willimantic is 9,205.
What is the Ratio of Males per 100 Females in Willimantic?
There are 92.96 Males per 100 Females in Willimantic.
What is the Ratio of Females per 100 Males in Willimantic?
There are 107.57 Females per 100 Males in Willimantic.
What is the Median Population Age in Willimantic?
Median Population Age in Willimantic is 30.5 Years.
What is the Average Family Size in Willimantic
Average Family Size in Willimantic is 2.9 People.
What is the Average Household Size in Willimantic
Average Household Size in Willimantic is 2.3 People.
How Large is the Labor Force in Willimantic?
There are 8,958 People in the Labor Forcein in Willimantic.
What is the Percentage of People in the Labor Force in Willimantic?
57.4% of People are in the Labor Force in Willimantic.
What is the Unemployment Rate in Willimantic?
Unemployment Rate in Willimantic is 8.2%.