Cities with the Highest Percentage of Swedish Population in Connecticut
RELATED REPORTS & OPTIONS
Swedish
Connecticut
Compare Cities
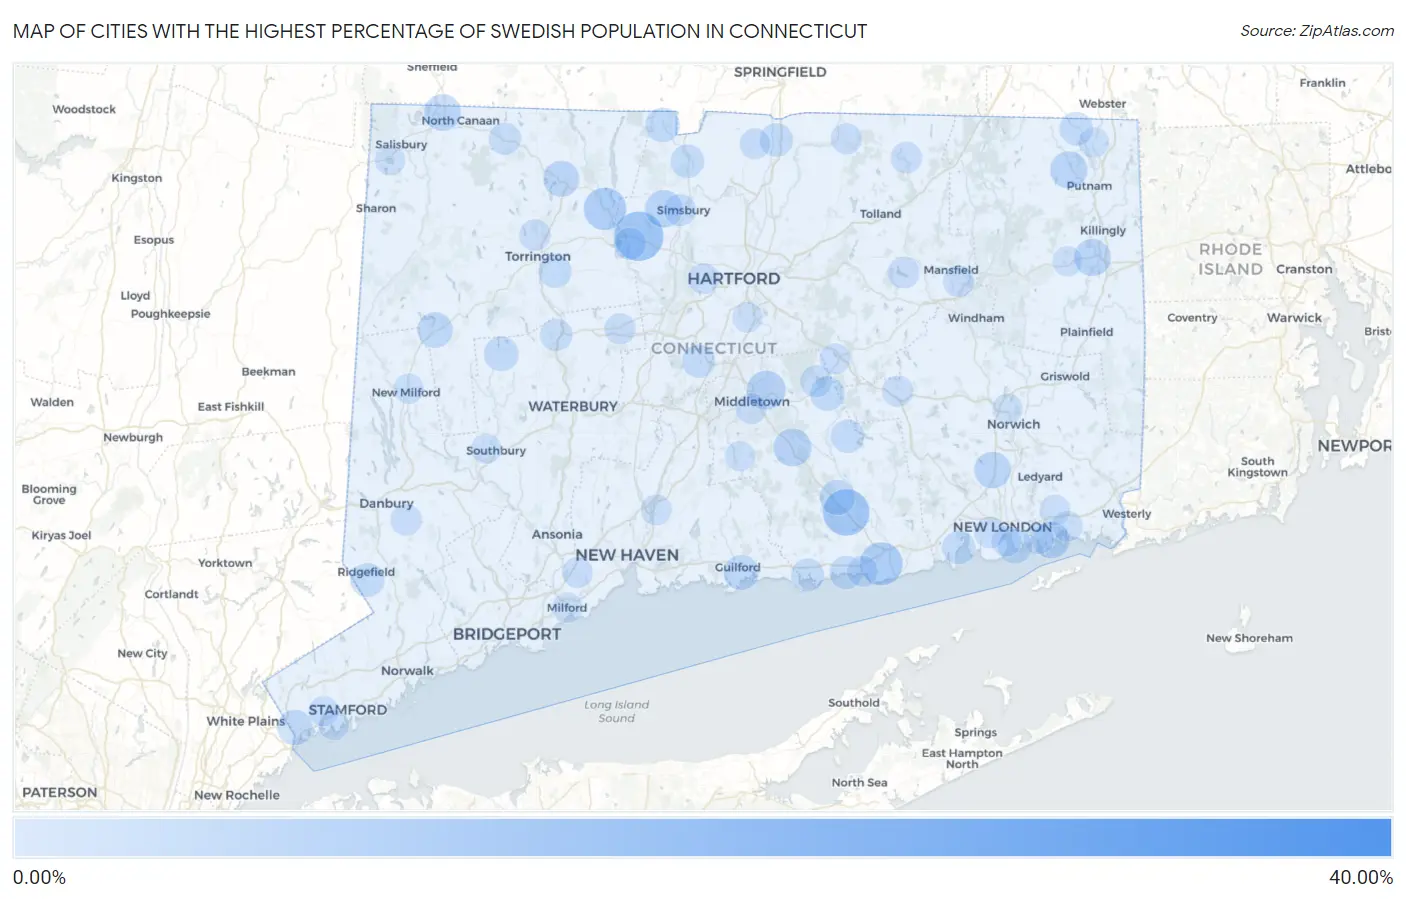
Map of Cities with the Highest Percentage of Swedish Population in Connecticut
0.00%
40.00%
Cities with the Highest Percentage of Swedish Population in Connecticut
| City | Swedish | vs State | vs National | |
| 1. | Riverton | 31.02% | 1.33%(+29.7)#1 | 1.05%(+30.0)#61 |
| 2. | Topstone | 12.92% | 1.33%(+11.6)#2 | 1.05%(+11.9)#378 |
| 3. | Canton Valley | 10.98% | 1.33%(+9.66)#3 | 1.05%(+9.94)#551 |
| 4. | Deep River Center | 9.48% | 1.33%(+8.16)#4 | 1.05%(+8.43)#707 |
| 5. | Old Saybrook Center | 7.68% | 1.33%(+6.36)#5 | 1.05%(+6.64)#1,023 |
| 6. | New Hartford Center | 7.40% | 1.33%(+6.08)#6 | 1.05%(+6.36)#1,091 |
| 7. | Groton Long Point Borough | 6.38% | 1.33%(+5.06)#7 | 1.05%(+5.33)#1,396 |
| 8. | South Wilton | 6.02% | 1.33%(+4.70)#8 | 1.05%(+4.97)#1,541 |
| 9. | Mechanicsville | 5.72% | 1.33%(+4.39)#9 | 1.05%(+4.67)#1,649 |
| 10. | Portland | 5.63% | 1.33%(+4.30)#10 | 1.05%(+4.58)#1,688 |
| 11. | Higganum | 5.08% | 1.33%(+3.75)#11 | 1.05%(+4.03)#1,941 |
| 12. | Fenwick Borough | 5.00% | 1.33%(+3.67)#12 | 1.05%(+3.95)#1,996 |
| 13. | Bridgewater | 4.93% | 1.33%(+3.60)#13 | 1.05%(+3.88)#2,038 |
| 14. | Quasset Lake | 4.92% | 1.33%(+3.59)#14 | 1.05%(+3.87)#2,044 |
| 15. | West Simsbury | 4.90% | 1.33%(+3.57)#15 | 1.05%(+3.85)#2,054 |
| 16. | South Woodstock | 4.80% | 1.33%(+3.47)#16 | 1.05%(+3.75)#2,122 |
| 17. | East Brooklyn | 4.63% | 1.33%(+3.31)#17 | 1.05%(+3.58)#2,226 |
| 18. | Oxoboxo River | 4.53% | 1.33%(+3.20)#18 | 1.05%(+3.48)#2,290 |
| 19. | Canaan | 4.51% | 1.33%(+3.18)#19 | 1.05%(+3.46)#2,305 |
| 20. | Noank | 4.45% | 1.33%(+3.12)#20 | 1.05%(+3.40)#2,339 |
| 21. | Winsted | 4.23% | 1.33%(+2.90)#21 | 1.05%(+3.18)#2,488 |
| 22. | New Preston | 4.00% | 1.33%(+2.67)#22 | 1.05%(+2.95)#2,658 |
| 23. | Pemberwick | 3.95% | 1.33%(+2.63)#23 | 1.05%(+2.91)#2,698 |
| 24. | Chester Center | 3.88% | 1.33%(+2.55)#24 | 1.05%(+2.83)#2,762 |
| 25. | Guilford Center | 3.70% | 1.33%(+2.37)#25 | 1.05%(+2.65)#2,936 |
| 26. | Gaylordsville | 3.53% | 1.33%(+2.21)#26 | 1.05%(+2.48)#3,132 |
| 27. | Bethlehem Village | 3.52% | 1.33%(+2.19)#27 | 1.05%(+2.47)#3,140 |
| 28. | Tokeneke | 3.50% | 1.33%(+2.17)#28 | 1.05%(+2.45)#3,165 |
| 29. | Groton | 3.42% | 1.33%(+2.09)#29 | 1.05%(+2.37)#3,266 |
| 30. | North Granby | 3.41% | 1.33%(+2.08)#30 | 1.05%(+2.36)#3,280 |
| 31. | East Hampton | 3.40% | 1.33%(+2.07)#31 | 1.05%(+2.35)#3,293 |
| 32. | Saugatuck | 3.37% | 1.33%(+2.04)#32 | 1.05%(+2.32)#3,324 |
| 33. | Rock Ridge | 3.35% | 1.33%(+2.02)#33 | 1.05%(+2.30)#3,346 |
| 34. | Lordship | 3.30% | 1.33%(+1.97)#34 | 1.05%(+2.25)#3,400 |
| 35. | Stepney | 3.24% | 1.33%(+1.91)#35 | 1.05%(+2.19)#3,473 |
| 36. | Ridgefield | 3.16% | 1.33%(+1.84)#36 | 1.05%(+2.11)#3,579 |
| 37. | Jewett City Borough | 3.02% | 1.33%(+1.69)#37 | 1.05%(+1.97)#3,783 |
| 38. | Botsford | 2.98% | 1.33%(+1.65)#38 | 1.05%(+1.93)#3,837 |
| 39. | Salmon Brook | 2.98% | 1.33%(+1.65)#39 | 1.05%(+1.93)#3,843 |
| 40. | Quinebaug | 2.96% | 1.33%(+1.63)#40 | 1.05%(+1.91)#3,868 |
| 41. | Moodus | 2.94% | 1.33%(+1.62)#41 | 1.05%(+1.89)#3,891 |
| 42. | Westbrook Center | 2.89% | 1.33%(+1.57)#42 | 1.05%(+1.84)#3,970 |
| 43. | Thompsonville | 2.89% | 1.33%(+1.56)#43 | 1.05%(+1.84)#3,977 |
| 44. | Niantic | 2.86% | 1.33%(+1.53)#44 | 1.05%(+1.81)#4,028 |
| 45. | Ridgebury | 2.83% | 1.33%(+1.51)#45 | 1.05%(+1.79)#4,074 |
| 46. | Northwest Harwinton | 2.75% | 1.33%(+1.42)#46 | 1.05%(+1.70)#4,207 |
| 47. | Clinton | 2.73% | 1.33%(+1.40)#47 | 1.05%(+1.68)#4,235 |
| 48. | Kensington | 2.72% | 1.33%(+1.40)#48 | 1.05%(+1.68)#4,249 |
| 49. | Plattsville | 2.63% | 1.33%(+1.30)#49 | 1.05%(+1.58)#4,419 |
| 50. | Thomaston | 2.44% | 1.33%(+1.12)#50 | 1.05%(+1.40)#4,785 |
| 51. | Stonington Borough | 2.44% | 1.33%(+1.12)#51 | 1.05%(+1.39)#4,792 |
| 52. | Noroton | 2.34% | 1.33%(+1.01)#52 | 1.05%(+1.29)#4,977 |
| 53. | Norfolk | 2.30% | 1.33%(+0.975)#53 | 1.05%(+1.25)#5,056 |
| 54. | Lake Pocotopaug | 2.25% | 1.33%(+0.922)#54 | 1.05%(+1.20)#5,167 |
| 55. | Simsbury Center | 2.24% | 1.33%(+0.917)#55 | 1.05%(+1.19)#5,177 |
| 56. | Collinsville | 2.24% | 1.33%(+0.914)#56 | 1.05%(+1.19)#5,185 |
| 57. | Lakes East | 2.06% | 1.33%(+0.733)#57 | 1.05%(+1.01)#5,607 |
| 58. | Woodmont Borough | 2.04% | 1.33%(+0.713)#58 | 1.05%(+0.990)#5,674 |
| 59. | South Coventry | 1.98% | 1.33%(+0.650)#59 | 1.05%(+0.927)#5,865 |
| 60. | Torrington | 1.97% | 1.33%(+0.649)#60 | 1.05%(+0.926)#5,868 |
| 61. | Northford | 1.97% | 1.33%(+0.646)#61 | 1.05%(+0.923)#5,880 |
| 62. | Oronoque | 1.97% | 1.33%(+0.642)#62 | 1.05%(+0.920)#5,887 |
| 63. | Waterford | 1.95% | 1.33%(+0.628)#63 | 1.05%(+0.905)#5,939 |
| 64. | Mansfield Center | 1.95% | 1.33%(+0.626)#64 | 1.05%(+0.903)#5,947 |
| 65. | Ball Pond | 1.94% | 1.33%(+0.610)#65 | 1.05%(+0.888)#5,992 |
| 66. | Stafford Springs | 1.90% | 1.33%(+0.576)#66 | 1.05%(+0.853)#6,096 |
| 67. | Bethel | 1.87% | 1.33%(+0.544)#67 | 1.05%(+0.822)#6,199 |
| 68. | Colchester | 1.83% | 1.33%(+0.503)#68 | 1.05%(+0.780)#6,314 |
| 69. | Bristol | 1.82% | 1.33%(+0.494)#69 | 1.05%(+0.771)#6,338 |
| 70. | Somers | 1.79% | 1.33%(+0.467)#70 | 1.05%(+0.745)#6,418 |
| 71. | Newtown Borough | 1.79% | 1.33%(+0.461)#71 | 1.05%(+0.738)#6,434 |
| 72. | Noroton Heights | 1.76% | 1.33%(+0.438)#72 | 1.05%(+0.715)#6,511 |
| 73. | Bantam Borough | 1.72% | 1.33%(+0.396)#73 | 1.05%(+0.673)#6,634 |
| 74. | West Hartford | 1.68% | 1.33%(+0.355)#74 | 1.05%(+0.632)#6,767 |
| 75. | Trumbull Center | 1.66% | 1.33%(+0.339)#75 | 1.05%(+0.616)#6,822 |
| 76. | Saybrook Manor | 1.62% | 1.33%(+0.299)#76 | 1.05%(+0.576)#6,941 |
| 77. | Darien Downtown | 1.61% | 1.33%(+0.289)#77 | 1.05%(+0.566)#6,981 |
| 78. | Sandy Hook | 1.59% | 1.33%(+0.268)#78 | 1.05%(+0.545)#7,048 |
| 79. | Suffield Depot | 1.59% | 1.33%(+0.265)#79 | 1.05%(+0.542)#7,061 |
| 80. | North Haven | 1.57% | 1.33%(+0.242)#80 | 1.05%(+0.519)#7,134 |
| 81. | Middletown | 1.55% | 1.33%(+0.224)#81 | 1.05%(+0.501)#7,206 |
| 82. | Orange | 1.55% | 1.33%(+0.220)#82 | 1.05%(+0.498)#7,218 |
| 83. | Terramuggus | 1.54% | 1.33%(+0.217)#83 | 1.05%(+0.494)#7,231 |
| 84. | Candlewood Orchards | 1.53% | 1.33%(+0.201)#84 | 1.05%(+0.478)#7,294 |
| 85. | Mystic | 1.52% | 1.33%(+0.191)#85 | 1.05%(+0.468)#7,338 |
| 86. | Old Mystic | 1.51% | 1.33%(+0.181)#86 | 1.05%(+0.458)#7,383 |
| 87. | Lakeville | 1.47% | 1.33%(+0.142)#87 | 1.05%(+0.419)#7,531 |
| 88. | Greens Farms | 1.41% | 1.33%(+0.084)#88 | 1.05%(+0.361)#7,739 |
| 89. | North Grosvenor Dale | 1.41% | 1.33%(+0.080)#89 | 1.05%(+0.357)#7,768 |
| 90. | Old Greenwich | 1.39% | 1.33%(+0.063)#90 | 1.05%(+0.340)#7,858 |
| 91. | New Milford | 1.37% | 1.33%(+0.042)#91 | 1.05%(+0.319)#7,948 |
| 92. | Milford City Balance | 1.36% | 1.33%(+0.030)#92 | 1.05%(+0.308)#7,999 |
| 93. | Brooklyn | 1.35% | 1.33%(+0.029)#93 | 1.05%(+0.306)#8,001 |
| 94. | Wethersfield | 1.34% | 1.33%(+0.017)#94 | 1.05%(+0.294)#8,061 |
| 95. | Cos Cob | 1.34% | 1.33%(+0.014)#95 | 1.05%(+0.291)#8,079 |
| 96. | New London | 1.34% | 1.33%(+0.012)#96 | 1.05%(+0.289)#8,088 |
| 97. | Durham | 1.30% | 1.33%(-0.028)#97 | 1.05%(+0.249)#8,266 |
| 98. | Poquonock Bridge | 1.29% | 1.33%(-0.031)#98 | 1.05%(+0.247)#8,282 |
| 99. | Heritage Village | 1.29% | 1.33%(-0.033)#99 | 1.05%(+0.244)#8,292 |
| 100. | Norwich | 1.29% | 1.33%(-0.035)#100 | 1.05%(+0.242)#8,296 |
Common Questions
What are the Top 10 Cities with the Highest Percentage of Swedish Population in Connecticut?
Top 10 Cities with the Highest Percentage of Swedish Population in Connecticut are:
#1
10.98%
#2
9.48%
#3
7.68%
#4
7.40%
#5
5.63%
#6
5.08%
#7
4.90%
#8
4.80%
#9
4.63%
#10
4.53%
What city has the Highest Percentage of Swedish Population in Connecticut?
Canton Valley has the Highest Percentage of Swedish Population in Connecticut with 10.98%.
What is the Percentage of Swedish Population in the State of Connecticut?
Percentage of Swedish Population in Connecticut is 1.33%.
What is the Percentage of Swedish Population in the United States?
Percentage of Swedish Population in the United States is 1.05%.