Durham, CT Map & Demographics
Durham Map
Durham Overview
$56,557
PER CAPITA INCOME
$153,478
AVG FAMILY INCOME
$127,361
AVG HOUSEHOLD INCOME
13.5%
WAGE / INCOME GAP [ % ]
86.5¢/ $1
WAGE / INCOME GAP [ $ ]
0.37
INEQUALITY / GINI INDEX
3,469
TOTAL POPULATION
1,835
MALE POPULATION
1,634
FEMALE POPULATION
112.30
MALES / 100 FEMALES
89.05
FEMALES / 100 MALES
46.9
MEDIAN AGE
2.8
AVG FAMILY SIZE
2.4
AVG HOUSEHOLD SIZE
2,210
LABOR FORCE [ PEOPLE ]
73.7%
PERCENT IN LABOR FORCE
6.0%
UNEMPLOYMENT RATE
Durham Zip Codes
Durham Area Codes
Income in Durham
Income Overview in Durham
Per Capita Income in Durham is $56,557, while median incomes of families and households are $153,478 and $127,361 respectively.
| Characteristic | Number | Measure |
| Per Capita Income | 3,469 | $56,557 |
| Median Family Income | 958 | $153,478 |
| Mean Family Income | 958 | $167,296 |
| Median Household Income | 1,459 | $127,361 |
| Mean Household Income | 1,459 | $135,351 |
| Income Deficit | 958 | $0 |
| Wage / Income Gap (%) | 3,469 | 13.48% |
| Wage / Income Gap ($) | 3,469 | 86.52¢ per $1 |
| Gini / Inequality Index | 3,469 | 0.37 |
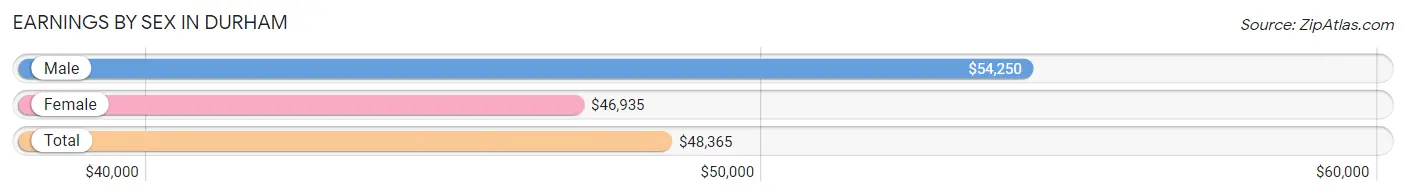
Earnings by Sex in Durham
Average Earnings in Durham are $48,365, $54,250 for men and $46,935 for women, a difference of 13.5%.
| Sex | Number | Average Earnings |
| Male | 1,214 (53.2%) | $54,250 |
| Female | 1,068 (46.8%) | $46,935 |
| Total | 2,282 (100.0%) | $48,365 |
Earnings by Sex by Income Bracket in Durham
The most common earnings brackets in Durham are $100,000+ for men (249 | 20.5%) and $100,000+ for women (221 | 20.7%).
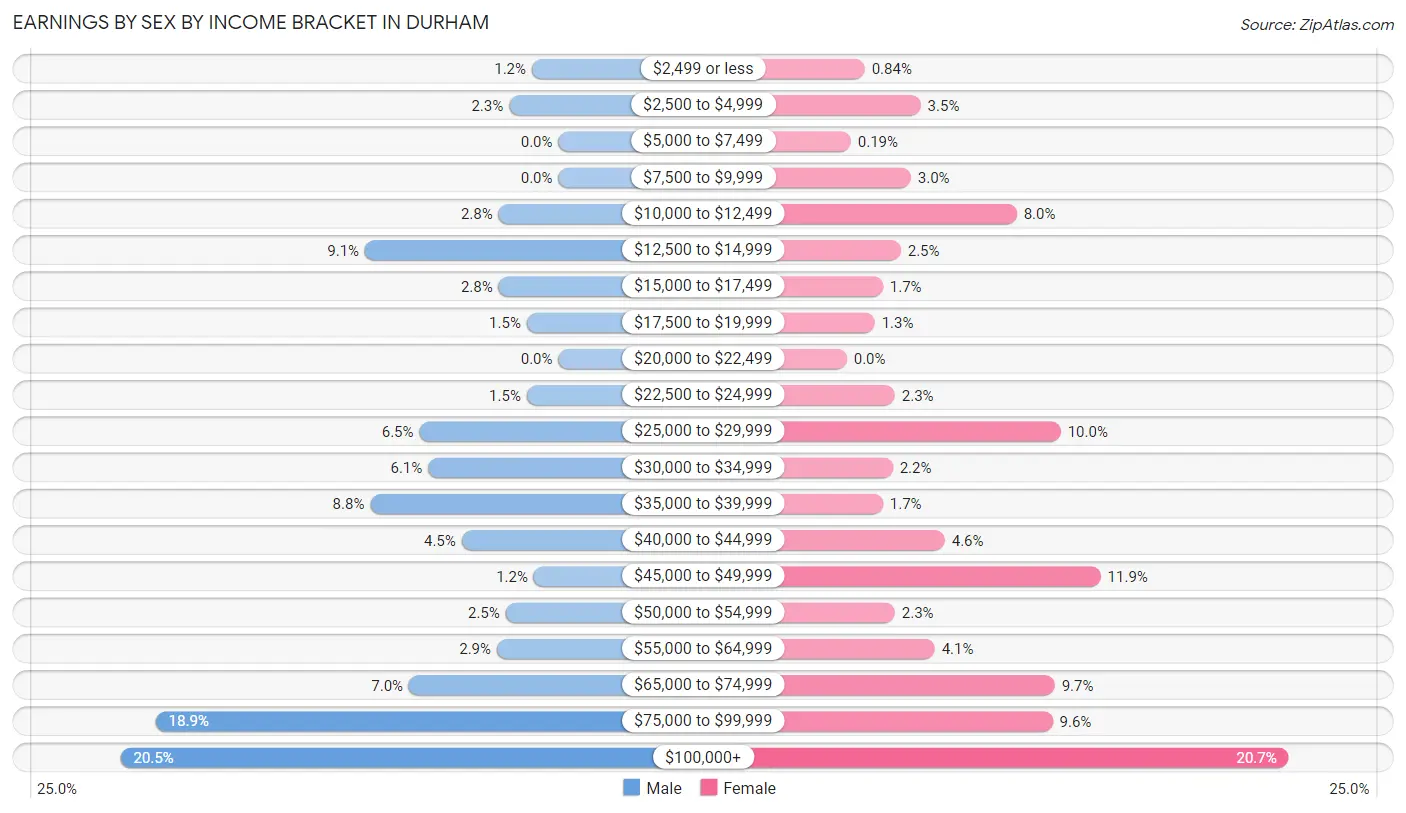
| Income | Male | Female |
| $2,499 or less | 15 (1.2%) | 9 (0.8%) |
| $2,500 to $4,999 | 28 (2.3%) | 37 (3.5%) |
| $5,000 to $7,499 | 0 (0.0%) | 2 (0.2%) |
| $7,500 to $9,999 | 0 (0.0%) | 32 (3.0%) |
| $10,000 to $12,499 | 34 (2.8%) | 85 (8.0%) |
| $12,500 to $14,999 | 110 (9.1%) | 27 (2.5%) |
| $15,000 to $17,499 | 34 (2.8%) | 18 (1.7%) |
| $17,500 to $19,999 | 18 (1.5%) | 14 (1.3%) |
| $20,000 to $22,499 | 0 (0.0%) | 0 (0.0%) |
| $22,500 to $24,999 | 18 (1.5%) | 24 (2.2%) |
| $25,000 to $29,999 | 79 (6.5%) | 107 (10.0%) |
| $30,000 to $34,999 | 74 (6.1%) | 23 (2.1%) |
| $35,000 to $39,999 | 107 (8.8%) | 18 (1.7%) |
| $40,000 to $44,999 | 55 (4.5%) | 49 (4.6%) |
| $45,000 to $49,999 | 14 (1.1%) | 127 (11.9%) |
| $50,000 to $54,999 | 30 (2.5%) | 24 (2.2%) |
| $55,000 to $64,999 | 35 (2.9%) | 44 (4.1%) |
| $65,000 to $74,999 | 85 (7.0%) | 104 (9.7%) |
| $75,000 to $99,999 | 229 (18.9%) | 103 (9.6%) |
| $100,000+ | 249 (20.5%) | 221 (20.7%) |
| Total | 1,214 (100.0%) | 1,068 (100.0%) |
Earnings by Sex by Educational Attainment in Durham
Average earnings in Durham are $63,400 for men and $50,260 for women, a difference of 20.7%. Men with an educational attainment of bachelor's degree enjoy the highest average annual earnings of $99,063, while those with high school diploma education earn the least with $38,191. Women with an educational attainment of graduate degree earn the most with the average annual earnings of $98,951, while those with high school diploma education have the smallest earnings of $26,757.
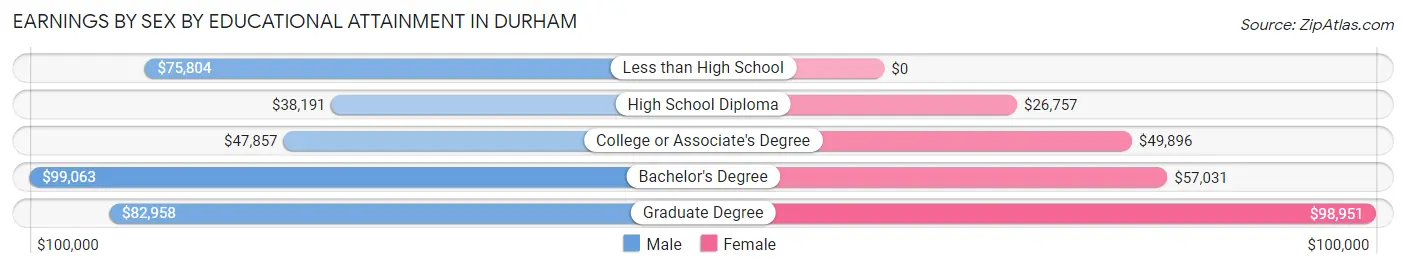
| Educational Attainment | Male Income | Female Income |
| Less than High School | $75,804 | $0 |
| High School Diploma | $38,191 | $26,757 |
| College or Associate's Degree | $47,857 | $49,896 |
| Bachelor's Degree | $99,063 | $57,031 |
| Graduate Degree | $82,958 | $98,951 |
| Total | $63,400 | $50,260 |
Family Income in Durham
Family Income Brackets in Durham
According to the Durham family income data, there are 331 families falling into the $150,000 to $199,999 income range, which is the most common income bracket and makes up 34.5% of all families.
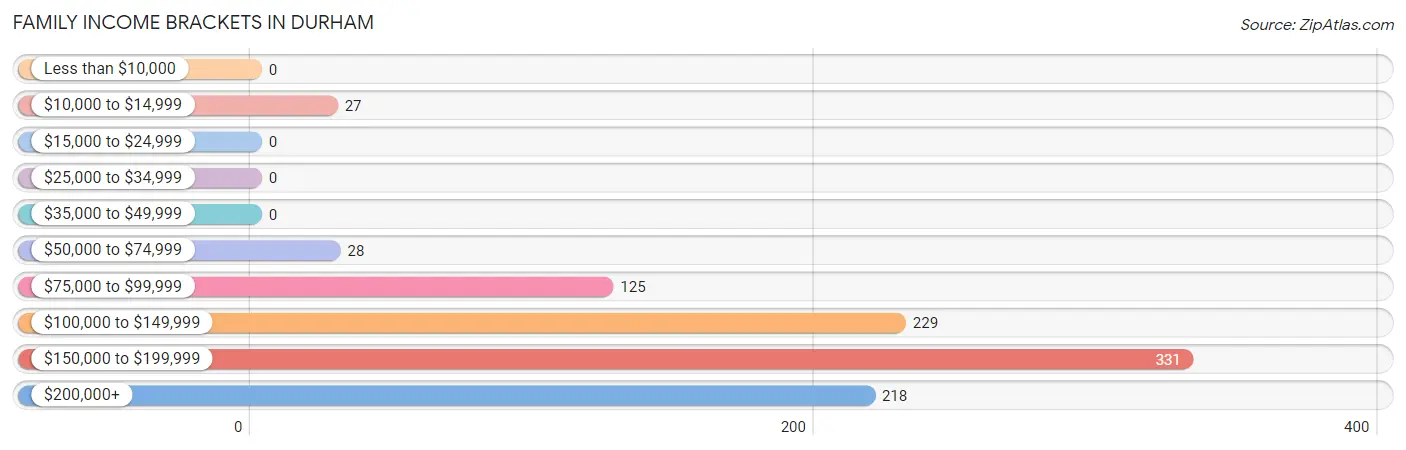
| Income Bracket | # Families | % Families |
| Less than $10,000 | 0 | 0.0% |
| $10,000 to $14,999 | 27 | 2.8% |
| $15,000 to $24,999 | 0 | 0.0% |
| $25,000 to $34,999 | 0 | 0.0% |
| $35,000 to $49,999 | 0 | 0.0% |
| $50,000 to $74,999 | 28 | 2.9% |
| $75,000 to $99,999 | 125 | 13.0% |
| $100,000 to $149,999 | 229 | 23.9% |
| $150,000 to $199,999 | 331 | 34.6% |
| $200,000+ | 218 | 22.8% |
Family Income by Famaliy Size in Durham
5-person families (82 | 8.6%) account for the highest median family income in Durham with $180,588 per family, while 2-person families (535 | 55.8%) have the highest median income of $76,743 per family member.
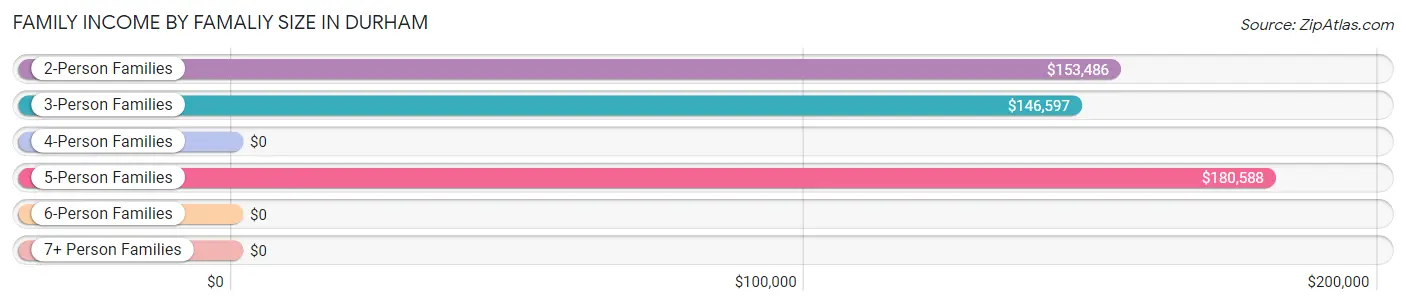
| Income Bracket | # Families | Median Income |
| 2-Person Families | 535 (55.8%) | $153,486 |
| 3-Person Families | 131 (13.7%) | $146,597 |
| 4-Person Families | 210 (21.9%) | $0 |
| 5-Person Families | 82 (8.6%) | $180,588 |
| 6-Person Families | 0 (0.0%) | $0 |
| 7+ Person Families | 0 (0.0%) | $0 |
| Total | 958 (100.0%) | $153,478 |
Family Income by Number of Earners in Durham
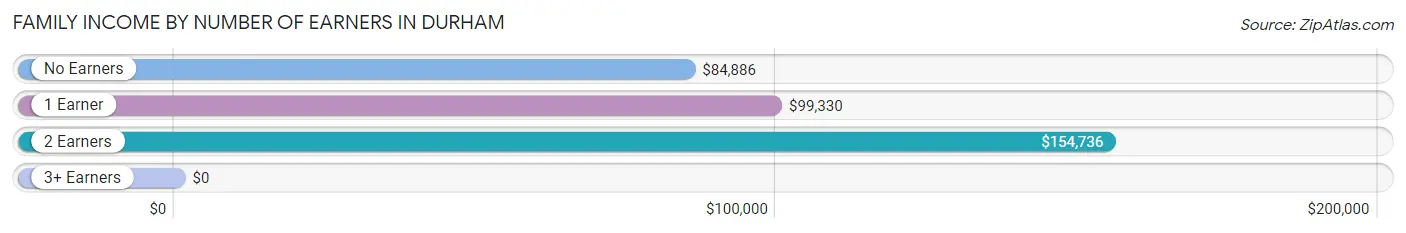
| Number of Earners | # Families | Median Income |
| No Earners | 69 (7.2%) | $84,886 |
| 1 Earner | 181 (18.9%) | $99,330 |
| 2 Earners | 580 (60.5%) | $154,736 |
| 3+ Earners | 128 (13.4%) | $0 |
| Total | 958 (100.0%) | $153,478 |
Household Income in Durham
Household Income Brackets in Durham
With 331 households falling in the category, the $150,000 to $199,999 income range is the most frequent in Durham, accounting for 22.7% of all households. In contrast, only 13 households (0.9%) fall into the less than $10,000 income bracket, making it the least populous group.
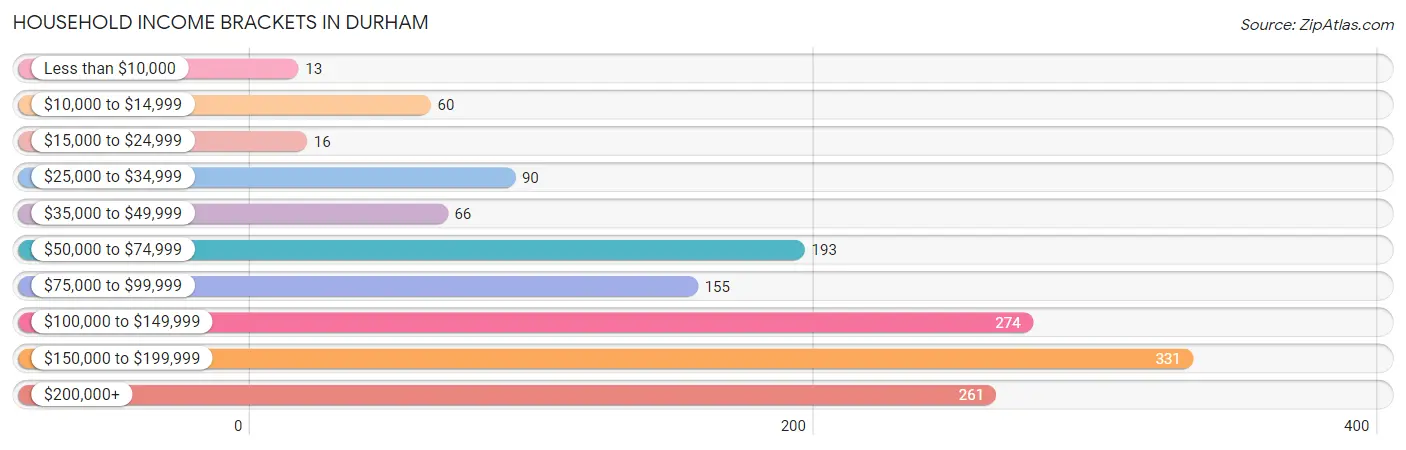
| Income Bracket | # Households | % Households |
| Less than $10,000 | 13 | 0.9% |
| $10,000 to $14,999 | 60 | 4.1% |
| $15,000 to $24,999 | 16 | 1.1% |
| $25,000 to $34,999 | 90 | 6.2% |
| $35,000 to $49,999 | 66 | 4.5% |
| $50,000 to $74,999 | 193 | 13.2% |
| $75,000 to $99,999 | 155 | 10.6% |
| $100,000 to $149,999 | 274 | 18.8% |
| $150,000 to $199,999 | 331 | 22.7% |
| $200,000+ | 261 | 17.9% |
Household Income by Householder Age in Durham
The median household income in Durham is $127,361, with the highest median household income of $153,525 found in the 45 to 64 years age bracket for the primary householder. A total of 678 households (46.5%) fall into this category. Meanwhile, the 15 to 24 years age bracket for the primary householder has the lowest median household income of $0, with 78 households (5.3%) in this group.
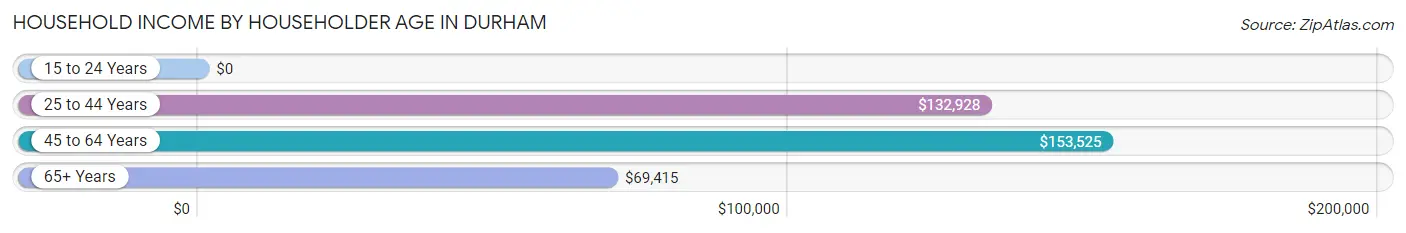
| Income Bracket | # Households | Median Income |
| 15 to 24 Years | 78 (5.3%) | $0 |
| 25 to 44 Years | 295 (20.2%) | $132,928 |
| 45 to 64 Years | 678 (46.5%) | $153,525 |
| 65+ Years | 408 (28.0%) | $69,415 |
| Total | 1,459 (100.0%) | $127,361 |
Poverty in Durham
Income Below Poverty by Sex and Age in Durham
With 6.2% poverty level for males and 8.6% for females among the residents of Durham, 25 to 34 year old males and 18 to 24 year old females are the most vulnerable to poverty, with 99 males (31.0%) and 60 females (75.9%) in their respective age groups living below the poverty level.
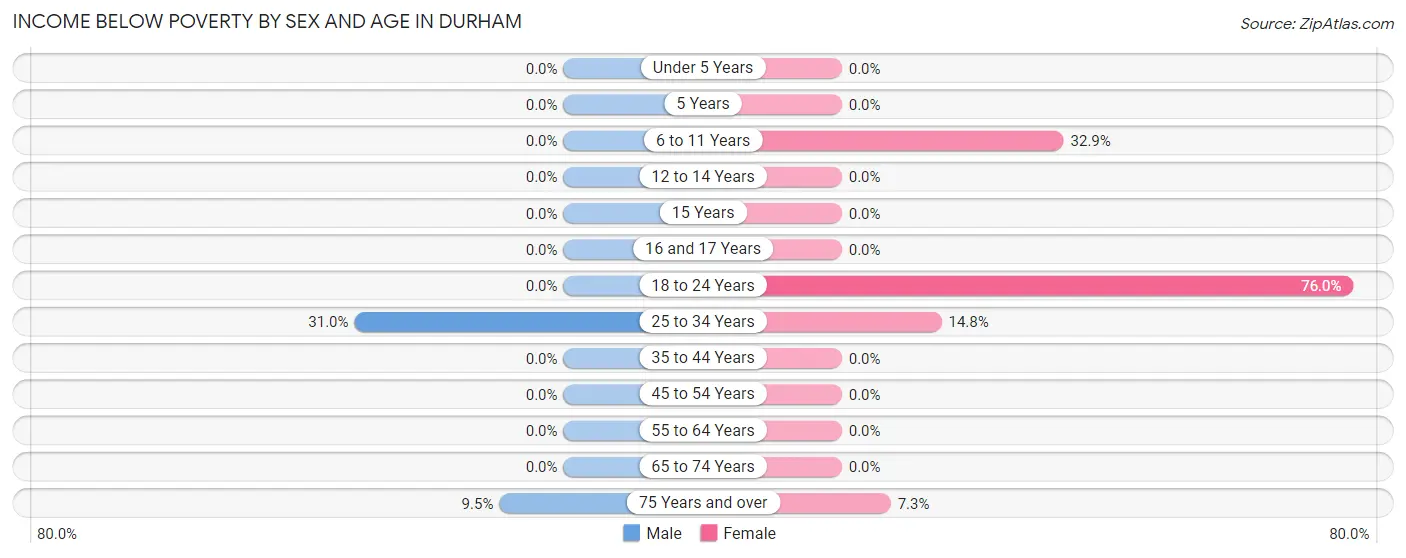
| Age Bracket | Male | Female |
| Under 5 Years | 0 (0.0%) | 0 (0.0%) |
| 5 Years | 0 (0.0%) | 0 (0.0%) |
| 6 to 11 Years | 0 (0.0%) | 28 (32.9%) |
| 12 to 14 Years | 0 (0.0%) | 0 (0.0%) |
| 15 Years | 0 (0.0%) | 0 (0.0%) |
| 16 and 17 Years | 0 (0.0%) | 0 (0.0%) |
| 18 to 24 Years | 0 (0.0%) | 60 (75.9%) |
| 25 to 34 Years | 99 (31.0%) | 40 (14.8%) |
| 35 to 44 Years | 0 (0.0%) | 0 (0.0%) |
| 45 to 54 Years | 0 (0.0%) | 0 (0.0%) |
| 55 to 64 Years | 0 (0.0%) | 0 (0.0%) |
| 65 to 74 Years | 0 (0.0%) | 0 (0.0%) |
| 75 Years and over | 14 (9.5%) | 13 (7.3%) |
| Total | 113 (6.2%) | 141 (8.6%) |
Income Above Poverty by Sex and Age in Durham
According to the poverty statistics in Durham, males aged under 5 years and females aged 12 to 14 years are the age groups that are most secure financially, with 100.0% of males and 100.0% of females in these age groups living above the poverty line.
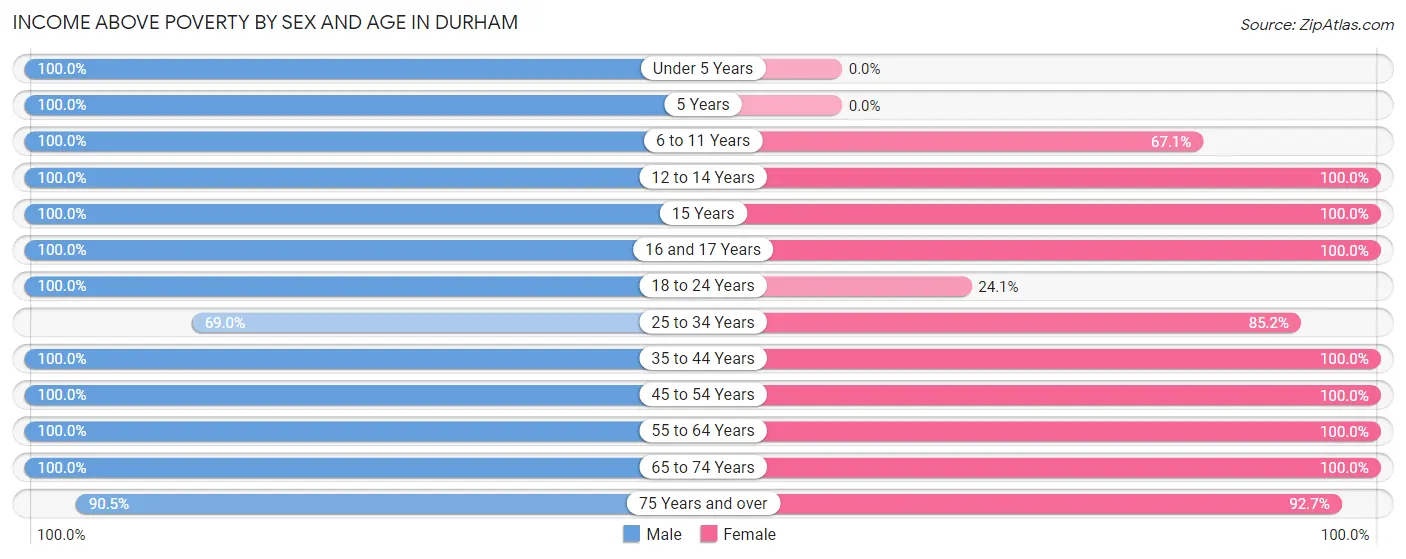
| Age Bracket | Male | Female |
| Under 5 Years | 94 (100.0%) | 0 (0.0%) |
| 5 Years | 18 (100.0%) | 0 (0.0%) |
| 6 to 11 Years | 31 (100.0%) | 57 (67.1%) |
| 12 to 14 Years | 124 (100.0%) | 89 (100.0%) |
| 15 Years | 17 (100.0%) | 13 (100.0%) |
| 16 and 17 Years | 48 (100.0%) | 66 (100.0%) |
| 18 to 24 Years | 56 (100.0%) | 19 (24.0%) |
| 25 to 34 Years | 220 (69.0%) | 230 (85.2%) |
| 35 to 44 Years | 175 (100.0%) | 154 (100.0%) |
| 45 to 54 Years | 272 (100.0%) | 293 (100.0%) |
| 55 to 64 Years | 401 (100.0%) | 319 (100.0%) |
| 65 to 74 Years | 133 (100.0%) | 87 (100.0%) |
| 75 Years and over | 133 (90.5%) | 166 (92.7%) |
| Total | 1,722 (93.8%) | 1,493 (91.4%) |
Income Below Poverty Among Married-Couple Families in Durham
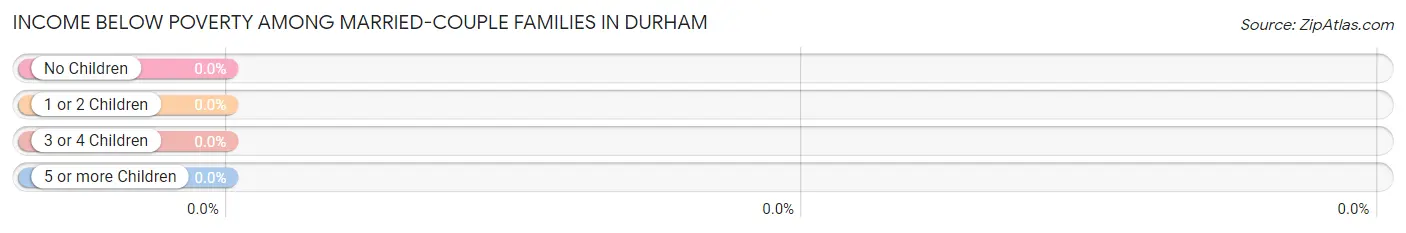
| Children | Above Poverty | Below Poverty |
| No Children | 493 (100.0%) | 0 (0.0%) |
| 1 or 2 Children | 278 (100.0%) | 0 (0.0%) |
| 3 or 4 Children | 54 (100.0%) | 0 (0.0%) |
| 5 or more Children | 0 (0.0%) | 0 (0.0%) |
| Total | 825 (100.0%) | 0 (0.0%) |
Income Below Poverty Among Single-Parent Households in Durham
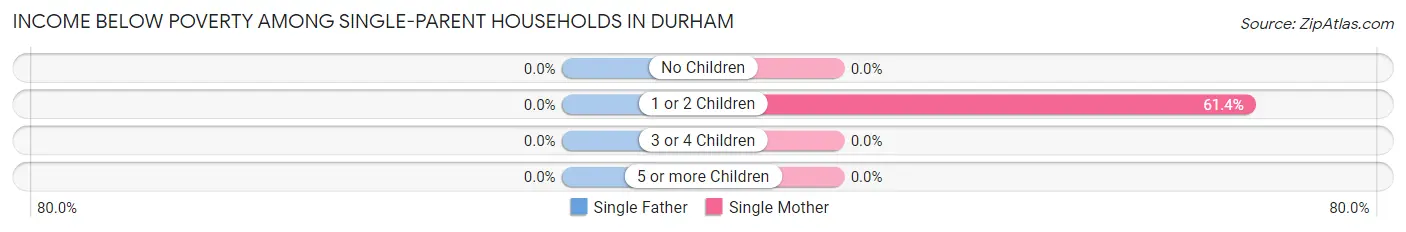
| Children | Single Father | Single Mother |
| No Children | 0 (0.0%) | 0 (0.0%) |
| 1 or 2 Children | 0 (0.0%) | 27 (61.4%) |
| 3 or 4 Children | 0 (0.0%) | 0 (0.0%) |
| 5 or more Children | 0 (0.0%) | 0 (0.0%) |
| Total | 0 (0.0%) | 27 (29.7%) |
Income Below Poverty Among Married-Couple vs Single-Parent Households in Durham
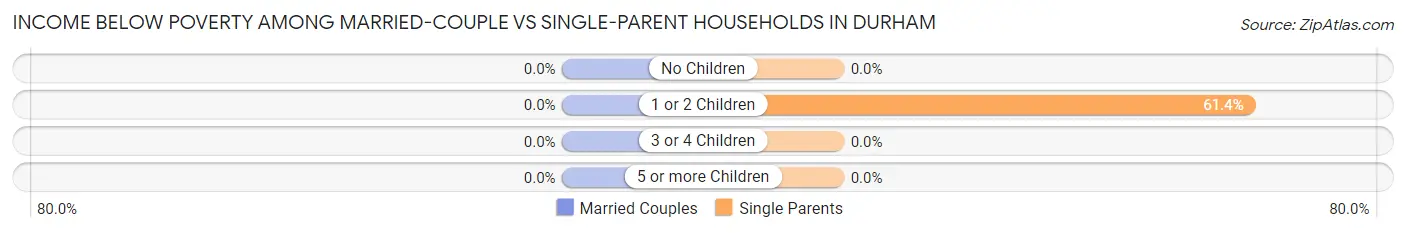
| Children | Married-Couple Families | Single-Parent Households |
| No Children | 0 (0.0%) | 0 (0.0%) |
| 1 or 2 Children | 0 (0.0%) | 27 (61.4%) |
| 3 or 4 Children | 0 (0.0%) | 0 (0.0%) |
| 5 or more Children | 0 (0.0%) | 0 (0.0%) |
| Total | 0 (0.0%) | 27 (20.3%) |
Race in Durham
The most populous races in Durham are White / Caucasian (3,092 | 89.1%), Hispanic or Latino (210 | 6.0%), and Two or more Races (200 | 5.8%).
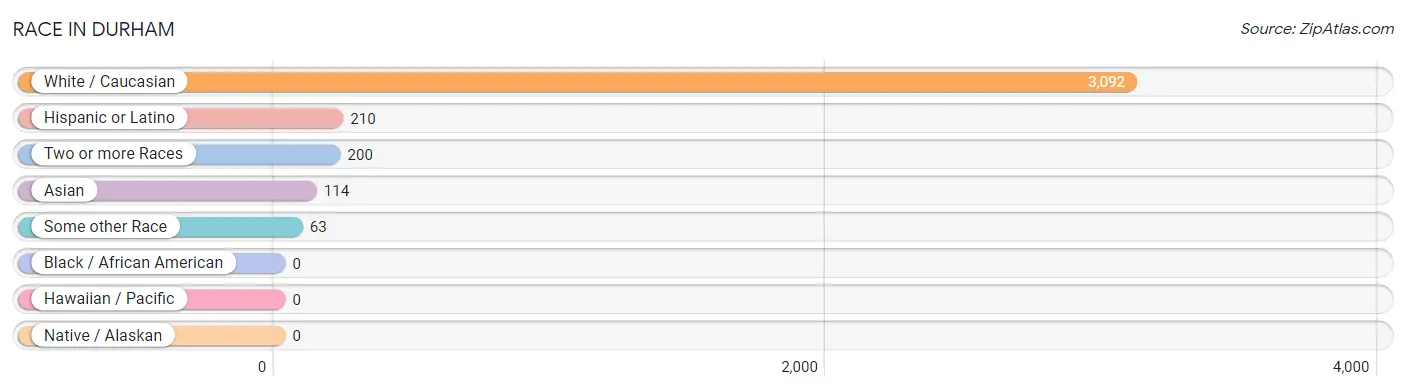
| Race | # Population | % Population |
| Asian | 114 | 3.3% |
| Black / African American | 0 | 0.0% |
| Hawaiian / Pacific | 0 | 0.0% |
| Hispanic or Latino | 210 | 6.0% |
| Native / Alaskan | 0 | 0.0% |
| White / Caucasian | 3,092 | 89.1% |
| Two or more Races | 200 | 5.8% |
| Some other Race | 63 | 1.8% |
| Total | 3,469 | 100.0% |
Ancestry in Durham
The most populous ancestries reported in Durham are Italian (999 | 28.8%), English (609 | 17.6%), Polish (587 | 16.9%), Irish (524 | 15.1%), and German (275 | 7.9%), together accounting for 86.3% of all Durham residents.
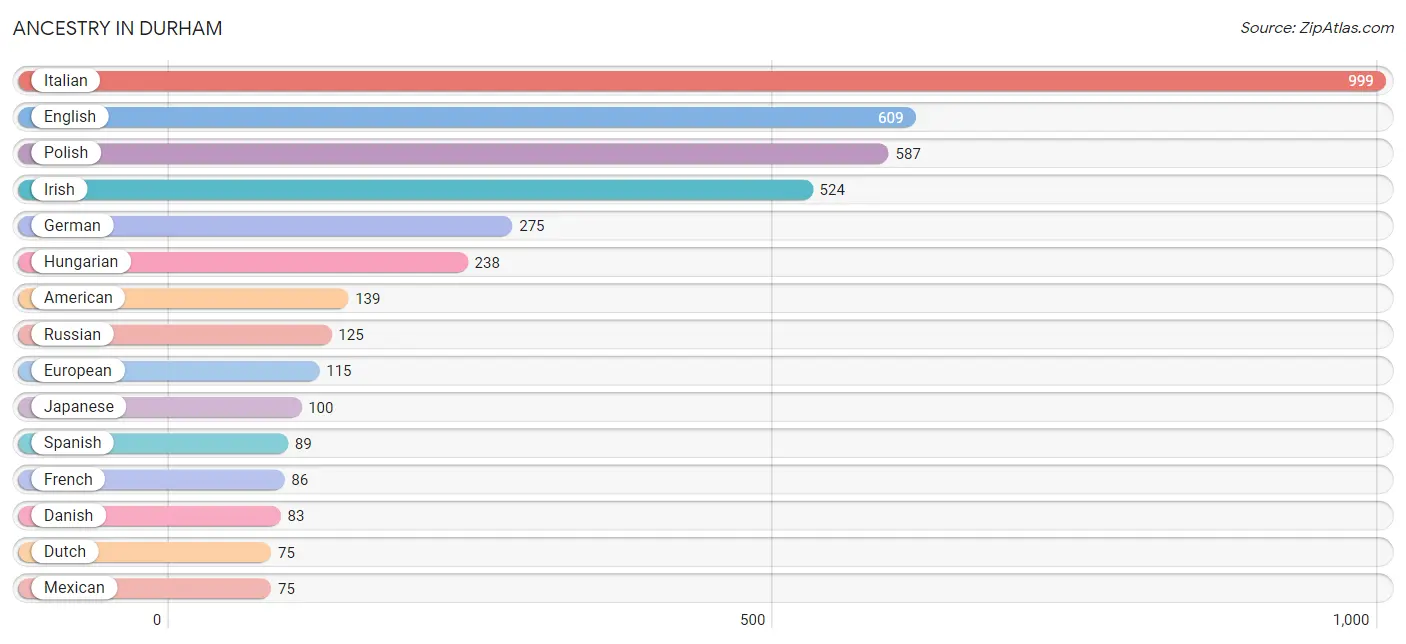
| Ancestry | # Population | % Population |
| American | 139 | 4.0% |
| Austrian | 26 | 0.7% |
| British | 23 | 0.7% |
| Czech | 18 | 0.5% |
| Czechoslovakian | 19 | 0.5% |
| Danish | 83 | 2.4% |
| Dutch | 75 | 2.2% |
| Eastern European | 14 | 0.4% |
| English | 609 | 17.6% |
| European | 115 | 3.3% |
| French | 86 | 2.5% |
| French Canadian | 47 | 1.3% |
| German | 275 | 7.9% |
| Greek | 15 | 0.4% |
| Hungarian | 238 | 6.9% |
| Indian (Asian) | 14 | 0.4% |
| Irish | 524 | 15.1% |
| Italian | 999 | 28.8% |
| Japanese | 100 | 2.9% |
| Latvian | 31 | 0.9% |
| Lithuanian | 27 | 0.8% |
| Mexican | 75 | 2.2% |
| Northern European | 31 | 0.9% |
| Polish | 587 | 16.9% |
| Portuguese | 37 | 1.1% |
| Puerto Rican | 45 | 1.3% |
| Russian | 125 | 3.6% |
| Spanish | 89 | 2.6% |
| Swedish | 45 | 1.3% | View All 29 Rows |
Immigrants in Durham
The most numerous immigrant groups reported in Durham came from Asia (114 | 3.3%), Cambodia (100 | 2.9%), South Eastern Asia (100 | 2.9%), Europe (24 | 0.7%), and Northern Europe (24 | 0.7%), together accounting for 10.4% of all Durham residents.
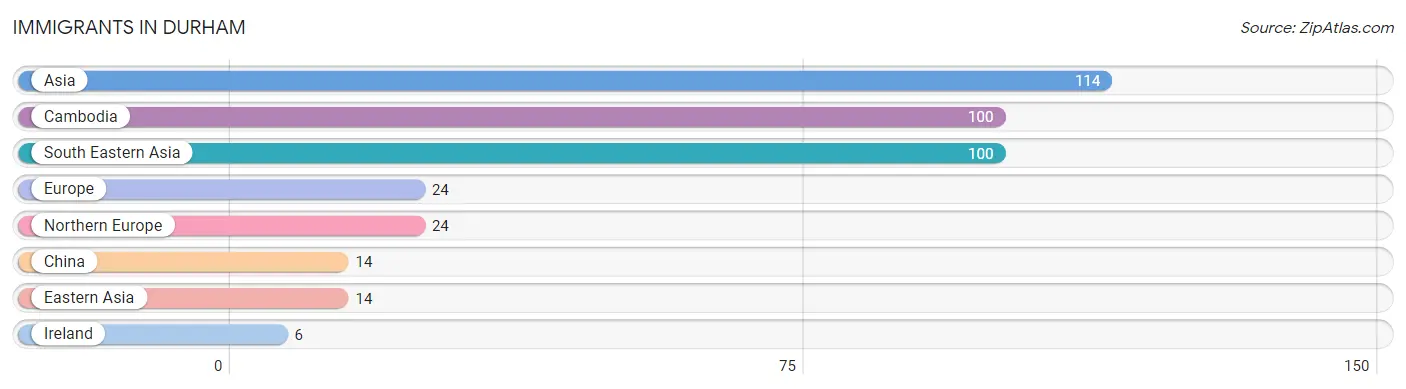
| Immigration Origin | # Population | % Population |
| Asia | 114 | 3.3% |
| Cambodia | 100 | 2.9% |
| China | 14 | 0.4% |
| Eastern Asia | 14 | 0.4% |
| Europe | 24 | 0.7% |
| Ireland | 6 | 0.2% |
| Northern Europe | 24 | 0.7% |
| South Eastern Asia | 100 | 2.9% | View All 8 Rows |
Sex and Age in Durham
Sex and Age in Durham
The most populous age groups in Durham are 30 to 34 Years (214 | 11.7%) for men and 50 to 54 Years (216 | 13.2%) for women.
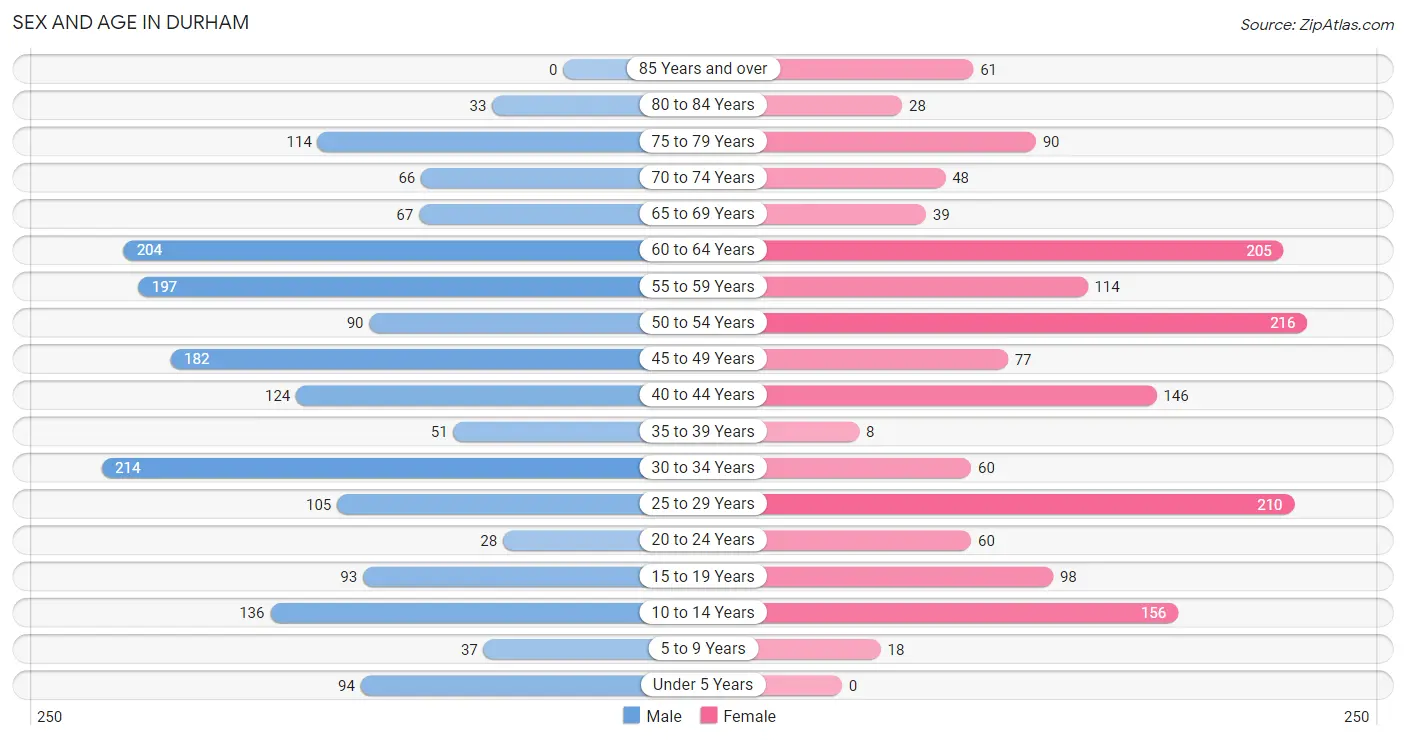
| Age Bracket | Male | Female |
| Under 5 Years | 94 (5.1%) | 0 (0.0%) |
| 5 to 9 Years | 37 (2.0%) | 18 (1.1%) |
| 10 to 14 Years | 136 (7.4%) | 156 (9.6%) |
| 15 to 19 Years | 93 (5.1%) | 98 (6.0%) |
| 20 to 24 Years | 28 (1.5%) | 60 (3.7%) |
| 25 to 29 Years | 105 (5.7%) | 210 (12.9%) |
| 30 to 34 Years | 214 (11.7%) | 60 (3.7%) |
| 35 to 39 Years | 51 (2.8%) | 8 (0.5%) |
| 40 to 44 Years | 124 (6.8%) | 146 (8.9%) |
| 45 to 49 Years | 182 (9.9%) | 77 (4.7%) |
| 50 to 54 Years | 90 (4.9%) | 216 (13.2%) |
| 55 to 59 Years | 197 (10.7%) | 114 (7.0%) |
| 60 to 64 Years | 204 (11.1%) | 205 (12.6%) |
| 65 to 69 Years | 67 (3.6%) | 39 (2.4%) |
| 70 to 74 Years | 66 (3.6%) | 48 (2.9%) |
| 75 to 79 Years | 114 (6.2%) | 90 (5.5%) |
| 80 to 84 Years | 33 (1.8%) | 28 (1.7%) |
| 85 Years and over | 0 (0.0%) | 61 (3.7%) |
| Total | 1,835 (100.0%) | 1,634 (100.0%) |
Families and Households in Durham
Median Family Size in Durham
The median family size in Durham is 2.75 persons per family, with married-couple families (825 | 86.1%) accounting for the largest median family size of 2.8 persons per family. On the other hand, single male/father families (42 | 4.4%) represent the smallest median family size with 2.19 persons per family.
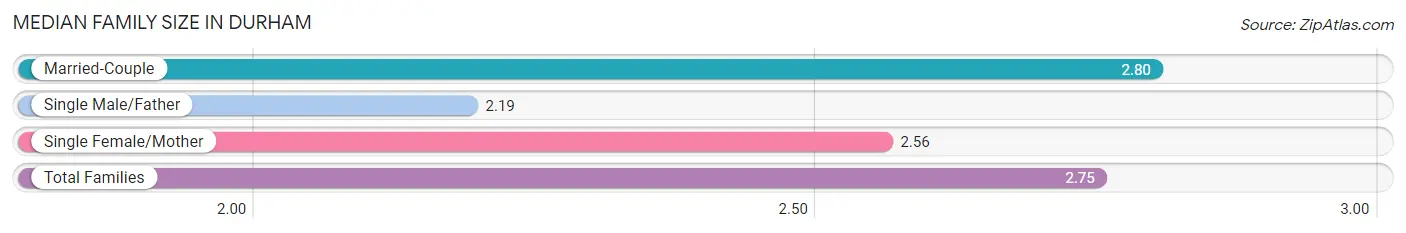
| Family Type | # Families | Family Size |
| Married-Couple | 825 (86.1%) | 2.80 |
| Single Male/Father | 42 (4.4%) | 2.19 |
| Single Female/Mother | 91 (9.5%) | 2.56 |
| Total Families | 958 (100.0%) | 2.75 |
Median Household Size in Durham
The median household size in Durham is 2.37 persons per household, with single female/mother households (91 | 6.2%) accounting for the largest median household size of 3.98 persons per household. non-family households (501 | 34.3%) represent the smallest median household size with 1.36 persons per household.
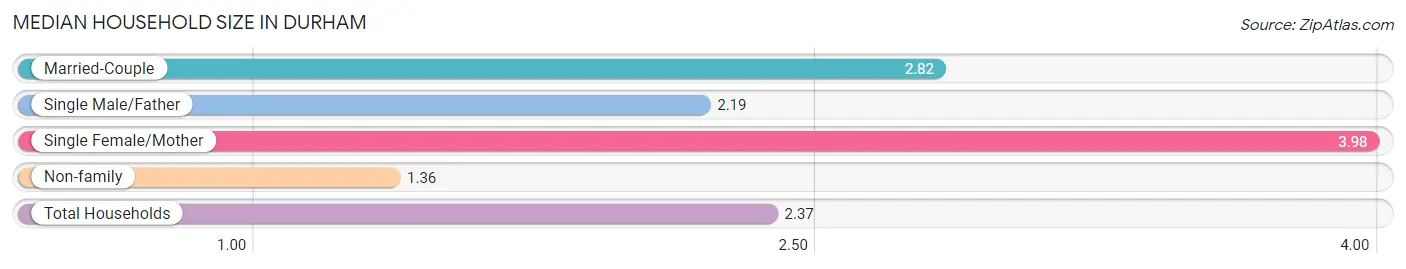
| Household Type | # Households | Household Size |
| Married-Couple | 825 (56.6%) | 2.82 |
| Single Male/Father | 42 (2.9%) | 2.19 |
| Single Female/Mother | 91 (6.2%) | 3.98 |
| Non-family | 501 (34.3%) | 1.36 |
| Total Households | 1,459 (100.0%) | 2.37 |
Household Size by Marriage Status in Durham
Out of a total of 1,459 households in Durham, 958 (65.7%) are family households, while 501 (34.3%) are nonfamily households. The most numerous type of family households are 2-person households, comprising 495, and the most common type of nonfamily households are 1-person households, comprising 389.
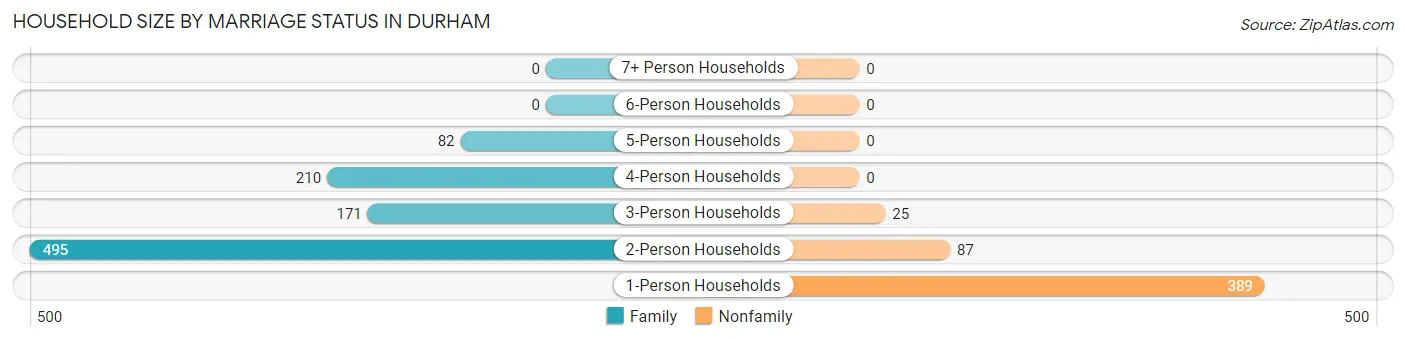
| Household Size | Family Households | Nonfamily Households |
| 1-Person Households | - | 389 (26.7%) |
| 2-Person Households | 495 (33.9%) | 87 (6.0%) |
| 3-Person Households | 171 (11.7%) | 25 (1.7%) |
| 4-Person Households | 210 (14.4%) | 0 (0.0%) |
| 5-Person Households | 82 (5.6%) | 0 (0.0%) |
| 6-Person Households | 0 (0.0%) | 0 (0.0%) |
| 7+ Person Households | 0 (0.0%) | 0 (0.0%) |
| Total | 958 (65.7%) | 501 (34.3%) |
Female Fertility in Durham
Fertility by Age in Durham
Average fertility rate in Durham is 47.0 births per 1,000 women. Women in the age bracket of 20 to 34 years have the highest fertility rate with 94.0 births per 1,000 women. Women in the age bracket of 20 to 34 years acount for 100.0% of all women with births.
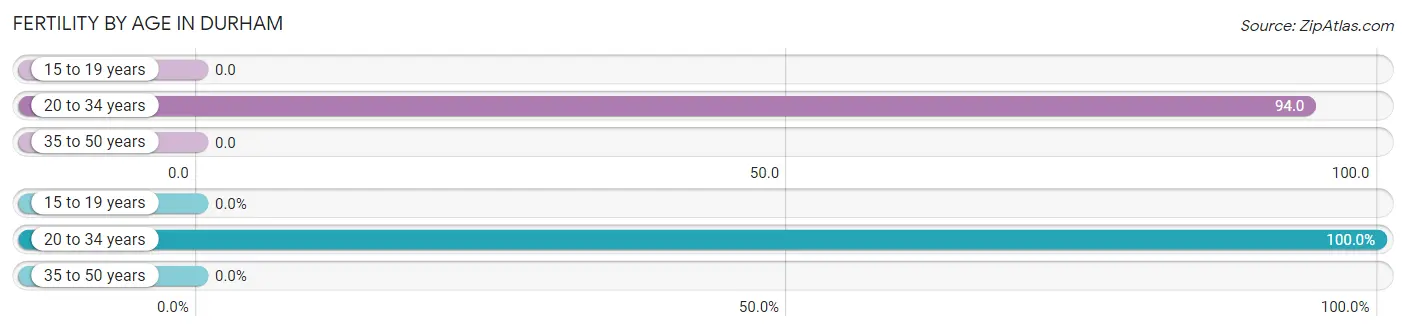
| Age Bracket | Women with Births | Births / 1,000 Women |
| 15 to 19 years | 0 (0.0%) | 0.0 |
| 20 to 34 years | 31 (100.0%) | 94.0 |
| 35 to 50 years | 0 (0.0%) | 0.0 |
| Total | 31 (100.0%) | 47.0 |
Fertility by Age by Marriage Status in Durham
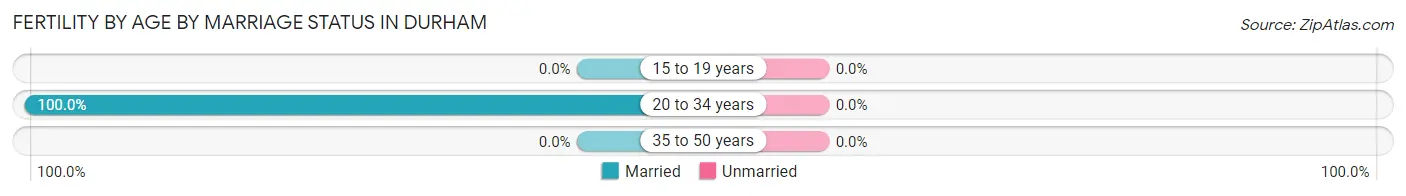
| Age Bracket | Married | Unmarried |
| 15 to 19 years | 0 (0.0%) | 0 (0.0%) |
| 20 to 34 years | 31 (100.0%) | 0 (0.0%) |
| 35 to 50 years | 0 (0.0%) | 0 (0.0%) |
| Total | 31 (100.0%) | 0 (0.0%) |
Fertility by Education in Durham
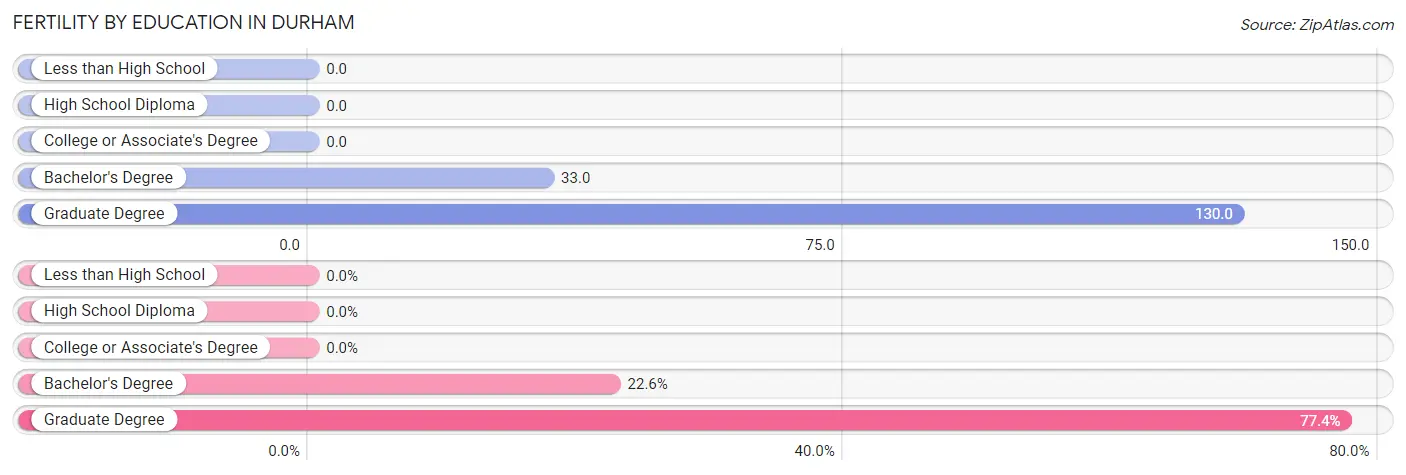
| Educational Attainment | Women with Births | Births / 1,000 Women |
| Less than High School | 0 (0.0%) | 0.0 |
| High School Diploma | 0 (0.0%) | 0.0 |
| College or Associate's Degree | 0 (0.0%) | 0.0 |
| Bachelor's Degree | 7 (22.6%) | 33.0 |
| Graduate Degree | 24 (77.4%) | 130.0 |
| Total | 31 (100.0%) | 47.0 |
Fertility by Education by Marriage Status in Durham
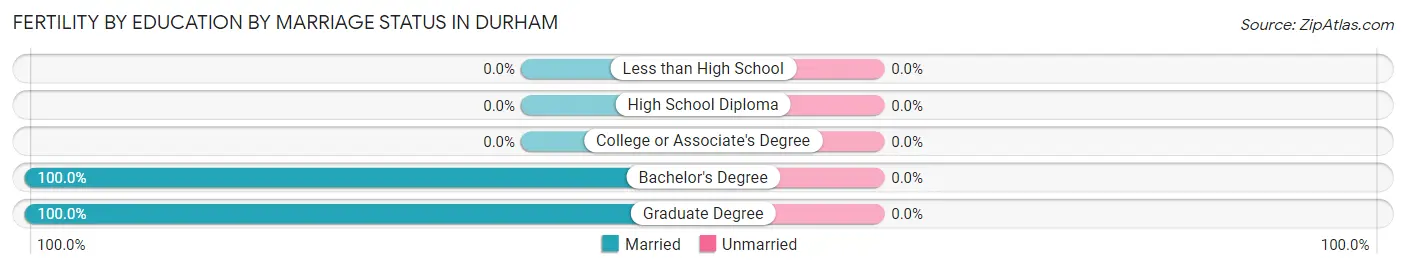
| Educational Attainment | Married | Unmarried |
| Less than High School | 0 (0.0%) | 0 (0.0%) |
| High School Diploma | 0 (0.0%) | 0 (0.0%) |
| College or Associate's Degree | 0 (0.0%) | 0 (0.0%) |
| Bachelor's Degree | 7 (100.0%) | 0 (0.0%) |
| Graduate Degree | 24 (100.0%) | 0 (0.0%) |
| Total | 31 (100.0%) | 0 (0.0%) |
Employment Characteristics in Durham
Employment by Class of Employer in Durham
Among the 2,046 employed individuals in Durham, private company employees (1,261 | 61.6%), self-employed (not incorporated) (217 | 10.6%), and local government employees (189 | 9.2%) make up the most common classes of employment.
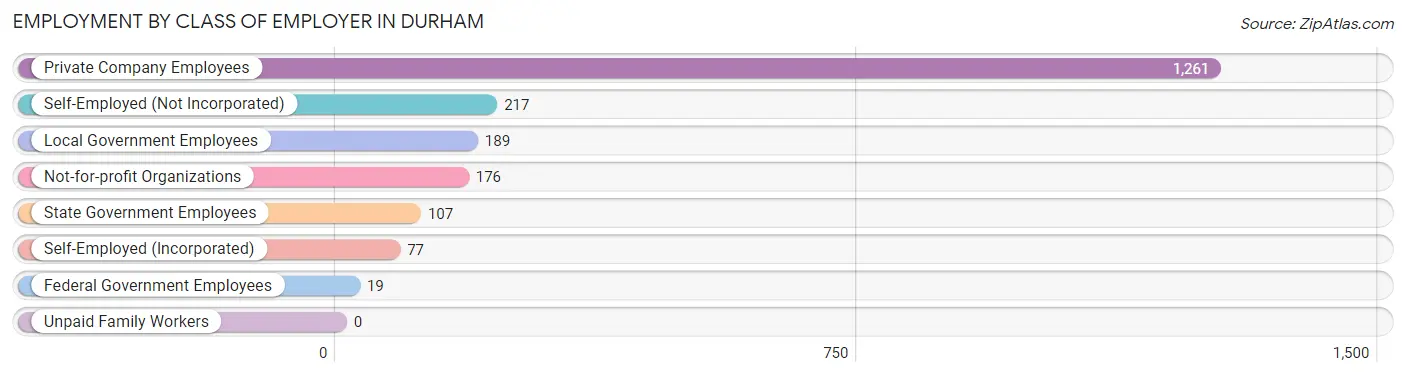
| Employer Class | # Employees | % Employees |
| Private Company Employees | 1,261 | 61.6% |
| Self-Employed (Incorporated) | 77 | 3.8% |
| Self-Employed (Not Incorporated) | 217 | 10.6% |
| Not-for-profit Organizations | 176 | 8.6% |
| Local Government Employees | 189 | 9.2% |
| State Government Employees | 107 | 5.2% |
| Federal Government Employees | 19 | 0.9% |
| Unpaid Family Workers | 0 | 0.0% |
| Total | 2,046 | 100.0% |
Employment Status by Age in Durham
According to the labor force statistics for Durham, out of the total population over 16 years of age (2,998), 73.7% or 2,210 individuals are in the labor force, with 6.0% or 133 of them unemployed. The age group with the highest labor force participation rate is 20 to 24 years, with 100.0% or 88 individuals in the labor force. Within the labor force, the 30 to 34 years age range has the highest percentage of unemployed individuals, with 41.2% or 105 of them being unemployed.
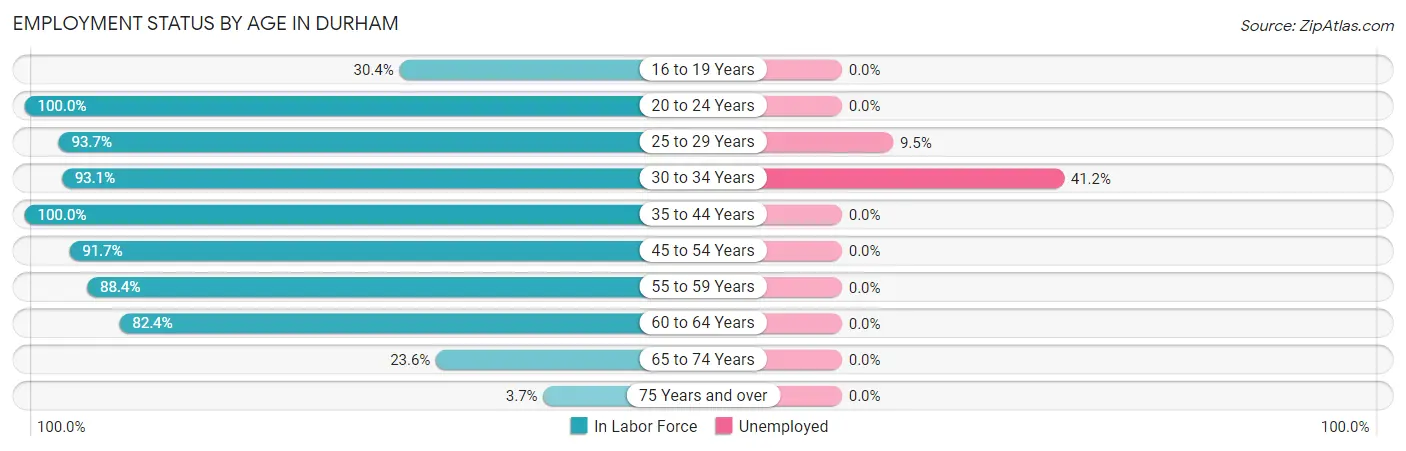
| Age Bracket | In Labor Force | Unemployed |
| 16 to 19 Years | 49 (30.4%) | 0 (0.0%) |
| 20 to 24 Years | 88 (100.0%) | 0 (0.0%) |
| 25 to 29 Years | 295 (93.7%) | 28 (9.5%) |
| 30 to 34 Years | 255 (93.1%) | 105 (41.2%) |
| 35 to 44 Years | 329 (100.0%) | 0 (0.0%) |
| 45 to 54 Years | 518 (91.7%) | 0 (0.0%) |
| 55 to 59 Years | 275 (88.4%) | 0 (0.0%) |
| 60 to 64 Years | 337 (82.4%) | 0 (0.0%) |
| 65 to 74 Years | 52 (23.6%) | 0 (0.0%) |
| 75 Years and over | 12 (3.7%) | 0 (0.0%) |
| Total | 2,210 (73.7%) | 133 (6.0%) |
Employment Status by Educational Attainment in Durham
According to labor force statistics for Durham, 91.2% of individuals (2,009) out of the total population between 25 and 64 years of age (2,203) are in the labor force, with 6.6% or 133 of them being unemployed. The group with the highest labor force participation rate are those with the educational attainment of less than high school, with 100.0% or 91 individuals in the labor force. Within the labor force, individuals with high school diploma education have the highest percentage of unemployment, with 16.3% or 99 of them being unemployed.
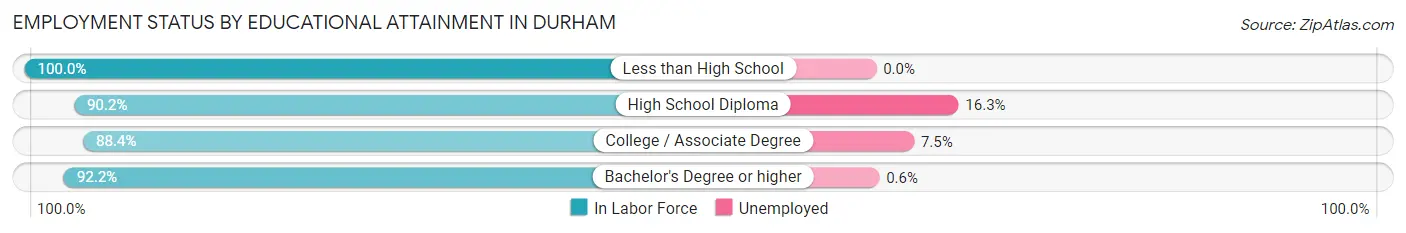
| Educational Attainment | In Labor Force | Unemployed |
| Less than High School | 91 (100.0%) | 0 (0.0%) |
| High School Diploma | 607 (90.2%) | 110 (16.3%) |
| College / Associate Degree | 372 (88.4%) | 32 (7.5%) |
| Bachelor's Degree or higher | 939 (92.2%) | 6 (0.6%) |
| Total | 2,009 (91.2%) | 145 (6.6%) |
Employment Occupations by Sex in Durham
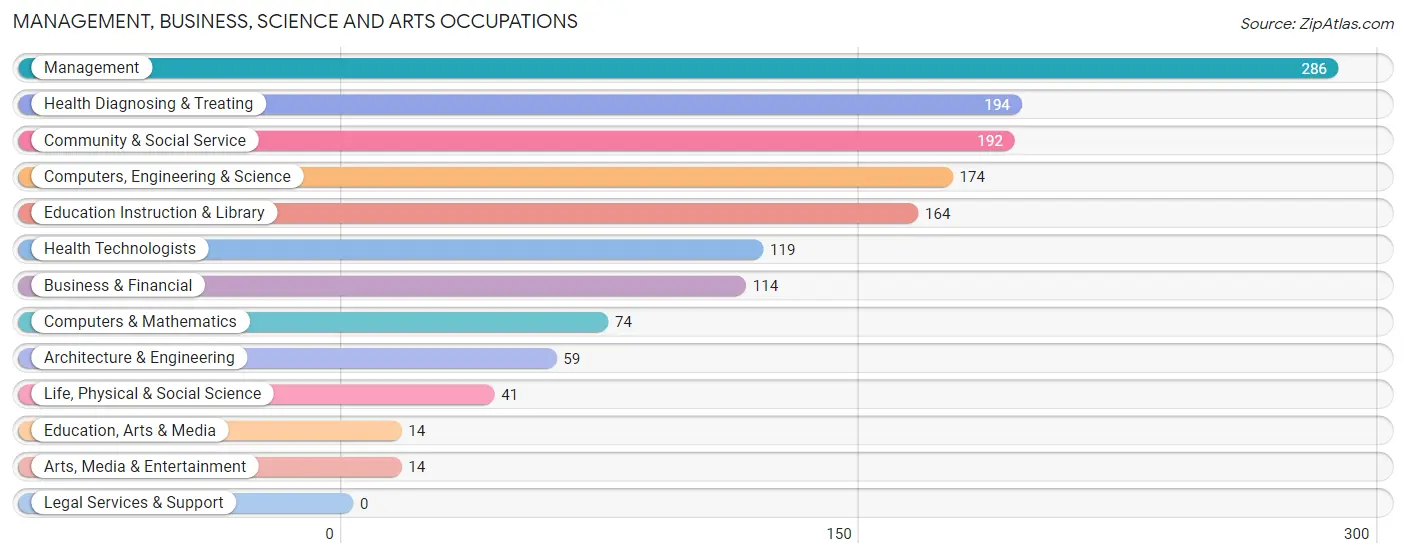
Management, Business, Science and Arts Occupations
The most common Management, Business, Science and Arts occupations in Durham are Management (286 | 13.8%), Health Diagnosing & Treating (194 | 9.3%), Community & Social Service (192 | 9.2%), Computers, Engineering & Science (174 | 8.4%), and Education Instruction & Library (164 | 7.9%).
Management, Business, Science and Arts Occupations by Sex
Within the Management, Business, Science and Arts occupations in Durham, the most male-oriented occupations are Computers & Mathematics (100.0%), Education, Arts & Media (100.0%), and Arts, Media & Entertainment (100.0%), while the most female-oriented occupations are Life, Physical & Social Science (100.0%), Health Technologists (100.0%), and Business & Financial (91.2%).
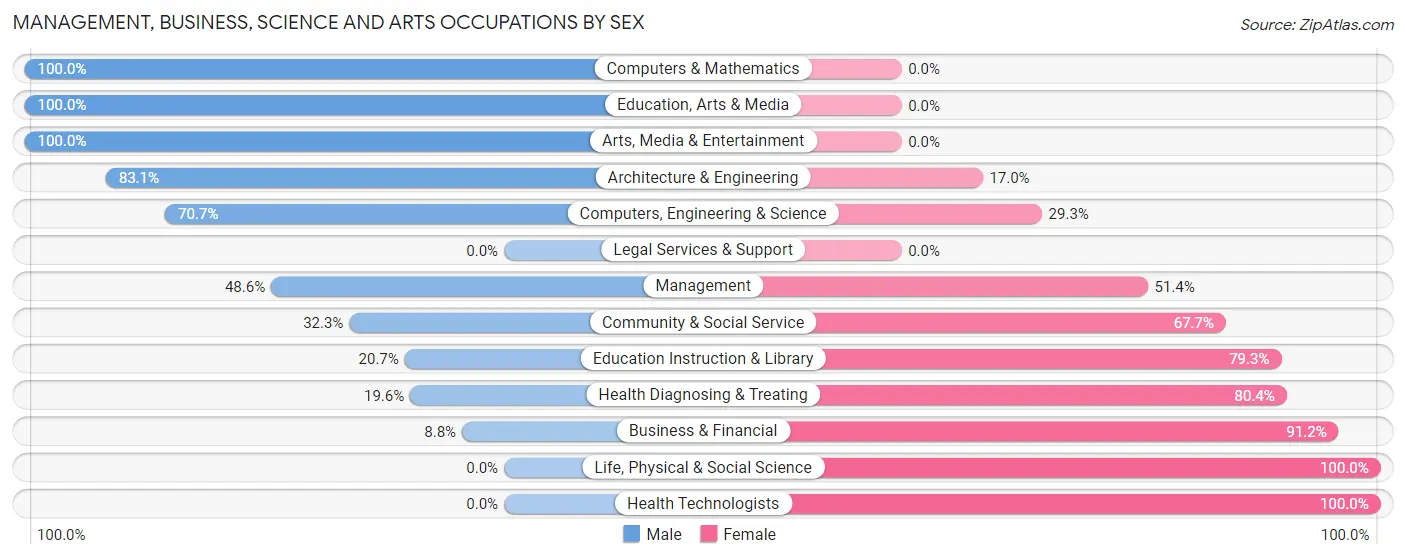
| Occupation | Male | Female |
| Management | 139 (48.6%) | 147 (51.4%) |
| Business & Financial | 10 (8.8%) | 104 (91.2%) |
| Computers, Engineering & Science | 123 (70.7%) | 51 (29.3%) |
| Computers & Mathematics | 74 (100.0%) | 0 (0.0%) |
| Architecture & Engineering | 49 (83.1%) | 10 (17.0%) |
| Life, Physical & Social Science | 0 (0.0%) | 41 (100.0%) |
| Community & Social Service | 62 (32.3%) | 130 (67.7%) |
| Education, Arts & Media | 14 (100.0%) | 0 (0.0%) |
| Legal Services & Support | 0 (0.0%) | 0 (0.0%) |
| Education Instruction & Library | 34 (20.7%) | 130 (79.3%) |
| Arts, Media & Entertainment | 14 (100.0%) | 0 (0.0%) |
| Health Diagnosing & Treating | 38 (19.6%) | 156 (80.4%) |
| Health Technologists | 0 (0.0%) | 119 (100.0%) |
| Total (Category) | 372 (38.8%) | 588 (61.3%) |
| Total (Overall) | 1,035 (49.8%) | 1,042 (50.2%) |
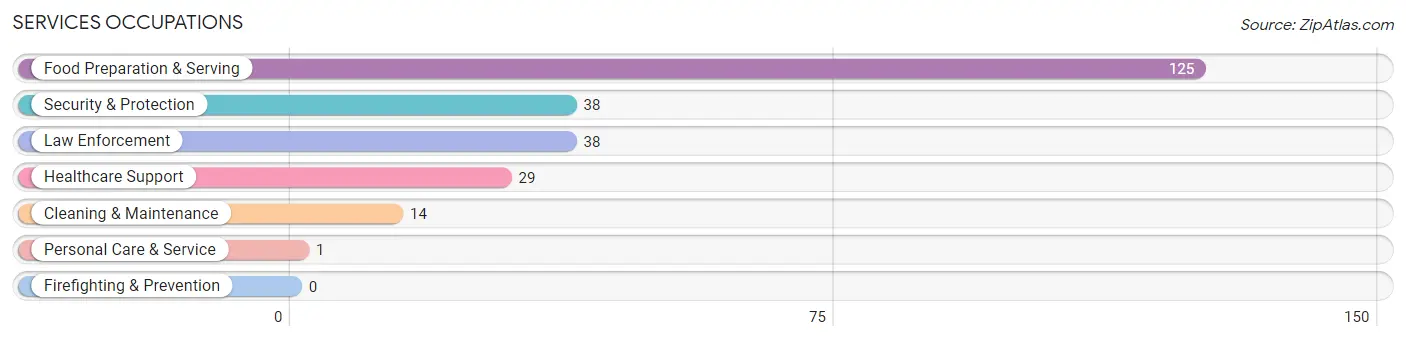
Services Occupations
The most common Services occupations in Durham are Food Preparation & Serving (125 | 6.0%), Security & Protection (38 | 1.8%), Law Enforcement (38 | 1.8%), Healthcare Support (29 | 1.4%), and Cleaning & Maintenance (14 | 0.7%).
Services Occupations by Sex
Within the Services occupations in Durham, the most male-oriented occupations are Security & Protection (100.0%), Law Enforcement (100.0%), and Cleaning & Maintenance (100.0%), while the most female-oriented occupations are Healthcare Support (93.1%), and Food Preparation & Serving (77.6%).
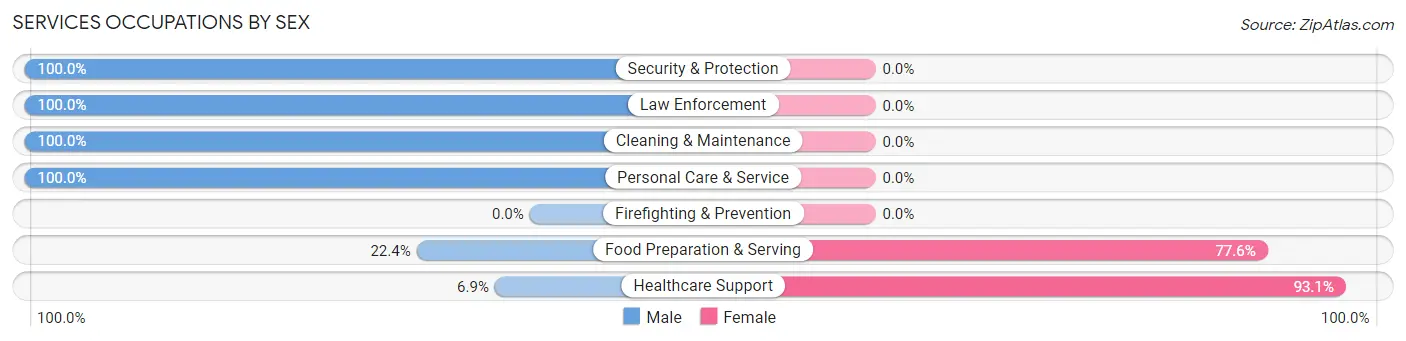
| Occupation | Male | Female |
| Healthcare Support | 2 (6.9%) | 27 (93.1%) |
| Security & Protection | 38 (100.0%) | 0 (0.0%) |
| Firefighting & Prevention | 0 (0.0%) | 0 (0.0%) |
| Law Enforcement | 38 (100.0%) | 0 (0.0%) |
| Food Preparation & Serving | 28 (22.4%) | 97 (77.6%) |
| Cleaning & Maintenance | 14 (100.0%) | 0 (0.0%) |
| Personal Care & Service | 1 (100.0%) | 0 (0.0%) |
| Total (Category) | 83 (40.1%) | 124 (59.9%) |
| Total (Overall) | 1,035 (49.8%) | 1,042 (50.2%) |
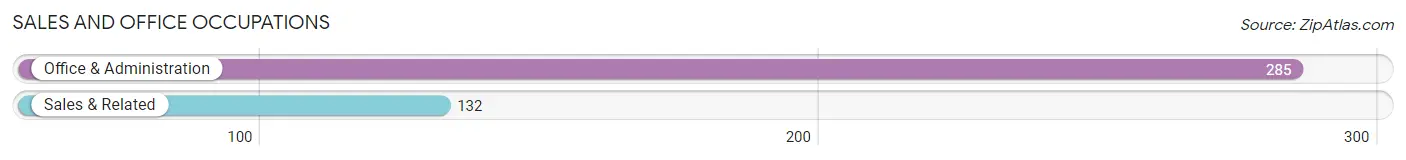
Sales and Office Occupations
The most common Sales and Office occupations in Durham are Office & Administration (285 | 13.7%), and Sales & Related (132 | 6.4%).
Sales and Office Occupations by Sex
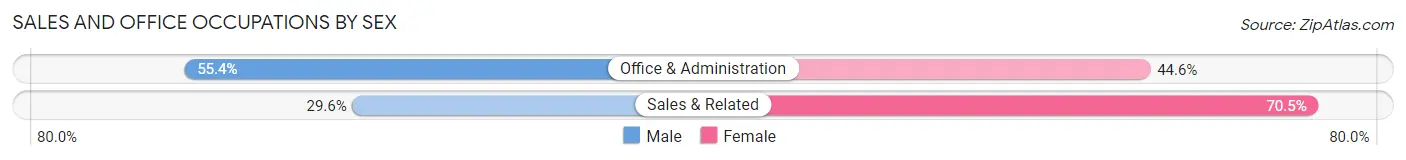
| Occupation | Male | Female |
| Sales & Related | 39 (29.5%) | 93 (70.5%) |
| Office & Administration | 158 (55.4%) | 127 (44.6%) |
| Total (Category) | 197 (47.2%) | 220 (52.8%) |
| Total (Overall) | 1,035 (49.8%) | 1,042 (50.2%) |
Natural Resources, Construction and Maintenance Occupations
The most common Natural Resources, Construction and Maintenance occupations in Durham are Construction & Extraction (129 | 6.2%), and Installation, Maintenance & Repair (74 | 3.6%).
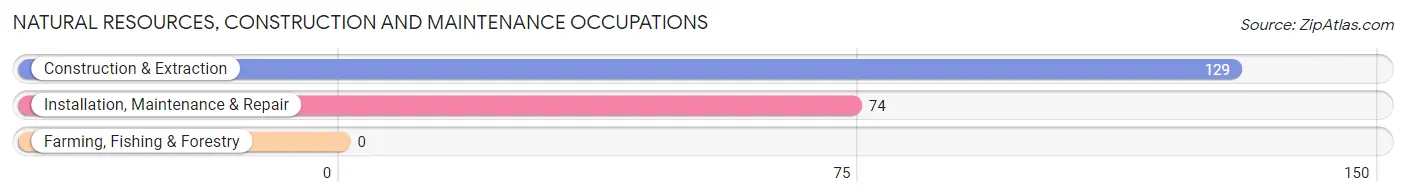
Natural Resources, Construction and Maintenance Occupations by Sex
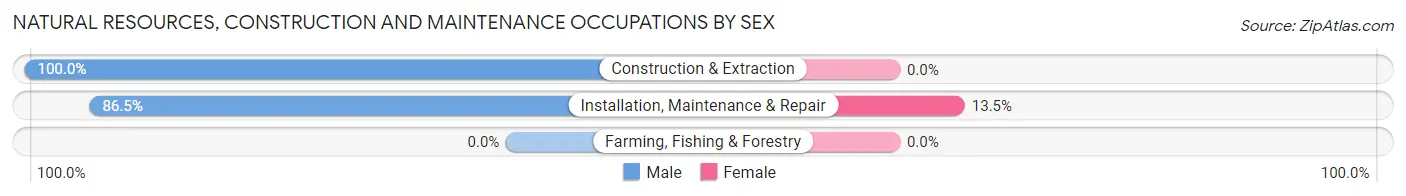
| Occupation | Male | Female |
| Farming, Fishing & Forestry | 0 (0.0%) | 0 (0.0%) |
| Construction & Extraction | 129 (100.0%) | 0 (0.0%) |
| Installation, Maintenance & Repair | 64 (86.5%) | 10 (13.5%) |
| Total (Category) | 193 (95.1%) | 10 (4.9%) |
| Total (Overall) | 1,035 (49.8%) | 1,042 (50.2%) |
Production, Transportation and Moving Occupations
The most common Production, Transportation and Moving occupations in Durham are Production (227 | 10.9%), and Transportation (63 | 3.0%).
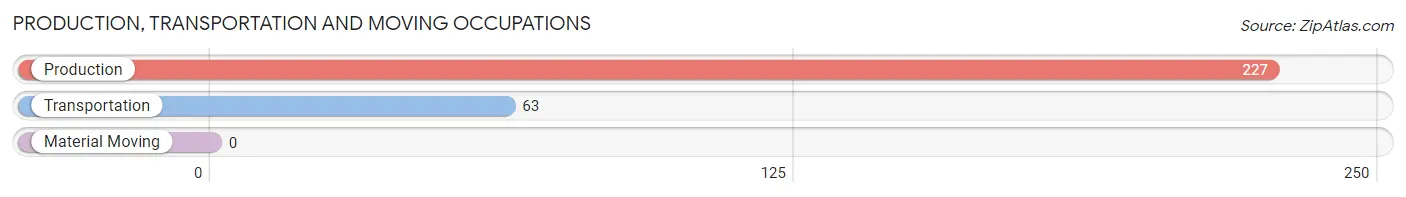
Production, Transportation and Moving Occupations by Sex
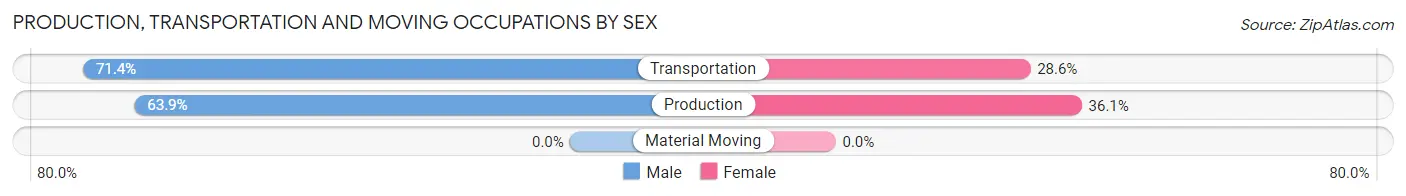
| Occupation | Male | Female |
| Production | 145 (63.9%) | 82 (36.1%) |
| Transportation | 45 (71.4%) | 18 (28.6%) |
| Material Moving | 0 (0.0%) | 0 (0.0%) |
| Total (Category) | 190 (65.5%) | 100 (34.5%) |
| Total (Overall) | 1,035 (49.8%) | 1,042 (50.2%) |
Employment Industries by Sex in Durham
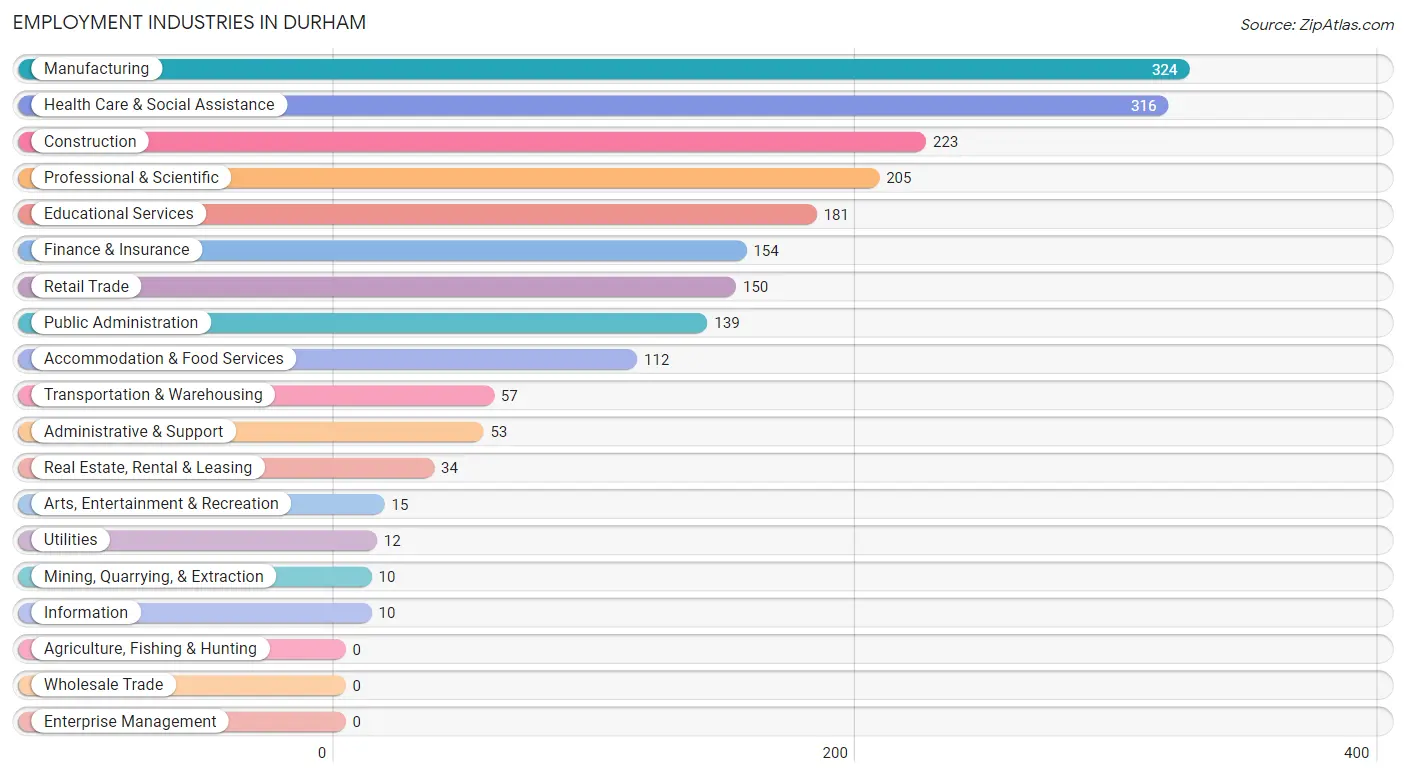
Employment Industries in Durham
The major employment industries in Durham include Manufacturing (324 | 15.6%), Health Care & Social Assistance (316 | 15.2%), Construction (223 | 10.7%), Professional & Scientific (205 | 9.9%), and Educational Services (181 | 8.7%).
Employment Industries by Sex in Durham
The Durham industries that see more men than women are Mining, Quarrying, & Extraction (100.0%), Utilities (100.0%), and Real Estate, Rental & Leasing (100.0%), whereas the industries that tend to have a higher number of women are Information (100.0%), Retail Trade (94.0%), and Educational Services (80.1%).
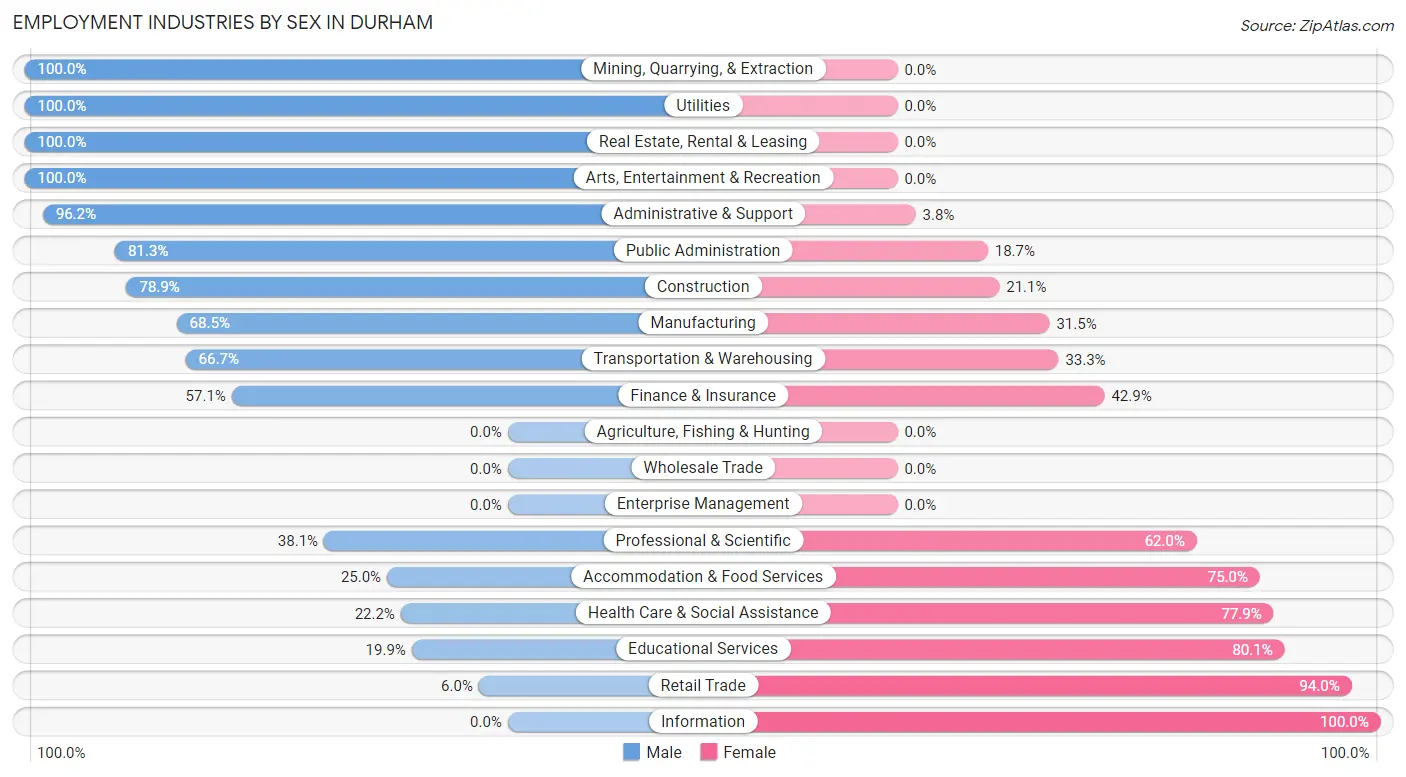
| Industry | Male | Female |
| Agriculture, Fishing & Hunting | 0 (0.0%) | 0 (0.0%) |
| Mining, Quarrying, & Extraction | 10 (100.0%) | 0 (0.0%) |
| Construction | 176 (78.9%) | 47 (21.1%) |
| Manufacturing | 222 (68.5%) | 102 (31.5%) |
| Wholesale Trade | 0 (0.0%) | 0 (0.0%) |
| Retail Trade | 9 (6.0%) | 141 (94.0%) |
| Transportation & Warehousing | 38 (66.7%) | 19 (33.3%) |
| Utilities | 12 (100.0%) | 0 (0.0%) |
| Information | 0 (0.0%) | 10 (100.0%) |
| Finance & Insurance | 88 (57.1%) | 66 (42.9%) |
| Real Estate, Rental & Leasing | 34 (100.0%) | 0 (0.0%) |
| Professional & Scientific | 78 (38.1%) | 127 (62.0%) |
| Enterprise Management | 0 (0.0%) | 0 (0.0%) |
| Administrative & Support | 51 (96.2%) | 2 (3.8%) |
| Educational Services | 36 (19.9%) | 145 (80.1%) |
| Health Care & Social Assistance | 70 (22.2%) | 246 (77.8%) |
| Arts, Entertainment & Recreation | 15 (100.0%) | 0 (0.0%) |
| Accommodation & Food Services | 28 (25.0%) | 84 (75.0%) |
| Public Administration | 113 (81.3%) | 26 (18.7%) |
| Total | 1,035 (49.8%) | 1,042 (50.2%) |
Education in Durham
School Enrollment in Durham
The most common levels of schooling among the 691 students in Durham are middle school (244 | 35.3%), high school (192 | 27.8%), and college / undergraduate (136 | 19.7%).
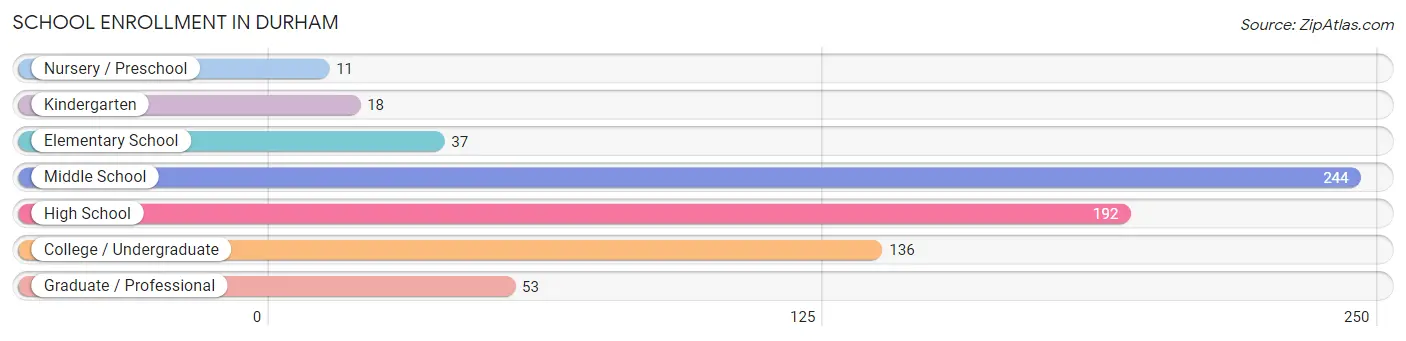
| School Level | # Students | % Students |
| Nursery / Preschool | 11 | 1.6% |
| Kindergarten | 18 | 2.6% |
| Elementary School | 37 | 5.3% |
| Middle School | 244 | 35.3% |
| High School | 192 | 27.8% |
| College / Undergraduate | 136 | 19.7% |
| Graduate / Professional | 53 | 7.7% |
| Total | 691 | 100.0% |
School Enrollment by Age by Funding Source in Durham
Out of a total of 691 students who are enrolled in schools in Durham, 143 (20.7%) attend a private institution, while the remaining 548 (79.3%) are enrolled in public schools. The age group of 5 to 9 year old has the highest likelihood of being enrolled in private schools, with 36 (65.4% in the age bracket) enrolled. Conversely, the age group of 3 to 4 year olds has the lowest likelihood of being enrolled in a private school, with 11 (100.0% in the age bracket) attending a public institution.
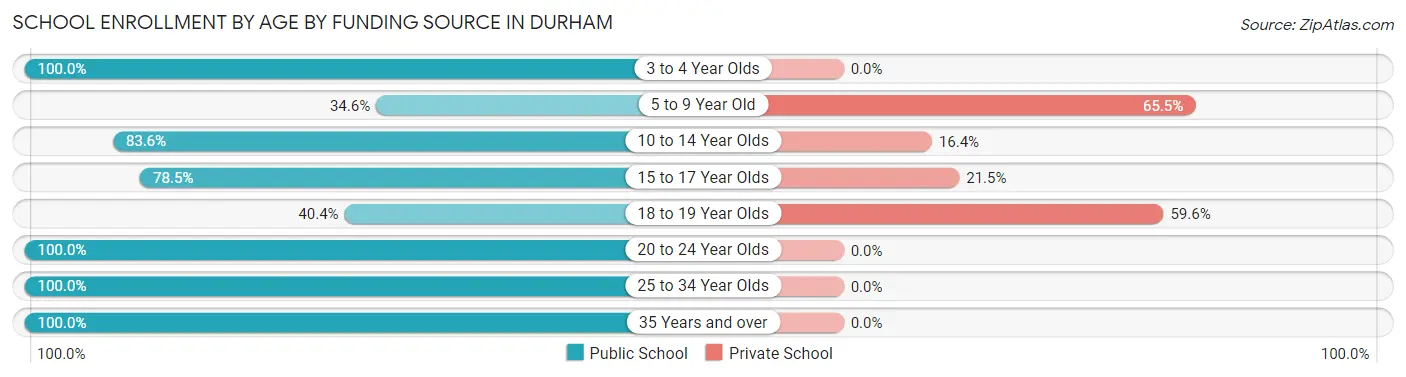
| Age Bracket | Public School | Private School |
| 3 to 4 Year Olds | 11 (100.0%) | 0 (0.0%) |
| 5 to 9 Year Old | 19 (34.5%) | 36 (65.4%) |
| 10 to 14 Year Olds | 244 (83.6%) | 48 (16.4%) |
| 15 to 17 Year Olds | 113 (78.5%) | 31 (21.5%) |
| 18 to 19 Year Olds | 19 (40.4%) | 28 (59.6%) |
| 20 to 24 Year Olds | 60 (100.0%) | 0 (0.0%) |
| 25 to 34 Year Olds | 13 (100.0%) | 0 (0.0%) |
| 35 Years and over | 69 (100.0%) | 0 (0.0%) |
| Total | 548 (79.3%) | 143 (20.7%) |
Educational Attainment by Field of Study in Durham
Business (220 | 18.1%), social sciences (208 | 17.1%), science & technology (200 | 16.4%), physical & health sciences (115 | 9.5%), and arts & humanities (104 | 8.6%) are the most common fields of study among 1,217 individuals in Durham who have obtained a bachelor's degree or higher.
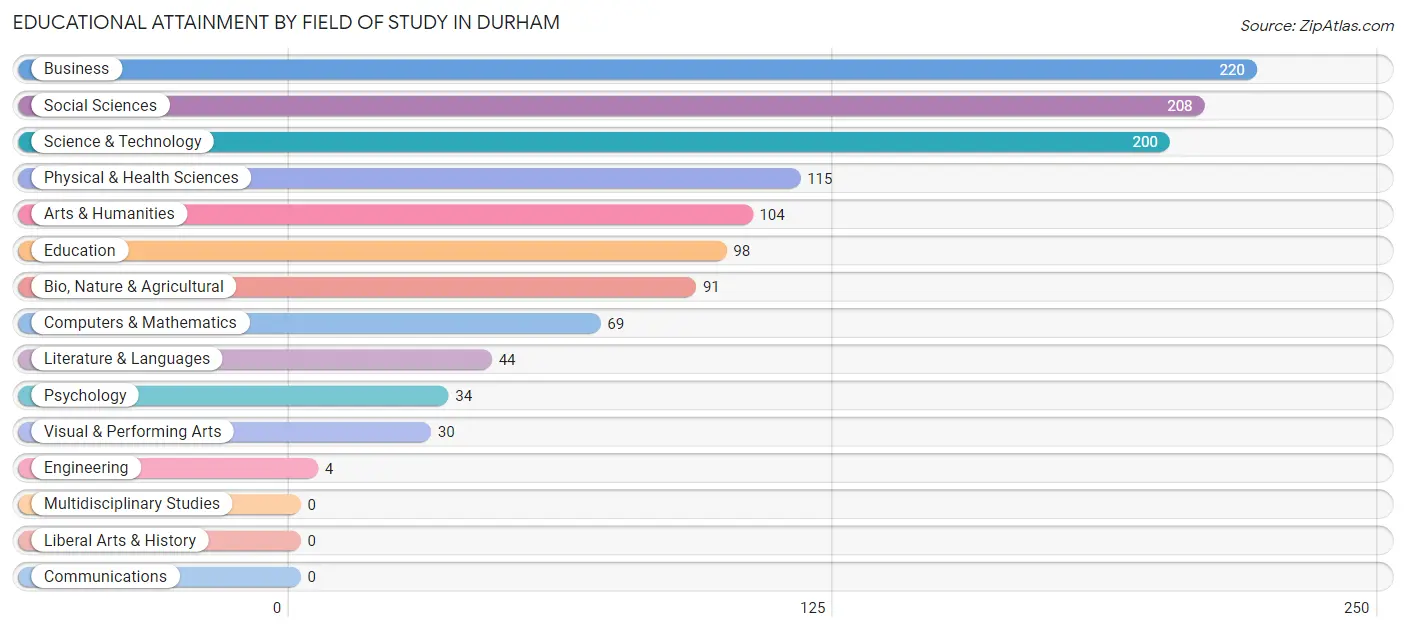
| Field of Study | # Graduates | % Graduates |
| Computers & Mathematics | 69 | 5.7% |
| Bio, Nature & Agricultural | 91 | 7.5% |
| Physical & Health Sciences | 115 | 9.5% |
| Psychology | 34 | 2.8% |
| Social Sciences | 208 | 17.1% |
| Engineering | 4 | 0.3% |
| Multidisciplinary Studies | 0 | 0.0% |
| Science & Technology | 200 | 16.4% |
| Business | 220 | 18.1% |
| Education | 98 | 8.1% |
| Literature & Languages | 44 | 3.6% |
| Liberal Arts & History | 0 | 0.0% |
| Visual & Performing Arts | 30 | 2.5% |
| Communications | 0 | 0.0% |
| Arts & Humanities | 104 | 8.6% |
| Total | 1,217 | 100.0% |
Transportation & Commute in Durham
Vehicle Availability by Sex in Durham
The most prevalent vehicle ownership categories in Durham are males with 2 vehicles (400, accounting for 38.7%) and females with 2 vehicles (457, making up 39.6%).
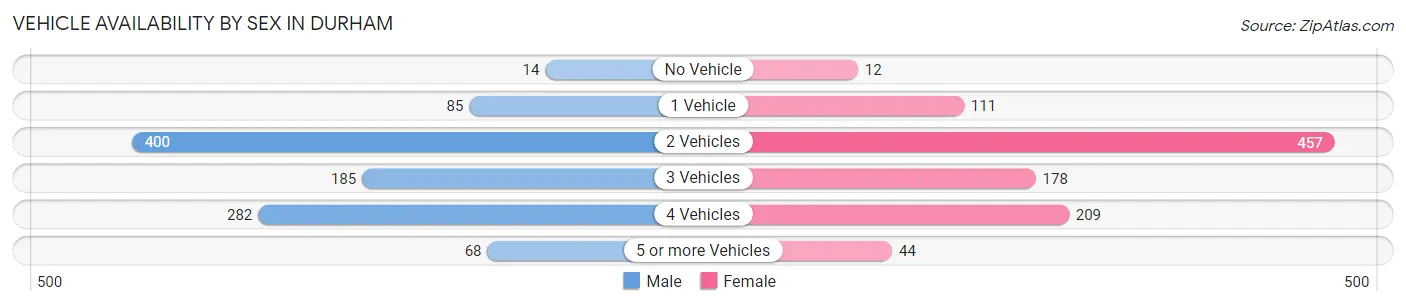
| Vehicles Available | Male | Female |
| No Vehicle | 14 (1.3%) | 12 (1.2%) |
| 1 Vehicle | 85 (8.2%) | 111 (11.0%) |
| 2 Vehicles | 400 (38.7%) | 457 (45.2%) |
| 3 Vehicles | 185 (17.9%) | 178 (17.6%) |
| 4 Vehicles | 282 (27.3%) | 209 (20.7%) |
| 5 or more Vehicles | 68 (6.6%) | 44 (4.3%) |
| Total | 1,034 (100.0%) | 1,011 (100.0%) |
Commute Time in Durham
The most frequently occuring commute durations in Durham are 20 to 24 minutes (403 commuters, 24.1%), 15 to 19 minutes (253 commuters, 15.1%), and 30 to 34 minutes (209 commuters, 12.5%).
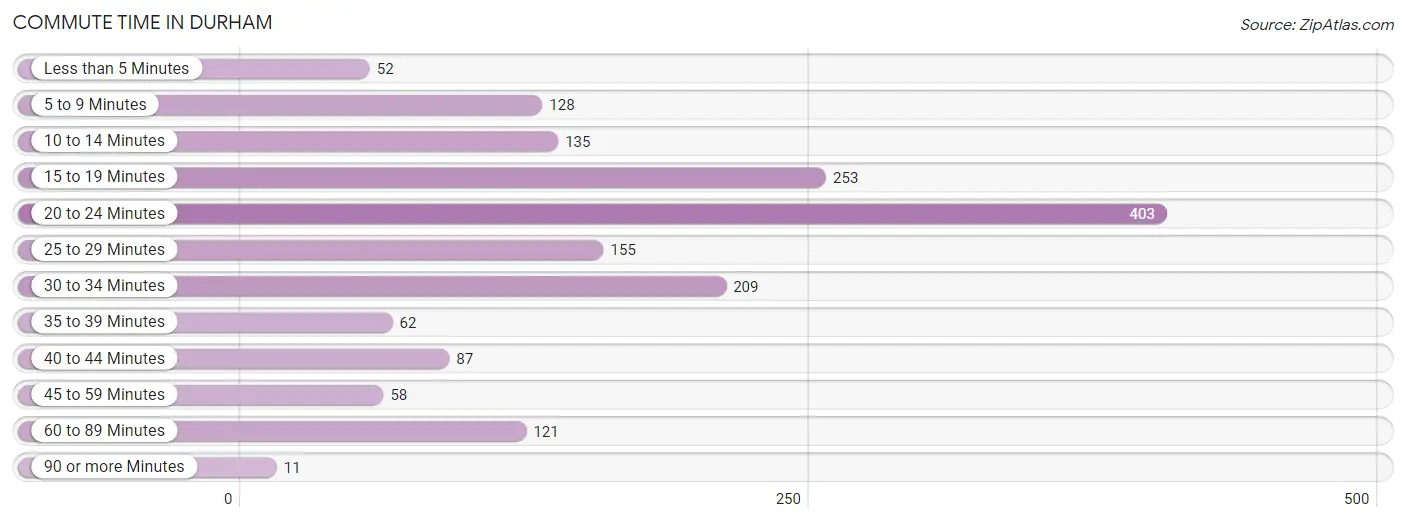
| Commute Time | # Commuters | % Commuters |
| Less than 5 Minutes | 52 | 3.1% |
| 5 to 9 Minutes | 128 | 7.6% |
| 10 to 14 Minutes | 135 | 8.1% |
| 15 to 19 Minutes | 253 | 15.1% |
| 20 to 24 Minutes | 403 | 24.1% |
| 25 to 29 Minutes | 155 | 9.3% |
| 30 to 34 Minutes | 209 | 12.5% |
| 35 to 39 Minutes | 62 | 3.7% |
| 40 to 44 Minutes | 87 | 5.2% |
| 45 to 59 Minutes | 58 | 3.5% |
| 60 to 89 Minutes | 121 | 7.2% |
| 90 or more Minutes | 11 | 0.7% |
Commute Time by Sex in Durham
The most common commute times in Durham are 20 to 24 minutes (214 commuters, 27.7%) for males and 20 to 24 minutes (189 commuters, 20.9%) for females.
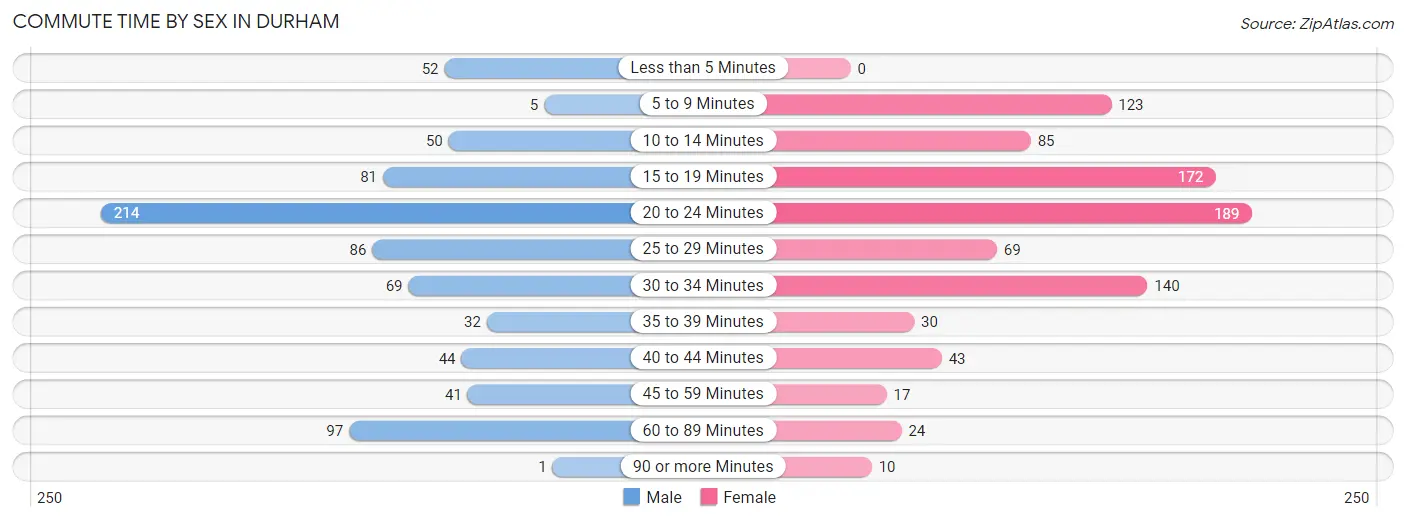
| Commute Time | Male | Female |
| Less than 5 Minutes | 52 (6.7%) | 0 (0.0%) |
| 5 to 9 Minutes | 5 (0.6%) | 123 (13.6%) |
| 10 to 14 Minutes | 50 (6.5%) | 85 (9.4%) |
| 15 to 19 Minutes | 81 (10.5%) | 172 (19.1%) |
| 20 to 24 Minutes | 214 (27.7%) | 189 (20.9%) |
| 25 to 29 Minutes | 86 (11.1%) | 69 (7.6%) |
| 30 to 34 Minutes | 69 (8.9%) | 140 (15.5%) |
| 35 to 39 Minutes | 32 (4.2%) | 30 (3.3%) |
| 40 to 44 Minutes | 44 (5.7%) | 43 (4.8%) |
| 45 to 59 Minutes | 41 (5.3%) | 17 (1.9%) |
| 60 to 89 Minutes | 97 (12.6%) | 24 (2.7%) |
| 90 or more Minutes | 1 (0.1%) | 10 (1.1%) |
Time of Departure to Work by Sex in Durham
The most frequent times of departure to work in Durham are 7:00 AM to 7:29 AM (158, 20.5%) for males and 6:30 AM to 6:59 AM (220, 24.4%) for females.
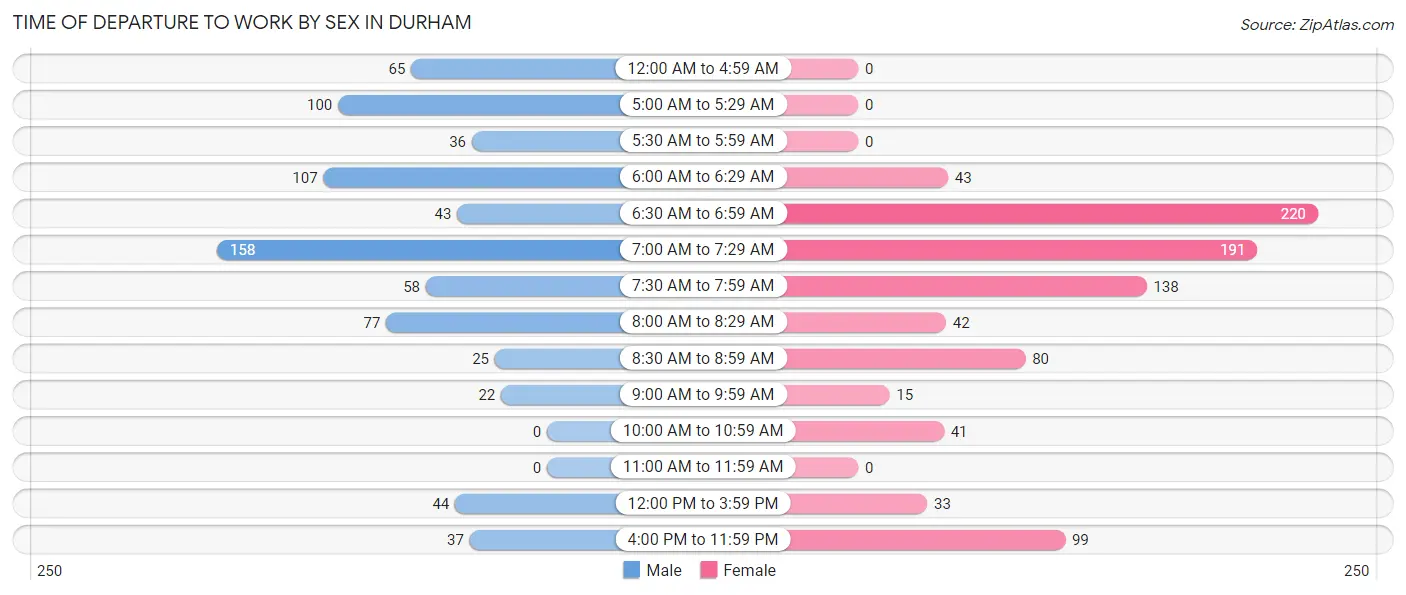
| Time of Departure | Male | Female |
| 12:00 AM to 4:59 AM | 65 (8.4%) | 0 (0.0%) |
| 5:00 AM to 5:29 AM | 100 (13.0%) | 0 (0.0%) |
| 5:30 AM to 5:59 AM | 36 (4.7%) | 0 (0.0%) |
| 6:00 AM to 6:29 AM | 107 (13.9%) | 43 (4.8%) |
| 6:30 AM to 6:59 AM | 43 (5.6%) | 220 (24.4%) |
| 7:00 AM to 7:29 AM | 158 (20.5%) | 191 (21.2%) |
| 7:30 AM to 7:59 AM | 58 (7.5%) | 138 (15.3%) |
| 8:00 AM to 8:29 AM | 77 (10.0%) | 42 (4.7%) |
| 8:30 AM to 8:59 AM | 25 (3.2%) | 80 (8.9%) |
| 9:00 AM to 9:59 AM | 22 (2.9%) | 15 (1.7%) |
| 10:00 AM to 10:59 AM | 0 (0.0%) | 41 (4.5%) |
| 11:00 AM to 11:59 AM | 0 (0.0%) | 0 (0.0%) |
| 12:00 PM to 3:59 PM | 44 (5.7%) | 33 (3.7%) |
| 4:00 PM to 11:59 PM | 37 (4.8%) | 99 (11.0%) |
| Total | 772 (100.0%) | 902 (100.0%) |
Housing Occupancy in Durham
Occupancy by Ownership in Durham
Of the total 1,459 dwellings in Durham, owner-occupied units account for 1,291 (88.5%), while renter-occupied units make up 168 (11.5%).
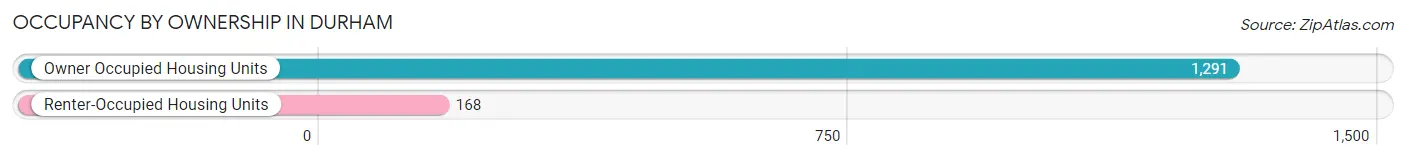
| Occupancy | # Housing Units | % Housing Units |
| Owner Occupied Housing Units | 1,291 | 88.5% |
| Renter-Occupied Housing Units | 168 | 11.5% |
| Total Occupied Housing Units | 1,459 | 100.0% |
Occupancy by Household Size in Durham
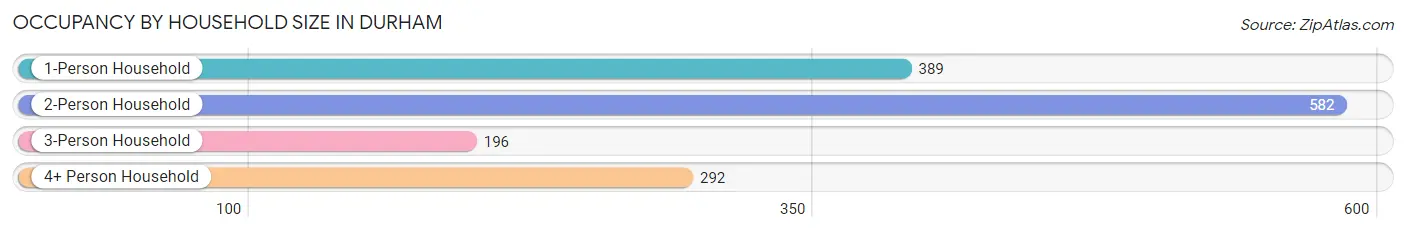
| Household Size | # Housing Units | % Housing Units |
| 1-Person Household | 389 | 26.7% |
| 2-Person Household | 582 | 39.9% |
| 3-Person Household | 196 | 13.4% |
| 4+ Person Household | 292 | 20.0% |
| Total Housing Units | 1,459 | 100.0% |
Occupancy by Ownership by Household Size in Durham
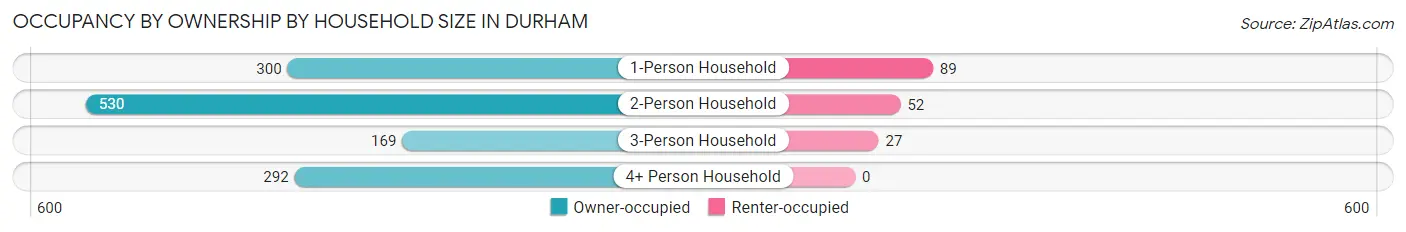
| Household Size | Owner-occupied | Renter-occupied |
| 1-Person Household | 300 (77.1%) | 89 (22.9%) |
| 2-Person Household | 530 (91.1%) | 52 (8.9%) |
| 3-Person Household | 169 (86.2%) | 27 (13.8%) |
| 4+ Person Household | 292 (100.0%) | 0 (0.0%) |
| Total Housing Units | 1,291 (88.5%) | 168 (11.5%) |
Occupancy by Educational Attainment in Durham
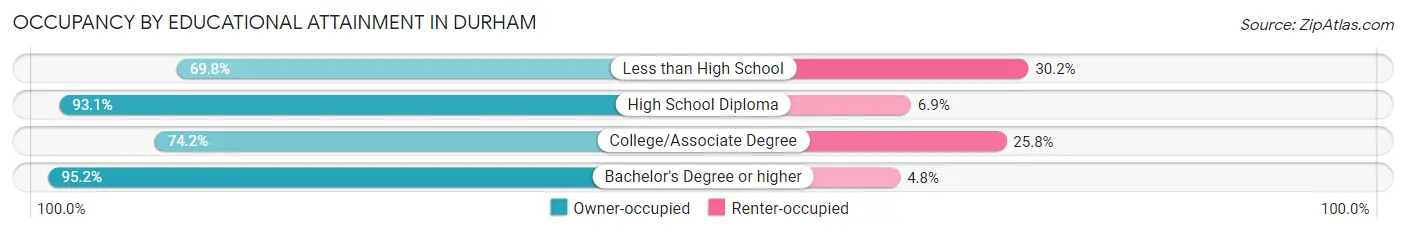
| Household Size | Owner-occupied | Renter-occupied |
| Less than High School | 37 (69.8%) | 16 (30.2%) |
| High School Diploma | 365 (93.1%) | 27 (6.9%) |
| College/Associate Degree | 270 (74.2%) | 94 (25.8%) |
| Bachelor's Degree or higher | 619 (95.2%) | 31 (4.8%) |
Occupancy by Age of Householder in Durham
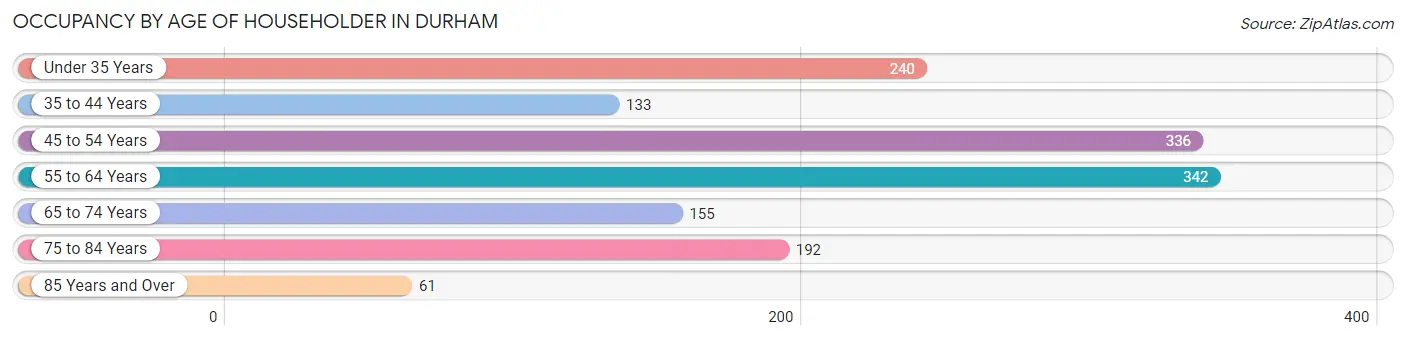
| Age Bracket | # Households | % Households |
| Under 35 Years | 240 | 16.5% |
| 35 to 44 Years | 133 | 9.1% |
| 45 to 54 Years | 336 | 23.0% |
| 55 to 64 Years | 342 | 23.4% |
| 65 to 74 Years | 155 | 10.6% |
| 75 to 84 Years | 192 | 13.2% |
| 85 Years and Over | 61 | 4.2% |
| Total | 1,459 | 100.0% |
Housing Finances in Durham
Median Income by Occupancy in Durham
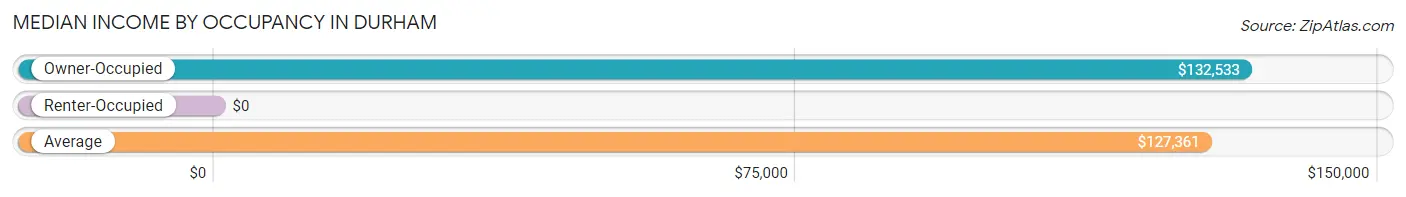
| Occupancy Type | # Households | Median Income |
| Owner-Occupied | 1,291 (88.5%) | $132,533 |
| Renter-Occupied | 168 (11.5%) | $0 |
| Average | 1,459 (100.0%) | $127,361 |
Occupancy by Householder Income Bracket in Durham
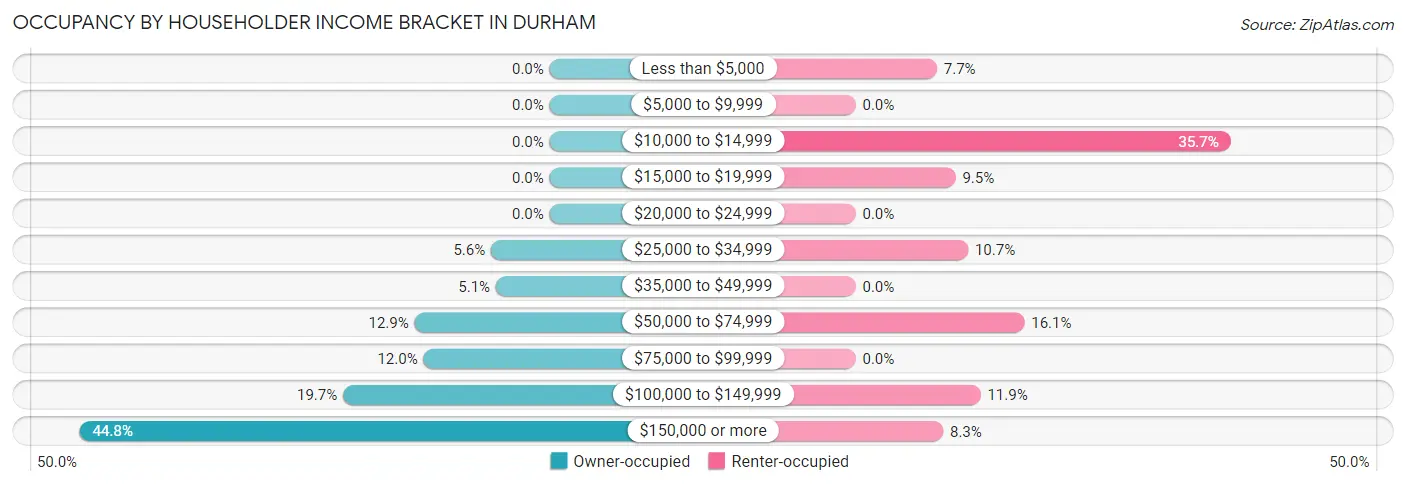
| Income Bracket | Owner-occupied | Renter-occupied |
| Less than $5,000 | 0 (0.0%) | 13 (7.7%) |
| $5,000 to $9,999 | 0 (0.0%) | 0 (0.0%) |
| $10,000 to $14,999 | 0 (0.0%) | 60 (35.7%) |
| $15,000 to $19,999 | 0 (0.0%) | 16 (9.5%) |
| $20,000 to $24,999 | 0 (0.0%) | 0 (0.0%) |
| $25,000 to $34,999 | 72 (5.6%) | 18 (10.7%) |
| $35,000 to $49,999 | 66 (5.1%) | 0 (0.0%) |
| $50,000 to $74,999 | 166 (12.9%) | 27 (16.1%) |
| $75,000 to $99,999 | 155 (12.0%) | 0 (0.0%) |
| $100,000 to $149,999 | 254 (19.7%) | 20 (11.9%) |
| $150,000 or more | 578 (44.8%) | 14 (8.3%) |
| Total | 1,291 (100.0%) | 168 (100.0%) |
Monthly Housing Cost Tiers in Durham
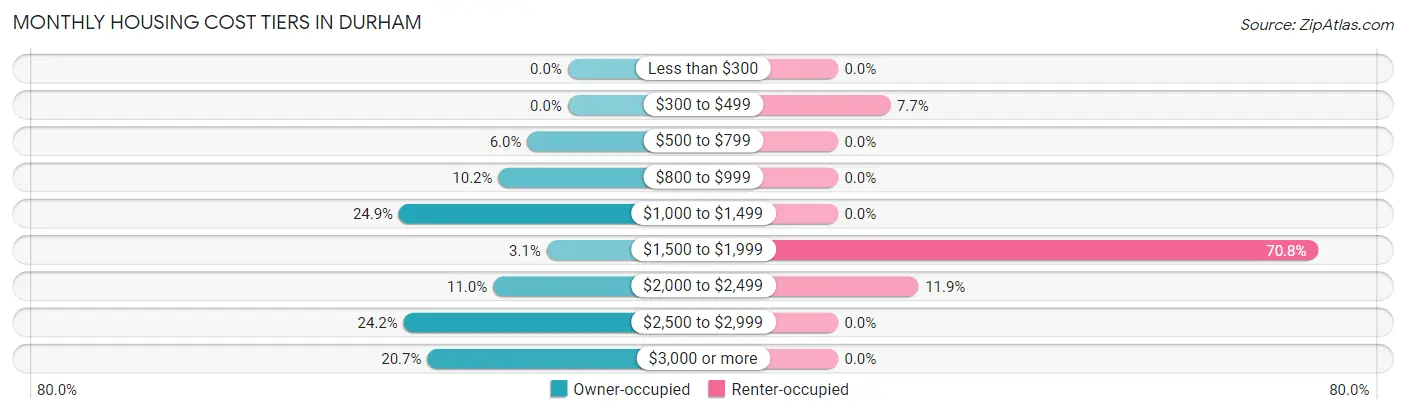
| Monthly Cost | Owner-occupied | Renter-occupied |
| Less than $300 | 0 (0.0%) | 0 (0.0%) |
| $300 to $499 | 0 (0.0%) | 13 (7.7%) |
| $500 to $799 | 77 (6.0%) | 0 (0.0%) |
| $800 to $999 | 132 (10.2%) | 0 (0.0%) |
| $1,000 to $1,499 | 321 (24.9%) | 0 (0.0%) |
| $1,500 to $1,999 | 40 (3.1%) | 119 (70.8%) |
| $2,000 to $2,499 | 142 (11.0%) | 20 (11.9%) |
| $2,500 to $2,999 | 312 (24.2%) | 0 (0.0%) |
| $3,000 or more | 267 (20.7%) | 0 (0.0%) |
| Total | 1,291 (100.0%) | 168 (100.0%) |
Physical Housing Characteristics in Durham
Housing Structures in Durham
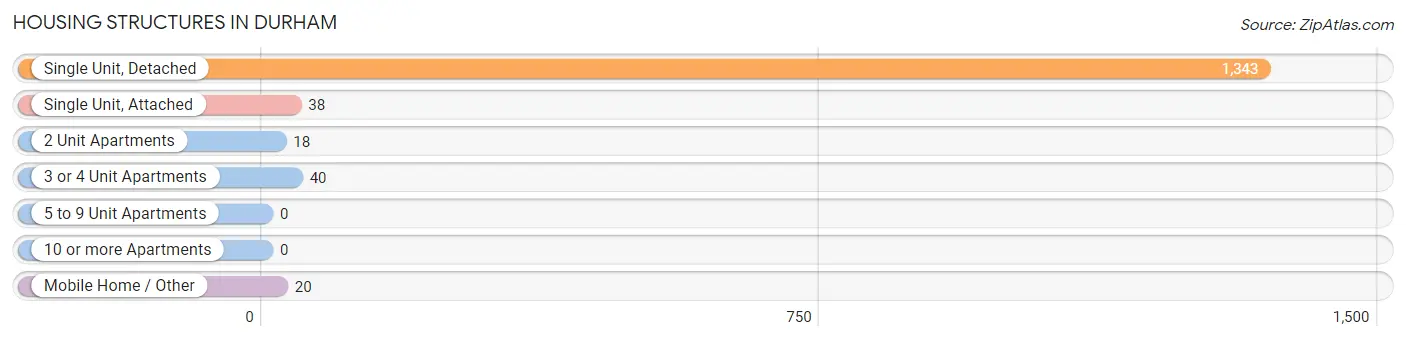
| Structure Type | # Housing Units | % Housing Units |
| Single Unit, Detached | 1,343 | 92.0% |
| Single Unit, Attached | 38 | 2.6% |
| 2 Unit Apartments | 18 | 1.2% |
| 3 or 4 Unit Apartments | 40 | 2.7% |
| 5 to 9 Unit Apartments | 0 | 0.0% |
| 10 or more Apartments | 0 | 0.0% |
| Mobile Home / Other | 20 | 1.4% |
| Total | 1,459 | 100.0% |
Housing Structures by Occupancy in Durham
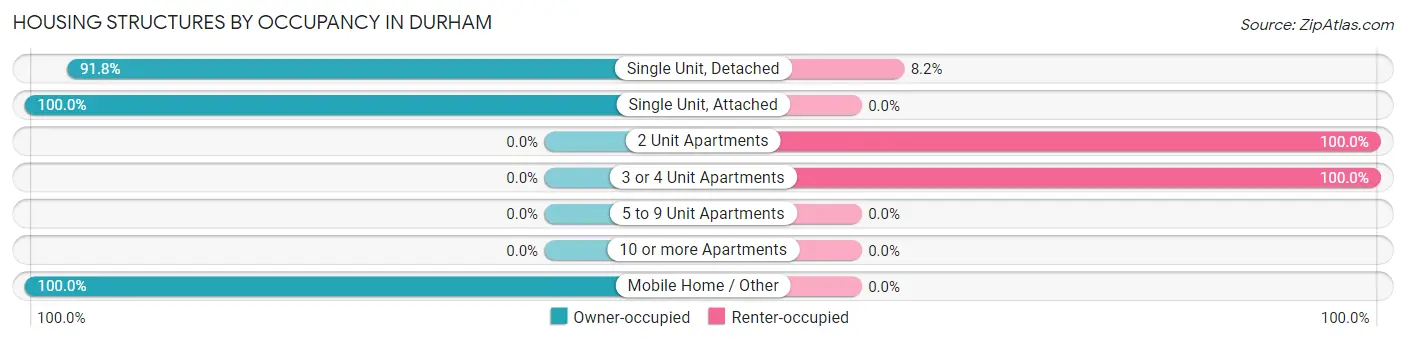
| Structure Type | Owner-occupied | Renter-occupied |
| Single Unit, Detached | 1,233 (91.8%) | 110 (8.2%) |
| Single Unit, Attached | 38 (100.0%) | 0 (0.0%) |
| 2 Unit Apartments | 0 (0.0%) | 18 (100.0%) |
| 3 or 4 Unit Apartments | 0 (0.0%) | 40 (100.0%) |
| 5 to 9 Unit Apartments | 0 (0.0%) | 0 (0.0%) |
| 10 or more Apartments | 0 (0.0%) | 0 (0.0%) |
| Mobile Home / Other | 20 (100.0%) | 0 (0.0%) |
| Total | 1,291 (88.5%) | 168 (11.5%) |
Housing Structures by Number of Rooms in Durham
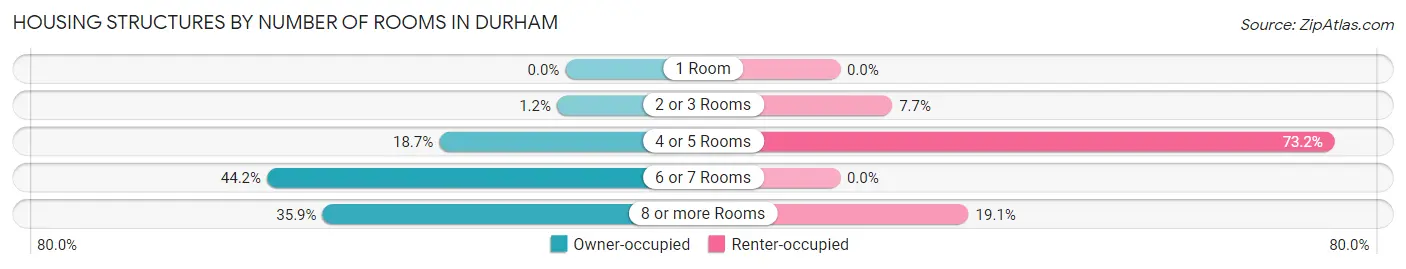
| Number of Rooms | Owner-occupied | Renter-occupied |
| 1 Room | 0 (0.0%) | 0 (0.0%) |
| 2 or 3 Rooms | 16 (1.2%) | 13 (7.7%) |
| 4 or 5 Rooms | 241 (18.7%) | 123 (73.2%) |
| 6 or 7 Rooms | 570 (44.2%) | 0 (0.0%) |
| 8 or more Rooms | 464 (35.9%) | 32 (19.1%) |
| Total | 1,291 (100.0%) | 168 (100.0%) |
Housing Structure by Heating Type in Durham
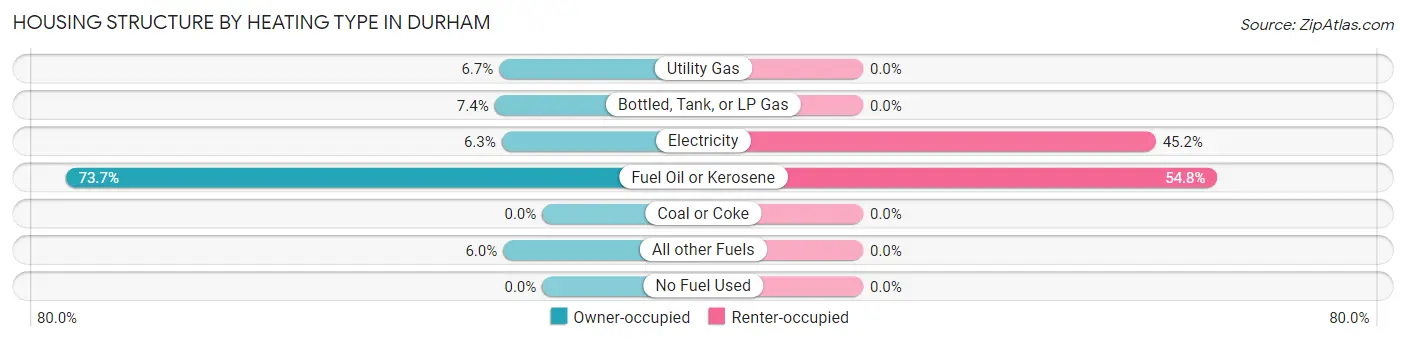
| Heating Type | Owner-occupied | Renter-occupied |
| Utility Gas | 86 (6.7%) | 0 (0.0%) |
| Bottled, Tank, or LP Gas | 95 (7.4%) | 0 (0.0%) |
| Electricity | 81 (6.3%) | 76 (45.2%) |
| Fuel Oil or Kerosene | 951 (73.7%) | 92 (54.8%) |
| Coal or Coke | 0 (0.0%) | 0 (0.0%) |
| All other Fuels | 78 (6.0%) | 0 (0.0%) |
| No Fuel Used | 0 (0.0%) | 0 (0.0%) |
| Total | 1,291 (100.0%) | 168 (100.0%) |
Household Vehicle Usage in Durham
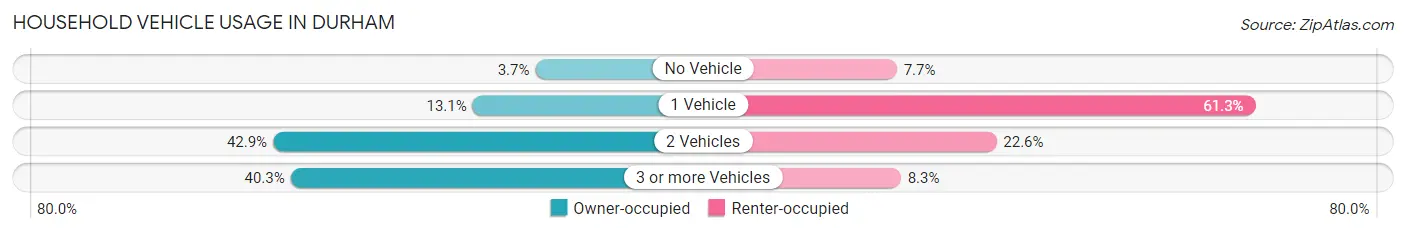
| Vehicles per Household | Owner-occupied | Renter-occupied |
| No Vehicle | 48 (3.7%) | 13 (7.7%) |
| 1 Vehicle | 169 (13.1%) | 103 (61.3%) |
| 2 Vehicles | 554 (42.9%) | 38 (22.6%) |
| 3 or more Vehicles | 520 (40.3%) | 14 (8.3%) |
| Total | 1,291 (100.0%) | 168 (100.0%) |
Real Estate & Mortgages in Durham
Real Estate and Mortgage Overview in Durham
| Characteristic | Without Mortgage | With Mortgage |
| Housing Units | 419 | 872 |
| Median Property Value | $334,400 | $369,500 |
| Median Household Income | $121,681 | $387 |
| Monthly Housing Costs | $1,202 | $267 |
| Real Estate Taxes | $7,057 | $25 |
Property Value by Mortgage Status in Durham
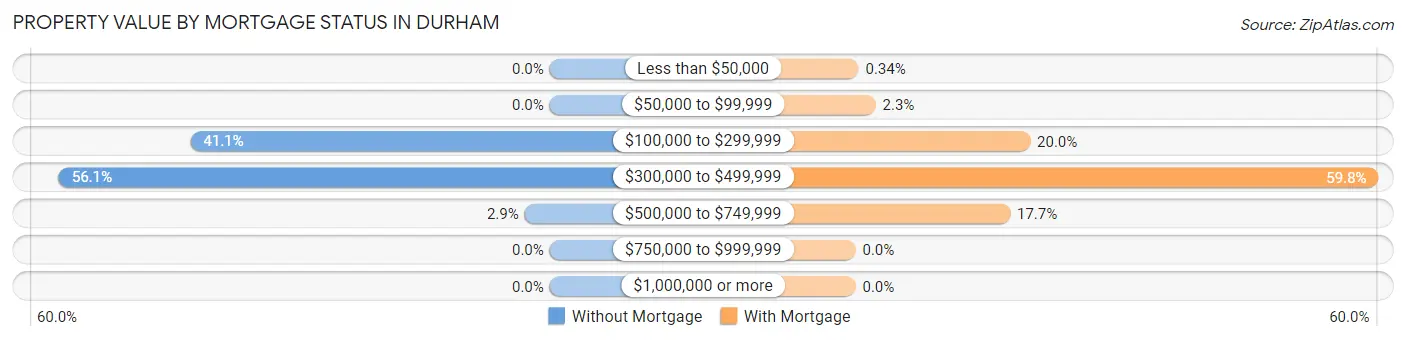
| Property Value | Without Mortgage | With Mortgage |
| Less than $50,000 | 0 (0.0%) | 3 (0.3%) |
| $50,000 to $99,999 | 0 (0.0%) | 20 (2.3%) |
| $100,000 to $299,999 | 172 (41.0%) | 174 (20.0%) |
| $300,000 to $499,999 | 235 (56.1%) | 521 (59.8%) |
| $500,000 to $749,999 | 12 (2.9%) | 154 (17.7%) |
| $750,000 to $999,999 | 0 (0.0%) | 0 (0.0%) |
| $1,000,000 or more | 0 (0.0%) | 0 (0.0%) |
| Total | 419 (100.0%) | 872 (100.0%) |
Household Income by Mortgage Status in Durham
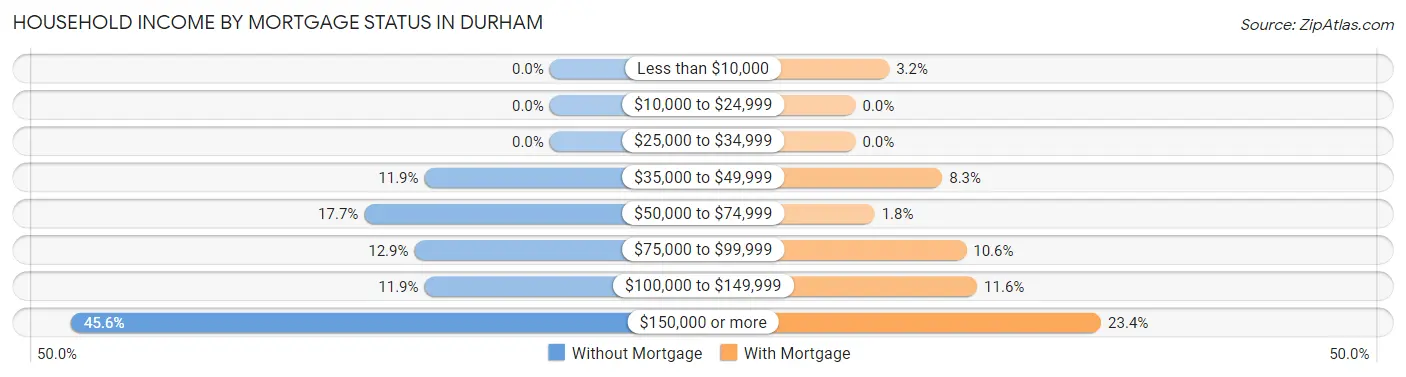
| Household Income | Without Mortgage | With Mortgage |
| Less than $10,000 | 0 (0.0%) | 28 (3.2%) |
| $10,000 to $24,999 | 0 (0.0%) | 0 (0.0%) |
| $25,000 to $34,999 | 0 (0.0%) | 0 (0.0%) |
| $35,000 to $49,999 | 50 (11.9%) | 72 (8.3%) |
| $50,000 to $74,999 | 74 (17.7%) | 16 (1.8%) |
| $75,000 to $99,999 | 54 (12.9%) | 92 (10.5%) |
| $100,000 to $149,999 | 50 (11.9%) | 101 (11.6%) |
| $150,000 or more | 191 (45.6%) | 204 (23.4%) |
| Total | 419 (100.0%) | 872 (100.0%) |
Property Value to Household Income Ratio in Durham
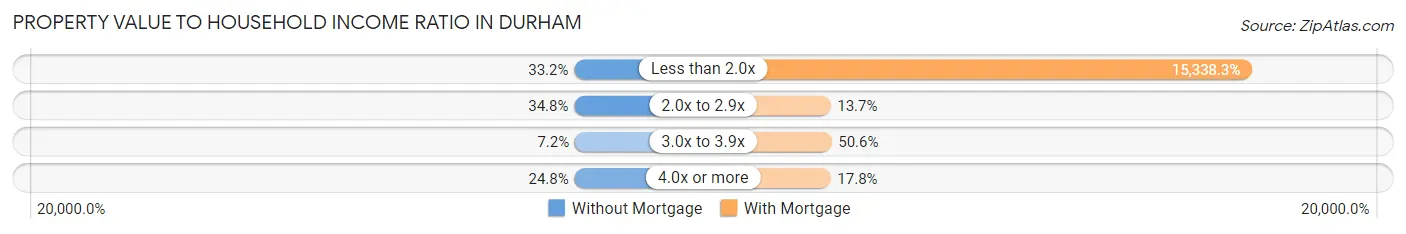
| Value-to-Income Ratio | Without Mortgage | With Mortgage |
| Less than 2.0x | 139 (33.2%) | 133,750 (15,338.3%) |
| 2.0x to 2.9x | 146 (34.8%) | 119 (13.7%) |
| 3.0x to 3.9x | 30 (7.2%) | 441 (50.6%) |
| 4.0x or more | 104 (24.8%) | 155 (17.8%) |
| Total | 419 (100.0%) | 872 (100.0%) |
Real Estate Taxes by Mortgage Status in Durham
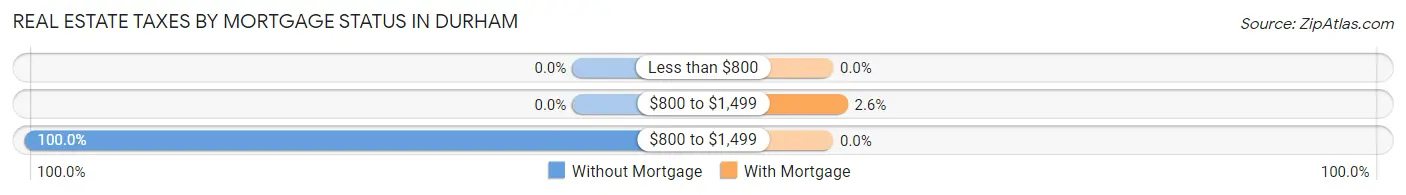
| Property Taxes | Without Mortgage | With Mortgage |
| Less than $800 | 0 (0.0%) | 0 (0.0%) |
| $800 to $1,499 | 0 (0.0%) | 23 (2.6%) |
| $800 to $1,499 | 419 (100.0%) | 0 (0.0%) |
| Total | 419 (100.0%) | 872 (100.0%) |
Health & Disability in Durham
Health Insurance Coverage by Age in Durham
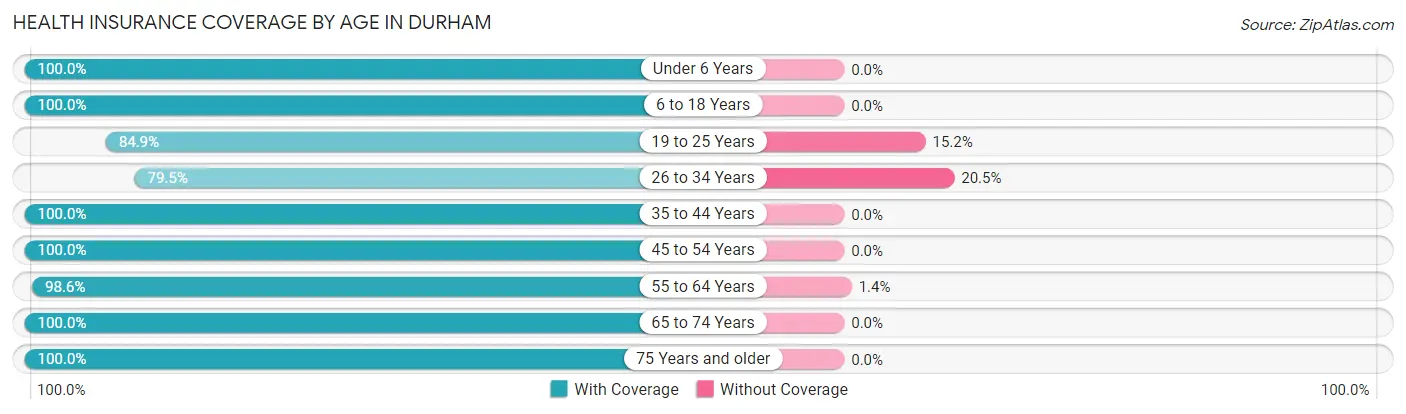
| Age Bracket | With Coverage | Without Coverage |
| Under 6 Years | 112 (100.0%) | 0 (0.0%) |
| 6 to 18 Years | 520 (100.0%) | 0 (0.0%) |
| 19 to 25 Years | 140 (84.9%) | 25 (15.1%) |
| 26 to 34 Years | 407 (79.5%) | 105 (20.5%) |
| 35 to 44 Years | 329 (100.0%) | 0 (0.0%) |
| 45 to 54 Years | 565 (100.0%) | 0 (0.0%) |
| 55 to 64 Years | 710 (98.6%) | 10 (1.4%) |
| 65 to 74 Years | 220 (100.0%) | 0 (0.0%) |
| 75 Years and older | 326 (100.0%) | 0 (0.0%) |
| Total | 3,329 (96.0%) | 140 (4.0%) |
Health Insurance Coverage by Citizenship Status in Durham
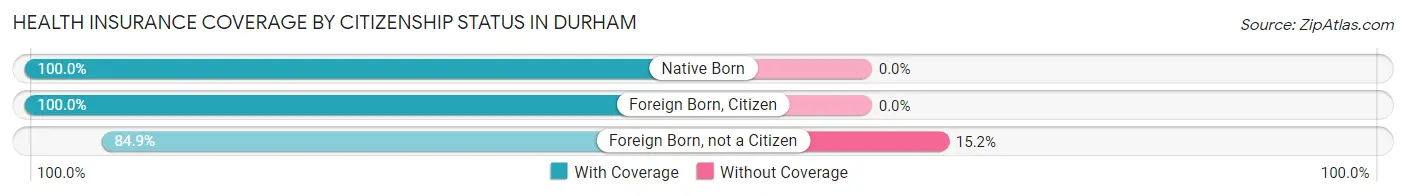
| Citizenship Status | With Coverage | Without Coverage |
| Native Born | 112 (100.0%) | 0 (0.0%) |
| Foreign Born, Citizen | 520 (100.0%) | 0 (0.0%) |
| Foreign Born, not a Citizen | 140 (84.9%) | 25 (15.1%) |
Health Insurance Coverage by Household Income in Durham
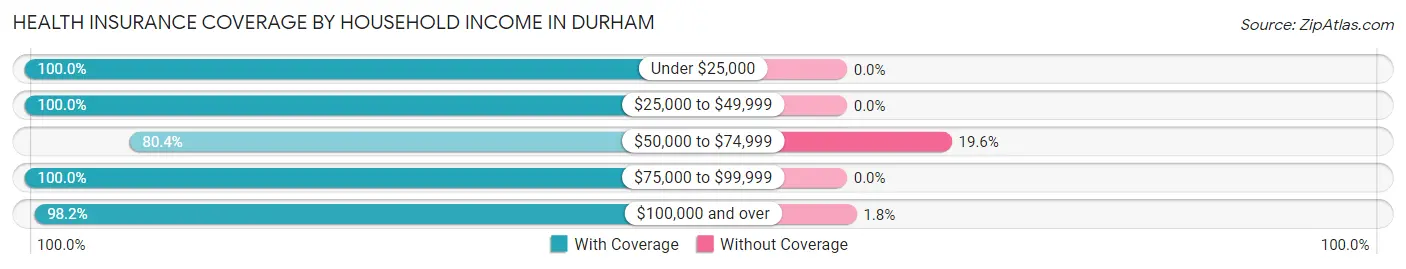
| Household Income | With Coverage | Without Coverage |
| Under $25,000 | 89 (100.0%) | 0 (0.0%) |
| $25,000 to $49,999 | 189 (100.0%) | 0 (0.0%) |
| $50,000 to $74,999 | 405 (80.4%) | 99 (19.6%) |
| $75,000 to $99,999 | 417 (100.0%) | 0 (0.0%) |
| $100,000 and over | 2,221 (98.2%) | 41 (1.8%) |
Public vs Private Health Insurance Coverage by Age in Durham

| Age Bracket | Public Insurance | Private Insurance |
| Under 6 | 0 (0.0%) | 112 (100.0%) |
| 6 to 18 Years | 64 (12.3%) | 467 (89.8%) |
| 19 to 25 Years | 20 (12.1%) | 140 (84.9%) |
| 25 to 34 Years | 47 (9.2%) | 360 (70.3%) |
| 35 to 44 Years | 34 (10.3%) | 295 (89.7%) |
| 45 to 54 Years | 51 (9.0%) | 544 (96.3%) |
| 55 to 64 Years | 25 (3.5%) | 695 (96.5%) |
| 65 to 74 Years | 208 (94.6%) | 114 (51.8%) |
| 75 Years and over | 326 (100.0%) | 185 (56.8%) |
| Total | 775 (22.3%) | 2,912 (83.9%) |
Disability Status by Sex by Age in Durham
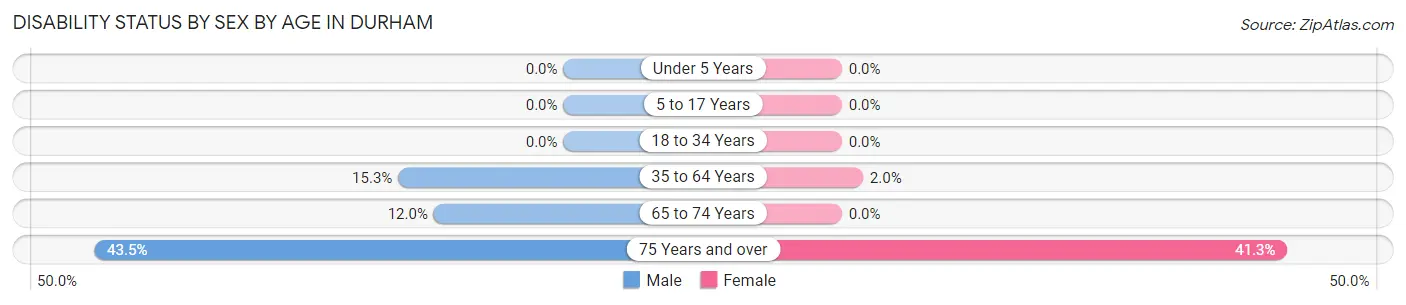
| Age Bracket | Male | Female |
| Under 5 Years | 0 (0.0%) | 0 (0.0%) |
| 5 to 17 Years | 0 (0.0%) | 0 (0.0%) |
| 18 to 34 Years | 0 (0.0%) | 0 (0.0%) |
| 35 to 64 Years | 130 (15.3%) | 15 (2.0%) |
| 65 to 74 Years | 16 (12.0%) | 0 (0.0%) |
| 75 Years and over | 64 (43.5%) | 74 (41.3%) |
Disability Class by Sex by Age in Durham
Disability Class: Hearing Difficulty

| Age Bracket | Male | Female |
| Under 5 Years | 0 (0.0%) | 0 (0.0%) |
| 5 to 17 Years | 0 (0.0%) | 0 (0.0%) |
| 18 to 34 Years | 0 (0.0%) | 0 (0.0%) |
| 35 to 64 Years | 0 (0.0%) | 0 (0.0%) |
| 65 to 74 Years | 0 (0.0%) | 0 (0.0%) |
| 75 Years and over | 27 (18.4%) | 26 (14.5%) |
Disability Class: Vision Difficulty
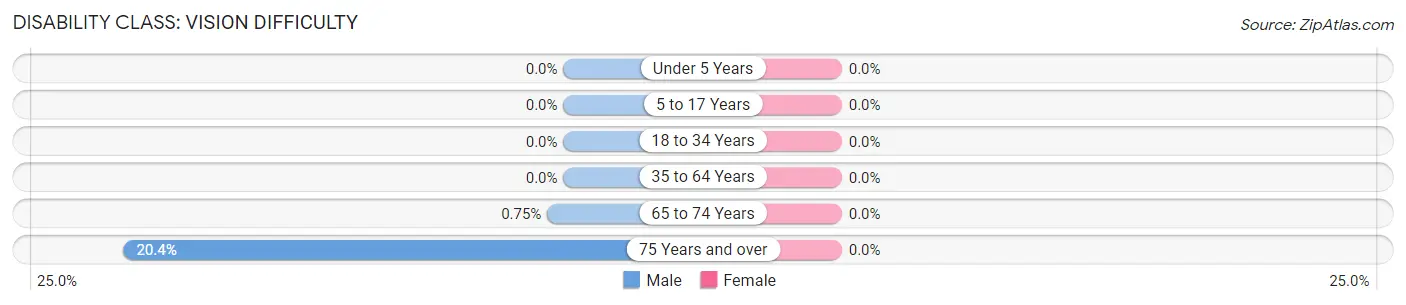
| Age Bracket | Male | Female |
| Under 5 Years | 0 (0.0%) | 0 (0.0%) |
| 5 to 17 Years | 0 (0.0%) | 0 (0.0%) |
| 18 to 34 Years | 0 (0.0%) | 0 (0.0%) |
| 35 to 64 Years | 0 (0.0%) | 0 (0.0%) |
| 65 to 74 Years | 1 (0.7%) | 0 (0.0%) |
| 75 Years and over | 30 (20.4%) | 0 (0.0%) |
Disability Class: Cognitive Difficulty
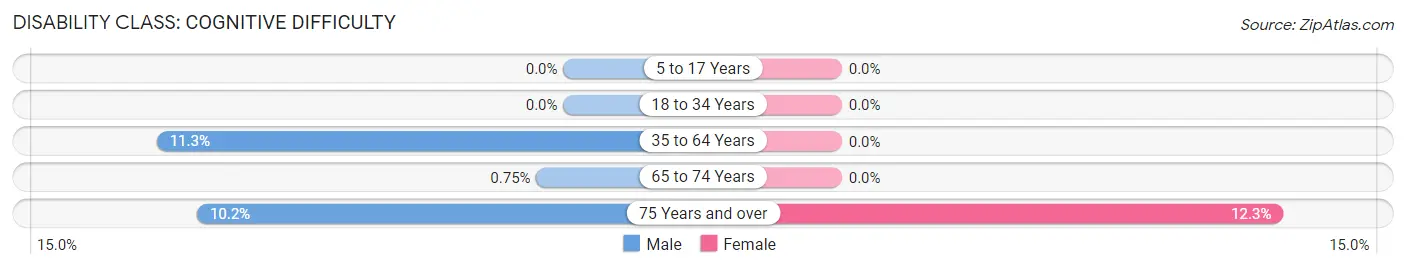
| Age Bracket | Male | Female |
| 5 to 17 Years | 0 (0.0%) | 0 (0.0%) |
| 18 to 34 Years | 0 (0.0%) | 0 (0.0%) |
| 35 to 64 Years | 96 (11.3%) | 0 (0.0%) |
| 65 to 74 Years | 1 (0.7%) | 0 (0.0%) |
| 75 Years and over | 15 (10.2%) | 22 (12.3%) |
Disability Class: Ambulatory Difficulty
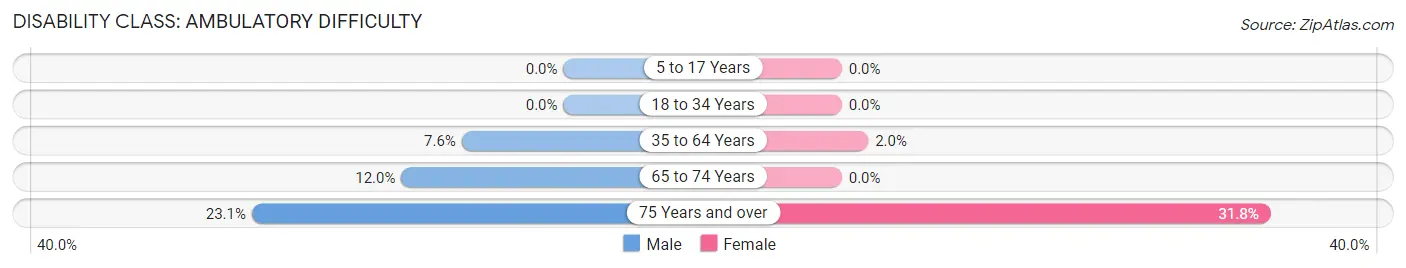
| Age Bracket | Male | Female |
| 5 to 17 Years | 0 (0.0%) | 0 (0.0%) |
| 18 to 34 Years | 0 (0.0%) | 0 (0.0%) |
| 35 to 64 Years | 64 (7.5%) | 15 (2.0%) |
| 65 to 74 Years | 16 (12.0%) | 0 (0.0%) |
| 75 Years and over | 34 (23.1%) | 57 (31.8%) |
Disability Class: Self-Care Difficulty
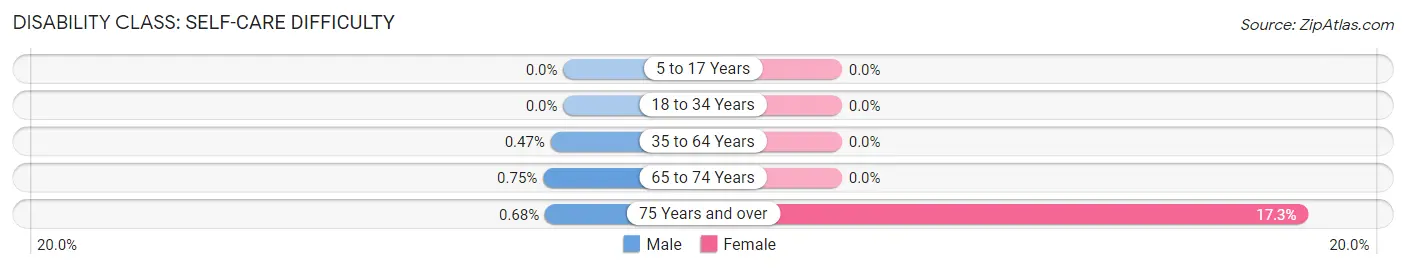
| Age Bracket | Male | Female |
| 5 to 17 Years | 0 (0.0%) | 0 (0.0%) |
| 18 to 34 Years | 0 (0.0%) | 0 (0.0%) |
| 35 to 64 Years | 4 (0.5%) | 0 (0.0%) |
| 65 to 74 Years | 1 (0.7%) | 0 (0.0%) |
| 75 Years and over | 1 (0.7%) | 31 (17.3%) |
Technology Access in Durham
Computing Device Access in Durham
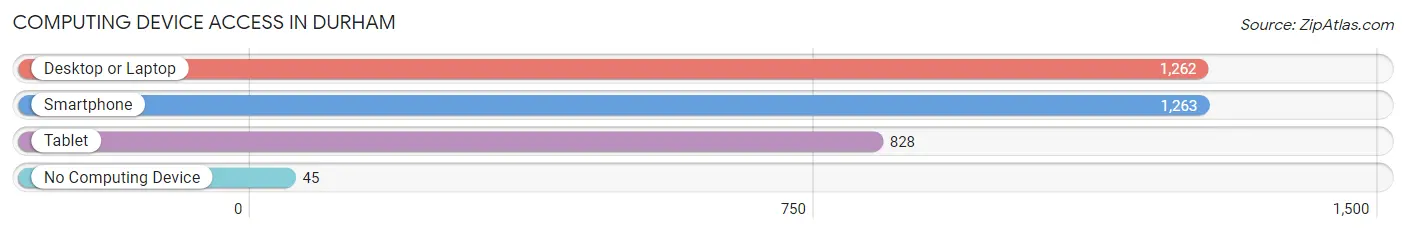
| Device Type | # Households | % Households |
| Desktop or Laptop | 1,262 | 86.5% |
| Smartphone | 1,263 | 86.6% |
| Tablet | 828 | 56.8% |
| No Computing Device | 45 | 3.1% |
| Total | 1,459 | 100.0% |
Internet Access in Durham
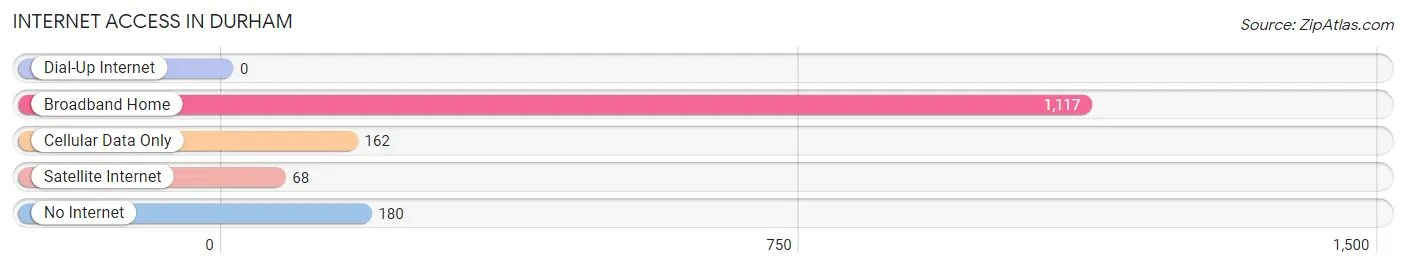
| Internet Type | # Households | % Households |
| Dial-Up Internet | 0 | 0.0% |
| Broadband Home | 1,117 | 76.6% |
| Cellular Data Only | 162 | 11.1% |
| Satellite Internet | 68 | 4.7% |
| No Internet | 180 | 12.3% |
| Total | 1,459 | 100.0% |
Durham Summary
Durham, Connecticut is a small town located in Middlesex County, Connecticut. It is situated in the Connecticut River Valley, and is bordered by Middlefield, Middletown, and Wallingford. The town has a population of approximately 8,000 people, and is known for its rural charm and small-town atmosphere.
History
Durham was first settled in 1699 by a group of settlers from Killingworth, Connecticut. The town was originally known as Durham Parish, and was part of the larger town of Killingworth. In 1744, the town was officially incorporated as Durham.
The town was named after Durham, England, and was originally a farming community. The town was known for its production of tobacco, and was home to several tobacco warehouses. The town also had a thriving shipbuilding industry, and was home to several shipyards.
In the 19th century, Durham was a popular summer resort destination. The town was home to several large hotels, and was a popular destination for wealthy New Yorkers. The town also had a thriving dairy industry, and was home to several large dairy farms.
Geography
Durham is located in the Connecticut River Valley, and is bordered by Middlefield, Middletown, and Wallingford. The town is situated on the banks of the Connecticut River, and is home to several small lakes and ponds. The town is also home to several small streams, including the Coginchaug River and the Mattabesset River.
The town has a total area of 24.2 square miles, of which 23.9 square miles is land and 0.3 square miles is water. The town is located in a hilly region, and is home to several small hills and ridges. The highest point in the town is the summit of Bald Hill, which has an elevation of 590 feet.
Economy
Durham is a primarily residential community, and the town’s economy is largely based on tourism and retail. The town is home to several small businesses, including restaurants, shops, and galleries. The town is also home to several small manufacturing companies, including a metal fabrication company and a plastics manufacturer.
The town is also home to several farms, and is known for its production of dairy products, fruits, and vegetables. The town is also home to several wineries, and is known for its production of wine.
Demographics
As of the 2010 census, the town had a population of 8,129 people. The racial makeup of the town was 94.3% White, 1.3% African American, 0.3% Native American, 1.2% Asian, 0.1% Pacific Islander, 1.2% from other races, and 1.7% from two or more races. Hispanic or Latino of any race were 3.3% of the population.
The median household income in the town was $76,944, and the median family income was $90,917. The per capita income in the town was $35,945. About 4.2% of the population was below the poverty line.
Durham is a small town with a rich history and a unique atmosphere. The town is known for its rural charm and small-town atmosphere, and is a popular destination for tourists and residents alike. The town is home to several small businesses, farms, and wineries, and is a great place to live and work.
Common Questions
What is Per Capita Income in Durham?
Per Capita income in Durham is $56,557.
What is the Median Family Income in Durham?
Median Family Income in Durham is $153,478.
What is the Median Household income in Durham?
Median Household Income in Durham is $127,361.
What is Income or Wage Gap in Durham?
Income or Wage Gap in Durham is 13.5%.
Women in Durham earn 86.5 cents for every dollar earned by a man.
What is Inequality or Gini Index in Durham?
Inequality or Gini Index in Durham is 0.37.
What is the Total Population of Durham?
Total Population of Durham is 3,469.
What is the Total Male Population of Durham?
Total Male Population of Durham is 1,835.
What is the Total Female Population of Durham?
Total Female Population of Durham is 1,634.
What is the Ratio of Males per 100 Females in Durham?
There are 112.30 Males per 100 Females in Durham.
What is the Ratio of Females per 100 Males in Durham?
There are 89.05 Females per 100 Males in Durham.
What is the Median Population Age in Durham?
Median Population Age in Durham is 46.9 Years.
What is the Average Family Size in Durham
Average Family Size in Durham is 2.8 People.
What is the Average Household Size in Durham
Average Household Size in Durham is 2.4 People.
How Large is the Labor Force in Durham?
There are 2,210 People in the Labor Forcein in Durham.
What is the Percentage of People in the Labor Force in Durham?
73.7% of People are in the Labor Force in Durham.
What is the Unemployment Rate in Durham?
Unemployment Rate in Durham is 6.0%.