Glastonbury Center, CT Map & Demographics
Glastonbury Center Map
Glastonbury Center Overview
$65,413
PER CAPITA INCOME
$161,378
AVG FAMILY INCOME
$104,557
AVG HOUSEHOLD INCOME
31.8%
WAGE / INCOME GAP [ % ]
68.2¢/ $1
WAGE / INCOME GAP [ $ ]
0.46
INEQUALITY / GINI INDEX
7,959
TOTAL POPULATION
3,430
MALE POPULATION
4,529
FEMALE POPULATION
75.73
MALES / 100 FEMALES
132.04
FEMALES / 100 MALES
48.6
MEDIAN AGE
2.9
AVG FAMILY SIZE
2.1
AVG HOUSEHOLD SIZE
4,168
LABOR FORCE [ PEOPLE ]
61.5%
PERCENT IN LABOR FORCE
2.7%
UNEMPLOYMENT RATE
Income in Glastonbury Center
Income Overview in Glastonbury Center
Per Capita Income in Glastonbury Center is $65,413, while median incomes of families and households are $161,378 and $104,557 respectively.
| Characteristic | Number | Measure |
| Per Capita Income | 7,959 | $65,413 |
| Median Family Income | 1,951 | $161,378 |
| Mean Family Income | 1,951 | $191,877 |
| Median Household Income | 3,681 | $104,557 |
| Mean Household Income | 3,681 | $138,992 |
| Income Deficit | 1,951 | $0 |
| Wage / Income Gap (%) | 7,959 | 31.85% |
| Wage / Income Gap ($) | 7,959 | 68.15¢ per $1 |
| Gini / Inequality Index | 7,959 | 0.46 |
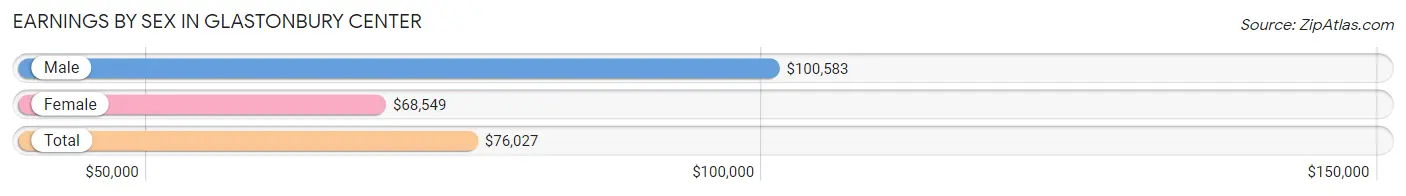
Earnings by Sex in Glastonbury Center
Average Earnings in Glastonbury Center are $76,027, $100,583 for men and $68,549 for women, a difference of 31.9%.
| Sex | Number | Average Earnings |
| Male | 1,946 (45.4%) | $100,583 |
| Female | 2,345 (54.6%) | $68,549 |
| Total | 4,291 (100.0%) | $76,027 |
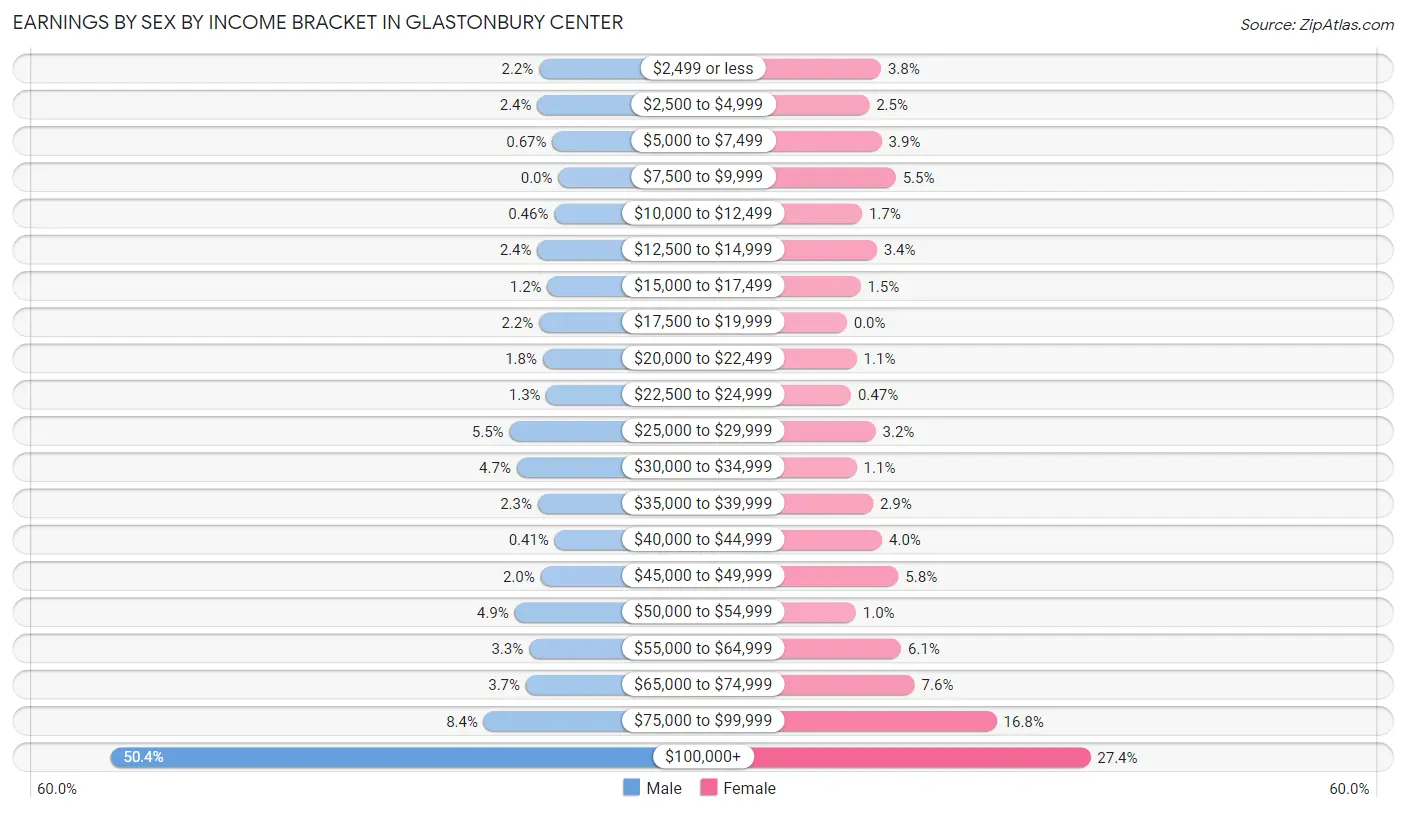
Earnings by Sex by Income Bracket in Glastonbury Center
The most common earnings brackets in Glastonbury Center are $100,000+ for men (980 | 50.4%) and $100,000+ for women (642 | 27.4%).
| Income | Male | Female |
| $2,499 or less | 42 (2.2%) | 90 (3.8%) |
| $2,500 to $4,999 | 46 (2.4%) | 59 (2.5%) |
| $5,000 to $7,499 | 13 (0.7%) | 92 (3.9%) |
| $7,500 to $9,999 | 0 (0.0%) | 129 (5.5%) |
| $10,000 to $12,499 | 9 (0.5%) | 40 (1.7%) |
| $12,500 to $14,999 | 46 (2.4%) | 79 (3.4%) |
| $15,000 to $17,499 | 24 (1.2%) | 36 (1.5%) |
| $17,500 to $19,999 | 42 (2.2%) | 0 (0.0%) |
| $20,000 to $22,499 | 34 (1.8%) | 26 (1.1%) |
| $22,500 to $24,999 | 26 (1.3%) | 11 (0.5%) |
| $25,000 to $29,999 | 107 (5.5%) | 76 (3.2%) |
| $30,000 to $34,999 | 91 (4.7%) | 26 (1.1%) |
| $35,000 to $39,999 | 45 (2.3%) | 69 (2.9%) |
| $40,000 to $44,999 | 8 (0.4%) | 93 (4.0%) |
| $45,000 to $49,999 | 39 (2.0%) | 136 (5.8%) |
| $50,000 to $54,999 | 96 (4.9%) | 24 (1.0%) |
| $55,000 to $64,999 | 64 (3.3%) | 143 (6.1%) |
| $65,000 to $74,999 | 71 (3.6%) | 179 (7.6%) |
| $75,000 to $99,999 | 163 (8.4%) | 395 (16.8%) |
| $100,000+ | 980 (50.4%) | 642 (27.4%) |
| Total | 1,946 (100.0%) | 2,345 (100.0%) |
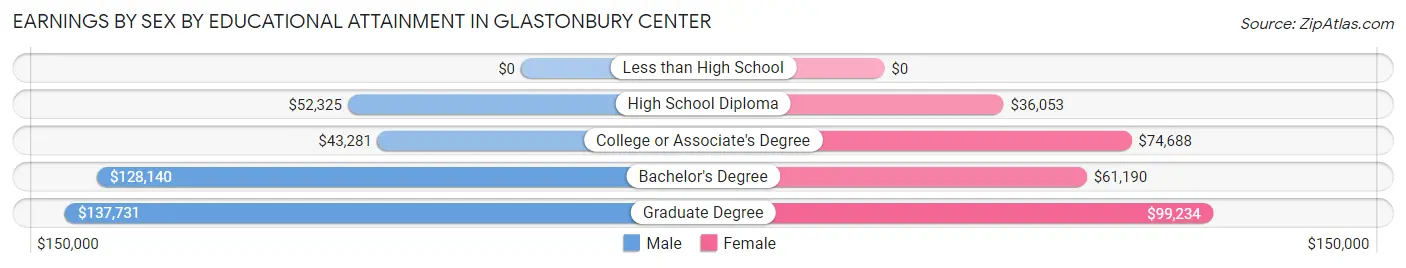
Earnings by Sex by Educational Attainment in Glastonbury Center
Average earnings in Glastonbury Center are $102,750 for men and $75,282 for women, a difference of 26.7%. Men with an educational attainment of graduate degree enjoy the highest average annual earnings of $137,731, while those with college or associate's degree education earn the least with $43,281. Women with an educational attainment of graduate degree earn the most with the average annual earnings of $99,234, while those with high school diploma education have the smallest earnings of $36,053.
| Educational Attainment | Male Income | Female Income |
| Less than High School | - | - |
| High School Diploma | $52,325 | $36,053 |
| College or Associate's Degree | $43,281 | $74,688 |
| Bachelor's Degree | $128,140 | $61,190 |
| Graduate Degree | $137,731 | $99,234 |
| Total | $102,750 | $75,282 |
Family Income in Glastonbury Center
Family Income Brackets in Glastonbury Center
According to the Glastonbury Center family income data, there are 704 families falling into the $200,000+ income range, which is the most common income bracket and makes up 36.1% of all families.
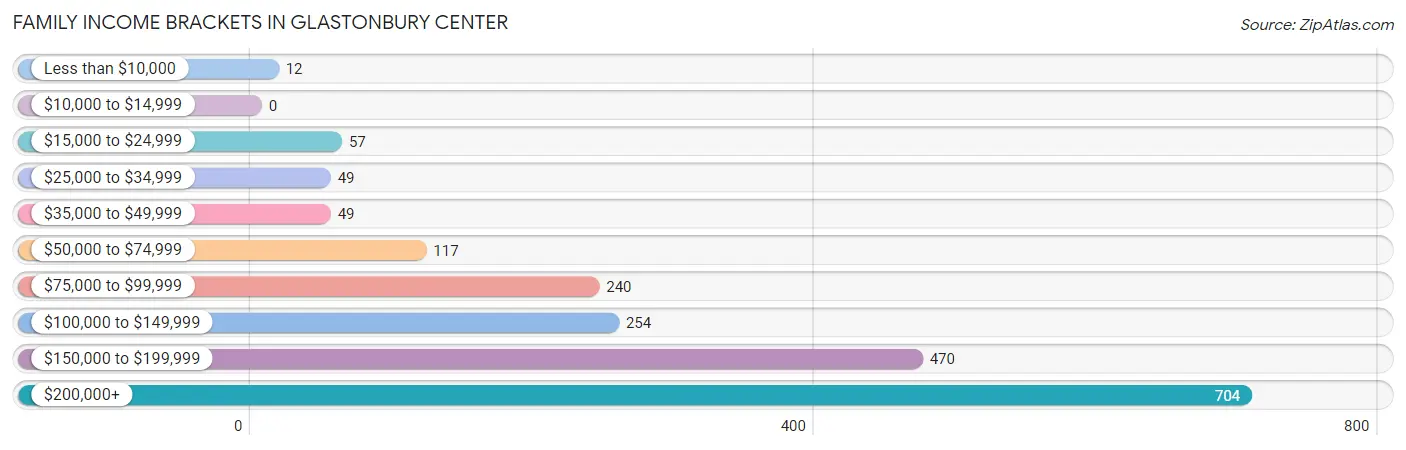
| Income Bracket | # Families | % Families |
| Less than $10,000 | 12 | 0.6% |
| $10,000 to $14,999 | 0 | 0.0% |
| $15,000 to $24,999 | 57 | 2.9% |
| $25,000 to $34,999 | 49 | 2.5% |
| $35,000 to $49,999 | 49 | 2.5% |
| $50,000 to $74,999 | 117 | 6.0% |
| $75,000 to $99,999 | 240 | 12.3% |
| $100,000 to $149,999 | 254 | 13.0% |
| $150,000 to $199,999 | 470 | 24.1% |
| $200,000+ | 704 | 36.1% |
Family Income by Famaliy Size in Glastonbury Center
4-person families (456 | 23.4%) account for the highest median family income in Glastonbury Center with $167,656 per family, while 2-person families (982 | 50.3%) have the highest median income of $80,602 per family member.
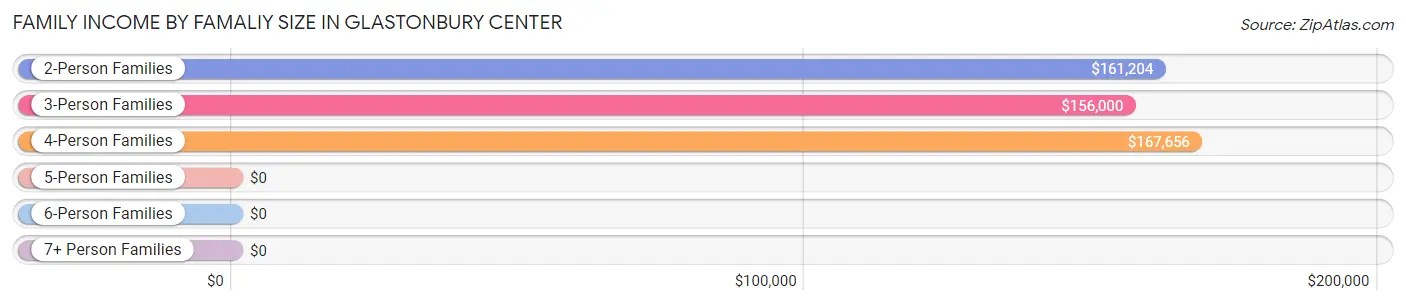
| Income Bracket | # Families | Median Income |
| 2-Person Families | 982 (50.3%) | $161,204 |
| 3-Person Families | 434 (22.3%) | $156,000 |
| 4-Person Families | 456 (23.4%) | $167,656 |
| 5-Person Families | 69 (3.5%) | $0 |
| 6-Person Families | 10 (0.5%) | $0 |
| 7+ Person Families | 0 (0.0%) | $0 |
| Total | 1,951 (100.0%) | $161,378 |
Family Income by Number of Earners in Glastonbury Center
The median family income in Glastonbury Center is $161,378, with families comprising 2 earners (1,119) having the highest median family income of $204,196, while families with 1 earner (323) have the lowest median family income of $91,611, accounting for 57.4% and 16.6% of families, respectively.
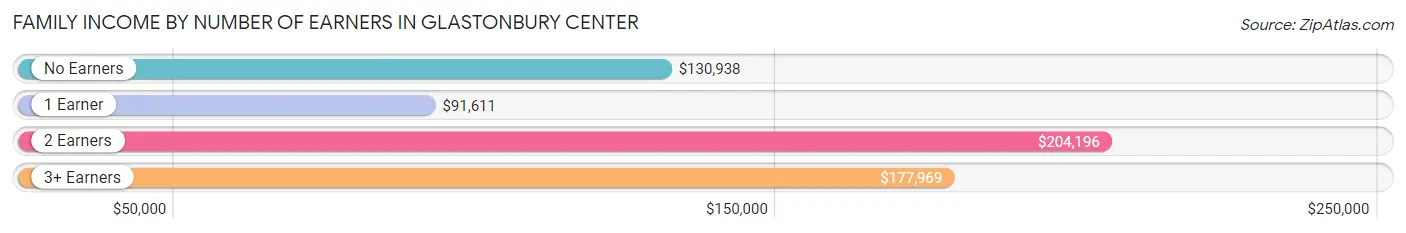
| Number of Earners | # Families | Median Income |
| No Earners | 380 (19.5%) | $130,938 |
| 1 Earner | 323 (16.6%) | $91,611 |
| 2 Earners | 1,119 (57.4%) | $204,196 |
| 3+ Earners | 129 (6.6%) | $177,969 |
| Total | 1,951 (100.0%) | $161,378 |
Household Income in Glastonbury Center
Household Income Brackets in Glastonbury Center
With 858 households falling in the category, the $200,000+ income range is the most frequent in Glastonbury Center, accounting for 23.3% of all households. In contrast, only 118 households (3.2%) fall into the $10,000 to $14,999 income bracket, making it the least populous group.
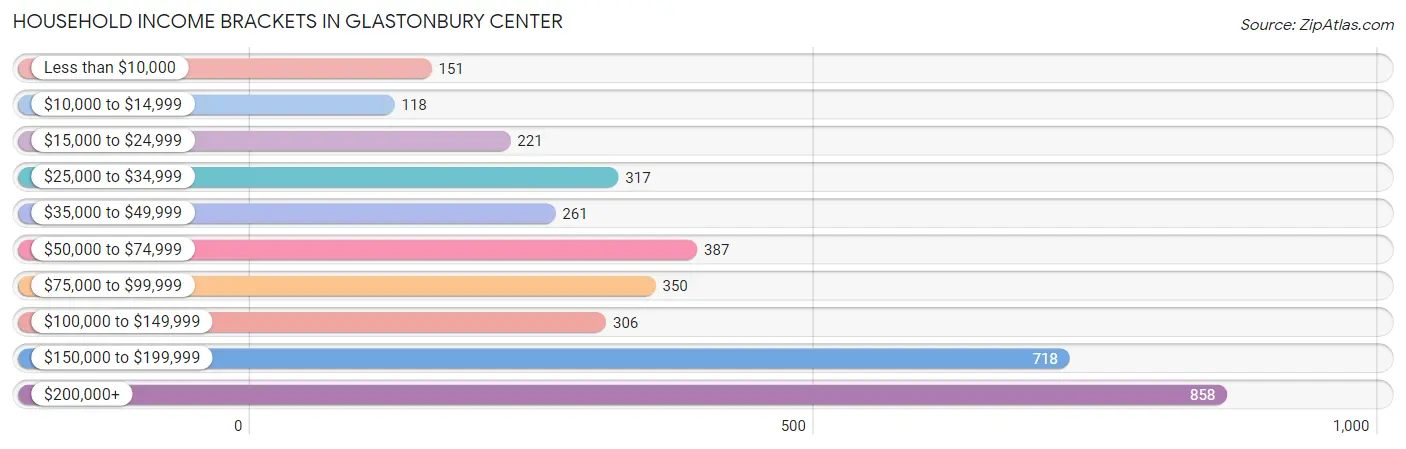
| Income Bracket | # Households | % Households |
| Less than $10,000 | 151 | 4.1% |
| $10,000 to $14,999 | 118 | 3.2% |
| $15,000 to $24,999 | 221 | 6.0% |
| $25,000 to $34,999 | 317 | 8.6% |
| $35,000 to $49,999 | 261 | 7.1% |
| $50,000 to $74,999 | 387 | 10.5% |
| $75,000 to $99,999 | 350 | 9.5% |
| $100,000 to $149,999 | 306 | 8.3% |
| $150,000 to $199,999 | 718 | 19.5% |
| $200,000+ | 858 | 23.3% |
Household Income by Householder Age in Glastonbury Center
The median household income in Glastonbury Center is $104,557, with the highest median household income of $175,662 found in the 25 to 44 years age bracket for the primary householder. A total of 973 households (26.4%) fall into this category. Meanwhile, the 15 to 24 years age bracket for the primary householder has the lowest median household income of $0, with 36 households (1.0%) in this group.
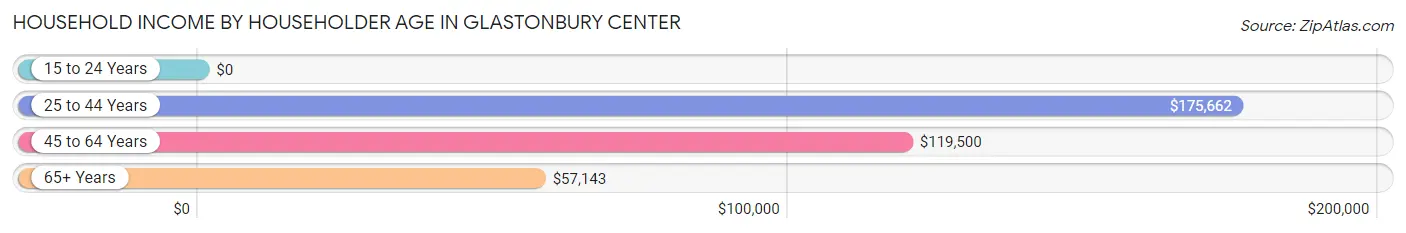
| Income Bracket | # Households | Median Income |
| 15 to 24 Years | 36 (1.0%) | $0 |
| 25 to 44 Years | 973 (26.4%) | $175,662 |
| 45 to 64 Years | 1,192 (32.4%) | $119,500 |
| 65+ Years | 1,480 (40.2%) | $57,143 |
| Total | 3,681 (100.0%) | $104,557 |
Poverty in Glastonbury Center
Income Below Poverty by Sex and Age in Glastonbury Center
With 3.4% poverty level for males and 7.5% for females among the residents of Glastonbury Center, 45 to 54 year old males and 15 year old females are the most vulnerable to poverty, with 71 males (17.2%) and 13 females (21.0%) in their respective age groups living below the poverty level.
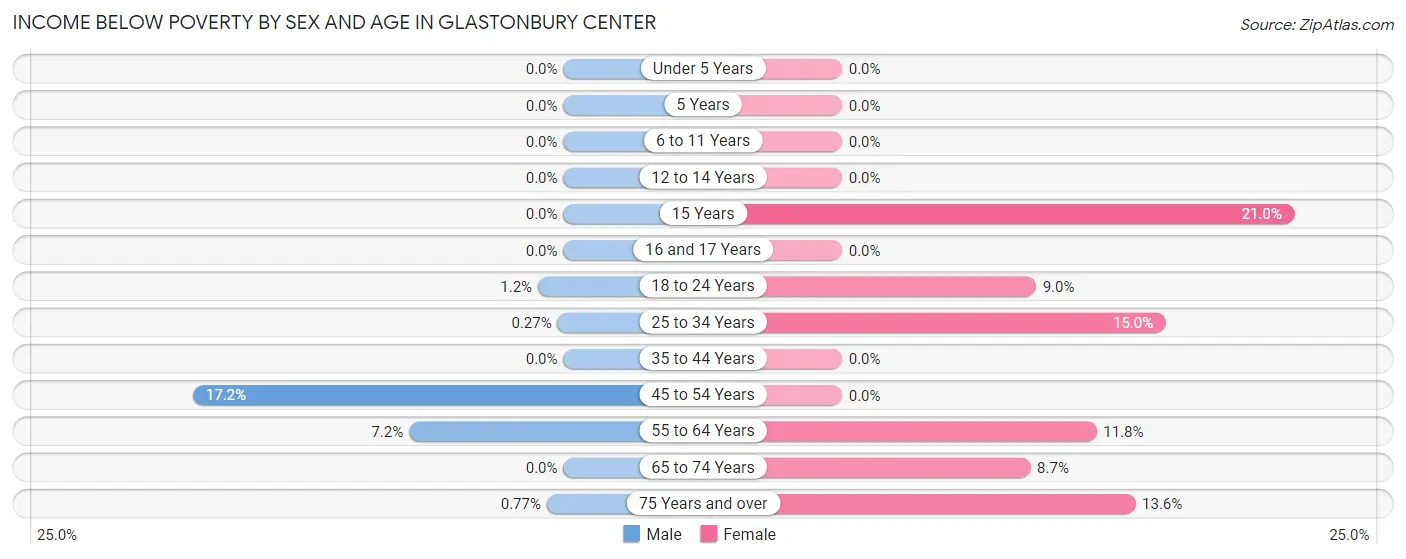
| Age Bracket | Male | Female |
| Under 5 Years | 0 (0.0%) | 0 (0.0%) |
| 5 Years | 0 (0.0%) | 0 (0.0%) |
| 6 to 11 Years | 0 (0.0%) | 0 (0.0%) |
| 12 to 14 Years | 0 (0.0%) | 0 (0.0%) |
| 15 Years | 0 (0.0%) | 13 (21.0%) |
| 16 and 17 Years | 0 (0.0%) | 0 (0.0%) |
| 18 to 24 Years | 1 (1.2%) | 36 (9.0%) |
| 25 to 34 Years | 1 (0.3%) | 69 (15.0%) |
| 35 to 44 Years | 0 (0.0%) | 0 (0.0%) |
| 45 to 54 Years | 71 (17.2%) | 0 (0.0%) |
| 55 to 64 Years | 39 (7.2%) | 66 (11.8%) |
| 65 to 74 Years | 0 (0.0%) | 62 (8.7%) |
| 75 Years and over | 4 (0.8%) | 86 (13.6%) |
| Total | 116 (3.4%) | 332 (7.5%) |
Income Above Poverty by Sex and Age in Glastonbury Center
According to the poverty statistics in Glastonbury Center, males aged under 5 years and females aged under 5 years are the age groups that are most secure financially, with 100.0% of males and 100.0% of females in these age groups living above the poverty line.
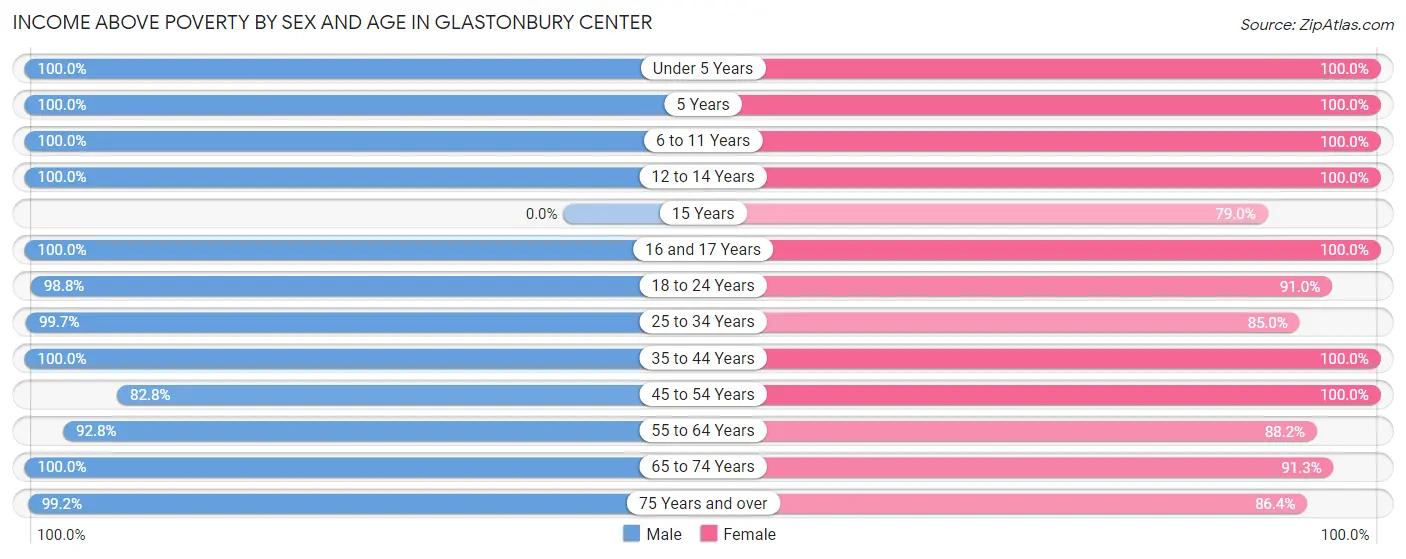
| Age Bracket | Male | Female |
| Under 5 Years | 224 (100.0%) | 171 (100.0%) |
| 5 Years | 27 (100.0%) | 22 (100.0%) |
| 6 to 11 Years | 292 (100.0%) | 188 (100.0%) |
| 12 to 14 Years | 77 (100.0%) | 90 (100.0%) |
| 15 Years | 0 (0.0%) | 49 (79.0%) |
| 16 and 17 Years | 90 (100.0%) | 98 (100.0%) |
| 18 to 24 Years | 84 (98.8%) | 364 (91.0%) |
| 25 to 34 Years | 370 (99.7%) | 391 (85.0%) |
| 35 to 44 Years | 510 (100.0%) | 537 (100.0%) |
| 45 to 54 Years | 342 (82.8%) | 469 (100.0%) |
| 55 to 64 Years | 506 (92.8%) | 493 (88.2%) |
| 65 to 74 Years | 240 (100.0%) | 647 (91.3%) |
| 75 Years and over | 514 (99.2%) | 546 (86.4%) |
| Total | 3,276 (96.6%) | 4,065 (92.4%) |
Income Below Poverty Among Married-Couple Families in Glastonbury Center
The poverty statistics for married-couple families in Glastonbury Center show that 1.5% or 24 of the total 1,650 families live below the poverty line. Families with no children have the highest poverty rate of 2.2%, comprising of 24 families. On the other hand, families with 1 or 2 children have the lowest poverty rate of 0.0%, which includes 0 families.
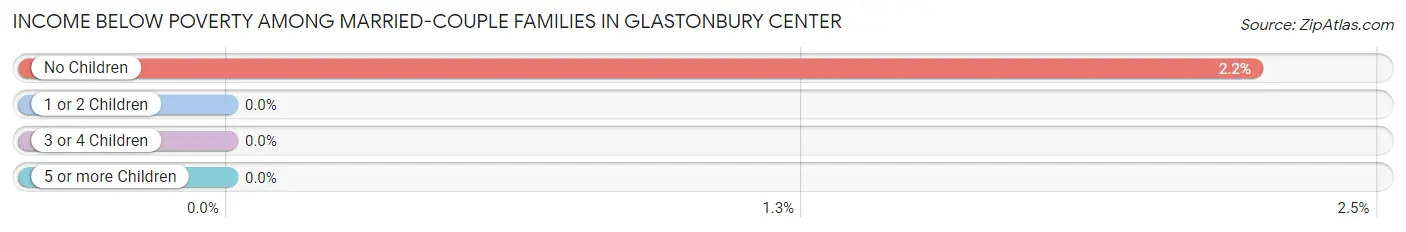
| Children | Above Poverty | Below Poverty |
| No Children | 1,052 (97.8%) | 24 (2.2%) |
| 1 or 2 Children | 495 (100.0%) | 0 (0.0%) |
| 3 or 4 Children | 79 (100.0%) | 0 (0.0%) |
| 5 or more Children | 0 (0.0%) | 0 (0.0%) |
| Total | 1,626 (98.6%) | 24 (1.5%) |
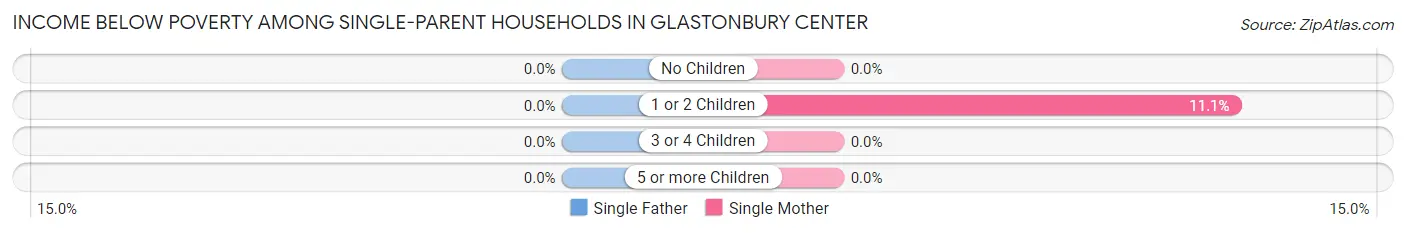
Income Below Poverty Among Single-Parent Households in Glastonbury Center
| Children | Single Father | Single Mother |
| No Children | 0 (0.0%) | 0 (0.0%) |
| 1 or 2 Children | 0 (0.0%) | 12 (11.1%) |
| 3 or 4 Children | 0 (0.0%) | 0 (0.0%) |
| 5 or more Children | 0 (0.0%) | 0 (0.0%) |
| Total | 0 (0.0%) | 12 (4.4%) |
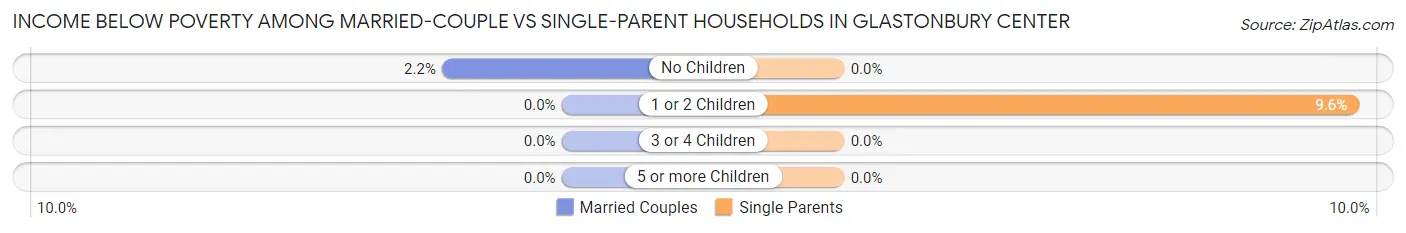
Income Below Poverty Among Married-Couple vs Single-Parent Households in Glastonbury Center
The poverty data for Glastonbury Center shows that 24 of the married-couple family households (1.5%) and 12 of the single-parent households (4.0%) are living below the poverty level. Within the married-couple family households, those with no children have the highest poverty rate, with 24 households (2.2%) falling below the poverty line. Among the single-parent households, those with 1 or 2 children have the highest poverty rate, with 12 household (9.6%) living below poverty.
| Children | Married-Couple Families | Single-Parent Households |
| No Children | 24 (2.2%) | 0 (0.0%) |
| 1 or 2 Children | 0 (0.0%) | 12 (9.6%) |
| 3 or 4 Children | 0 (0.0%) | 0 (0.0%) |
| 5 or more Children | 0 (0.0%) | 0 (0.0%) |
| Total | 24 (1.5%) | 12 (4.0%) |
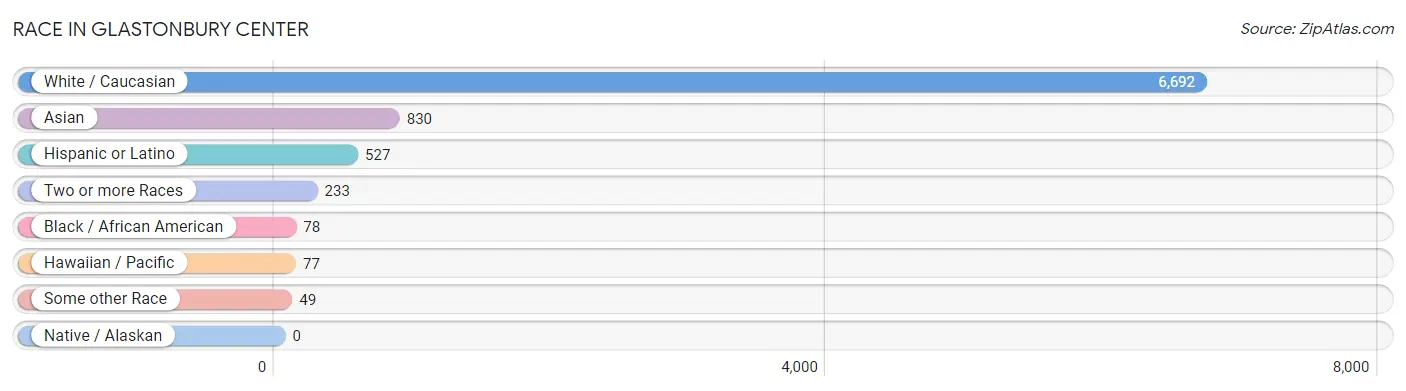
Race in Glastonbury Center
The most populous races in Glastonbury Center are White / Caucasian (6,692 | 84.1%), Asian (830 | 10.4%), and Hispanic or Latino (527 | 6.6%).
| Race | # Population | % Population |
| Asian | 830 | 10.4% |
| Black / African American | 78 | 1.0% |
| Hawaiian / Pacific | 77 | 1.0% |
| Hispanic or Latino | 527 | 6.6% |
| Native / Alaskan | 0 | 0.0% |
| White / Caucasian | 6,692 | 84.1% |
| Two or more Races | 233 | 2.9% |
| Some other Race | 49 | 0.6% |
| Total | 7,959 | 100.0% |
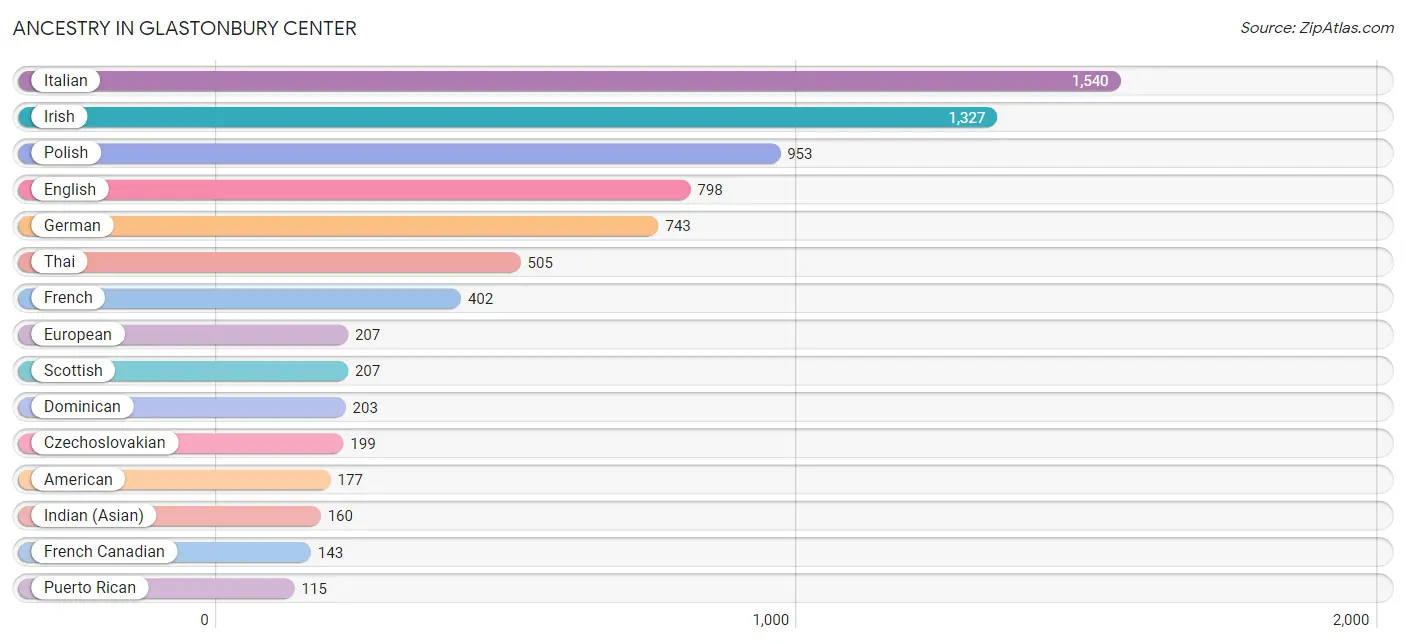
Ancestry in Glastonbury Center
The most populous ancestries reported in Glastonbury Center are Italian (1,540 | 19.4%), Irish (1,327 | 16.7%), Polish (953 | 12.0%), English (798 | 10.0%), and German (743 | 9.3%), together accounting for 67.4% of all Glastonbury Center residents.
| Ancestry | # Population | % Population |
| African | 4 | 0.1% |
| Albanian | 52 | 0.6% |
| American | 177 | 2.2% |
| Arab | 15 | 0.2% |
| Austrian | 41 | 0.5% |
| Bhutanese | 42 | 0.5% |
| British | 40 | 0.5% |
| Burmese | 98 | 1.2% |
| Canadian | 21 | 0.3% |
| Central American | 67 | 0.8% |
| Colombian | 27 | 0.3% |
| Costa Rican | 43 | 0.5% |
| Cuban | 51 | 0.6% |
| Czech | 20 | 0.3% |
| Czechoslovakian | 199 | 2.5% |
| Danish | 15 | 0.2% |
| Dominican | 203 | 2.5% |
| Dutch | 49 | 0.6% |
| Eastern European | 46 | 0.6% |
| Ecuadorian | 18 | 0.2% |
| English | 798 | 10.0% |
| European | 207 | 2.6% |
| French | 402 | 5.1% |
| French Canadian | 143 | 1.8% |
| German | 743 | 9.3% |
| Greek | 65 | 0.8% |
| Hungarian | 63 | 0.8% |
| Indian (Asian) | 160 | 2.0% |
| Irish | 1,327 | 16.7% |
| Italian | 1,540 | 19.4% |
| Jamaican | 54 | 0.7% |
| Korean | 5 | 0.1% |
| Lebanese | 15 | 0.2% |
| Lithuanian | 61 | 0.8% |
| Northern European | 10 | 0.1% |
| Norwegian | 44 | 0.5% |
| Panamanian | 24 | 0.3% |
| Peruvian | 16 | 0.2% |
| Polish | 953 | 12.0% |
| Portuguese | 15 | 0.2% |
| Puerto Rican | 115 | 1.4% |
| Russian | 114 | 1.4% |
| Scandinavian | 9 | 0.1% |
| Scotch-Irish | 19 | 0.2% |
| Scottish | 207 | 2.6% |
| Slovak | 62 | 0.8% |
| South American | 61 | 0.8% |
| Spanish | 24 | 0.3% |
| Sri Lankan | 41 | 0.5% |
| Subsaharan African | 4 | 0.1% |
| Swedish | 91 | 1.1% |
| Swiss | 21 | 0.3% |
| Thai | 505 | 6.4% |
| Welsh | 14 | 0.2% | View All 54 Rows |
Immigrants in Glastonbury Center
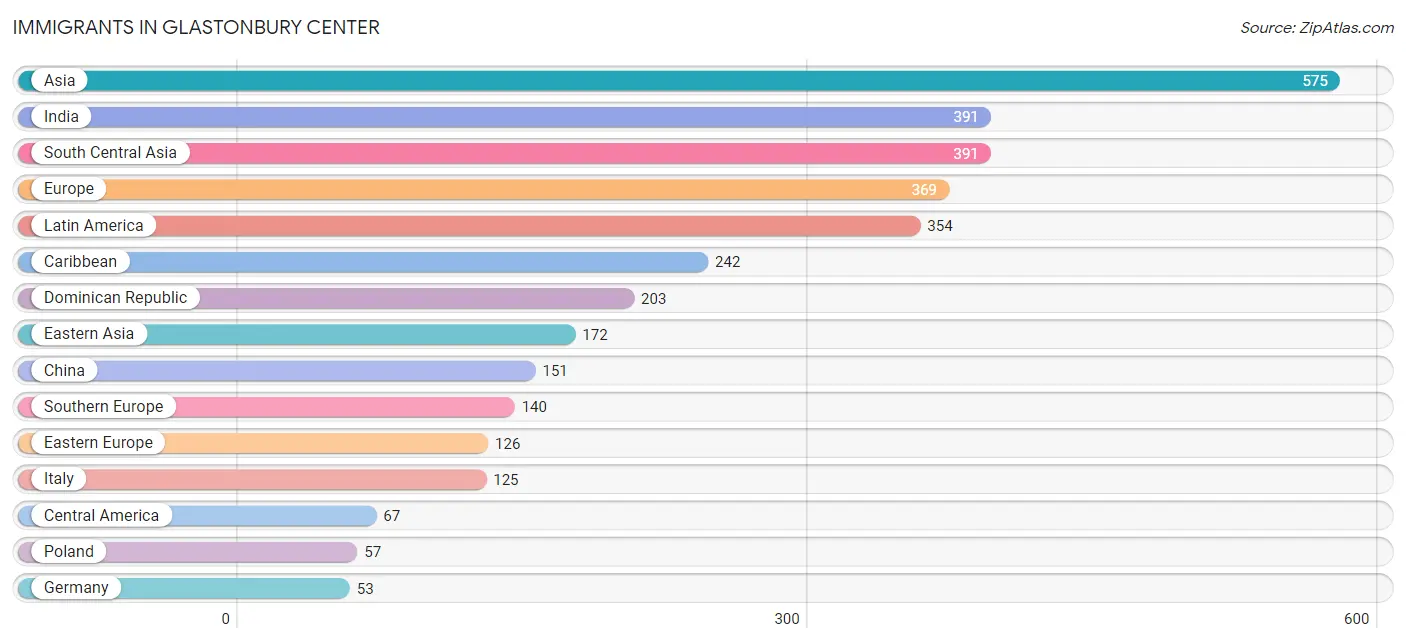
The most numerous immigrant groups reported in Glastonbury Center came from Asia (575 | 7.2%), India (391 | 4.9%), South Central Asia (391 | 4.9%), Europe (369 | 4.6%), and Latin America (354 | 4.4%), together accounting for 26.1% of all Glastonbury Center residents.
| Immigration Origin | # Population | % Population |
| Albania | 52 | 0.6% |
| Asia | 575 | 7.2% |
| Canada | 12 | 0.2% |
| Caribbean | 242 | 3.0% |
| Central America | 67 | 0.8% |
| China | 151 | 1.9% |
| Colombia | 27 | 0.3% |
| Costa Rica | 43 | 0.5% |
| Cuba | 21 | 0.3% |
| Dominican Republic | 203 | 2.5% |
| Eastern Asia | 172 | 2.2% |
| Eastern Europe | 126 | 1.6% |
| Ecuador | 18 | 0.2% |
| Europe | 369 | 4.6% |
| Germany | 53 | 0.7% |
| India | 391 | 4.9% |
| Ireland | 4 | 0.1% |
| Italy | 125 | 1.6% |
| Jamaica | 18 | 0.2% |
| Korea | 21 | 0.3% |
| Latin America | 354 | 4.4% |
| Northern Europe | 50 | 0.6% |
| Panama | 24 | 0.3% |
| Philippines | 5 | 0.1% |
| Poland | 57 | 0.7% |
| Portugal | 15 | 0.2% |
| South America | 45 | 0.6% |
| South Central Asia | 391 | 4.9% |
| South Eastern Asia | 12 | 0.2% |
| Southern Europe | 140 | 1.8% |
| Taiwan | 23 | 0.3% |
| Vietnam | 7 | 0.1% |
| Western Europe | 53 | 0.7% | View All 33 Rows |
Sex and Age in Glastonbury Center
Sex and Age in Glastonbury Center
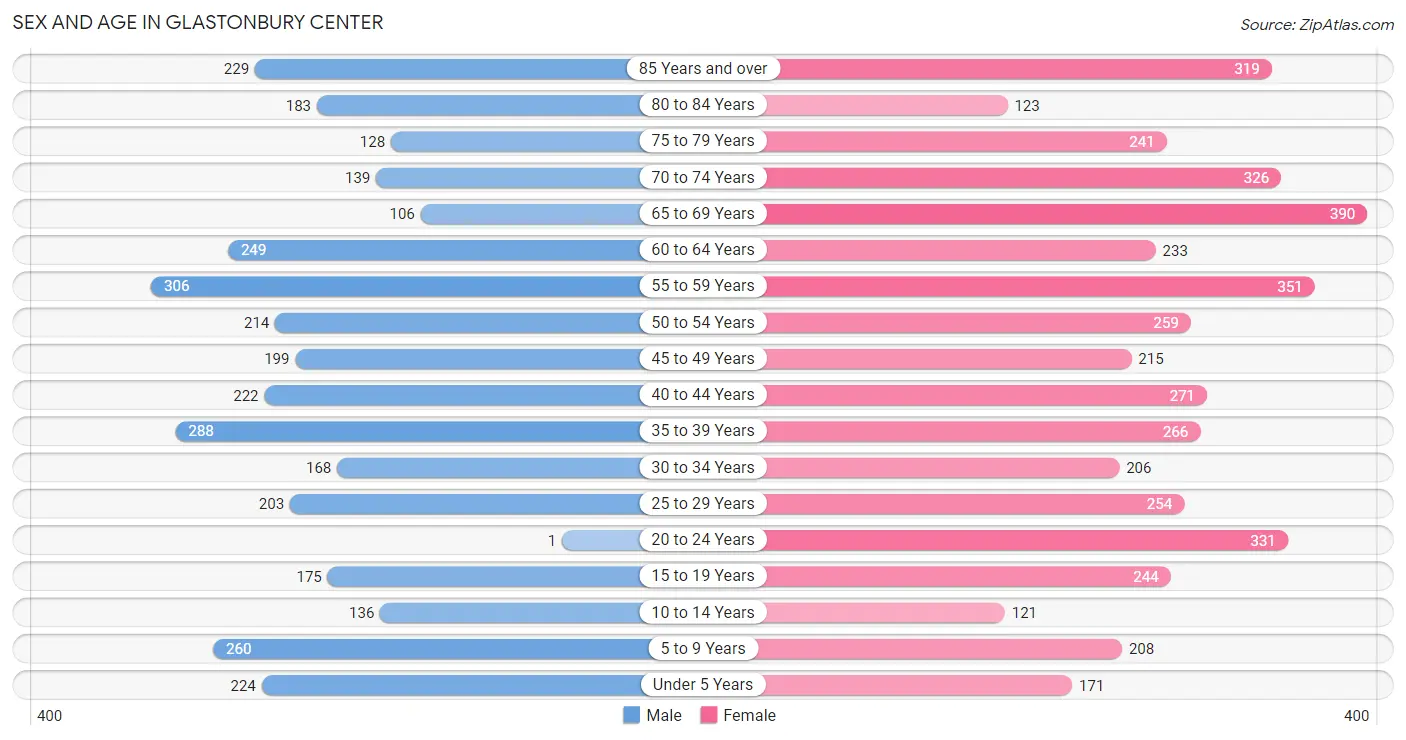
The most populous age groups in Glastonbury Center are 55 to 59 Years (306 | 8.9%) for men and 65 to 69 Years (390 | 8.6%) for women.
| Age Bracket | Male | Female |
| Under 5 Years | 224 (6.5%) | 171 (3.8%) |
| 5 to 9 Years | 260 (7.6%) | 208 (4.6%) |
| 10 to 14 Years | 136 (4.0%) | 121 (2.7%) |
| 15 to 19 Years | 175 (5.1%) | 244 (5.4%) |
| 20 to 24 Years | 1 (0.0%) | 331 (7.3%) |
| 25 to 29 Years | 203 (5.9%) | 254 (5.6%) |
| 30 to 34 Years | 168 (4.9%) | 206 (4.5%) |
| 35 to 39 Years | 288 (8.4%) | 266 (5.9%) |
| 40 to 44 Years | 222 (6.5%) | 271 (6.0%) |
| 45 to 49 Years | 199 (5.8%) | 215 (4.8%) |
| 50 to 54 Years | 214 (6.2%) | 259 (5.7%) |
| 55 to 59 Years | 306 (8.9%) | 351 (7.7%) |
| 60 to 64 Years | 249 (7.3%) | 233 (5.1%) |
| 65 to 69 Years | 106 (3.1%) | 390 (8.6%) |
| 70 to 74 Years | 139 (4.1%) | 326 (7.2%) |
| 75 to 79 Years | 128 (3.7%) | 241 (5.3%) |
| 80 to 84 Years | 183 (5.3%) | 123 (2.7%) |
| 85 Years and over | 229 (6.7%) | 319 (7.0%) |
| Total | 3,430 (100.0%) | 4,529 (100.0%) |
Families and Households in Glastonbury Center
Median Family Size in Glastonbury Center
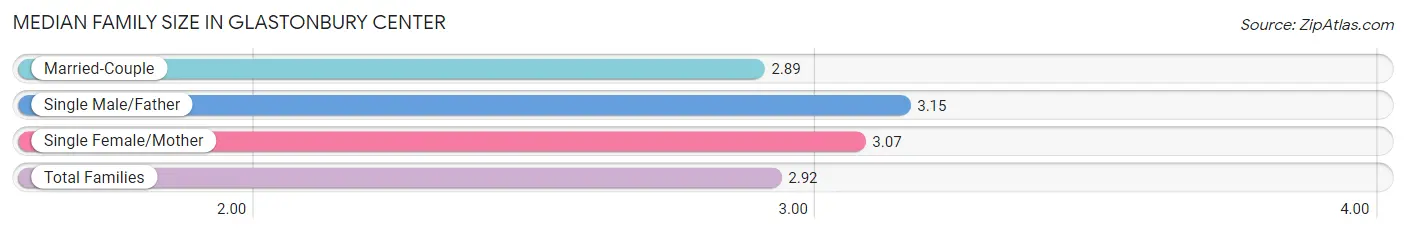
The median family size in Glastonbury Center is 2.92 persons per family, with single male/father families (27 | 1.4%) accounting for the largest median family size of 3.15 persons per family. On the other hand, married-couple families (1,650 | 84.6%) represent the smallest median family size with 2.89 persons per family.
| Family Type | # Families | Family Size |
| Married-Couple | 1,650 (84.6%) | 2.89 |
| Single Male/Father | 27 (1.4%) | 3.15 |
| Single Female/Mother | 274 (14.0%) | 3.07 |
| Total Families | 1,951 (100.0%) | 2.92 |
Median Household Size in Glastonbury Center
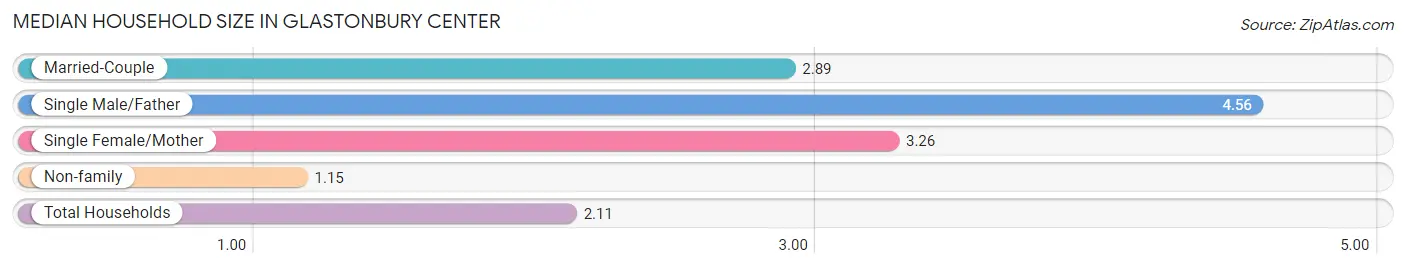
The median household size in Glastonbury Center is 2.11 persons per household, with single male/father households (27 | 0.7%) accounting for the largest median household size of 4.56 persons per household. non-family households (1,730 | 47.0%) represent the smallest median household size with 1.15 persons per household.
| Household Type | # Households | Household Size |
| Married-Couple | 1,650 (44.8%) | 2.89 |
| Single Male/Father | 27 (0.7%) | 4.56 |
| Single Female/Mother | 274 (7.4%) | 3.26 |
| Non-family | 1,730 (47.0%) | 1.15 |
| Total Households | 3,681 (100.0%) | 2.11 |
Household Size by Marriage Status in Glastonbury Center
Out of a total of 3,681 households in Glastonbury Center, 1,951 (53.0%) are family households, while 1,730 (47.0%) are nonfamily households. The most numerous type of family households are 2-person households, comprising 982, and the most common type of nonfamily households are 1-person households, comprising 1,491.
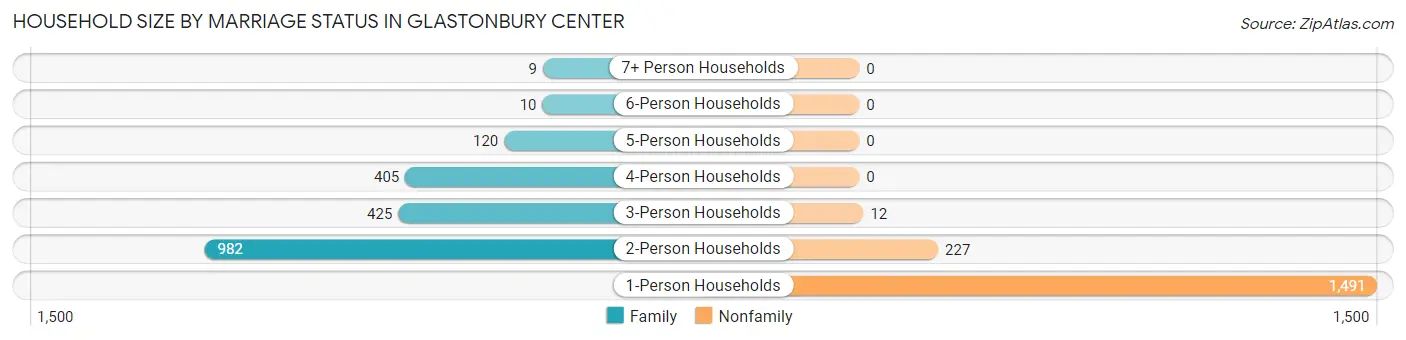
| Household Size | Family Households | Nonfamily Households |
| 1-Person Households | - | 1,491 (40.5%) |
| 2-Person Households | 982 (26.7%) | 227 (6.2%) |
| 3-Person Households | 425 (11.6%) | 12 (0.3%) |
| 4-Person Households | 405 (11.0%) | 0 (0.0%) |
| 5-Person Households | 120 (3.3%) | 0 (0.0%) |
| 6-Person Households | 10 (0.3%) | 0 (0.0%) |
| 7+ Person Households | 9 (0.2%) | 0 (0.0%) |
| Total | 1,951 (53.0%) | 1,730 (47.0%) |
Female Fertility in Glastonbury Center
Fertility by Age in Glastonbury Center
Average fertility rate in Glastonbury Center is 40.0 births per 1,000 women. Women in the age bracket of 35 to 50 years have the highest fertility rate with 49.0 births per 1,000 women. Women in the age bracket of 35 to 50 years acount for 52.8% of all women with births.
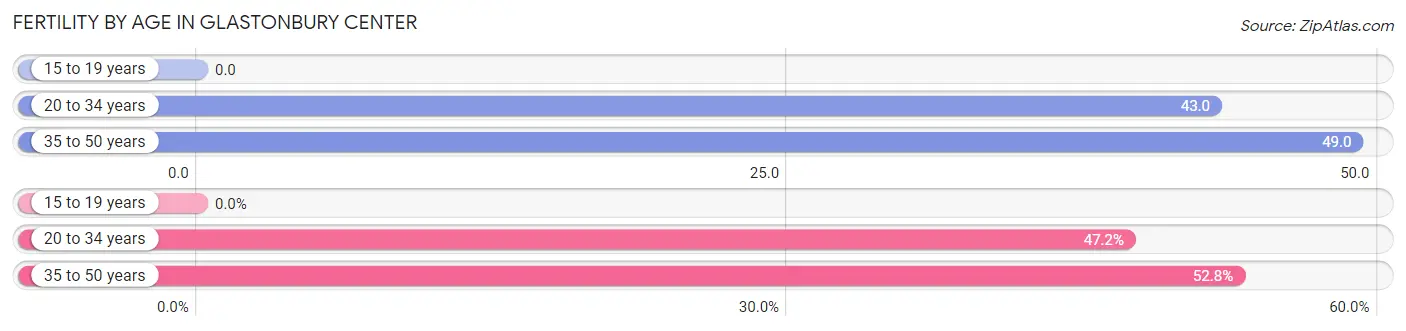
| Age Bracket | Women with Births | Births / 1,000 Women |
| 15 to 19 years | 0 (0.0%) | 0.0 |
| 20 to 34 years | 34 (47.2%) | 43.0 |
| 35 to 50 years | 38 (52.8%) | 49.0 |
| Total | 72 (100.0%) | 40.0 |
Fertility by Age by Marriage Status in Glastonbury Center
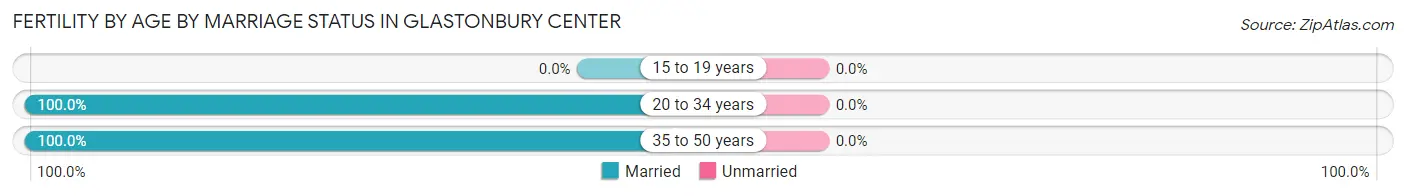
| Age Bracket | Married | Unmarried |
| 15 to 19 years | 0 (0.0%) | 0 (0.0%) |
| 20 to 34 years | 34 (100.0%) | 0 (0.0%) |
| 35 to 50 years | 38 (100.0%) | 0 (0.0%) |
| Total | 72 (100.0%) | 0 (0.0%) |
Fertility by Education in Glastonbury Center

| Educational Attainment | Women with Births | Births / 1,000 Women |
| Less than High School | 0 (0.0%) | 0.0 |
| High School Diploma | 0 (0.0%) | 0.0 |
| College or Associate's Degree | 49 (68.1%) | 130.0 |
| Bachelor's Degree | 0 (0.0%) | 0.0 |
| Graduate Degree | 23 (31.9%) | 49.0 |
| Total | 72 (100.0%) | 40.0 |
Fertility by Education by Marriage Status in Glastonbury Center
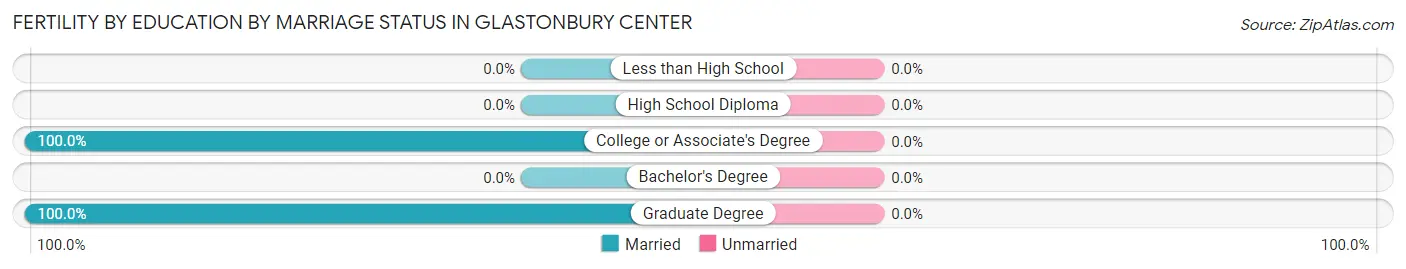
| Educational Attainment | Married | Unmarried |
| Less than High School | 0 (0.0%) | 0 (0.0%) |
| High School Diploma | 0 (0.0%) | 0 (0.0%) |
| College or Associate's Degree | 49 (100.0%) | 0 (0.0%) |
| Bachelor's Degree | 0 (0.0%) | 0 (0.0%) |
| Graduate Degree | 23 (100.0%) | 0 (0.0%) |
| Total | 72 (100.0%) | 0 (0.0%) |
Employment Characteristics in Glastonbury Center
Employment by Class of Employer in Glastonbury Center
Among the 4,059 employed individuals in Glastonbury Center, private company employees (2,531 | 62.4%), local government employees (489 | 12.0%), and not-for-profit organizations (394 | 9.7%) make up the most common classes of employment.
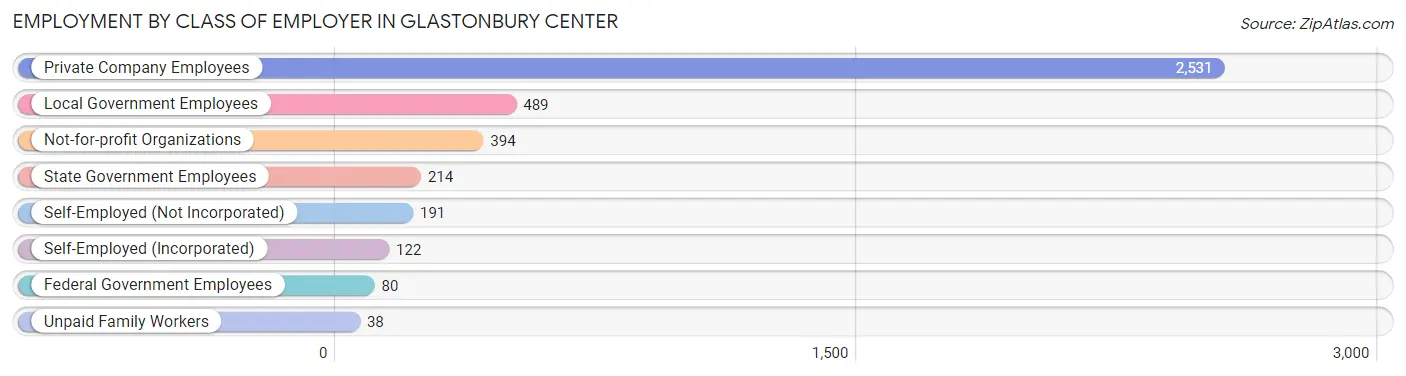
| Employer Class | # Employees | % Employees |
| Private Company Employees | 2,531 | 62.4% |
| Self-Employed (Incorporated) | 122 | 3.0% |
| Self-Employed (Not Incorporated) | 191 | 4.7% |
| Not-for-profit Organizations | 394 | 9.7% |
| Local Government Employees | 489 | 12.0% |
| State Government Employees | 214 | 5.3% |
| Federal Government Employees | 80 | 2.0% |
| Unpaid Family Workers | 38 | 0.9% |
| Total | 4,059 | 100.0% |
Employment Status by Age in Glastonbury Center
According to the labor force statistics for Glastonbury Center, out of the total population over 16 years of age (6,777), 61.5% or 4,168 individuals are in the labor force, with 2.7% or 113 of them unemployed. The age group with the highest labor force participation rate is 35 to 44 years, with 96.3% or 1,008 individuals in the labor force. Within the labor force, the 16 to 19 years age range has the highest percentage of unemployed individuals, with 76.2% or 64 of them being unemployed.
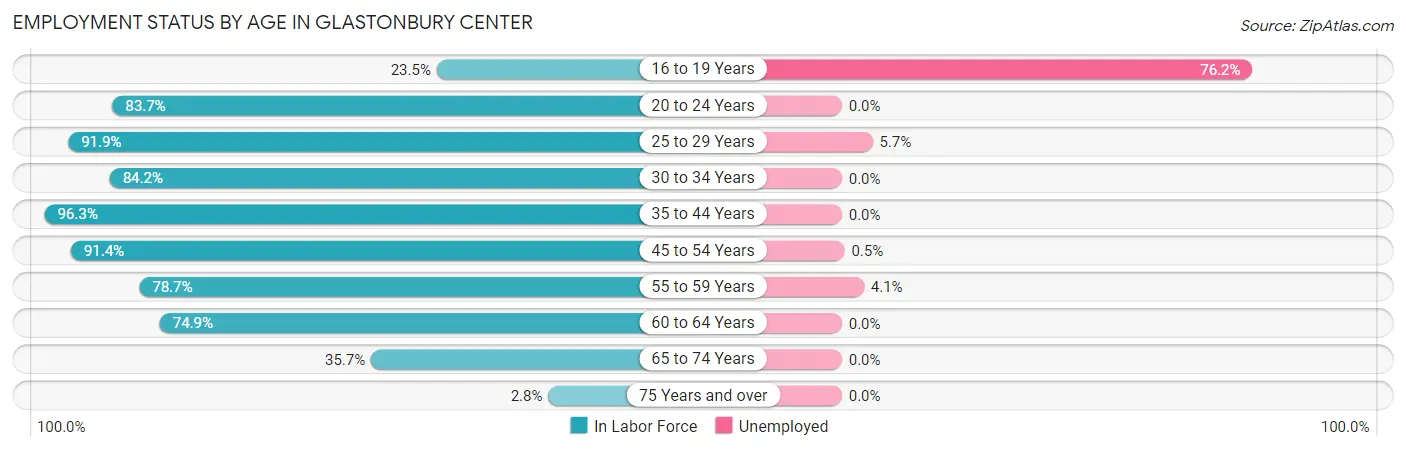
| Age Bracket | In Labor Force | Unemployed |
| 16 to 19 Years | 84 (23.5%) | 64 (76.2%) |
| 20 to 24 Years | 278 (83.7%) | 0 (0.0%) |
| 25 to 29 Years | 420 (91.9%) | 24 (5.7%) |
| 30 to 34 Years | 315 (84.2%) | 0 (0.0%) |
| 35 to 44 Years | 1,008 (96.3%) | 0 (0.0%) |
| 45 to 54 Years | 811 (91.4%) | 4 (0.5%) |
| 55 to 59 Years | 517 (78.7%) | 21 (4.1%) |
| 60 to 64 Years | 361 (74.9%) | 0 (0.0%) |
| 65 to 74 Years | 343 (35.7%) | 0 (0.0%) |
| 75 Years and over | 34 (2.8%) | 0 (0.0%) |
| Total | 4,168 (61.5%) | 113 (2.7%) |
Employment Status by Educational Attainment in Glastonbury Center
According to labor force statistics for Glastonbury Center, 87.9% of individuals (3,432) out of the total population between 25 and 64 years of age (3,904) are in the labor force, with 1.4% or 48 of them being unemployed. The group with the highest labor force participation rate are those with the educational attainment of bachelor's degree or higher, with 92.2% or 2,695 individuals in the labor force. Within the labor force, individuals with bachelor's degree or higher education have the highest percentage of unemployment, with 1.8% or 49 of them being unemployed.
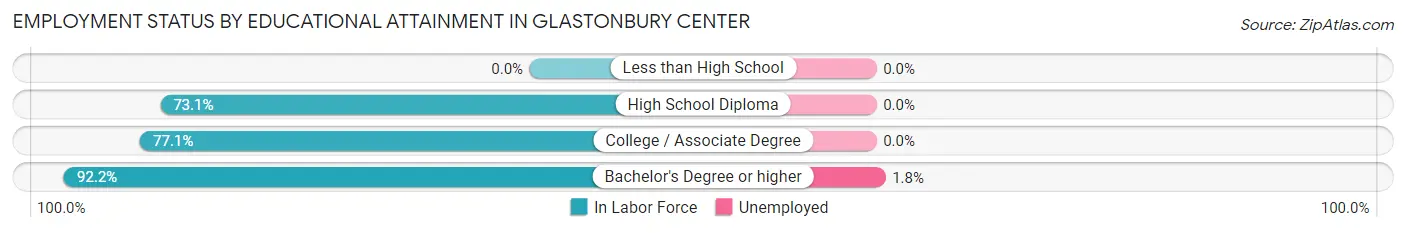
| Educational Attainment | In Labor Force | Unemployed |
| Less than High School | 0 (0.0%) | 0 (0.0%) |
| High School Diploma | 264 (73.1%) | 0 (0.0%) |
| College / Associate Degree | 474 (77.1%) | 0 (0.0%) |
| Bachelor's Degree or higher | 2,695 (92.2%) | 53 (1.8%) |
| Total | 3,432 (87.9%) | 55 (1.4%) |
Employment Occupations by Sex in Glastonbury Center
Management, Business, Science and Arts Occupations
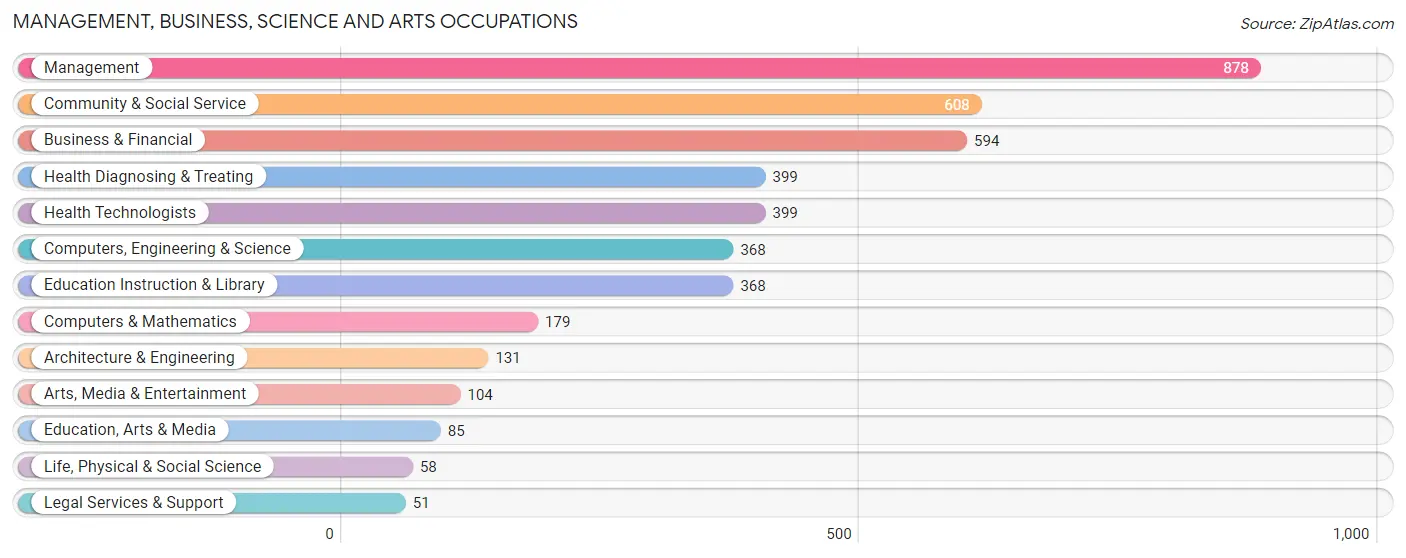
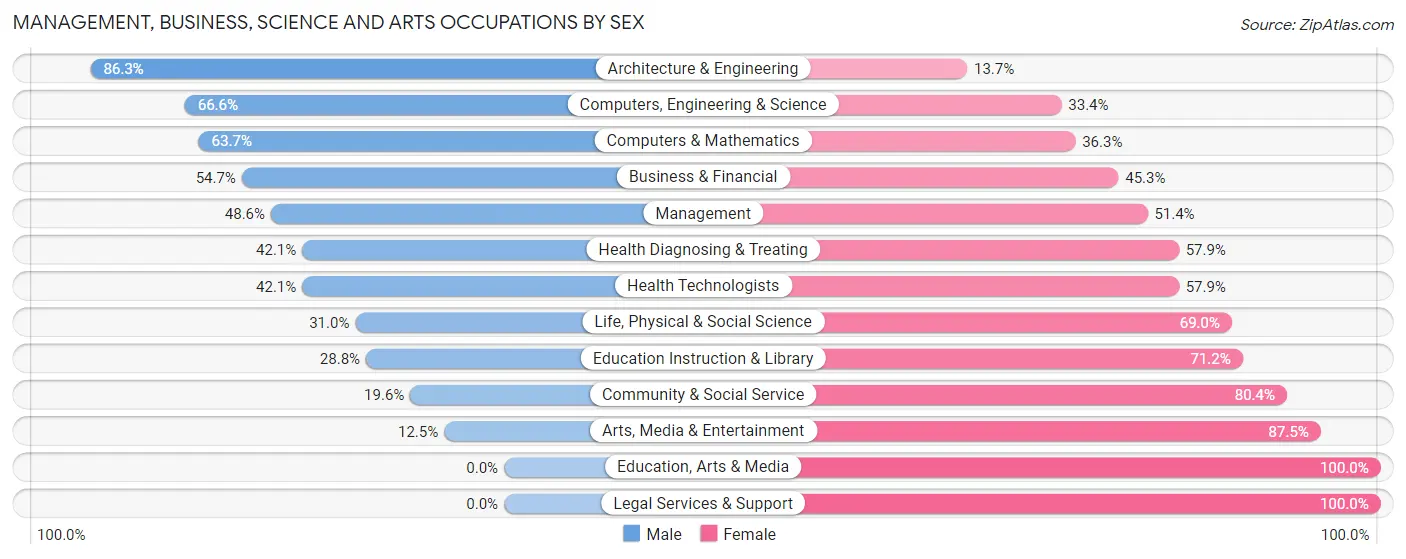
The most common Management, Business, Science and Arts occupations in Glastonbury Center are Management (878 | 21.8%), Community & Social Service (608 | 15.1%), Business & Financial (594 | 14.7%), Health Diagnosing & Treating (399 | 9.9%), and Health Technologists (399 | 9.9%).
Management, Business, Science and Arts Occupations by Sex
Within the Management, Business, Science and Arts occupations in Glastonbury Center, the most male-oriented occupations are Architecture & Engineering (86.3%), Computers, Engineering & Science (66.6%), and Computers & Mathematics (63.7%), while the most female-oriented occupations are Education, Arts & Media (100.0%), Legal Services & Support (100.0%), and Arts, Media & Entertainment (87.5%).
| Occupation | Male | Female |
| Management | 427 (48.6%) | 451 (51.4%) |
| Business & Financial | 325 (54.7%) | 269 (45.3%) |
| Computers, Engineering & Science | 245 (66.6%) | 123 (33.4%) |
| Computers & Mathematics | 114 (63.7%) | 65 (36.3%) |
| Architecture & Engineering | 113 (86.3%) | 18 (13.7%) |
| Life, Physical & Social Science | 18 (31.0%) | 40 (69.0%) |
| Community & Social Service | 119 (19.6%) | 489 (80.4%) |
| Education, Arts & Media | 0 (0.0%) | 85 (100.0%) |
| Legal Services & Support | 0 (0.0%) | 51 (100.0%) |
| Education Instruction & Library | 106 (28.8%) | 262 (71.2%) |
| Arts, Media & Entertainment | 13 (12.5%) | 91 (87.5%) |
| Health Diagnosing & Treating | 168 (42.1%) | 231 (57.9%) |
| Health Technologists | 168 (42.1%) | 231 (57.9%) |
| Total (Category) | 1,284 (45.1%) | 1,563 (54.9%) |
| Total (Overall) | 1,712 (42.5%) | 2,317 (57.5%) |
Services Occupations
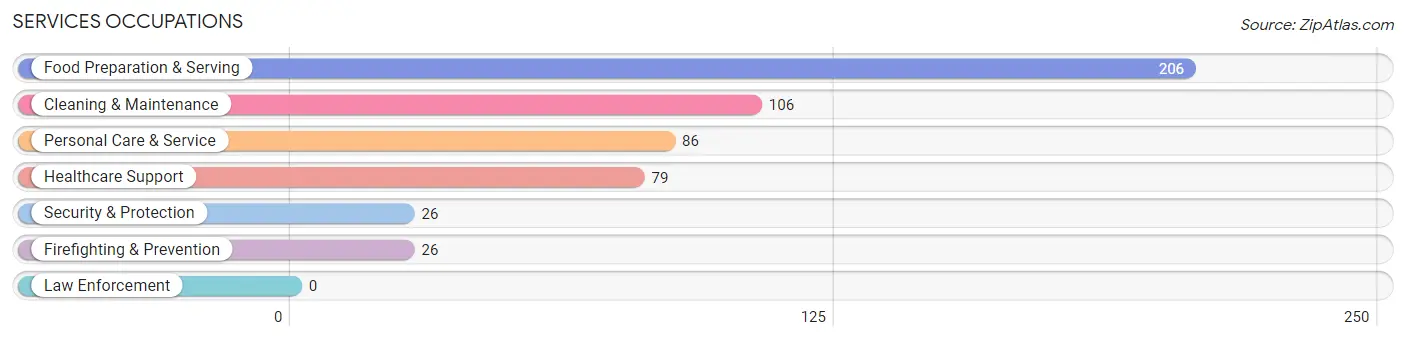
The most common Services occupations in Glastonbury Center are Food Preparation & Serving (206 | 5.1%), Cleaning & Maintenance (106 | 2.6%), Personal Care & Service (86 | 2.1%), Healthcare Support (79 | 2.0%), and Security & Protection (26 | 0.6%).
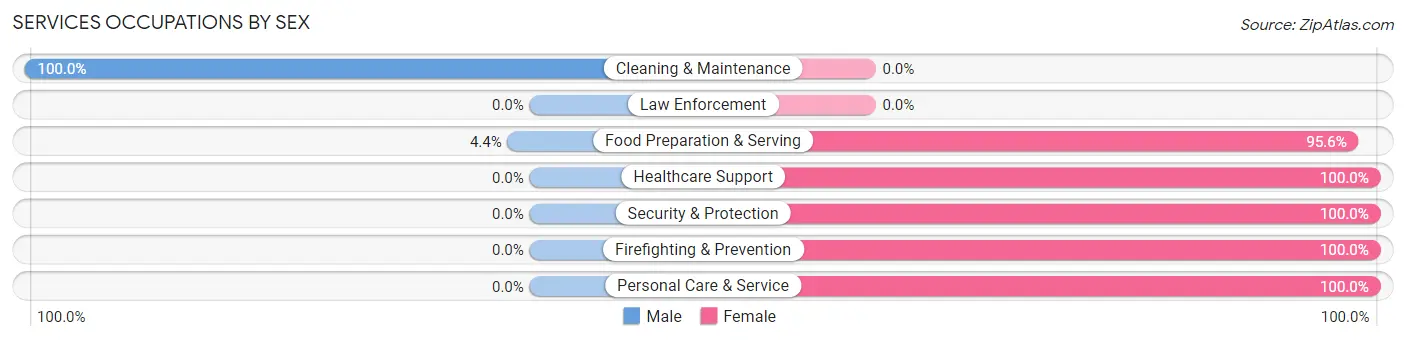
Services Occupations by Sex
Within the Services occupations in Glastonbury Center, the most male-oriented occupations are Cleaning & Maintenance (100.0%), and Food Preparation & Serving (4.4%), while the most female-oriented occupations are Healthcare Support (100.0%), Security & Protection (100.0%), and Firefighting & Prevention (100.0%).
| Occupation | Male | Female |
| Healthcare Support | 0 (0.0%) | 79 (100.0%) |
| Security & Protection | 0 (0.0%) | 26 (100.0%) |
| Firefighting & Prevention | 0 (0.0%) | 26 (100.0%) |
| Law Enforcement | 0 (0.0%) | 0 (0.0%) |
| Food Preparation & Serving | 9 (4.4%) | 197 (95.6%) |
| Cleaning & Maintenance | 106 (100.0%) | 0 (0.0%) |
| Personal Care & Service | 0 (0.0%) | 86 (100.0%) |
| Total (Category) | 115 (22.9%) | 388 (77.1%) |
| Total (Overall) | 1,712 (42.5%) | 2,317 (57.5%) |
Sales and Office Occupations
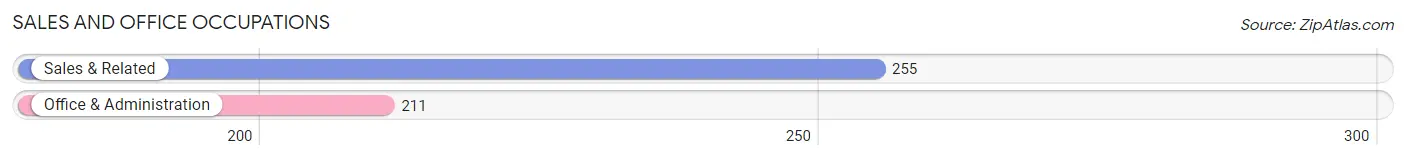
The most common Sales and Office occupations in Glastonbury Center are Sales & Related (255 | 6.3%), and Office & Administration (211 | 5.2%).
Sales and Office Occupations by Sex
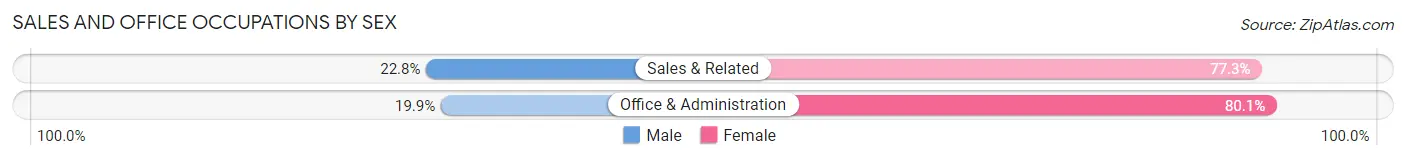
| Occupation | Male | Female |
| Sales & Related | 58 (22.8%) | 197 (77.2%) |
| Office & Administration | 42 (19.9%) | 169 (80.1%) |
| Total (Category) | 100 (21.5%) | 366 (78.5%) |
| Total (Overall) | 1,712 (42.5%) | 2,317 (57.5%) |
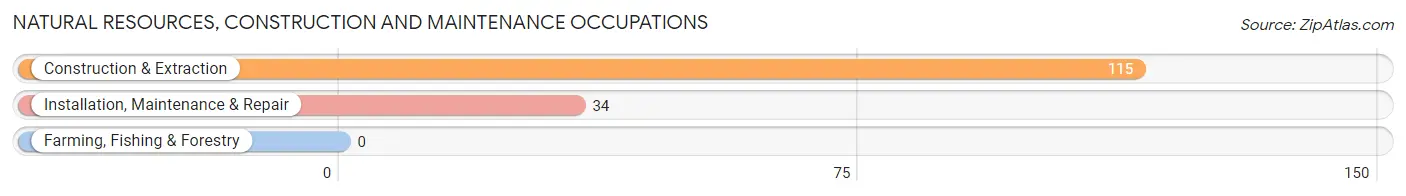
Natural Resources, Construction and Maintenance Occupations
The most common Natural Resources, Construction and Maintenance occupations in Glastonbury Center are Construction & Extraction (115 | 2.9%), and Installation, Maintenance & Repair (34 | 0.8%).
Natural Resources, Construction and Maintenance Occupations by Sex
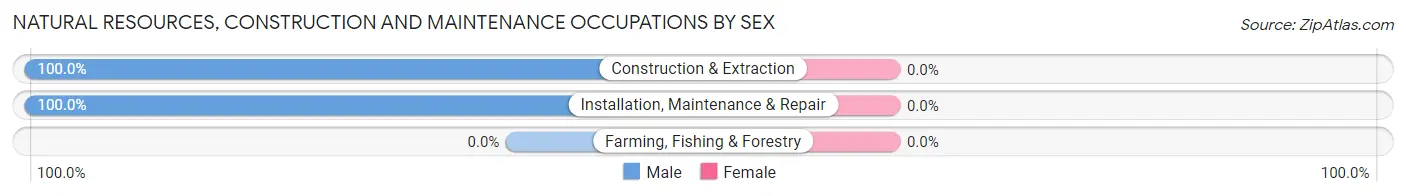
| Occupation | Male | Female |
| Farming, Fishing & Forestry | 0 (0.0%) | 0 (0.0%) |
| Construction & Extraction | 115 (100.0%) | 0 (0.0%) |
| Installation, Maintenance & Repair | 34 (100.0%) | 0 (0.0%) |
| Total (Category) | 149 (100.0%) | 0 (0.0%) |
| Total (Overall) | 1,712 (42.5%) | 2,317 (57.5%) |
Production, Transportation and Moving Occupations
The most common Production, Transportation and Moving occupations in Glastonbury Center are Transportation (24 | 0.6%), Production (21 | 0.5%), and Material Moving (19 | 0.5%).
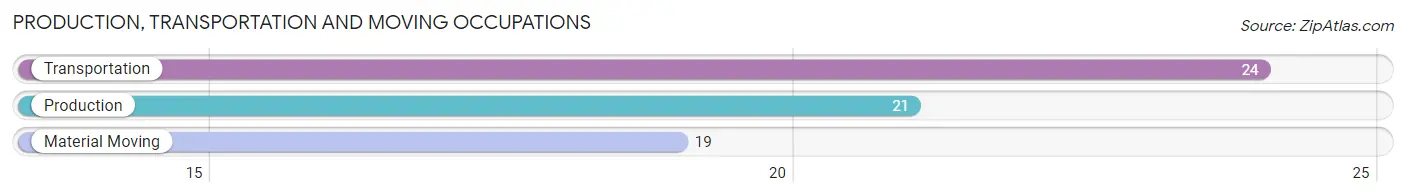
Production, Transportation and Moving Occupations by Sex
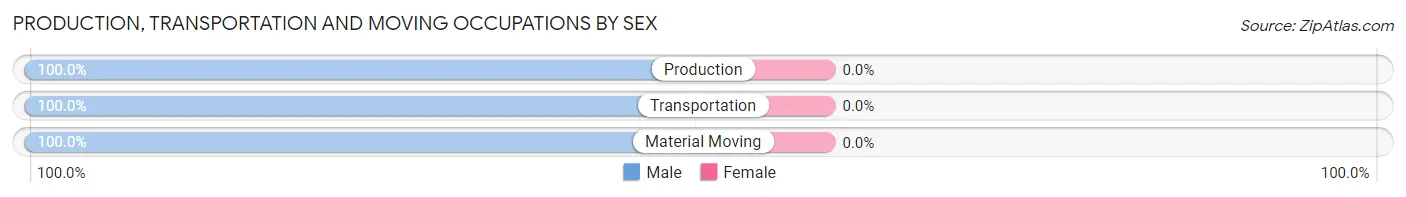
| Occupation | Male | Female |
| Production | 21 (100.0%) | 0 (0.0%) |
| Transportation | 24 (100.0%) | 0 (0.0%) |
| Material Moving | 19 (100.0%) | 0 (0.0%) |
| Total (Category) | 64 (100.0%) | 0 (0.0%) |
| Total (Overall) | 1,712 (42.5%) | 2,317 (57.5%) |
Employment Industries by Sex in Glastonbury Center
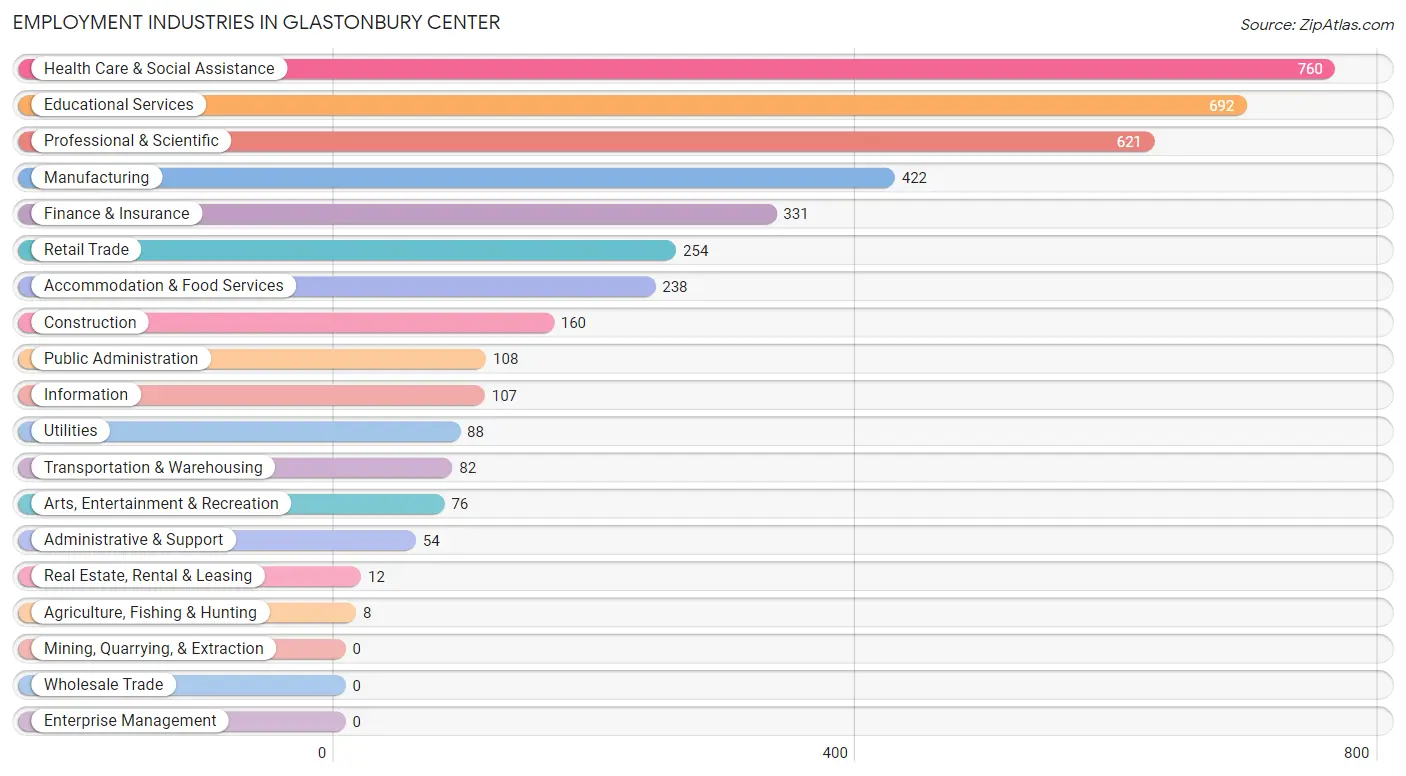
Employment Industries in Glastonbury Center
The major employment industries in Glastonbury Center include Health Care & Social Assistance (760 | 18.9%), Educational Services (692 | 17.2%), Professional & Scientific (621 | 15.4%), Manufacturing (422 | 10.5%), and Finance & Insurance (331 | 8.2%).
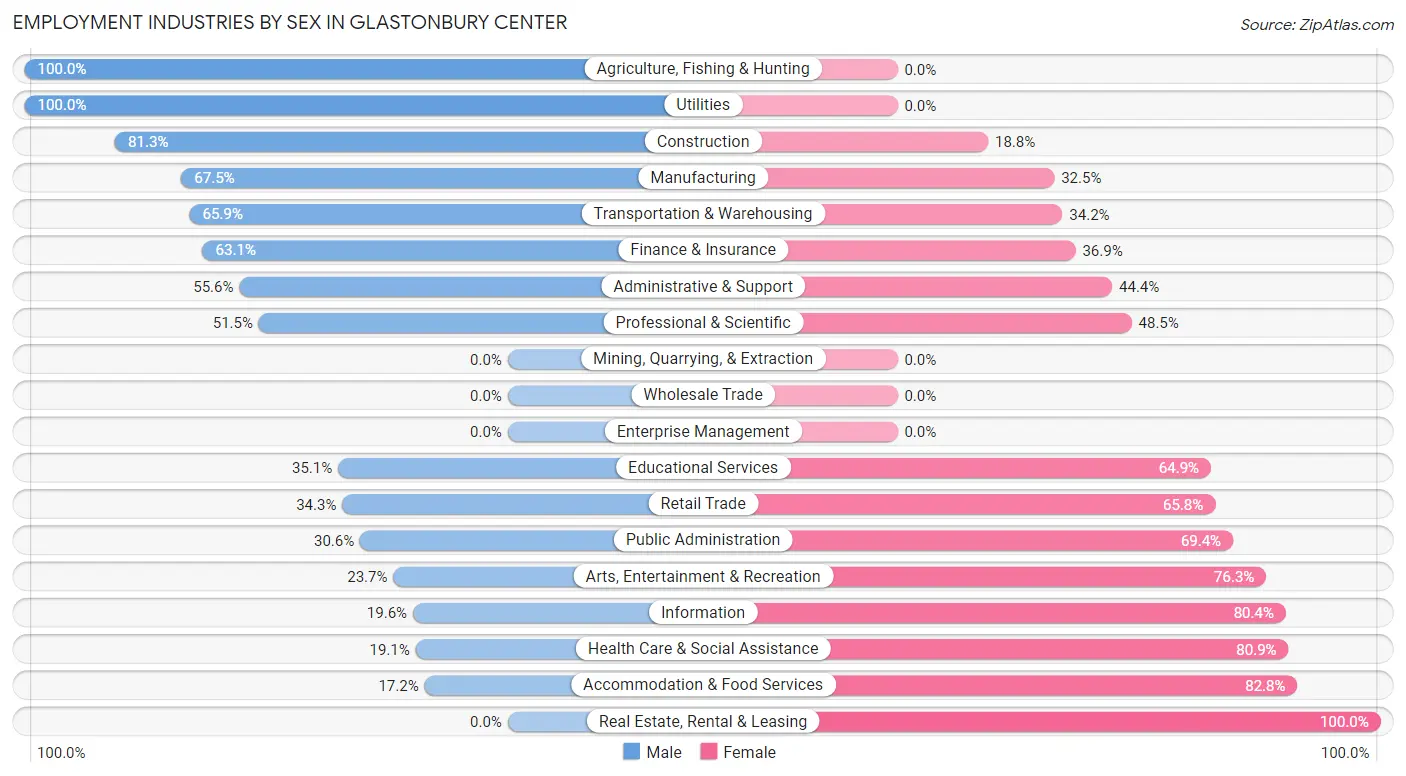
Employment Industries by Sex in Glastonbury Center
The Glastonbury Center industries that see more men than women are Agriculture, Fishing & Hunting (100.0%), Utilities (100.0%), and Construction (81.2%), whereas the industries that tend to have a higher number of women are Real Estate, Rental & Leasing (100.0%), Accommodation & Food Services (82.8%), and Health Care & Social Assistance (80.9%).
| Industry | Male | Female |
| Agriculture, Fishing & Hunting | 8 (100.0%) | 0 (0.0%) |
| Mining, Quarrying, & Extraction | 0 (0.0%) | 0 (0.0%) |
| Construction | 130 (81.2%) | 30 (18.8%) |
| Manufacturing | 285 (67.5%) | 137 (32.5%) |
| Wholesale Trade | 0 (0.0%) | 0 (0.0%) |
| Retail Trade | 87 (34.3%) | 167 (65.7%) |
| Transportation & Warehousing | 54 (65.8%) | 28 (34.2%) |
| Utilities | 88 (100.0%) | 0 (0.0%) |
| Information | 21 (19.6%) | 86 (80.4%) |
| Finance & Insurance | 209 (63.1%) | 122 (36.9%) |
| Real Estate, Rental & Leasing | 0 (0.0%) | 12 (100.0%) |
| Professional & Scientific | 320 (51.5%) | 301 (48.5%) |
| Enterprise Management | 0 (0.0%) | 0 (0.0%) |
| Administrative & Support | 30 (55.6%) | 24 (44.4%) |
| Educational Services | 243 (35.1%) | 449 (64.9%) |
| Health Care & Social Assistance | 145 (19.1%) | 615 (80.9%) |
| Arts, Entertainment & Recreation | 18 (23.7%) | 58 (76.3%) |
| Accommodation & Food Services | 41 (17.2%) | 197 (82.8%) |
| Public Administration | 33 (30.6%) | 75 (69.4%) |
| Total | 1,712 (42.5%) | 2,317 (57.5%) |
Education in Glastonbury Center
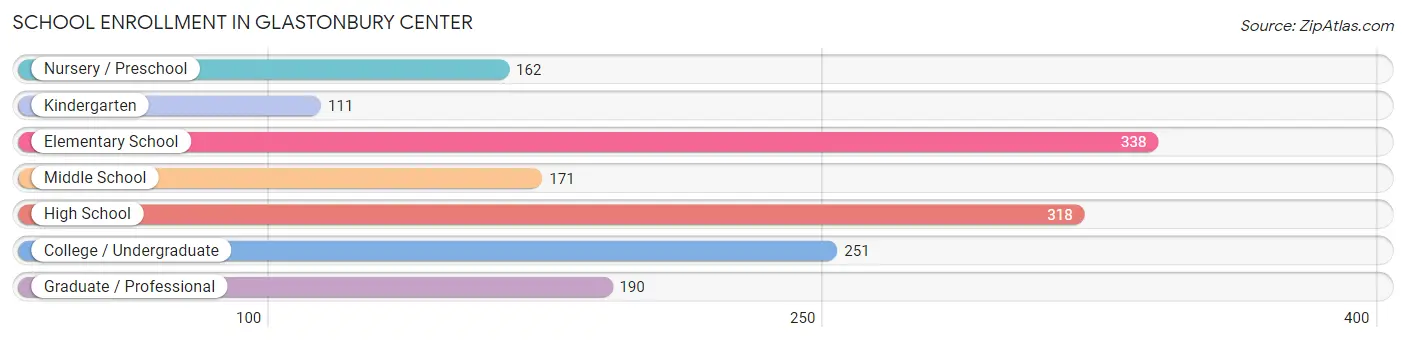
School Enrollment in Glastonbury Center
The most common levels of schooling among the 1,541 students in Glastonbury Center are elementary school (338 | 21.9%), high school (318 | 20.6%), and college / undergraduate (251 | 16.3%).
| School Level | # Students | % Students |
| Nursery / Preschool | 162 | 10.5% |
| Kindergarten | 111 | 7.2% |
| Elementary School | 338 | 21.9% |
| Middle School | 171 | 11.1% |
| High School | 318 | 20.6% |
| College / Undergraduate | 251 | 16.3% |
| Graduate / Professional | 190 | 12.3% |
| Total | 1,541 | 100.0% |
School Enrollment by Age by Funding Source in Glastonbury Center
Out of a total of 1,541 students who are enrolled in schools in Glastonbury Center, 316 (20.5%) attend a private institution, while the remaining 1,225 (79.5%) are enrolled in public schools. The age group of 3 to 4 year olds has the highest likelihood of being enrolled in private schools, with 112 (78.3% in the age bracket) enrolled. Conversely, the age group of 15 to 17 year olds has the lowest likelihood of being enrolled in a private school, with 251 (100.0% in the age bracket) attending a public institution.
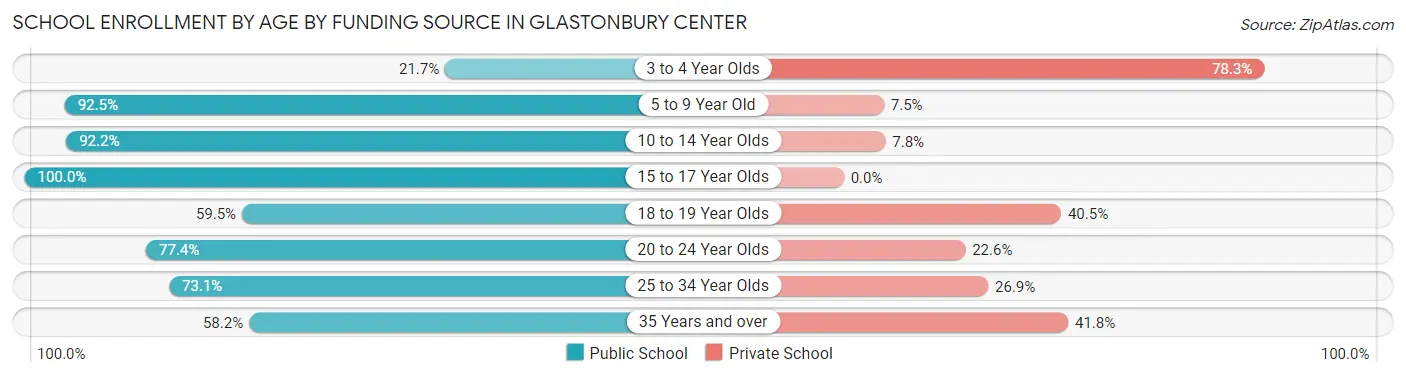
| Age Bracket | Public School | Private School |
| 3 to 4 Year Olds | 31 (21.7%) | 112 (78.3%) |
| 5 to 9 Year Old | 433 (92.5%) | 35 (7.5%) |
| 10 to 14 Year Olds | 202 (92.2%) | 17 (7.8%) |
| 15 to 17 Year Olds | 251 (100.0%) | 0 (0.0%) |
| 18 to 19 Year Olds | 100 (59.5%) | 68 (40.5%) |
| 20 to 24 Year Olds | 82 (77.4%) | 24 (22.6%) |
| 25 to 34 Year Olds | 87 (73.1%) | 32 (26.9%) |
| 35 Years and over | 39 (58.2%) | 28 (41.8%) |
| Total | 1,225 (79.5%) | 316 (20.5%) |
Educational Attainment by Field of Study in Glastonbury Center
Business (985 | 22.3%), science & technology (471 | 10.6%), engineering (450 | 10.2%), social sciences (430 | 9.7%), and education (376 | 8.5%) are the most common fields of study among 4,426 individuals in Glastonbury Center who have obtained a bachelor's degree or higher.
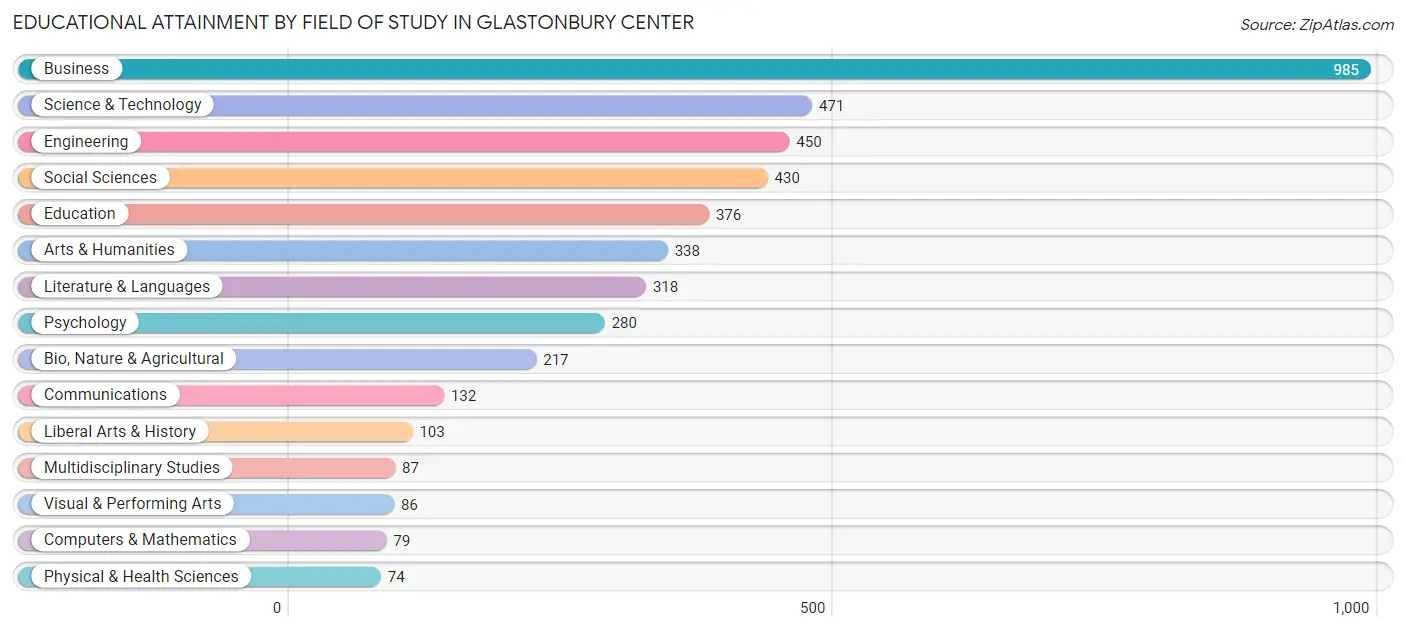
| Field of Study | # Graduates | % Graduates |
| Computers & Mathematics | 79 | 1.8% |
| Bio, Nature & Agricultural | 217 | 4.9% |
| Physical & Health Sciences | 74 | 1.7% |
| Psychology | 280 | 6.3% |
| Social Sciences | 430 | 9.7% |
| Engineering | 450 | 10.2% |
| Multidisciplinary Studies | 87 | 2.0% |
| Science & Technology | 471 | 10.6% |
| Business | 985 | 22.3% |
| Education | 376 | 8.5% |
| Literature & Languages | 318 | 7.2% |
| Liberal Arts & History | 103 | 2.3% |
| Visual & Performing Arts | 86 | 1.9% |
| Communications | 132 | 3.0% |
| Arts & Humanities | 338 | 7.6% |
| Total | 4,426 | 100.0% |
Transportation & Commute in Glastonbury Center
Vehicle Availability by Sex in Glastonbury Center
The most prevalent vehicle ownership categories in Glastonbury Center are males with 2 vehicles (1,045, accounting for 60.0%) and females with 2 vehicles (1,356, making up 45.1%).
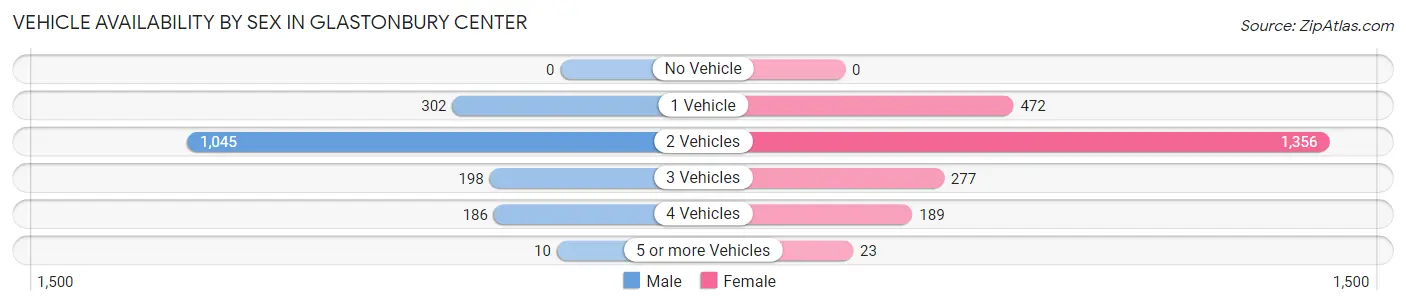
| Vehicles Available | Male | Female |
| No Vehicle | 0 (0.0%) | 0 (0.0%) |
| 1 Vehicle | 302 (17.3%) | 472 (20.4%) |
| 2 Vehicles | 1,045 (60.0%) | 1,356 (58.5%) |
| 3 Vehicles | 198 (11.4%) | 277 (12.0%) |
| 4 Vehicles | 186 (10.7%) | 189 (8.2%) |
| 5 or more Vehicles | 10 (0.6%) | 23 (1.0%) |
| Total | 1,741 (100.0%) | 2,317 (100.0%) |
Commute Time in Glastonbury Center
The most frequently occuring commute durations in Glastonbury Center are 20 to 24 minutes (625 commuters, 18.3%), 5 to 9 minutes (620 commuters, 18.2%), and 15 to 19 minutes (546 commuters, 16.0%).
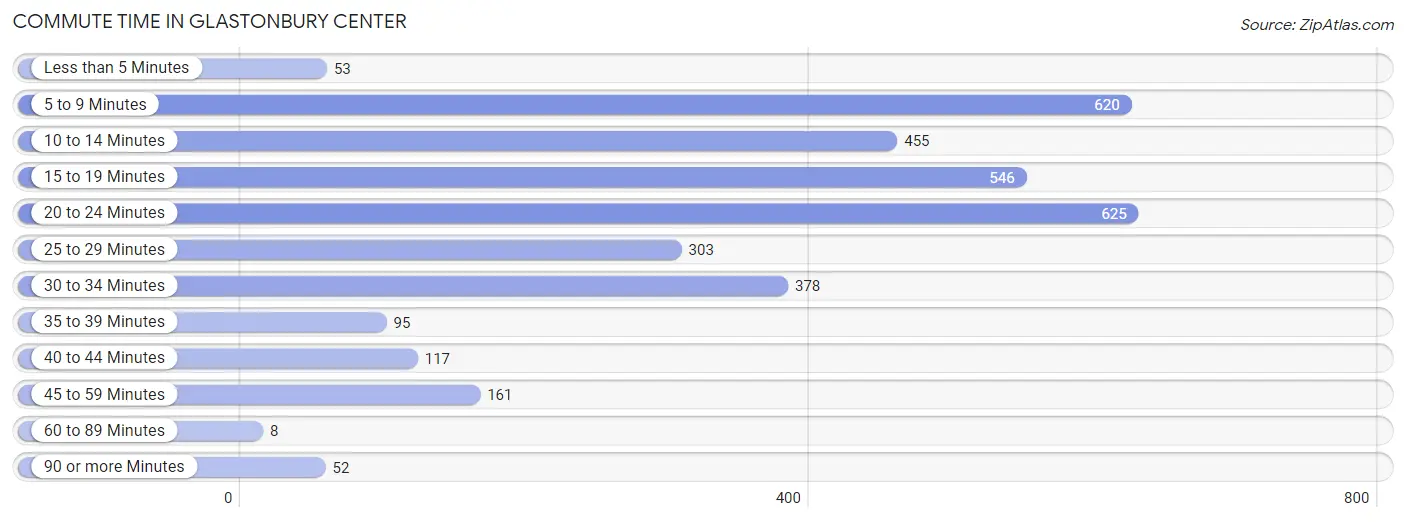
| Commute Time | # Commuters | % Commuters |
| Less than 5 Minutes | 53 | 1.5% |
| 5 to 9 Minutes | 620 | 18.2% |
| 10 to 14 Minutes | 455 | 13.3% |
| 15 to 19 Minutes | 546 | 16.0% |
| 20 to 24 Minutes | 625 | 18.3% |
| 25 to 29 Minutes | 303 | 8.9% |
| 30 to 34 Minutes | 378 | 11.1% |
| 35 to 39 Minutes | 95 | 2.8% |
| 40 to 44 Minutes | 117 | 3.4% |
| 45 to 59 Minutes | 161 | 4.7% |
| 60 to 89 Minutes | 8 | 0.2% |
| 90 or more Minutes | 52 | 1.5% |
Commute Time by Sex in Glastonbury Center
The most common commute times in Glastonbury Center are 20 to 24 minutes (317 commuters, 22.2%) for males and 5 to 9 minutes (474 commuters, 23.9%) for females.
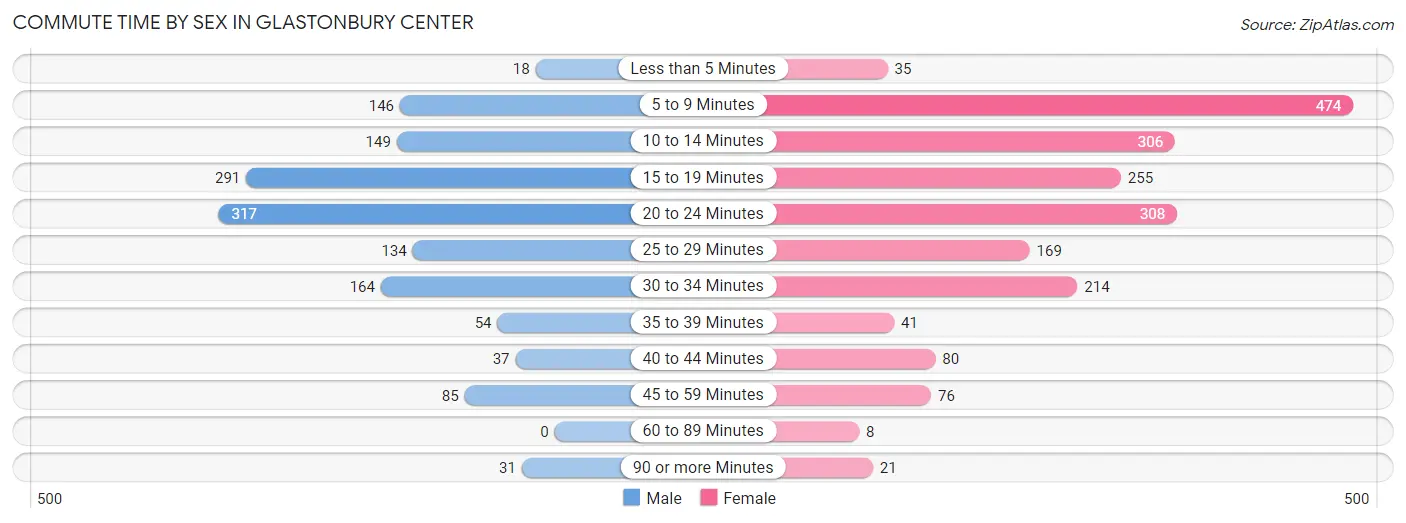
| Commute Time | Male | Female |
| Less than 5 Minutes | 18 (1.3%) | 35 (1.8%) |
| 5 to 9 Minutes | 146 (10.2%) | 474 (23.9%) |
| 10 to 14 Minutes | 149 (10.4%) | 306 (15.4%) |
| 15 to 19 Minutes | 291 (20.4%) | 255 (12.8%) |
| 20 to 24 Minutes | 317 (22.2%) | 308 (15.5%) |
| 25 to 29 Minutes | 134 (9.4%) | 169 (8.5%) |
| 30 to 34 Minutes | 164 (11.5%) | 214 (10.8%) |
| 35 to 39 Minutes | 54 (3.8%) | 41 (2.1%) |
| 40 to 44 Minutes | 37 (2.6%) | 80 (4.0%) |
| 45 to 59 Minutes | 85 (6.0%) | 76 (3.8%) |
| 60 to 89 Minutes | 0 (0.0%) | 8 (0.4%) |
| 90 or more Minutes | 31 (2.2%) | 21 (1.1%) |
Time of Departure to Work by Sex in Glastonbury Center
The most frequent times of departure to work in Glastonbury Center are 6:30 AM to 6:59 AM (376, 26.4%) for males and 8:00 AM to 8:29 AM (582, 29.3%) for females.
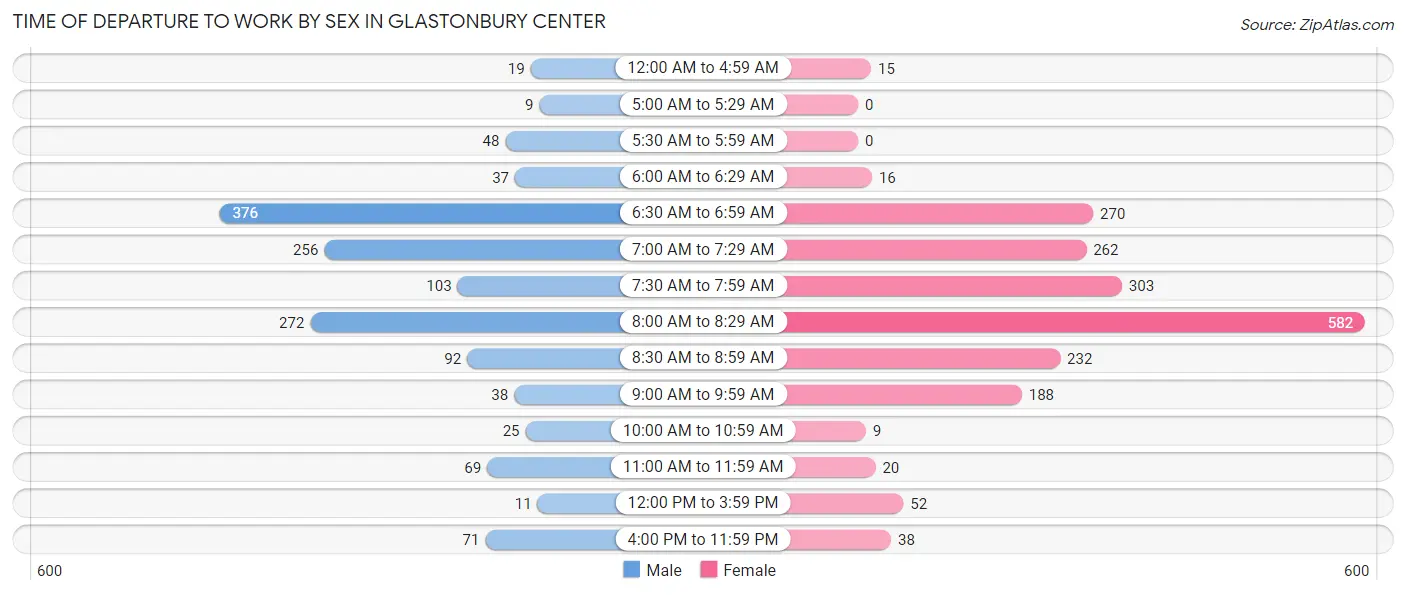
| Time of Departure | Male | Female |
| 12:00 AM to 4:59 AM | 19 (1.3%) | 15 (0.7%) |
| 5:00 AM to 5:29 AM | 9 (0.6%) | 0 (0.0%) |
| 5:30 AM to 5:59 AM | 48 (3.4%) | 0 (0.0%) |
| 6:00 AM to 6:29 AM | 37 (2.6%) | 16 (0.8%) |
| 6:30 AM to 6:59 AM | 376 (26.4%) | 270 (13.6%) |
| 7:00 AM to 7:29 AM | 256 (17.9%) | 262 (13.2%) |
| 7:30 AM to 7:59 AM | 103 (7.2%) | 303 (15.2%) |
| 8:00 AM to 8:29 AM | 272 (19.1%) | 582 (29.3%) |
| 8:30 AM to 8:59 AM | 92 (6.5%) | 232 (11.7%) |
| 9:00 AM to 9:59 AM | 38 (2.7%) | 188 (9.5%) |
| 10:00 AM to 10:59 AM | 25 (1.8%) | 9 (0.4%) |
| 11:00 AM to 11:59 AM | 69 (4.8%) | 20 (1.0%) |
| 12:00 PM to 3:59 PM | 11 (0.8%) | 52 (2.6%) |
| 4:00 PM to 11:59 PM | 71 (5.0%) | 38 (1.9%) |
| Total | 1,426 (100.0%) | 1,987 (100.0%) |
Housing Occupancy in Glastonbury Center
Occupancy by Ownership in Glastonbury Center
Of the total 3,681 dwellings in Glastonbury Center, owner-occupied units account for 2,522 (68.5%), while renter-occupied units make up 1,159 (31.5%).
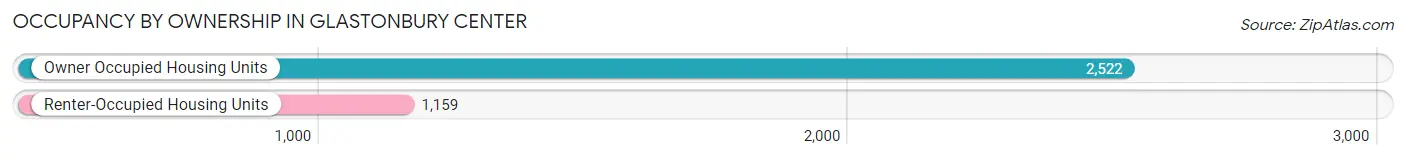
| Occupancy | # Housing Units | % Housing Units |
| Owner Occupied Housing Units | 2,522 | 68.5% |
| Renter-Occupied Housing Units | 1,159 | 31.5% |
| Total Occupied Housing Units | 3,681 | 100.0% |
Occupancy by Household Size in Glastonbury Center
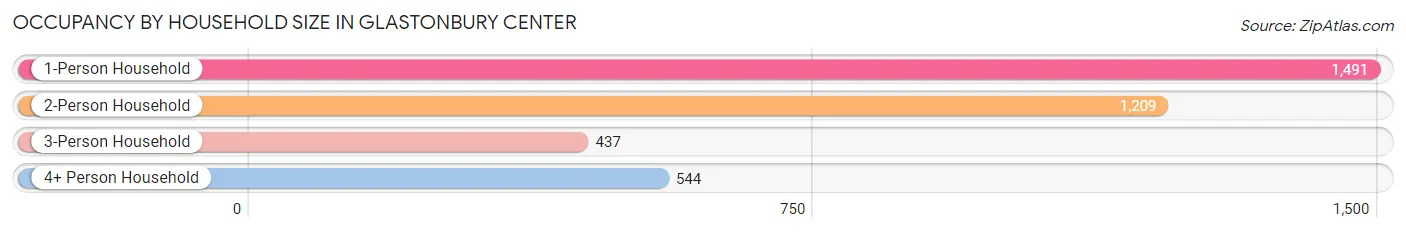
| Household Size | # Housing Units | % Housing Units |
| 1-Person Household | 1,491 | 40.5% |
| 2-Person Household | 1,209 | 32.8% |
| 3-Person Household | 437 | 11.9% |
| 4+ Person Household | 544 | 14.8% |
| Total Housing Units | 3,681 | 100.0% |
Occupancy by Ownership by Household Size in Glastonbury Center
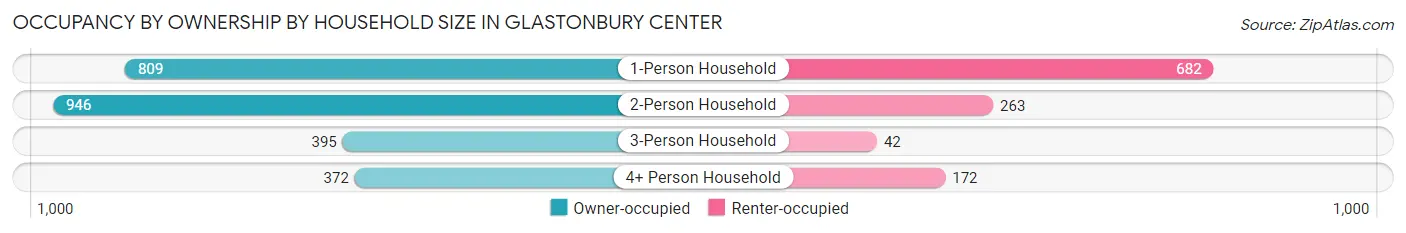
| Household Size | Owner-occupied | Renter-occupied |
| 1-Person Household | 809 (54.3%) | 682 (45.7%) |
| 2-Person Household | 946 (78.2%) | 263 (21.7%) |
| 3-Person Household | 395 (90.4%) | 42 (9.6%) |
| 4+ Person Household | 372 (68.4%) | 172 (31.6%) |
| Total Housing Units | 2,522 (68.5%) | 1,159 (31.5%) |
Occupancy by Educational Attainment in Glastonbury Center
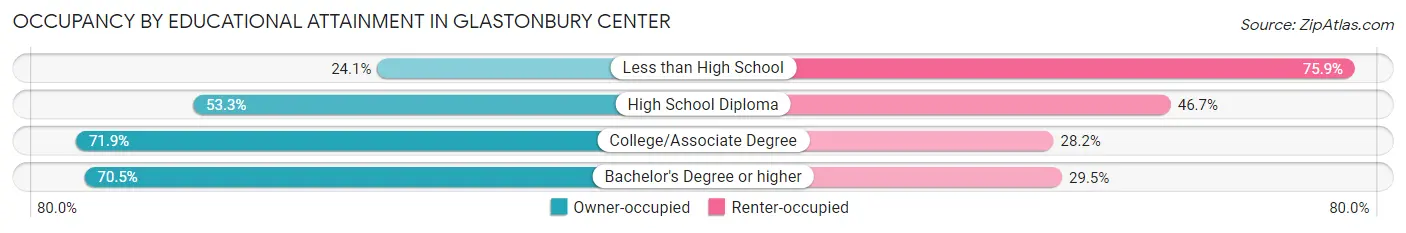
| Household Size | Owner-occupied | Renter-occupied |
| Less than High School | 13 (24.1%) | 41 (75.9%) |
| High School Diploma | 179 (53.3%) | 157 (46.7%) |
| College/Associate Degree | 513 (71.9%) | 201 (28.1%) |
| Bachelor's Degree or higher | 1,817 (70.5%) | 760 (29.5%) |
Occupancy by Age of Householder in Glastonbury Center
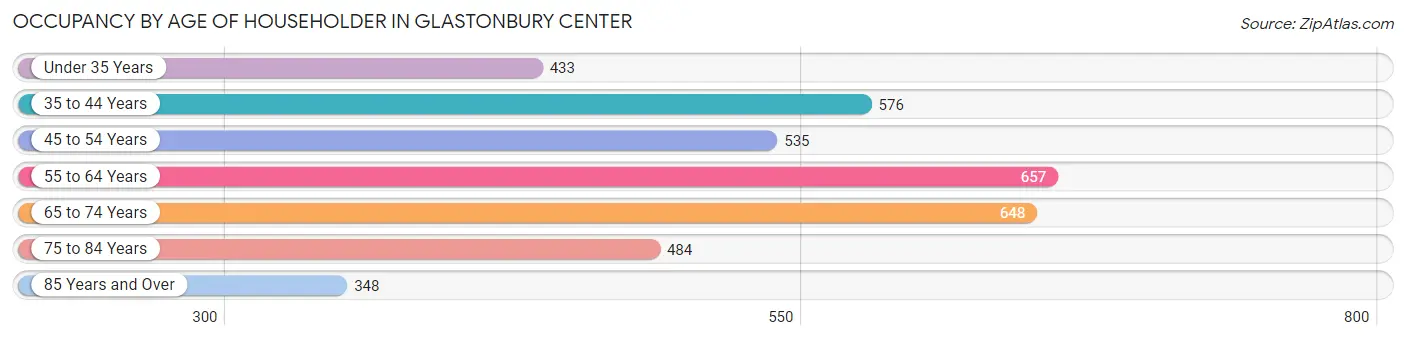
| Age Bracket | # Households | % Households |
| Under 35 Years | 433 | 11.8% |
| 35 to 44 Years | 576 | 15.7% |
| 45 to 54 Years | 535 | 14.5% |
| 55 to 64 Years | 657 | 17.8% |
| 65 to 74 Years | 648 | 17.6% |
| 75 to 84 Years | 484 | 13.2% |
| 85 Years and Over | 348 | 9.5% |
| Total | 3,681 | 100.0% |
Housing Finances in Glastonbury Center
Median Income by Occupancy in Glastonbury Center
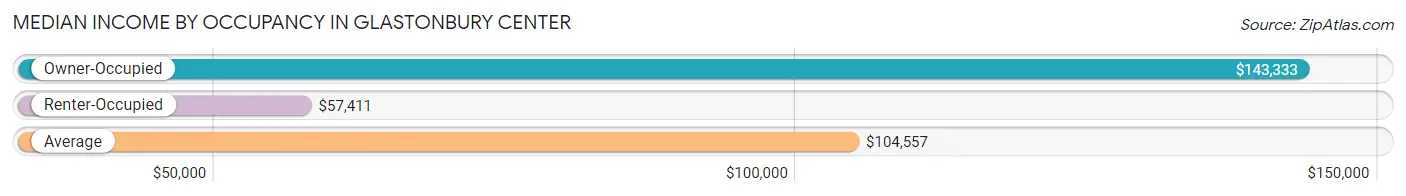
| Occupancy Type | # Households | Median Income |
| Owner-Occupied | 2,522 (68.5%) | $143,333 |
| Renter-Occupied | 1,159 (31.5%) | $57,411 |
| Average | 3,681 (100.0%) | $104,557 |
Occupancy by Householder Income Bracket in Glastonbury Center
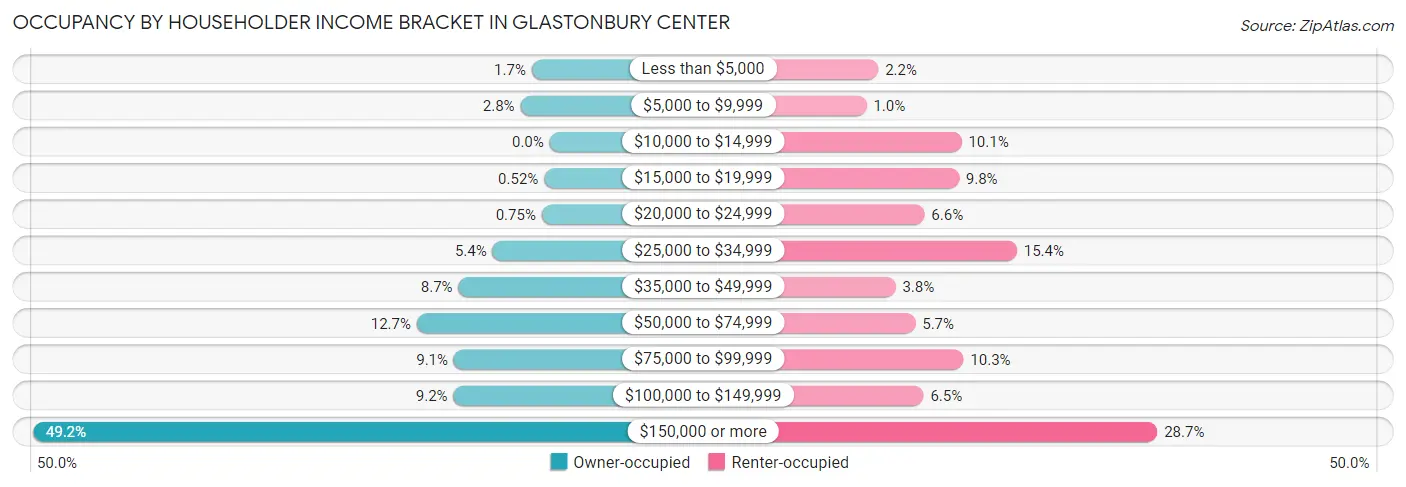
| Income Bracket | Owner-occupied | Renter-occupied |
| Less than $5,000 | 43 (1.7%) | 25 (2.2%) |
| $5,000 to $9,999 | 70 (2.8%) | 12 (1.0%) |
| $10,000 to $14,999 | 0 (0.0%) | 117 (10.1%) |
| $15,000 to $19,999 | 13 (0.5%) | 114 (9.8%) |
| $20,000 to $24,999 | 19 (0.7%) | 76 (6.6%) |
| $25,000 to $34,999 | 137 (5.4%) | 178 (15.4%) |
| $35,000 to $49,999 | 219 (8.7%) | 44 (3.8%) |
| $50,000 to $74,999 | 319 (12.7%) | 66 (5.7%) |
| $75,000 to $99,999 | 230 (9.1%) | 119 (10.3%) |
| $100,000 to $149,999 | 231 (9.2%) | 75 (6.5%) |
| $150,000 or more | 1,241 (49.2%) | 333 (28.7%) |
| Total | 2,522 (100.0%) | 1,159 (100.0%) |
Monthly Housing Cost Tiers in Glastonbury Center
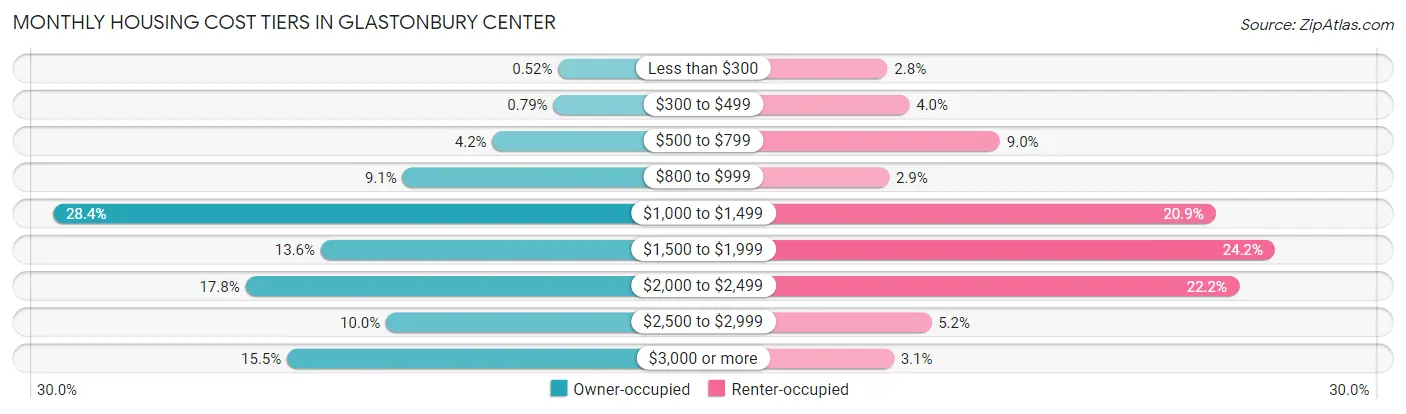
| Monthly Cost | Owner-occupied | Renter-occupied |
| Less than $300 | 13 (0.5%) | 32 (2.8%) |
| $300 to $499 | 20 (0.8%) | 46 (4.0%) |
| $500 to $799 | 105 (4.2%) | 104 (9.0%) |
| $800 to $999 | 230 (9.1%) | 33 (2.9%) |
| $1,000 to $1,499 | 717 (28.4%) | 242 (20.9%) |
| $1,500 to $1,999 | 344 (13.6%) | 280 (24.2%) |
| $2,000 to $2,499 | 449 (17.8%) | 257 (22.2%) |
| $2,500 to $2,999 | 253 (10.0%) | 60 (5.2%) |
| $3,000 or more | 391 (15.5%) | 36 (3.1%) |
| Total | 2,522 (100.0%) | 1,159 (100.0%) |
Physical Housing Characteristics in Glastonbury Center
Housing Structures in Glastonbury Center
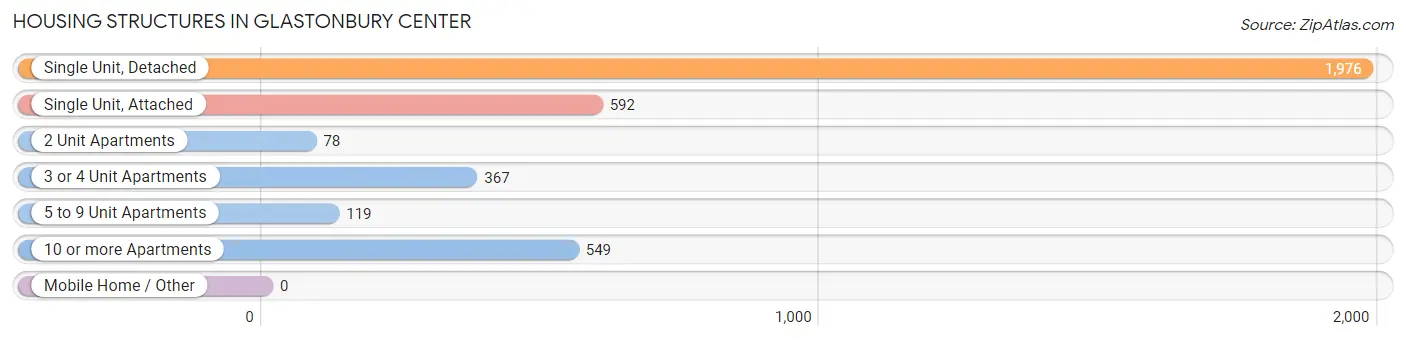
| Structure Type | # Housing Units | % Housing Units |
| Single Unit, Detached | 1,976 | 53.7% |
| Single Unit, Attached | 592 | 16.1% |
| 2 Unit Apartments | 78 | 2.1% |
| 3 or 4 Unit Apartments | 367 | 10.0% |
| 5 to 9 Unit Apartments | 119 | 3.2% |
| 10 or more Apartments | 549 | 14.9% |
| Mobile Home / Other | 0 | 0.0% |
| Total | 3,681 | 100.0% |
Housing Structures by Occupancy in Glastonbury Center
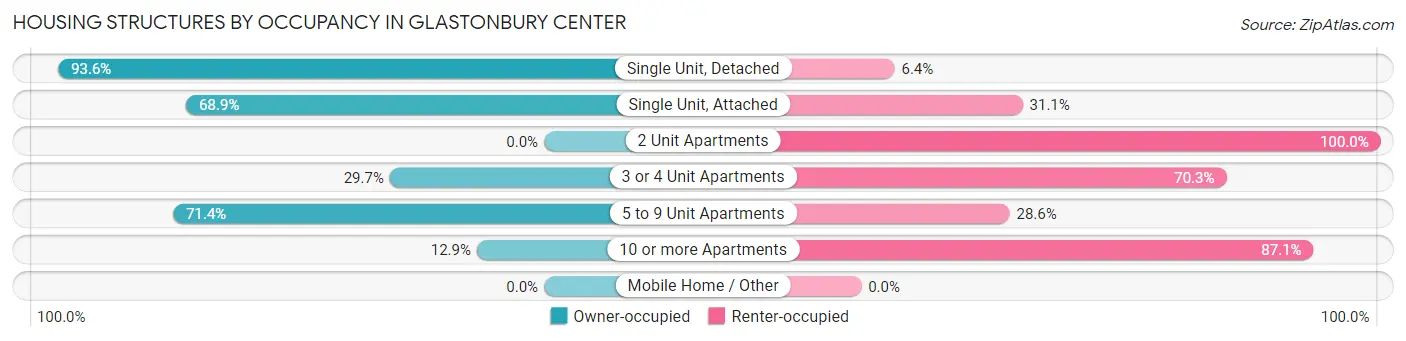
| Structure Type | Owner-occupied | Renter-occupied |
| Single Unit, Detached | 1,849 (93.6%) | 127 (6.4%) |
| Single Unit, Attached | 408 (68.9%) | 184 (31.1%) |
| 2 Unit Apartments | 0 (0.0%) | 78 (100.0%) |
| 3 or 4 Unit Apartments | 109 (29.7%) | 258 (70.3%) |
| 5 to 9 Unit Apartments | 85 (71.4%) | 34 (28.6%) |
| 10 or more Apartments | 71 (12.9%) | 478 (87.1%) |
| Mobile Home / Other | 0 (0.0%) | 0 (0.0%) |
| Total | 2,522 (68.5%) | 1,159 (31.5%) |
Housing Structures by Number of Rooms in Glastonbury Center
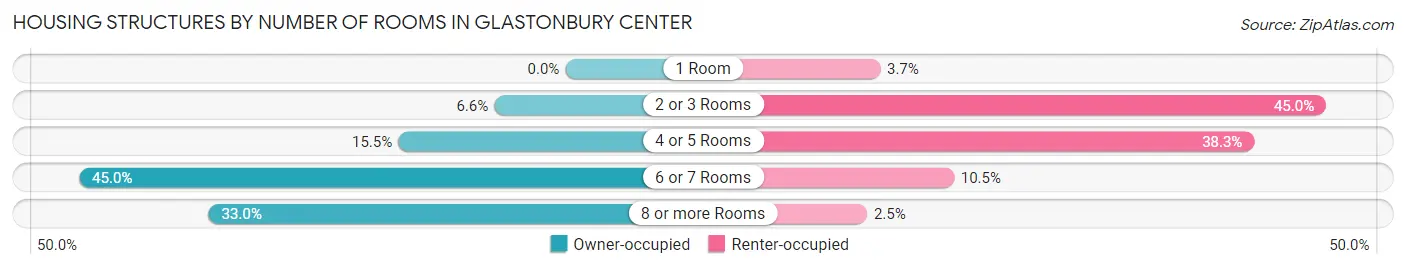
| Number of Rooms | Owner-occupied | Renter-occupied |
| 1 Room | 0 (0.0%) | 43 (3.7%) |
| 2 or 3 Rooms | 166 (6.6%) | 521 (45.0%) |
| 4 or 5 Rooms | 390 (15.5%) | 444 (38.3%) |
| 6 or 7 Rooms | 1,134 (45.0%) | 122 (10.5%) |
| 8 or more Rooms | 832 (33.0%) | 29 (2.5%) |
| Total | 2,522 (100.0%) | 1,159 (100.0%) |
Housing Structure by Heating Type in Glastonbury Center
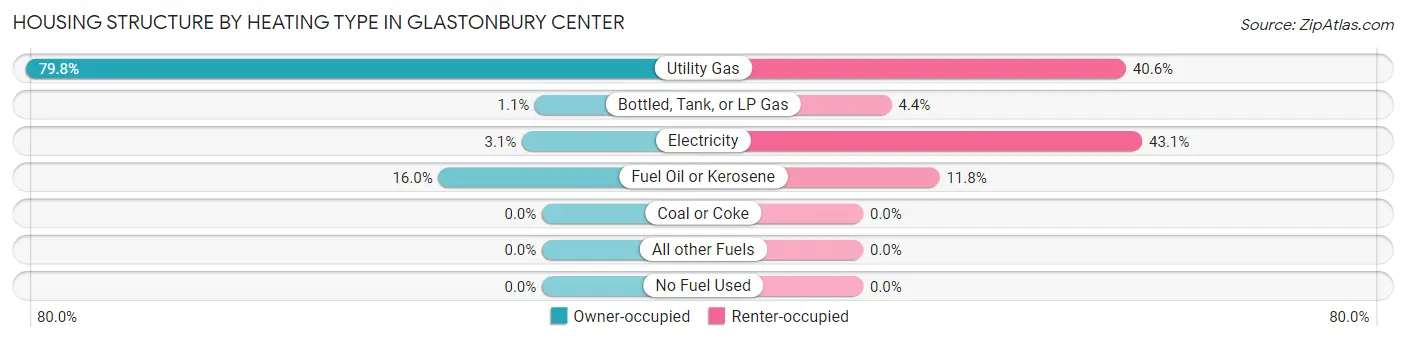
| Heating Type | Owner-occupied | Renter-occupied |
| Utility Gas | 2,013 (79.8%) | 471 (40.6%) |
| Bottled, Tank, or LP Gas | 27 (1.1%) | 51 (4.4%) |
| Electricity | 78 (3.1%) | 500 (43.1%) |
| Fuel Oil or Kerosene | 404 (16.0%) | 137 (11.8%) |
| Coal or Coke | 0 (0.0%) | 0 (0.0%) |
| All other Fuels | 0 (0.0%) | 0 (0.0%) |
| No Fuel Used | 0 (0.0%) | 0 (0.0%) |
| Total | 2,522 (100.0%) | 1,159 (100.0%) |
Household Vehicle Usage in Glastonbury Center
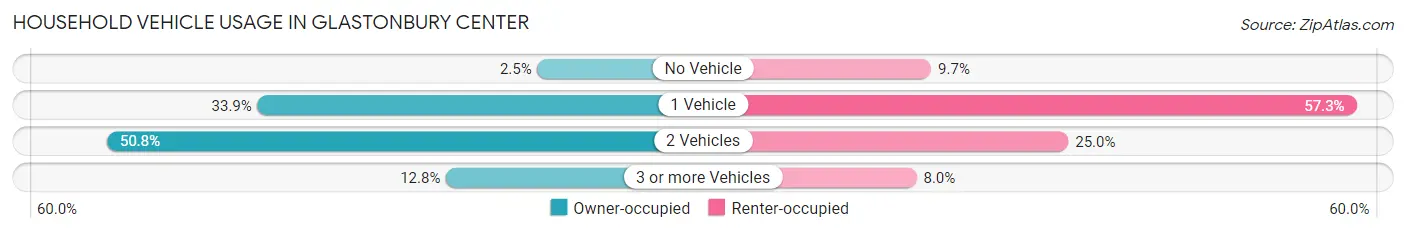
| Vehicles per Household | Owner-occupied | Renter-occupied |
| No Vehicle | 64 (2.5%) | 112 (9.7%) |
| 1 Vehicle | 855 (33.9%) | 664 (57.3%) |
| 2 Vehicles | 1,281 (50.8%) | 290 (25.0%) |
| 3 or more Vehicles | 322 (12.8%) | 93 (8.0%) |
| Total | 2,522 (100.0%) | 1,159 (100.0%) |
Real Estate & Mortgages in Glastonbury Center
Real Estate and Mortgage Overview in Glastonbury Center
| Characteristic | Without Mortgage | With Mortgage |
| Housing Units | 1,053 | 1,469 |
| Median Property Value | $350,200 | $366,800 |
| Median Household Income | $102,630 | $838 |
| Monthly Housing Costs | $1,109 | $376 |
| Real Estate Taxes | $7,450 | $0 |
Property Value by Mortgage Status in Glastonbury Center
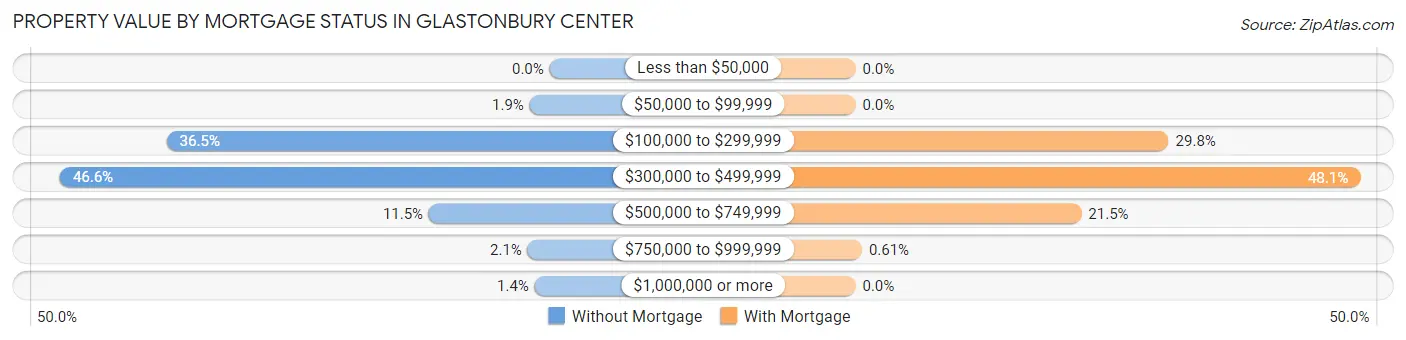
| Property Value | Without Mortgage | With Mortgage |
| Less than $50,000 | 0 (0.0%) | 0 (0.0%) |
| $50,000 to $99,999 | 20 (1.9%) | 0 (0.0%) |
| $100,000 to $299,999 | 384 (36.5%) | 438 (29.8%) |
| $300,000 to $499,999 | 491 (46.6%) | 706 (48.1%) |
| $500,000 to $749,999 | 121 (11.5%) | 316 (21.5%) |
| $750,000 to $999,999 | 22 (2.1%) | 9 (0.6%) |
| $1,000,000 or more | 15 (1.4%) | 0 (0.0%) |
| Total | 1,053 (100.0%) | 1,469 (100.0%) |
Household Income by Mortgage Status in Glastonbury Center
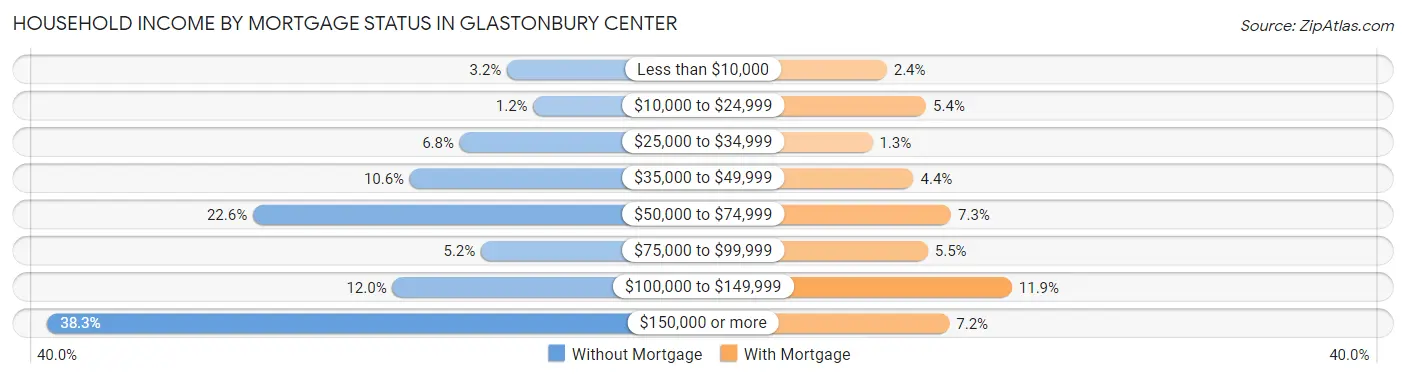
| Household Income | Without Mortgage | With Mortgage |
| Less than $10,000 | 34 (3.2%) | 35 (2.4%) |
| $10,000 to $24,999 | 13 (1.2%) | 79 (5.4%) |
| $25,000 to $34,999 | 72 (6.8%) | 19 (1.3%) |
| $35,000 to $49,999 | 112 (10.6%) | 65 (4.4%) |
| $50,000 to $74,999 | 238 (22.6%) | 107 (7.3%) |
| $75,000 to $99,999 | 55 (5.2%) | 81 (5.5%) |
| $100,000 to $149,999 | 126 (12.0%) | 175 (11.9%) |
| $150,000 or more | 403 (38.3%) | 105 (7.1%) |
| Total | 1,053 (100.0%) | 1,469 (100.0%) |
Property Value to Household Income Ratio in Glastonbury Center
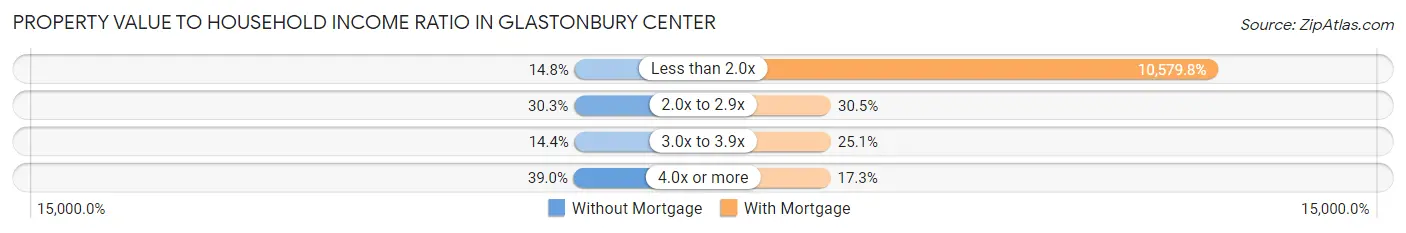
| Value-to-Income Ratio | Without Mortgage | With Mortgage |
| Less than 2.0x | 156 (14.8%) | 155,417 (10,579.8%) |
| 2.0x to 2.9x | 319 (30.3%) | 448 (30.5%) |
| 3.0x to 3.9x | 152 (14.4%) | 369 (25.1%) |
| 4.0x or more | 411 (39.0%) | 254 (17.3%) |
| Total | 1,053 (100.0%) | 1,469 (100.0%) |
Real Estate Taxes by Mortgage Status in Glastonbury Center
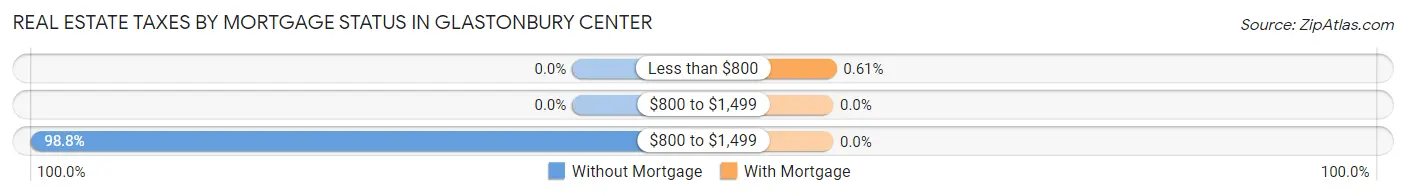
| Property Taxes | Without Mortgage | With Mortgage |
| Less than $800 | 0 (0.0%) | 9 (0.6%) |
| $800 to $1,499 | 0 (0.0%) | 0 (0.0%) |
| $800 to $1,499 | 1,040 (98.8%) | 0 (0.0%) |
| Total | 1,053 (100.0%) | 1,469 (100.0%) |
Health & Disability in Glastonbury Center
Health Insurance Coverage by Age in Glastonbury Center
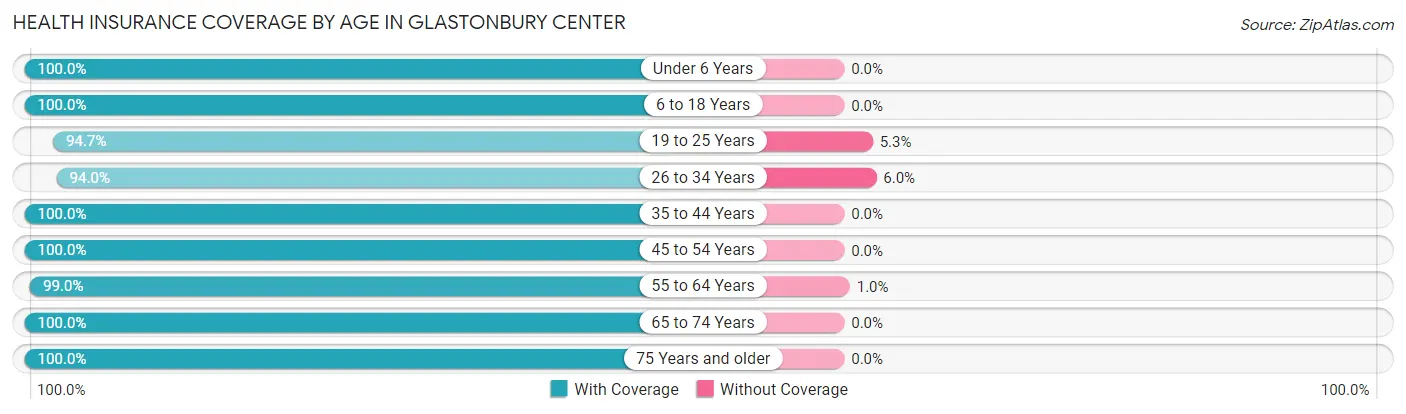
| Age Bracket | With Coverage | Without Coverage |
| Under 6 Years | 444 (100.0%) | 0 (0.0%) |
| 6 to 18 Years | 961 (100.0%) | 0 (0.0%) |
| 19 to 25 Years | 626 (94.7%) | 35 (5.3%) |
| 26 to 34 Years | 597 (94.0%) | 38 (6.0%) |
| 35 to 44 Years | 1,047 (100.0%) | 0 (0.0%) |
| 45 to 54 Years | 882 (100.0%) | 0 (0.0%) |
| 55 to 64 Years | 1,063 (99.0%) | 11 (1.0%) |
| 65 to 74 Years | 949 (100.0%) | 0 (0.0%) |
| 75 Years and older | 1,150 (100.0%) | 0 (0.0%) |
| Total | 7,719 (98.9%) | 84 (1.1%) |
Health Insurance Coverage by Citizenship Status in Glastonbury Center
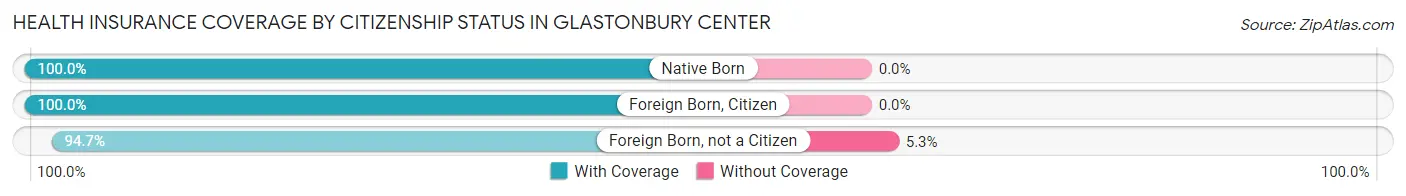
| Citizenship Status | With Coverage | Without Coverage |
| Native Born | 444 (100.0%) | 0 (0.0%) |
| Foreign Born, Citizen | 961 (100.0%) | 0 (0.0%) |
| Foreign Born, not a Citizen | 626 (94.7%) | 35 (5.3%) |
Health Insurance Coverage by Household Income in Glastonbury Center
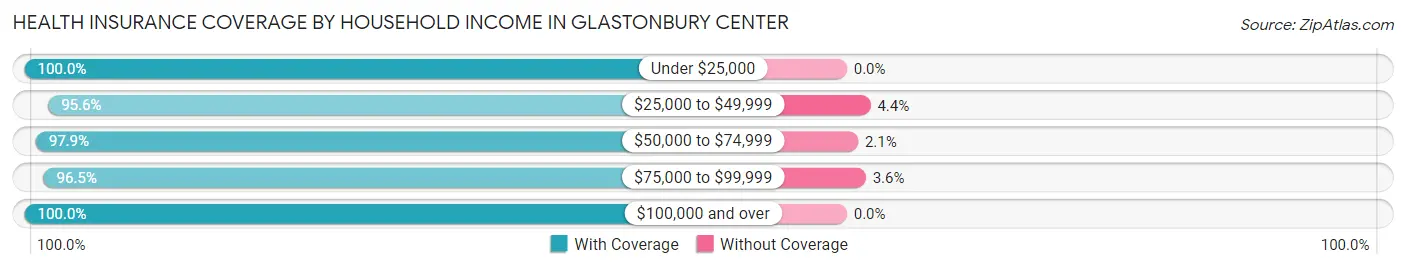
| Household Income | With Coverage | Without Coverage |
| Under $25,000 | 590 (100.0%) | 0 (0.0%) |
| $25,000 to $49,999 | 798 (95.6%) | 37 (4.4%) |
| $50,000 to $74,999 | 512 (97.9%) | 11 (2.1%) |
| $75,000 to $99,999 | 950 (96.5%) | 35 (3.5%) |
| $100,000 and over | 4,804 (100.0%) | 0 (0.0%) |
Public vs Private Health Insurance Coverage by Age in Glastonbury Center
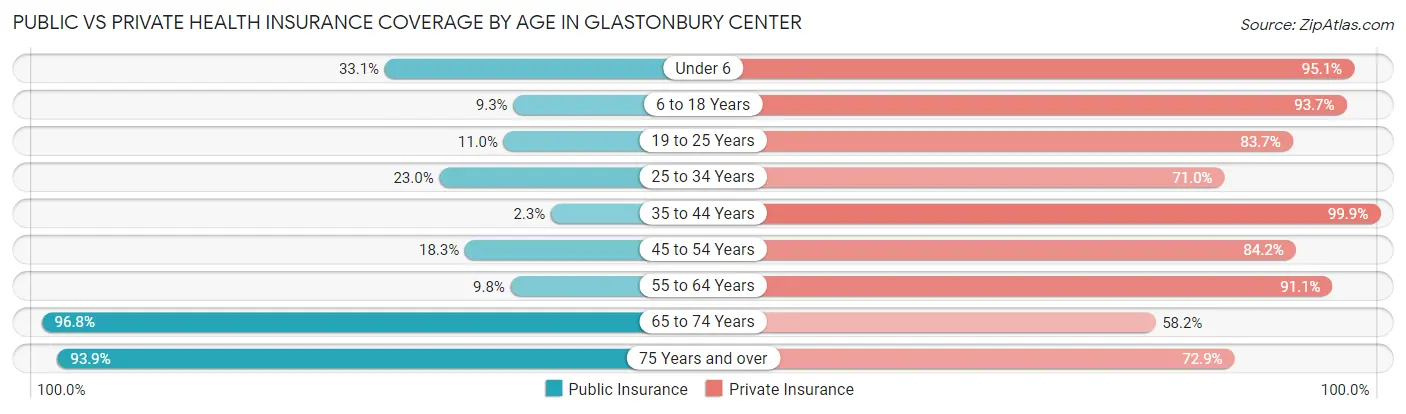
| Age Bracket | Public Insurance | Private Insurance |
| Under 6 | 147 (33.1%) | 422 (95.1%) |
| 6 to 18 Years | 89 (9.3%) | 900 (93.6%) |
| 19 to 25 Years | 73 (11.0%) | 553 (83.7%) |
| 25 to 34 Years | 146 (23.0%) | 451 (71.0%) |
| 35 to 44 Years | 24 (2.3%) | 1,046 (99.9%) |
| 45 to 54 Years | 161 (18.2%) | 743 (84.2%) |
| 55 to 64 Years | 105 (9.8%) | 978 (91.1%) |
| 65 to 74 Years | 919 (96.8%) | 552 (58.2%) |
| 75 Years and over | 1,080 (93.9%) | 838 (72.9%) |
| Total | 2,744 (35.2%) | 6,483 (83.1%) |
Disability Status by Sex by Age in Glastonbury Center
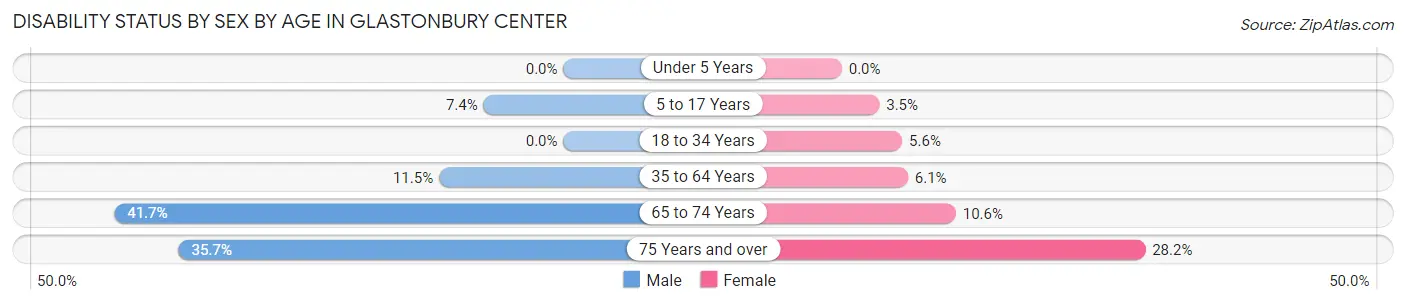
| Age Bracket | Male | Female |
| Under 5 Years | 0 (0.0%) | 0 (0.0%) |
| 5 to 17 Years | 36 (7.4%) | 17 (3.5%) |
| 18 to 34 Years | 0 (0.0%) | 49 (5.6%) |
| 35 to 64 Years | 166 (11.5%) | 96 (6.1%) |
| 65 to 74 Years | 100 (41.7%) | 75 (10.6%) |
| 75 Years and over | 185 (35.7%) | 178 (28.2%) |
Disability Class by Sex by Age in Glastonbury Center
Disability Class: Hearing Difficulty
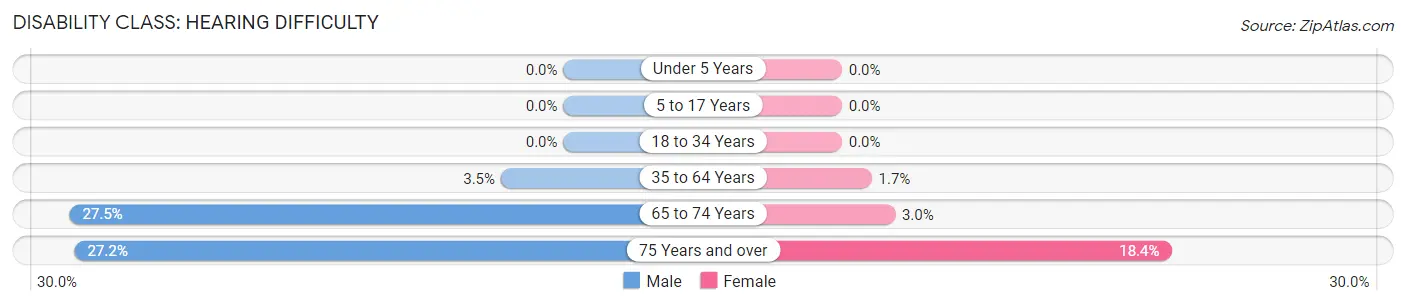
| Age Bracket | Male | Female |
| Under 5 Years | 0 (0.0%) | 0 (0.0%) |
| 5 to 17 Years | 0 (0.0%) | 0 (0.0%) |
| 18 to 34 Years | 0 (0.0%) | 0 (0.0%) |
| 35 to 64 Years | 50 (3.5%) | 26 (1.7%) |
| 65 to 74 Years | 66 (27.5%) | 21 (3.0%) |
| 75 Years and over | 141 (27.2%) | 116 (18.3%) |
Disability Class: Vision Difficulty
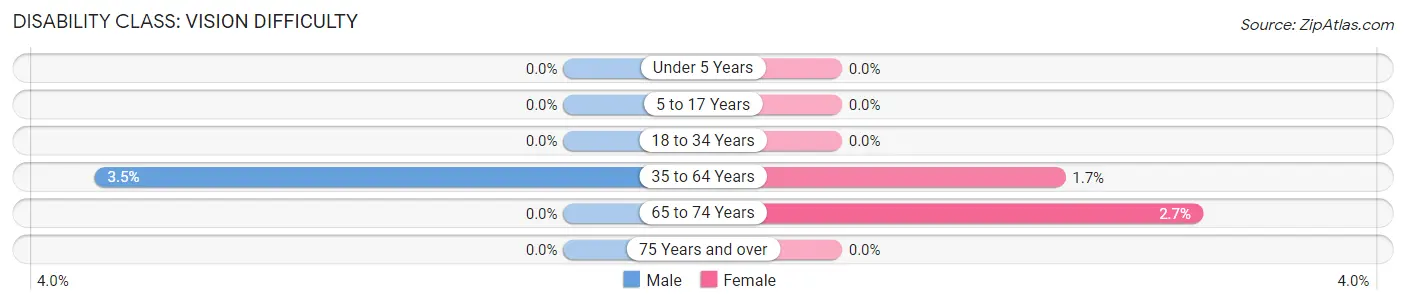
| Age Bracket | Male | Female |
| Under 5 Years | 0 (0.0%) | 0 (0.0%) |
| 5 to 17 Years | 0 (0.0%) | 0 (0.0%) |
| 18 to 34 Years | 0 (0.0%) | 0 (0.0%) |
| 35 to 64 Years | 50 (3.5%) | 26 (1.7%) |
| 65 to 74 Years | 0 (0.0%) | 19 (2.7%) |
| 75 Years and over | 0 (0.0%) | 0 (0.0%) |
Disability Class: Cognitive Difficulty
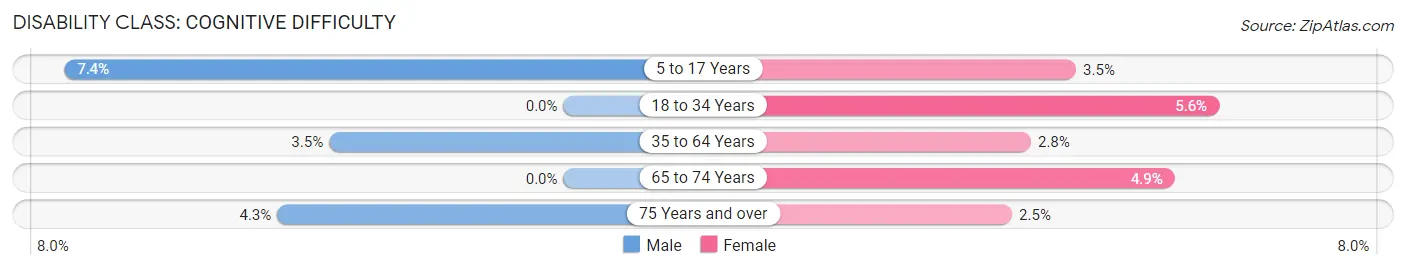
| Age Bracket | Male | Female |
| 5 to 17 Years | 36 (7.4%) | 17 (3.5%) |
| 18 to 34 Years | 0 (0.0%) | 49 (5.6%) |
| 35 to 64 Years | 50 (3.5%) | 44 (2.8%) |
| 65 to 74 Years | 0 (0.0%) | 35 (4.9%) |
| 75 Years and over | 22 (4.3%) | 16 (2.5%) |
Disability Class: Ambulatory Difficulty
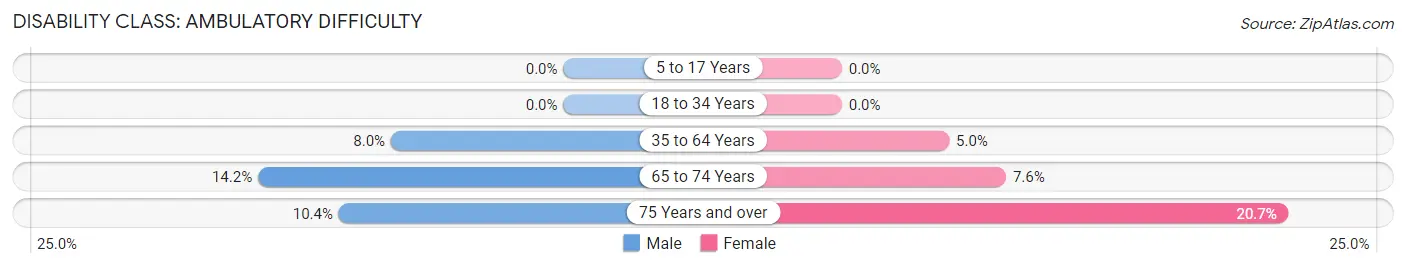
| Age Bracket | Male | Female |
| 5 to 17 Years | 0 (0.0%) | 0 (0.0%) |
| 18 to 34 Years | 0 (0.0%) | 0 (0.0%) |
| 35 to 64 Years | 115 (8.0%) | 78 (5.0%) |
| 65 to 74 Years | 34 (14.2%) | 54 (7.6%) |
| 75 Years and over | 54 (10.4%) | 131 (20.7%) |
Disability Class: Self-Care Difficulty
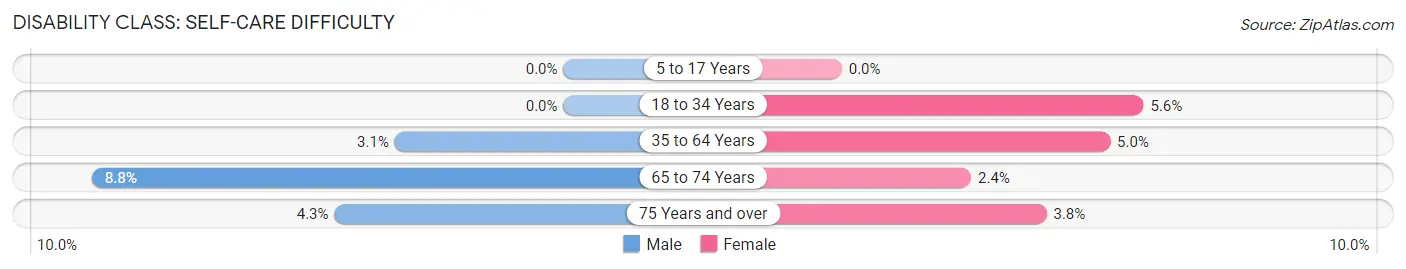
| Age Bracket | Male | Female |
| 5 to 17 Years | 0 (0.0%) | 0 (0.0%) |
| 18 to 34 Years | 0 (0.0%) | 49 (5.6%) |
| 35 to 64 Years | 45 (3.1%) | 78 (5.0%) |
| 65 to 74 Years | 21 (8.7%) | 17 (2.4%) |
| 75 Years and over | 22 (4.3%) | 24 (3.8%) |
Technology Access in Glastonbury Center
Computing Device Access in Glastonbury Center
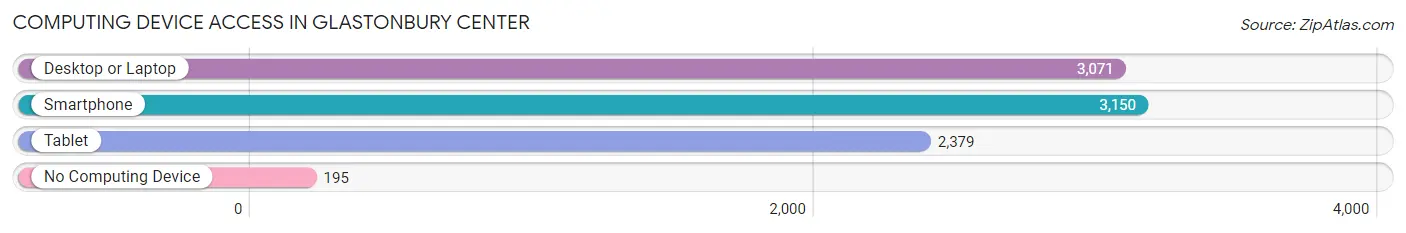
| Device Type | # Households | % Households |
| Desktop or Laptop | 3,071 | 83.4% |
| Smartphone | 3,150 | 85.6% |
| Tablet | 2,379 | 64.6% |
| No Computing Device | 195 | 5.3% |
| Total | 3,681 | 100.0% |
Internet Access in Glastonbury Center
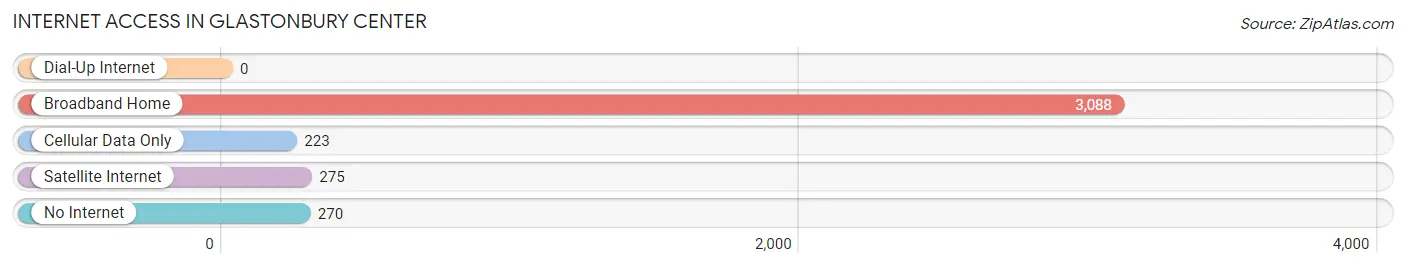
| Internet Type | # Households | % Households |
| Dial-Up Internet | 0 | 0.0% |
| Broadband Home | 3,088 | 83.9% |
| Cellular Data Only | 223 | 6.1% |
| Satellite Internet | 275 | 7.5% |
| No Internet | 270 | 7.3% |
| Total | 3,681 | 100.0% |
Glastonbury Center Summary
Glastonbury Center is a census-designated place (CDP) located in the town of Glastonbury in Hartford County, Connecticut. It is located in the southeastern part of the state, about 8 miles south of Hartford. The population of Glastonbury Center was 4,845 at the 2010 census.
Geography
Glastonbury Center is located at 41°41'25" North, 72°37'17" West (41.690278, -72.621389). According to the United States Census Bureau, the CDP has a total area of 4.2 square miles, all of it land.
Glastonbury Center is bordered by the towns of East Hartford to the north, Manchester to the east, South Glastonbury to the south, and Glastonbury to the west. The CDP is located in the Connecticut River Valley, and is bisected by the Connecticut River. The CDP is located in the Glastonbury Hills, a range of low hills that run through the town of Glastonbury.
Demographics
As of the census of 2000, there were 4,845 people, 1,845 households, and 1,346 families residing in the CDP. The population density was 1,154.3 people per square mile (446.7/km^2). There were 1,902 housing units at an average density of 451.2 per square mile (174.2/km^2). The racial makeup of the CDP was 95.45% White, 0.90% African American, 0.17% Native American, 1.90% Asian, 0.02% Pacific Islander, 0.45% from other races, and 1.11% from two or more races. Hispanic or Latino of any race were 1.90% of the population.
There were 1,845 households, out of which 33.2% had children under the age of 18 living with them, 58.2% were married couples living together, 8.7% had a female householder with no husband present, and 29.7% were non-families. 24.2% of all households were made up of individuals, and 8.2% had someone living alone who was 65 years of age or older. The average household size was 2.62 and the average family size was 3.14.
In the CDP, the population was spread out, with 25.2% under the age of 18, 5.2% from 18 to 24, 32.2% from 25 to 44, 24.2% from 45 to 64, and 13.2% who were 65 years of age or older. The median age was 38 years. For every 100 females, there were 93.2 males. For every 100 females age 18 and over, there were 90.2 males.
The median income for a household in the CDP was $68,958, and the median income for a family was $77,917. Males had a median income of $51,932 versus $37,917 for females. The per capita income for the CDP was $30,945. About 1.2% of families and 2.2% of the population were below the poverty line, including 1.7% of those under age 18 and 4.2% of those age 65 or over.
Economy
Glastonbury Center is home to a variety of businesses, including retail stores, restaurants, and professional services. The town is also home to several large employers, including Pratt & Whitney, a division of United Technologies, and the Connecticut Department of Transportation.
The town is also home to several small businesses, including a variety of restaurants, retail stores, and professional services. The town is also home to several small manufacturing companies, including a plastics manufacturer and a metal fabrication company.
The town is also home to several small farms, including a dairy farm, a vegetable farm, and a Christmas tree farm.
Conclusion
Glastonbury Center is a census-designated place located in the town of Glastonbury in Hartford County, Connecticut. It is located in the southeastern part of the state, about 8 miles south of Hartford. The population of Glastonbury Center was 4,845 at the 2010 census. The CDP is located in the Connecticut River Valley, and is bisected by the Connecticut River. The CDP is located in the Glastonbury Hills, a range of low hills that run through the town of Glastonbury.
The population of Glastonbury Center is predominantly white, with a small percentage of African American, Native American, Asian, and Hispanic or Latino residents. The median income for a household in the CDP was $68,958, and the median income for a family was $77,917.
Glastonbury Center is home to a variety of businesses, including retail stores, restaurants, and professional services. The town is also home to several large employers, including Pratt & Whitney, a division of United Technologies, and the Connecticut Department of Transportation. The town is also home to several small businesses, including a variety of restaurants, retail stores, and professional services. The town is also home to several small manufacturing companies, including a plastics manufacturer and a metal fabrication company. The town is also home to several small farms, including a dairy farm, a vegetable farm, and a Christmas tree farm.
Common Questions
What is Per Capita Income in Glastonbury Center?
Per Capita income in Glastonbury Center is $65,413.
What is the Median Family Income in Glastonbury Center?
Median Family Income in Glastonbury Center is $161,378.
What is the Median Household income in Glastonbury Center?
Median Household Income in Glastonbury Center is $104,557.
What is Income or Wage Gap in Glastonbury Center?
Income or Wage Gap in Glastonbury Center is 31.8%.
Women in Glastonbury Center earn 68.2 cents for every dollar earned by a man.
What is Inequality or Gini Index in Glastonbury Center?
Inequality or Gini Index in Glastonbury Center is 0.46.
What is the Total Population of Glastonbury Center?
Total Population of Glastonbury Center is 7,959.
What is the Total Male Population of Glastonbury Center?
Total Male Population of Glastonbury Center is 3,430.
What is the Total Female Population of Glastonbury Center?
Total Female Population of Glastonbury Center is 4,529.
What is the Ratio of Males per 100 Females in Glastonbury Center?
There are 75.73 Males per 100 Females in Glastonbury Center.
What is the Ratio of Females per 100 Males in Glastonbury Center?
There are 132.04 Females per 100 Males in Glastonbury Center.
What is the Median Population Age in Glastonbury Center?
Median Population Age in Glastonbury Center is 48.6 Years.
What is the Average Family Size in Glastonbury Center
Average Family Size in Glastonbury Center is 2.9 People.
What is the Average Household Size in Glastonbury Center
Average Household Size in Glastonbury Center is 2.1 People.
How Large is the Labor Force in Glastonbury Center?
There are 4,168 People in the Labor Forcein in Glastonbury Center.
What is the Percentage of People in the Labor Force in Glastonbury Center?
61.5% of People are in the Labor Force in Glastonbury Center.
What is the Unemployment Rate in Glastonbury Center?
Unemployment Rate in Glastonbury Center is 2.7%.