Cities with the Highest Percentage of Scotch-Irish Population in Connecticut
RELATED REPORTS & OPTIONS
Scotch-Irish
Connecticut
Compare Cities
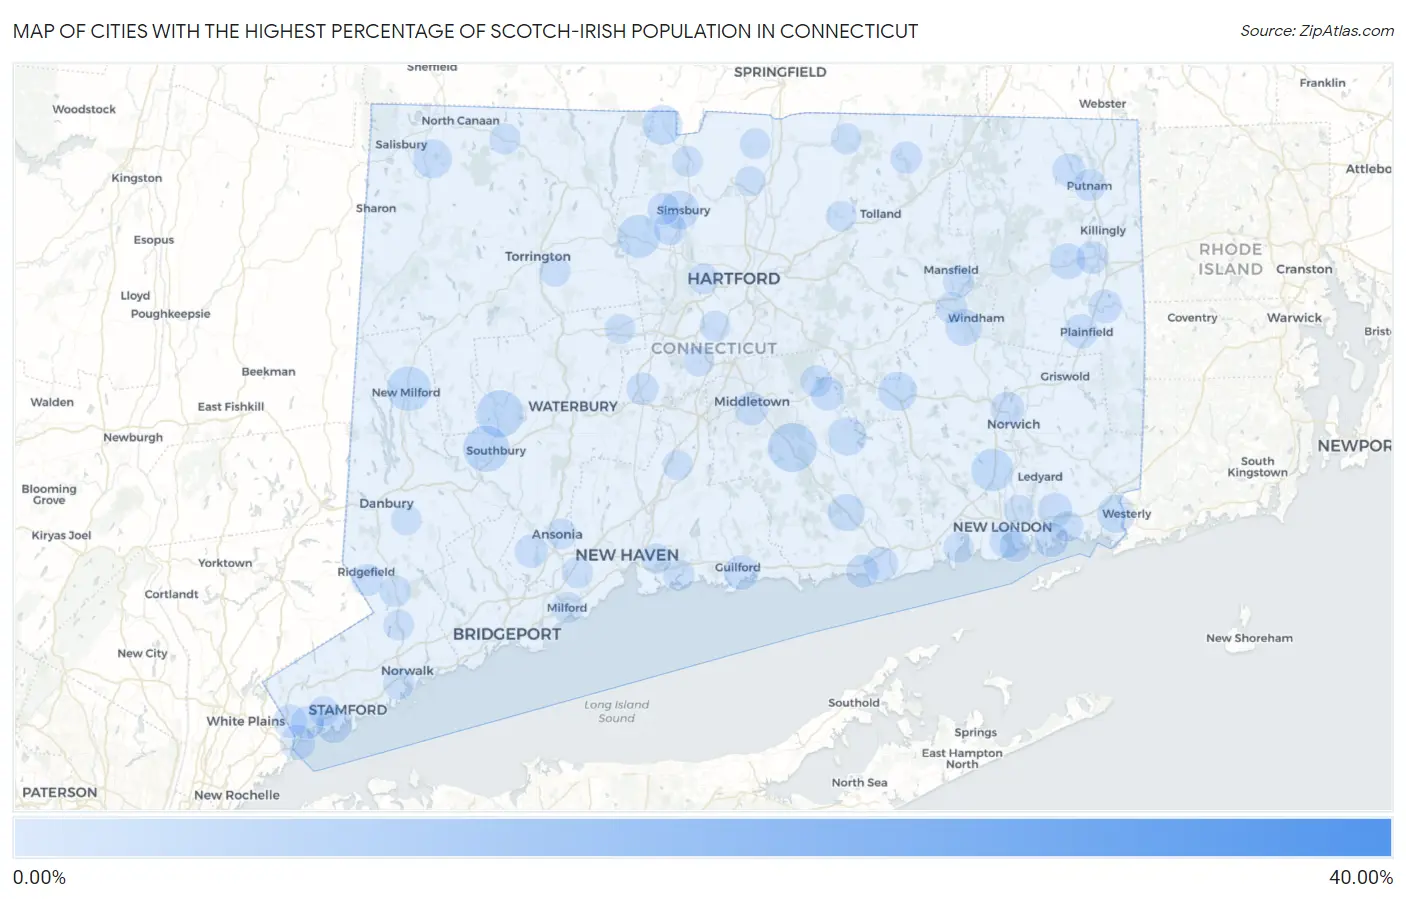
Map of Cities with the Highest Percentage of Scotch-Irish Population in Connecticut
0.00%
40.00%
Cities with the Highest Percentage of Scotch-Irish Population in Connecticut
| City | Scotch-Irish | vs State | vs National | |
| 1. | Witches Woods | 34.01% | 0.44%(+33.6)#1 | 0.82%(+33.2)#31 |
| 2. | Branchville | 31.65% | 0.44%(+31.2)#2 | 0.82%(+30.8)#33 |
| 3. | Lakes East | 5.49% | 0.44%(+5.05)#3 | 0.82%(+4.67)#789 |
| 4. | Inglenook | 4.16% | 0.44%(+3.72)#4 | 0.82%(+3.34)#1,269 |
| 5. | West Cornwall | 3.70% | 0.44%(+3.26)#5 | 0.82%(+2.89)#1,537 |
| 6. | Higganum | 3.37% | 0.44%(+2.92)#6 | 0.82%(+2.55)#1,794 |
| 7. | Stonington Borough | 3.29% | 0.44%(+2.85)#7 | 0.82%(+2.47)#1,879 |
| 8. | Noroton Heights | 3.19% | 0.44%(+2.75)#8 | 0.82%(+2.38)#1,964 |
| 9. | Woodbury Center | 3.04% | 0.44%(+2.60)#9 | 0.82%(+2.23)#2,135 |
| 10. | Heritage Village | 2.90% | 0.44%(+2.46)#10 | 0.82%(+2.08)#2,298 |
| 11. | Sandy Hook | 2.71% | 0.44%(+2.27)#11 | 0.82%(+1.89)#2,566 |
| 12. | Newtown Borough | 2.65% | 0.44%(+2.21)#12 | 0.82%(+1.84)#2,637 |
| 13. | New Milford | 2.64% | 0.44%(+2.19)#13 | 0.82%(+1.82)#2,654 |
| 14. | Canton Valley | 2.36% | 0.44%(+1.92)#14 | 0.82%(+1.54)#3,104 |
| 15. | Oxoboxo River | 2.26% | 0.44%(+1.82)#15 | 0.82%(+1.45)#3,281 |
| 16. | Stepney | 2.23% | 0.44%(+1.79)#16 | 0.82%(+1.41)#3,355 |
| 17. | Tokeneke | 2.21% | 0.44%(+1.77)#17 | 0.82%(+1.40)#3,392 |
| 18. | South Wilton | 2.03% | 0.44%(+1.59)#18 | 0.82%(+1.21)#3,836 |
| 19. | North Granby | 1.86% | 0.44%(+1.42)#19 | 0.82%(+1.05)#4,323 |
| 20. | Colchester | 1.71% | 0.44%(+1.26)#20 | 0.82%(+0.887)#4,820 |
| 21. | Falls Village | 1.69% | 0.44%(+1.25)#21 | 0.82%(+0.873)#4,866 |
| 22. | Moodus | 1.62% | 0.44%(+1.18)#22 | 0.82%(+0.803)#5,124 |
| 23. | Simsbury Center | 1.60% | 0.44%(+1.16)#23 | 0.82%(+0.786)#5,193 |
| 24. | Pawcatuck | 1.58% | 0.44%(+1.14)#24 | 0.82%(+0.762)#5,306 |
| 25. | New Canaan | 1.49% | 0.44%(+1.04)#25 | 0.82%(+0.668)#5,706 |
| 26. | Bridgewater | 1.41% | 0.44%(+0.966)#26 | 0.82%(+0.591)#6,053 |
| 27. | Deep River Center | 1.41% | 0.44%(+0.965)#27 | 0.82%(+0.590)#6,058 |
| 28. | South Windham | 1.35% | 0.44%(+0.904)#28 | 0.82%(+0.528)#6,366 |
| 29. | Old Greenwich | 1.25% | 0.44%(+0.804)#29 | 0.82%(+0.429)#6,884 |
| 30. | Brooklyn | 1.24% | 0.44%(+0.799)#30 | 0.82%(+0.424)#6,916 |
| 31. | Byram | 1.10% | 0.44%(+0.655)#31 | 0.82%(+0.280)#7,818 |
| 32. | Guilford Center | 1.02% | 0.44%(+0.581)#32 | 0.82%(+0.205)#8,338 |
| 33. | Old Mystic | 1.00% | 0.44%(+0.562)#33 | 0.82%(+0.187)#8,520 |
| 34. | Plainfield Village | 0.97% | 0.44%(+0.528)#34 | 0.82%(+0.152)#8,786 |
| 35. | Noank | 0.94% | 0.44%(+0.495)#35 | 0.82%(+0.119)#9,054 |
| 36. | Norwich | 0.90% | 0.44%(+0.462)#36 | 0.82%(+0.086)#9,317 |
| 37. | Old Saybrook Center | 0.89% | 0.44%(+0.450)#37 | 0.82%(+0.075)#9,399 |
| 38. | Bantam Borough | 0.86% | 0.44%(+0.419)#38 | 0.82%(+0.043)#9,678 |
| 39. | Daniels Farm | 0.86% | 0.44%(+0.415)#39 | 0.82%(+0.039)#9,715 |
| 40. | Bigelow Corners | 0.85% | 0.44%(+0.413)#40 | 0.82%(+0.037)#9,742 |
| 41. | Moosup | 0.85% | 0.44%(+0.408)#41 | 0.82%(+0.033)#9,784 |
| 42. | East Hampton | 0.85% | 0.44%(+0.407)#42 | 0.82%(+0.031)#9,795 |
| 43. | Middletown | 0.83% | 0.44%(+0.387)#43 | 0.82%(+0.011)#9,970 |
| 44. | Glenville | 0.80% | 0.44%(+0.361)#44 | 0.82%(-0.015)#10,188 |
| 45. | New London | 0.79% | 0.44%(+0.352)#45 | 0.82%(-0.024)#10,283 |
| 46. | Shelton | 0.78% | 0.44%(+0.339)#46 | 0.82%(-0.036)#10,390 |
| 47. | South Woodstock | 0.78% | 0.44%(+0.334)#47 | 0.82%(-0.042)#10,443 |
| 48. | Greenwich | 0.75% | 0.44%(+0.312)#48 | 0.82%(-0.063)#10,644 |
| 49. | Weatogue | 0.75% | 0.44%(+0.307)#49 | 0.82%(-0.069)#10,702 |
| 50. | East Brooklyn | 0.73% | 0.44%(+0.289)#50 | 0.82%(-0.087)#10,857 |
| 51. | Saybrook Manor | 0.73% | 0.44%(+0.289)#51 | 0.82%(-0.087)#10,861 |
| 52. | Route 7 Gateway | 0.69% | 0.44%(+0.252)#52 | 0.82%(-0.124)#11,254 |
| 53. | Noroton | 0.68% | 0.44%(+0.236)#53 | 0.82%(-0.140)#11,422 |
| 54. | Quinnipiac University | 0.67% | 0.44%(+0.228)#54 | 0.82%(-0.148)#11,508 |
| 55. | Weston | 0.63% | 0.44%(+0.185)#55 | 0.82%(-0.191)#11,941 |
| 56. | Plantsville | 0.62% | 0.44%(+0.182)#56 | 0.82%(-0.194)#11,984 |
| 57. | Putnam | 0.61% | 0.44%(+0.168)#57 | 0.82%(-0.207)#12,140 |
| 58. | West Simsbury | 0.61% | 0.44%(+0.166)#58 | 0.82%(-0.210)#12,174 |
| 59. | Oronoque | 0.59% | 0.44%(+0.148)#59 | 0.82%(-0.227)#12,369 |
| 60. | Lake Pocotopaug | 0.59% | 0.44%(+0.146)#60 | 0.82%(-0.230)#12,395 |
| 61. | Groton Long Point Borough | 0.58% | 0.44%(+0.138)#61 | 0.82%(-0.238)#12,458 |
| 62. | Ridgefield | 0.57% | 0.44%(+0.133)#62 | 0.82%(-0.243)#12,512 |
| 63. | Stafford Springs | 0.57% | 0.44%(+0.131)#63 | 0.82%(-0.245)#12,532 |
| 64. | Jewett City Borough | 0.56% | 0.44%(+0.114)#64 | 0.82%(-0.261)#12,725 |
| 65. | Mansfield Center | 0.55% | 0.44%(+0.104)#65 | 0.82%(-0.271)#12,839 |
| 66. | Georgetown | 0.54% | 0.44%(+0.101)#66 | 0.82%(-0.274)#12,871 |
| 67. | Branford Center | 0.53% | 0.44%(+0.090)#67 | 0.82%(-0.286)#13,009 |
| 68. | Norwalk | 0.53% | 0.44%(+0.090)#68 | 0.82%(-0.286)#13,021 |
| 69. | Coleytown | 0.53% | 0.44%(+0.089)#69 | 0.82%(-0.287)#13,030 |
| 70. | Willimantic | 0.52% | 0.44%(+0.076)#70 | 0.82%(-0.300)#13,185 |
| 71. | Milford City Balance | 0.50% | 0.44%(+0.055)#71 | 0.82%(-0.320)#13,415 |
| 72. | Westport | 0.49% | 0.44%(+0.045)#72 | 0.82%(-0.331)#13,530 |
| 73. | Orange | 0.48% | 0.44%(+0.043)#73 | 0.82%(-0.333)#13,556 |
| 74. | Groton | 0.48% | 0.44%(+0.039)#74 | 0.82%(-0.337)#13,612 |
| 75. | Norfolk | 0.46% | 0.44%(+0.018)#75 | 0.82%(-0.358)#13,856 |
| 76. | Northwest Harwinton | 0.44% | 0.44%(-0.005)#76 | 0.82%(-0.381)#14,129 |
| 77. | Ball Pond | 0.43% | 0.44%(-0.007)#77 | 0.82%(-0.383)#14,171 |
| 78. | Mystic | 0.43% | 0.44%(-0.012)#78 | 0.82%(-0.388)#14,219 |
| 79. | Wilton Center | 0.43% | 0.44%(-0.016)#79 | 0.82%(-0.392)#14,261 |
| 80. | West Hartford | 0.43% | 0.44%(-0.016)#80 | 0.82%(-0.392)#14,266 |
| 81. | Suffield Depot | 0.42% | 0.44%(-0.018)#81 | 0.82%(-0.394)#14,287 |
| 82. | Newington | 0.42% | 0.44%(-0.019)#82 | 0.82%(-0.394)#14,300 |
| 83. | Ansonia | 0.42% | 0.44%(-0.020)#83 | 0.82%(-0.396)#14,323 |
| 84. | Bethel | 0.42% | 0.44%(-0.027)#84 | 0.82%(-0.402)#14,403 |
| 85. | Salmon Brook | 0.41% | 0.44%(-0.030)#85 | 0.82%(-0.406)#14,435 |
| 86. | Somers | 0.40% | 0.44%(-0.039)#86 | 0.82%(-0.414)#14,531 |
| 87. | Rockville | 0.39% | 0.44%(-0.054)#87 | 0.82%(-0.429)#14,707 |
| 88. | Northford | 0.39% | 0.44%(-0.054)#88 | 0.82%(-0.430)#14,717 |
| 89. | Kensington | 0.38% | 0.44%(-0.066)#89 | 0.82%(-0.442)#14,885 |
| 90. | Niantic | 0.37% | 0.44%(-0.070)#90 | 0.82%(-0.446)#14,929 |
| 91. | East Haven | 0.36% | 0.44%(-0.083)#91 | 0.82%(-0.459)#15,090 |
| 92. | Old Hill | 0.35% | 0.44%(-0.092)#92 | 0.82%(-0.468)#15,191 |
| 93. | Greens Farms | 0.33% | 0.44%(-0.114)#93 | 0.82%(-0.490)#15,471 |
| 94. | Wallingford Center | 0.32% | 0.44%(-0.122)#94 | 0.82%(-0.498)#15,556 |
| 95. | Bristol | 0.32% | 0.44%(-0.123)#95 | 0.82%(-0.498)#15,570 |
| 96. | Windsor Locks | 0.32% | 0.44%(-0.124)#96 | 0.82%(-0.499)#15,582 |
| 97. | Naugatuck Borough | 0.31% | 0.44%(-0.132)#97 | 0.82%(-0.508)#15,691 |
| 98. | Woodmont Borough | 0.31% | 0.44%(-0.133)#98 | 0.82%(-0.509)#15,698 |
| 99. | Cos Cob | 0.30% | 0.44%(-0.138)#99 | 0.82%(-0.514)#15,755 |
| 100. | Conning Towers Nautilus Park | 0.29% | 0.44%(-0.154)#100 | 0.82%(-0.530)#15,973 |
Common Questions
What are the Top 10 Cities with the Highest Percentage of Scotch-Irish Population in Connecticut?
Top 10 Cities with the Highest Percentage of Scotch-Irish Population in Connecticut are:
#1
3.37%
#2
3.04%
#3
2.90%
#4
2.64%
#5
2.36%
#6
2.26%
#7
1.86%
#8
1.71%
#9
1.69%
#10
1.62%
What city has the Highest Percentage of Scotch-Irish Population in Connecticut?
Higganum has the Highest Percentage of Scotch-Irish Population in Connecticut with 3.37%.
What is the Percentage of Scotch-Irish Population in the State of Connecticut?
Percentage of Scotch-Irish Population in Connecticut is 0.44%.
What is the Percentage of Scotch-Irish Population in the United States?
Percentage of Scotch-Irish Population in the United States is 0.82%.