Cities with the Highest Percentage of Immigrants from Mexico in Connecticut
RELATED REPORTS & OPTIONS
Mexico
Connecticut
Compare Cities
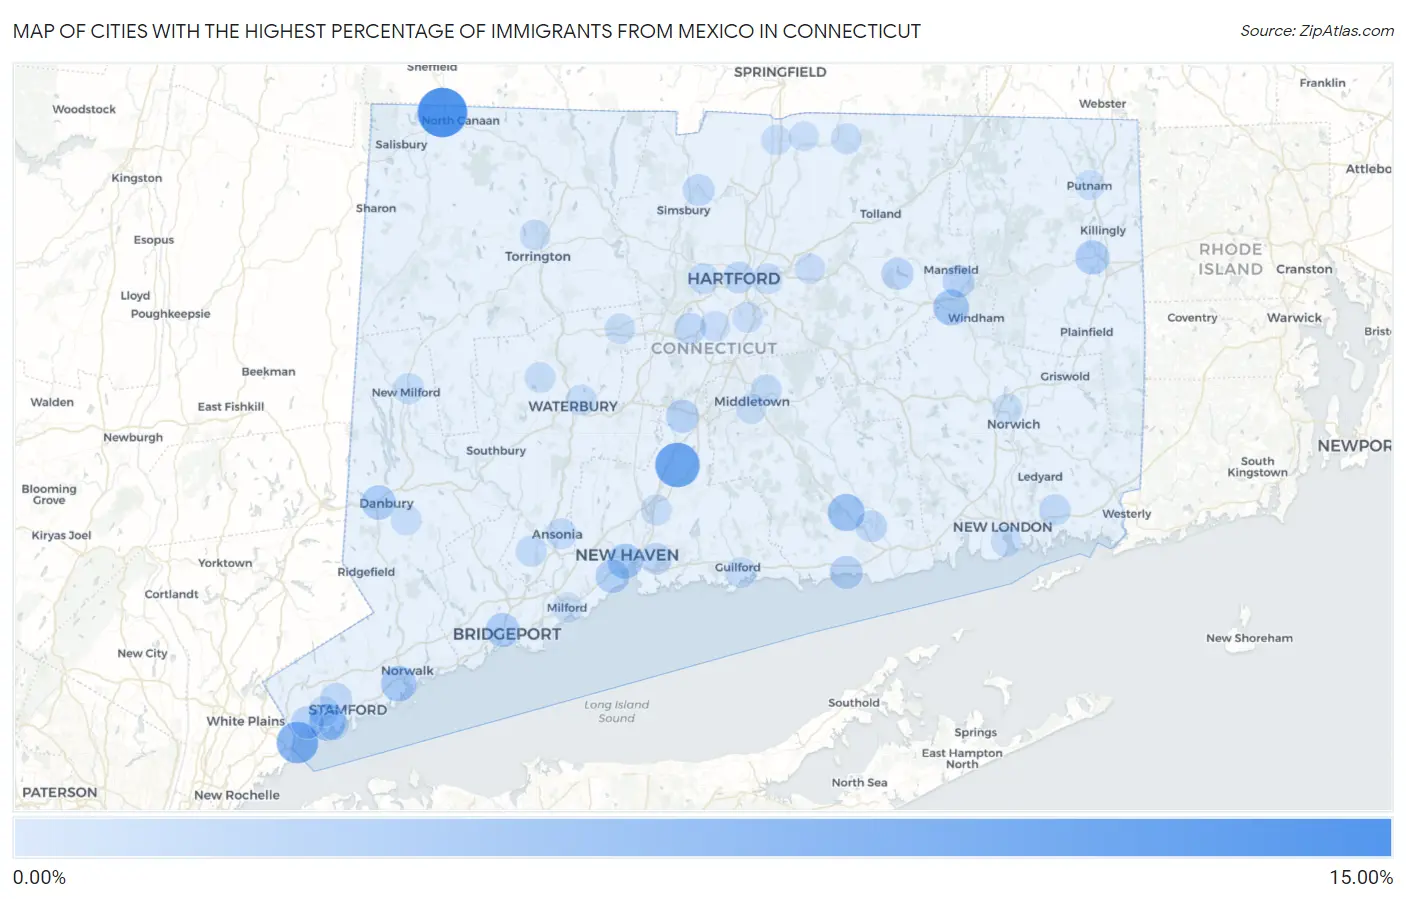
Map of Cities with the Highest Percentage of Immigrants from Mexico in Connecticut
0.00%
15.00%
Cities with the Highest Percentage of Immigrants from Mexico in Connecticut
| City | Mexico | vs State | vs National | |
| 1. | Canaan | 10.86% | 0.71%(+10.2)#-1 | 3.25%(+7.61)#0 |
| 2. | Wallingford Center | 8.03% | 0.71%(+7.31)#0 | 3.25%(+4.77)#1 |
| 3. | Byram | 6.28% | 0.71%(+5.57)#1 | 3.25%(+3.03)#2 |
| 4. | Deep River Center | 3.74% | 0.71%(+3.03)#2 | 3.25%(+0.489)#3 |
| 5. | Riverside | 3.53% | 0.71%(+2.82)#3 | 3.25%(+0.278)#4 |
| 6. | Willimantic | 3.12% | 0.71%(+2.41)#4 | 3.25%(-0.127)#5 |
| 7. | Danielson Borough | 2.98% | 0.71%(+2.26)#5 | 3.25%(-0.273)#6 |
| 8. | Norwalk | 2.93% | 0.71%(+2.21)#6 | 3.25%(-0.324)#128 |
| 9. | New Haven | 2.71% | 0.71%(+1.99)#7 | 3.25%(-0.544)#129 |
| 10. | Danbury | 2.31% | 0.71%(+1.60)#8 | 3.25%(-0.941)#130 |
| 11. | East Brooklyn | 2.15% | 0.71%(+1.43)#9 | 3.25%(-1.11)#131 |
| 12. | Bridgeport | 2.08% | 0.71%(+1.37)#10 | 3.25%(-1.17)#195 |
| 13. | West Haven | 2.01% | 0.71%(+1.29)#11 | 3.25%(-1.24)#196 |
| 14. | Candlewood Shores | 1.89% | 0.71%(+1.18)#12 | 3.25%(-1.36)#197 |
| 15. | Meriden | 1.63% | 0.71%(+0.919)#13 | 3.25%(-1.62)#198 |
| 16. | Westbrook Center | 1.60% | 0.71%(+0.882)#14 | 3.25%(-1.66)#199 |
| 17. | Greenwich | 1.52% | 0.71%(+0.801)#15 | 3.25%(-1.74)#200 |
| 18. | Greens Farms | 1.34% | 0.71%(+0.630)#16 | 3.25%(-1.91)#201 |
| 19. | Mansfield Center | 1.33% | 0.71%(+0.613)#17 | 3.25%(-1.92)#202 |
| 20. | Coventry Lake | 1.03% | 0.71%(+0.317)#18 | 3.25%(-2.22)#203 |
| 21. | Stamford | 0.95% | 0.71%(+0.232)#19 | 3.25%(-2.31)#204 |
| 22. | New Britain | 0.90% | 0.71%(+0.186)#20 | 3.25%(-2.35)#205 |
| 23. | Tariffville | 0.89% | 0.71%(+0.173)#21 | 3.25%(-2.36)#206 |
| 24. | East Haven | 0.86% | 0.71%(+0.150)#22 | 3.25%(-2.39)#207 |
| 25. | Essex Village | 0.84% | 0.71%(+0.130)#23 | 3.25%(-2.41)#208 |
| 26. | Hartford | 0.82% | 0.71%(+0.105)#24 | 3.25%(-2.43)#209 |
| 27. | Old Mystic | 0.71% | 0.71%(-0.005)#25 | 3.25%(-2.54)#210 |
| 28. | Sacred Heart University | 0.63% | 0.71%(-0.084)#26 | 3.25%(-2.62)#211 |
| 29. | New Milford | 0.62% | 0.71%(-0.094)#27 | 3.25%(-2.63)#212 |
| 30. | West Hartford | 0.59% | 0.71%(-0.128)#28 | 3.25%(-2.67)#213 |
| 31. | Ansonia | 0.52% | 0.71%(-0.192)#29 | 3.25%(-2.73)#214 |
| 32. | Portland | 0.51% | 0.71%(-0.200)#30 | 3.25%(-2.74)#215 |
| 33. | Shelton | 0.49% | 0.71%(-0.224)#31 | 3.25%(-2.76)#216 |
| 34. | Somers | 0.45% | 0.71%(-0.266)#32 | 3.25%(-2.80)#217 |
| 35. | New London | 0.44% | 0.71%(-0.276)#33 | 3.25%(-2.81)#218 |
| 36. | North Haven | 0.44% | 0.71%(-0.276)#34 | 3.25%(-2.81)#219 |
| 37. | East Hartford | 0.40% | 0.71%(-0.312)#35 | 3.25%(-2.85)#220 |
| 38. | Waterbury | 0.40% | 0.71%(-0.314)#36 | 3.25%(-2.85)#221 |
| 39. | Watertown | 0.40% | 0.71%(-0.316)#37 | 3.25%(-2.85)#222 |
| 40. | Guilford Center | 0.39% | 0.71%(-0.321)#38 | 3.25%(-2.86)#223 |
| 41. | Bethel | 0.39% | 0.71%(-0.325)#39 | 3.25%(-2.86)#224 |
| 42. | Cos Cob | 0.36% | 0.71%(-0.356)#40 | 3.25%(-2.89)#225 |
| 43. | Oronoque | 0.32% | 0.71%(-0.395)#41 | 3.25%(-2.93)#226 |
| 44. | Torrington | 0.31% | 0.71%(-0.405)#42 | 3.25%(-2.94)#227 |
| 45. | Noroton | 0.29% | 0.71%(-0.429)#43 | 3.25%(-2.97)#228 |
| 46. | Bristol | 0.28% | 0.71%(-0.431)#44 | 3.25%(-2.97)#229 |
| 47. | Naugatuck Borough | 0.25% | 0.71%(-0.462)#45 | 3.25%(-3.00)#230 |
| 48. | Fairfield University | 0.22% | 0.71%(-0.494)#46 | 3.25%(-3.03)#231 |
| 49. | Wethersfield | 0.22% | 0.71%(-0.498)#47 | 3.25%(-3.03)#232 |
| 50. | Sandy Hook | 0.21% | 0.71%(-0.506)#48 | 3.25%(-3.04)#233 |
| 51. | Newington | 0.21% | 0.71%(-0.508)#49 | 3.25%(-3.05)#234 |
| 52. | Stratford Downtown | 0.21% | 0.71%(-0.509)#50 | 3.25%(-3.05)#235 |
| 53. | Thompsonville | 0.17% | 0.71%(-0.542)#51 | 3.25%(-3.08)#236 |
| 54. | Old Greenwich | 0.17% | 0.71%(-0.545)#52 | 3.25%(-3.08)#237 |
| 55. | Manchester | 0.16% | 0.71%(-0.550)#53 | 3.25%(-3.09)#238 |
| 56. | Norwich | 0.11% | 0.71%(-0.600)#54 | 3.25%(-3.14)#239 |
| 57. | Middletown | 0.11% | 0.71%(-0.602)#55 | 3.25%(-3.14)#240 |
| 58. | Trumbull Center | 0.087% | 0.71%(-0.627)#56 | 3.25%(-3.16)#241 |
| 59. | Putnam | 0.056% | 0.71%(-0.659)#57 | 3.25%(-3.20)#242 |
| 60. | Milford City Balance | 0.036% | 0.71%(-0.679)#58 | 3.25%(-3.22)#243 |
| 61. | Hazardville | 0.033% | 0.71%(-0.682)#59 | 3.25%(-3.22)#244 |
1
2Common Questions
What are the Top 10 Cities with the Highest Percentage of Immigrants from Mexico in Connecticut?
Top 10 Cities with the Highest Percentage of Immigrants from Mexico in Connecticut are:
#1
10.86%
#2
8.03%
#3
6.28%
#4
3.74%
#5
3.53%
#6
3.12%
#7
2.93%
#8
2.71%
#9
2.31%
#10
2.15%
What city has the Highest Percentage of Immigrants from Mexico in Connecticut?
Canaan has the Highest Percentage of Immigrants from Mexico in Connecticut with 10.86%.
What is the Percentage of Immigrants from Mexico in the State of Connecticut?
Percentage of Immigrants from Mexico in Connecticut is 0.71%.
What is the Percentage of Immigrants from Mexico in the United States?
Percentage of Immigrants from Mexico in the United States is 3.25%.