Cities with the Highest Percentage of Population with a Degree in Business in Connecticut
RELATED REPORTS & OPTIONS
Business
Connecticut
Compare Cities
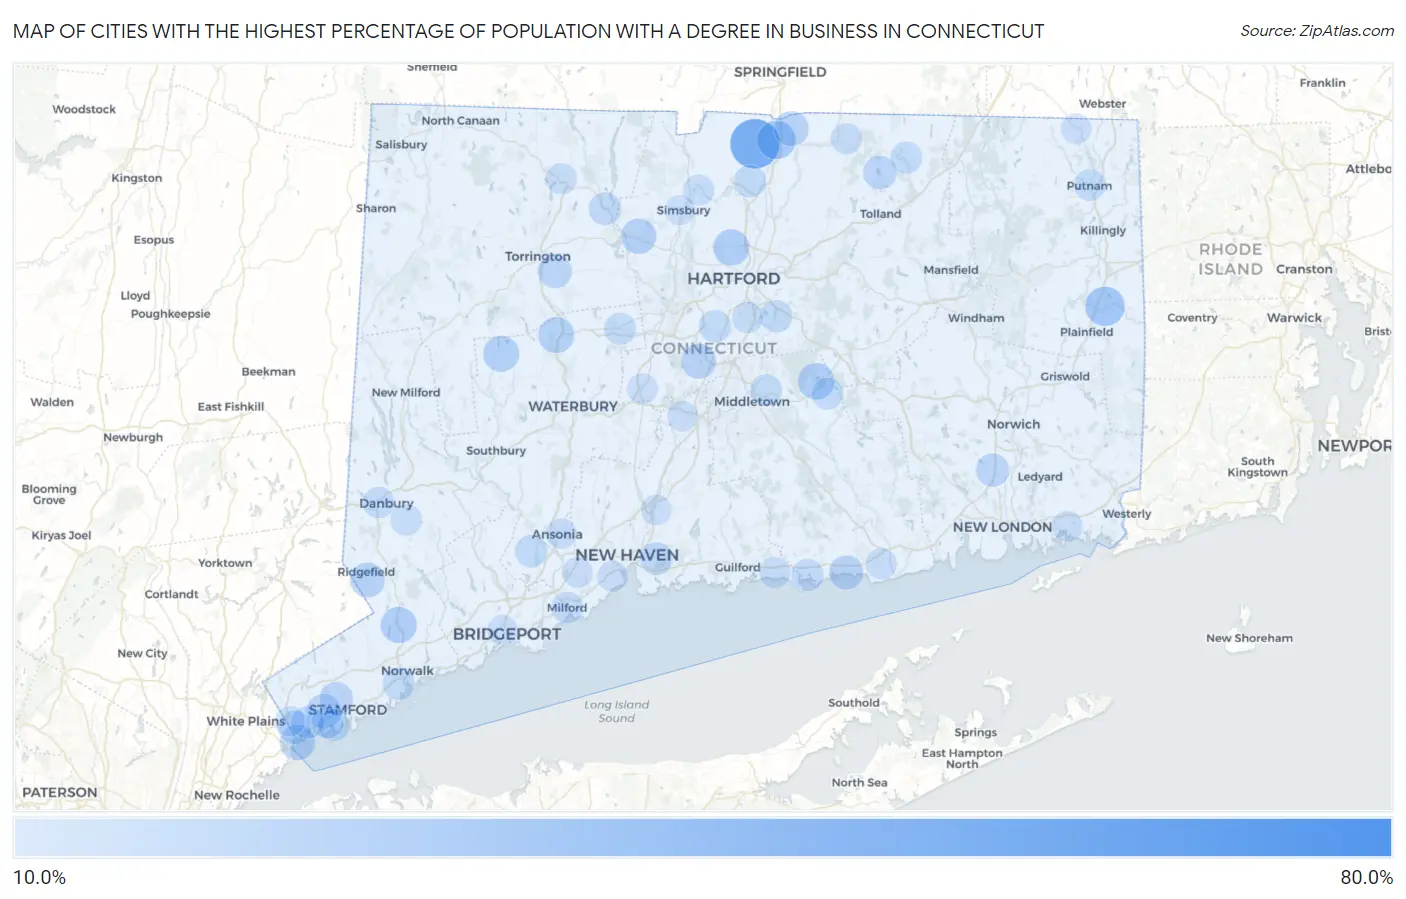
Map of Cities with the Highest Percentage of Population with a Degree in Business in Connecticut
0.0%
80.0%
Cities with the Highest Percentage of Population with a Degree in Business in Connecticut
| City | % Graduates | vs State | vs National | |
| 1. | Riverton | 68.7% | 19.0%(+49.7)#1 | 19.5%(+49.2)#491 |
| 2. | Topstone | 55.1% | 19.0%(+36.1)#2 | 19.5%(+35.6)#832 |
| 3. | Suffield Depot | 50.4% | 19.0%(+31.4)#3 | 19.5%(+30.9)#993 |
| 4. | Redding Center | 46.1% | 19.0%(+27.1)#4 | 19.5%(+26.6)#1,333 |
| 5. | Candlewood Shores | 38.3% | 19.0%(+19.3)#5 | 19.5%(+18.8)#2,072 |
| 6. | West Mountain | 37.6% | 19.0%(+18.6)#6 | 19.5%(+18.1)#2,146 |
| 7. | Brookfield Center | 37.0% | 19.0%(+18.0)#7 | 19.5%(+17.5)#2,245 |
| 8. | Tashua | 35.7% | 19.0%(+16.7)#8 | 19.5%(+16.2)#2,452 |
| 9. | Indian Field | 34.5% | 19.0%(+15.6)#9 | 19.5%(+15.0)#2,655 |
| 10. | Moosup | 33.8% | 19.0%(+14.8)#10 | 19.5%(+14.3)#2,788 |
| 11. | West Cornwall | 33.3% | 19.0%(+14.4)#11 | 19.5%(+13.8)#3,011 |
| 12. | Sherman | 33.3% | 19.0%(+14.4)#12 | 19.5%(+13.8)#3,020 |
| 13. | Thompsonville | 32.1% | 19.0%(+13.1)#13 | 19.5%(+12.6)#3,286 |
| 14. | Coleytown | 30.6% | 19.0%(+11.6)#14 | 19.5%(+11.1)#3,730 |
| 15. | Daniels Farm | 29.7% | 19.0%(+10.7)#15 | 19.5%(+10.2)#3,997 |
| 16. | Sail Harbor | 29.3% | 19.0%(+10.3)#16 | 19.5%(+9.81)#4,142 |
| 17. | Lake Pocotopaug | 28.9% | 19.0%(+9.92)#17 | 19.5%(+9.39)#4,277 |
| 18. | Saugatuck | 28.5% | 19.0%(+9.58)#18 | 19.5%(+9.05)#4,460 |
| 19. | Blue Hills | 28.3% | 19.0%(+9.37)#19 | 19.5%(+8.84)#4,530 |
| 20. | Wilton Center | 28.3% | 19.0%(+9.36)#20 | 19.5%(+8.82)#4,534 |
| 21. | Bethlehem Village | 28.2% | 19.0%(+9.19)#21 | 19.5%(+8.66)#4,610 |
| 22. | Thomaston | 27.9% | 19.0%(+8.94)#22 | 19.5%(+8.41)#4,717 |
| 23. | Compo | 27.5% | 19.0%(+8.58)#23 | 19.5%(+8.05)#4,907 |
| 24. | Tokeneke | 27.5% | 19.0%(+8.55)#24 | 19.5%(+8.02)#4,919 |
| 25. | Trumbull Center | 27.5% | 19.0%(+8.49)#25 | 19.5%(+7.95)#4,955 |
| 26. | East | 27.4% | 19.0%(+8.39)#26 | 19.5%(+7.85)#5,004 |
| 27. | Bogus Hill | 27.2% | 19.0%(+8.21)#27 | 19.5%(+7.67)#5,110 |
| 28. | Byram | 26.9% | 19.0%(+7.95)#28 | 19.5%(+7.41)#5,250 |
| 29. | Canton Valley | 26.8% | 19.0%(+7.79)#29 | 19.5%(+7.26)#5,345 |
| 30. | Sherwood Manor | 26.4% | 19.0%(+7.41)#30 | 19.5%(+6.88)#5,569 |
| 31. | Kensington | 26.4% | 19.0%(+7.40)#31 | 19.5%(+6.87)#5,575 |
| 32. | New Canaan | 26.3% | 19.0%(+7.28)#32 | 19.5%(+6.75)#5,652 |
| 33. | Ridgefield | 26.0% | 19.0%(+7.05)#33 | 19.5%(+6.51)#5,790 |
| 34. | Candlewood Knolls | 25.9% | 19.0%(+6.92)#34 | 19.5%(+6.38)#5,865 |
| 35. | Cos Cob | 25.6% | 19.0%(+6.63)#35 | 19.5%(+6.10)#6,044 |
| 36. | Westbrook Center | 25.3% | 19.0%(+6.34)#36 | 19.5%(+5.80)#6,218 |
| 37. | Noroton | 24.6% | 19.0%(+5.67)#37 | 19.5%(+5.14)#6,754 |
| 38. | Northwest Harwinton | 24.6% | 19.0%(+5.63)#38 | 19.5%(+5.09)#6,784 |
| 39. | Candlewood Isle | 24.5% | 19.0%(+5.50)#39 | 19.5%(+4.97)#6,868 |
| 40. | Stepney | 24.3% | 19.0%(+5.38)#40 | 19.5%(+4.85)#6,952 |
| 41. | Woodmont Borough | 24.2% | 19.0%(+5.25)#41 | 19.5%(+4.71)#7,045 |
| 42. | Crystal Lake | 24.2% | 19.0%(+5.21)#42 | 19.5%(+4.68)#7,076 |
| 43. | Stamford | 24.1% | 19.0%(+5.11)#43 | 19.5%(+4.57)#7,162 |
| 44. | Pemberwick | 23.8% | 19.0%(+4.86)#44 | 19.5%(+4.32)#7,337 |
| 45. | Oxoboxo River | 23.7% | 19.0%(+4.71)#45 | 19.5%(+4.18)#7,464 |
| 46. | Ridgebury | 23.5% | 19.0%(+4.58)#46 | 19.5%(+4.04)#7,579 |
| 47. | Weston | 23.4% | 19.0%(+4.48)#47 | 19.5%(+3.94)#7,666 |
| 48. | Dodgingtown | 23.3% | 19.0%(+4.37)#48 | 19.5%(+3.83)#7,785 |
| 49. | Greens Farms | 23.3% | 19.0%(+4.32)#49 | 19.5%(+3.78)#7,826 |
| 50. | Oronoque | 23.1% | 19.0%(+4.13)#50 | 19.5%(+3.59)#7,973 |
| 51. | East Haven | 22.9% | 19.0%(+3.94)#51 | 19.5%(+3.41)#8,153 |
| 52. | Greenwich | 22.8% | 19.0%(+3.83)#52 | 19.5%(+3.29)#8,232 |
| 53. | New Hartford Center | 22.8% | 19.0%(+3.82)#53 | 19.5%(+3.28)#8,241 |
| 54. | Hawleyville | 22.7% | 19.0%(+3.70)#54 | 19.5%(+3.17)#8,362 |
| 55. | Sandy Hook | 22.6% | 19.0%(+3.62)#55 | 19.5%(+3.08)#8,445 |
| 56. | Darien Downtown | 22.5% | 19.0%(+3.56)#56 | 19.5%(+3.03)#8,503 |
| 57. | Groton Long Point Borough | 22.5% | 19.0%(+3.55)#57 | 19.5%(+3.02)#8,508 |
| 58. | Newington | 22.4% | 19.0%(+3.46)#58 | 19.5%(+2.93)#8,585 |
| 59. | Shelton | 22.4% | 19.0%(+3.44)#59 | 19.5%(+2.91)#8,605 |
| 60. | Glastonbury Center | 22.3% | 19.0%(+3.29)#60 | 19.5%(+2.76)#8,712 |
| 61. | Windsor Locks | 22.2% | 19.0%(+3.28)#61 | 19.5%(+2.75)#8,716 |
| 62. | Norwalk | 22.1% | 19.0%(+3.16)#62 | 19.5%(+2.63)#8,870 |
| 63. | Clinton | 22.1% | 19.0%(+3.15)#63 | 19.5%(+2.62)#8,882 |
| 64. | Old Greenwich | 21.9% | 19.0%(+2.94)#64 | 19.5%(+2.41)#9,110 |
| 65. | Riverside | 21.8% | 19.0%(+2.80)#65 | 19.5%(+2.27)#9,241 |
| 66. | Bristol | 21.6% | 19.0%(+2.65)#66 | 19.5%(+2.12)#9,379 |
| 67. | Putnam | 21.5% | 19.0%(+2.56)#67 | 19.5%(+2.03)#9,461 |
| 68. | Ball Pond | 21.3% | 19.0%(+2.38)#68 | 19.5%(+1.85)#9,653 |
| 69. | Portland | 21.3% | 19.0%(+2.32)#69 | 19.5%(+1.78)#9,726 |
| 70. | Mill Plain | 21.2% | 19.0%(+2.26)#70 | 19.5%(+1.73)#9,775 |
| 71. | Stafford Springs | 21.2% | 19.0%(+2.25)#71 | 19.5%(+1.72)#9,785 |
| 72. | Candlewood Orchards | 21.2% | 19.0%(+2.24)#72 | 19.5%(+1.70)#9,807 |
| 73. | East Hampton | 21.2% | 19.0%(+2.22)#73 | 19.5%(+1.69)#9,817 |
| 74. | Danbury | 20.9% | 19.0%(+1.93)#74 | 19.5%(+1.40)#10,072 |
| 75. | Quasset Lake | 20.8% | 19.0%(+1.87)#75 | 19.5%(+1.33)#10,149 |
| 76. | Milford City Balance | 20.8% | 19.0%(+1.86)#76 | 19.5%(+1.32)#10,164 |
| 77. | Bethel | 20.8% | 19.0%(+1.83)#77 | 19.5%(+1.30)#10,187 |
| 78. | Somers | 20.6% | 19.0%(+1.62)#78 | 19.5%(+1.09)#10,418 |
| 79. | Lakes West | 20.5% | 19.0%(+1.51)#79 | 19.5%(+0.974)#10,531 |
| 80. | Madison Center | 20.4% | 19.0%(+1.41)#80 | 19.5%(+0.873)#10,636 |
| 81. | Winsted | 20.4% | 19.0%(+1.40)#81 | 19.5%(+0.861)#10,653 |
| 82. | Wethersfield | 20.3% | 19.0%(+1.38)#82 | 19.5%(+0.847)#10,666 |
| 83. | Tariffville | 20.2% | 19.0%(+1.26)#83 | 19.5%(+0.724)#10,790 |
| 84. | Noroton Heights | 20.2% | 19.0%(+1.25)#84 | 19.5%(+0.714)#10,799 |
| 85. | Old Saybrook Center | 20.1% | 19.0%(+1.12)#85 | 19.5%(+0.582)#10,928 |
| 86. | West Haven | 19.8% | 19.0%(+0.876)#86 | 19.5%(+0.342)#11,228 |
| 87. | South Wilton | 19.8% | 19.0%(+0.841)#87 | 19.5%(+0.307)#11,259 |
| 88. | Ansonia | 19.7% | 19.0%(+0.697)#88 | 19.5%(+0.163)#11,414 |
| 89. | Mystic | 19.6% | 19.0%(+0.587)#89 | 19.5%(+0.054)#11,524 |
| 90. | Knollcrest | 19.5% | 19.0%(+0.562)#90 | 19.5%(+0.028)#11,554 |
| 91. | Plantsville | 19.5% | 19.0%(+0.547)#91 | 19.5%(+0.013)#11,571 |
| 92. | North Haven | 19.5% | 19.0%(+0.547)#92 | 19.5%(+0.013)#11,582 |
| 93. | Meriden | 19.4% | 19.0%(+0.444)#93 | 19.5%(-0.090)#11,680 |
| 94. | Orange | 19.4% | 19.0%(+0.409)#94 | 19.5%(-0.125)#11,716 |
| 95. | Cornwall Bridge | 19.4% | 19.0%(+0.390)#95 | 19.5%(-0.144)#11,751 |
| 96. | Quinebaug | 19.2% | 19.0%(+0.240)#96 | 19.5%(-0.294)#11,923 |
| 97. | Bridgeport | 19.0% | 19.0%(+0.064)#97 | 19.5%(-0.470)#12,113 |
| 98. | Glenville | 19.0% | 19.0%(+0.057)#98 | 19.5%(-0.477)#12,120 |
| 99. | Fenwick Borough | 18.8% | 19.0%(-0.215)#99 | 19.5%(-0.749)#12,440 |
| 100. | Simsbury Center | 18.7% | 19.0%(-0.247)#100 | 19.5%(-0.781)#12,463 |
Common Questions
What are the Top 10 Cities with the Highest Percentage of Population with a Degree in Business in Connecticut?
Top 10 Cities with the Highest Percentage of Population with a Degree in Business in Connecticut are:
#1
50.4%
#2
33.8%
#3
32.1%
#4
28.9%
#5
28.3%
#6
28.3%
#7
28.2%
#8
27.9%
#9
26.9%
#10
26.8%
What city has the Highest Percentage of Population with a Degree in Business in Connecticut?
Suffield Depot has the Highest Percentage of Population with a Degree in Business in Connecticut with 50.4%.
What is the Percentage of Population with a Degree in Business in the State of Connecticut?
Percentage of Population with a Degree in Business in Connecticut is 19.0%.
What is the Percentage of Population with a Degree in Business in the United States?
Percentage of Population with a Degree in Business in the United States is 19.5%.