East Hampton, CT Map & Demographics
East Hampton Map
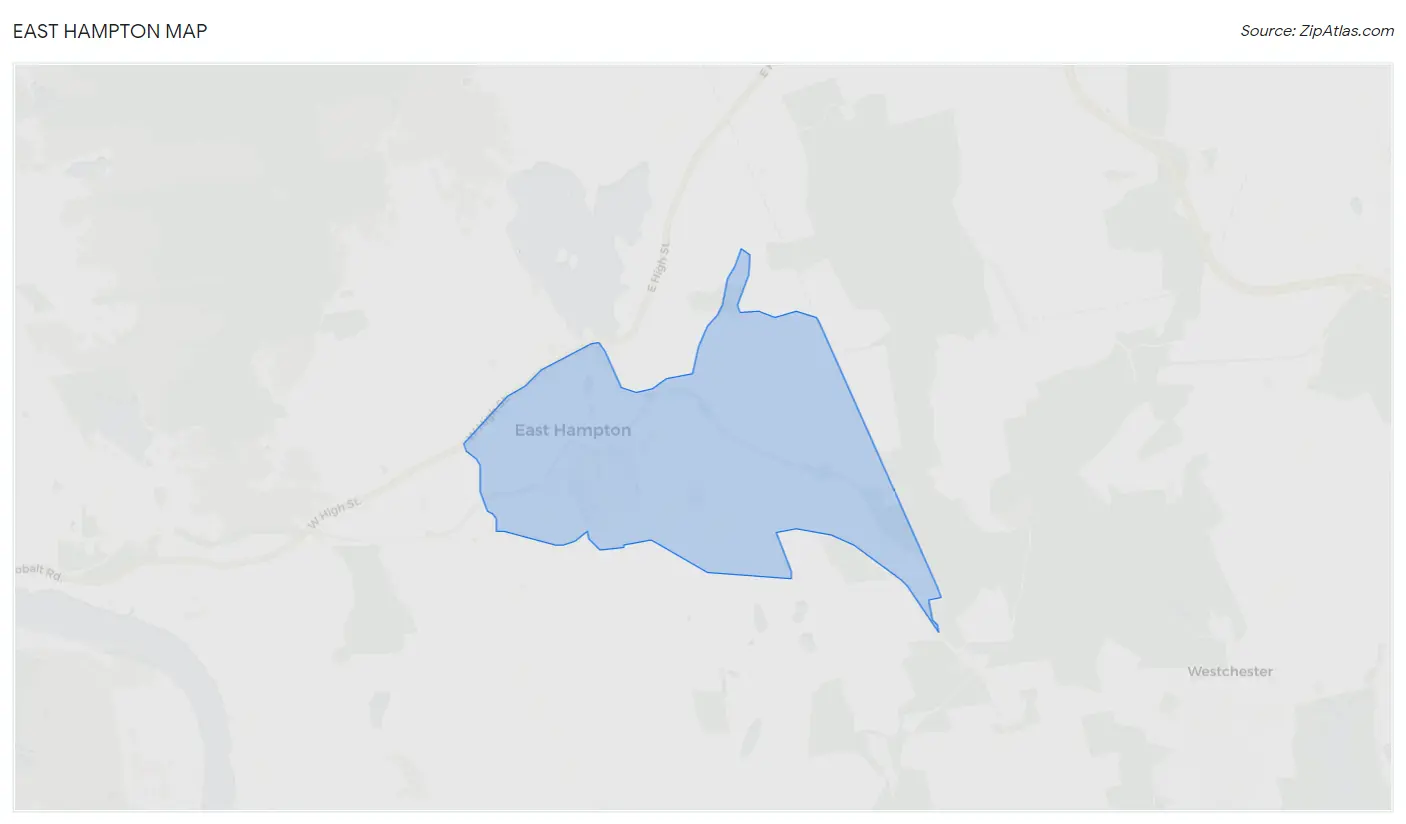
East Hampton Overview
$42,508
PER CAPITA INCOME
$128,457
AVG FAMILY INCOME
$122,426
AVG HOUSEHOLD INCOME
47.8%
WAGE / INCOME GAP [ % ]
52.2¢/ $1
WAGE / INCOME GAP [ $ ]
0.31
INEQUALITY / GINI INDEX
2,944
TOTAL POPULATION
1,384
MALE POPULATION
1,560
FEMALE POPULATION
88.72
MALES / 100 FEMALES
112.72
FEMALES / 100 MALES
45.5
MEDIAN AGE
3.1
AVG FAMILY SIZE
2.8
AVG HOUSEHOLD SIZE
1,529
LABOR FORCE [ PEOPLE ]
62.9%
PERCENT IN LABOR FORCE
4.5%
UNEMPLOYMENT RATE
East Hampton Zip Codes
East Hampton Area Codes
Income in East Hampton
Income Overview in East Hampton
Per Capita Income in East Hampton is $42,508, while median incomes of families and households are $128,457 and $122,426 respectively.
| Characteristic | Number | Measure |
| Per Capita Income | 2,944 | $42,508 |
| Median Family Income | 840 | $128,457 |
| Mean Family Income | 840 | $134,123 |
| Median Household Income | 1,025 | $122,426 |
| Mean Household Income | 1,025 | $121,103 |
| Income Deficit | 840 | $0 |
| Wage / Income Gap (%) | 2,944 | 47.78% |
| Wage / Income Gap ($) | 2,944 | 52.22¢ per $1 |
| Gini / Inequality Index | 2,944 | 0.31 |
Earnings by Sex in East Hampton
Average Earnings in East Hampton are $49,028, $68,158 for men and $35,592 for women, a difference of 47.8%.
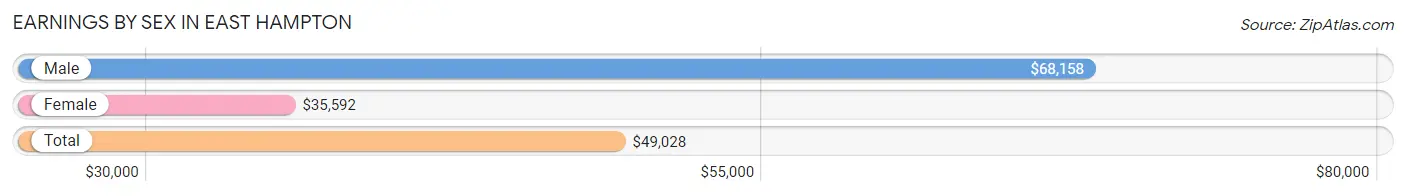
| Sex | Number | Average Earnings |
| Male | 936 (58.5%) | $68,158 |
| Female | 663 (41.5%) | $35,592 |
| Total | 1,599 (100.0%) | $49,028 |
Earnings by Sex by Income Bracket in East Hampton
The most common earnings brackets in East Hampton are $100,000+ for men (377 | 40.3%) and $25,000 to $29,999 for women (107 | 16.1%).
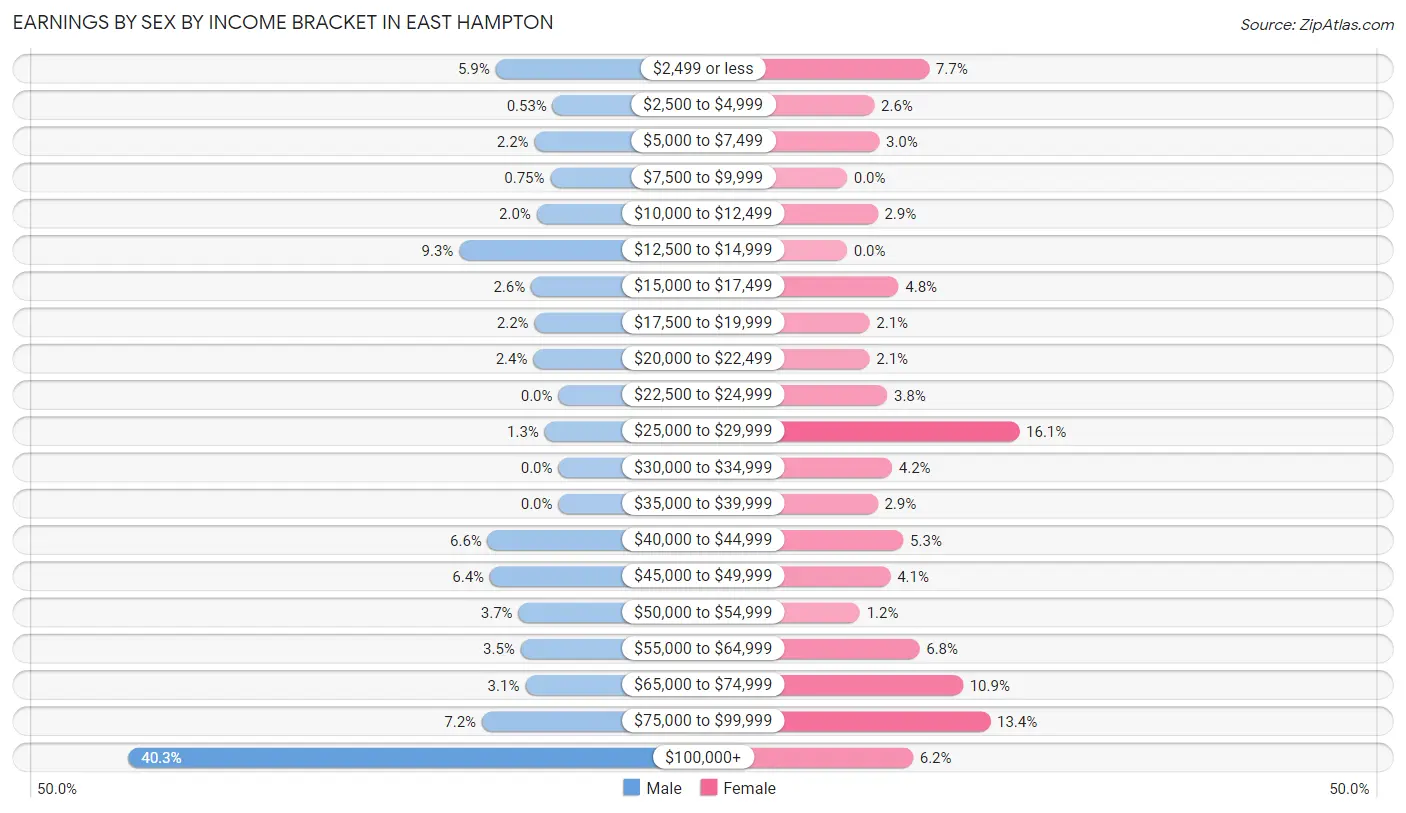
| Income | Male | Female |
| $2,499 or less | 55 (5.9%) | 51 (7.7%) |
| $2,500 to $4,999 | 5 (0.5%) | 17 (2.6%) |
| $5,000 to $7,499 | 21 (2.2%) | 20 (3.0%) |
| $7,500 to $9,999 | 7 (0.7%) | 0 (0.0%) |
| $10,000 to $12,499 | 19 (2.0%) | 19 (2.9%) |
| $12,500 to $14,999 | 87 (9.3%) | 0 (0.0%) |
| $15,000 to $17,499 | 24 (2.6%) | 32 (4.8%) |
| $17,500 to $19,999 | 21 (2.2%) | 14 (2.1%) |
| $20,000 to $22,499 | 22 (2.4%) | 14 (2.1%) |
| $22,500 to $24,999 | 0 (0.0%) | 25 (3.8%) |
| $25,000 to $29,999 | 12 (1.3%) | 107 (16.1%) |
| $30,000 to $34,999 | 0 (0.0%) | 28 (4.2%) |
| $35,000 to $39,999 | 0 (0.0%) | 19 (2.9%) |
| $40,000 to $44,999 | 62 (6.6%) | 35 (5.3%) |
| $45,000 to $49,999 | 60 (6.4%) | 27 (4.1%) |
| $50,000 to $54,999 | 35 (3.7%) | 8 (1.2%) |
| $55,000 to $64,999 | 33 (3.5%) | 45 (6.8%) |
| $65,000 to $74,999 | 29 (3.1%) | 72 (10.9%) |
| $75,000 to $99,999 | 67 (7.2%) | 89 (13.4%) |
| $100,000+ | 377 (40.3%) | 41 (6.2%) |
| Total | 936 (100.0%) | 663 (100.0%) |
Earnings by Sex by Educational Attainment in East Hampton
Average earnings in East Hampton are $97,895 for men and $53,281 for women, a difference of 45.6%. Men with an educational attainment of graduate degree enjoy the highest average annual earnings of $125,000, while those with high school diploma education earn the least with $40,458. Women with an educational attainment of graduate degree earn the most with the average annual earnings of $80,163, while those with college or associate's degree education have the smallest earnings of $41,364.
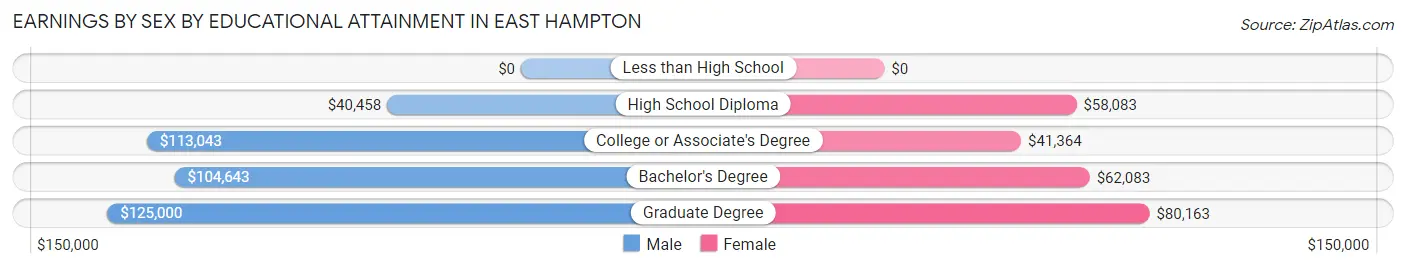
| Educational Attainment | Male Income | Female Income |
| Less than High School | - | - |
| High School Diploma | $40,458 | $58,083 |
| College or Associate's Degree | $113,043 | $41,364 |
| Bachelor's Degree | $104,643 | $62,083 |
| Graduate Degree | $125,000 | $80,163 |
| Total | $97,895 | $53,281 |
Family Income in East Hampton
Family Income Brackets in East Hampton
According to the East Hampton family income data, there are 237 families falling into the $100,000 to $149,999 income range, which is the most common income bracket and makes up 28.2% of all families.
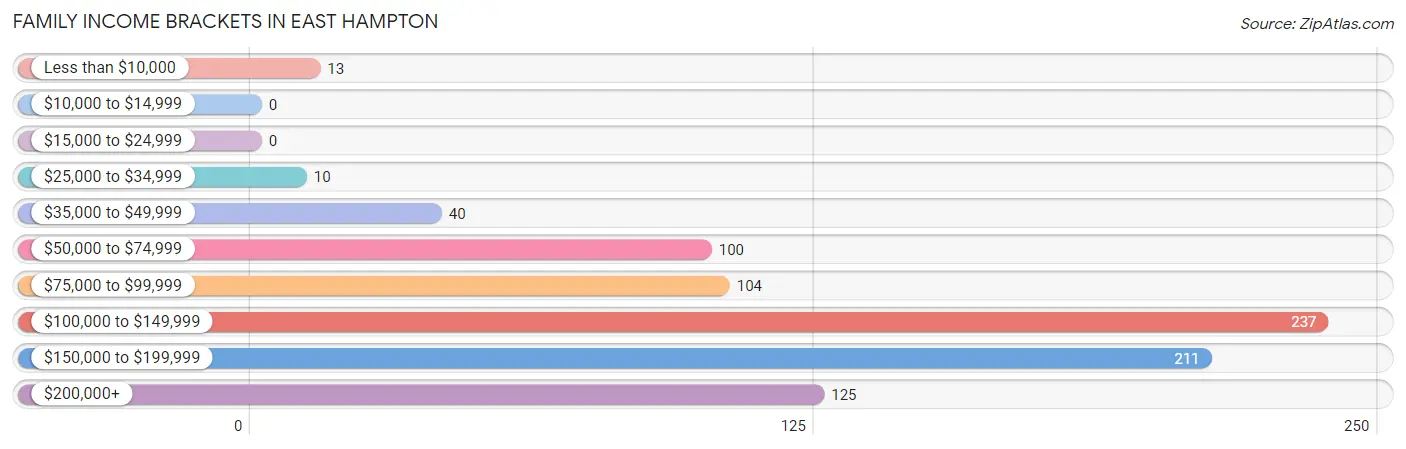
| Income Bracket | # Families | % Families |
| Less than $10,000 | 13 | 1.5% |
| $10,000 to $14,999 | 0 | 0.0% |
| $15,000 to $24,999 | 0 | 0.0% |
| $25,000 to $34,999 | 10 | 1.2% |
| $35,000 to $49,999 | 40 | 4.8% |
| $50,000 to $74,999 | 100 | 11.9% |
| $75,000 to $99,999 | 104 | 12.4% |
| $100,000 to $149,999 | 237 | 28.2% |
| $150,000 to $199,999 | 211 | 25.1% |
| $200,000+ | 125 | 14.9% |
Family Income by Famaliy Size in East Hampton
4-person families (228 | 27.1%) account for the highest median family income in East Hampton with $152,694 per family, while 2-person families (296 | 35.2%) have the highest median income of $51,094 per family member.
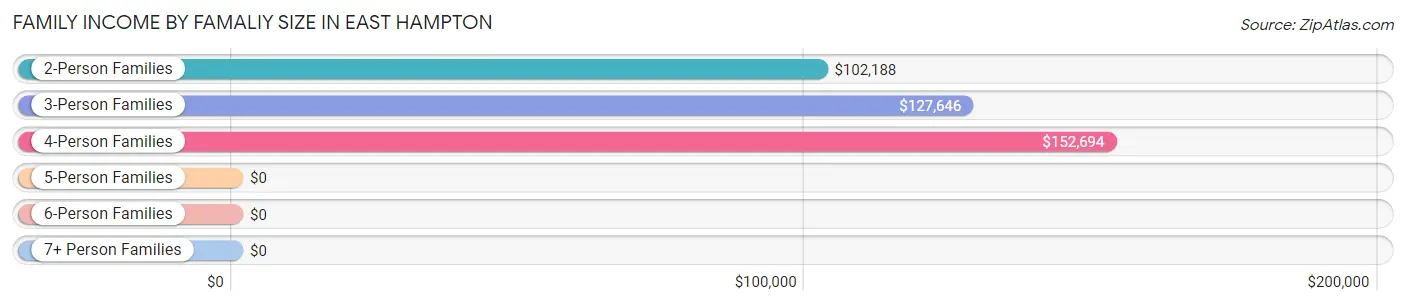
| Income Bracket | # Families | Median Income |
| 2-Person Families | 296 (35.2%) | $102,188 |
| 3-Person Families | 277 (33.0%) | $127,646 |
| 4-Person Families | 228 (27.1%) | $152,694 |
| 5-Person Families | 29 (3.5%) | $0 |
| 6-Person Families | 4 (0.5%) | $0 |
| 7+ Person Families | 6 (0.7%) | $0 |
| Total | 840 (100.0%) | $128,457 |
Family Income by Number of Earners in East Hampton
The median family income in East Hampton is $128,457, with families comprising 3+ earners (197) having the highest median family income of $154,008, while families with no earners (95) have the lowest median family income of $59,095, accounting for 23.4% and 11.3% of families, respectively.
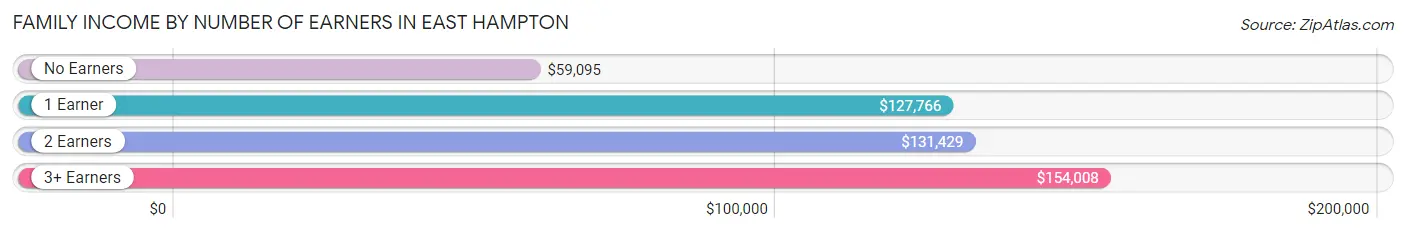
| Number of Earners | # Families | Median Income |
| No Earners | 95 (11.3%) | $59,095 |
| 1 Earner | 242 (28.8%) | $127,766 |
| 2 Earners | 306 (36.4%) | $131,429 |
| 3+ Earners | 197 (23.4%) | $154,008 |
| Total | 840 (100.0%) | $128,457 |
Household Income in East Hampton
Household Income Brackets in East Hampton
With 260 households falling in the category, the $100,000 to $149,999 income range is the most frequent in East Hampton, accounting for 25.4% of all households. In contrast, only 10 households (1.0%) fall into the $15,000 to $24,999 income bracket, making it the least populous group.
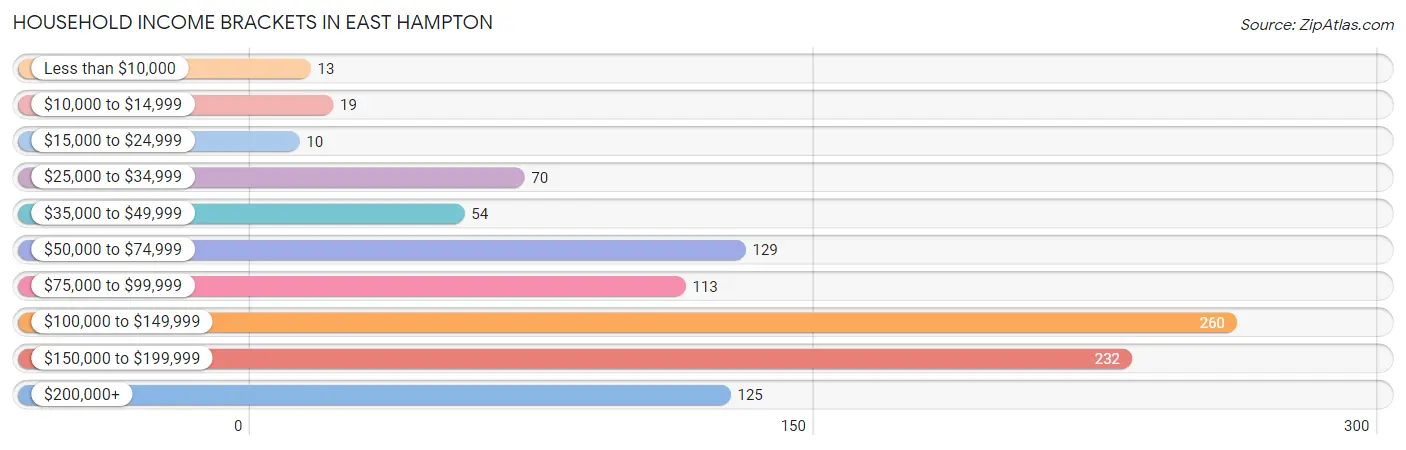
| Income Bracket | # Households | % Households |
| Less than $10,000 | 13 | 1.3% |
| $10,000 to $14,999 | 19 | 1.9% |
| $15,000 to $24,999 | 10 | 1.0% |
| $25,000 to $34,999 | 70 | 6.8% |
| $35,000 to $49,999 | 54 | 5.3% |
| $50,000 to $74,999 | 129 | 12.6% |
| $75,000 to $99,999 | 113 | 11.0% |
| $100,000 to $149,999 | 260 | 25.4% |
| $150,000 to $199,999 | 232 | 22.6% |
| $200,000+ | 125 | 12.2% |
Household Income by Householder Age in East Hampton
The median household income in East Hampton is $122,426, with the highest median household income of $152,961 found in the 45 to 64 years age bracket for the primary householder. A total of 450 households (43.9%) fall into this category.
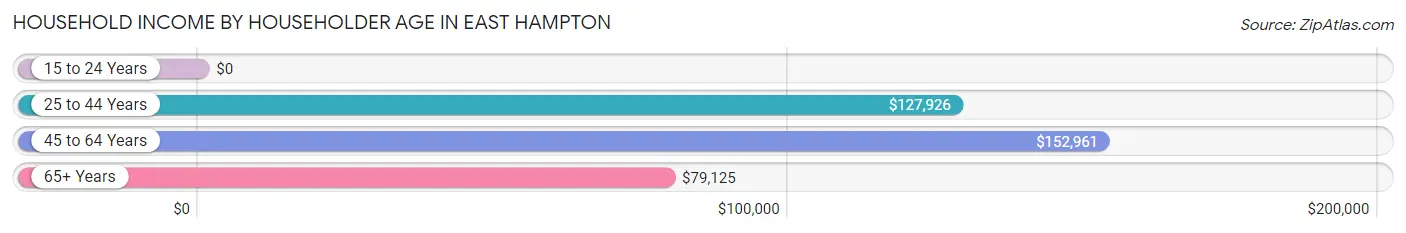
| Income Bracket | # Households | Median Income |
| 15 to 24 Years | 0 (0.0%) | $0 |
| 25 to 44 Years | 254 (24.8%) | $127,926 |
| 45 to 64 Years | 450 (43.9%) | $152,961 |
| 65+ Years | 321 (31.3%) | $79,125 |
| Total | 1,025 (100.0%) | $122,426 |
Poverty in East Hampton
Income Below Poverty by Sex and Age in East Hampton
With 5.2% poverty level for males and 3.4% for females among the residents of East Hampton, 6 to 11 year old males and 16 and 17 year old females are the most vulnerable to poverty, with 29 males (36.7%) and 8 females (21.6%) in their respective age groups living below the poverty level.
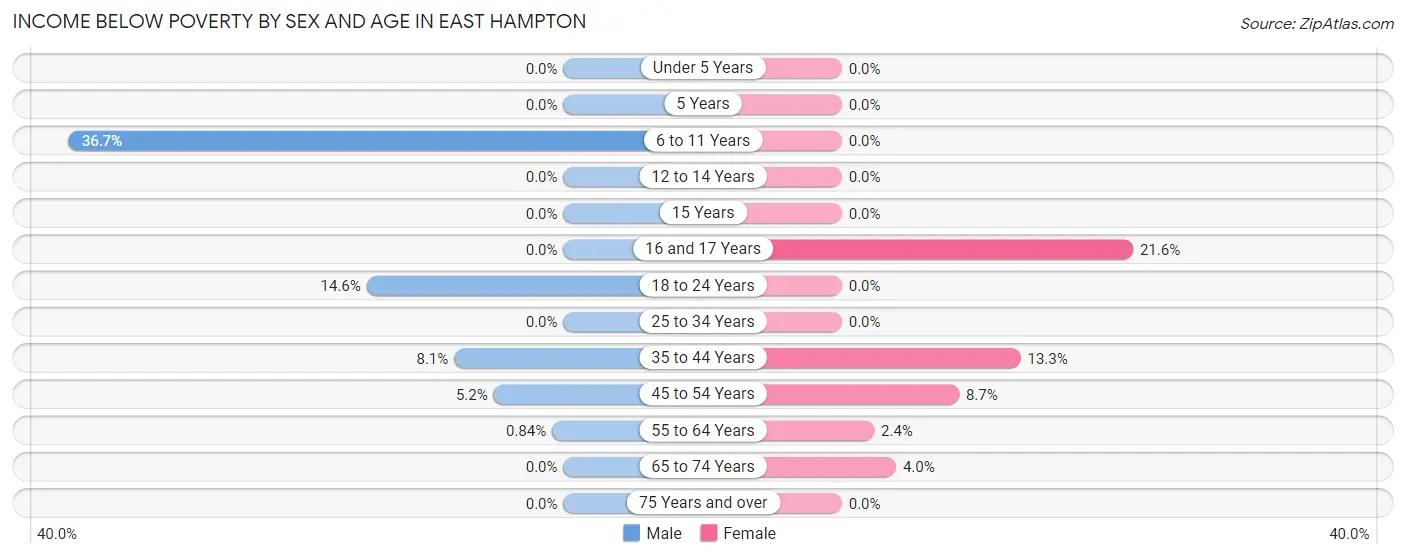
| Age Bracket | Male | Female |
| Under 5 Years | 0 (0.0%) | 0 (0.0%) |
| 5 Years | 0 (0.0%) | 0 (0.0%) |
| 6 to 11 Years | 29 (36.7%) | 0 (0.0%) |
| 12 to 14 Years | 0 (0.0%) | 0 (0.0%) |
| 15 Years | 0 (0.0%) | 0 (0.0%) |
| 16 and 17 Years | 0 (0.0%) | 8 (21.6%) |
| 18 to 24 Years | 13 (14.6%) | 0 (0.0%) |
| 25 to 34 Years | 0 (0.0%) | 0 (0.0%) |
| 35 to 44 Years | 15 (8.1%) | 13 (13.3%) |
| 45 to 54 Years | 13 (5.2%) | 16 (8.7%) |
| 55 to 64 Years | 2 (0.8%) | 5 (2.4%) |
| 65 to 74 Years | 0 (0.0%) | 10 (4.0%) |
| 75 Years and over | 0 (0.0%) | 0 (0.0%) |
| Total | 72 (5.2%) | 52 (3.4%) |
Income Above Poverty by Sex and Age in East Hampton
According to the poverty statistics in East Hampton, males aged under 5 years and females aged under 5 years are the age groups that are most secure financially, with 100.0% of males and 100.0% of females in these age groups living above the poverty line.
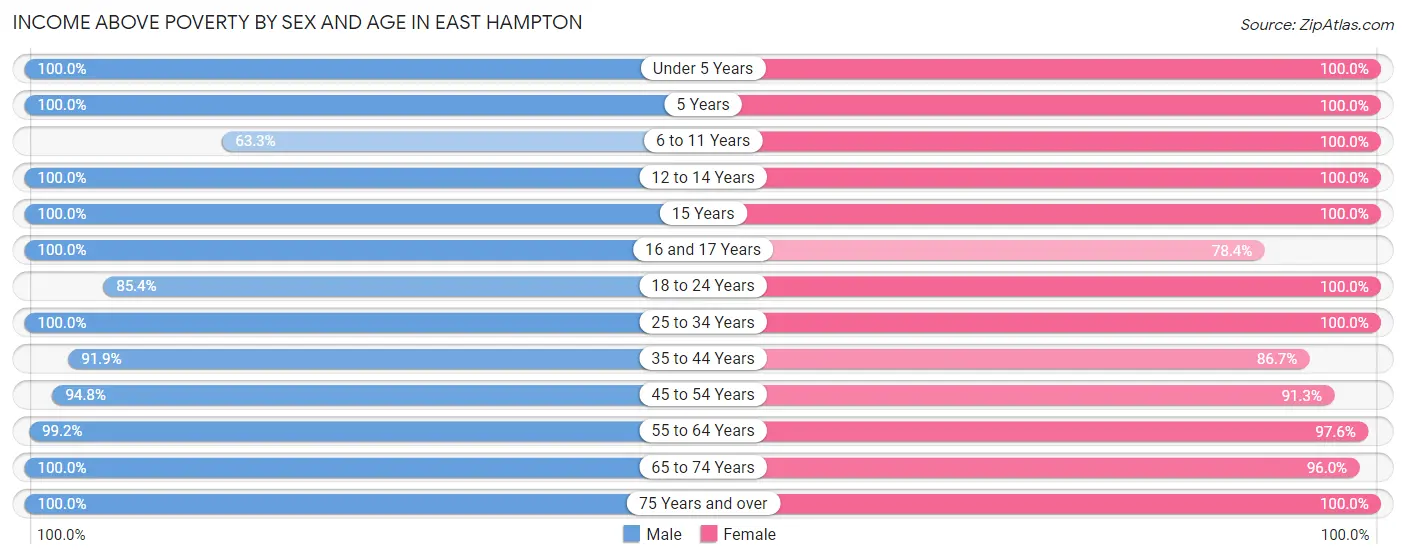
| Age Bracket | Male | Female |
| Under 5 Years | 18 (100.0%) | 214 (100.0%) |
| 5 Years | 13 (100.0%) | 15 (100.0%) |
| 6 to 11 Years | 50 (63.3%) | 39 (100.0%) |
| 12 to 14 Years | 46 (100.0%) | 53 (100.0%) |
| 15 Years | 26 (100.0%) | 10 (100.0%) |
| 16 and 17 Years | 94 (100.0%) | 29 (78.4%) |
| 18 to 24 Years | 76 (85.4%) | 159 (100.0%) |
| 25 to 34 Years | 106 (100.0%) | 184 (100.0%) |
| 35 to 44 Years | 170 (91.9%) | 85 (86.7%) |
| 45 to 54 Years | 238 (94.8%) | 168 (91.3%) |
| 55 to 64 Years | 235 (99.2%) | 203 (97.6%) |
| 65 to 74 Years | 207 (100.0%) | 239 (96.0%) |
| 75 Years and over | 27 (100.0%) | 80 (100.0%) |
| Total | 1,306 (94.8%) | 1,478 (96.6%) |
Income Below Poverty Among Married-Couple Families in East Hampton
The poverty statistics for married-couple families in East Hampton show that 1.7% or 13 of the total 750 families live below the poverty line. Families with 1 or 2 children have the highest poverty rate of 3.5%, comprising of 13 families. On the other hand, families with no children have the lowest poverty rate of 0.0%, which includes 0 families.
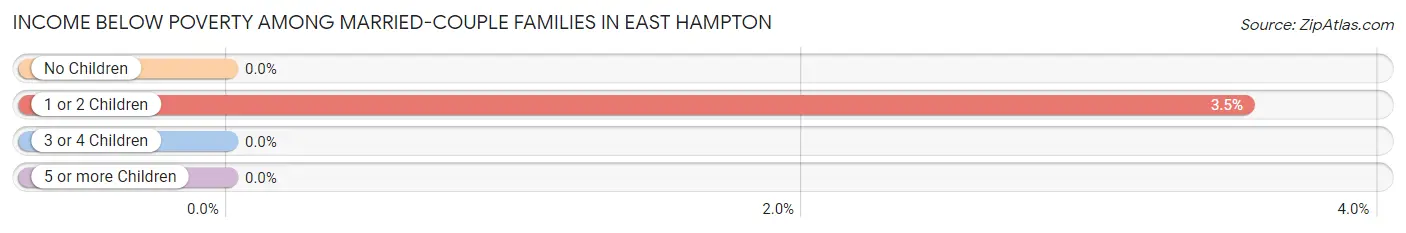
| Children | Above Poverty | Below Poverty |
| No Children | 373 (100.0%) | 0 (0.0%) |
| 1 or 2 Children | 354 (96.5%) | 13 (3.5%) |
| 3 or 4 Children | 10 (100.0%) | 0 (0.0%) |
| 5 or more Children | 0 (0.0%) | 0 (0.0%) |
| Total | 737 (98.3%) | 13 (1.7%) |
Income Below Poverty Among Single-Parent Households in East Hampton
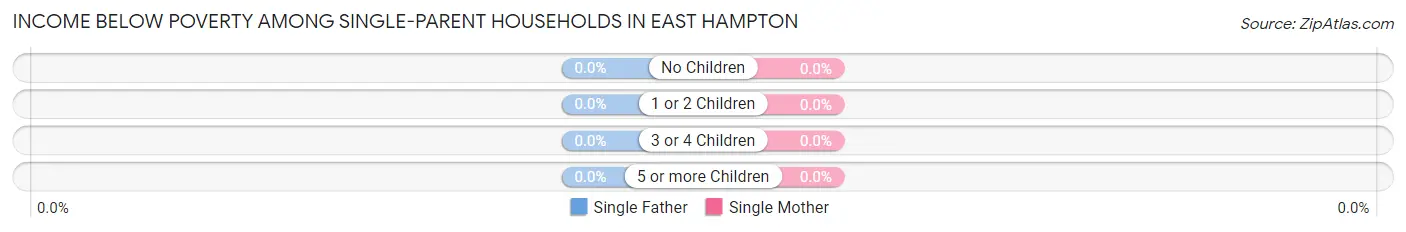
| Children | Single Father | Single Mother |
| No Children | 0 (0.0%) | 0 (0.0%) |
| 1 or 2 Children | 0 (0.0%) | 0 (0.0%) |
| 3 or 4 Children | 0 (0.0%) | 0 (0.0%) |
| 5 or more Children | 0 (0.0%) | 0 (0.0%) |
| Total | 0 (0.0%) | 0 (0.0%) |
Income Below Poverty Among Married-Couple vs Single-Parent Households in East Hampton
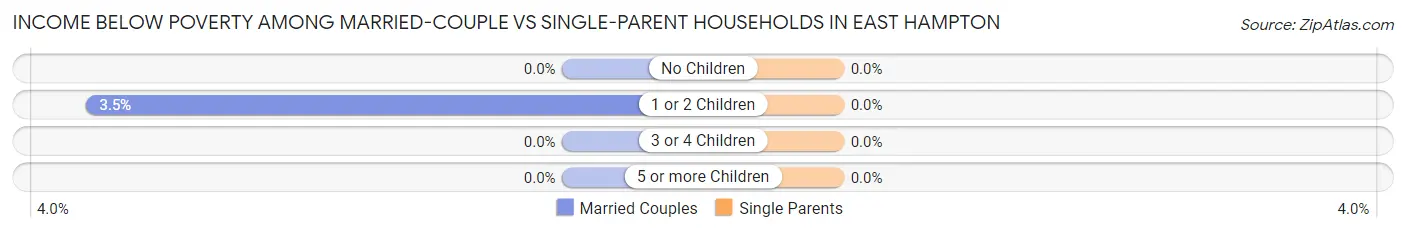
| Children | Married-Couple Families | Single-Parent Households |
| No Children | 0 (0.0%) | 0 (0.0%) |
| 1 or 2 Children | 13 (3.5%) | 0 (0.0%) |
| 3 or 4 Children | 0 (0.0%) | 0 (0.0%) |
| 5 or more Children | 0 (0.0%) | 0 (0.0%) |
| Total | 13 (1.7%) | 0 (0.0%) |
Race in East Hampton
The most populous races in East Hampton are White / Caucasian (2,877 | 97.7%), Hispanic or Latino (142 | 4.8%), and Two or more Races (53 | 1.8%).
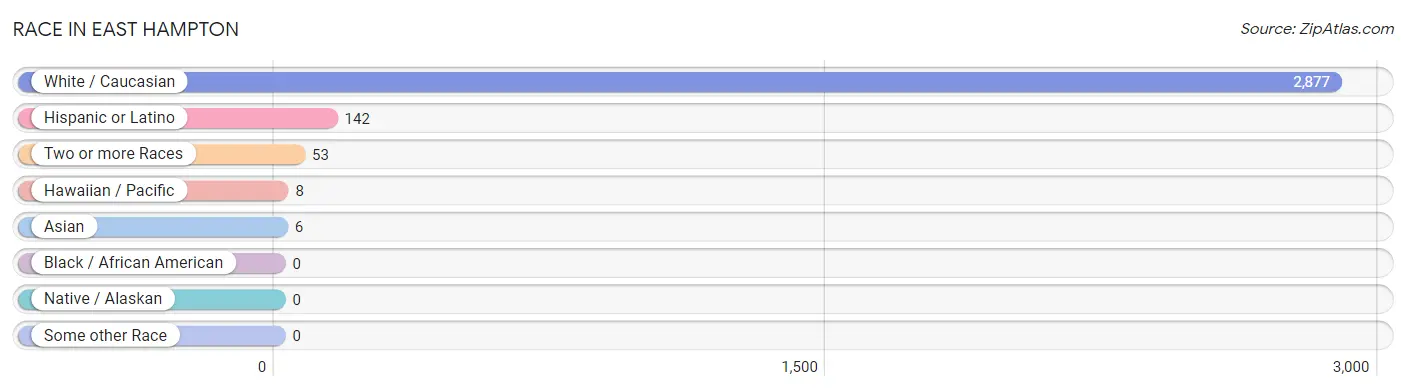
| Race | # Population | % Population |
| Asian | 6 | 0.2% |
| Black / African American | 0 | 0.0% |
| Hawaiian / Pacific | 8 | 0.3% |
| Hispanic or Latino | 142 | 4.8% |
| Native / Alaskan | 0 | 0.0% |
| White / Caucasian | 2,877 | 97.7% |
| Two or more Races | 53 | 1.8% |
| Some other Race | 0 | 0.0% |
| Total | 2,944 | 100.0% |
Ancestry in East Hampton
The most populous ancestries reported in East Hampton are Irish (531 | 18.0%), Polish (512 | 17.4%), Italian (508 | 17.3%), French Canadian (449 | 15.2%), and European (369 | 12.5%), together accounting for 80.5% of all East Hampton residents.
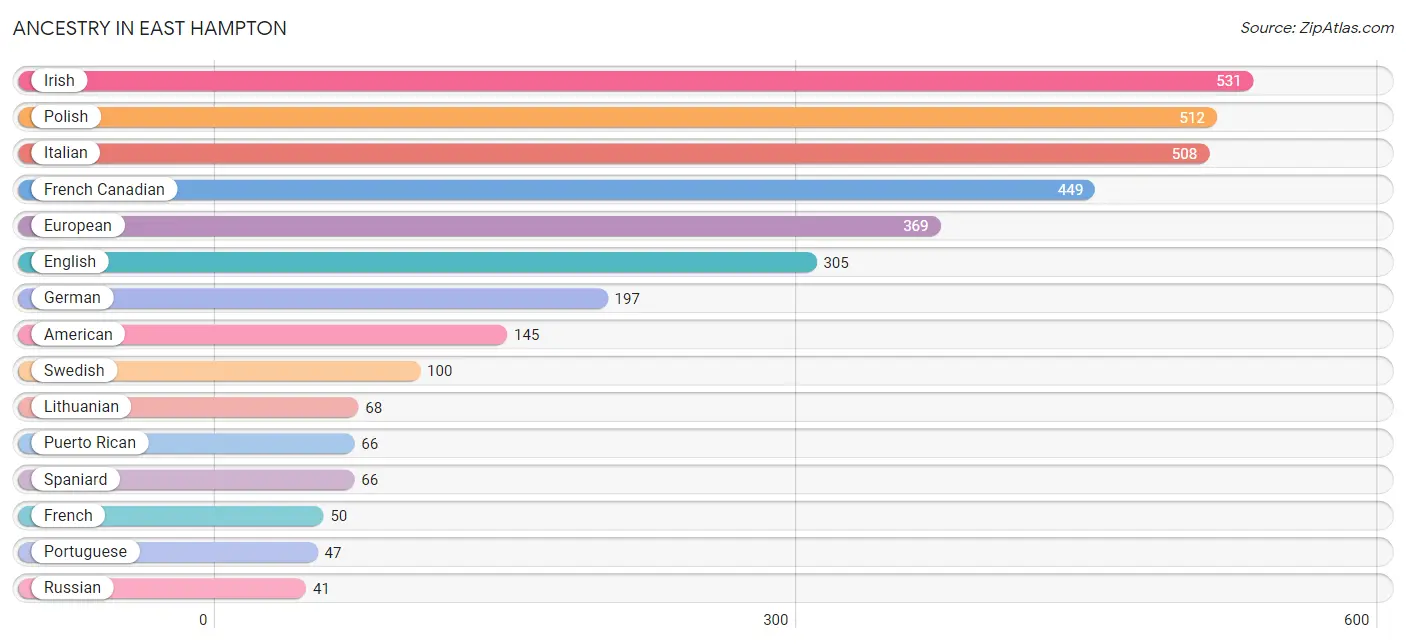
| Ancestry | # Population | % Population |
| American | 145 | 4.9% |
| British | 7 | 0.2% |
| Canadian | 9 | 0.3% |
| Colombian | 10 | 0.3% |
| Czech | 9 | 0.3% |
| Dutch | 40 | 1.4% |
| Eastern European | 5 | 0.2% |
| English | 305 | 10.4% |
| European | 369 | 12.5% |
| Finnish | 11 | 0.4% |
| French | 50 | 1.7% |
| French Canadian | 449 | 15.2% |
| German | 197 | 6.7% |
| Greek | 10 | 0.3% |
| Indian (Asian) | 6 | 0.2% |
| Irish | 531 | 18.0% |
| Italian | 508 | 17.3% |
| Lithuanian | 68 | 2.3% |
| Native Hawaiian | 8 | 0.3% |
| Northern European | 8 | 0.3% |
| Norwegian | 11 | 0.4% |
| Pennsylvania German | 10 | 0.3% |
| Polish | 512 | 17.4% |
| Portuguese | 47 | 1.6% |
| Puerto Rican | 66 | 2.2% |
| Romanian | 27 | 0.9% |
| Russian | 41 | 1.4% |
| Samoan | 8 | 0.3% |
| Scotch-Irish | 25 | 0.9% |
| Scottish | 37 | 1.3% |
| Slovak | 20 | 0.7% |
| South American | 10 | 0.3% |
| Spaniard | 66 | 2.2% |
| Swedish | 100 | 3.4% |
| Ukrainian | 36 | 1.2% | View All 35 Rows |
Immigrants in East Hampton
The most numerous immigrant groups reported in East Hampton came from Eastern Europe (61 | 2.1%), Europe (61 | 2.1%), Poland (61 | 2.1%), and Canada (35 | 1.2%), together accounting for 7.4% of all East Hampton residents.
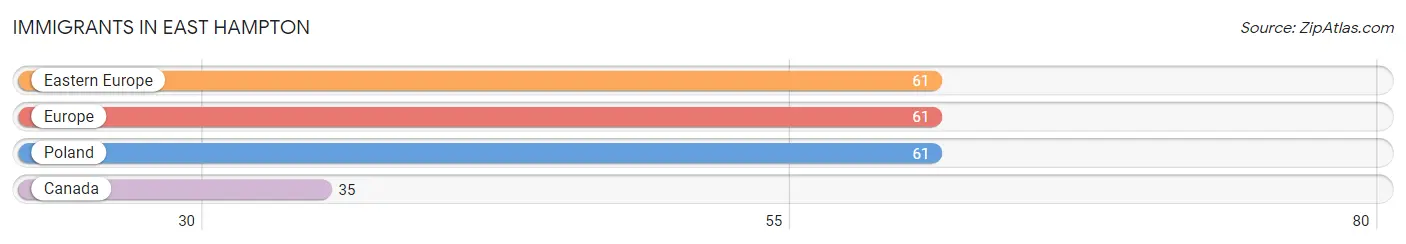
| Immigration Origin | # Population | % Population |
| Canada | 35 | 1.2% |
| Eastern Europe | 61 | 2.1% |
| Europe | 61 | 2.1% |
| Poland | 61 | 2.1% | View All 4 Rows |
Sex and Age in East Hampton
Sex and Age in East Hampton
The most populous age groups in East Hampton are 50 to 54 Years (218 | 15.8%) for men and Under 5 Years (214 | 13.7%) for women.
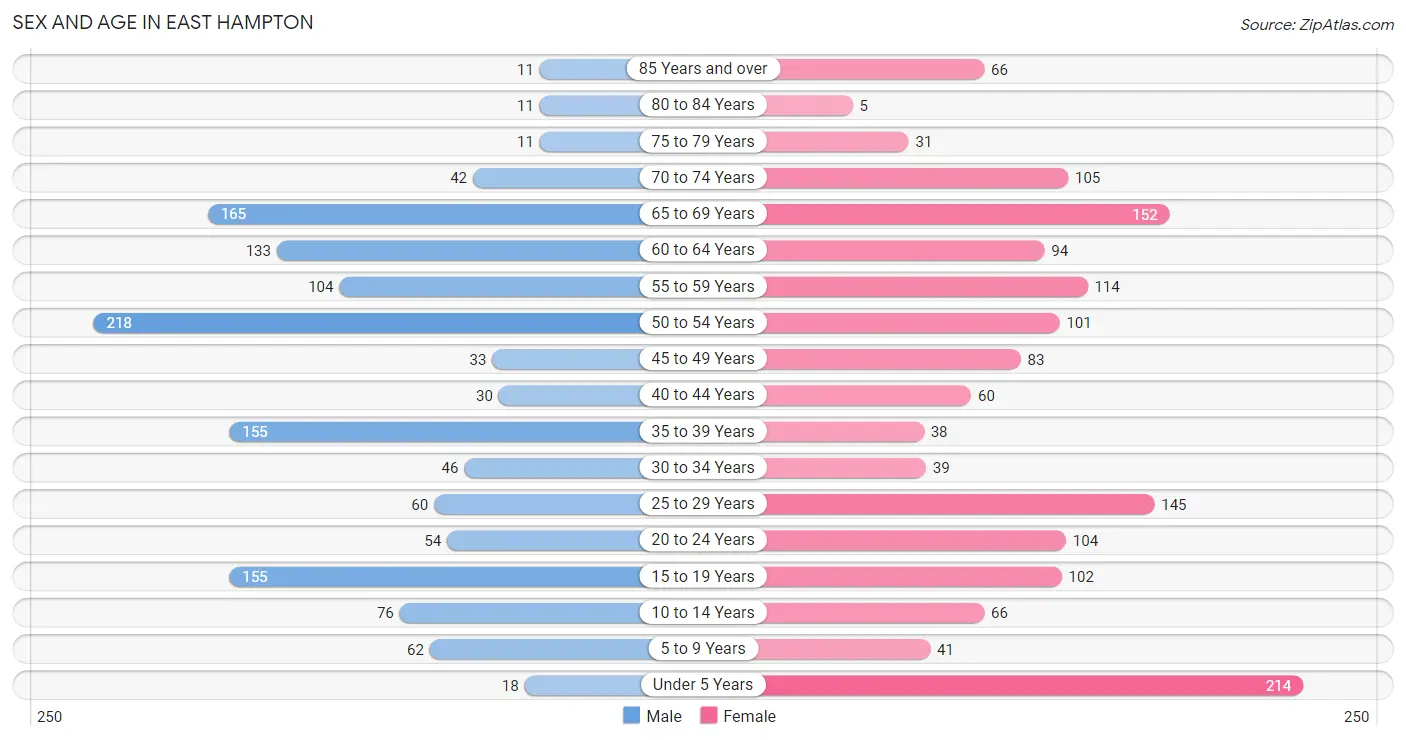
| Age Bracket | Male | Female |
| Under 5 Years | 18 (1.3%) | 214 (13.7%) |
| 5 to 9 Years | 62 (4.5%) | 41 (2.6%) |
| 10 to 14 Years | 76 (5.5%) | 66 (4.2%) |
| 15 to 19 Years | 155 (11.2%) | 102 (6.5%) |
| 20 to 24 Years | 54 (3.9%) | 104 (6.7%) |
| 25 to 29 Years | 60 (4.3%) | 145 (9.3%) |
| 30 to 34 Years | 46 (3.3%) | 39 (2.5%) |
| 35 to 39 Years | 155 (11.2%) | 38 (2.4%) |
| 40 to 44 Years | 30 (2.2%) | 60 (3.8%) |
| 45 to 49 Years | 33 (2.4%) | 83 (5.3%) |
| 50 to 54 Years | 218 (15.8%) | 101 (6.5%) |
| 55 to 59 Years | 104 (7.5%) | 114 (7.3%) |
| 60 to 64 Years | 133 (9.6%) | 94 (6.0%) |
| 65 to 69 Years | 165 (11.9%) | 152 (9.7%) |
| 70 to 74 Years | 42 (3.0%) | 105 (6.7%) |
| 75 to 79 Years | 11 (0.8%) | 31 (2.0%) |
| 80 to 84 Years | 11 (0.8%) | 5 (0.3%) |
| 85 Years and over | 11 (0.8%) | 66 (4.2%) |
| Total | 1,384 (100.0%) | 1,560 (100.0%) |
Families and Households in East Hampton
Median Family Size in East Hampton
The median family size in East Hampton is 3.13 persons per family, with single female/mother families (43 | 5.1%) accounting for the largest median family size of 3.58 persons per family. On the other hand, single male/father families (47 | 5.6%) represent the smallest median family size with 2.70 persons per family.
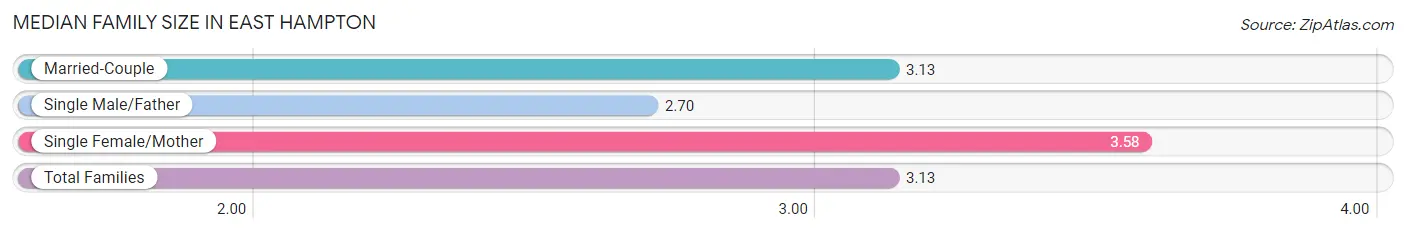
| Family Type | # Families | Family Size |
| Married-Couple | 750 (89.3%) | 3.13 |
| Single Male/Father | 47 (5.6%) | 2.70 |
| Single Female/Mother | 43 (5.1%) | 3.58 |
| Total Families | 840 (100.0%) | 3.13 |
Median Household Size in East Hampton
The median household size in East Hampton is 2.83 persons per household, with single female/mother households (43 | 4.2%) accounting for the largest median household size of 3.81 persons per household. non-family households (185 | 18.0%) represent the smallest median household size with 1.22 persons per household.
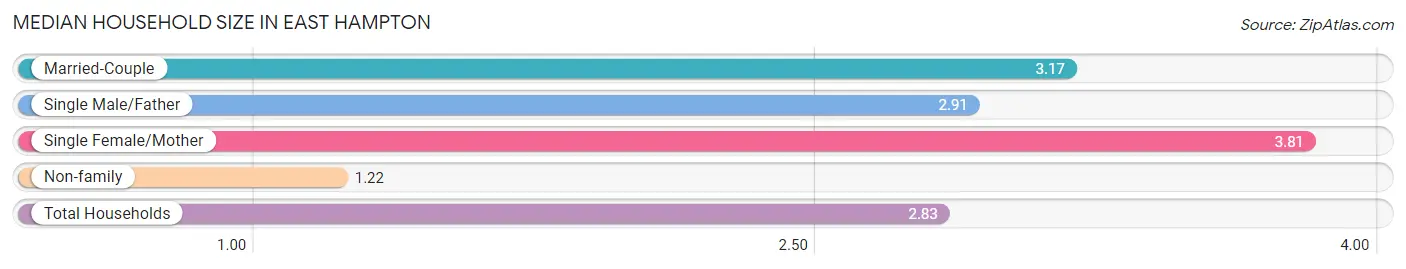
| Household Type | # Households | Household Size |
| Married-Couple | 750 (73.2%) | 3.17 |
| Single Male/Father | 47 (4.6%) | 2.91 |
| Single Female/Mother | 43 (4.2%) | 3.81 |
| Non-family | 185 (18.0%) | 1.22 |
| Total Households | 1,025 (100.0%) | 2.83 |
Household Size by Marriage Status in East Hampton
Out of a total of 1,025 households in East Hampton, 840 (82.0%) are family households, while 185 (18.0%) are nonfamily households. The most numerous type of family households are 3-person households, comprising 287, and the most common type of nonfamily households are 1-person households, comprising 153.
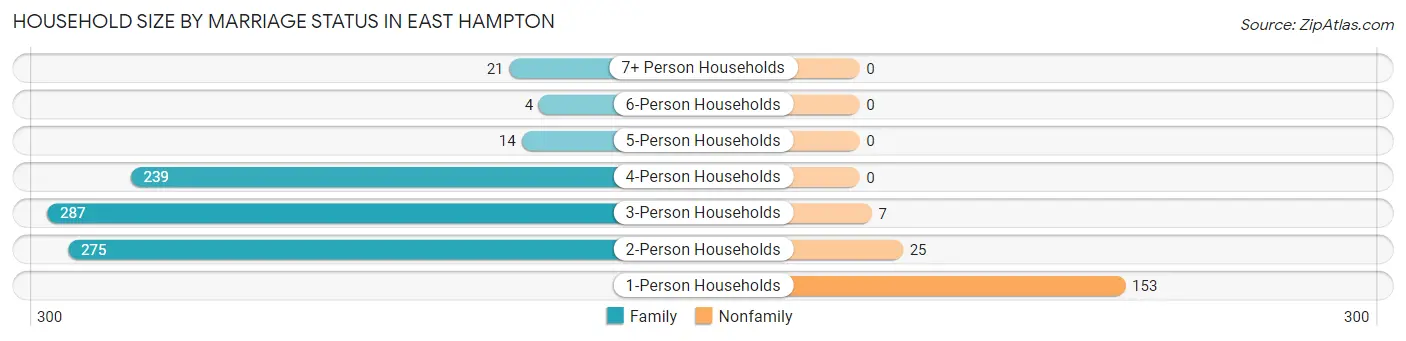
| Household Size | Family Households | Nonfamily Households |
| 1-Person Households | - | 153 (14.9%) |
| 2-Person Households | 275 (26.8%) | 25 (2.4%) |
| 3-Person Households | 287 (28.0%) | 7 (0.7%) |
| 4-Person Households | 239 (23.3%) | 0 (0.0%) |
| 5-Person Households | 14 (1.4%) | 0 (0.0%) |
| 6-Person Households | 4 (0.4%) | 0 (0.0%) |
| 7+ Person Households | 21 (2.1%) | 0 (0.0%) |
| Total | 840 (82.0%) | 185 (18.0%) |
Female Fertility in East Hampton
Fertility by Age in East Hampton
| Age Bracket | Women with Births | Births / 1,000 Women |
| 15 to 19 years | 0 (0.0%) | 0.0 |
| 20 to 34 years | 0 (0.0%) | 0.0 |
| 35 to 50 years | 0 (0.0%) | 0.0 |
| Total | 0 (0.0%) | 0.0 |
Fertility by Age by Marriage Status in East Hampton
| Age Bracket | Married | Unmarried |
| 15 to 19 years | 0 (0.0%) | 0 (0.0%) |
| 20 to 34 years | 0 (0.0%) | 0 (0.0%) |
| 35 to 50 years | 0 (0.0%) | 0 (0.0%) |
| Total | 0 (0.0%) | 0 (0.0%) |
Fertility by Education in East Hampton
| Educational Attainment | Women with Births | Births / 1,000 Women |
| Less than High School | 0 (0.0%) | 0.0 |
| High School Diploma | 0 (0.0%) | 0.0 |
| College or Associate's Degree | 0 (0.0%) | 0.0 |
| Bachelor's Degree | 0 (0.0%) | 0.0 |
| Graduate Degree | 0 (0.0%) | 0.0 |
| Total | 0 (0.0%) | 0.0 |
Fertility by Education by Marriage Status in East Hampton
| Educational Attainment | Married | Unmarried |
| Less than High School | 0 (0.0%) | 0 (0.0%) |
| High School Diploma | 0 (0.0%) | 0 (0.0%) |
| College or Associate's Degree | 0 (0.0%) | 0 (0.0%) |
| Bachelor's Degree | 0 (0.0%) | 0 (0.0%) |
| Graduate Degree | 0 (0.0%) | 0 (0.0%) |
| Total | 0 (0.0%) | 0 (0.0%) |
Employment Characteristics in East Hampton
Employment by Class of Employer in East Hampton
Among the 1,444 employed individuals in East Hampton, private company employees (885 | 61.3%), self-employed (not incorporated) (168 | 11.6%), and not-for-profit organizations (141 | 9.8%) make up the most common classes of employment.
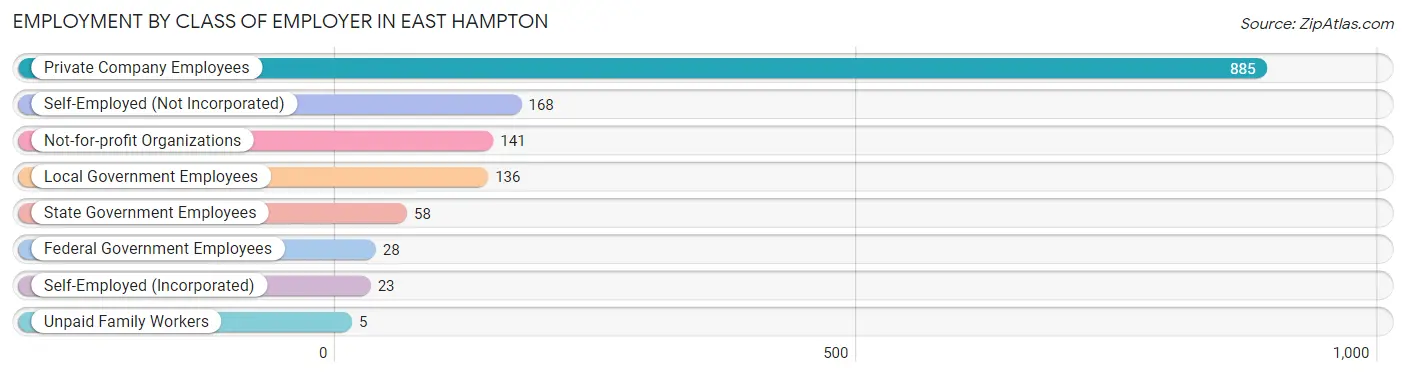
| Employer Class | # Employees | % Employees |
| Private Company Employees | 885 | 61.3% |
| Self-Employed (Incorporated) | 23 | 1.6% |
| Self-Employed (Not Incorporated) | 168 | 11.6% |
| Not-for-profit Organizations | 141 | 9.8% |
| Local Government Employees | 136 | 9.4% |
| State Government Employees | 58 | 4.0% |
| Federal Government Employees | 28 | 1.9% |
| Unpaid Family Workers | 5 | 0.4% |
| Total | 1,444 | 100.0% |
Employment Status by Age in East Hampton
According to the labor force statistics for East Hampton, out of the total population over 16 years of age (2,431), 62.9% or 1,529 individuals are in the labor force, with 4.5% or 69 of them unemployed. The age group with the highest labor force participation rate is 30 to 34 years, with 100.0% or 85 individuals in the labor force. Within the labor force, the 25 to 29 years age range has the highest percentage of unemployed individuals, with 12.9% or 12 of them being unemployed.
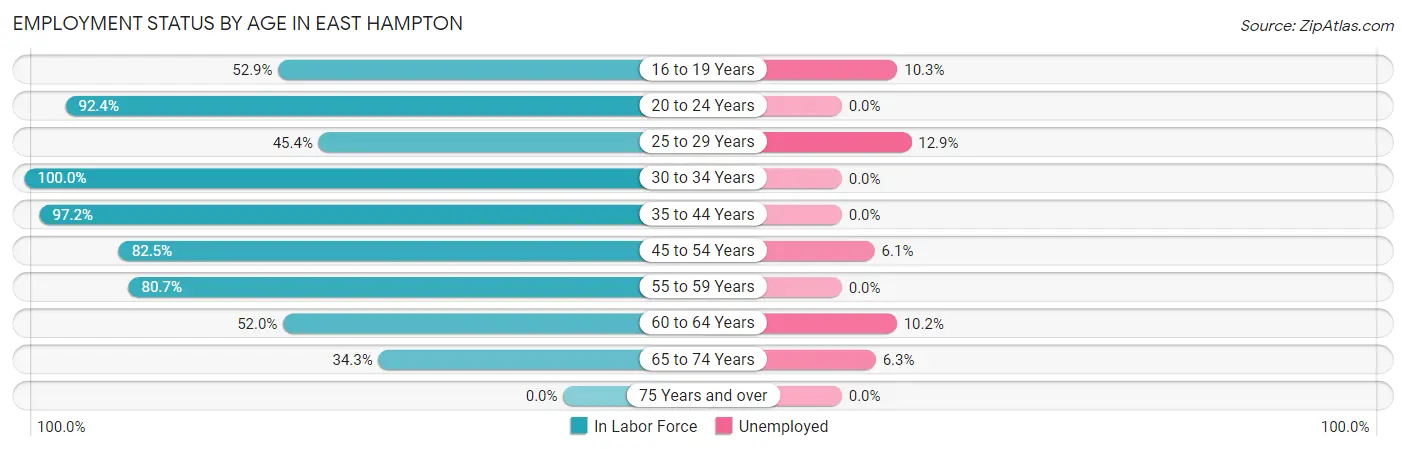
| Age Bracket | In Labor Force | Unemployed |
| 16 to 19 Years | 117 (52.9%) | 12 (10.3%) |
| 20 to 24 Years | 146 (92.4%) | 0 (0.0%) |
| 25 to 29 Years | 93 (45.4%) | 12 (12.9%) |
| 30 to 34 Years | 85 (100.0%) | 0 (0.0%) |
| 35 to 44 Years | 275 (97.2%) | 0 (0.0%) |
| 45 to 54 Years | 359 (82.5%) | 22 (6.1%) |
| 55 to 59 Years | 176 (80.7%) | 0 (0.0%) |
| 60 to 64 Years | 118 (52.0%) | 12 (10.2%) |
| 65 to 74 Years | 159 (34.3%) | 10 (6.3%) |
| 75 Years and over | 0 (0.0%) | 0 (0.0%) |
| Total | 1,529 (62.9%) | 69 (4.5%) |
Employment Status by Educational Attainment in East Hampton
According to labor force statistics for East Hampton, 76.1% of individuals (1,106) out of the total population between 25 and 64 years of age (1,453) are in the labor force, with 4.2% or 46 of them being unemployed. The group with the highest labor force participation rate are those with the educational attainment of bachelor's degree or higher, with 88.4% or 449 individuals in the labor force. Within the labor force, individuals with high school diploma education have the highest percentage of unemployment, with 6.0% or 12 of them being unemployed.
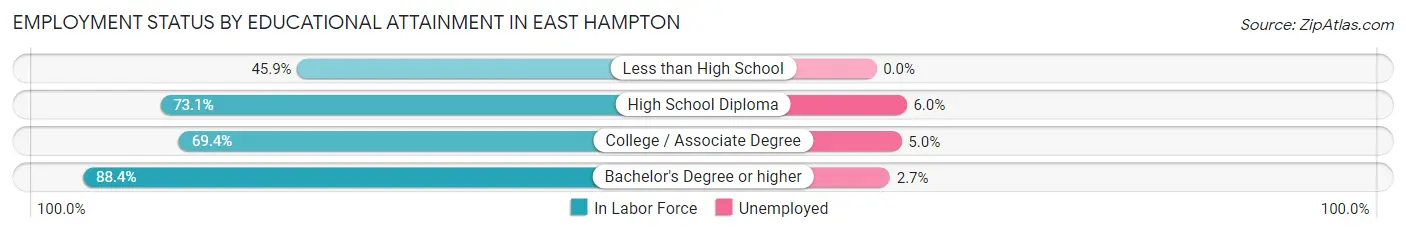
| Educational Attainment | In Labor Force | Unemployed |
| Less than High School | 17 (45.9%) | 0 (0.0%) |
| High School Diploma | 201 (73.1%) | 16 (6.0%) |
| College / Associate Degree | 439 (69.4%) | 32 (5.0%) |
| Bachelor's Degree or higher | 449 (88.4%) | 14 (2.7%) |
| Total | 1,106 (76.1%) | 61 (4.2%) |
Employment Occupations by Sex in East Hampton
Management, Business, Science and Arts Occupations
The most common Management, Business, Science and Arts occupations in East Hampton are Community & Social Service (183 | 12.5%), Education Instruction & Library (147 | 10.1%), Computers, Engineering & Science (116 | 8.0%), Computers & Mathematics (79 | 5.4%), and Management (71 | 4.9%).
Management, Business, Science and Arts Occupations by Sex
Within the Management, Business, Science and Arts occupations in East Hampton, the most male-oriented occupations are Computers, Engineering & Science (100.0%), Computers & Mathematics (100.0%), and Architecture & Engineering (100.0%), while the most female-oriented occupations are Education, Arts & Media (100.0%), Education Instruction & Library (93.2%), and Community & Social Service (86.9%).
| Occupation | Male | Female |
| Management | 18 (25.4%) | 53 (74.7%) |
| Business & Financial | 57 (91.9%) | 5 (8.1%) |
| Computers, Engineering & Science | 116 (100.0%) | 0 (0.0%) |
| Computers & Mathematics | 79 (100.0%) | 0 (0.0%) |
| Architecture & Engineering | 23 (100.0%) | 0 (0.0%) |
| Life, Physical & Social Science | 14 (100.0%) | 0 (0.0%) |
| Community & Social Service | 24 (13.1%) | 159 (86.9%) |
| Education, Arts & Media | 0 (0.0%) | 11 (100.0%) |
| Legal Services & Support | 0 (0.0%) | 0 (0.0%) |
| Education Instruction & Library | 10 (6.8%) | 137 (93.2%) |
| Arts, Media & Entertainment | 14 (56.0%) | 11 (44.0%) |
| Health Diagnosing & Treating | 9 (17.6%) | 42 (82.4%) |
| Health Technologists | 9 (18.8%) | 39 (81.2%) |
| Total (Category) | 224 (46.4%) | 259 (53.6%) |
| Total (Overall) | 855 (58.6%) | 605 (41.4%) |
Services Occupations
The most common Services occupations in East Hampton are Food Preparation & Serving (171 | 11.7%), Healthcare Support (42 | 2.9%), Cleaning & Maintenance (32 | 2.2%), Security & Protection (20 | 1.4%), and Law Enforcement (20 | 1.4%).
Services Occupations by Sex
Within the Services occupations in East Hampton, the most male-oriented occupations are Security & Protection (100.0%), Law Enforcement (100.0%), and Cleaning & Maintenance (68.8%), while the most female-oriented occupations are Healthcare Support (100.0%), Personal Care & Service (100.0%), and Food Preparation & Serving (57.3%).
| Occupation | Male | Female |
| Healthcare Support | 0 (0.0%) | 42 (100.0%) |
| Security & Protection | 20 (100.0%) | 0 (0.0%) |
| Firefighting & Prevention | 0 (0.0%) | 0 (0.0%) |
| Law Enforcement | 20 (100.0%) | 0 (0.0%) |
| Food Preparation & Serving | 73 (42.7%) | 98 (57.3%) |
| Cleaning & Maintenance | 22 (68.8%) | 10 (31.2%) |
| Personal Care & Service | 0 (0.0%) | 14 (100.0%) |
| Total (Category) | 115 (41.2%) | 164 (58.8%) |
| Total (Overall) | 855 (58.6%) | 605 (41.4%) |
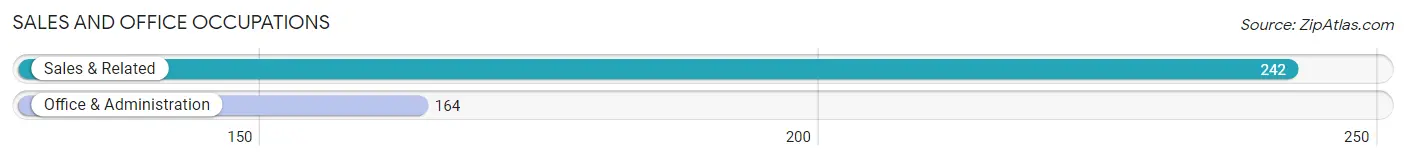
Sales and Office Occupations
The most common Sales and Office occupations in East Hampton are Sales & Related (242 | 16.6%), and Office & Administration (164 | 11.2%).
Sales and Office Occupations by Sex
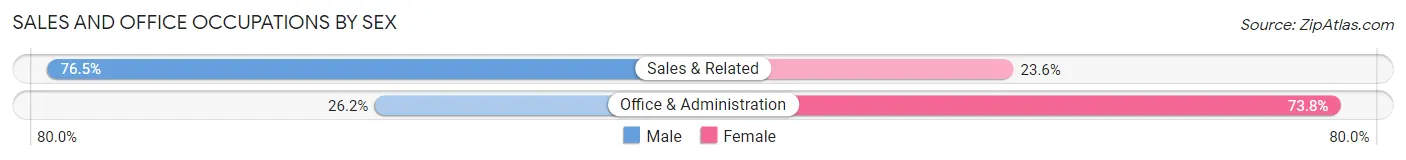
| Occupation | Male | Female |
| Sales & Related | 185 (76.4%) | 57 (23.5%) |
| Office & Administration | 43 (26.2%) | 121 (73.8%) |
| Total (Category) | 228 (56.2%) | 178 (43.8%) |
| Total (Overall) | 855 (58.6%) | 605 (41.4%) |
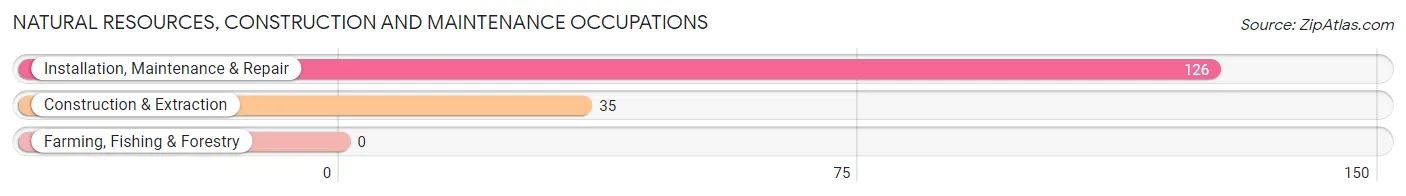
Natural Resources, Construction and Maintenance Occupations
The most common Natural Resources, Construction and Maintenance occupations in East Hampton are Installation, Maintenance & Repair (126 | 8.6%), and Construction & Extraction (35 | 2.4%).
Natural Resources, Construction and Maintenance Occupations by Sex
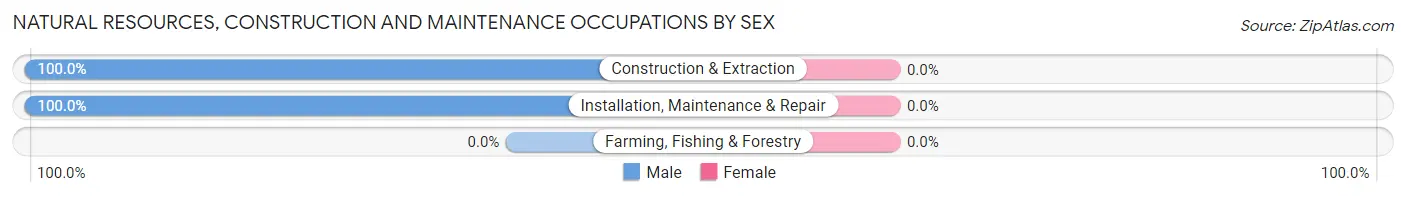
| Occupation | Male | Female |
| Farming, Fishing & Forestry | 0 (0.0%) | 0 (0.0%) |
| Construction & Extraction | 35 (100.0%) | 0 (0.0%) |
| Installation, Maintenance & Repair | 126 (100.0%) | 0 (0.0%) |
| Total (Category) | 161 (100.0%) | 0 (0.0%) |
| Total (Overall) | 855 (58.6%) | 605 (41.4%) |
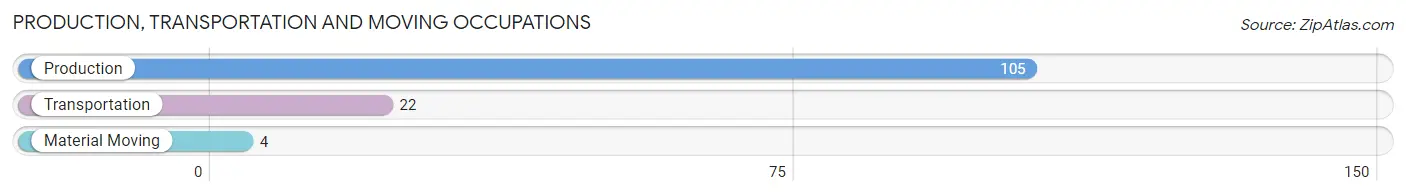
Production, Transportation and Moving Occupations
The most common Production, Transportation and Moving occupations in East Hampton are Production (105 | 7.2%), Transportation (22 | 1.5%), and Material Moving (4 | 0.3%).
Production, Transportation and Moving Occupations by Sex
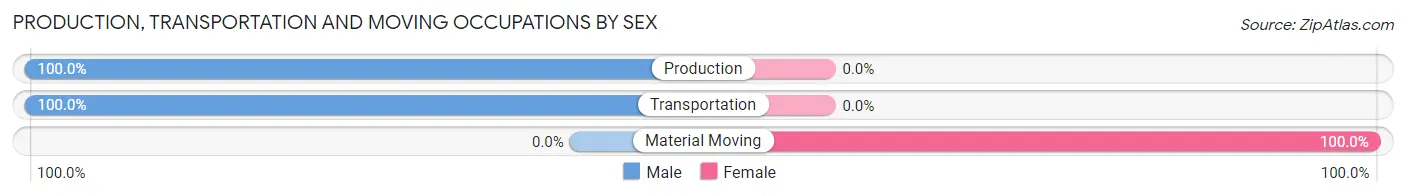
| Occupation | Male | Female |
| Production | 105 (100.0%) | 0 (0.0%) |
| Transportation | 22 (100.0%) | 0 (0.0%) |
| Material Moving | 0 (0.0%) | 4 (100.0%) |
| Total (Category) | 127 (97.0%) | 4 (3.0%) |
| Total (Overall) | 855 (58.6%) | 605 (41.4%) |
Employment Industries by Sex in East Hampton
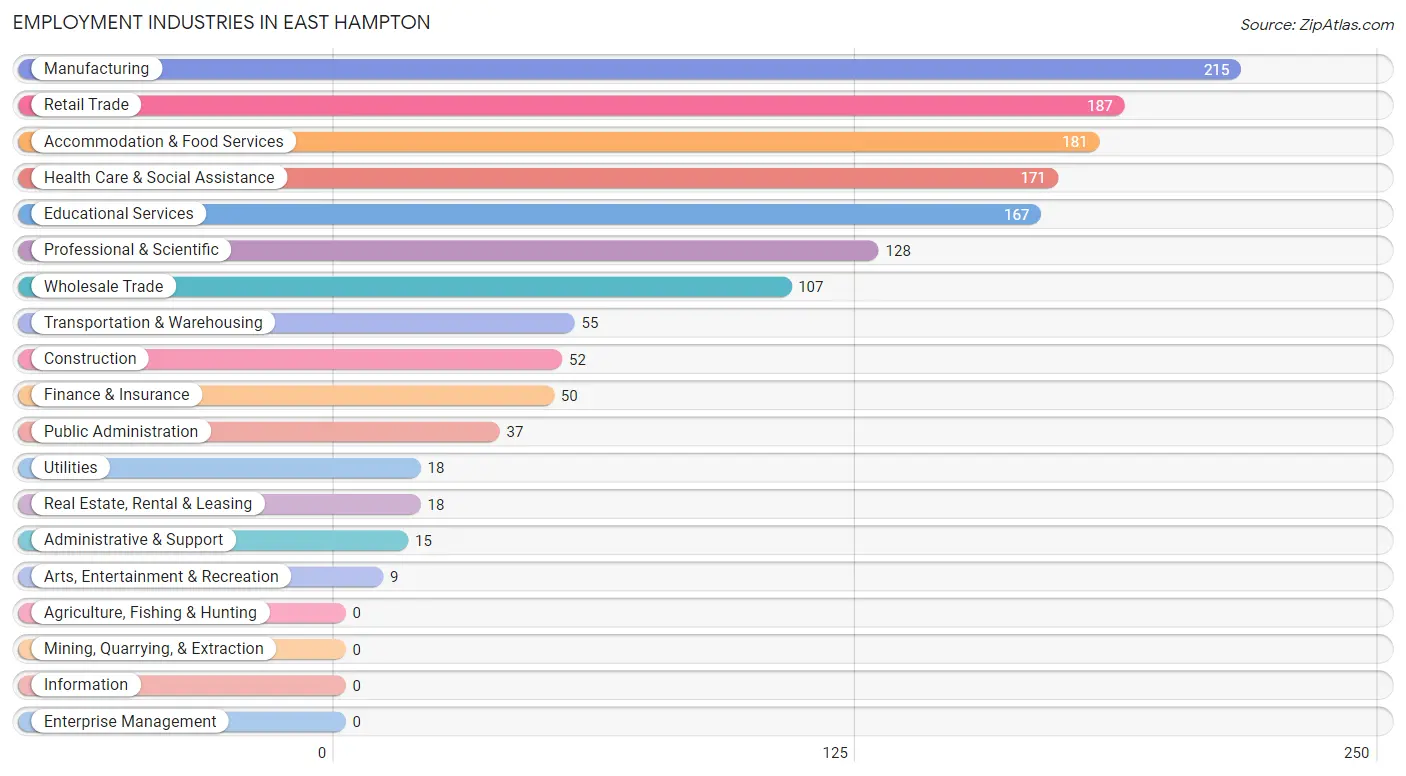
Employment Industries in East Hampton
The major employment industries in East Hampton include Manufacturing (215 | 14.7%), Retail Trade (187 | 12.8%), Accommodation & Food Services (181 | 12.4%), Health Care & Social Assistance (171 | 11.7%), and Educational Services (167 | 11.4%).
Employment Industries by Sex in East Hampton
The East Hampton industries that see more men than women are Construction (100.0%), Real Estate, Rental & Leasing (100.0%), and Manufacturing (95.4%), whereas the industries that tend to have a higher number of women are Arts, Entertainment & Recreation (100.0%), Health Care & Social Assistance (79.5%), and Educational Services (74.3%).
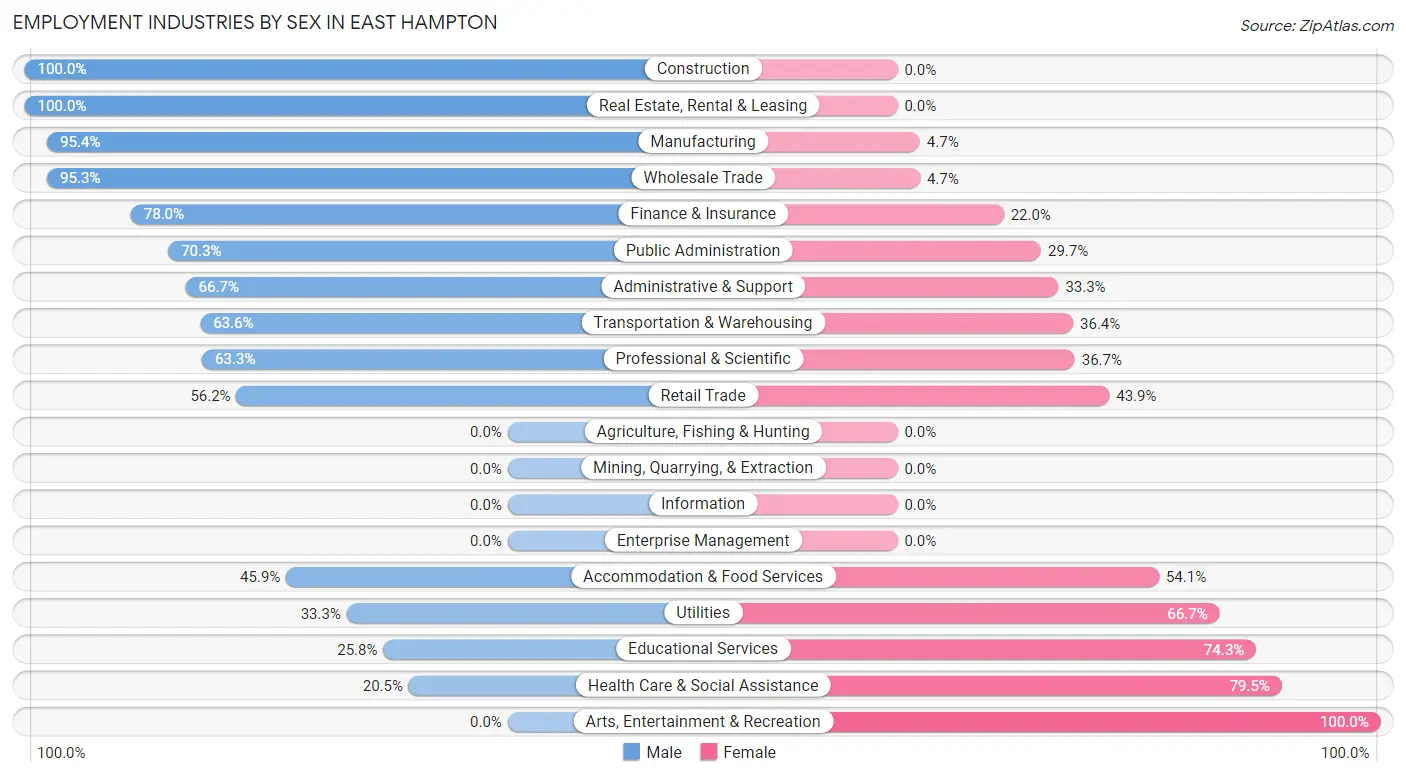
| Industry | Male | Female |
| Agriculture, Fishing & Hunting | 0 (0.0%) | 0 (0.0%) |
| Mining, Quarrying, & Extraction | 0 (0.0%) | 0 (0.0%) |
| Construction | 52 (100.0%) | 0 (0.0%) |
| Manufacturing | 205 (95.4%) | 10 (4.6%) |
| Wholesale Trade | 102 (95.3%) | 5 (4.7%) |
| Retail Trade | 105 (56.1%) | 82 (43.9%) |
| Transportation & Warehousing | 35 (63.6%) | 20 (36.4%) |
| Utilities | 6 (33.3%) | 12 (66.7%) |
| Information | 0 (0.0%) | 0 (0.0%) |
| Finance & Insurance | 39 (78.0%) | 11 (22.0%) |
| Real Estate, Rental & Leasing | 18 (100.0%) | 0 (0.0%) |
| Professional & Scientific | 81 (63.3%) | 47 (36.7%) |
| Enterprise Management | 0 (0.0%) | 0 (0.0%) |
| Administrative & Support | 10 (66.7%) | 5 (33.3%) |
| Educational Services | 43 (25.8%) | 124 (74.3%) |
| Health Care & Social Assistance | 35 (20.5%) | 136 (79.5%) |
| Arts, Entertainment & Recreation | 0 (0.0%) | 9 (100.0%) |
| Accommodation & Food Services | 83 (45.9%) | 98 (54.1%) |
| Public Administration | 26 (70.3%) | 11 (29.7%) |
| Total | 855 (58.6%) | 605 (41.4%) |
Education in East Hampton
School Enrollment in East Hampton
The most common levels of schooling among the 745 students in East Hampton are college / undergraduate (272 | 36.5%), high school (205 | 27.5%), and middle school (118 | 15.8%).
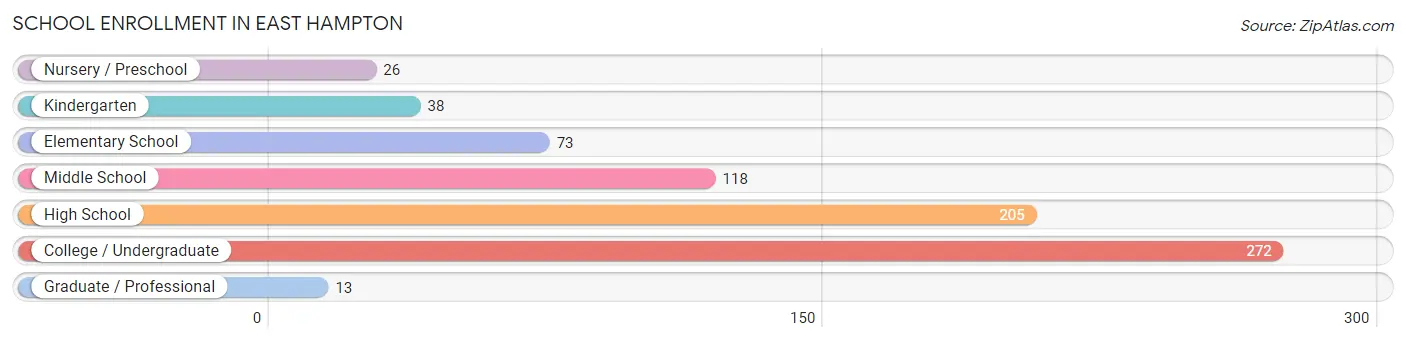
| School Level | # Students | % Students |
| Nursery / Preschool | 26 | 3.5% |
| Kindergarten | 38 | 5.1% |
| Elementary School | 73 | 9.8% |
| Middle School | 118 | 15.8% |
| High School | 205 | 27.5% |
| College / Undergraduate | 272 | 36.5% |
| Graduate / Professional | 13 | 1.7% |
| Total | 745 | 100.0% |
School Enrollment by Age by Funding Source in East Hampton
Out of a total of 745 students who are enrolled in schools in East Hampton, 84 (11.3%) attend a private institution, while the remaining 661 (88.7%) are enrolled in public schools. The age group of 3 to 4 year olds has the highest likelihood of being enrolled in private schools, with 26 (100.0% in the age bracket) enrolled. Conversely, the age group of 20 to 24 year olds has the lowest likelihood of being enrolled in a private school, with 104 (100.0% in the age bracket) attending a public institution.
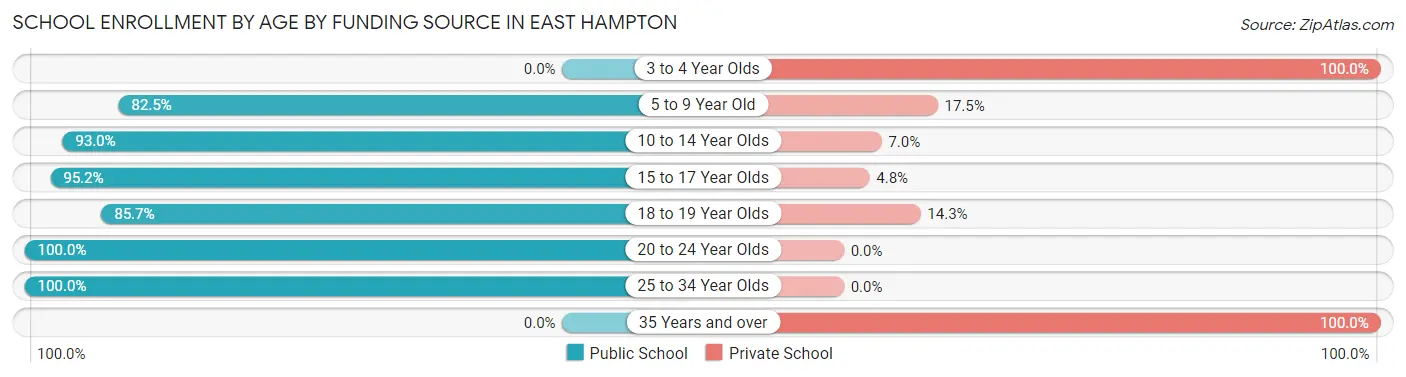
| Age Bracket | Public School | Private School |
| 3 to 4 Year Olds | 0 (0.0%) | 26 (100.0%) |
| 5 to 9 Year Old | 85 (82.5%) | 18 (17.5%) |
| 10 to 14 Year Olds | 132 (93.0%) | 10 (7.0%) |
| 15 to 17 Year Olds | 159 (95.2%) | 8 (4.8%) |
| 18 to 19 Year Olds | 66 (85.7%) | 11 (14.3%) |
| 20 to 24 Year Olds | 104 (100.0%) | 0 (0.0%) |
| 25 to 34 Year Olds | 115 (100.0%) | 0 (0.0%) |
| 35 Years and over | 0 (0.0%) | 11 (100.0%) |
| Total | 661 (88.7%) | 84 (11.3%) |
Educational Attainment by Field of Study in East Hampton
Business (175 | 21.2%), education (136 | 16.5%), science & technology (73 | 8.8%), computers & mathematics (67 | 8.1%), and social sciences (58 | 7.0%) are the most common fields of study among 826 individuals in East Hampton who have obtained a bachelor's degree or higher.
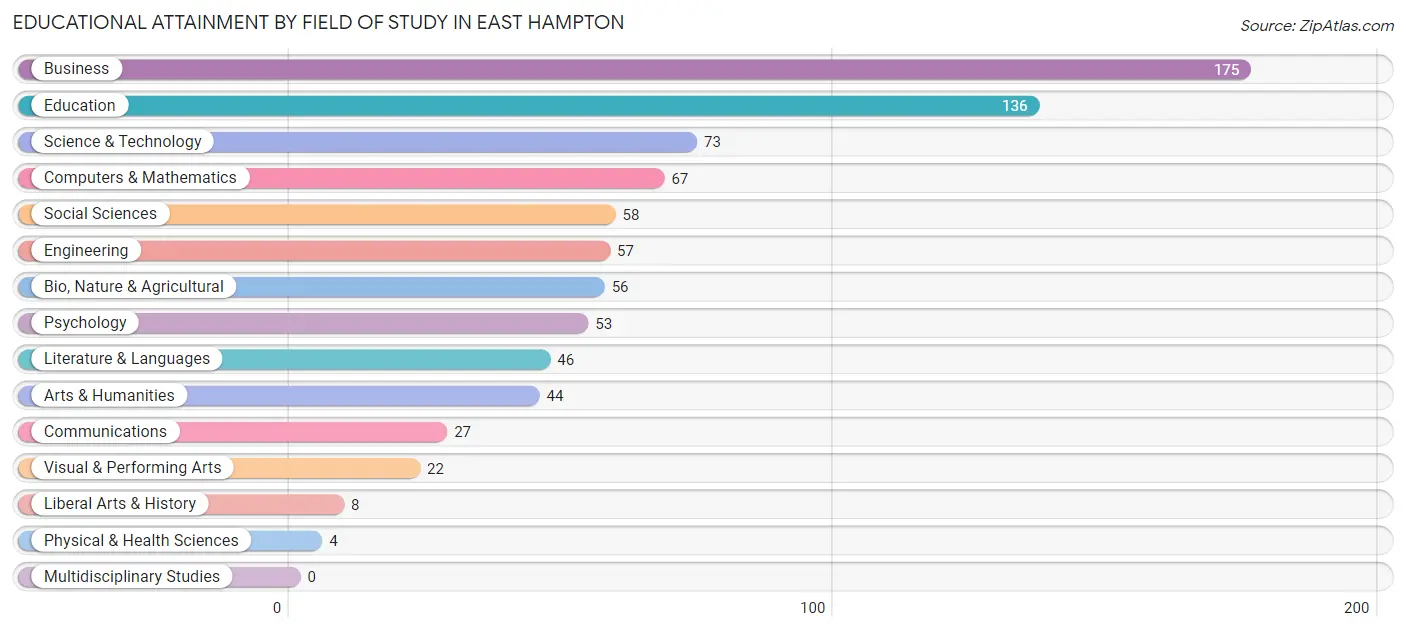
| Field of Study | # Graduates | % Graduates |
| Computers & Mathematics | 67 | 8.1% |
| Bio, Nature & Agricultural | 56 | 6.8% |
| Physical & Health Sciences | 4 | 0.5% |
| Psychology | 53 | 6.4% |
| Social Sciences | 58 | 7.0% |
| Engineering | 57 | 6.9% |
| Multidisciplinary Studies | 0 | 0.0% |
| Science & Technology | 73 | 8.8% |
| Business | 175 | 21.2% |
| Education | 136 | 16.5% |
| Literature & Languages | 46 | 5.6% |
| Liberal Arts & History | 8 | 1.0% |
| Visual & Performing Arts | 22 | 2.7% |
| Communications | 27 | 3.3% |
| Arts & Humanities | 44 | 5.3% |
| Total | 826 | 100.0% |
Transportation & Commute in East Hampton
Vehicle Availability by Sex in East Hampton
The most prevalent vehicle ownership categories in East Hampton are males with 2 vehicles (348, accounting for 40.9%) and females with 2 vehicles (168, making up 58.6%).
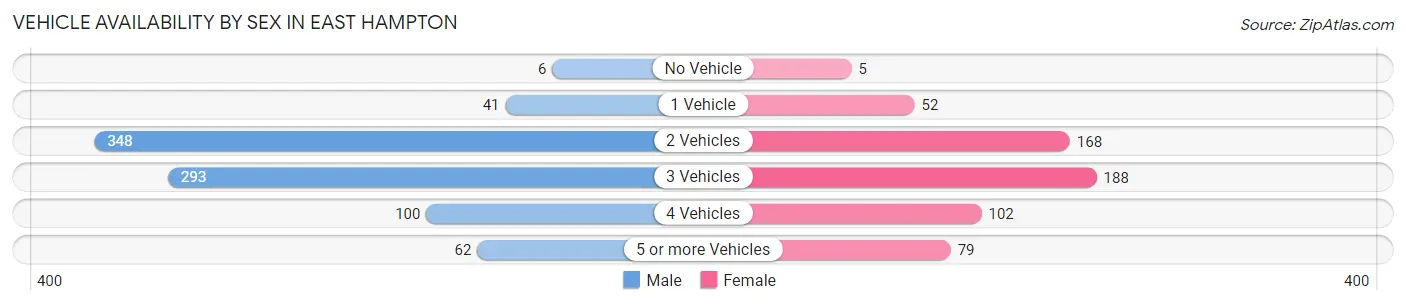
| Vehicles Available | Male | Female |
| No Vehicle | 6 (0.7%) | 5 (0.8%) |
| 1 Vehicle | 41 (4.8%) | 52 (8.7%) |
| 2 Vehicles | 348 (40.9%) | 168 (28.3%) |
| 3 Vehicles | 293 (34.5%) | 188 (31.7%) |
| 4 Vehicles | 100 (11.8%) | 102 (17.2%) |
| 5 or more Vehicles | 62 (7.3%) | 79 (13.3%) |
| Total | 850 (100.0%) | 594 (100.0%) |
Commute Time in East Hampton
The most frequently occuring commute durations in East Hampton are 35 to 39 minutes (241 commuters, 17.4%), 25 to 29 minutes (172 commuters, 12.4%), and 40 to 44 minutes (158 commuters, 11.4%).
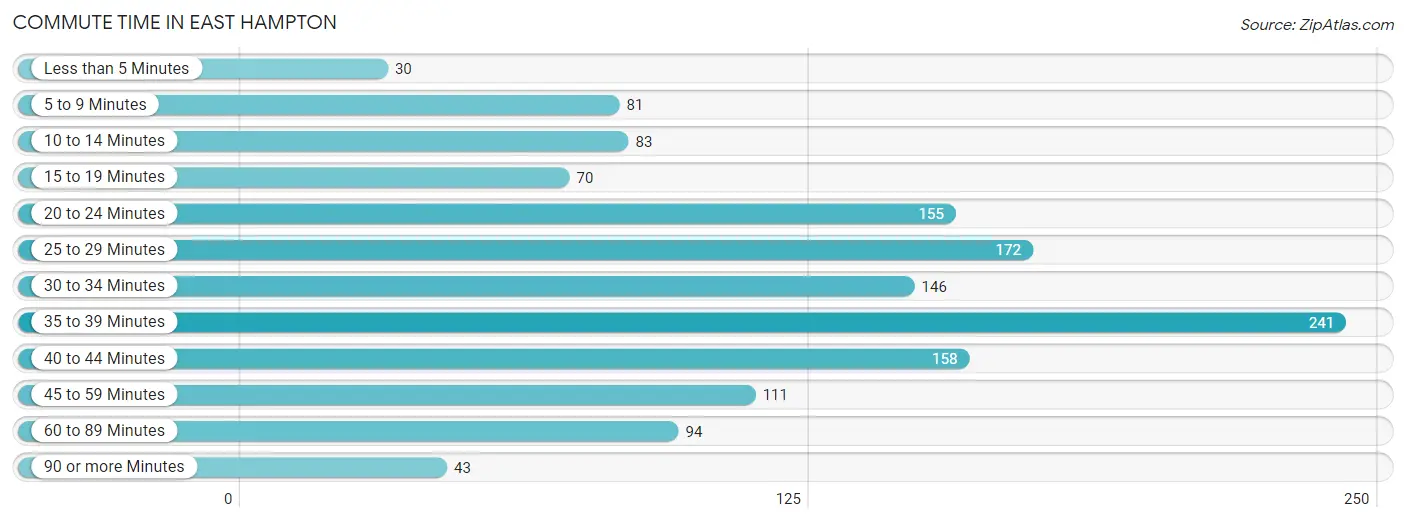
| Commute Time | # Commuters | % Commuters |
| Less than 5 Minutes | 30 | 2.2% |
| 5 to 9 Minutes | 81 | 5.9% |
| 10 to 14 Minutes | 83 | 6.0% |
| 15 to 19 Minutes | 70 | 5.1% |
| 20 to 24 Minutes | 155 | 11.2% |
| 25 to 29 Minutes | 172 | 12.4% |
| 30 to 34 Minutes | 146 | 10.5% |
| 35 to 39 Minutes | 241 | 17.4% |
| 40 to 44 Minutes | 158 | 11.4% |
| 45 to 59 Minutes | 111 | 8.0% |
| 60 to 89 Minutes | 94 | 6.8% |
| 90 or more Minutes | 43 | 3.1% |
Commute Time by Sex in East Hampton
The most common commute times in East Hampton are 35 to 39 minutes (198 commuters, 24.2%) for males and 40 to 44 minutes (108 commuters, 19.1%) for females.
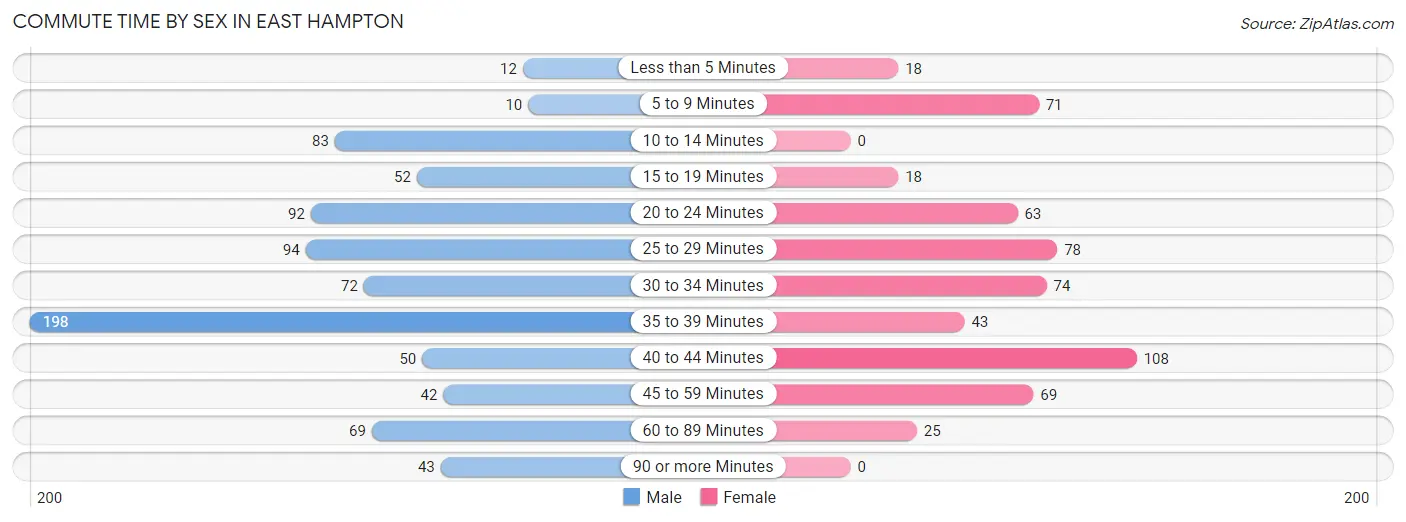
| Commute Time | Male | Female |
| Less than 5 Minutes | 12 (1.5%) | 18 (3.2%) |
| 5 to 9 Minutes | 10 (1.2%) | 71 (12.5%) |
| 10 to 14 Minutes | 83 (10.2%) | 0 (0.0%) |
| 15 to 19 Minutes | 52 (6.4%) | 18 (3.2%) |
| 20 to 24 Minutes | 92 (11.3%) | 63 (11.1%) |
| 25 to 29 Minutes | 94 (11.5%) | 78 (13.8%) |
| 30 to 34 Minutes | 72 (8.8%) | 74 (13.1%) |
| 35 to 39 Minutes | 198 (24.2%) | 43 (7.6%) |
| 40 to 44 Minutes | 50 (6.1%) | 108 (19.1%) |
| 45 to 59 Minutes | 42 (5.1%) | 69 (12.2%) |
| 60 to 89 Minutes | 69 (8.5%) | 25 (4.4%) |
| 90 or more Minutes | 43 (5.3%) | 0 (0.0%) |
Time of Departure to Work by Sex in East Hampton
The most frequent times of departure to work in East Hampton are 6:00 AM to 6:29 AM (231, 28.3%) for males and 7:00 AM to 7:29 AM (138, 24.3%) for females.
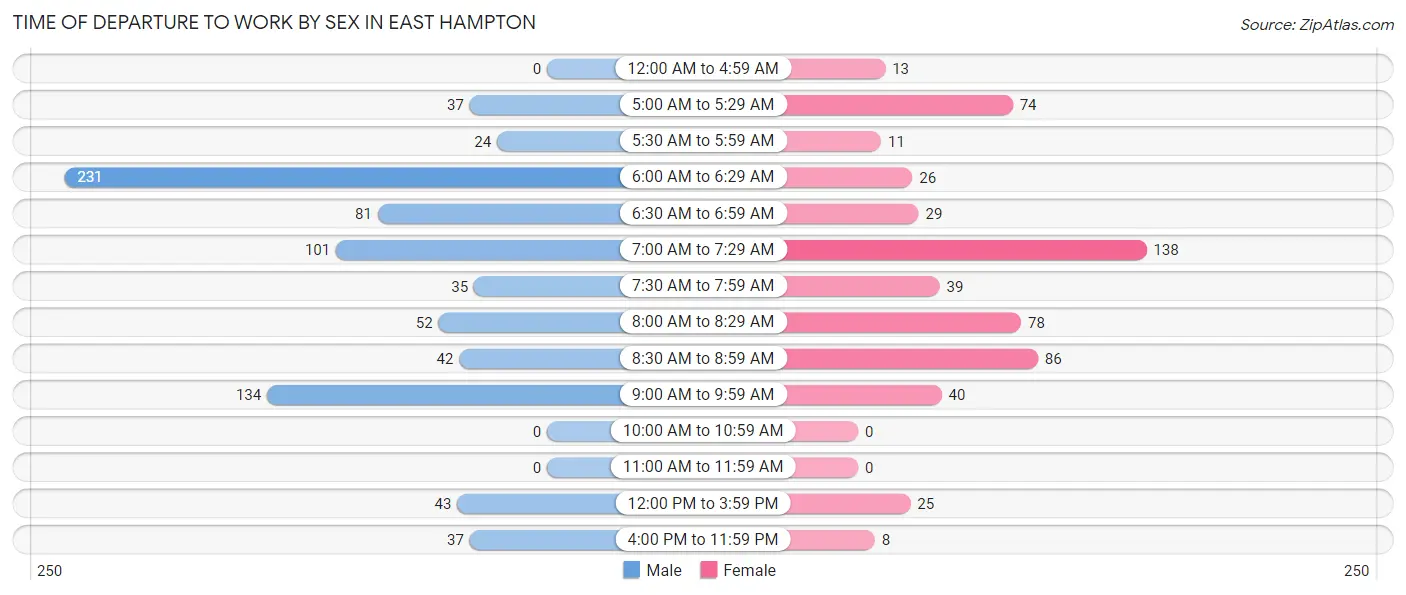
| Time of Departure | Male | Female |
| 12:00 AM to 4:59 AM | 0 (0.0%) | 13 (2.3%) |
| 5:00 AM to 5:29 AM | 37 (4.5%) | 74 (13.1%) |
| 5:30 AM to 5:59 AM | 24 (2.9%) | 11 (1.9%) |
| 6:00 AM to 6:29 AM | 231 (28.3%) | 26 (4.6%) |
| 6:30 AM to 6:59 AM | 81 (9.9%) | 29 (5.1%) |
| 7:00 AM to 7:29 AM | 101 (12.4%) | 138 (24.3%) |
| 7:30 AM to 7:59 AM | 35 (4.3%) | 39 (6.9%) |
| 8:00 AM to 8:29 AM | 52 (6.4%) | 78 (13.8%) |
| 8:30 AM to 8:59 AM | 42 (5.1%) | 86 (15.2%) |
| 9:00 AM to 9:59 AM | 134 (16.4%) | 40 (7.0%) |
| 10:00 AM to 10:59 AM | 0 (0.0%) | 0 (0.0%) |
| 11:00 AM to 11:59 AM | 0 (0.0%) | 0 (0.0%) |
| 12:00 PM to 3:59 PM | 43 (5.3%) | 25 (4.4%) |
| 4:00 PM to 11:59 PM | 37 (4.5%) | 8 (1.4%) |
| Total | 817 (100.0%) | 567 (100.0%) |
Housing Occupancy in East Hampton
Occupancy by Ownership in East Hampton
Of the total 1,025 dwellings in East Hampton, owner-occupied units account for 931 (90.8%), while renter-occupied units make up 94 (9.2%).
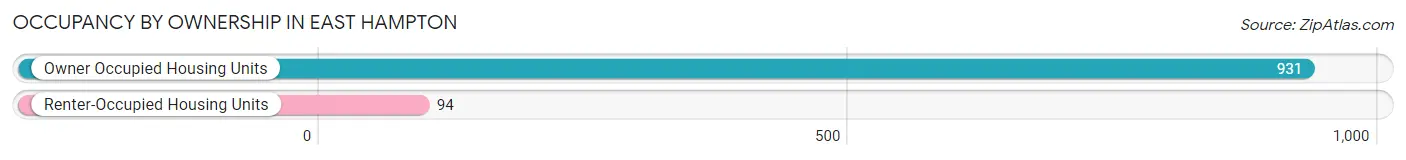
| Occupancy | # Housing Units | % Housing Units |
| Owner Occupied Housing Units | 931 | 90.8% |
| Renter-Occupied Housing Units | 94 | 9.2% |
| Total Occupied Housing Units | 1,025 | 100.0% |
Occupancy by Household Size in East Hampton
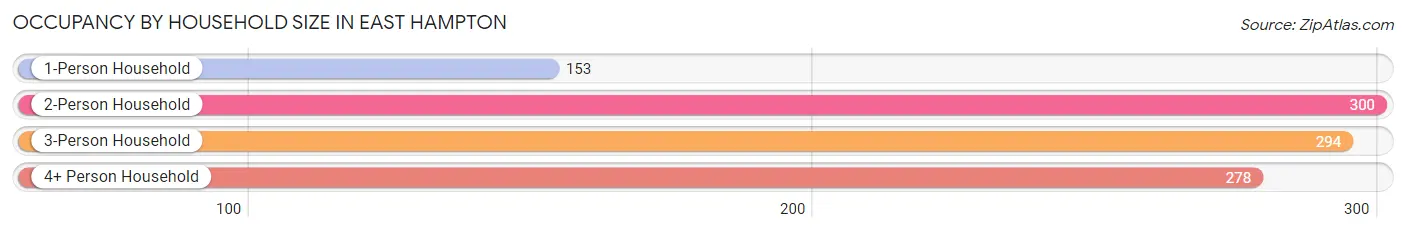
| Household Size | # Housing Units | % Housing Units |
| 1-Person Household | 153 | 14.9% |
| 2-Person Household | 300 | 29.3% |
| 3-Person Household | 294 | 28.7% |
| 4+ Person Household | 278 | 27.1% |
| Total Housing Units | 1,025 | 100.0% |
Occupancy by Ownership by Household Size in East Hampton
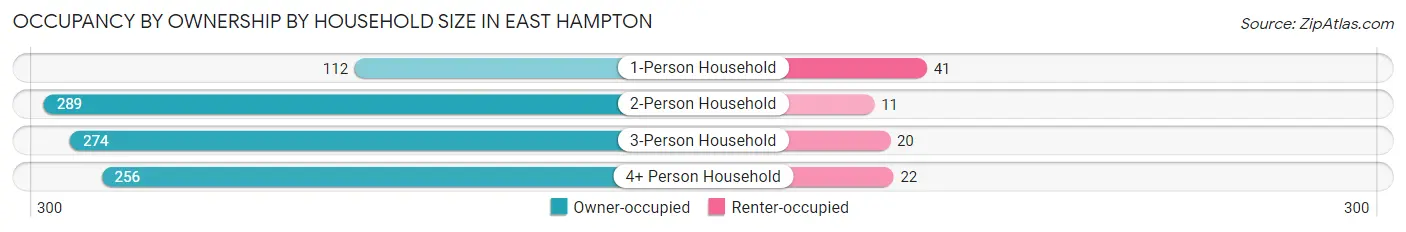
| Household Size | Owner-occupied | Renter-occupied |
| 1-Person Household | 112 (73.2%) | 41 (26.8%) |
| 2-Person Household | 289 (96.3%) | 11 (3.7%) |
| 3-Person Household | 274 (93.2%) | 20 (6.8%) |
| 4+ Person Household | 256 (92.1%) | 22 (7.9%) |
| Total Housing Units | 931 (90.8%) | 94 (9.2%) |
Occupancy by Educational Attainment in East Hampton
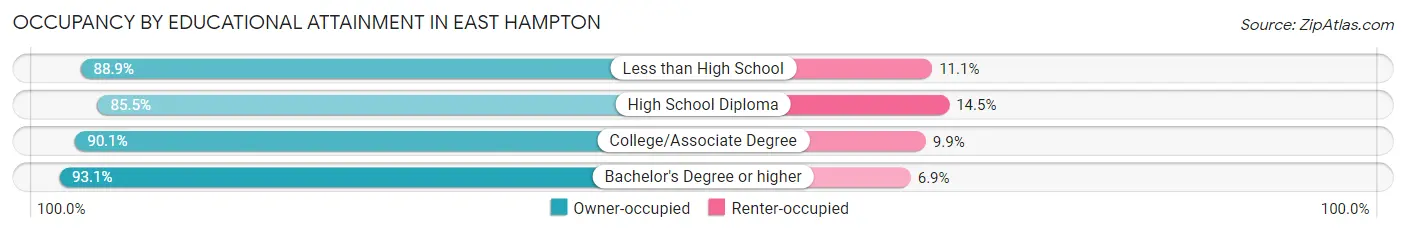
| Household Size | Owner-occupied | Renter-occupied |
| Less than High School | 8 (88.9%) | 1 (11.1%) |
| High School Diploma | 118 (85.5%) | 20 (14.5%) |
| College/Associate Degree | 384 (90.1%) | 42 (9.9%) |
| Bachelor's Degree or higher | 421 (93.1%) | 31 (6.9%) |
Occupancy by Age of Householder in East Hampton
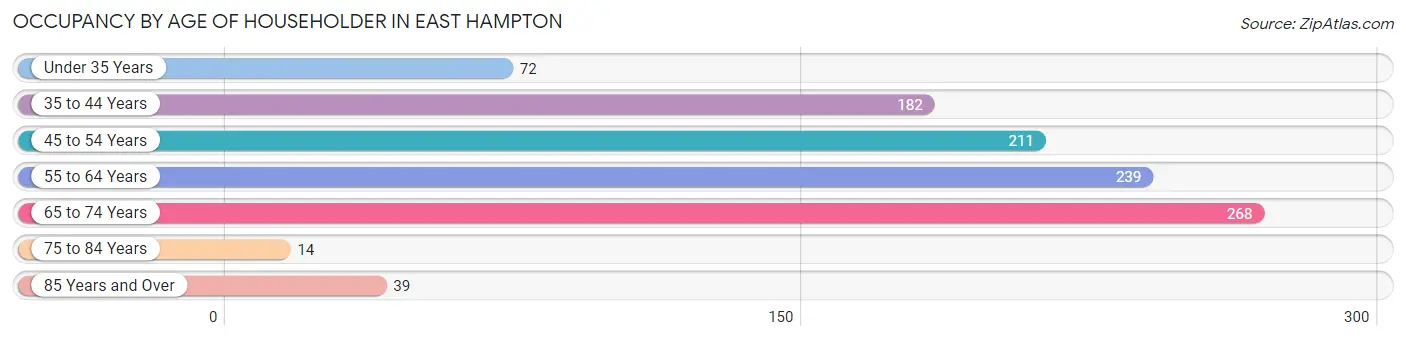
| Age Bracket | # Households | % Households |
| Under 35 Years | 72 | 7.0% |
| 35 to 44 Years | 182 | 17.8% |
| 45 to 54 Years | 211 | 20.6% |
| 55 to 64 Years | 239 | 23.3% |
| 65 to 74 Years | 268 | 26.2% |
| 75 to 84 Years | 14 | 1.4% |
| 85 Years and Over | 39 | 3.8% |
| Total | 1,025 | 100.0% |
Housing Finances in East Hampton
Median Income by Occupancy in East Hampton
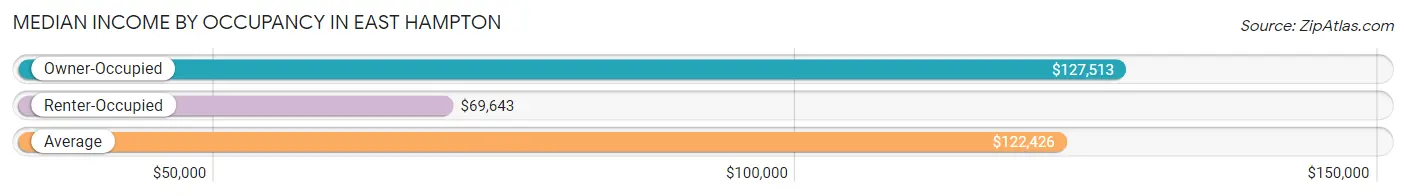
| Occupancy Type | # Households | Median Income |
| Owner-Occupied | 931 (90.8%) | $127,513 |
| Renter-Occupied | 94 (9.2%) | $69,643 |
| Average | 1,025 (100.0%) | $122,426 |
Occupancy by Householder Income Bracket in East Hampton
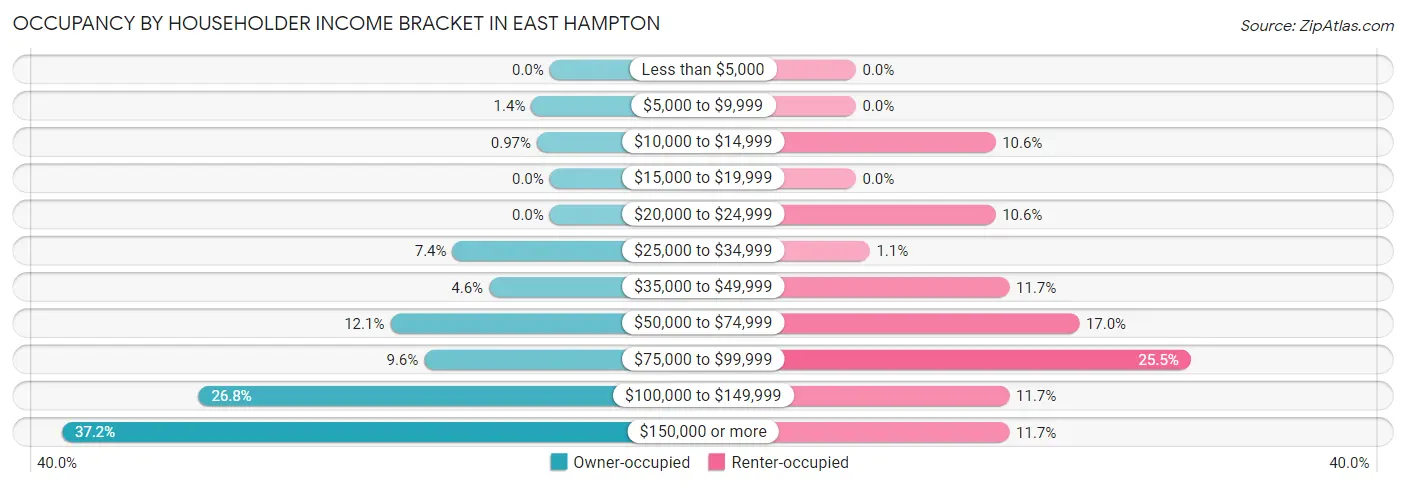
| Income Bracket | Owner-occupied | Renter-occupied |
| Less than $5,000 | 0 (0.0%) | 0 (0.0%) |
| $5,000 to $9,999 | 13 (1.4%) | 0 (0.0%) |
| $10,000 to $14,999 | 9 (1.0%) | 10 (10.6%) |
| $15,000 to $19,999 | 0 (0.0%) | 0 (0.0%) |
| $20,000 to $24,999 | 0 (0.0%) | 10 (10.6%) |
| $25,000 to $34,999 | 69 (7.4%) | 1 (1.1%) |
| $35,000 to $49,999 | 43 (4.6%) | 11 (11.7%) |
| $50,000 to $74,999 | 113 (12.1%) | 16 (17.0%) |
| $75,000 to $99,999 | 89 (9.6%) | 24 (25.5%) |
| $100,000 to $149,999 | 249 (26.8%) | 11 (11.7%) |
| $150,000 or more | 346 (37.2%) | 11 (11.7%) |
| Total | 931 (100.0%) | 94 (100.0%) |
Monthly Housing Cost Tiers in East Hampton
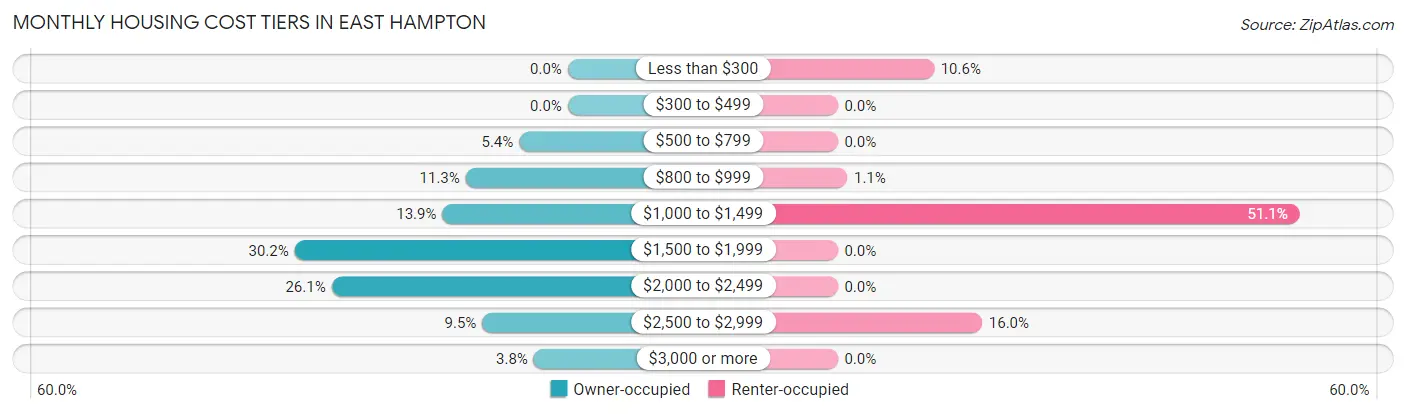
| Monthly Cost | Owner-occupied | Renter-occupied |
| Less than $300 | 0 (0.0%) | 10 (10.6%) |
| $300 to $499 | 0 (0.0%) | 0 (0.0%) |
| $500 to $799 | 50 (5.4%) | 0 (0.0%) |
| $800 to $999 | 105 (11.3%) | 1 (1.1%) |
| $1,000 to $1,499 | 129 (13.9%) | 48 (51.1%) |
| $1,500 to $1,999 | 281 (30.2%) | 0 (0.0%) |
| $2,000 to $2,499 | 243 (26.1%) | 0 (0.0%) |
| $2,500 to $2,999 | 88 (9.5%) | 15 (16.0%) |
| $3,000 or more | 35 (3.8%) | 0 (0.0%) |
| Total | 931 (100.0%) | 94 (100.0%) |
Physical Housing Characteristics in East Hampton
Housing Structures in East Hampton
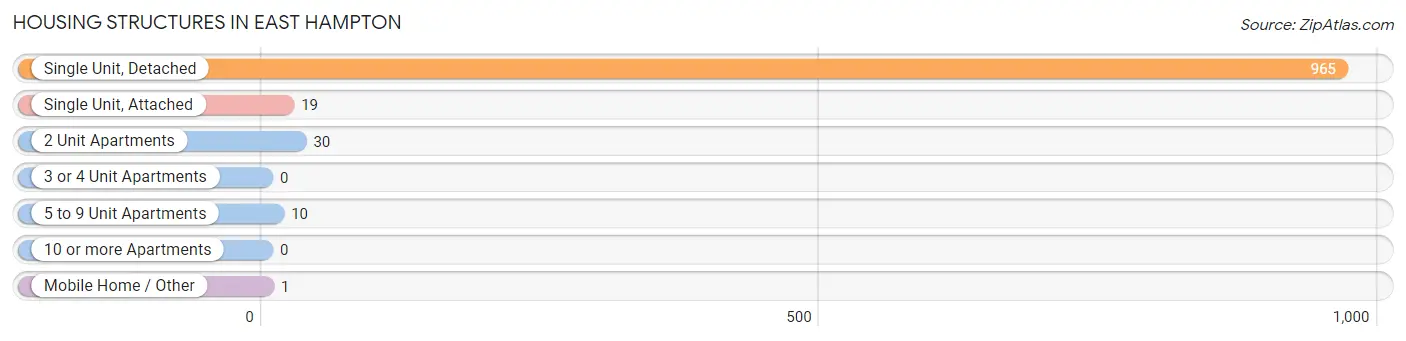
| Structure Type | # Housing Units | % Housing Units |
| Single Unit, Detached | 965 | 94.2% |
| Single Unit, Attached | 19 | 1.8% |
| 2 Unit Apartments | 30 | 2.9% |
| 3 or 4 Unit Apartments | 0 | 0.0% |
| 5 to 9 Unit Apartments | 10 | 1.0% |
| 10 or more Apartments | 0 | 0.0% |
| Mobile Home / Other | 1 | 0.1% |
| Total | 1,025 | 100.0% |
Housing Structures by Occupancy in East Hampton
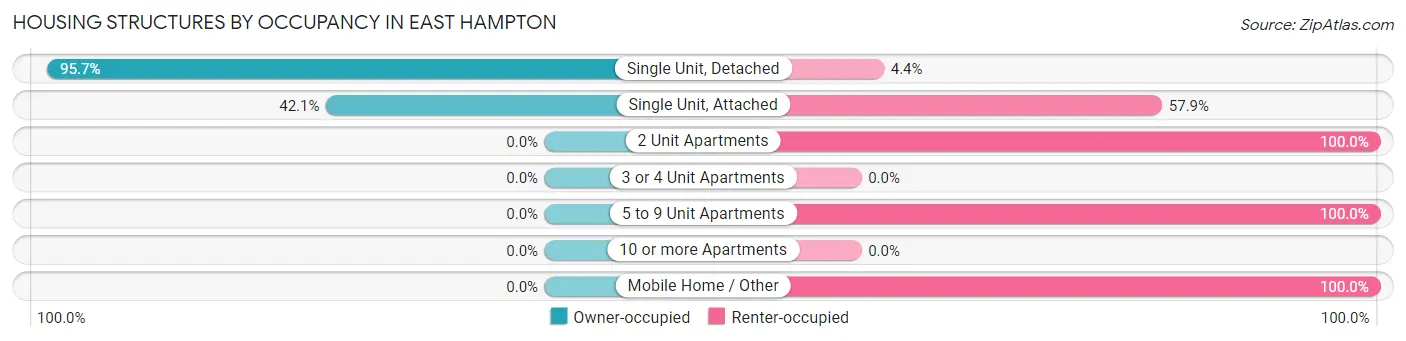
| Structure Type | Owner-occupied | Renter-occupied |
| Single Unit, Detached | 923 (95.7%) | 42 (4.3%) |
| Single Unit, Attached | 8 (42.1%) | 11 (57.9%) |
| 2 Unit Apartments | 0 (0.0%) | 30 (100.0%) |
| 3 or 4 Unit Apartments | 0 (0.0%) | 0 (0.0%) |
| 5 to 9 Unit Apartments | 0 (0.0%) | 10 (100.0%) |
| 10 or more Apartments | 0 (0.0%) | 0 (0.0%) |
| Mobile Home / Other | 0 (0.0%) | 1 (100.0%) |
| Total | 931 (90.8%) | 94 (9.2%) |
Housing Structures by Number of Rooms in East Hampton
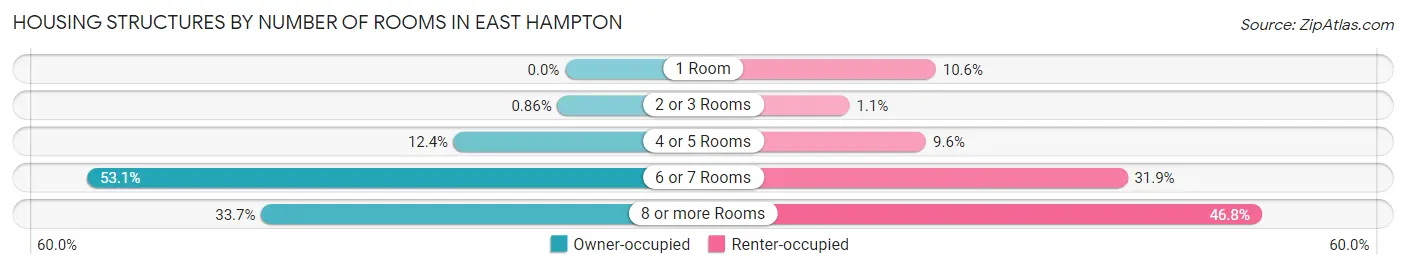
| Number of Rooms | Owner-occupied | Renter-occupied |
| 1 Room | 0 (0.0%) | 10 (10.6%) |
| 2 or 3 Rooms | 8 (0.9%) | 1 (1.1%) |
| 4 or 5 Rooms | 115 (12.3%) | 9 (9.6%) |
| 6 or 7 Rooms | 494 (53.1%) | 30 (31.9%) |
| 8 or more Rooms | 314 (33.7%) | 44 (46.8%) |
| Total | 931 (100.0%) | 94 (100.0%) |
Housing Structure by Heating Type in East Hampton
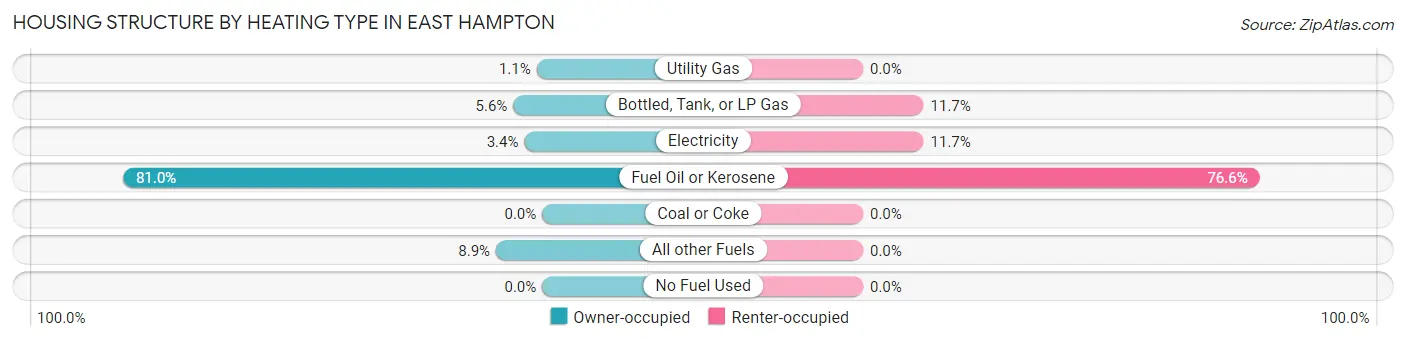
| Heating Type | Owner-occupied | Renter-occupied |
| Utility Gas | 10 (1.1%) | 0 (0.0%) |
| Bottled, Tank, or LP Gas | 52 (5.6%) | 11 (11.7%) |
| Electricity | 32 (3.4%) | 11 (11.7%) |
| Fuel Oil or Kerosene | 754 (81.0%) | 72 (76.6%) |
| Coal or Coke | 0 (0.0%) | 0 (0.0%) |
| All other Fuels | 83 (8.9%) | 0 (0.0%) |
| No Fuel Used | 0 (0.0%) | 0 (0.0%) |
| Total | 931 (100.0%) | 94 (100.0%) |
Household Vehicle Usage in East Hampton
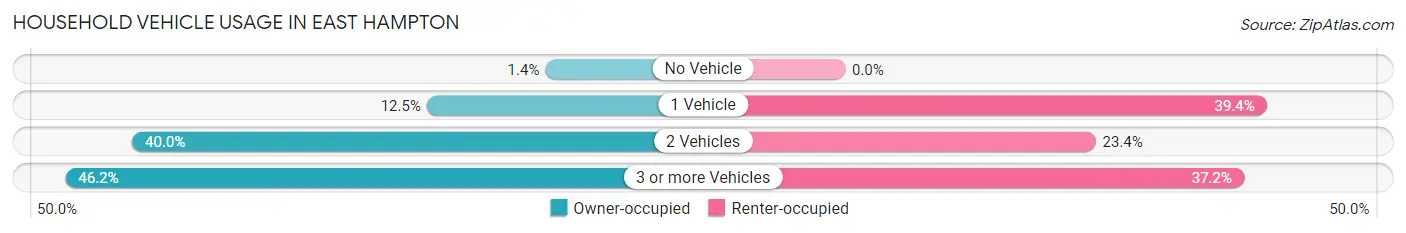
| Vehicles per Household | Owner-occupied | Renter-occupied |
| No Vehicle | 13 (1.4%) | 0 (0.0%) |
| 1 Vehicle | 116 (12.5%) | 37 (39.4%) |
| 2 Vehicles | 372 (40.0%) | 22 (23.4%) |
| 3 or more Vehicles | 430 (46.2%) | 35 (37.2%) |
| Total | 931 (100.0%) | 94 (100.0%) |
Real Estate & Mortgages in East Hampton
Real Estate and Mortgage Overview in East Hampton
| Characteristic | Without Mortgage | With Mortgage |
| Housing Units | 214 | 717 |
| Median Property Value | $238,900 | $320,900 |
| Median Household Income | $107,750 | $271 |
| Monthly Housing Costs | $958 | $35 |
| Real Estate Taxes | $6,000 | $13 |
Property Value by Mortgage Status in East Hampton
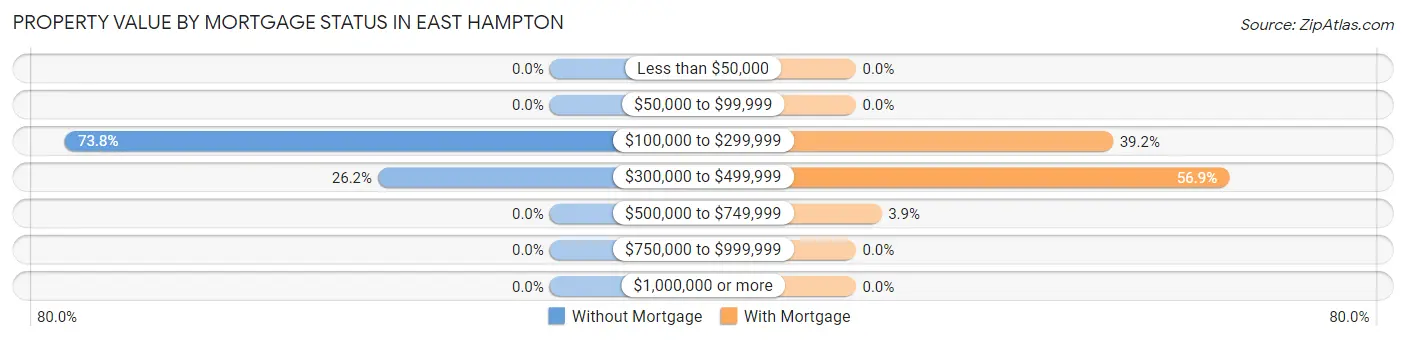
| Property Value | Without Mortgage | With Mortgage |
| Less than $50,000 | 0 (0.0%) | 0 (0.0%) |
| $50,000 to $99,999 | 0 (0.0%) | 0 (0.0%) |
| $100,000 to $299,999 | 158 (73.8%) | 281 (39.2%) |
| $300,000 to $499,999 | 56 (26.2%) | 408 (56.9%) |
| $500,000 to $749,999 | 0 (0.0%) | 28 (3.9%) |
| $750,000 to $999,999 | 0 (0.0%) | 0 (0.0%) |
| $1,000,000 or more | 0 (0.0%) | 0 (0.0%) |
| Total | 214 (100.0%) | 717 (100.0%) |
Household Income by Mortgage Status in East Hampton
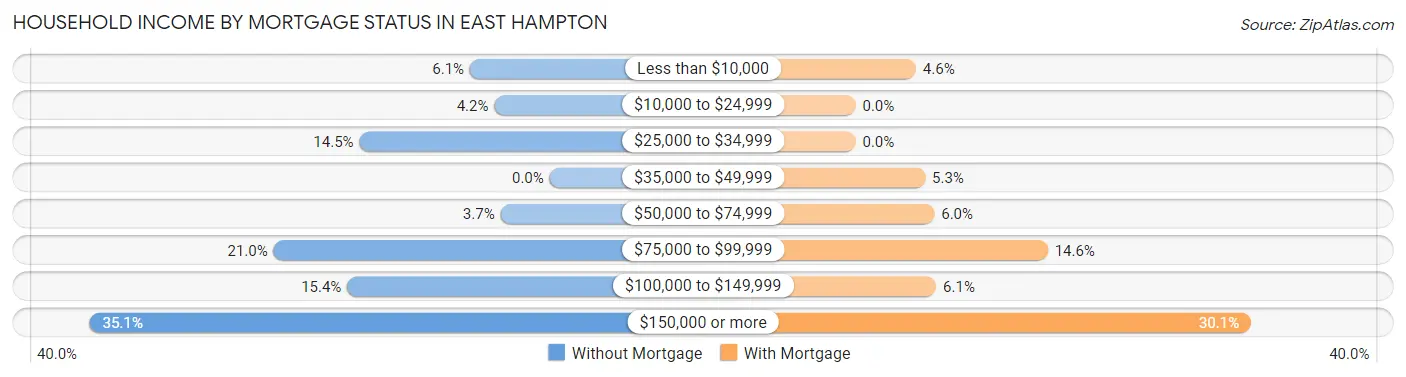
| Household Income | Without Mortgage | With Mortgage |
| Less than $10,000 | 13 (6.1%) | 33 (4.6%) |
| $10,000 to $24,999 | 9 (4.2%) | 0 (0.0%) |
| $25,000 to $34,999 | 31 (14.5%) | 0 (0.0%) |
| $35,000 to $49,999 | 0 (0.0%) | 38 (5.3%) |
| $50,000 to $74,999 | 8 (3.7%) | 43 (6.0%) |
| $75,000 to $99,999 | 45 (21.0%) | 105 (14.6%) |
| $100,000 to $149,999 | 33 (15.4%) | 44 (6.1%) |
| $150,000 or more | 75 (35.0%) | 216 (30.1%) |
| Total | 214 (100.0%) | 717 (100.0%) |
Property Value to Household Income Ratio in East Hampton
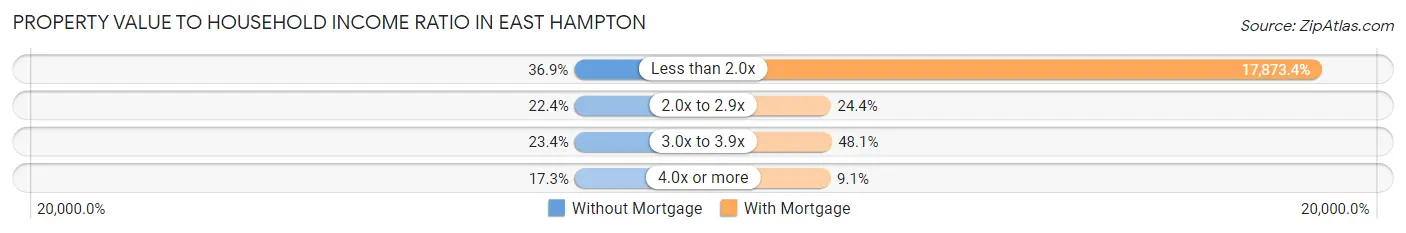
| Value-to-Income Ratio | Without Mortgage | With Mortgage |
| Less than 2.0x | 79 (36.9%) | 128,152 (17,873.4%) |
| 2.0x to 2.9x | 48 (22.4%) | 175 (24.4%) |
| 3.0x to 3.9x | 50 (23.4%) | 345 (48.1%) |
| 4.0x or more | 37 (17.3%) | 65 (9.1%) |
| Total | 214 (100.0%) | 717 (100.0%) |
Real Estate Taxes by Mortgage Status in East Hampton
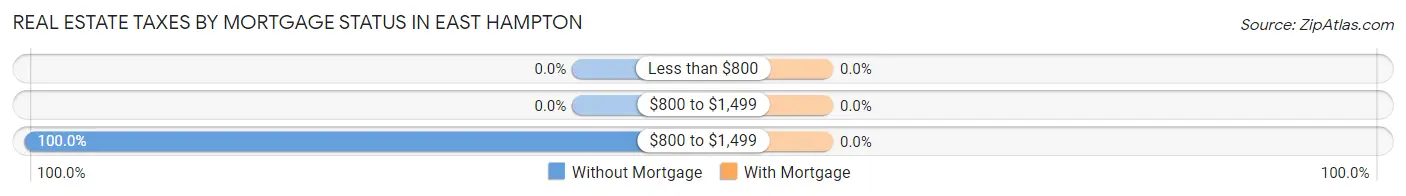
| Property Taxes | Without Mortgage | With Mortgage |
| Less than $800 | 0 (0.0%) | 0 (0.0%) |
| $800 to $1,499 | 0 (0.0%) | 0 (0.0%) |
| $800 to $1,499 | 214 (100.0%) | 0 (0.0%) |
| Total | 214 (100.0%) | 717 (100.0%) |
Health & Disability in East Hampton
Health Insurance Coverage by Age in East Hampton
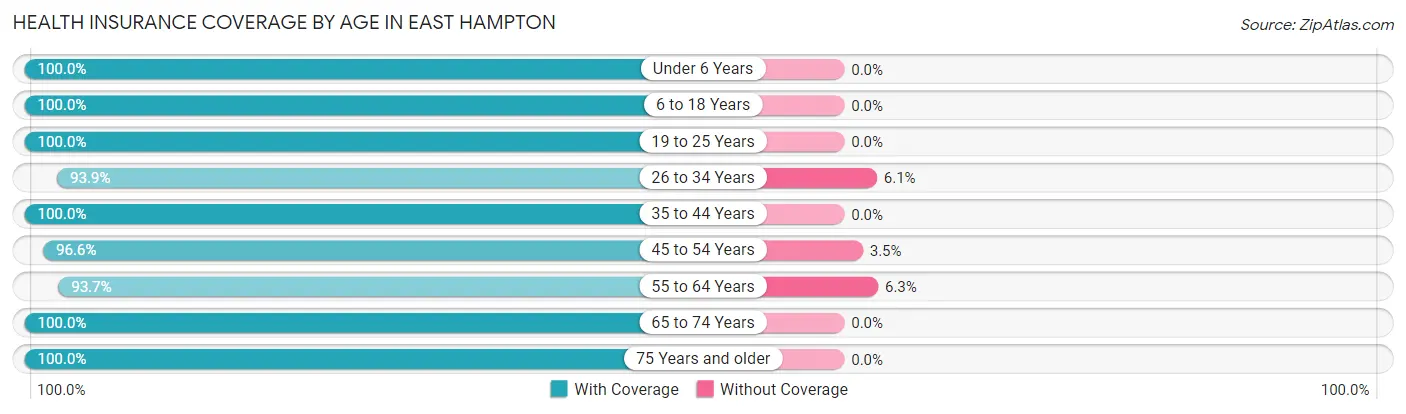
| Age Bracket | With Coverage | Without Coverage |
| Under 6 Years | 260 (100.0%) | 0 (0.0%) |
| 6 to 18 Years | 433 (100.0%) | 0 (0.0%) |
| 19 to 25 Years | 209 (100.0%) | 0 (0.0%) |
| 26 to 34 Years | 263 (93.9%) | 17 (6.1%) |
| 35 to 44 Years | 283 (100.0%) | 0 (0.0%) |
| 45 to 54 Years | 420 (96.6%) | 15 (3.5%) |
| 55 to 64 Years | 417 (93.7%) | 28 (6.3%) |
| 65 to 74 Years | 456 (100.0%) | 0 (0.0%) |
| 75 Years and older | 107 (100.0%) | 0 (0.0%) |
| Total | 2,848 (97.9%) | 60 (2.1%) |
Health Insurance Coverage by Citizenship Status in East Hampton
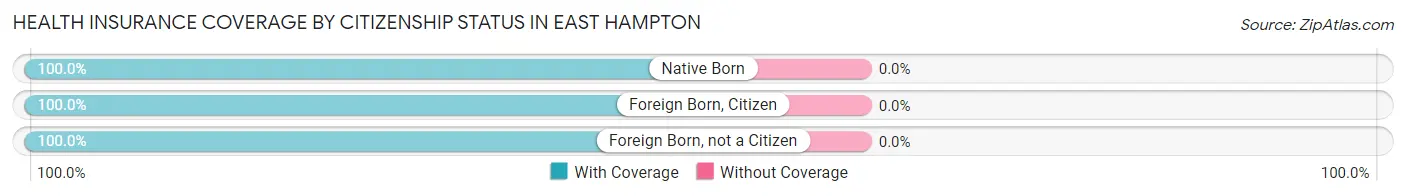
| Citizenship Status | With Coverage | Without Coverage |
| Native Born | 260 (100.0%) | 0 (0.0%) |
| Foreign Born, Citizen | 433 (100.0%) | 0 (0.0%) |
| Foreign Born, not a Citizen | 209 (100.0%) | 0 (0.0%) |
Health Insurance Coverage by Household Income in East Hampton
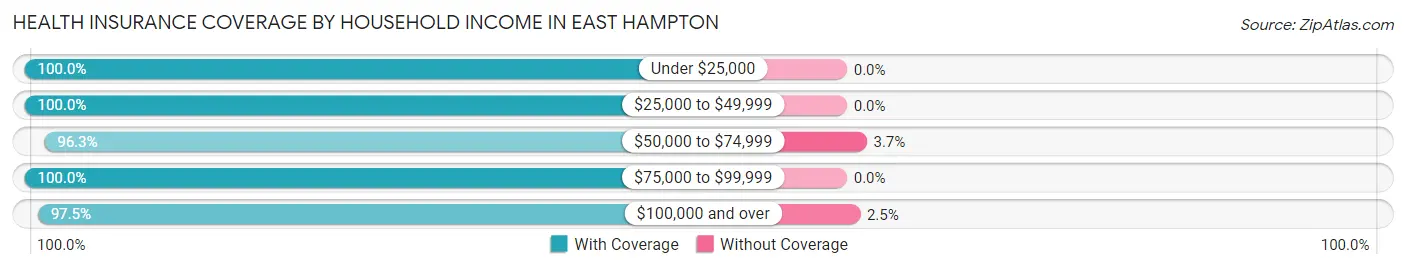
| Household Income | With Coverage | Without Coverage |
| Under $25,000 | 86 (100.0%) | 0 (0.0%) |
| $25,000 to $49,999 | 179 (100.0%) | 0 (0.0%) |
| $50,000 to $74,999 | 312 (96.3%) | 12 (3.7%) |
| $75,000 to $99,999 | 371 (100.0%) | 0 (0.0%) |
| $100,000 and over | 1,895 (97.5%) | 48 (2.5%) |
Public vs Private Health Insurance Coverage by Age in East Hampton
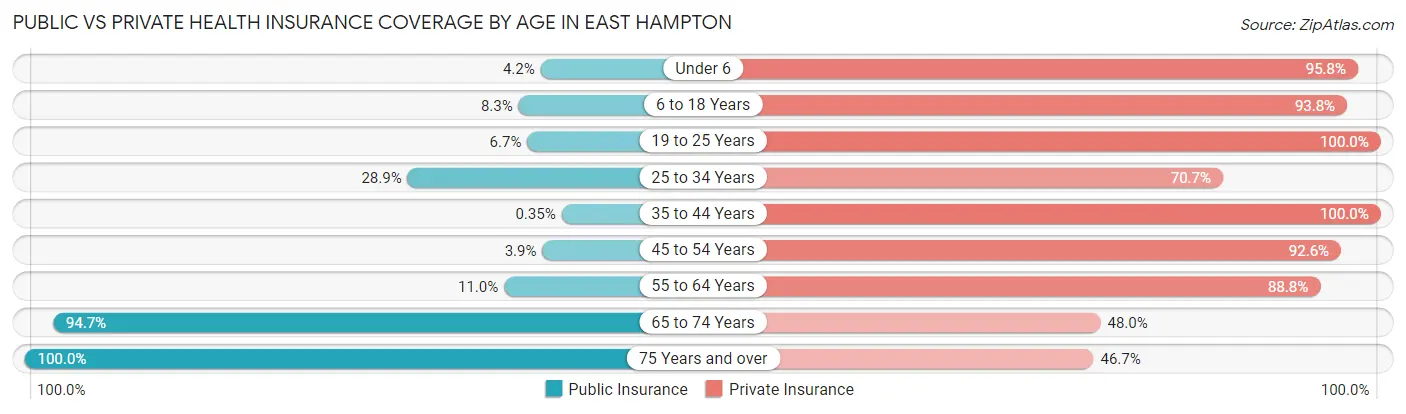
| Age Bracket | Public Insurance | Private Insurance |
| Under 6 | 11 (4.2%) | 249 (95.8%) |
| 6 to 18 Years | 36 (8.3%) | 406 (93.8%) |
| 19 to 25 Years | 14 (6.7%) | 209 (100.0%) |
| 25 to 34 Years | 81 (28.9%) | 198 (70.7%) |
| 35 to 44 Years | 1 (0.4%) | 283 (100.0%) |
| 45 to 54 Years | 17 (3.9%) | 403 (92.6%) |
| 55 to 64 Years | 49 (11.0%) | 395 (88.8%) |
| 65 to 74 Years | 432 (94.7%) | 219 (48.0%) |
| 75 Years and over | 107 (100.0%) | 50 (46.7%) |
| Total | 748 (25.7%) | 2,412 (82.9%) |
Disability Status by Sex by Age in East Hampton
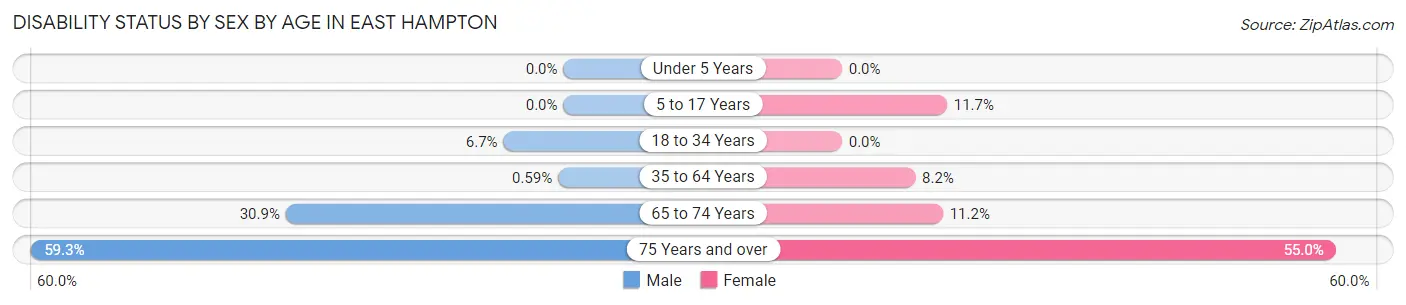
| Age Bracket | Male | Female |
| Under 5 Years | 0 (0.0%) | 0 (0.0%) |
| 5 to 17 Years | 0 (0.0%) | 18 (11.7%) |
| 18 to 34 Years | 13 (6.7%) | 0 (0.0%) |
| 35 to 64 Years | 4 (0.6%) | 40 (8.2%) |
| 65 to 74 Years | 64 (30.9%) | 28 (11.2%) |
| 75 Years and over | 16 (59.3%) | 44 (55.0%) |
Disability Class by Sex by Age in East Hampton
Disability Class: Hearing Difficulty
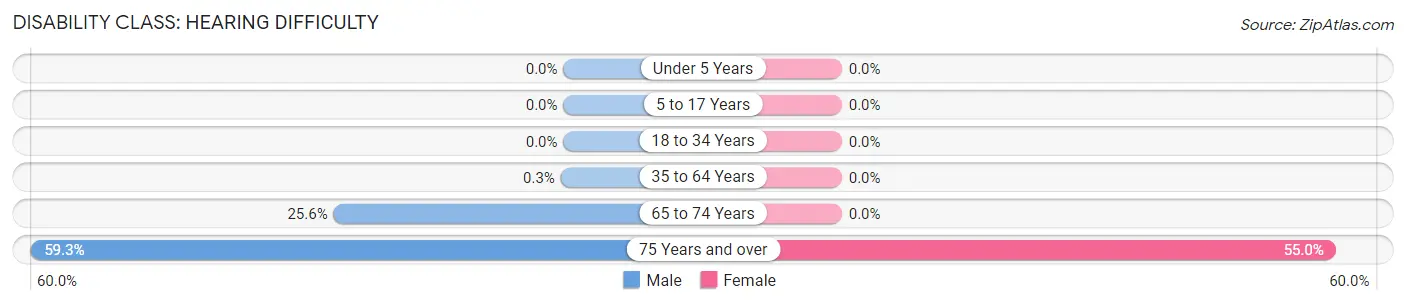
| Age Bracket | Male | Female |
| Under 5 Years | 0 (0.0%) | 0 (0.0%) |
| 5 to 17 Years | 0 (0.0%) | 0 (0.0%) |
| 18 to 34 Years | 0 (0.0%) | 0 (0.0%) |
| 35 to 64 Years | 2 (0.3%) | 0 (0.0%) |
| 65 to 74 Years | 53 (25.6%) | 0 (0.0%) |
| 75 Years and over | 16 (59.3%) | 44 (55.0%) |
Disability Class: Vision Difficulty
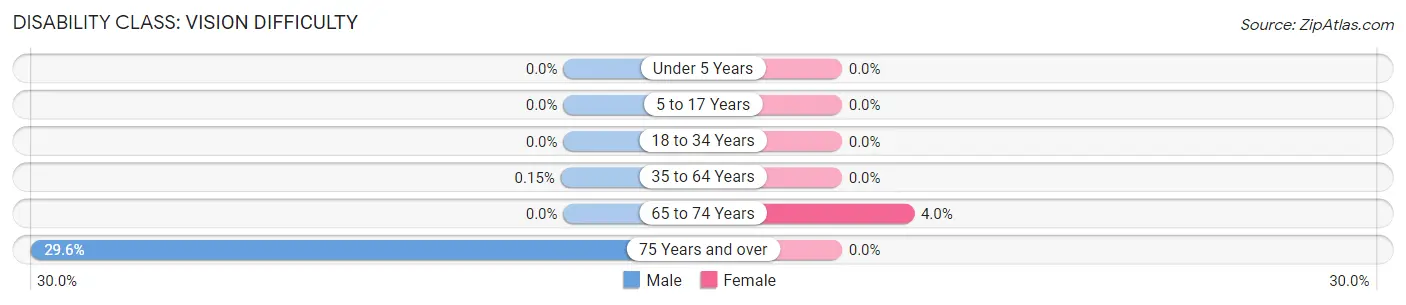
| Age Bracket | Male | Female |
| Under 5 Years | 0 (0.0%) | 0 (0.0%) |
| 5 to 17 Years | 0 (0.0%) | 0 (0.0%) |
| 18 to 34 Years | 0 (0.0%) | 0 (0.0%) |
| 35 to 64 Years | 1 (0.2%) | 0 (0.0%) |
| 65 to 74 Years | 0 (0.0%) | 10 (4.0%) |
| 75 Years and over | 8 (29.6%) | 0 (0.0%) |
Disability Class: Cognitive Difficulty
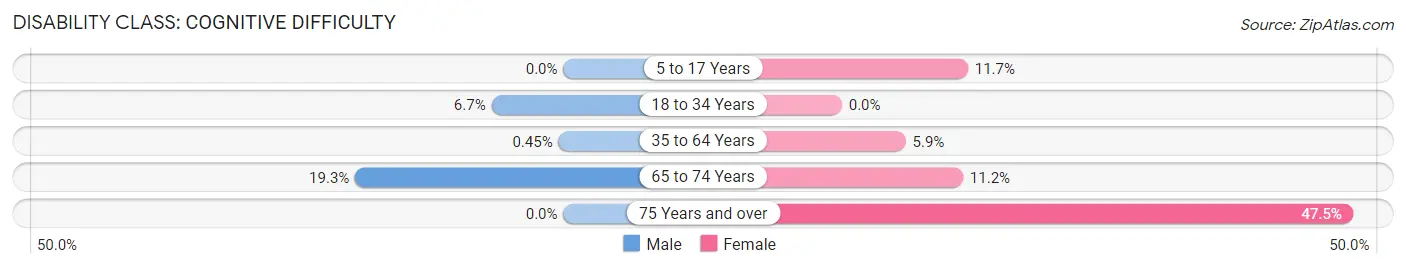
| Age Bracket | Male | Female |
| 5 to 17 Years | 0 (0.0%) | 18 (11.7%) |
| 18 to 34 Years | 13 (6.7%) | 0 (0.0%) |
| 35 to 64 Years | 3 (0.4%) | 29 (5.9%) |
| 65 to 74 Years | 40 (19.3%) | 28 (11.2%) |
| 75 Years and over | 0 (0.0%) | 38 (47.5%) |
Disability Class: Ambulatory Difficulty
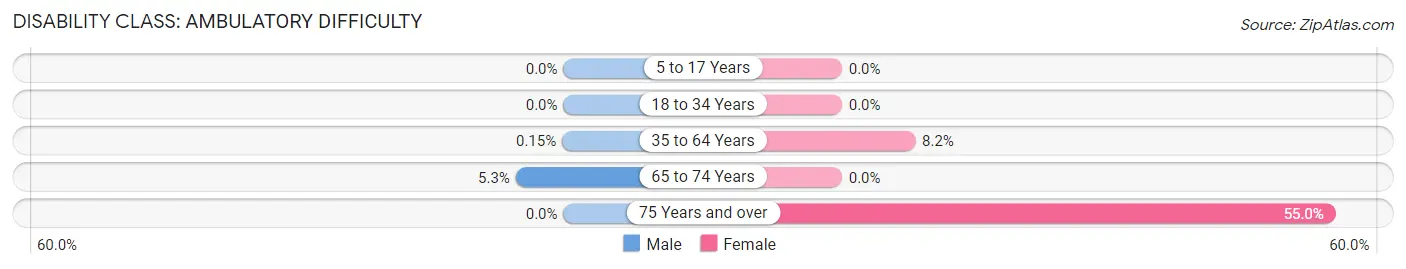
| Age Bracket | Male | Female |
| 5 to 17 Years | 0 (0.0%) | 0 (0.0%) |
| 18 to 34 Years | 0 (0.0%) | 0 (0.0%) |
| 35 to 64 Years | 1 (0.2%) | 40 (8.2%) |
| 65 to 74 Years | 11 (5.3%) | 0 (0.0%) |
| 75 Years and over | 0 (0.0%) | 44 (55.0%) |
Disability Class: Self-Care Difficulty
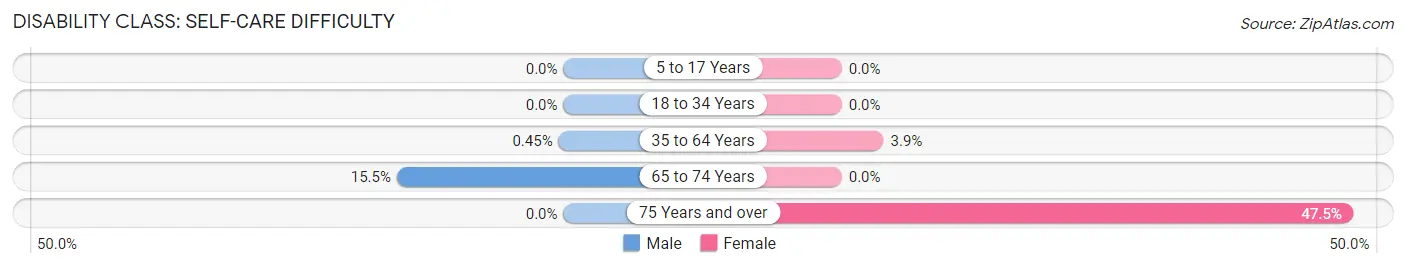
| Age Bracket | Male | Female |
| 5 to 17 Years | 0 (0.0%) | 0 (0.0%) |
| 18 to 34 Years | 0 (0.0%) | 0 (0.0%) |
| 35 to 64 Years | 3 (0.4%) | 19 (3.9%) |
| 65 to 74 Years | 32 (15.5%) | 0 (0.0%) |
| 75 Years and over | 0 (0.0%) | 38 (47.5%) |
Technology Access in East Hampton
Computing Device Access in East Hampton
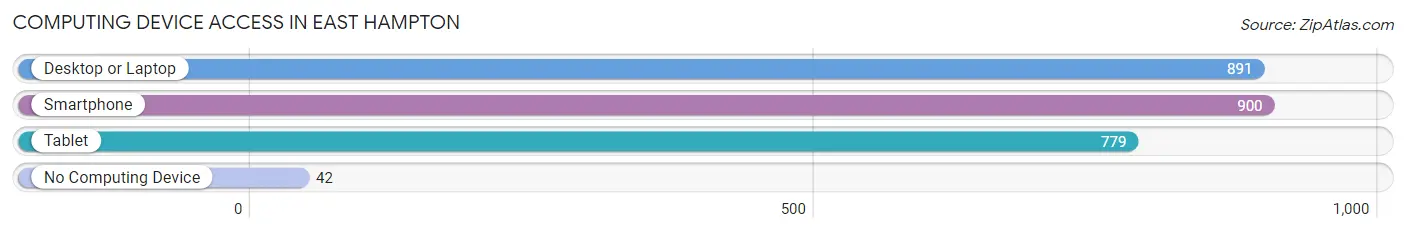
| Device Type | # Households | % Households |
| Desktop or Laptop | 891 | 86.9% |
| Smartphone | 900 | 87.8% |
| Tablet | 779 | 76.0% |
| No Computing Device | 42 | 4.1% |
| Total | 1,025 | 100.0% |
Internet Access in East Hampton
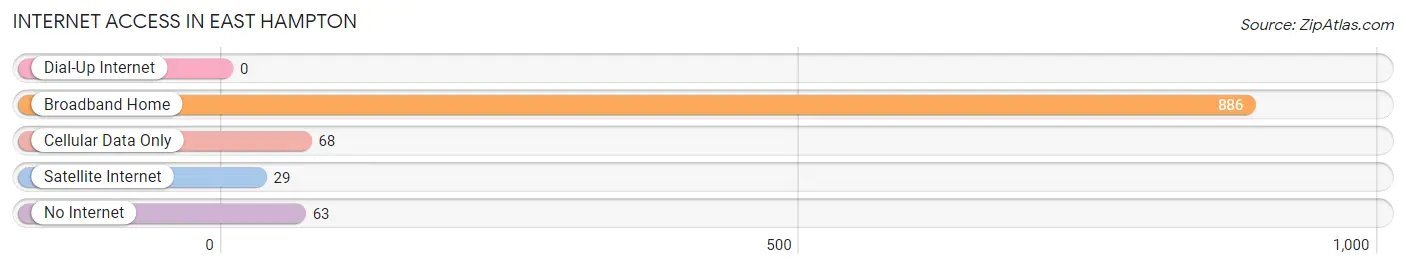
| Internet Type | # Households | % Households |
| Dial-Up Internet | 0 | 0.0% |
| Broadband Home | 886 | 86.4% |
| Cellular Data Only | 68 | 6.6% |
| Satellite Internet | 29 | 2.8% |
| No Internet | 63 | 6.1% |
| Total | 1,025 | 100.0% |
East Hampton Summary
Introduction
East Hampton is a town located in Middlesex County, Connecticut, United States. It is situated in the southeastern part of the state, about 20 miles east of Hartford. The town was incorporated in 1767 and has a population of 12,959 as of the 2010 census. East Hampton is known for its rural charm and its proximity to the Connecticut River. The town is home to several historic sites, including the East Hampton Historical Society, the East Hampton Town Hall, and the East Hampton Congregational Church.
History
East Hampton was first settled in 1639 by a group of settlers from Hartford, Connecticut. The town was originally known as Chatham, but was renamed East Hampton in 1767. The town was incorporated in 1767 and has remained largely unchanged since then.
The town was an important center of the Revolutionary War, with several battles taking place in the area. The town was also the site of the first public school in Connecticut, which was established in 1790.
East Hampton was an agricultural community for much of its history, with dairy farming and apple orchards being the main sources of income. The town also had several mills, including a grist mill, a saw mill, and a paper mill.
Geography
East Hampton is located in the southeastern part of Connecticut, about 20 miles east of Hartford. The town is bordered by the towns of Colchester to the north, Hebron to the east, Marlborough to the south, and Glastonbury to the west.
The town is situated on the banks of the Connecticut River, which forms the western border of the town. The town is also home to several lakes, including Lake Pocotopaug, Lake Hayward, and Lake Pocotopaug.
The town has a total area of 28.3 square miles, of which 28.2 square miles is land and 0.1 square miles is water.
Economy
East Hampton has a diverse economy, with a mix of manufacturing, retail, and service industries. The town is home to several large employers, including Pratt & Whitney, a manufacturer of aircraft engines, and the East Hampton Public Schools.
The town also has a thriving tourism industry, with several attractions, including the East Hampton Historical Society, the East Hampton Town Hall, and the East Hampton Congregational Church.
Demographics
As of the 2010 census, East Hampton had a population of 12,959. The racial makeup of the town was 95.3% White, 1.2% African American, 0.3% Native American, 0.9% Asian, 0.1% Pacific Islander, 0.7% from other races, and 1.6% from two or more races. Hispanic or Latino of any race were 2.7% of the population.
The median income for a household in the town was $68,945, and the median income for a family was $77,945. The per capita income for the town was $30,945.
Conclusion
East Hampton is a small town located in southeastern Connecticut, about 20 miles east of Hartford. The town was incorporated in 1767 and has a population of 12,959 as of the 2010 census. East Hampton is known for its rural charm and its proximity to the Connecticut River. The town has a diverse economy, with a mix of manufacturing, retail, and service industries. The town also has a thriving tourism industry, with several attractions, including the East Hampton Historical Society, the East Hampton Town Hall, and the East Hampton Congregational Church.
Common Questions
What is Per Capita Income in East Hampton?
Per Capita income in East Hampton is $42,508.
What is the Median Family Income in East Hampton?
Median Family Income in East Hampton is $128,457.
What is the Median Household income in East Hampton?
Median Household Income in East Hampton is $122,426.
What is Income or Wage Gap in East Hampton?
Income or Wage Gap in East Hampton is 47.8%.
Women in East Hampton earn 52.2 cents for every dollar earned by a man.
What is Inequality or Gini Index in East Hampton?
Inequality or Gini Index in East Hampton is 0.31.
What is the Total Population of East Hampton?
Total Population of East Hampton is 2,944.
What is the Total Male Population of East Hampton?
Total Male Population of East Hampton is 1,384.
What is the Total Female Population of East Hampton?
Total Female Population of East Hampton is 1,560.
What is the Ratio of Males per 100 Females in East Hampton?
There are 88.72 Males per 100 Females in East Hampton.
What is the Ratio of Females per 100 Males in East Hampton?
There are 112.72 Females per 100 Males in East Hampton.
What is the Median Population Age in East Hampton?
Median Population Age in East Hampton is 45.5 Years.
What is the Average Family Size in East Hampton
Average Family Size in East Hampton is 3.1 People.
What is the Average Household Size in East Hampton
Average Household Size in East Hampton is 2.8 People.
How Large is the Labor Force in East Hampton?
There are 1,529 People in the Labor Forcein in East Hampton.
What is the Percentage of People in the Labor Force in East Hampton?
62.9% of People are in the Labor Force in East Hampton.
What is the Unemployment Rate in East Hampton?
Unemployment Rate in East Hampton is 4.5%.