Storrs, CT Map & Demographics
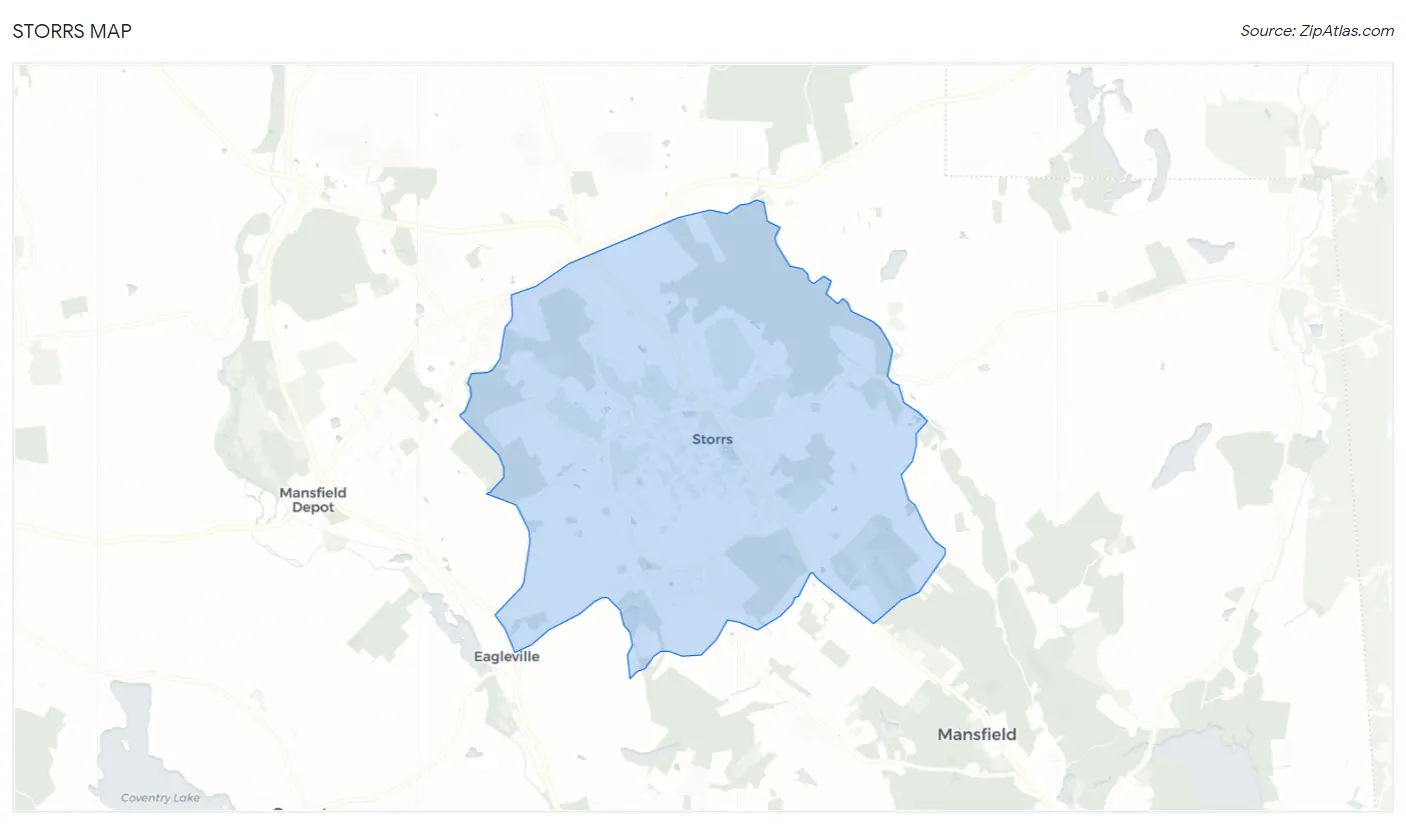
Storrs Map
Storrs Overview
$14,547
PER CAPITA INCOME
$138,800
AVG FAMILY INCOME
$27,793
AVG HOUSEHOLD INCOME
25.2%
WAGE / INCOME GAP [ % ]
74.8¢/ $1
WAGE / INCOME GAP [ $ ]
0.66
INEQUALITY / GINI INDEX
17,606
TOTAL POPULATION
7,951
MALE POPULATION
9,655
FEMALE POPULATION
82.35
MALES / 100 FEMALES
121.43
FEMALES / 100 MALES
20.4
MEDIAN AGE
3.1
AVG FAMILY SIZE
2.1
AVG HOUSEHOLD SIZE
7,563
LABOR FORCE [ PEOPLE ]
43.8%
PERCENT IN LABOR FORCE
12.5%
UNEMPLOYMENT RATE
Storrs Area Codes
Income in Storrs
Income Overview in Storrs
Per Capita Income in Storrs is $14,547, while median incomes of families and households are $138,800 and $27,793 respectively.
| Characteristic | Number | Measure |
| Per Capita Income | 17,606 | $14,547 |
| Median Family Income | 538 | $138,800 |
| Mean Family Income | 538 | $199,880 |
| Median Household Income | 2,241 | $27,793 |
| Mean Household Income | 2,241 | $88,752 |
| Income Deficit | 538 | $0 |
| Wage / Income Gap (%) | 17,606 | 25.23% |
| Wage / Income Gap ($) | 17,606 | 74.77¢ per $1 |
| Gini / Inequality Index | 17,606 | 0.66 |
Earnings by Sex in Storrs
Average Earnings in Storrs are $4,900, $5,929 for men and $4,433 for women, a difference of 25.2%.
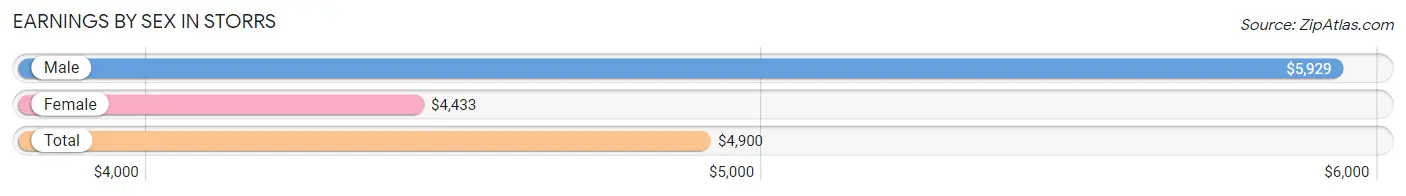
| Sex | Number | Average Earnings |
| Male | 4,858 (39.5%) | $5,929 |
| Female | 7,439 (60.5%) | $4,433 |
| Total | 12,297 (100.0%) | $4,900 |
Earnings by Sex by Income Bracket in Storrs
The most common earnings brackets in Storrs are $2,500 to $4,999 for men (1,051 | 21.6%) and $2,500 to $4,999 for women (2,153 | 28.9%).
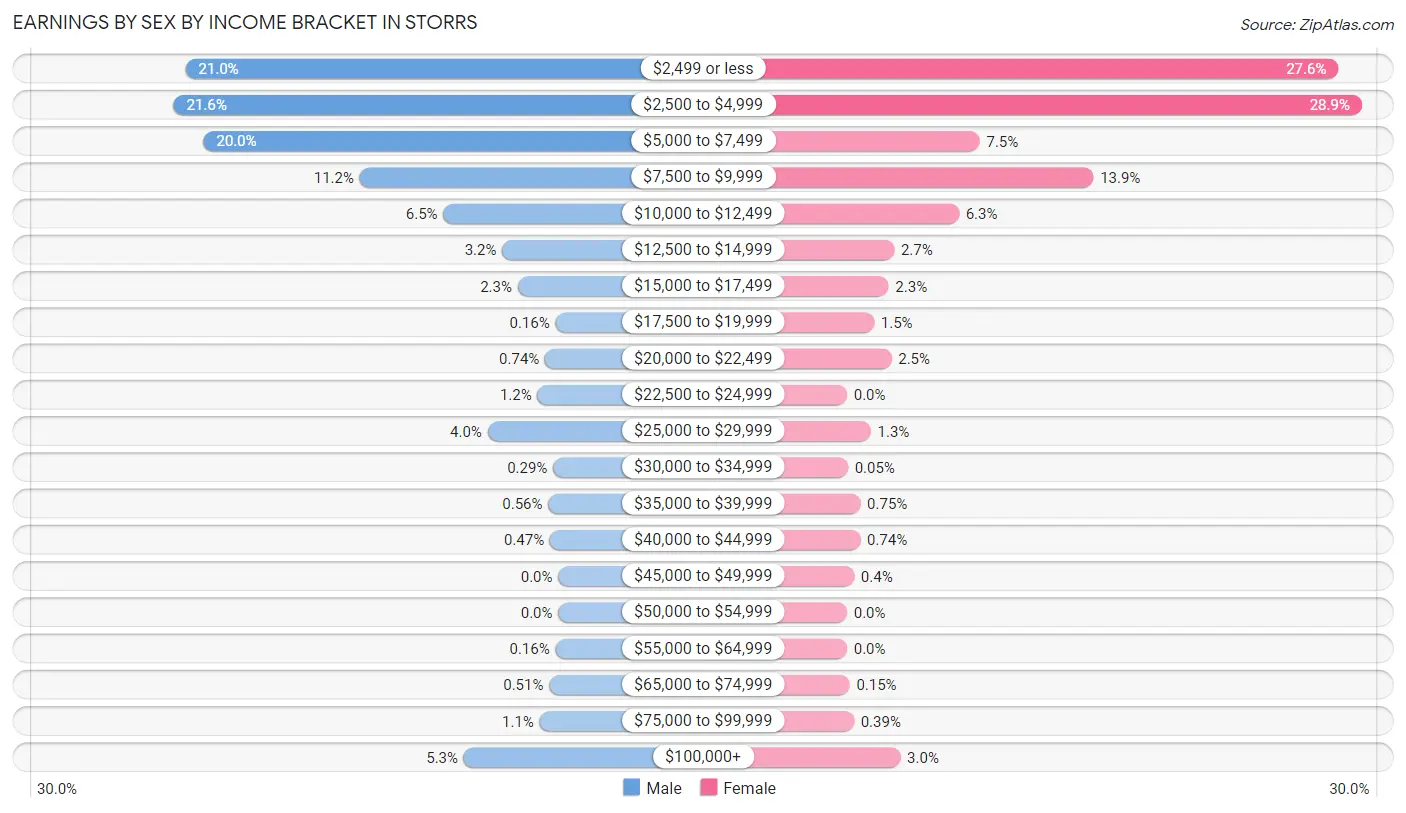
| Income | Male | Female |
| $2,499 or less | 1,018 (21.0%) | 2,055 (27.6%) |
| $2,500 to $4,999 | 1,051 (21.6%) | 2,153 (28.9%) |
| $5,000 to $7,499 | 969 (20.0%) | 555 (7.5%) |
| $7,500 to $9,999 | 542 (11.2%) | 1,030 (13.9%) |
| $10,000 to $12,499 | 314 (6.5%) | 468 (6.3%) |
| $12,500 to $14,999 | 153 (3.2%) | 197 (2.6%) |
| $15,000 to $17,499 | 111 (2.3%) | 174 (2.3%) |
| $17,500 to $19,999 | 8 (0.2%) | 113 (1.5%) |
| $20,000 to $22,499 | 36 (0.7%) | 186 (2.5%) |
| $22,500 to $24,999 | 57 (1.2%) | 0 (0.0%) |
| $25,000 to $29,999 | 193 (4.0%) | 100 (1.3%) |
| $30,000 to $34,999 | 14 (0.3%) | 4 (0.1%) |
| $35,000 to $39,999 | 27 (0.6%) | 56 (0.7%) |
| $40,000 to $44,999 | 23 (0.5%) | 55 (0.7%) |
| $45,000 to $49,999 | 0 (0.0%) | 30 (0.4%) |
| $50,000 to $54,999 | 0 (0.0%) | 0 (0.0%) |
| $55,000 to $64,999 | 8 (0.2%) | 0 (0.0%) |
| $65,000 to $74,999 | 25 (0.5%) | 11 (0.2%) |
| $75,000 to $99,999 | 51 (1.1%) | 29 (0.4%) |
| $100,000+ | 258 (5.3%) | 223 (3.0%) |
| Total | 4,858 (100.0%) | 7,439 (100.0%) |
Earnings by Sex by Educational Attainment in Storrs
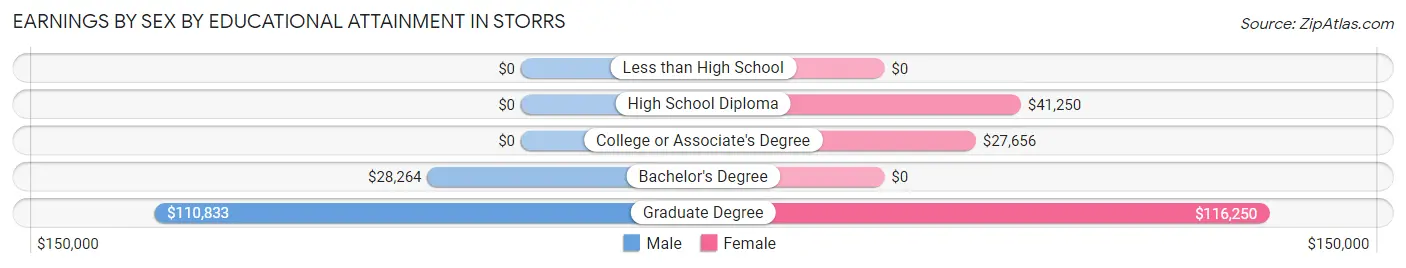
| Educational Attainment | Male Income | Female Income |
| Less than High School | - | - |
| High School Diploma | - | - |
| College or Associate's Degree | - | - |
| Bachelor's Degree | $28,264 | $0 |
| Graduate Degree | $110,833 | $116,250 |
| Total | $62,813 | $0 |
Family Income in Storrs
Family Income Brackets in Storrs
According to the Storrs family income data, there are 180 families falling into the $200,000+ income range, which is the most common income bracket and makes up 33.5% of all families.
| Income Bracket | # Families | % Families |
| Less than $10,000 | 0 | 0.0% |
| $10,000 to $14,999 | 0 | 0.0% |
| $15,000 to $24,999 | 19 | 3.5% |
| $25,000 to $34,999 | 32 | 5.9% |
| $35,000 to $49,999 | 23 | 4.3% |
| $50,000 to $74,999 | 37 | 6.9% |
| $75,000 to $99,999 | 29 | 5.4% |
| $100,000 to $149,999 | 160 | 29.7% |
| $150,000 to $199,999 | 58 | 10.8% |
| $200,000+ | 180 | 33.5% |
Family Income by Famaliy Size in Storrs
2-person families (243 | 45.2%) account for the highest median family income in Storrs with $158,472 per family, while 2-person families (243 | 45.2%) have the highest median income of $79,236 per family member.
| Income Bracket | # Families | Median Income |
| 2-Person Families | 243 (45.2%) | $158,472 |
| 3-Person Families | 134 (24.9%) | $0 |
| 4-Person Families | 134 (24.9%) | $109,848 |
| 5-Person Families | 4 (0.7%) | $0 |
| 6-Person Families | 23 (4.3%) | $0 |
| 7+ Person Families | 0 (0.0%) | $0 |
| Total | 538 (100.0%) | $138,800 |
Family Income by Number of Earners in Storrs
| Number of Earners | # Families | Median Income |
| No Earners | 57 (10.6%) | $130,461 |
| 1 Earner | 196 (36.4%) | $179,063 |
| 2 Earners | 276 (51.3%) | $139,100 |
| 3+ Earners | 9 (1.7%) | $0 |
| Total | 538 (100.0%) | $138,800 |
Household Income in Storrs
Household Income Brackets in Storrs
With 596 households falling in the category, the less than $10,000 income range is the most frequent in Storrs, accounting for 26.6% of all households. In contrast, only 45 households (2.0%) fall into the $75,000 to $99,999 income bracket, making it the least populous group.
| Income Bracket | # Households | % Households |
| Less than $10,000 | 596 | 26.6% |
| $10,000 to $14,999 | 119 | 5.3% |
| $15,000 to $24,999 | 363 | 16.2% |
| $25,000 to $34,999 | 168 | 7.5% |
| $35,000 to $49,999 | 137 | 6.1% |
| $50,000 to $74,999 | 105 | 4.7% |
| $75,000 to $99,999 | 45 | 2.0% |
| $100,000 to $149,999 | 262 | 11.7% |
| $150,000 to $199,999 | 58 | 2.6% |
| $200,000+ | 390 | 17.4% |
Household Income by Householder Age in Storrs
The median household income in Storrs is $27,793, with the highest median household income of $224,671 found in the 45 to 64 years age bracket for the primary householder. A total of 309 households (13.8%) fall into this category. Meanwhile, the 15 to 24 years age bracket for the primary householder has the lowest median household income of $13,598, with 984 households (43.9%) in this group.
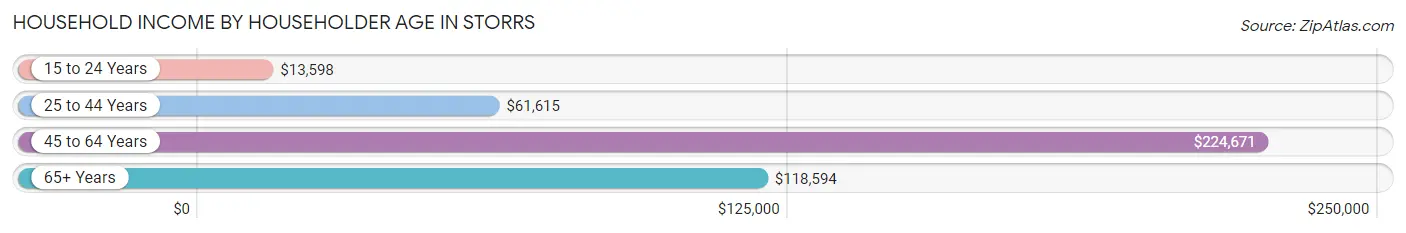
| Income Bracket | # Households | Median Income |
| 15 to 24 Years | 984 (43.9%) | $13,598 |
| 25 to 44 Years | 305 (13.6%) | $61,615 |
| 45 to 64 Years | 309 (13.8%) | $224,671 |
| 65+ Years | 643 (28.7%) | $118,594 |
| Total | 2,241 (100.0%) | $27,793 |
Poverty in Storrs
Income Below Poverty by Sex and Age in Storrs
With 55.5% poverty level for males and 34.2% for females among the residents of Storrs, 18 to 24 year old males and 18 to 24 year old females are the most vulnerable to poverty, with 1,105 males (87.4%) and 589 females (65.7%) in their respective age groups living below the poverty level.
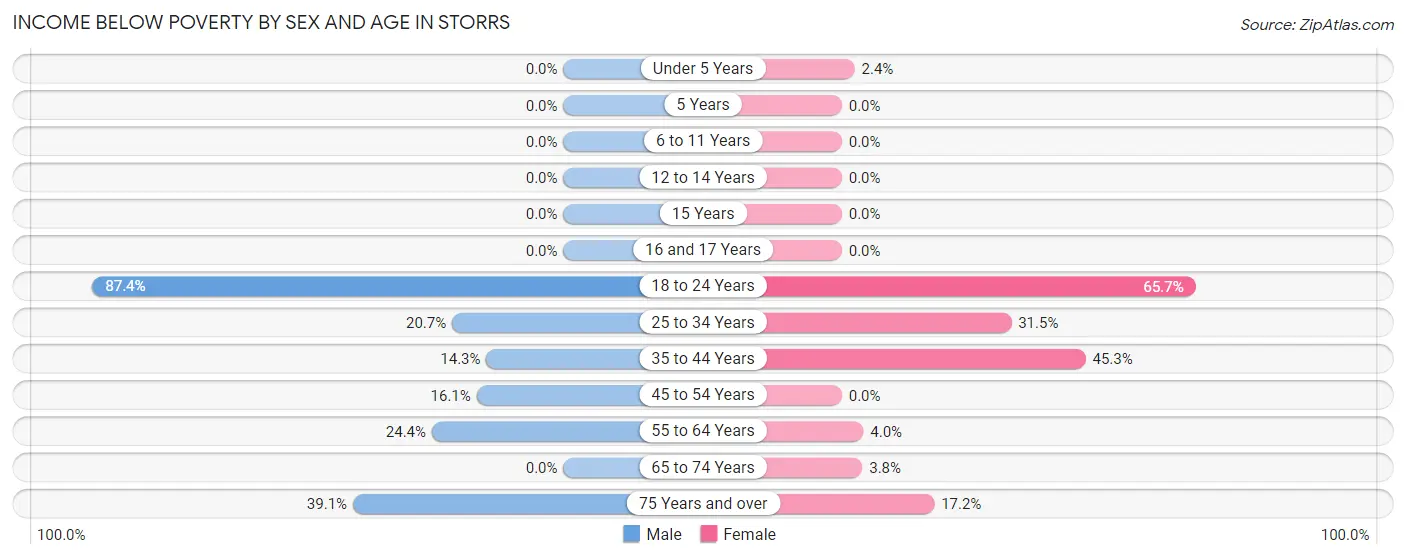
| Age Bracket | Male | Female |
| Under 5 Years | 0 (0.0%) | 1 (2.4%) |
| 5 Years | 0 (0.0%) | 0 (0.0%) |
| 6 to 11 Years | 0 (0.0%) | 0 (0.0%) |
| 12 to 14 Years | 0 (0.0%) | 0 (0.0%) |
| 15 Years | 0 (0.0%) | 0 (0.0%) |
| 16 and 17 Years | 0 (0.0%) | 0 (0.0%) |
| 18 to 24 Years | 1,105 (87.4%) | 589 (65.7%) |
| 25 to 34 Years | 44 (20.7%) | 50 (31.5%) |
| 35 to 44 Years | 24 (14.3%) | 81 (45.3%) |
| 45 to 54 Years | 19 (16.1%) | 0 (0.0%) |
| 55 to 64 Years | 31 (24.4%) | 9 (4.0%) |
| 65 to 74 Years | 0 (0.0%) | 9 (3.8%) |
| 75 Years and over | 50 (39.1%) | 59 (17.2%) |
| Total | 1,273 (55.5%) | 798 (34.2%) |
Income Above Poverty by Sex and Age in Storrs
According to the poverty statistics in Storrs, males aged under 5 years and females aged 5 years are the age groups that are most secure financially, with 100.0% of males and 100.0% of females in these age groups living above the poverty line.
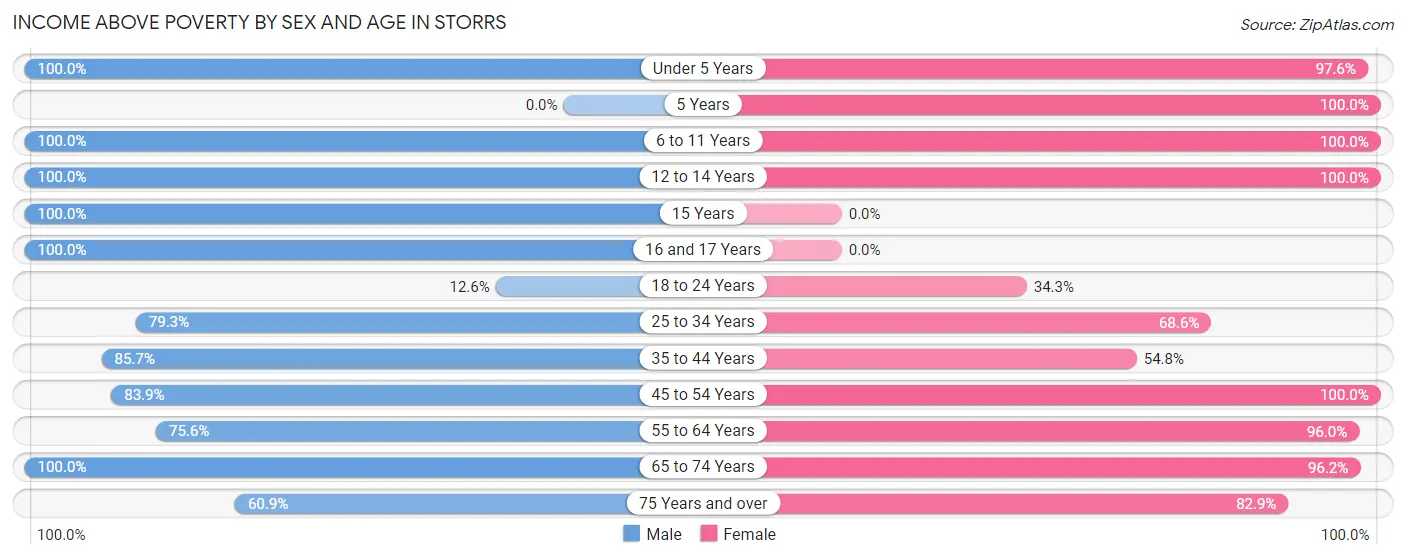
| Age Bracket | Male | Female |
| Under 5 Years | 8 (100.0%) | 41 (97.6%) |
| 5 Years | 0 (0.0%) | 22 (100.0%) |
| 6 to 11 Years | 32 (100.0%) | 141 (100.0%) |
| 12 to 14 Years | 65 (100.0%) | 20 (100.0%) |
| 15 Years | 9 (100.0%) | 0 (0.0%) |
| 16 and 17 Years | 14 (100.0%) | 0 (0.0%) |
| 18 to 24 Years | 159 (12.6%) | 308 (34.3%) |
| 25 to 34 Years | 169 (79.3%) | 109 (68.5%) |
| 35 to 44 Years | 144 (85.7%) | 98 (54.7%) |
| 45 to 54 Years | 99 (83.9%) | 70 (100.0%) |
| 55 to 64 Years | 96 (75.6%) | 216 (96.0%) |
| 65 to 74 Years | 148 (100.0%) | 228 (96.2%) |
| 75 Years and over | 78 (60.9%) | 285 (82.9%) |
| Total | 1,021 (44.5%) | 1,538 (65.8%) |
Income Below Poverty Among Married-Couple Families in Storrs
The poverty statistics for married-couple families in Storrs show that 4.3% or 19 of the total 438 families live below the poverty line. Families with 1 or 2 children have the highest poverty rate of 12.0%, comprising of 19 families. On the other hand, families with no children have the lowest poverty rate of 0.0%, which includes 0 families.
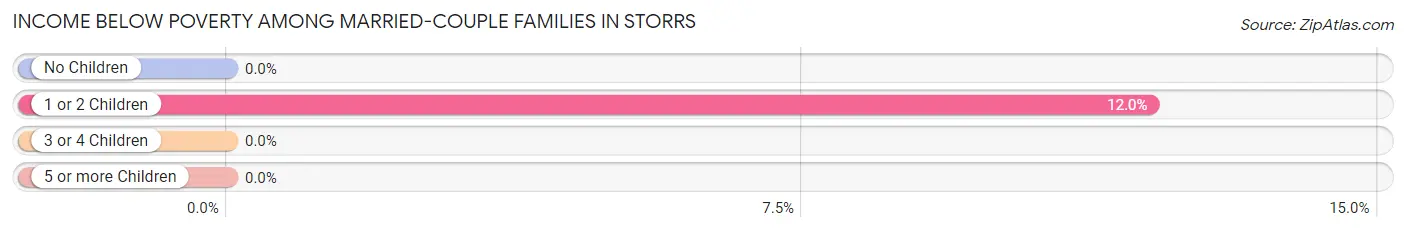
| Children | Above Poverty | Below Poverty |
| No Children | 253 (100.0%) | 0 (0.0%) |
| 1 or 2 Children | 139 (88.0%) | 19 (12.0%) |
| 3 or 4 Children | 27 (100.0%) | 0 (0.0%) |
| 5 or more Children | 0 (0.0%) | 0 (0.0%) |
| Total | 419 (95.7%) | 19 (4.3%) |
Income Below Poverty Among Single-Parent Households in Storrs
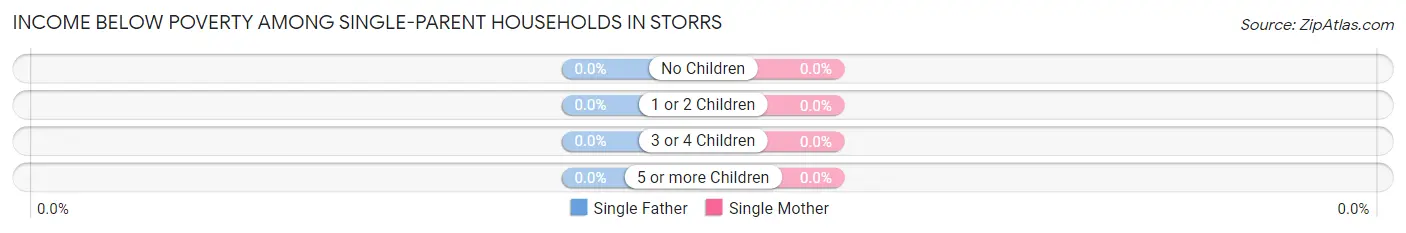
| Children | Single Father | Single Mother |
| No Children | 0 (0.0%) | 0 (0.0%) |
| 1 or 2 Children | 0 (0.0%) | 0 (0.0%) |
| 3 or 4 Children | 0 (0.0%) | 0 (0.0%) |
| 5 or more Children | 0 (0.0%) | 0 (0.0%) |
| Total | 0 (0.0%) | 0 (0.0%) |
Income Below Poverty Among Married-Couple vs Single-Parent Households in Storrs
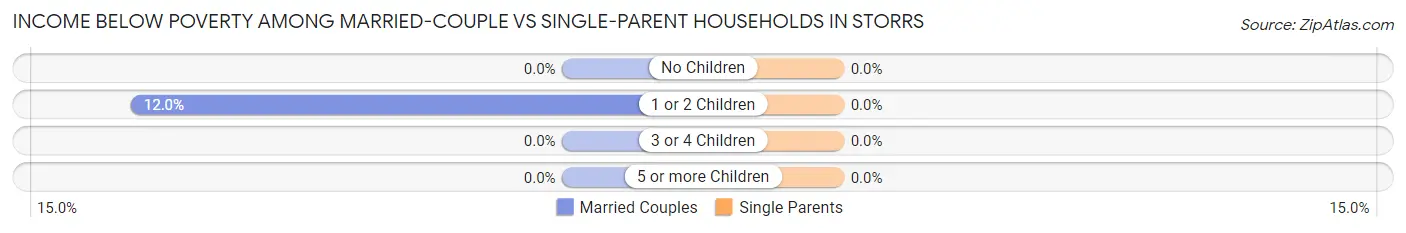
| Children | Married-Couple Families | Single-Parent Households |
| No Children | 0 (0.0%) | 0 (0.0%) |
| 1 or 2 Children | 19 (12.0%) | 0 (0.0%) |
| 3 or 4 Children | 0 (0.0%) | 0 (0.0%) |
| 5 or more Children | 0 (0.0%) | 0 (0.0%) |
| Total | 19 (4.3%) | 0 (0.0%) |
Race in Storrs
The most populous races in Storrs are White / Caucasian (12,916 | 73.4%), Asian (2,807 | 15.9%), and Hispanic or Latino (1,100 | 6.2%).
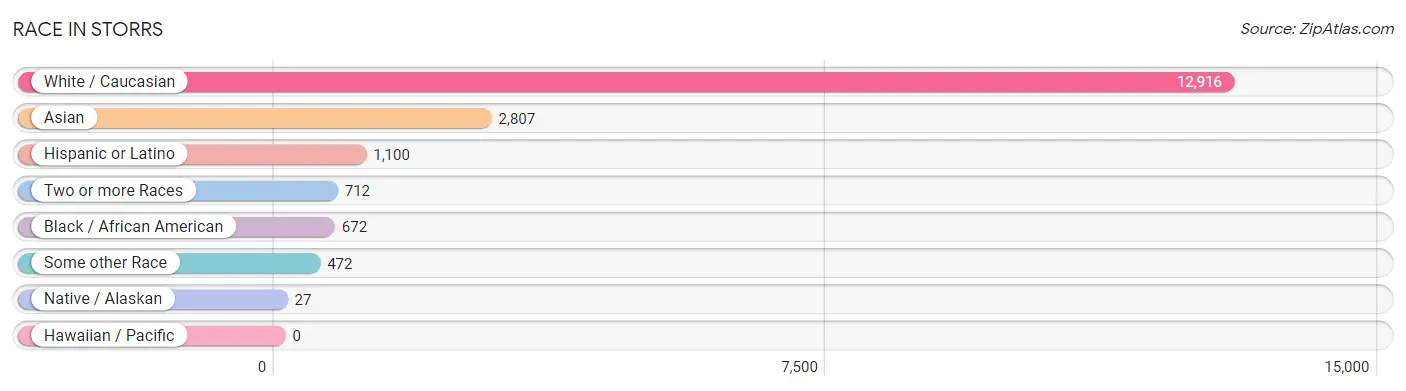
| Race | # Population | % Population |
| Asian | 2,807 | 15.9% |
| Black / African American | 672 | 3.8% |
| Hawaiian / Pacific | 0 | 0.0% |
| Hispanic or Latino | 1,100 | 6.2% |
| Native / Alaskan | 27 | 0.2% |
| White / Caucasian | 12,916 | 73.4% |
| Two or more Races | 712 | 4.0% |
| Some other Race | 472 | 2.7% |
| Total | 17,606 | 100.0% |
Ancestry in Storrs
The most populous ancestries reported in Storrs are Indian (Asian) (1,994 | 11.3%), Irish (977 | 5.6%), Italian (761 | 4.3%), English (482 | 2.7%), and German (467 | 2.6%), together accounting for 26.6% of all Storrs residents.
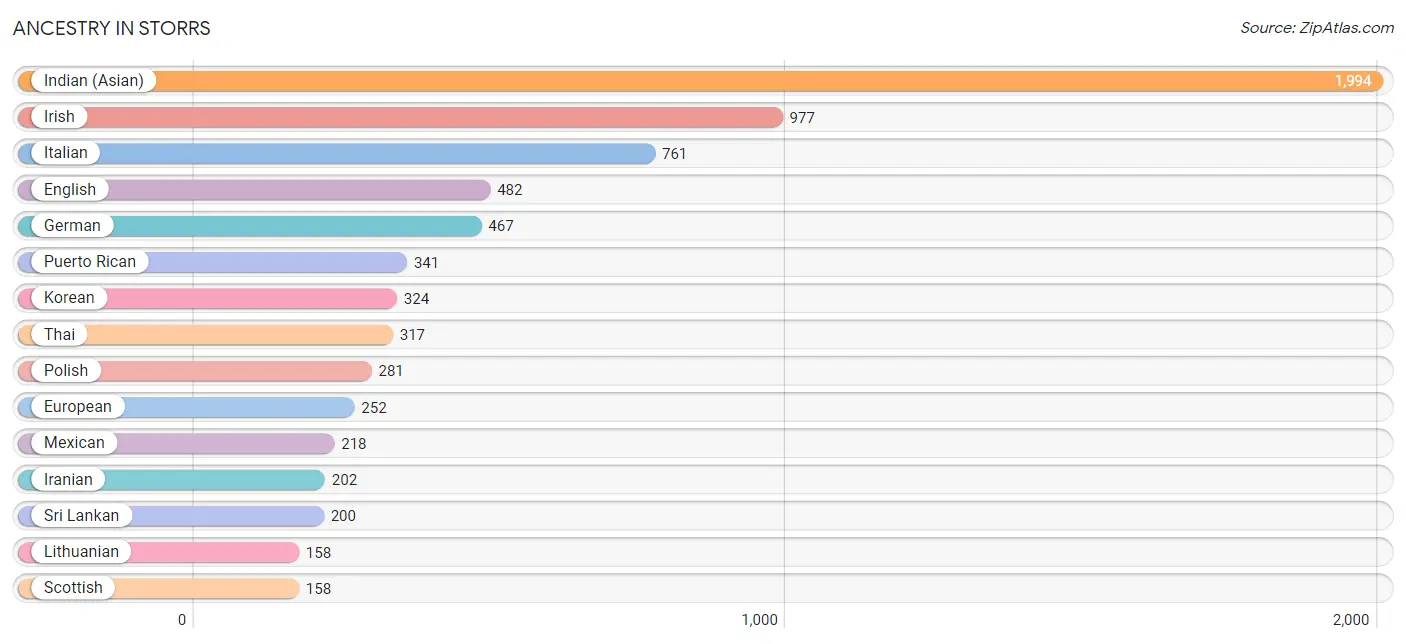
| Ancestry | # Population | % Population |
| African | 24 | 0.1% |
| American | 14 | 0.1% |
| Arab | 73 | 0.4% |
| Argentinean | 27 | 0.2% |
| Armenian | 9 | 0.1% |
| Blackfeet | 13 | 0.1% |
| Brazilian | 58 | 0.3% |
| British | 56 | 0.3% |
| Burmese | 65 | 0.4% |
| Canadian | 4 | 0.0% |
| Central American | 152 | 0.9% |
| Croatian | 19 | 0.1% |
| Danish | 11 | 0.1% |
| Dutch | 34 | 0.2% |
| Eastern European | 31 | 0.2% |
| Ecuadorian | 71 | 0.4% |
| Egyptian | 5 | 0.0% |
| English | 482 | 2.7% |
| European | 252 | 1.4% |
| Finnish | 38 | 0.2% |
| French | 126 | 0.7% |
| French Canadian | 39 | 0.2% |
| German | 467 | 2.6% |
| Greek | 19 | 0.1% |
| Guatemalan | 111 | 0.6% |
| Hungarian | 62 | 0.4% |
| Icelander | 36 | 0.2% |
| Indian (Asian) | 1,994 | 11.3% |
| Iranian | 202 | 1.1% |
| Irish | 977 | 5.6% |
| Italian | 761 | 4.3% |
| Korean | 324 | 1.8% |
| Lebanese | 62 | 0.4% |
| Lithuanian | 158 | 0.9% |
| Mexican | 218 | 1.2% |
| Norwegian | 55 | 0.3% |
| Pakistani | 37 | 0.2% |
| Peruvian | 36 | 0.2% |
| Polish | 281 | 1.6% |
| Portuguese | 10 | 0.1% |
| Puerto Rican | 341 | 1.9% |
| Russian | 109 | 0.6% |
| Salvadoran | 41 | 0.2% |
| Scandinavian | 17 | 0.1% |
| Scotch-Irish | 26 | 0.2% |
| Scottish | 158 | 0.9% |
| Sioux | 3 | 0.0% |
| South American | 134 | 0.8% |
| South American Indian | 23 | 0.1% |
| Spaniard | 23 | 0.1% |
| Spanish | 153 | 0.9% |
| Sri Lankan | 200 | 1.1% |
| Subsaharan African | 24 | 0.1% |
| Swedish | 28 | 0.2% |
| Syrian | 6 | 0.0% |
| Thai | 317 | 1.8% |
| Ukrainian | 60 | 0.3% |
| Welsh | 53 | 0.3% |
| West Indian | 4 | 0.0% |
| Yugoslavian | 12 | 0.1% | View All 60 Rows |
Immigrants in Storrs
The most numerous immigrant groups reported in Storrs came from Asia (1,903 | 10.8%), Eastern Asia (1,434 | 8.1%), China (1,400 | 8.0%), South Central Asia (289 | 1.6%), and Europe (254 | 1.4%), together accounting for 30.0% of all Storrs residents.
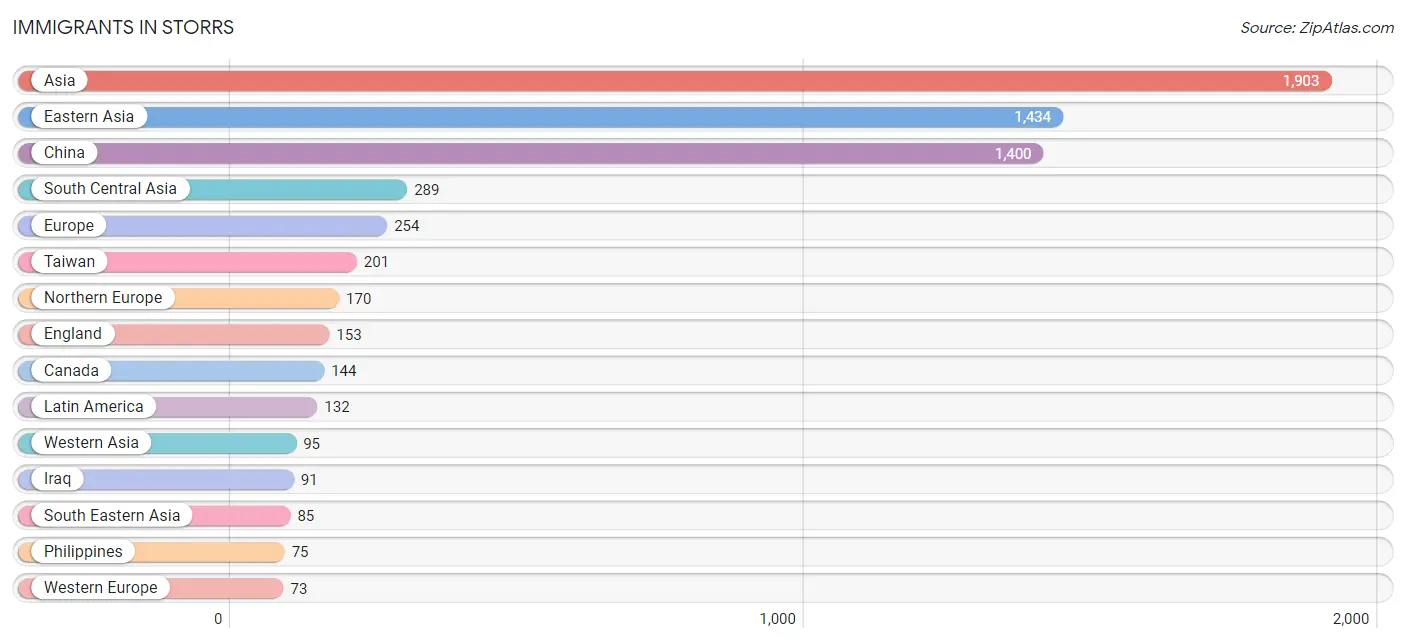
| Immigration Origin | # Population | % Population |
| Africa | 24 | 0.1% |
| Argentina | 4 | 0.0% |
| Asia | 1,903 | 10.8% |
| Bangladesh | 50 | 0.3% |
| Brazil | 48 | 0.3% |
| Canada | 144 | 0.8% |
| Caribbean | 15 | 0.1% |
| Central America | 61 | 0.4% |
| China | 1,400 | 8.0% |
| Eastern Asia | 1,434 | 8.1% |
| Eastern Europe | 11 | 0.1% |
| Egypt | 24 | 0.1% |
| England | 153 | 0.9% |
| Europe | 254 | 1.4% |
| France | 55 | 0.3% |
| Germany | 18 | 0.1% |
| Guatemala | 61 | 0.4% |
| India | 64 | 0.4% |
| Iran | 51 | 0.3% |
| Iraq | 91 | 0.5% |
| Israel | 4 | 0.0% |
| Korea | 34 | 0.2% |
| Latin America | 132 | 0.7% |
| Nepal | 16 | 0.1% |
| Northern Africa | 24 | 0.1% |
| Northern Europe | 170 | 1.0% |
| Pakistan | 44 | 0.3% |
| Peru | 4 | 0.0% |
| Philippines | 75 | 0.4% |
| Poland | 11 | 0.1% |
| South America | 56 | 0.3% |
| South Central Asia | 289 | 1.6% |
| South Eastern Asia | 85 | 0.5% |
| Sri Lanka | 64 | 0.4% |
| Taiwan | 201 | 1.1% |
| Thailand | 2 | 0.0% |
| Vietnam | 8 | 0.1% |
| Western Asia | 95 | 0.5% |
| Western Europe | 73 | 0.4% | View All 39 Rows |
Sex and Age in Storrs
Sex and Age in Storrs
The most populous age groups in Storrs are 20 to 24 Years (3,584 | 45.1%) for men and 20 to 24 Years (4,167 | 43.2%) for women.
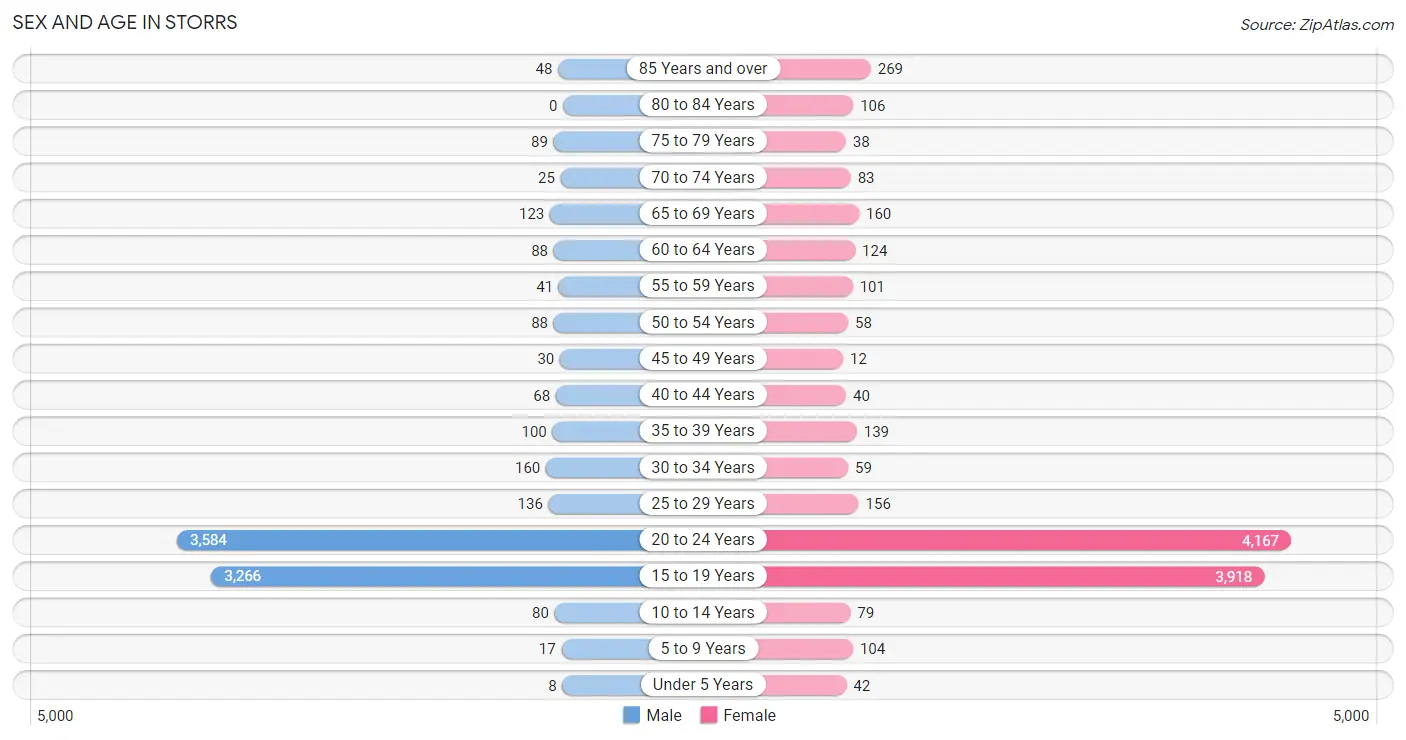
| Age Bracket | Male | Female |
| Under 5 Years | 8 (0.1%) | 42 (0.4%) |
| 5 to 9 Years | 17 (0.2%) | 104 (1.1%) |
| 10 to 14 Years | 80 (1.0%) | 79 (0.8%) |
| 15 to 19 Years | 3,266 (41.1%) | 3,918 (40.6%) |
| 20 to 24 Years | 3,584 (45.1%) | 4,167 (43.2%) |
| 25 to 29 Years | 136 (1.7%) | 156 (1.6%) |
| 30 to 34 Years | 160 (2.0%) | 59 (0.6%) |
| 35 to 39 Years | 100 (1.3%) | 139 (1.4%) |
| 40 to 44 Years | 68 (0.9%) | 40 (0.4%) |
| 45 to 49 Years | 30 (0.4%) | 12 (0.1%) |
| 50 to 54 Years | 88 (1.1%) | 58 (0.6%) |
| 55 to 59 Years | 41 (0.5%) | 101 (1.1%) |
| 60 to 64 Years | 88 (1.1%) | 124 (1.3%) |
| 65 to 69 Years | 123 (1.5%) | 160 (1.7%) |
| 70 to 74 Years | 25 (0.3%) | 83 (0.9%) |
| 75 to 79 Years | 89 (1.1%) | 38 (0.4%) |
| 80 to 84 Years | 0 (0.0%) | 106 (1.1%) |
| 85 Years and over | 48 (0.6%) | 269 (2.8%) |
| Total | 7,951 (100.0%) | 9,655 (100.0%) |
Families and Households in Storrs
Median Family Size in Storrs
The median family size in Storrs is 3.07 persons per family, with married-couple families (438 | 81.4%) accounting for the largest median family size of 3.24 persons per family. On the other hand, single male/father families (35 | 6.5%) represent the smallest median family size with 2.09 persons per family.
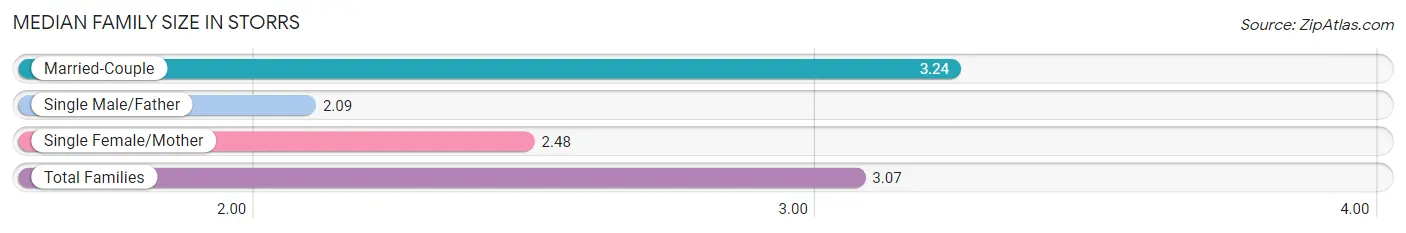
| Family Type | # Families | Family Size |
| Married-Couple | 438 (81.4%) | 3.24 |
| Single Male/Father | 35 (6.5%) | 2.09 |
| Single Female/Mother | 65 (12.1%) | 2.48 |
| Total Families | 538 (100.0%) | 3.07 |
Median Household Size in Storrs
The median household size in Storrs is 2.07 persons per household, with married-couple households (438 | 19.5%) accounting for the largest median household size of 3.27 persons per household. non-family households (1,703 | 76.0%) represent the smallest median household size with 1.72 persons per household.
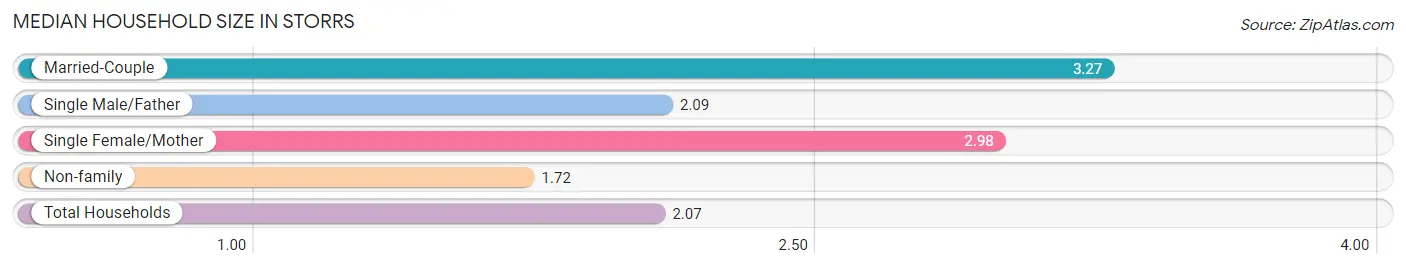
| Household Type | # Households | Household Size |
| Married-Couple | 438 (19.5%) | 3.27 |
| Single Male/Father | 35 (1.6%) | 2.09 |
| Single Female/Mother | 65 (2.9%) | 2.98 |
| Non-family | 1,703 (76.0%) | 1.72 |
| Total Households | 2,241 (100.0%) | 2.07 |
Household Size by Marriage Status in Storrs
Out of a total of 2,241 households in Storrs, 538 (24.0%) are family households, while 1,703 (76.0%) are nonfamily households. The most numerous type of family households are 2-person households, comprising 211, and the most common type of nonfamily households are 1-person households, comprising 968.
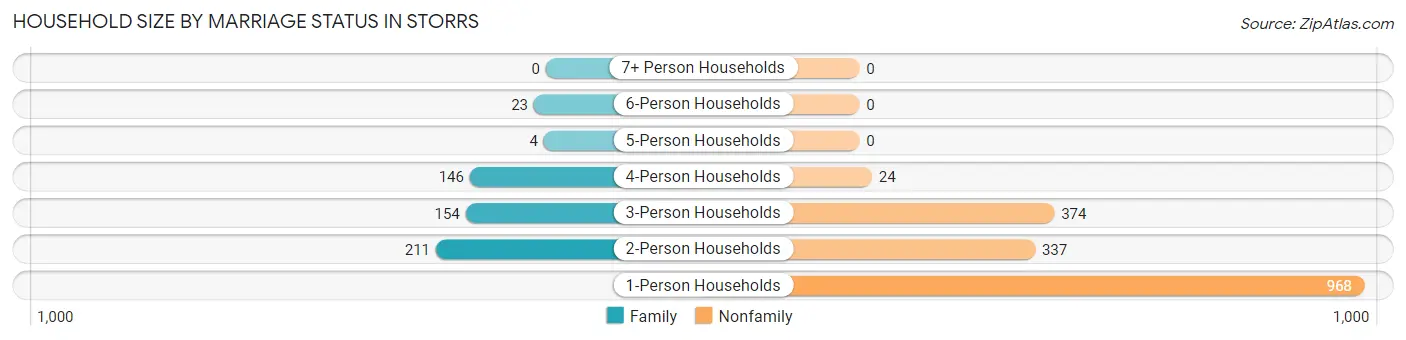
| Household Size | Family Households | Nonfamily Households |
| 1-Person Households | - | 968 (43.2%) |
| 2-Person Households | 211 (9.4%) | 337 (15.0%) |
| 3-Person Households | 154 (6.9%) | 374 (16.7%) |
| 4-Person Households | 146 (6.5%) | 24 (1.1%) |
| 5-Person Households | 4 (0.2%) | 0 (0.0%) |
| 6-Person Households | 23 (1.0%) | 0 (0.0%) |
| 7+ Person Households | 0 (0.0%) | 0 (0.0%) |
| Total | 538 (24.0%) | 1,703 (76.0%) |
Female Fertility in Storrs
Fertility by Age in Storrs
Average fertility rate in Storrs is 4.0 births per 1,000 women. Women in the age bracket of 20 to 34 years have the highest fertility rate with 8.0 births per 1,000 women. Women in the age bracket of 20 to 34 years acount for 100.0% of all women with births.
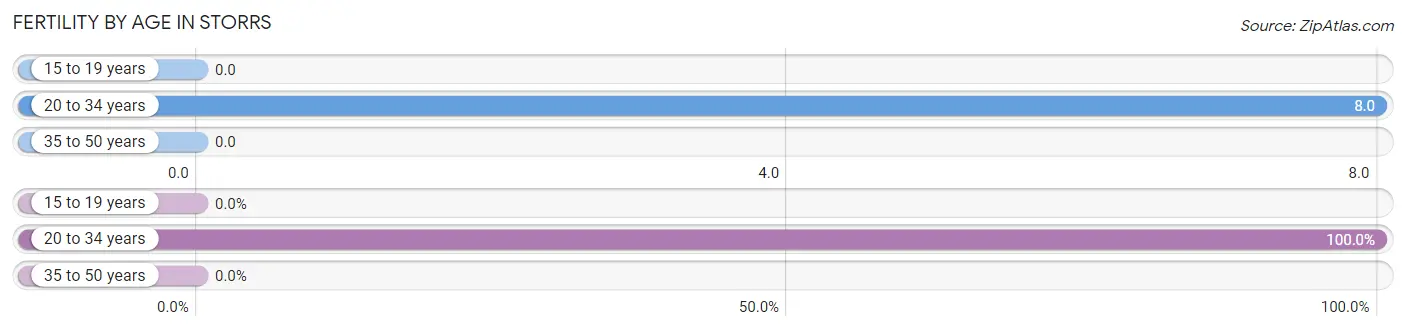
| Age Bracket | Women with Births | Births / 1,000 Women |
| 15 to 19 years | 0 (0.0%) | 0.0 |
| 20 to 34 years | 36 (100.0%) | 8.0 |
| 35 to 50 years | 0 (0.0%) | 0.0 |
| Total | 36 (100.0%) | 4.0 |
Fertility by Age by Marriage Status in Storrs
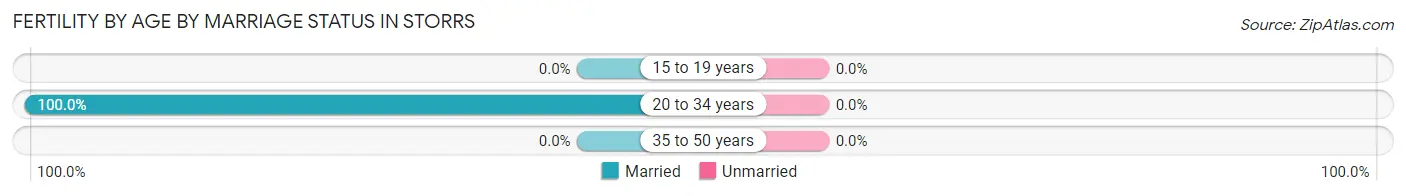
| Age Bracket | Married | Unmarried |
| 15 to 19 years | 0 (0.0%) | 0 (0.0%) |
| 20 to 34 years | 36 (100.0%) | 0 (0.0%) |
| 35 to 50 years | 0 (0.0%) | 0 (0.0%) |
| Total | 36 (100.0%) | 0 (0.0%) |
Fertility by Education in Storrs
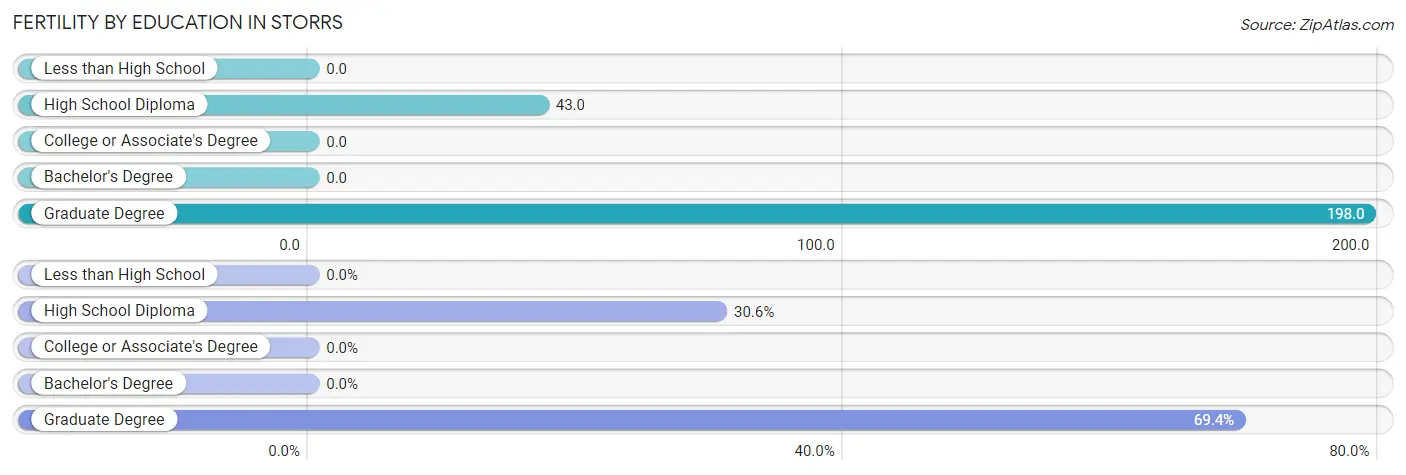
| Educational Attainment | Women with Births | Births / 1,000 Women |
| Less than High School | 0 (0.0%) | 0.0 |
| High School Diploma | 11 (30.6%) | 43.0 |
| College or Associate's Degree | 0 (0.0%) | 0.0 |
| Bachelor's Degree | 0 (0.0%) | 0.0 |
| Graduate Degree | 25 (69.4%) | 198.0 |
| Total | 36 (100.0%) | 4.0 |
Fertility by Education by Marriage Status in Storrs
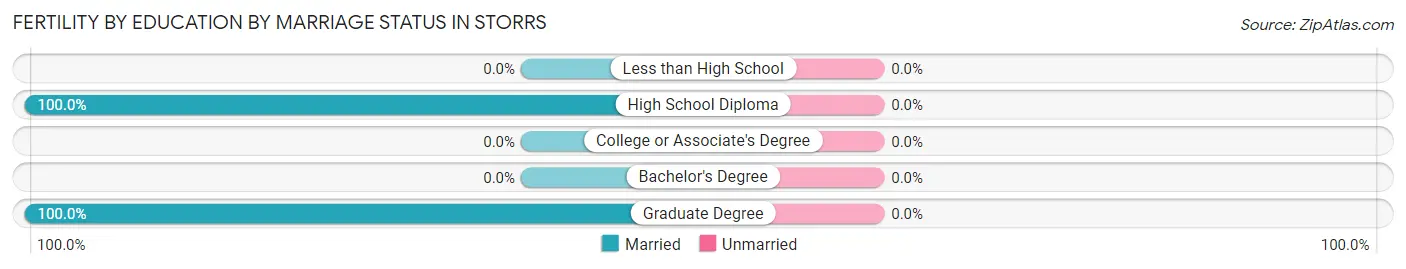
| Educational Attainment | Married | Unmarried |
| Less than High School | 0 (0.0%) | 0 (0.0%) |
| High School Diploma | 11 (100.0%) | 0 (0.0%) |
| College or Associate's Degree | 0 (0.0%) | 0 (0.0%) |
| Bachelor's Degree | 0 (0.0%) | 0 (0.0%) |
| Graduate Degree | 25 (100.0%) | 0 (0.0%) |
| Total | 36 (100.0%) | 0 (0.0%) |
Employment Characteristics in Storrs
Employment by Class of Employer in Storrs
Among the 5,909 employed individuals in Storrs, private company employees (3,725 | 63.0%), state government employees (1,272 | 21.5%), and not-for-profit organizations (574 | 9.7%) make up the most common classes of employment.
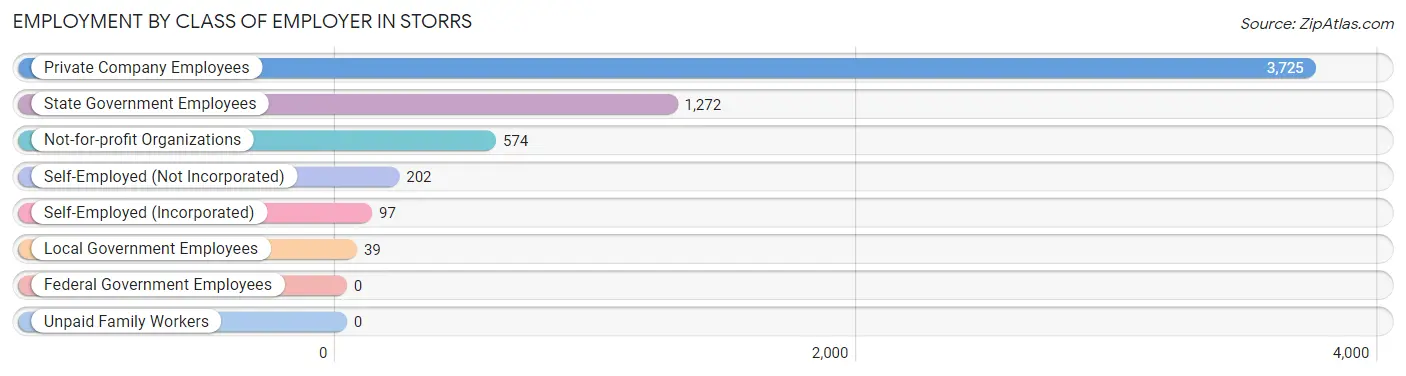
| Employer Class | # Employees | % Employees |
| Private Company Employees | 3,725 | 63.0% |
| Self-Employed (Incorporated) | 97 | 1.6% |
| Self-Employed (Not Incorporated) | 202 | 3.4% |
| Not-for-profit Organizations | 574 | 9.7% |
| Local Government Employees | 39 | 0.7% |
| State Government Employees | 1,272 | 21.5% |
| Federal Government Employees | 0 | 0.0% |
| Unpaid Family Workers | 0 | 0.0% |
| Total | 5,909 | 100.0% |
Employment Status by Age in Storrs
According to the labor force statistics for Storrs, out of the total population over 16 years of age (17,267), 43.8% or 7,563 individuals are in the labor force, with 12.5% or 945 of them unemployed. The age group with the highest labor force participation rate is 45 to 54 years, with 83.0% or 156 individuals in the labor force. Within the labor force, the 45 to 54 years age range has the highest percentage of unemployed individuals, with 14.7% or 23 of them being unemployed.
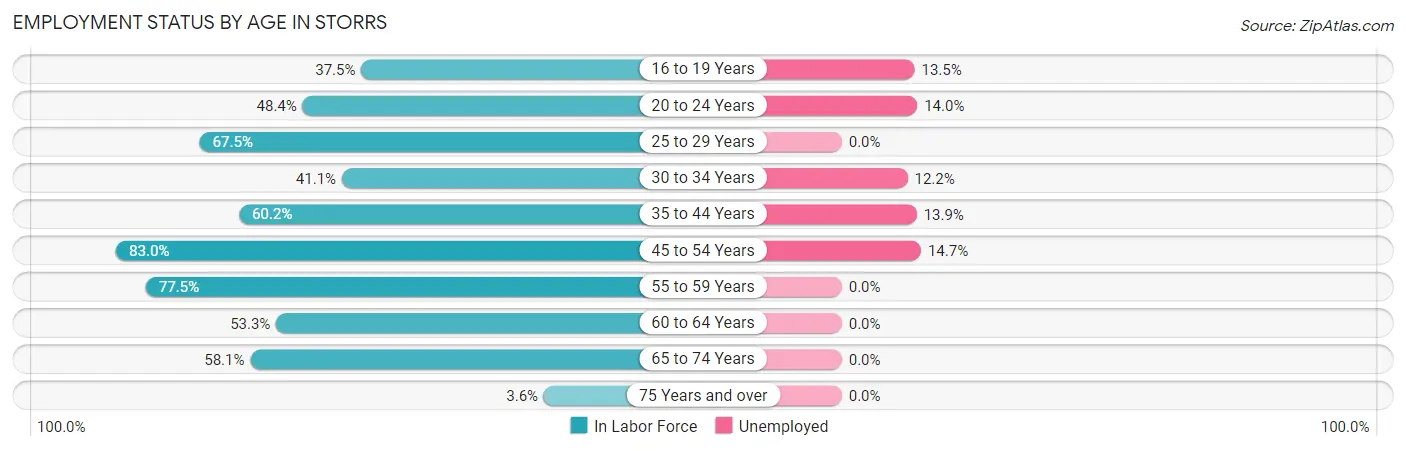
| Age Bracket | In Labor Force | Unemployed |
| 16 to 19 Years | 2,691 (37.5%) | 363 (13.5%) |
| 20 to 24 Years | 3,751 (48.4%) | 525 (14.0%) |
| 25 to 29 Years | 197 (67.5%) | 0 (0.0%) |
| 30 to 34 Years | 90 (41.1%) | 11 (12.2%) |
| 35 to 44 Years | 209 (60.2%) | 29 (13.9%) |
| 45 to 54 Years | 156 (83.0%) | 23 (14.7%) |
| 55 to 59 Years | 110 (77.5%) | 0 (0.0%) |
| 60 to 64 Years | 113 (53.3%) | 0 (0.0%) |
| 65 to 74 Years | 227 (58.1%) | 0 (0.0%) |
| 75 Years and over | 20 (3.6%) | 0 (0.0%) |
| Total | 7,563 (43.8%) | 945 (12.5%) |
Employment Status by Educational Attainment in Storrs
According to labor force statistics for Storrs, 62.5% of individuals (875) out of the total population between 25 and 64 years of age (1,400) are in the labor force, with 7.2% or 63 of them being unemployed. The group with the highest labor force participation rate are those with the educational attainment of high school diploma, with 79.7% or 137 individuals in the labor force. Within the labor force, individuals with less than high school education have the highest percentage of unemployment, with 100.0% or 29 of them being unemployed.
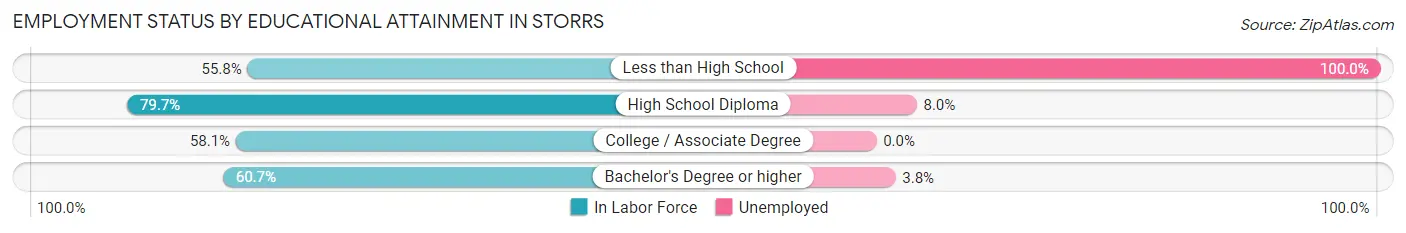
| Educational Attainment | In Labor Force | Unemployed |
| Less than High School | 29 (55.8%) | 52 (100.0%) |
| High School Diploma | 137 (79.7%) | 14 (8.0%) |
| College / Associate Degree | 100 (58.1%) | 0 (0.0%) |
| Bachelor's Degree or higher | 609 (60.7%) | 38 (3.8%) |
| Total | 875 (62.5%) | 101 (7.2%) |
Employment Occupations by Sex in Storrs
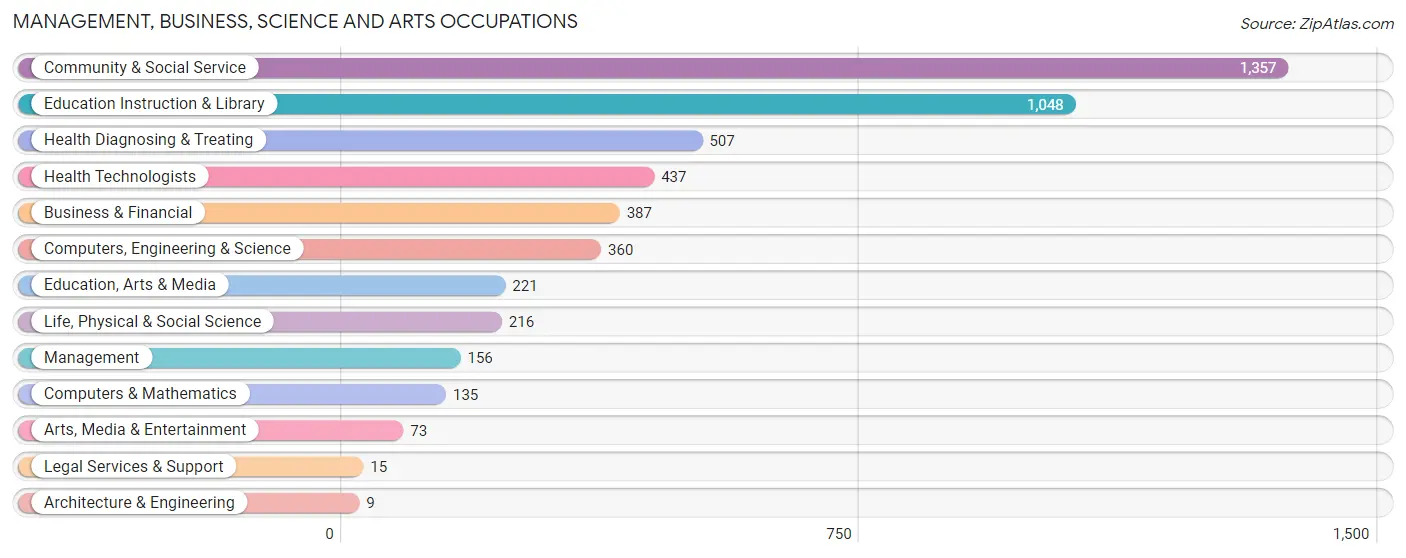
Management, Business, Science and Arts Occupations
The most common Management, Business, Science and Arts occupations in Storrs are Community & Social Service (1,357 | 20.5%), Education Instruction & Library (1,048 | 15.9%), Health Diagnosing & Treating (507 | 7.7%), Health Technologists (437 | 6.6%), and Business & Financial (387 | 5.9%).
Management, Business, Science and Arts Occupations by Sex
Within the Management, Business, Science and Arts occupations in Storrs, the most male-oriented occupations are Architecture & Engineering (100.0%), Legal Services & Support (100.0%), and Computers, Engineering & Science (91.1%), while the most female-oriented occupations are Education, Arts & Media (96.4%), Health Technologists (87.9%), and Education Instruction & Library (78.9%).
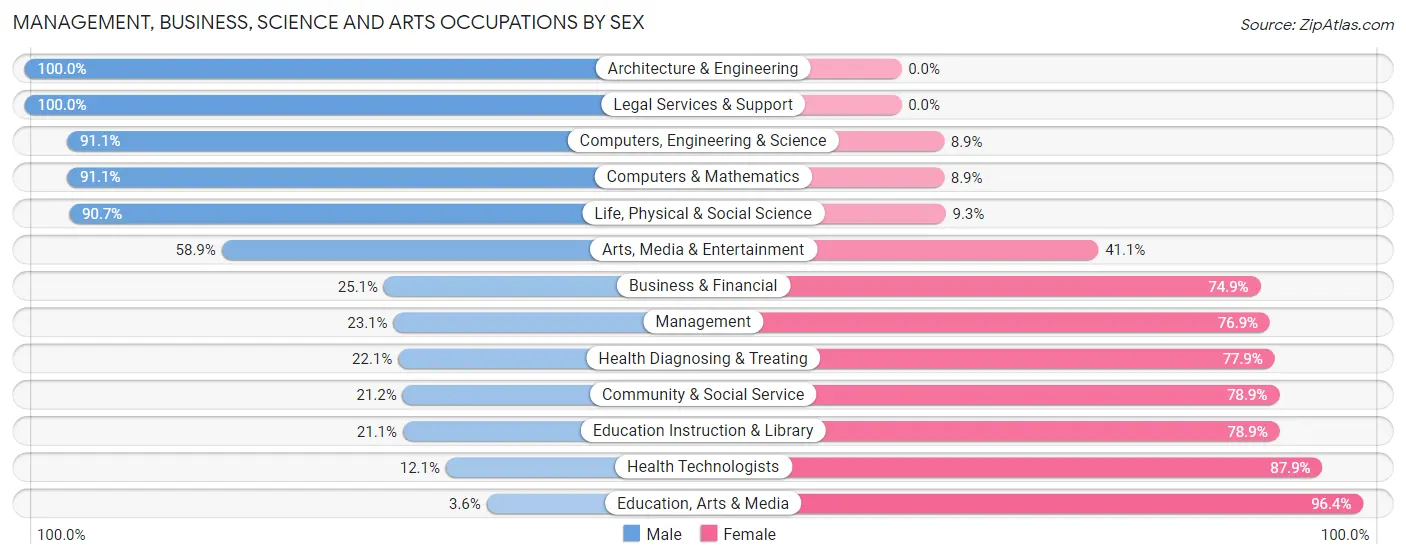
| Occupation | Male | Female |
| Management | 36 (23.1%) | 120 (76.9%) |
| Business & Financial | 97 (25.1%) | 290 (74.9%) |
| Computers, Engineering & Science | 328 (91.1%) | 32 (8.9%) |
| Computers & Mathematics | 123 (91.1%) | 12 (8.9%) |
| Architecture & Engineering | 9 (100.0%) | 0 (0.0%) |
| Life, Physical & Social Science | 196 (90.7%) | 20 (9.3%) |
| Community & Social Service | 287 (21.1%) | 1,070 (78.8%) |
| Education, Arts & Media | 8 (3.6%) | 213 (96.4%) |
| Legal Services & Support | 15 (100.0%) | 0 (0.0%) |
| Education Instruction & Library | 221 (21.1%) | 827 (78.9%) |
| Arts, Media & Entertainment | 43 (58.9%) | 30 (41.1%) |
| Health Diagnosing & Treating | 112 (22.1%) | 395 (77.9%) |
| Health Technologists | 53 (12.1%) | 384 (87.9%) |
| Total (Category) | 860 (31.1%) | 1,907 (68.9%) |
| Total (Overall) | 2,559 (38.7%) | 4,054 (61.3%) |
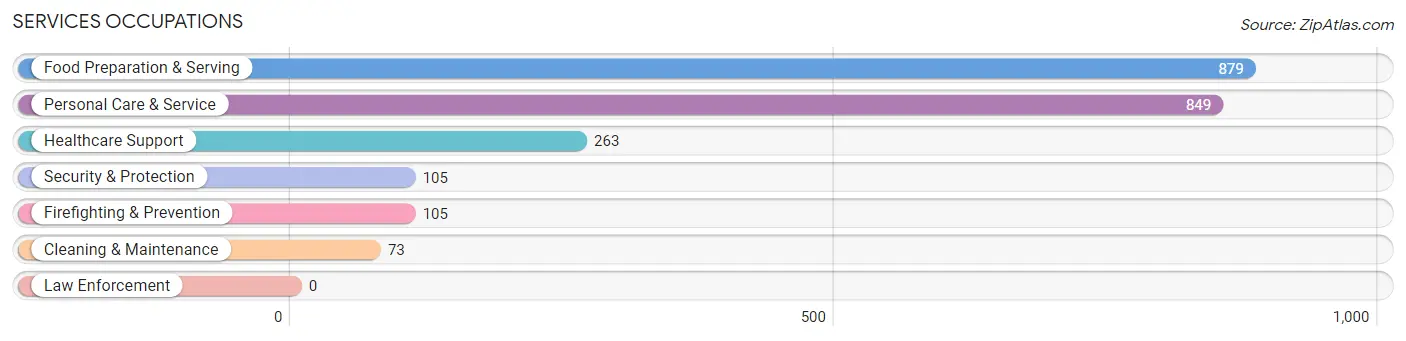
Services Occupations
The most common Services occupations in Storrs are Food Preparation & Serving (879 | 13.3%), Personal Care & Service (849 | 12.8%), Healthcare Support (263 | 4.0%), Security & Protection (105 | 1.6%), and Firefighting & Prevention (105 | 1.6%).
Services Occupations by Sex
Within the Services occupations in Storrs, the most male-oriented occupations are Personal Care & Service (54.3%), Security & Protection (54.3%), and Firefighting & Prevention (54.3%), while the most female-oriented occupations are Healthcare Support (87.1%), Cleaning & Maintenance (86.3%), and Food Preparation & Serving (66.0%).
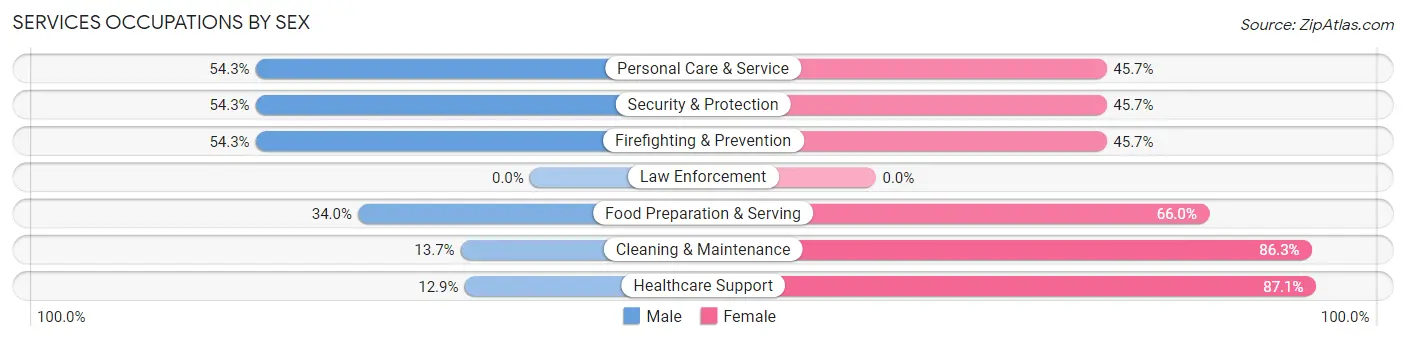
| Occupation | Male | Female |
| Healthcare Support | 34 (12.9%) | 229 (87.1%) |
| Security & Protection | 57 (54.3%) | 48 (45.7%) |
| Firefighting & Prevention | 57 (54.3%) | 48 (45.7%) |
| Law Enforcement | 0 (0.0%) | 0 (0.0%) |
| Food Preparation & Serving | 299 (34.0%) | 580 (66.0%) |
| Cleaning & Maintenance | 10 (13.7%) | 63 (86.3%) |
| Personal Care & Service | 461 (54.3%) | 388 (45.7%) |
| Total (Category) | 861 (39.7%) | 1,308 (60.3%) |
| Total (Overall) | 2,559 (38.7%) | 4,054 (61.3%) |
Sales and Office Occupations
The most common Sales and Office occupations in Storrs are Office & Administration (831 | 12.6%), and Sales & Related (583 | 8.8%).
Sales and Office Occupations by Sex
| Occupation | Male | Female |
| Sales & Related | 268 (46.0%) | 315 (54.0%) |
| Office & Administration | 343 (41.3%) | 488 (58.7%) |
| Total (Category) | 611 (43.2%) | 803 (56.8%) |
| Total (Overall) | 2,559 (38.7%) | 4,054 (61.3%) |
Natural Resources, Construction and Maintenance Occupations
The most common Natural Resources, Construction and Maintenance occupations in Storrs are , and Construction & Extraction (107 | 1.6%).
Natural Resources, Construction and Maintenance Occupations by Sex
| Occupation | Male | Female |
| Farming, Fishing & Forestry | 0 (0.0%) | 0 (0.0%) |
| Construction & Extraction | 107 (100.0%) | 0 (0.0%) |
| Installation, Maintenance & Repair | 0 (0.0%) | 0 (0.0%) |
| Total (Category) | 107 (100.0%) | 0 (0.0%) |
| Total (Overall) | 2,559 (38.7%) | 4,054 (61.3%) |
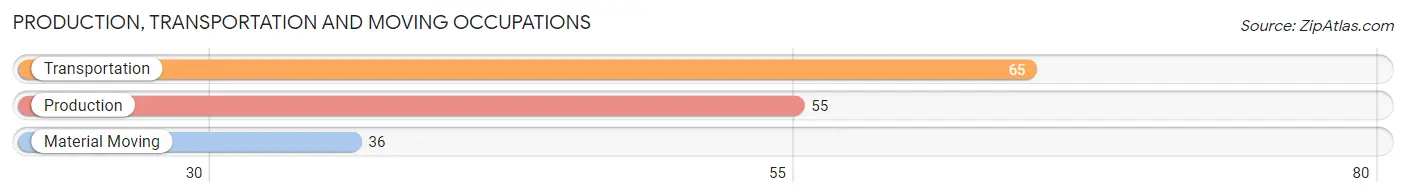
Production, Transportation and Moving Occupations
The most common Production, Transportation and Moving occupations in Storrs are Transportation (65 | 1.0%), Production (55 | 0.8%), and Material Moving (36 | 0.5%).
Production, Transportation and Moving Occupations by Sex
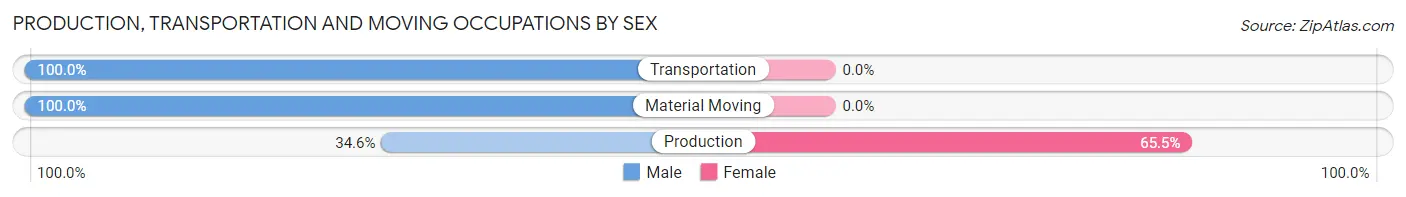
| Occupation | Male | Female |
| Production | 19 (34.5%) | 36 (65.4%) |
| Transportation | 65 (100.0%) | 0 (0.0%) |
| Material Moving | 36 (100.0%) | 0 (0.0%) |
| Total (Category) | 120 (76.9%) | 36 (23.1%) |
| Total (Overall) | 2,559 (38.7%) | 4,054 (61.3%) |
Employment Industries by Sex in Storrs
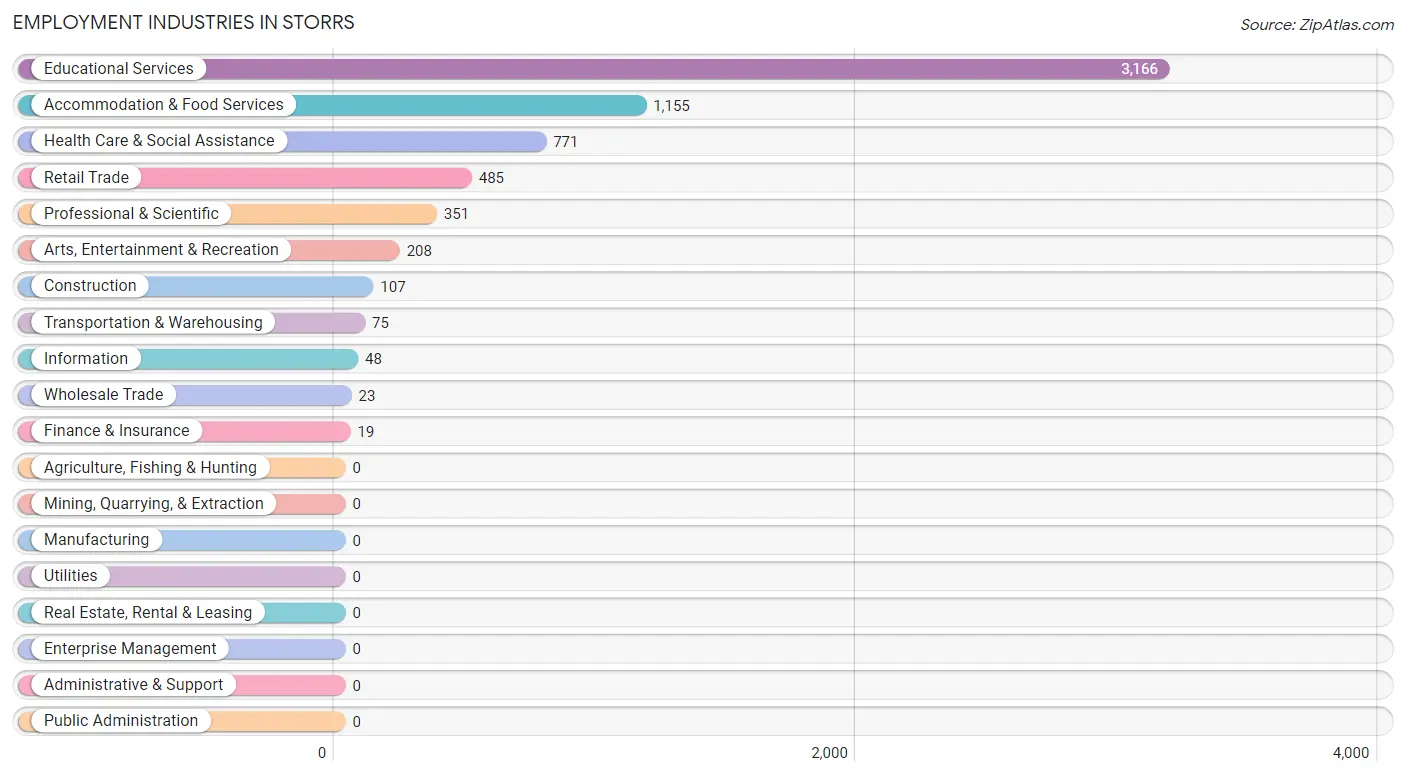
Employment Industries in Storrs
The major employment industries in Storrs include Educational Services (3,166 | 47.9%), Accommodation & Food Services (1,155 | 17.5%), Health Care & Social Assistance (771 | 11.7%), Retail Trade (485 | 7.3%), and Professional & Scientific (351 | 5.3%).
Employment Industries by Sex in Storrs
The Storrs industries that see more men than women are Construction (100.0%), Transportation & Warehousing (100.0%), and Finance & Insurance (100.0%), whereas the industries that tend to have a higher number of women are Wholesale Trade (100.0%), Accommodation & Food Services (78.3%), and Health Care & Social Assistance (76.9%).
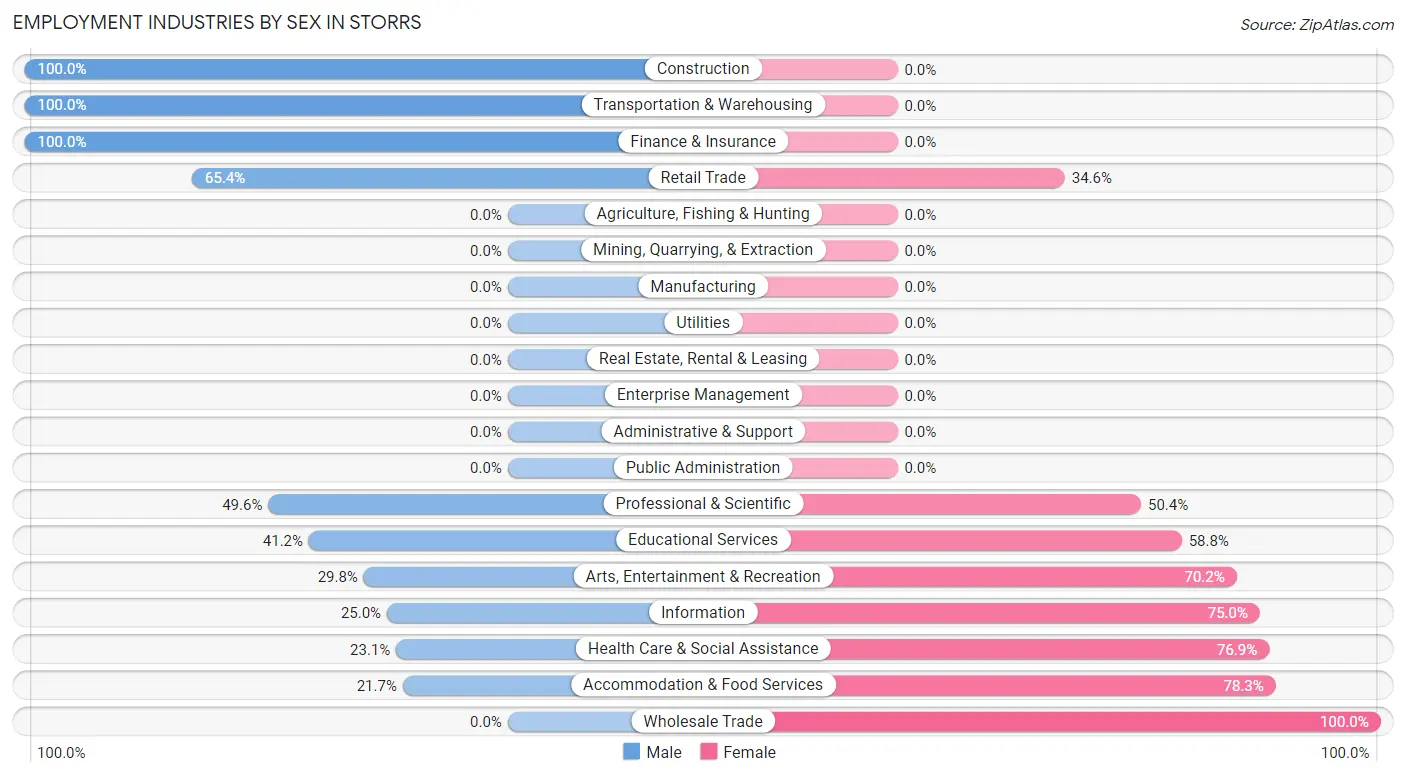
| Industry | Male | Female |
| Agriculture, Fishing & Hunting | 0 (0.0%) | 0 (0.0%) |
| Mining, Quarrying, & Extraction | 0 (0.0%) | 0 (0.0%) |
| Construction | 107 (100.0%) | 0 (0.0%) |
| Manufacturing | 0 (0.0%) | 0 (0.0%) |
| Wholesale Trade | 0 (0.0%) | 23 (100.0%) |
| Retail Trade | 317 (65.4%) | 168 (34.6%) |
| Transportation & Warehousing | 75 (100.0%) | 0 (0.0%) |
| Utilities | 0 (0.0%) | 0 (0.0%) |
| Information | 12 (25.0%) | 36 (75.0%) |
| Finance & Insurance | 19 (100.0%) | 0 (0.0%) |
| Real Estate, Rental & Leasing | 0 (0.0%) | 0 (0.0%) |
| Professional & Scientific | 174 (49.6%) | 177 (50.4%) |
| Enterprise Management | 0 (0.0%) | 0 (0.0%) |
| Administrative & Support | 0 (0.0%) | 0 (0.0%) |
| Educational Services | 1,303 (41.2%) | 1,863 (58.8%) |
| Health Care & Social Assistance | 178 (23.1%) | 593 (76.9%) |
| Arts, Entertainment & Recreation | 62 (29.8%) | 146 (70.2%) |
| Accommodation & Food Services | 251 (21.7%) | 904 (78.3%) |
| Public Administration | 0 (0.0%) | 0 (0.0%) |
| Total | 2,559 (38.7%) | 4,054 (61.3%) |
Education in Storrs
School Enrollment in Storrs
The most common levels of schooling among the 15,560 students in Storrs are college / undergraduate (14,934 | 96.0%), graduate / professional (323 | 2.1%), and middle school (155 | 1.0%).
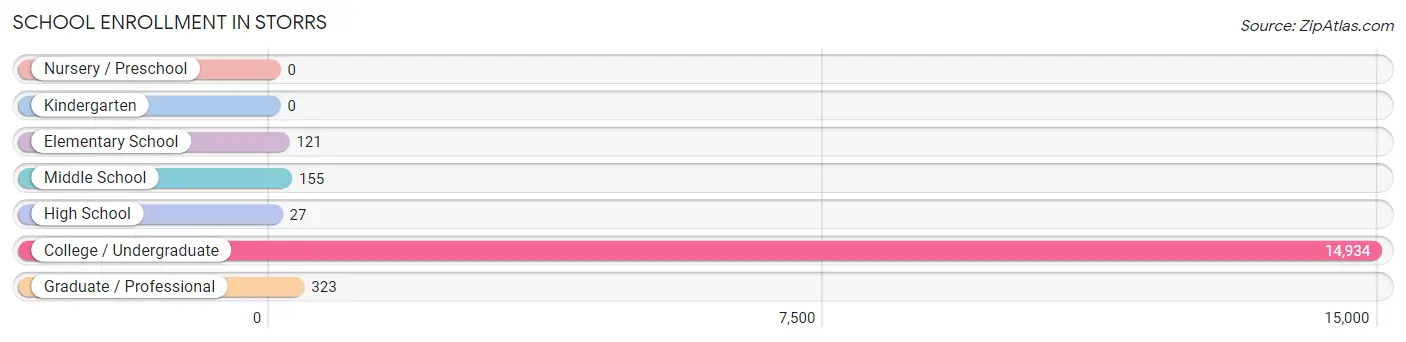
| School Level | # Students | % Students |
| Nursery / Preschool | 0 | 0.0% |
| Kindergarten | 0 | 0.0% |
| Elementary School | 121 | 0.8% |
| Middle School | 155 | 1.0% |
| High School | 27 | 0.2% |
| College / Undergraduate | 14,934 | 96.0% |
| Graduate / Professional | 323 | 2.1% |
| Total | 15,560 | 100.0% |
School Enrollment by Age by Funding Source in Storrs
Out of a total of 15,560 students who are enrolled in schools in Storrs, 93 (0.6%) attend a private institution, while the remaining 15,467 (99.4%) are enrolled in public schools. The age group of 5 to 9 year old has the highest likelihood of being enrolled in private schools, with 11 (9.1% in the age bracket) enrolled. Conversely, the age group of 10 to 14 year olds has the lowest likelihood of being enrolled in a private school, with 159 (100.0% in the age bracket) attending a public institution.
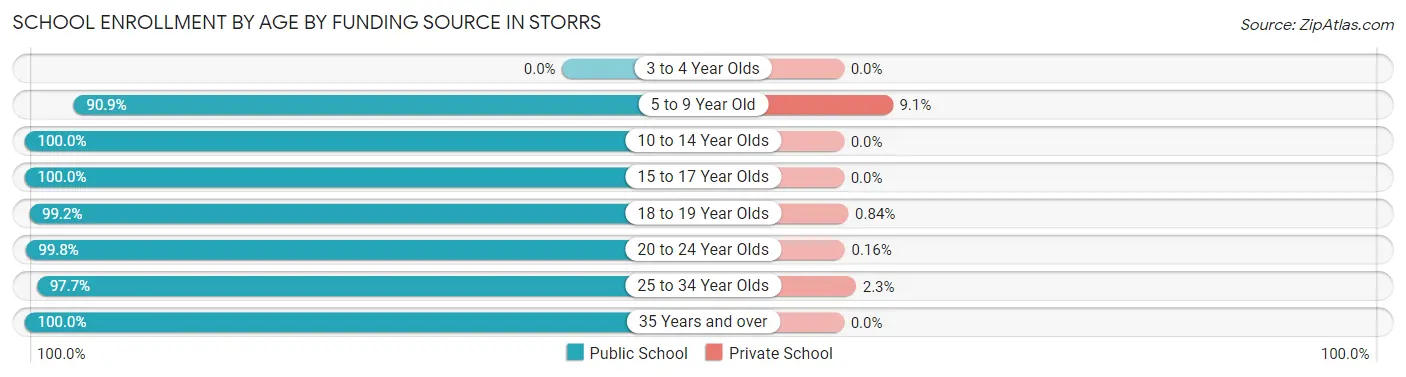
| Age Bracket | Public School | Private School |
| 3 to 4 Year Olds | 0 (0.0%) | 0 (0.0%) |
| 5 to 9 Year Old | 110 (90.9%) | 11 (9.1%) |
| 10 to 14 Year Olds | 159 (100.0%) | 0 (0.0%) |
| 15 to 17 Year Olds | 166 (100.0%) | 0 (0.0%) |
| 18 to 19 Year Olds | 6,959 (99.2%) | 59 (0.8%) |
| 20 to 24 Year Olds | 7,724 (99.8%) | 12 (0.2%) |
| 25 to 34 Year Olds | 303 (97.7%) | 7 (2.3%) |
| 35 Years and over | 50 (100.0%) | 0 (0.0%) |
| Total | 15,467 (99.4%) | 93 (0.6%) |
Educational Attainment by Field of Study in Storrs
Computers & mathematics (212 | 11.8%), bio, nature & agricultural (210 | 11.7%), science & technology (200 | 11.1%), social sciences (199 | 11.1%), and liberal arts & history (146 | 8.1%) are the most common fields of study among 1,796 individuals in Storrs who have obtained a bachelor's degree or higher.
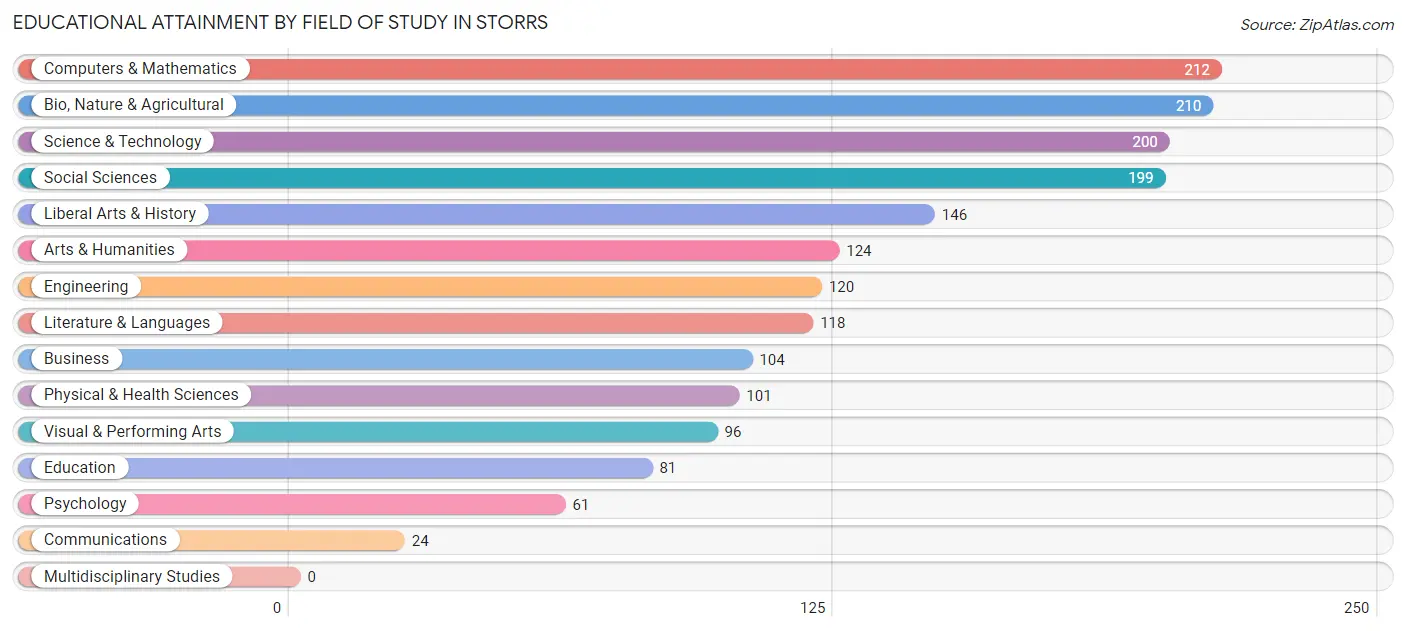
| Field of Study | # Graduates | % Graduates |
| Computers & Mathematics | 212 | 11.8% |
| Bio, Nature & Agricultural | 210 | 11.7% |
| Physical & Health Sciences | 101 | 5.6% |
| Psychology | 61 | 3.4% |
| Social Sciences | 199 | 11.1% |
| Engineering | 120 | 6.7% |
| Multidisciplinary Studies | 0 | 0.0% |
| Science & Technology | 200 | 11.1% |
| Business | 104 | 5.8% |
| Education | 81 | 4.5% |
| Literature & Languages | 118 | 6.6% |
| Liberal Arts & History | 146 | 8.1% |
| Visual & Performing Arts | 96 | 5.3% |
| Communications | 24 | 1.3% |
| Arts & Humanities | 124 | 6.9% |
| Total | 1,796 | 100.0% |
Transportation & Commute in Storrs
Vehicle Availability by Sex in Storrs
The most prevalent vehicle ownership categories in Storrs are males with 2 vehicles (304, accounting for 45.7%) and females with 2 vehicles (193, making up 37.5%).
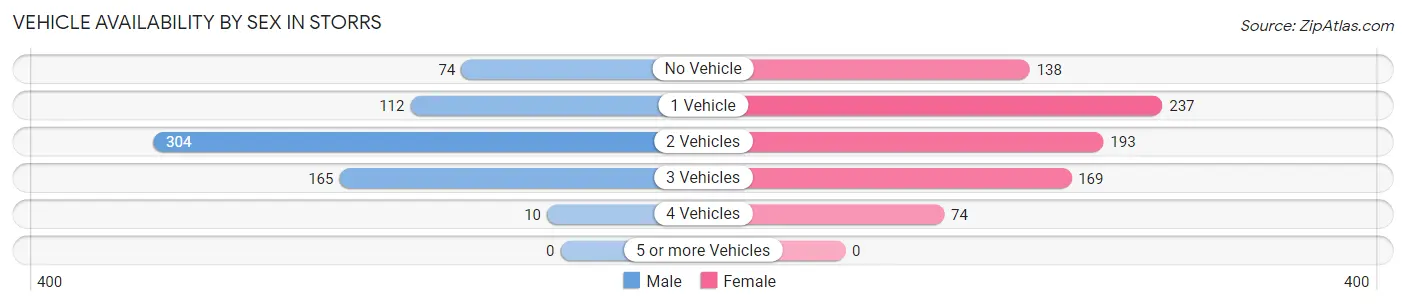
| Vehicles Available | Male | Female |
| No Vehicle | 74 (11.1%) | 138 (17.0%) |
| 1 Vehicle | 112 (16.8%) | 237 (29.2%) |
| 2 Vehicles | 304 (45.7%) | 193 (23.8%) |
| 3 Vehicles | 165 (24.8%) | 169 (20.8%) |
| 4 Vehicles | 10 (1.5%) | 74 (9.1%) |
| 5 or more Vehicles | 0 (0.0%) | 0 (0.0%) |
| Total | 665 (100.0%) | 811 (100.0%) |
Commute Time in Storrs
The most frequently occuring commute durations in Storrs are 5 to 9 minutes (1,121 commuters, 33.7%), 10 to 14 minutes (497 commuters, 15.0%), and less than 5 minutes (388 commuters, 11.7%).
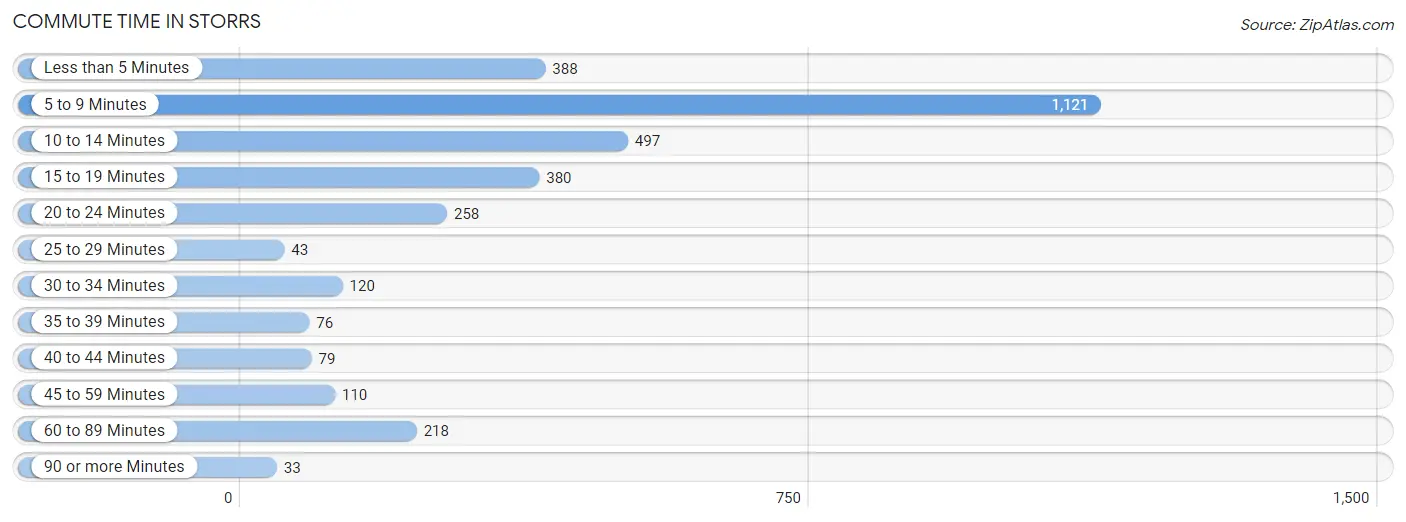
| Commute Time | # Commuters | % Commuters |
| Less than 5 Minutes | 388 | 11.7% |
| 5 to 9 Minutes | 1,121 | 33.7% |
| 10 to 14 Minutes | 497 | 15.0% |
| 15 to 19 Minutes | 380 | 11.4% |
| 20 to 24 Minutes | 258 | 7.8% |
| 25 to 29 Minutes | 43 | 1.3% |
| 30 to 34 Minutes | 120 | 3.6% |
| 35 to 39 Minutes | 76 | 2.3% |
| 40 to 44 Minutes | 79 | 2.4% |
| 45 to 59 Minutes | 110 | 3.3% |
| 60 to 89 Minutes | 218 | 6.6% |
| 90 or more Minutes | 33 | 1.0% |
Commute Time by Sex in Storrs
The most common commute times in Storrs are 5 to 9 minutes (480 commuters, 39.0%) for males and 5 to 9 minutes (641 commuters, 30.7%) for females.
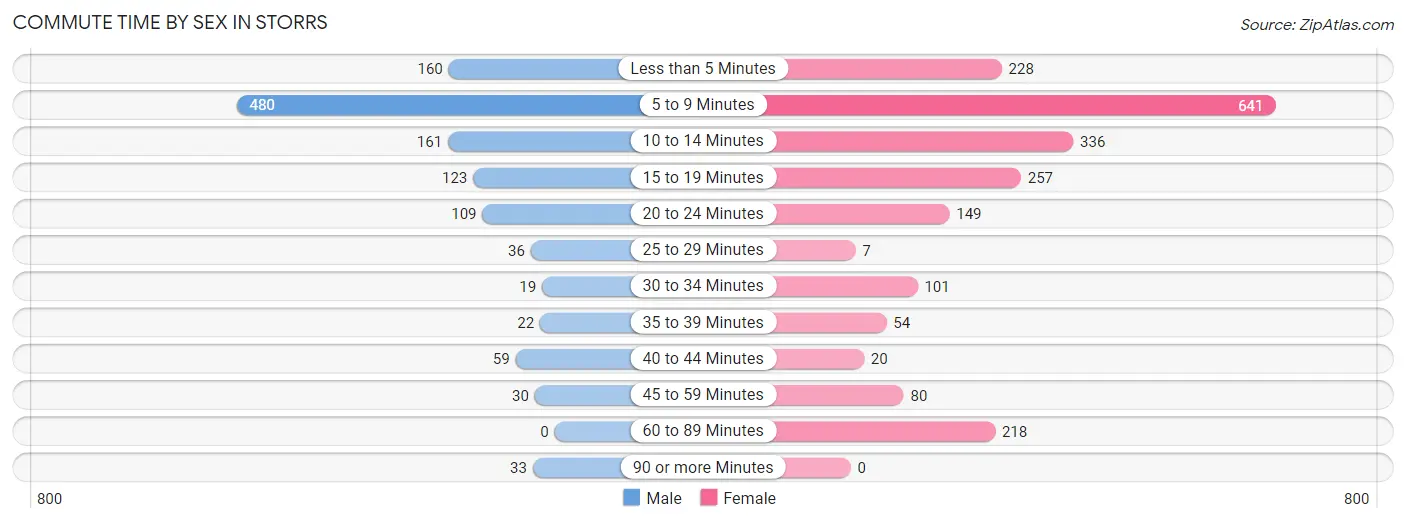
| Commute Time | Male | Female |
| Less than 5 Minutes | 160 (13.0%) | 228 (10.9%) |
| 5 to 9 Minutes | 480 (39.0%) | 641 (30.7%) |
| 10 to 14 Minutes | 161 (13.1%) | 336 (16.1%) |
| 15 to 19 Minutes | 123 (10.0%) | 257 (12.3%) |
| 20 to 24 Minutes | 109 (8.8%) | 149 (7.1%) |
| 25 to 29 Minutes | 36 (2.9%) | 7 (0.3%) |
| 30 to 34 Minutes | 19 (1.5%) | 101 (4.8%) |
| 35 to 39 Minutes | 22 (1.8%) | 54 (2.6%) |
| 40 to 44 Minutes | 59 (4.8%) | 20 (1.0%) |
| 45 to 59 Minutes | 30 (2.4%) | 80 (3.8%) |
| 60 to 89 Minutes | 0 (0.0%) | 218 (10.4%) |
| 90 or more Minutes | 33 (2.7%) | 0 (0.0%) |
Time of Departure to Work by Sex in Storrs
The most frequent times of departure to work in Storrs are 12:00 PM to 3:59 PM (306, 24.8%) for males and 7:30 AM to 7:59 AM (382, 18.3%) for females.
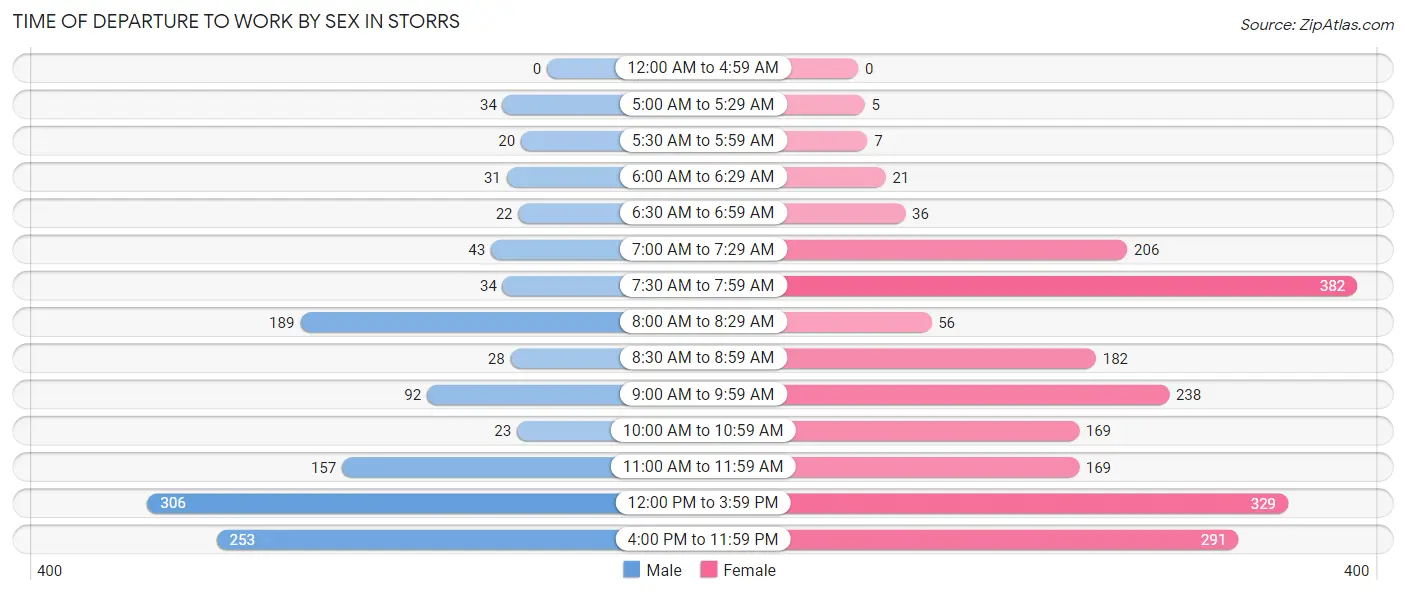
| Time of Departure | Male | Female |
| 12:00 AM to 4:59 AM | 0 (0.0%) | 0 (0.0%) |
| 5:00 AM to 5:29 AM | 34 (2.8%) | 5 (0.2%) |
| 5:30 AM to 5:59 AM | 20 (1.6%) | 7 (0.3%) |
| 6:00 AM to 6:29 AM | 31 (2.5%) | 21 (1.0%) |
| 6:30 AM to 6:59 AM | 22 (1.8%) | 36 (1.7%) |
| 7:00 AM to 7:29 AM | 43 (3.5%) | 206 (9.9%) |
| 7:30 AM to 7:59 AM | 34 (2.8%) | 382 (18.3%) |
| 8:00 AM to 8:29 AM | 189 (15.3%) | 56 (2.7%) |
| 8:30 AM to 8:59 AM | 28 (2.3%) | 182 (8.7%) |
| 9:00 AM to 9:59 AM | 92 (7.5%) | 238 (11.4%) |
| 10:00 AM to 10:59 AM | 23 (1.9%) | 169 (8.1%) |
| 11:00 AM to 11:59 AM | 157 (12.7%) | 169 (8.1%) |
| 12:00 PM to 3:59 PM | 306 (24.8%) | 329 (15.7%) |
| 4:00 PM to 11:59 PM | 253 (20.5%) | 291 (13.9%) |
| Total | 1,232 (100.0%) | 2,091 (100.0%) |
Housing Occupancy in Storrs
Occupancy by Ownership in Storrs
Of the total 2,241 dwellings in Storrs, owner-occupied units account for 814 (36.3%), while renter-occupied units make up 1,427 (63.7%).
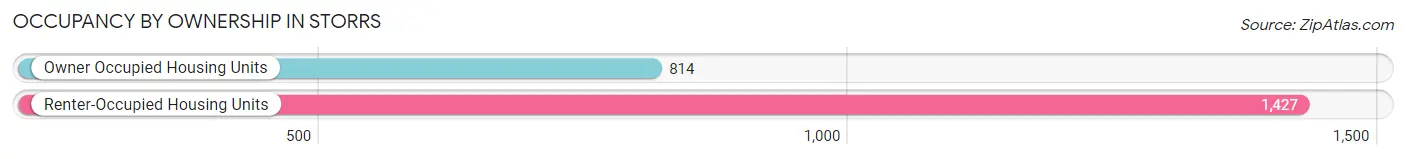
| Occupancy | # Housing Units | % Housing Units |
| Owner Occupied Housing Units | 814 | 36.3% |
| Renter-Occupied Housing Units | 1,427 | 63.7% |
| Total Occupied Housing Units | 2,241 | 100.0% |
Occupancy by Household Size in Storrs
| Household Size | # Housing Units | % Housing Units |
| 1-Person Household | 968 | 43.2% |
| 2-Person Household | 548 | 24.4% |
| 3-Person Household | 528 | 23.6% |
| 4+ Person Household | 197 | 8.8% |
| Total Housing Units | 2,241 | 100.0% |
Occupancy by Ownership by Household Size in Storrs
| Household Size | Owner-occupied | Renter-occupied |
| 1-Person Household | 235 (24.3%) | 733 (75.7%) |
| 2-Person Household | 315 (57.5%) | 233 (42.5%) |
| 3-Person Household | 125 (23.7%) | 403 (76.3%) |
| 4+ Person Household | 139 (70.6%) | 58 (29.4%) |
| Total Housing Units | 814 (36.3%) | 1,427 (63.7%) |
Occupancy by Educational Attainment in Storrs
| Household Size | Owner-occupied | Renter-occupied |
| Less than High School | 24 (63.2%) | 14 (36.8%) |
| High School Diploma | 71 (34.5%) | 135 (65.5%) |
| College/Associate Degree | 120 (14.5%) | 705 (85.5%) |
| Bachelor's Degree or higher | 599 (51.1%) | 573 (48.9%) |
Occupancy by Age of Householder in Storrs
| Age Bracket | # Households | % Households |
| Under 35 Years | 1,120 | 50.0% |
| 35 to 44 Years | 169 | 7.5% |
| 45 to 54 Years | 95 | 4.2% |
| 55 to 64 Years | 214 | 9.6% |
| 65 to 74 Years | 276 | 12.3% |
| 75 to 84 Years | 99 | 4.4% |
| 85 Years and Over | 268 | 12.0% |
| Total | 2,241 | 100.0% |
Housing Finances in Storrs
Median Income by Occupancy in Storrs
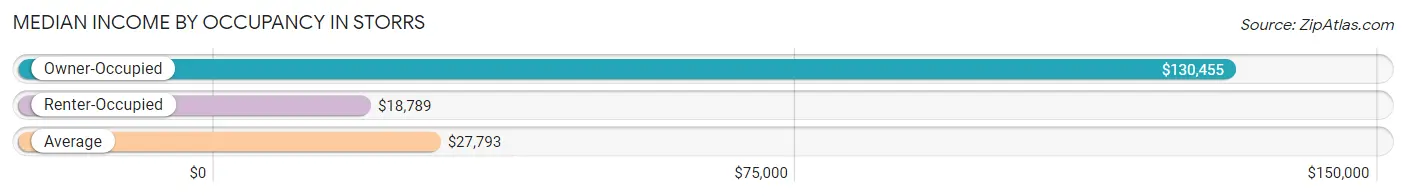
| Occupancy Type | # Households | Median Income |
| Owner-Occupied | 814 (36.3%) | $130,455 |
| Renter-Occupied | 1,427 (63.7%) | $18,789 |
| Average | 2,241 (100.0%) | $27,793 |
Occupancy by Householder Income Bracket in Storrs
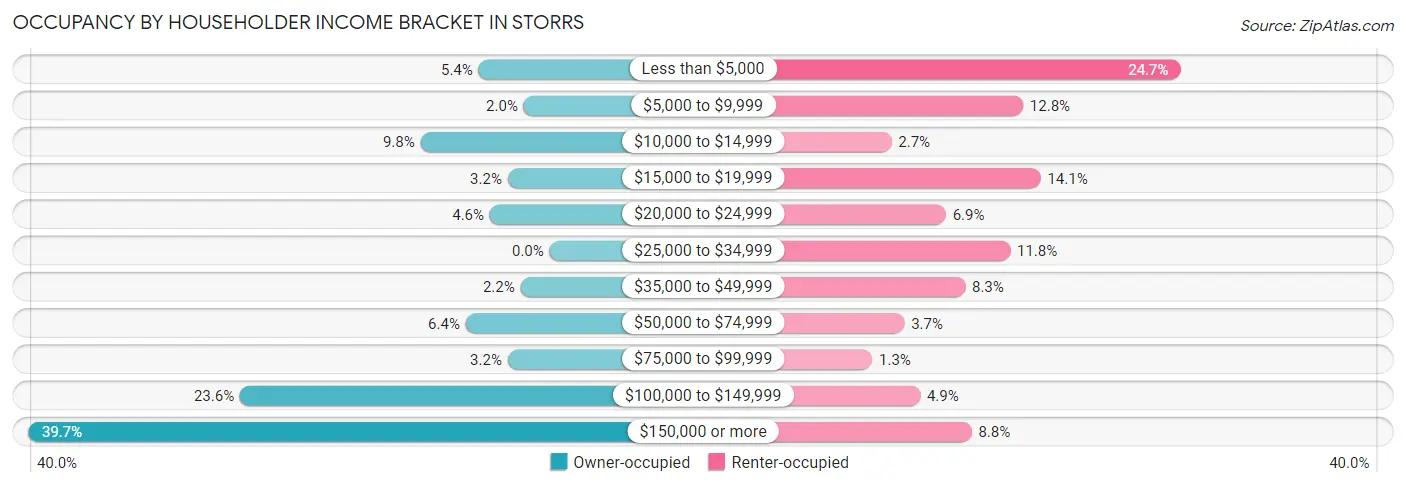
| Income Bracket | Owner-occupied | Renter-occupied |
| Less than $5,000 | 44 (5.4%) | 353 (24.7%) |
| $5,000 to $9,999 | 16 (2.0%) | 182 (12.8%) |
| $10,000 to $14,999 | 80 (9.8%) | 39 (2.7%) |
| $15,000 to $19,999 | 26 (3.2%) | 201 (14.1%) |
| $20,000 to $24,999 | 37 (4.5%) | 98 (6.9%) |
| $25,000 to $34,999 | 0 (0.0%) | 168 (11.8%) |
| $35,000 to $49,999 | 18 (2.2%) | 119 (8.3%) |
| $50,000 to $74,999 | 52 (6.4%) | 53 (3.7%) |
| $75,000 to $99,999 | 26 (3.2%) | 18 (1.3%) |
| $100,000 to $149,999 | 192 (23.6%) | 70 (4.9%) |
| $150,000 or more | 323 (39.7%) | 126 (8.8%) |
| Total | 814 (100.0%) | 1,427 (100.0%) |
Monthly Housing Cost Tiers in Storrs
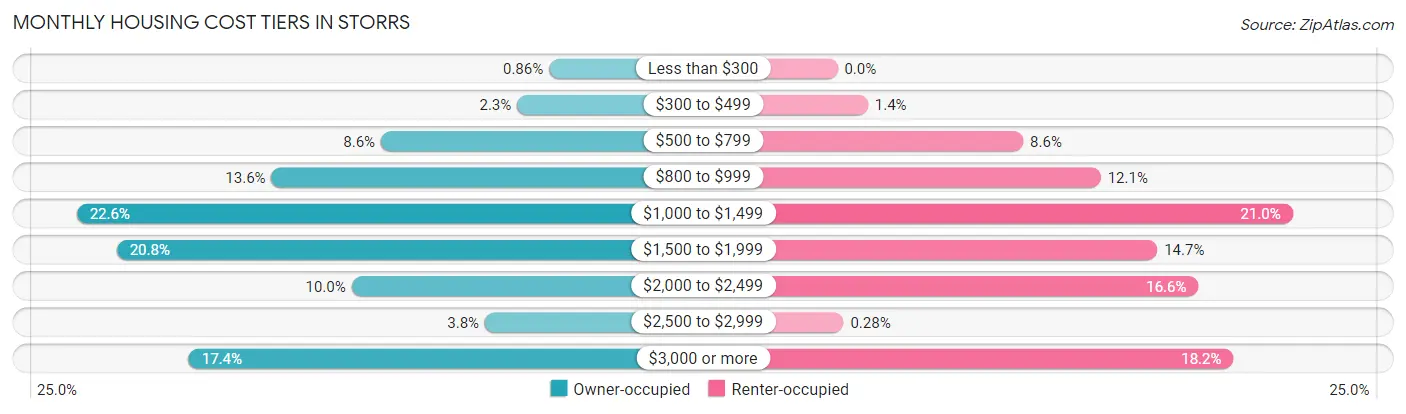
| Monthly Cost | Owner-occupied | Renter-occupied |
| Less than $300 | 7 (0.9%) | 0 (0.0%) |
| $300 to $499 | 19 (2.3%) | 20 (1.4%) |
| $500 to $799 | 70 (8.6%) | 122 (8.6%) |
| $800 to $999 | 111 (13.6%) | 173 (12.1%) |
| $1,000 to $1,499 | 184 (22.6%) | 299 (20.9%) |
| $1,500 to $1,999 | 169 (20.8%) | 210 (14.7%) |
| $2,000 to $2,499 | 81 (10.0%) | 237 (16.6%) |
| $2,500 to $2,999 | 31 (3.8%) | 4 (0.3%) |
| $3,000 or more | 142 (17.4%) | 260 (18.2%) |
| Total | 814 (100.0%) | 1,427 (100.0%) |
Physical Housing Characteristics in Storrs
Housing Structures in Storrs
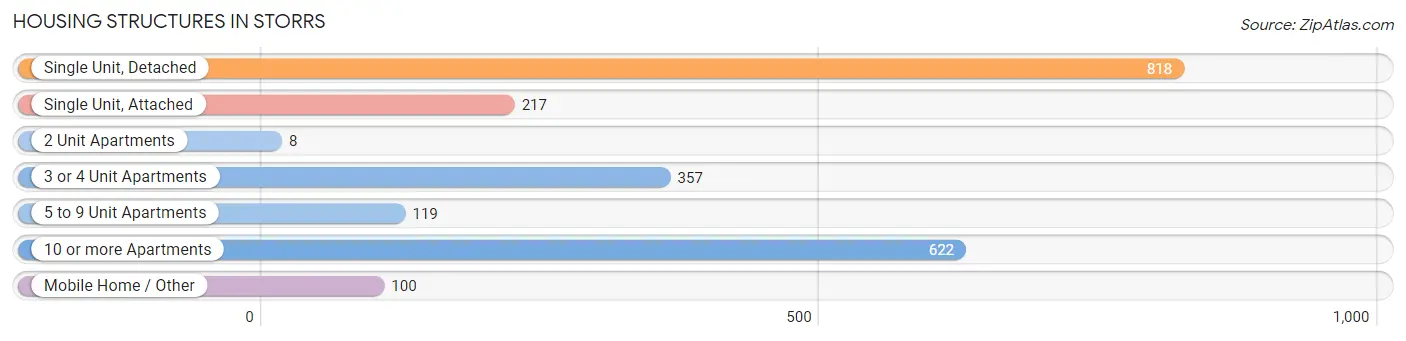
| Structure Type | # Housing Units | % Housing Units |
| Single Unit, Detached | 818 | 36.5% |
| Single Unit, Attached | 217 | 9.7% |
| 2 Unit Apartments | 8 | 0.4% |
| 3 or 4 Unit Apartments | 357 | 15.9% |
| 5 to 9 Unit Apartments | 119 | 5.3% |
| 10 or more Apartments | 622 | 27.8% |
| Mobile Home / Other | 100 | 4.5% |
| Total | 2,241 | 100.0% |
Housing Structures by Occupancy in Storrs
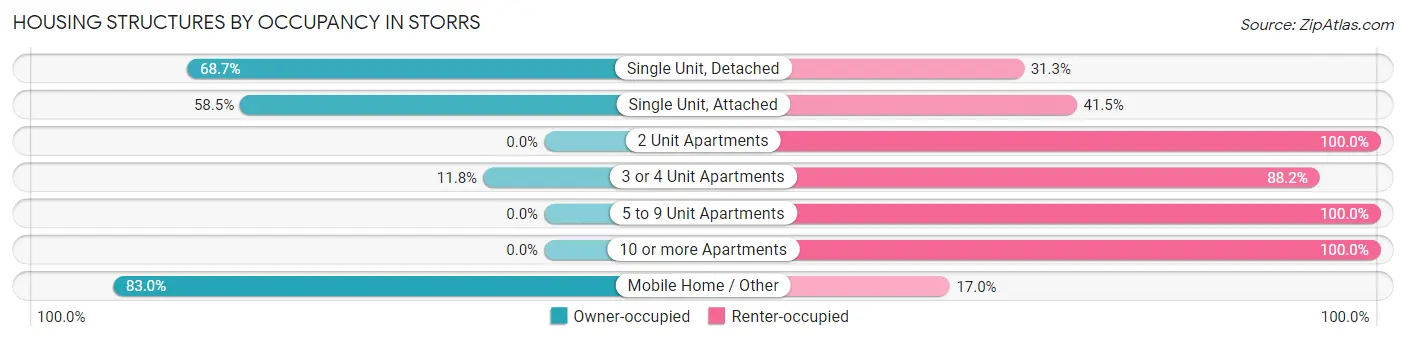
| Structure Type | Owner-occupied | Renter-occupied |
| Single Unit, Detached | 562 (68.7%) | 256 (31.3%) |
| Single Unit, Attached | 127 (58.5%) | 90 (41.5%) |
| 2 Unit Apartments | 0 (0.0%) | 8 (100.0%) |
| 3 or 4 Unit Apartments | 42 (11.8%) | 315 (88.2%) |
| 5 to 9 Unit Apartments | 0 (0.0%) | 119 (100.0%) |
| 10 or more Apartments | 0 (0.0%) | 622 (100.0%) |
| Mobile Home / Other | 83 (83.0%) | 17 (17.0%) |
| Total | 814 (36.3%) | 1,427 (63.7%) |
Housing Structures by Number of Rooms in Storrs
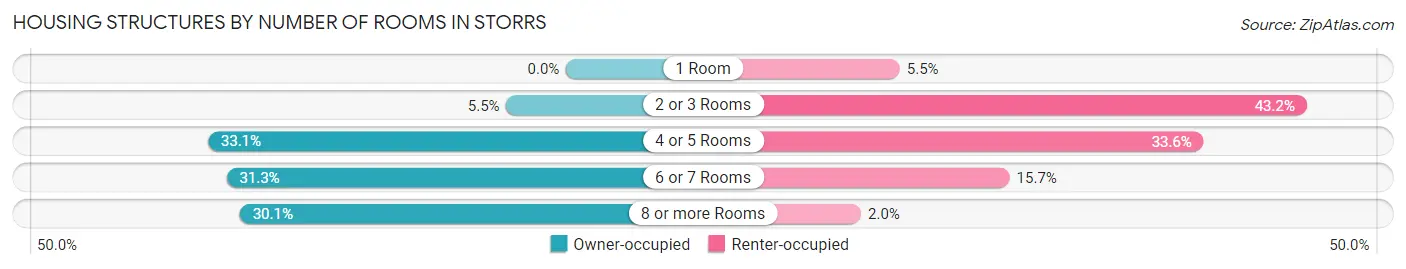
| Number of Rooms | Owner-occupied | Renter-occupied |
| 1 Room | 0 (0.0%) | 79 (5.5%) |
| 2 or 3 Rooms | 45 (5.5%) | 616 (43.2%) |
| 4 or 5 Rooms | 269 (33.1%) | 480 (33.6%) |
| 6 or 7 Rooms | 255 (31.3%) | 224 (15.7%) |
| 8 or more Rooms | 245 (30.1%) | 28 (2.0%) |
| Total | 814 (100.0%) | 1,427 (100.0%) |
Housing Structure by Heating Type in Storrs
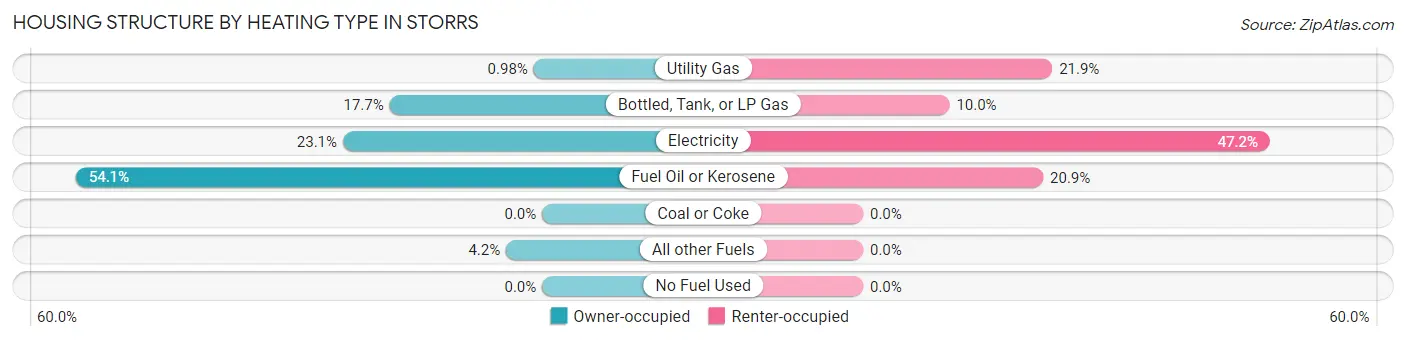
| Heating Type | Owner-occupied | Renter-occupied |
| Utility Gas | 8 (1.0%) | 313 (21.9%) |
| Bottled, Tank, or LP Gas | 144 (17.7%) | 143 (10.0%) |
| Electricity | 188 (23.1%) | 673 (47.2%) |
| Fuel Oil or Kerosene | 440 (54.0%) | 298 (20.9%) |
| Coal or Coke | 0 (0.0%) | 0 (0.0%) |
| All other Fuels | 34 (4.2%) | 0 (0.0%) |
| No Fuel Used | 0 (0.0%) | 0 (0.0%) |
| Total | 814 (100.0%) | 1,427 (100.0%) |
Household Vehicle Usage in Storrs
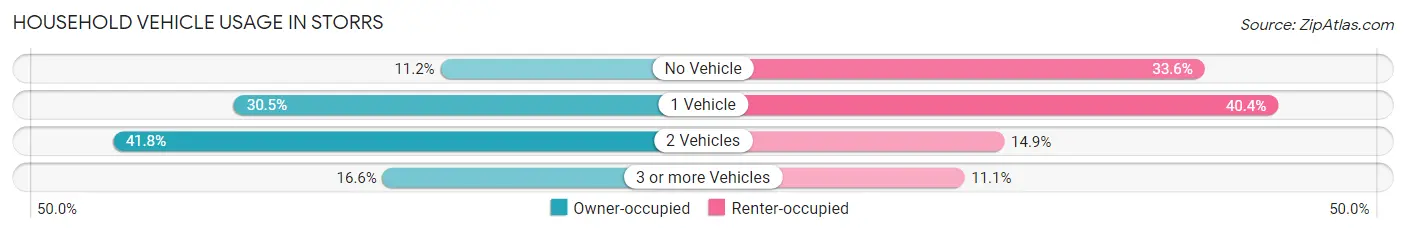
| Vehicles per Household | Owner-occupied | Renter-occupied |
| No Vehicle | 91 (11.2%) | 479 (33.6%) |
| 1 Vehicle | 248 (30.5%) | 577 (40.4%) |
| 2 Vehicles | 340 (41.8%) | 212 (14.9%) |
| 3 or more Vehicles | 135 (16.6%) | 159 (11.1%) |
| Total | 814 (100.0%) | 1,427 (100.0%) |
Real Estate & Mortgages in Storrs
Real Estate and Mortgage Overview in Storrs
| Characteristic | Without Mortgage | With Mortgage |
| Housing Units | 402 | 412 |
| Median Property Value | $297,800 | $324,800 |
| Median Household Income | $158,056 | $120 |
| Monthly Housing Costs | $925 | $142 |
| Real Estate Taxes | $5,882 | $0 |
Property Value by Mortgage Status in Storrs
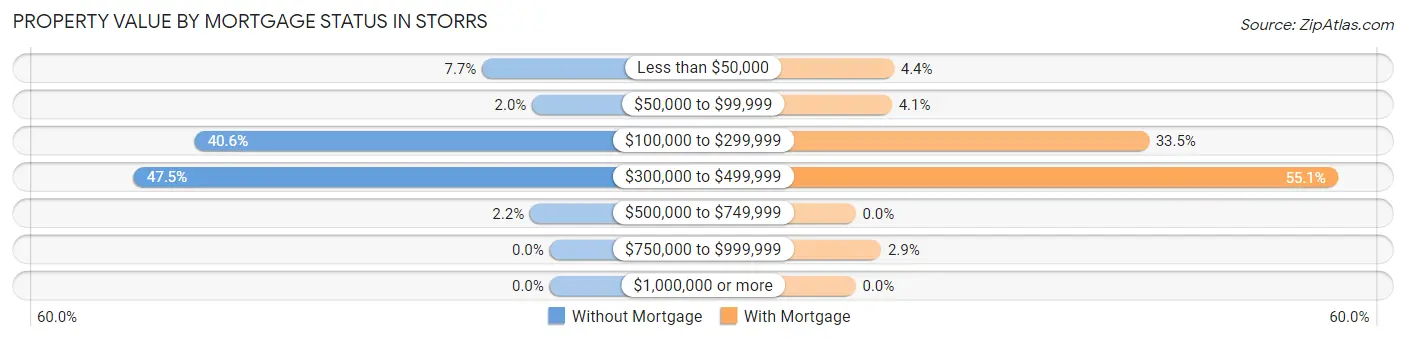
| Property Value | Without Mortgage | With Mortgage |
| Less than $50,000 | 31 (7.7%) | 18 (4.4%) |
| $50,000 to $99,999 | 8 (2.0%) | 17 (4.1%) |
| $100,000 to $299,999 | 163 (40.6%) | 138 (33.5%) |
| $300,000 to $499,999 | 191 (47.5%) | 227 (55.1%) |
| $500,000 to $749,999 | 9 (2.2%) | 0 (0.0%) |
| $750,000 to $999,999 | 0 (0.0%) | 12 (2.9%) |
| $1,000,000 or more | 0 (0.0%) | 0 (0.0%) |
| Total | 402 (100.0%) | 412 (100.0%) |
Household Income by Mortgage Status in Storrs
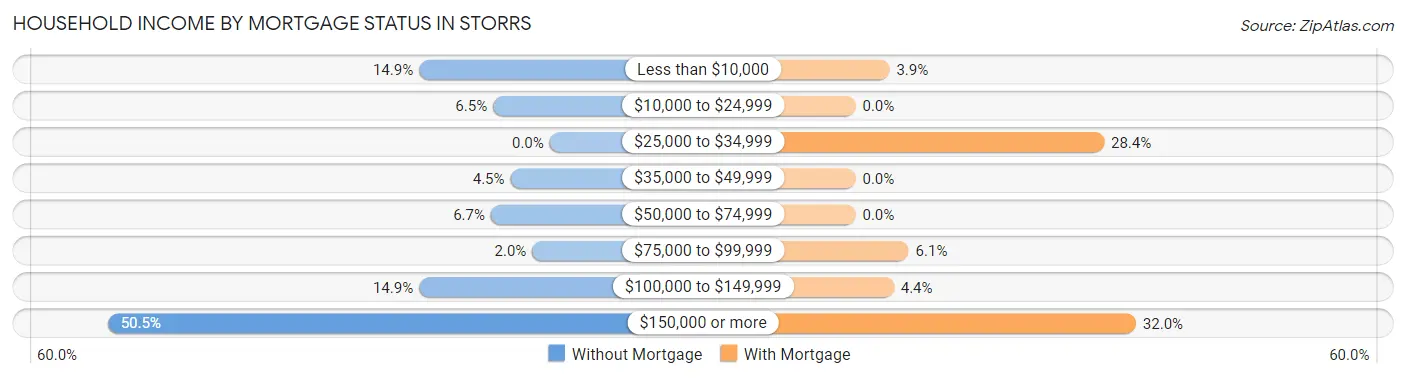
| Household Income | Without Mortgage | With Mortgage |
| Less than $10,000 | 60 (14.9%) | 16 (3.9%) |
| $10,000 to $24,999 | 26 (6.5%) | 0 (0.0%) |
| $25,000 to $34,999 | 0 (0.0%) | 117 (28.4%) |
| $35,000 to $49,999 | 18 (4.5%) | 0 (0.0%) |
| $50,000 to $74,999 | 27 (6.7%) | 0 (0.0%) |
| $75,000 to $99,999 | 8 (2.0%) | 25 (6.1%) |
| $100,000 to $149,999 | 60 (14.9%) | 18 (4.4%) |
| $150,000 or more | 203 (50.5%) | 132 (32.0%) |
| Total | 402 (100.0%) | 412 (100.0%) |
Property Value to Household Income Ratio in Storrs
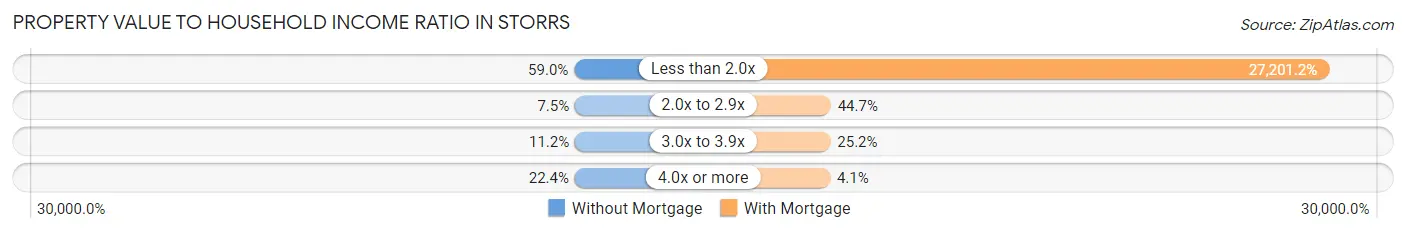
| Value-to-Income Ratio | Without Mortgage | With Mortgage |
| Less than 2.0x | 237 (59.0%) | 112,069 (27,201.2%) |
| 2.0x to 2.9x | 30 (7.5%) | 184 (44.7%) |
| 3.0x to 3.9x | 45 (11.2%) | 104 (25.2%) |
| 4.0x or more | 90 (22.4%) | 17 (4.1%) |
| Total | 402 (100.0%) | 412 (100.0%) |
Real Estate Taxes by Mortgage Status in Storrs
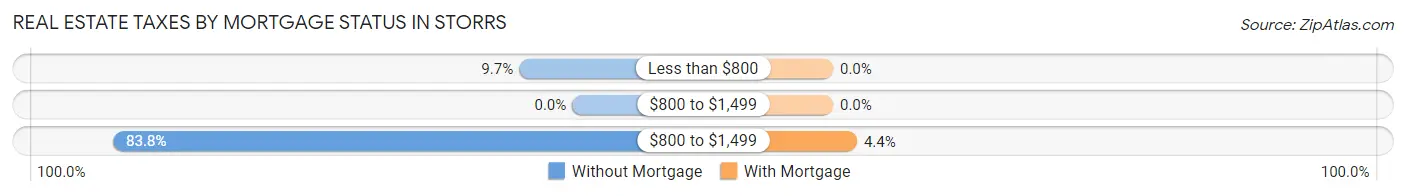
| Property Taxes | Without Mortgage | With Mortgage |
| Less than $800 | 39 (9.7%) | 0 (0.0%) |
| $800 to $1,499 | 0 (0.0%) | 0 (0.0%) |
| $800 to $1,499 | 337 (83.8%) | 18 (4.4%) |
| Total | 402 (100.0%) | 412 (100.0%) |
Health & Disability in Storrs
Health Insurance Coverage by Age in Storrs
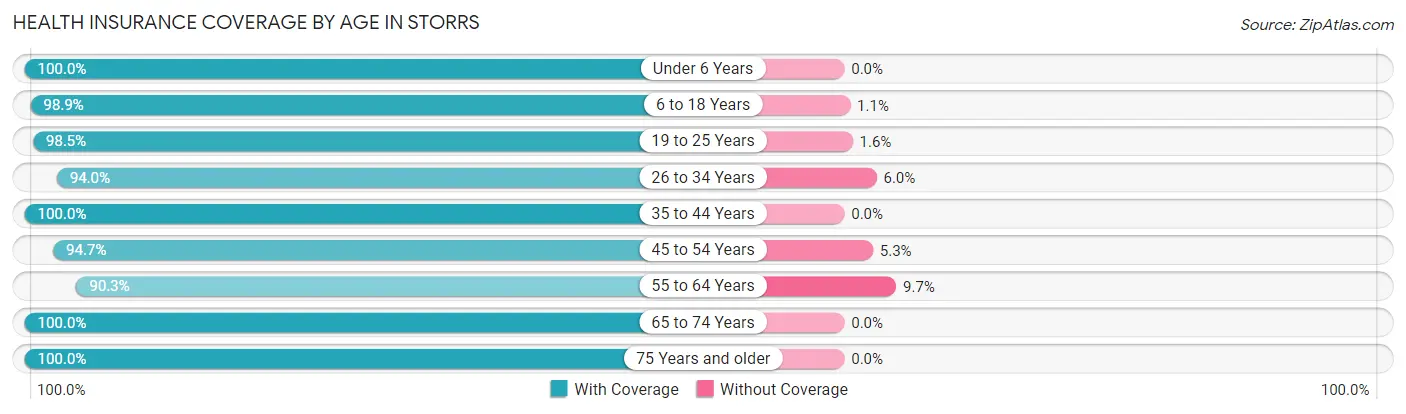
| Age Bracket | With Coverage | Without Coverage |
| Under 6 Years | 72 (100.0%) | 0 (0.0%) |
| 6 to 18 Years | 3,539 (98.9%) | 39 (1.1%) |
| 19 to 25 Years | 11,528 (98.5%) | 181 (1.5%) |
| 26 to 34 Years | 391 (94.0%) | 25 (6.0%) |
| 35 to 44 Years | 347 (100.0%) | 0 (0.0%) |
| 45 to 54 Years | 178 (94.7%) | 10 (5.3%) |
| 55 to 64 Years | 318 (90.3%) | 34 (9.7%) |
| 65 to 74 Years | 385 (100.0%) | 0 (0.0%) |
| 75 Years and older | 472 (100.0%) | 0 (0.0%) |
| Total | 17,230 (98.4%) | 289 (1.7%) |
Health Insurance Coverage by Citizenship Status in Storrs
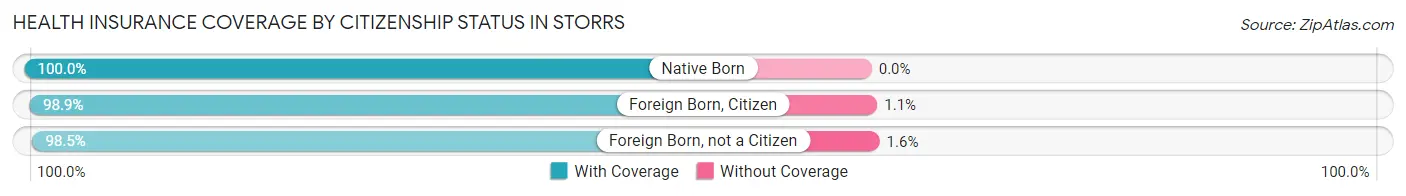
| Citizenship Status | With Coverage | Without Coverage |
| Native Born | 72 (100.0%) | 0 (0.0%) |
| Foreign Born, Citizen | 3,539 (98.9%) | 39 (1.1%) |
| Foreign Born, not a Citizen | 11,528 (98.5%) | 181 (1.5%) |
Health Insurance Coverage by Household Income in Storrs
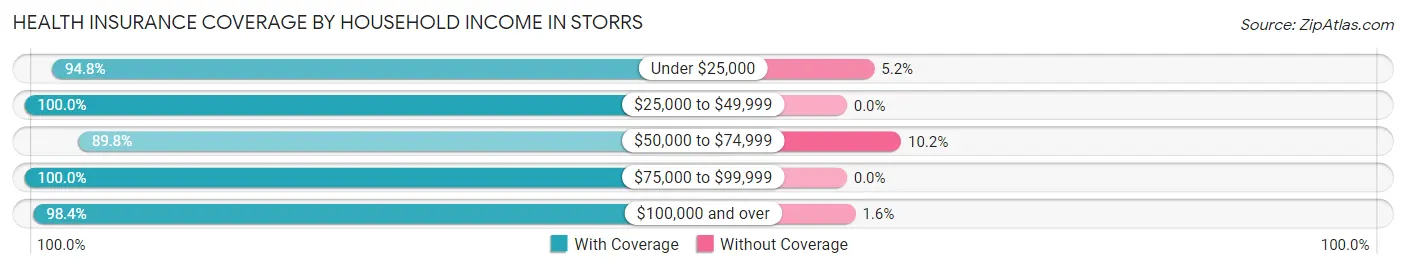
| Household Income | With Coverage | Without Coverage |
| Under $25,000 | 2,076 (94.8%) | 113 (5.2%) |
| $25,000 to $49,999 | 572 (100.0%) | 0 (0.0%) |
| $50,000 to $74,999 | 168 (89.8%) | 19 (10.2%) |
| $75,000 to $99,999 | 86 (100.0%) | 0 (0.0%) |
| $100,000 and over | 1,570 (98.4%) | 26 (1.6%) |
Public vs Private Health Insurance Coverage by Age in Storrs
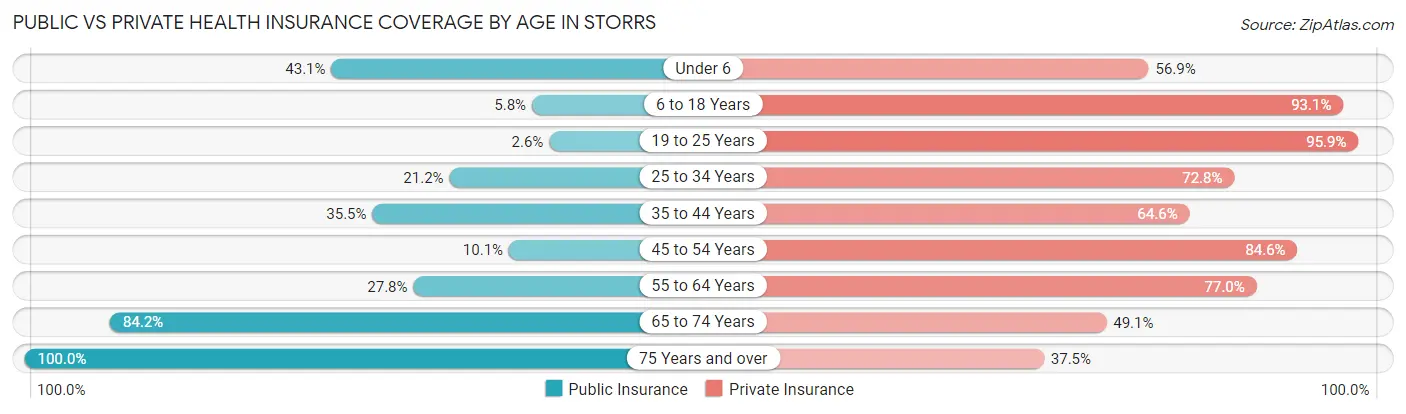
| Age Bracket | Public Insurance | Private Insurance |
| Under 6 | 31 (43.1%) | 41 (56.9%) |
| 6 to 18 Years | 209 (5.8%) | 3,330 (93.1%) |
| 19 to 25 Years | 308 (2.6%) | 11,225 (95.9%) |
| 25 to 34 Years | 88 (21.1%) | 303 (72.8%) |
| 35 to 44 Years | 123 (35.4%) | 224 (64.5%) |
| 45 to 54 Years | 19 (10.1%) | 159 (84.6%) |
| 55 to 64 Years | 98 (27.8%) | 271 (77.0%) |
| 65 to 74 Years | 324 (84.2%) | 189 (49.1%) |
| 75 Years and over | 472 (100.0%) | 177 (37.5%) |
| Total | 1,672 (9.5%) | 15,919 (90.9%) |
Disability Status by Sex by Age in Storrs
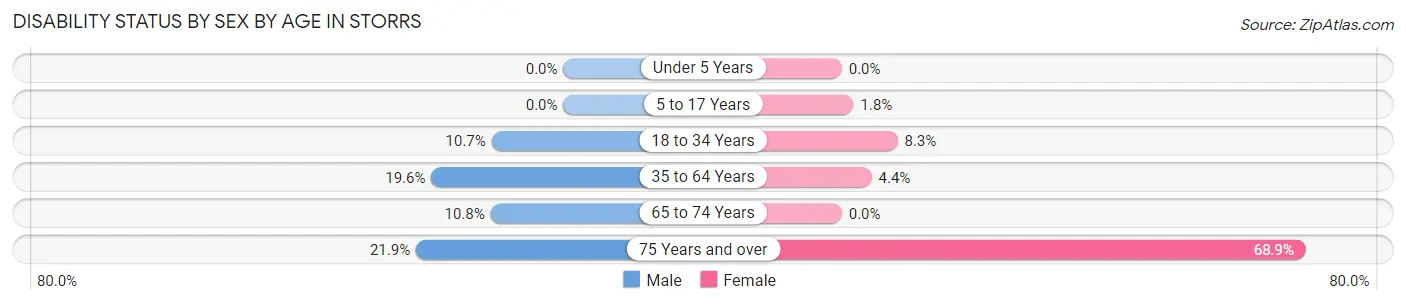
| Age Bracket | Male | Female |
| Under 5 Years | 0 (0.0%) | 0 (0.0%) |
| 5 to 17 Years | 0 (0.0%) | 5 (1.8%) |
| 18 to 34 Years | 754 (10.6%) | 679 (8.3%) |
| 35 to 64 Years | 81 (19.6%) | 21 (4.4%) |
| 65 to 74 Years | 16 (10.8%) | 0 (0.0%) |
| 75 Years and over | 28 (21.9%) | 237 (68.9%) |
Disability Class by Sex by Age in Storrs
Disability Class: Hearing Difficulty
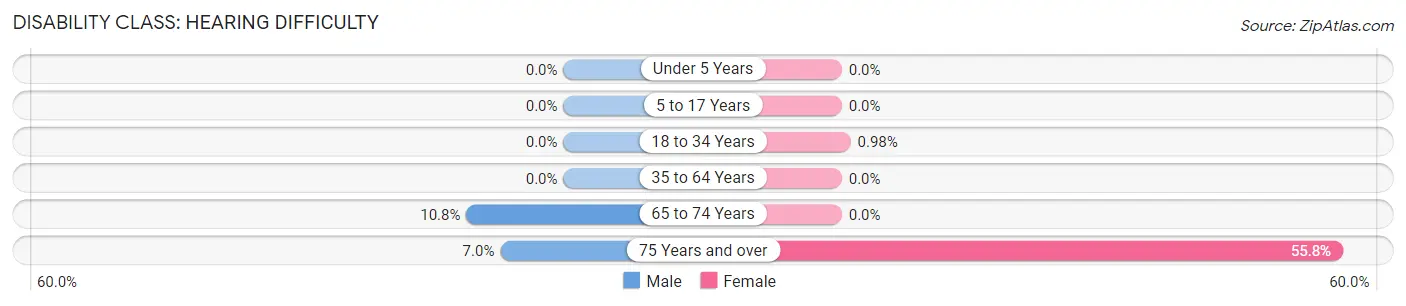
| Age Bracket | Male | Female |
| Under 5 Years | 0 (0.0%) | 0 (0.0%) |
| 5 to 17 Years | 0 (0.0%) | 0 (0.0%) |
| 18 to 34 Years | 0 (0.0%) | 80 (1.0%) |
| 35 to 64 Years | 0 (0.0%) | 0 (0.0%) |
| 65 to 74 Years | 16 (10.8%) | 0 (0.0%) |
| 75 Years and over | 9 (7.0%) | 192 (55.8%) |
Disability Class: Vision Difficulty
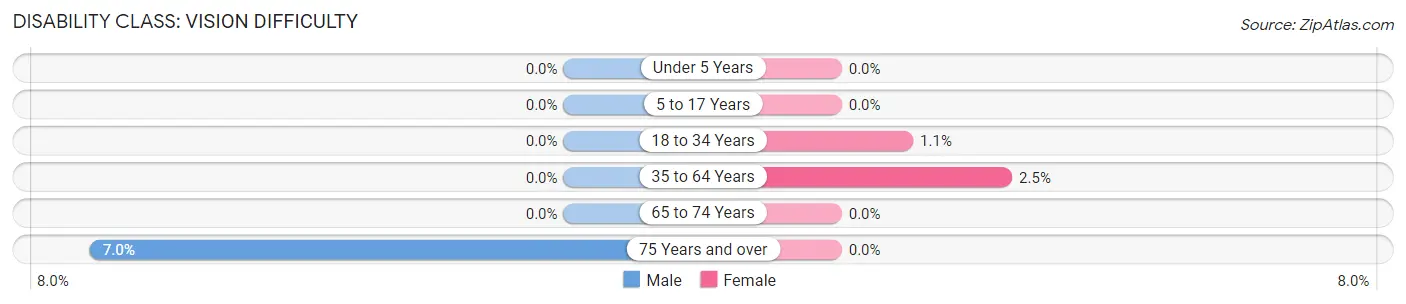
| Age Bracket | Male | Female |
| Under 5 Years | 0 (0.0%) | 0 (0.0%) |
| 5 to 17 Years | 0 (0.0%) | 0 (0.0%) |
| 18 to 34 Years | 0 (0.0%) | 87 (1.1%) |
| 35 to 64 Years | 0 (0.0%) | 12 (2.5%) |
| 65 to 74 Years | 0 (0.0%) | 0 (0.0%) |
| 75 Years and over | 9 (7.0%) | 0 (0.0%) |
Disability Class: Cognitive Difficulty
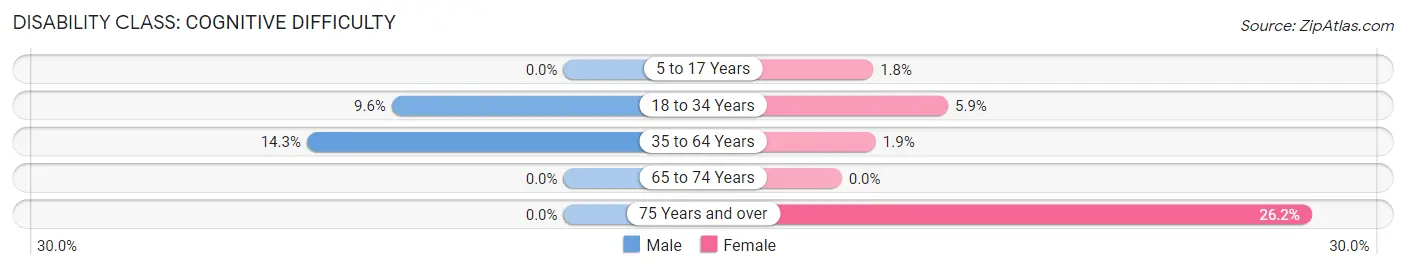
| Age Bracket | Male | Female |
| 5 to 17 Years | 0 (0.0%) | 5 (1.8%) |
| 18 to 34 Years | 677 (9.6%) | 485 (5.9%) |
| 35 to 64 Years | 59 (14.3%) | 9 (1.9%) |
| 65 to 74 Years | 0 (0.0%) | 0 (0.0%) |
| 75 Years and over | 0 (0.0%) | 90 (26.2%) |
Disability Class: Ambulatory Difficulty
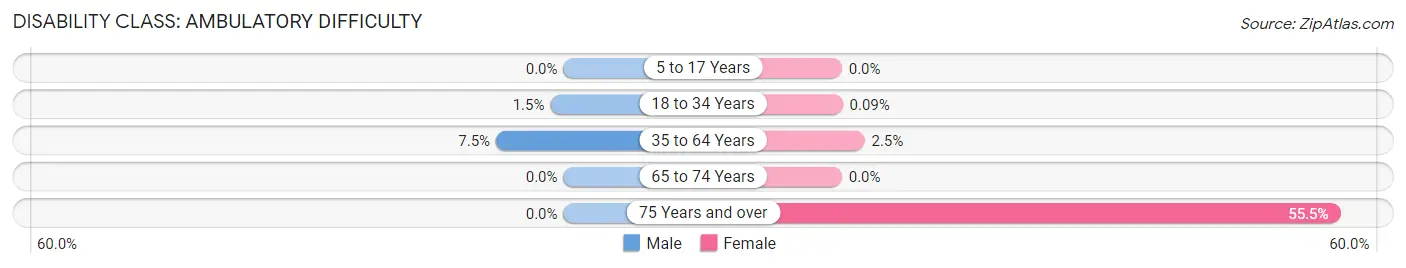
| Age Bracket | Male | Female |
| 5 to 17 Years | 0 (0.0%) | 0 (0.0%) |
| 18 to 34 Years | 103 (1.5%) | 7 (0.1%) |
| 35 to 64 Years | 31 (7.5%) | 12 (2.5%) |
| 65 to 74 Years | 0 (0.0%) | 0 (0.0%) |
| 75 Years and over | 0 (0.0%) | 191 (55.5%) |
Disability Class: Self-Care Difficulty
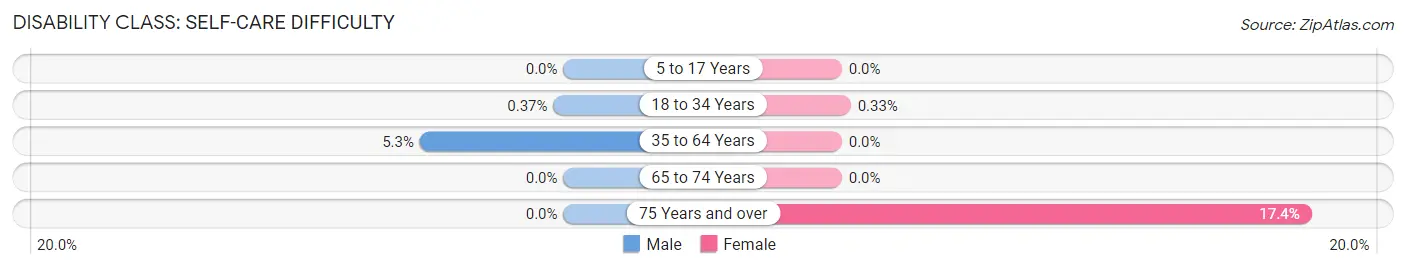
| Age Bracket | Male | Female |
| 5 to 17 Years | 0 (0.0%) | 0 (0.0%) |
| 18 to 34 Years | 26 (0.4%) | 27 (0.3%) |
| 35 to 64 Years | 22 (5.3%) | 0 (0.0%) |
| 65 to 74 Years | 0 (0.0%) | 0 (0.0%) |
| 75 Years and over | 0 (0.0%) | 60 (17.4%) |
Technology Access in Storrs
Computing Device Access in Storrs
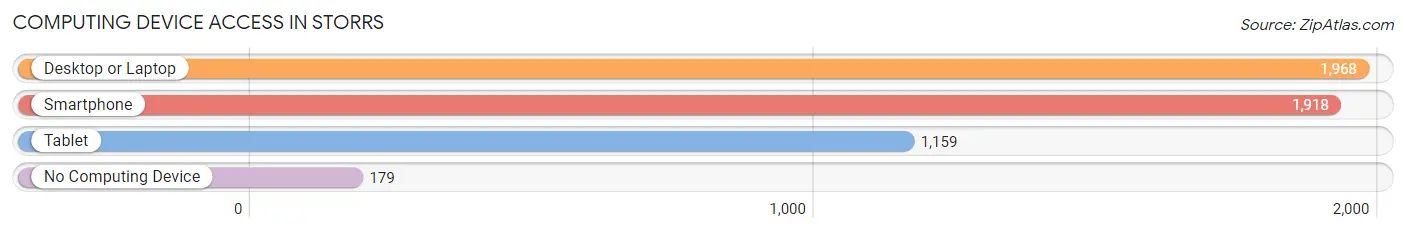
| Device Type | # Households | % Households |
| Desktop or Laptop | 1,968 | 87.8% |
| Smartphone | 1,918 | 85.6% |
| Tablet | 1,159 | 51.7% |
| No Computing Device | 179 | 8.0% |
| Total | 2,241 | 100.0% |
Internet Access in Storrs
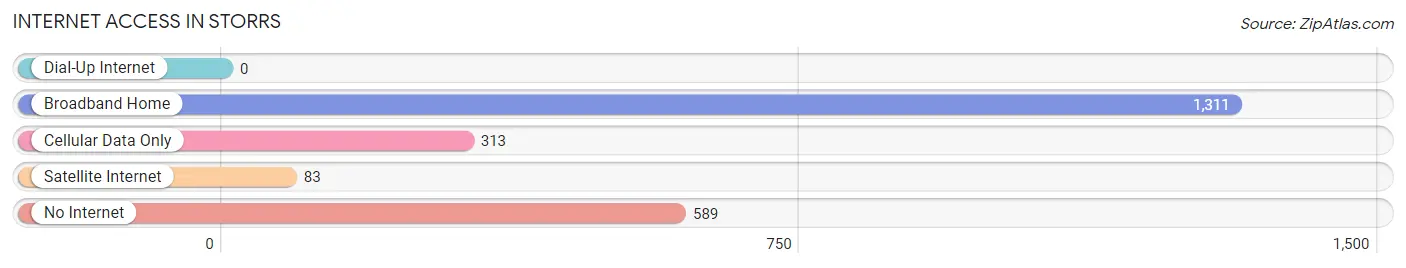
| Internet Type | # Households | % Households |
| Dial-Up Internet | 0 | 0.0% |
| Broadband Home | 1,311 | 58.5% |
| Cellular Data Only | 313 | 14.0% |
| Satellite Internet | 83 | 3.7% |
| No Internet | 589 | 26.3% |
| Total | 2,241 | 100.0% |
Storrs Summary
Storrs, Connecticut is a small town located in the northeastern part of the state. It is part of the town of Mansfield and is home to the main campus of the University of Connecticut. The town has a population of about 10,000 people and is located in Tolland County.
History
Storrs was first settled in 1720 by the Storrs family, who were among the first settlers in the area. The town was originally known as Storrs Parish, and was part of the town of Mansfield. In 1822, the town was incorporated as Storrs.
The town was named after Charles and Augustus Storrs, who were brothers and the original settlers of the area. The Storrs brothers were from Rhode Island and were among the first settlers in the area.
In 1881, the Storrs Agricultural School was founded in Storrs. This school was the predecessor to the University of Connecticut, which was established in 1881. The university has grown to become one of the largest universities in the United States.
Geography
Storrs is located in the northeastern part of Connecticut, in Tolland County. It is bordered by the towns of Mansfield, Willington, Coventry, and Ashford. The town is located in the foothills of the Berkshires and is part of the Connecticut River Valley.
The town has a total area of 8.3 square miles, of which 8.2 square miles is land and 0.1 square miles is water. The terrain is mostly flat, with some rolling hills. The highest point in the town is the summit of Storrs Hill, which is 845 feet above sea level.
Economy
The economy of Storrs is largely driven by the University of Connecticut. The university is the largest employer in the town, with over 10,000 employees. Other major employers in the town include the Storrs Center shopping complex, the Storrs Congregational Church, and the Storrs Public Library.
The town also has a number of small businesses, including restaurants, retail stores, and professional services. The town is also home to a number of farms, which produce a variety of crops, including corn, hay, and vegetables.
Demographics
As of the 2010 census, the population of Storrs was 10,322. The racial makeup of the town was 87.3% White, 5.2% African American, 0.3% Native American, 4.2% Asian, 0.1% Pacific Islander, and 2.9% from other races. Hispanic or Latino of any race were 6.2% of the population.
The median household income in Storrs was $63,944, and the median family income was $77,837. The per capita income for the town was $30,945. About 8.2% of families and 11.7% of the population were below the poverty line, including 15.2% of those under age 18 and 4.2% of those age 65 or over.
Common Questions
What is Per Capita Income in Storrs?
Per Capita income in Storrs is $14,547.
What is the Median Family Income in Storrs?
Median Family Income in Storrs is $138,800.
What is the Median Household income in Storrs?
Median Household Income in Storrs is $27,793.
What is Income or Wage Gap in Storrs?
Income or Wage Gap in Storrs is 25.2%.
Women in Storrs earn 74.8 cents for every dollar earned by a man.
What is Inequality or Gini Index in Storrs?
Inequality or Gini Index in Storrs is 0.66.
What is the Total Population of Storrs?
Total Population of Storrs is 17,606.
What is the Total Male Population of Storrs?
Total Male Population of Storrs is 7,951.
What is the Total Female Population of Storrs?
Total Female Population of Storrs is 9,655.
What is the Ratio of Males per 100 Females in Storrs?
There are 82.35 Males per 100 Females in Storrs.
What is the Ratio of Females per 100 Males in Storrs?
There are 121.43 Females per 100 Males in Storrs.
What is the Median Population Age in Storrs?
Median Population Age in Storrs is 20.4 Years.
What is the Average Family Size in Storrs
Average Family Size in Storrs is 3.1 People.
What is the Average Household Size in Storrs
Average Household Size in Storrs is 2.1 People.
How Large is the Labor Force in Storrs?
There are 7,563 People in the Labor Forcein in Storrs.
What is the Percentage of People in the Labor Force in Storrs?
43.8% of People are in the Labor Force in Storrs.
What is the Unemployment Rate in Storrs?
Unemployment Rate in Storrs is 12.5%.