Cities with the Highest Percentage of Austrian Population in Connecticut
RELATED REPORTS & OPTIONS
Austrian
Connecticut
Compare Cities
Map of Cities with the Highest Percentage of Austrian Population in Connecticut
0.00%
4.00%
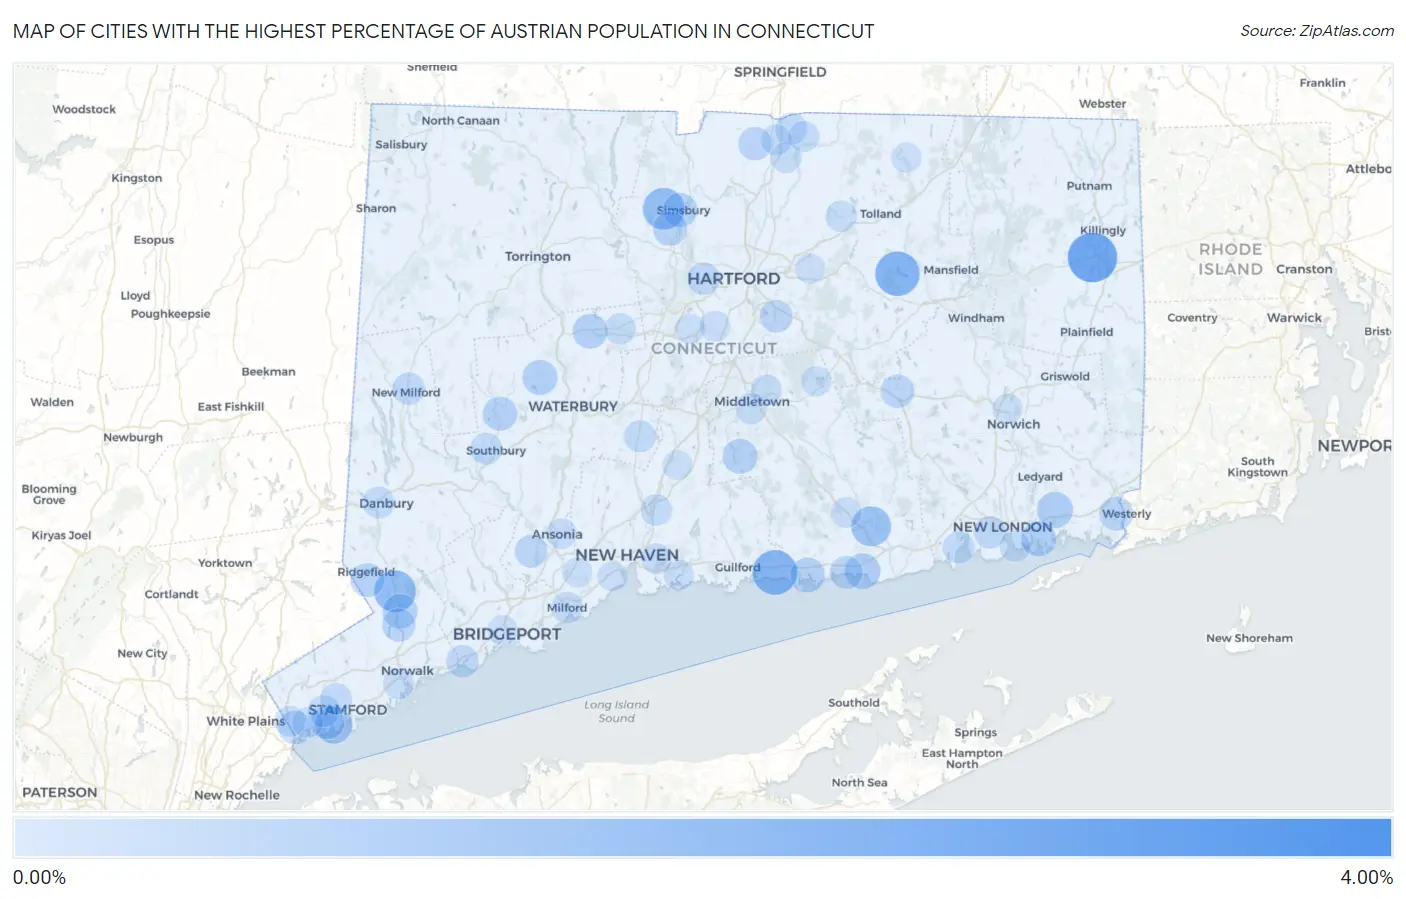
Cities with the Highest Percentage of Austrian Population in Connecticut
| City | Austrian | vs State | vs National | |
| 1. | Westport | 3.75% | 0.32% (+3.43)#1 | 0.19% (+3.56)#174 |
| 2. | Lake Chaffee | 2.99% | 0.32% (+2.67)#2 | 0.19% (+2.80)#245 |
| 3. | Poplar Plains | 2.87% | 0.32% (+2.54)#3 | 0.19% (+2.68)#260 |
| 4. | East Brooklyn | 2.73% | 0.32% (+2.41)#4 | 0.19% (+2.54)#281 |
| 5. | Northford | 2.71% | 0.32% (+2.39)#5 | 0.19% (+2.53)#283 |
| 6. | Rock Ridge | 2.63% | 0.32% (+2.31)#6 | 0.19% (+2.45)#298 |
| 7. | Ridgebury | 2.56% | 0.32% (+2.24)#7 | 0.19% (+2.37)#313 |
| 8. | Plattsville | 2.40% | 0.32% (+2.08)#8 | 0.19% (+2.21)#343 |
| 9. | Candlewood Knolls | 2.35% | 0.32% (+2.03)#9 | 0.19% (+2.17)#346 |
| 10. | Staples | 2.14% | 0.32% (+1.82)#10 | 0.19% (+1.95)#393 |
| 11. | Madison Center | 2.08% | 0.32% (+1.76)#11 | 0.19% (+1.90)#409 |
| 12. | Old Hill | 2.07% | 0.32% (+1.75)#12 | 0.19% (+1.88)#415 |
| 13. | Coventry Lake | 2.06% | 0.32% (+1.74)#13 | 0.19% (+1.88)#416 |
| 14. | South Wilton | 1.96% | 0.32% (+1.64)#14 | 0.19% (+1.77)#444 |
| 15. | Georgetown | 1.69% | 0.32% (+1.37)#15 | 0.19% (+1.50)#549 |
| 16. | West Simsbury | 1.68% | 0.32% (+1.36)#16 | 0.19% (+1.49)#552 |
| 17. | Greens Farms | 1.64% | 0.32% (+1.32)#17 | 0.19% (+1.45)#573 |
| 18. | Taylor Corners | 1.59% | 0.32% (+1.27)#18 | 0.19% (+1.40)#599 |
| 19. | Essex Village | 1.43% | 0.32% (+1.11)#19 | 0.19% (+1.25)#708 |
| 20. | Cornwall Bridge | 1.31% | 0.32% (+0.990)#20 | 0.19% (+1.12)#810 |
| 21. | Groton Long Point Borough | 1.16% | 0.32% (+0.840)#21 | 0.19% (+0.974)#995 |
| 22. | Coleytown | 1.12% | 0.32% (+0.801)#22 | 0.19% (+0.935)#1,040 |
| 23. | Old Greenwich | 1.09% | 0.32% (+0.770)#23 | 0.19% (+0.905)#1,082 |
| 24. | Murray | 0.99% | 0.32% (+0.670)#24 | 0.19% (+0.804)#1,227 |
| 25. | Trumbull Center | 0.93% | 0.32% (+0.609)#25 | 0.19% (+0.743)#1,311 |
| 26. | Old Mystic | 0.92% | 0.32% (+0.595)#26 | 0.19% (+0.730)#1,338 |
| 27. | Saybrook Manor | 0.89% | 0.32% (+0.573)#27 | 0.19% (+0.708)#1,382 |
| 28. | Watertown | 0.80% | 0.32% (+0.476)#28 | 0.19% (+0.611)#1,622 |
| 29. | Poquonock Bridge | 0.79% | 0.32% (+0.471)#29 | 0.19% (+0.605)#1,635 |
| 30. | Ball Pond | 0.79% | 0.32% (+0.470)#30 | 0.19% (+0.604)#1,638 |
| 31. | Clinton | 0.77% | 0.32% (+0.451)#31 | 0.19% (+0.585)#1,688 |
| 32. | Cannondale | 0.75% | 0.32% (+0.431)#32 | 0.19% (+0.566)#1,740 |
| 33. | Durham | 0.75% | 0.32% (+0.429)#33 | 0.19% (+0.563)#1,746 |
| 34. | Compo | 0.74% | 0.32% (+0.422)#34 | 0.19% (+0.556)#1,773 |
| 35. | Terryville | 0.74% | 0.32% (+0.420)#35 | 0.19% (+0.554)#1,781 |
| 36. | Sacred Heart University | 0.71% | 0.32% (+0.389)#36 | 0.19% (+0.523)#1,887 |
| 37. | Simsbury Center | 0.70% | 0.32% (+0.383)#37 | 0.19% (+0.518)#1,905 |
| 38. | Woodbury Center | 0.69% | 0.32% (+0.372)#38 | 0.19% (+0.506)#1,945 |
| 39. | Woodmont Borough | 0.68% | 0.32% (+0.359)#39 | 0.19% (+0.493)#1,987 |
| 40. | Weatogue | 0.67% | 0.32% (+0.354)#40 | 0.19% (+0.488)#2,011 |
| 41. | Indian Field | 0.67% | 0.32% (+0.345)#41 | 0.19% (+0.479)#2,040 |
| 42. | Fairfield University | 0.66% | 0.32% (+0.342)#42 | 0.19% (+0.477)#2,050 |
| 43. | Mill Plain | 0.65% | 0.32% (+0.331)#43 | 0.19% (+0.466)#2,085 |
| 44. | Pawcatuck | 0.65% | 0.32% (+0.326)#44 | 0.19% (+0.460)#2,106 |
| 45. | Ridgefield | 0.63% | 0.32% (+0.307)#45 | 0.19% (+0.441)#2,171 |
| 46. | Riverside | 0.62% | 0.32% (+0.295)#46 | 0.19% (+0.430)#2,210 |
| 47. | Lordship | 0.60% | 0.32% (+0.277)#47 | 0.19% (+0.411)#2,296 |
| 48. | Colchester | 0.60% | 0.32% (+0.275)#48 | 0.19% (+0.410)#2,304 |
| 49. | Suffield Depot | 0.58% | 0.32% (+0.263)#49 | 0.19% (+0.397)#2,351 |
| 50. | Noroton Heights | 0.57% | 0.32% (+0.245)#50 | 0.19% (+0.379)#2,421 |
| 51. | Pemberwick | 0.56% | 0.32% (+0.240)#51 | 0.19% (+0.374)#2,442 |
| 52. | New Canaan | 0.55% | 0.32% (+0.233)#52 | 0.19% (+0.368)#2,476 |
| 53. | Wilton Center | 0.55% | 0.32% (+0.228)#53 | 0.19% (+0.362)#2,502 |
| 54. | Westbrook Center | 0.52% | 0.32% (+0.198)#54 | 0.19% (+0.332)#2,654 |
| 55. | Glastonbury Center | 0.52% | 0.32% (+0.195)#55 | 0.19% (+0.329)#2,676 |
| 56. | Shelton | 0.50% | 0.32% (+0.175)#56 | 0.19% (+0.309)#2,776 |
| 57. | Noroton | 0.48% | 0.32% (+0.161)#57 | 0.19% (+0.296)#2,854 |
| 58. | West Hartford | 0.47% | 0.32% (+0.154)#58 | 0.19% (+0.288)#2,906 |
| 59. | Naugatuck Borough | 0.47% | 0.32% (+0.150)#59 | 0.19% (+0.285)#2,927 |
| 60. | Saugatuck | 0.47% | 0.32% (+0.146)#60 | 0.19% (+0.281)#2,948 |
| 61. | New Milford | 0.47% | 0.32% (+0.145)#61 | 0.19% (+0.279)#2,955 |
| 62. | Southport | 0.46% | 0.32% (+0.142)#62 | 0.19% (+0.276)#2,974 |
| 63. | Candlewood Orchards | 0.46% | 0.32% (+0.138)#63 | 0.19% (+0.272)#2,998 |
| 64. | Waterford | 0.43% | 0.32% (+0.107)#64 | 0.19% (+0.241)#3,198 |
| 65. | Cos Cob | 0.41% | 0.32% (+0.094)#65 | 0.19% (+0.228)#3,290 |
| 66. | Cheshire Village | 0.41% | 0.32% (+0.088)#66 | 0.19% (+0.222)#3,324 |
| 67. | Heritage Village | 0.39% | 0.32% (+0.065)#67 | 0.19% (+0.199)#3,495 |
| 68. | Danbury | 0.37% | 0.32% (+0.054)#68 | 0.19% (+0.189)#3,595 |
| 69. | Niantic | 0.37% | 0.32% (+0.051)#69 | 0.19% (+0.186)#3,622 |
| 70. | Sherwood Manor | 0.37% | 0.32% (+0.046)#70 | 0.19% (+0.180)#3,665 |
| 71. | Stamford | 0.34% | 0.32% (+0.020)#71 | 0.19% (+0.154)#3,893 |
| 72. | North Haven | 0.34% | 0.32% (+0.015)#72 | 0.19% (+0.149)#3,941 |
| 73. | East | 0.33% | 0.32% (+0.014)#73 | 0.19% (+0.148)#3,956 |
| 74. | Milford City Balance | 0.33% | 0.32% (+0.005)#74 | 0.19% (+0.140)#4,043 |
| 75. | Bristol | 0.32% | 0.32% (+0.001)#75 | 0.19% (+0.135)#4,082 |
| 76. | Rockville | 0.30% | 0.32% (-0.018)#76 | 0.19% (+0.116)#4,264 |
| 77. | Litchfield Borough | 0.30% | 0.32% (-0.025)#77 | 0.19% (+0.109)#4,343 |
| 78. | Middletown | 0.29% | 0.32% (-0.025)#78 | 0.19% (+0.109)#4,346 |
| 79. | Norwalk | 0.28% | 0.32% (-0.038)#79 | 0.19% (+0.096)#4,493 |
| 80. | Portland | 0.26% | 0.32% (-0.055)#80 | 0.19% (+0.079)#4,656 |
| 81. | Southwood Acres | 0.26% | 0.32% (-0.055)#81 | 0.19% (+0.079)#4,657 |
| 82. | Hazardville | 0.26% | 0.32% (-0.059)#82 | 0.19% (+0.075)#4,684 |
| 83. | Thompsonville | 0.26% | 0.32% (-0.061)#83 | 0.19% (+0.073)#4,702 |
| 84. | Glenville | 0.26% | 0.32% (-0.063)#84 | 0.19% (+0.071)#4,730 |
| 85. | Groton | 0.26% | 0.32% (-0.064)#85 | 0.19% (+0.070)#4,744 |
| 86. | Ansonia | 0.23% | 0.32% (-0.088)#86 | 0.19% (+0.046)#5,061 |
| 87. | Greenwich | 0.23% | 0.32% (-0.093)#87 | 0.19% (+0.042)#5,134 |
| 88. | Newington | 0.23% | 0.32% (-0.094)#88 | 0.19% (+0.040)#5,149 |
| 89. | East Haven | 0.22% | 0.32% (-0.098)#89 | 0.19% (+0.036)#5,196 |
| 90. | Deep River Center | 0.22% | 0.32% (-0.098)#90 | 0.19% (+0.036)#5,199 |
| 91. | Branford Center | 0.21% | 0.32% (-0.111)#91 | 0.19% (+0.024)#5,394 |
| 92. | Lake Pocotopaug | 0.19% | 0.32% (-0.131)#92 | 0.19% (+0.003)#5,679 |
| 93. | Stafford Springs | 0.18% | 0.32% (-0.136)#93 | 0.19% (-0.002)#5,746 |
| 94. | Manchester | 0.17% | 0.32% (-0.147)#94 | 0.19% (-0.013)#5,924 |
| 95. | Orange | 0.17% | 0.32% (-0.152)#95 | 0.19% (-0.017)#5,987 |
| 96. | Norwich | 0.16% | 0.32% (-0.156)#96 | 0.19% (-0.021)#6,043 |
| 97. | Bridgeport | 0.16% | 0.32% (-0.159)#97 | 0.19% (-0.025)#6,097 |
| 98. | Wallingford Center | 0.16% | 0.32% (-0.160)#98 | 0.19% (-0.026)#6,111 |
| 99. | New Britain | 0.16% | 0.32% (-0.163)#99 | 0.19% (-0.028)#6,154 |
| 100. | West Haven | 0.16% | 0.32% (-0.165)#100 | 0.19% (-0.031)#6,190 |
Common Questions
What are the Top 10 Cities with the Highest Percentage of Austrian Population in Connecticut?
Top 10 Cities with the Highest Percentage of Austrian Population in Connecticut are:
#1
2.73%
#2
2.08%
#3
2.06%
#4
1.69%
#5
1.68%
#6
1.43%
#7
1.09%
#8
0.92%
#9
0.89%
#10
0.80%
What city has the Highest Percentage of Austrian Population in Connecticut?
East Brooklyn has the Highest Percentage of Austrian Population in Connecticut with 2.73%.
What is the Percentage of Austrian Population in the State of Connecticut?
Percentage of Austrian Population in Connecticut is 0.32%.
What is the Percentage of Austrian Population in the United States?
Percentage of Austrian Population in the United States is 0.19%.