Paris, PA Map & Demographics
Paris Map
Paris Overview
$34,274
PER CAPITA INCOME
$88,542
AVG FAMILY INCOME
$80,795
AVG HOUSEHOLD INCOME
25.0%
WAGE / INCOME GAP [ % ]
75.0¢/ $1
WAGE / INCOME GAP [ $ ]
0.37
INEQUALITY / GINI INDEX
635
TOTAL POPULATION
303
MALE POPULATION
332
FEMALE POPULATION
91.27
MALES / 100 FEMALES
109.57
FEMALES / 100 MALES
50.6
MEDIAN AGE
2.9
AVG FAMILY SIZE
2.6
AVG HOUSEHOLD SIZE
298
LABOR FORCE [ PEOPLE ]
51.9%
PERCENT IN LABOR FORCE
Paris Area Codes
Income in Paris
Income Overview in Paris
Per Capita Income in Paris is $34,274, while median incomes of families and households are $88,542 and $80,795 respectively.
| Characteristic | Number | Measure |
| Per Capita Income | 635 | $34,274 |
| Median Family Income | 182 | $88,542 |
| Mean Family Income | 182 | $98,241 |
| Median Household Income | 244 | $80,795 |
| Mean Household Income | 244 | $86,225 |
| Income Deficit | 182 | $0 |
| Wage / Income Gap (%) | 635 | 24.99% |
| Wage / Income Gap ($) | 635 | 75.01¢ per $1 |
| Gini / Inequality Index | 635 | 0.37 |
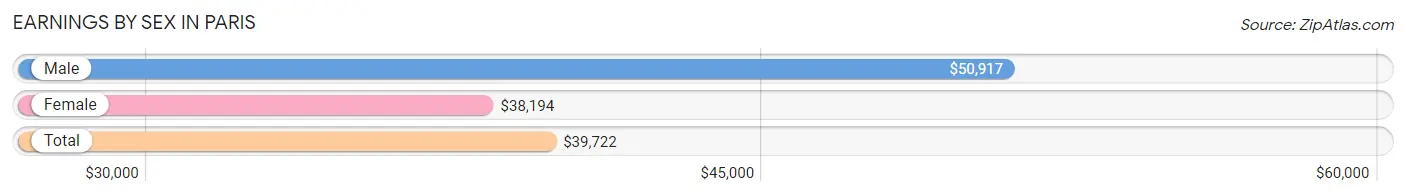
Earnings by Sex in Paris
Average Earnings in Paris are $39,722, $50,917 for men and $38,194 for women, a difference of 25.0%.
| Sex | Number | Average Earnings |
| Male | 129 (42.7%) | $50,917 |
| Female | 173 (57.3%) | $38,194 |
| Total | 302 (100.0%) | $39,722 |
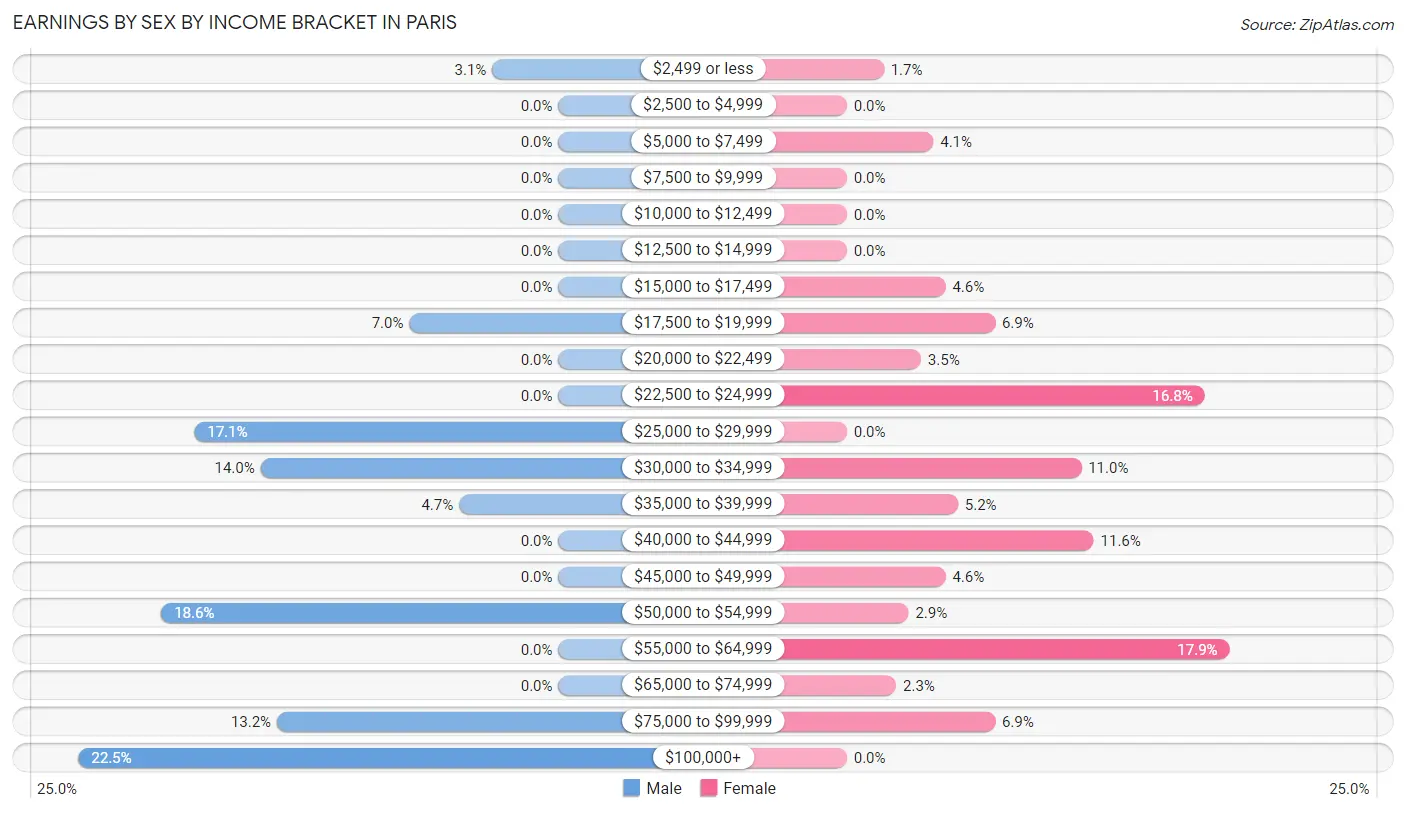
Earnings by Sex by Income Bracket in Paris
The most common earnings brackets in Paris are $100,000+ for men (29 | 22.5%) and $55,000 to $64,999 for women (31 | 17.9%).
| Income | Male | Female |
| $2,499 or less | 4 (3.1%) | 3 (1.7%) |
| $2,500 to $4,999 | 0 (0.0%) | 0 (0.0%) |
| $5,000 to $7,499 | 0 (0.0%) | 7 (4.1%) |
| $7,500 to $9,999 | 0 (0.0%) | 0 (0.0%) |
| $10,000 to $12,499 | 0 (0.0%) | 0 (0.0%) |
| $12,500 to $14,999 | 0 (0.0%) | 0 (0.0%) |
| $15,000 to $17,499 | 0 (0.0%) | 8 (4.6%) |
| $17,500 to $19,999 | 9 (7.0%) | 12 (6.9%) |
| $20,000 to $22,499 | 0 (0.0%) | 6 (3.5%) |
| $22,500 to $24,999 | 0 (0.0%) | 29 (16.8%) |
| $25,000 to $29,999 | 22 (17.1%) | 0 (0.0%) |
| $30,000 to $34,999 | 18 (14.0%) | 19 (11.0%) |
| $35,000 to $39,999 | 6 (4.6%) | 9 (5.2%) |
| $40,000 to $44,999 | 0 (0.0%) | 20 (11.6%) |
| $45,000 to $49,999 | 0 (0.0%) | 8 (4.6%) |
| $50,000 to $54,999 | 24 (18.6%) | 5 (2.9%) |
| $55,000 to $64,999 | 0 (0.0%) | 31 (17.9%) |
| $65,000 to $74,999 | 0 (0.0%) | 4 (2.3%) |
| $75,000 to $99,999 | 17 (13.2%) | 12 (6.9%) |
| $100,000+ | 29 (22.5%) | 0 (0.0%) |
| Total | 129 (100.0%) | 173 (100.0%) |
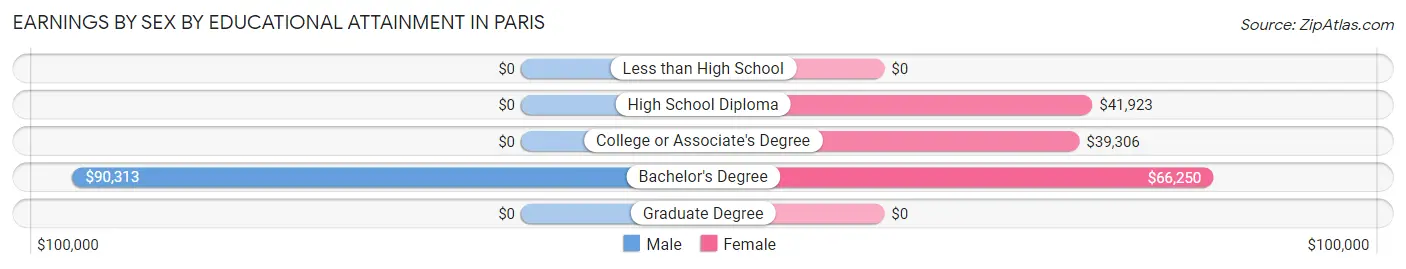
Earnings by Sex by Educational Attainment in Paris
| Educational Attainment | Male Income | Female Income |
| Less than High School | - | - |
| High School Diploma | - | - |
| College or Associate's Degree | - | - |
| Bachelor's Degree | $90,313 | $66,250 |
| Graduate Degree | - | - |
| Total | - | - |
Family Income in Paris
Family Income Brackets in Paris
According to the Paris family income data, there are 63 families falling into the $75,000 to $99,999 income range, which is the most common income bracket and makes up 34.6% of all families.
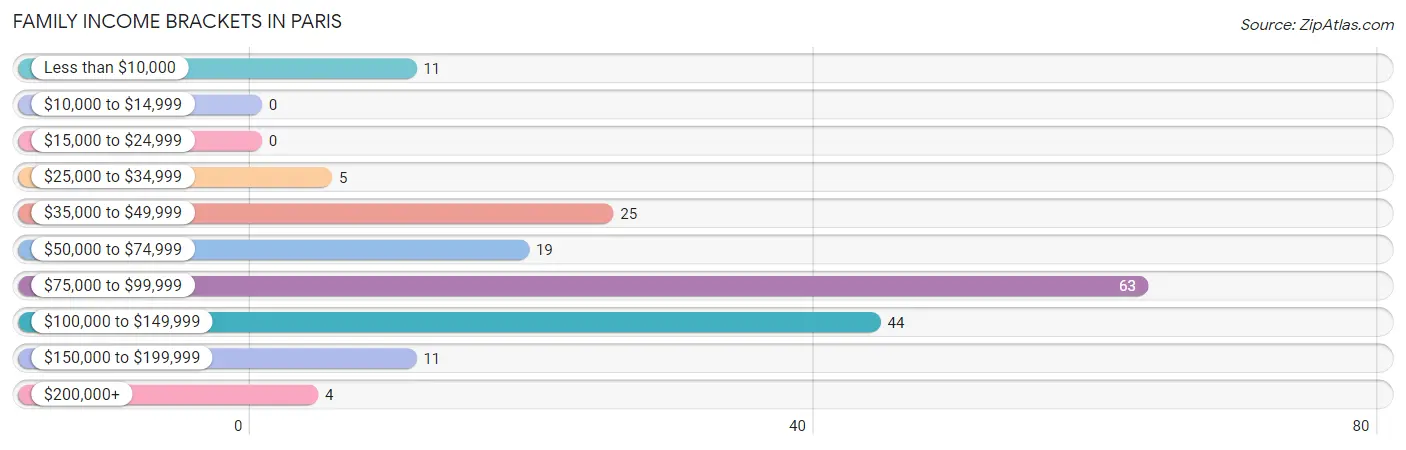
| Income Bracket | # Families | % Families |
| Less than $10,000 | 11 | 6.0% |
| $10,000 to $14,999 | 0 | 0.0% |
| $15,000 to $24,999 | 0 | 0.0% |
| $25,000 to $34,999 | 5 | 2.7% |
| $35,000 to $49,999 | 25 | 13.7% |
| $50,000 to $74,999 | 19 | 10.4% |
| $75,000 to $99,999 | 63 | 34.6% |
| $100,000 to $149,999 | 44 | 24.2% |
| $150,000 to $199,999 | 11 | 6.0% |
| $200,000+ | 4 | 2.2% |
Family Income by Famaliy Size in Paris
2-person families (88 | 48.3%) account for the highest median family income in Paris with $123,750 per family, while 2-person families (88 | 48.3%) have the highest median income of $61,875 per family member.
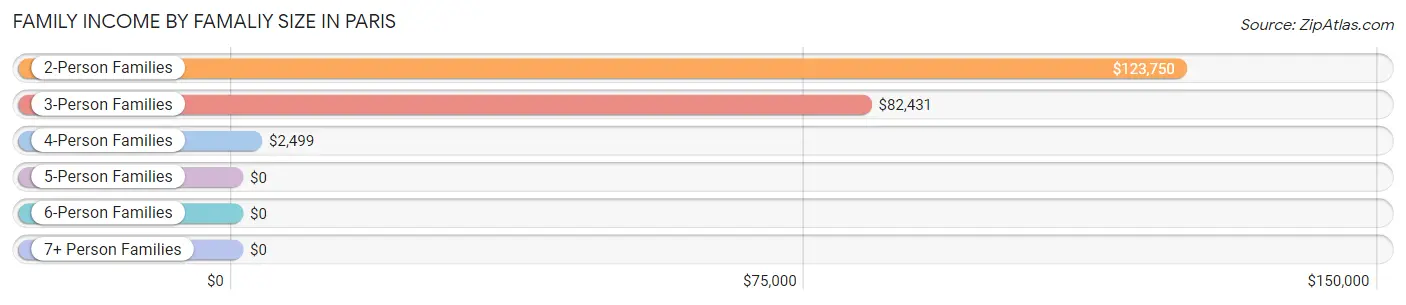
| Income Bracket | # Families | Median Income |
| 2-Person Families | 88 (48.3%) | $123,750 |
| 3-Person Families | 67 (36.8%) | $82,431 |
| 4-Person Families | 21 (11.5%) | $2,499 |
| 5-Person Families | 6 (3.3%) | $0 |
| 6-Person Families | 0 (0.0%) | $0 |
| 7+ Person Families | 0 (0.0%) | $0 |
| Total | 182 (100.0%) | $88,542 |
Family Income by Number of Earners in Paris
The median family income in Paris is $88,542, with families comprising 3+ earners (20) having the highest median family income of $172,917, while families with 1 earner (51) have the lowest median family income of $55,179, accounting for 11.0% and 28.0% of families, respectively.
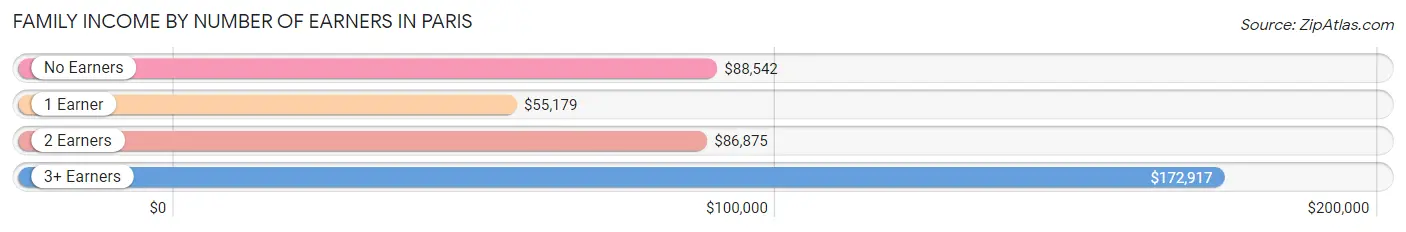
| Number of Earners | # Families | Median Income |
| No Earners | 49 (26.9%) | $88,542 |
| 1 Earner | 51 (28.0%) | $55,179 |
| 2 Earners | 62 (34.1%) | $86,875 |
| 3+ Earners | 20 (11.0%) | $172,917 |
| Total | 182 (100.0%) | $88,542 |
Household Income in Paris
Household Income Brackets in Paris
With 63 households falling in the category, the $75,000 to $99,999 income range is the most frequent in Paris, accounting for 25.8% of all households. In contrast, only 4 households (1.6%) fall into the $200,000+ income bracket, making it the least populous group.
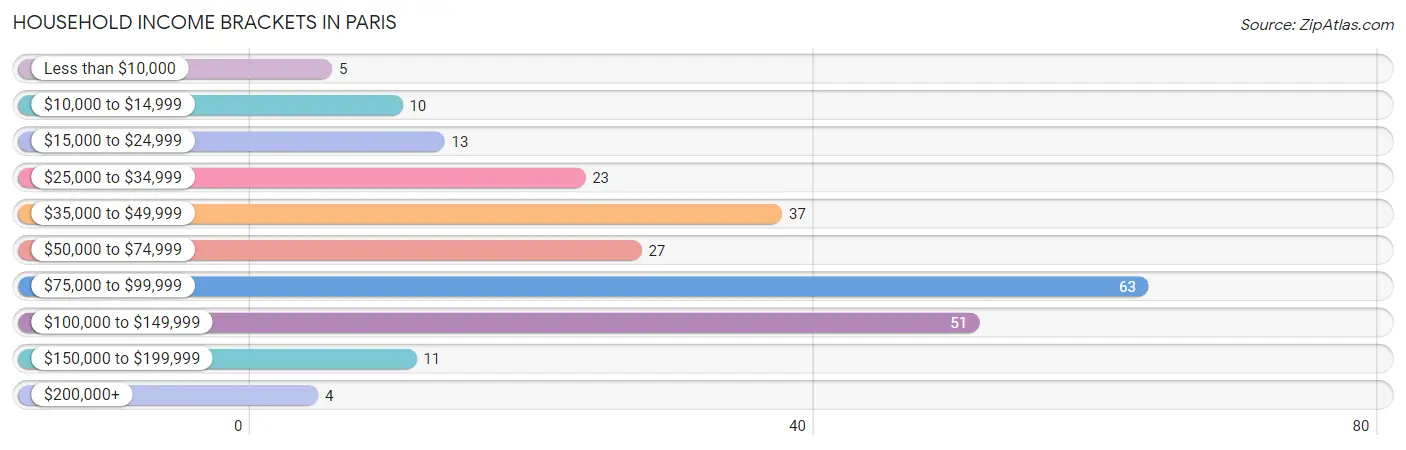
| Income Bracket | # Households | % Households |
| Less than $10,000 | 5 | 2.0% |
| $10,000 to $14,999 | 10 | 4.1% |
| $15,000 to $24,999 | 13 | 5.3% |
| $25,000 to $34,999 | 23 | 9.4% |
| $35,000 to $49,999 | 37 | 15.2% |
| $50,000 to $74,999 | 27 | 11.1% |
| $75,000 to $99,999 | 63 | 25.8% |
| $100,000 to $149,999 | 51 | 20.9% |
| $150,000 to $199,999 | 11 | 4.5% |
| $200,000+ | 4 | 1.6% |
Household Income by Householder Age in Paris
The median household income in Paris is $80,795, with the highest median household income of $80,972 found in the 25 to 44 years age bracket for the primary householder. A total of 36 households (14.7%) fall into this category.
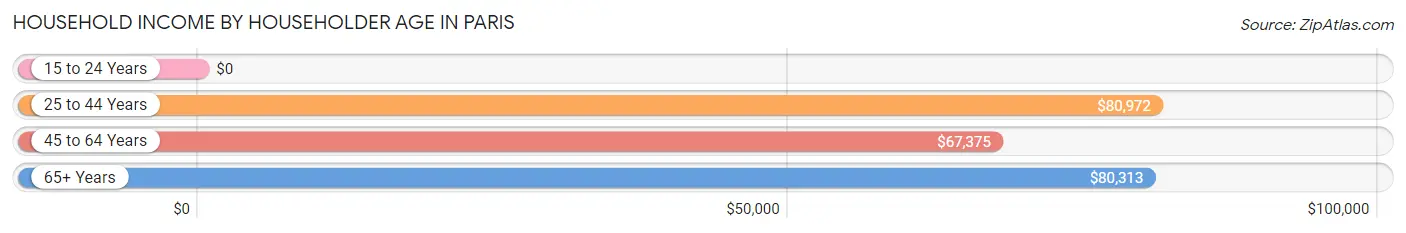
| Income Bracket | # Households | Median Income |
| 15 to 24 Years | 0 (0.0%) | $0 |
| 25 to 44 Years | 36 (14.7%) | $80,972 |
| 45 to 64 Years | 107 (43.9%) | $67,375 |
| 65+ Years | 101 (41.4%) | $80,313 |
| Total | 244 (100.0%) | $80,795 |
Poverty in Paris
Income Below Poverty by Sex and Age in Paris
With 17.8% poverty level for males and 9.6% for females among the residents of Paris, under 5 year old males and 6 to 11 year old females are the most vulnerable to poverty, with 12 males (100.0%) and 11 females (45.8%) in their respective age groups living below the poverty level.
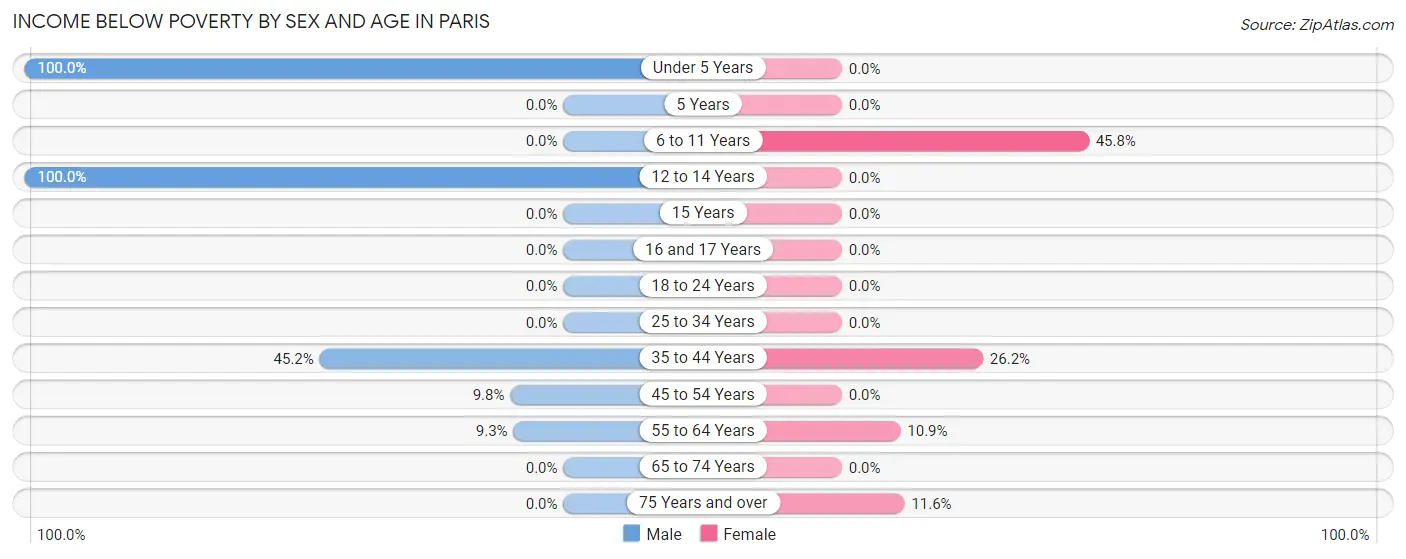
| Age Bracket | Male | Female |
| Under 5 Years | 12 (100.0%) | 0 (0.0%) |
| 5 Years | 0 (0.0%) | 0 (0.0%) |
| 6 to 11 Years | 0 (0.0%) | 11 (45.8%) |
| 12 to 14 Years | 12 (100.0%) | 0 (0.0%) |
| 15 Years | 0 (0.0%) | 0 (0.0%) |
| 16 and 17 Years | 0 (0.0%) | 0 (0.0%) |
| 18 to 24 Years | 0 (0.0%) | 0 (0.0%) |
| 25 to 34 Years | 0 (0.0%) | 0 (0.0%) |
| 35 to 44 Years | 19 (45.2%) | 11 (26.2%) |
| 45 to 54 Years | 6 (9.8%) | 0 (0.0%) |
| 55 to 64 Years | 5 (9.3%) | 5 (10.9%) |
| 65 to 74 Years | 0 (0.0%) | 0 (0.0%) |
| 75 Years and over | 0 (0.0%) | 5 (11.6%) |
| Total | 54 (17.8%) | 32 (9.6%) |
Income Above Poverty by Sex and Age in Paris
According to the poverty statistics in Paris, males aged 16 and 17 years and females aged 12 to 14 years are the age groups that are most secure financially, with 100.0% of males and 100.0% of females in these age groups living above the poverty line.
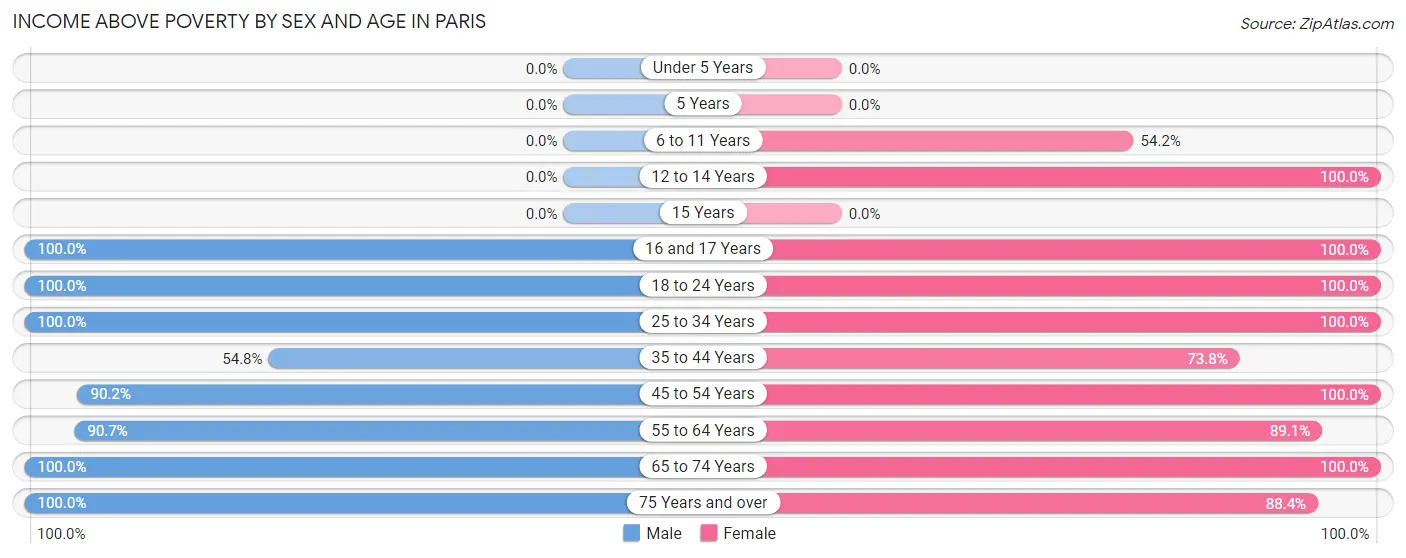
| Age Bracket | Male | Female |
| Under 5 Years | 0 (0.0%) | 0 (0.0%) |
| 5 Years | 0 (0.0%) | 0 (0.0%) |
| 6 to 11 Years | 0 (0.0%) | 13 (54.2%) |
| 12 to 14 Years | 0 (0.0%) | 13 (100.0%) |
| 15 Years | 0 (0.0%) | 0 (0.0%) |
| 16 and 17 Years | 12 (100.0%) | 7 (100.0%) |
| 18 to 24 Years | 18 (100.0%) | 73 (100.0%) |
| 25 to 34 Years | 6 (100.0%) | 14 (100.0%) |
| 35 to 44 Years | 23 (54.8%) | 31 (73.8%) |
| 45 to 54 Years | 55 (90.2%) | 58 (100.0%) |
| 55 to 64 Years | 49 (90.7%) | 41 (89.1%) |
| 65 to 74 Years | 38 (100.0%) | 12 (100.0%) |
| 75 Years and over | 48 (100.0%) | 38 (88.4%) |
| Total | 249 (82.2%) | 300 (90.4%) |
Income Below Poverty Among Married-Couple Families in Paris
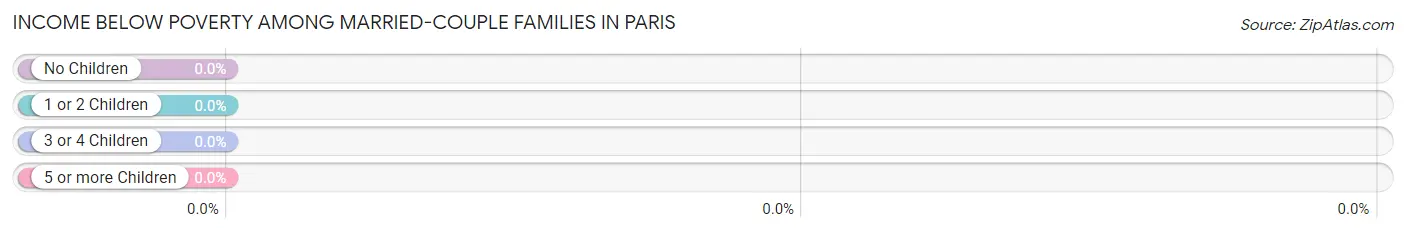
| Children | Above Poverty | Below Poverty |
| No Children | 99 (100.0%) | 0 (0.0%) |
| 1 or 2 Children | 10 (100.0%) | 0 (0.0%) |
| 3 or 4 Children | 0 (0.0%) | 0 (0.0%) |
| 5 or more Children | 0 (0.0%) | 0 (0.0%) |
| Total | 109 (100.0%) | 0 (0.0%) |
Income Below Poverty Among Single-Parent Households in Paris
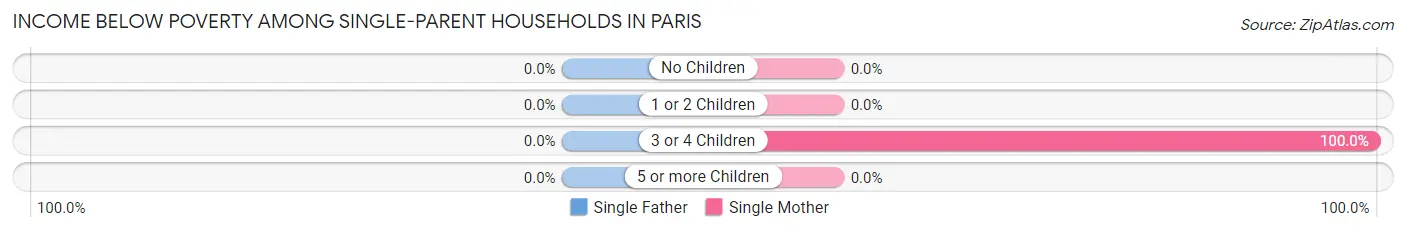
| Children | Single Father | Single Mother |
| No Children | 0 (0.0%) | 0 (0.0%) |
| 1 or 2 Children | 0 (0.0%) | 0 (0.0%) |
| 3 or 4 Children | 0 (0.0%) | 11 (100.0%) |
| 5 or more Children | 0 (0.0%) | 0 (0.0%) |
| Total | 0 (0.0%) | 11 (21.6%) |
Income Below Poverty Among Married-Couple vs Single-Parent Households in Paris

| Children | Married-Couple Families | Single-Parent Households |
| No Children | 0 (0.0%) | 0 (0.0%) |
| 1 or 2 Children | 0 (0.0%) | 0 (0.0%) |
| 3 or 4 Children | 0 (0.0%) | 11 (100.0%) |
| 5 or more Children | 0 (0.0%) | 0 (0.0%) |
| Total | 0 (0.0%) | 11 (15.1%) |
Race in Paris
The most populous races in Paris are , and White / Caucasian (635 | 100.0%).
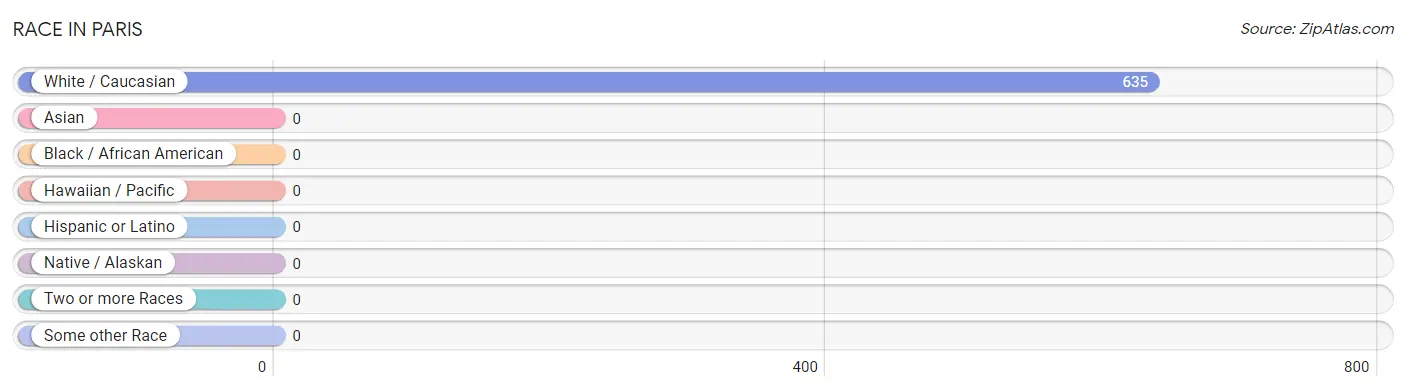
| Race | # Population | % Population |
| Asian | 0 | 0.0% |
| Black / African American | 0 | 0.0% |
| Hawaiian / Pacific | 0 | 0.0% |
| Hispanic or Latino | 0 | 0.0% |
| Native / Alaskan | 0 | 0.0% |
| White / Caucasian | 635 | 100.0% |
| Two or more Races | 0 | 0.0% |
| Some other Race | 0 | 0.0% |
| Total | 635 | 100.0% |
Ancestry in Paris
The most populous ancestries reported in Paris are Irish (98 | 15.4%), Italian (97 | 15.3%), English (79 | 12.4%), Polish (65 | 10.2%), and German (64 | 10.1%), together accounting for 63.5% of all Paris residents.
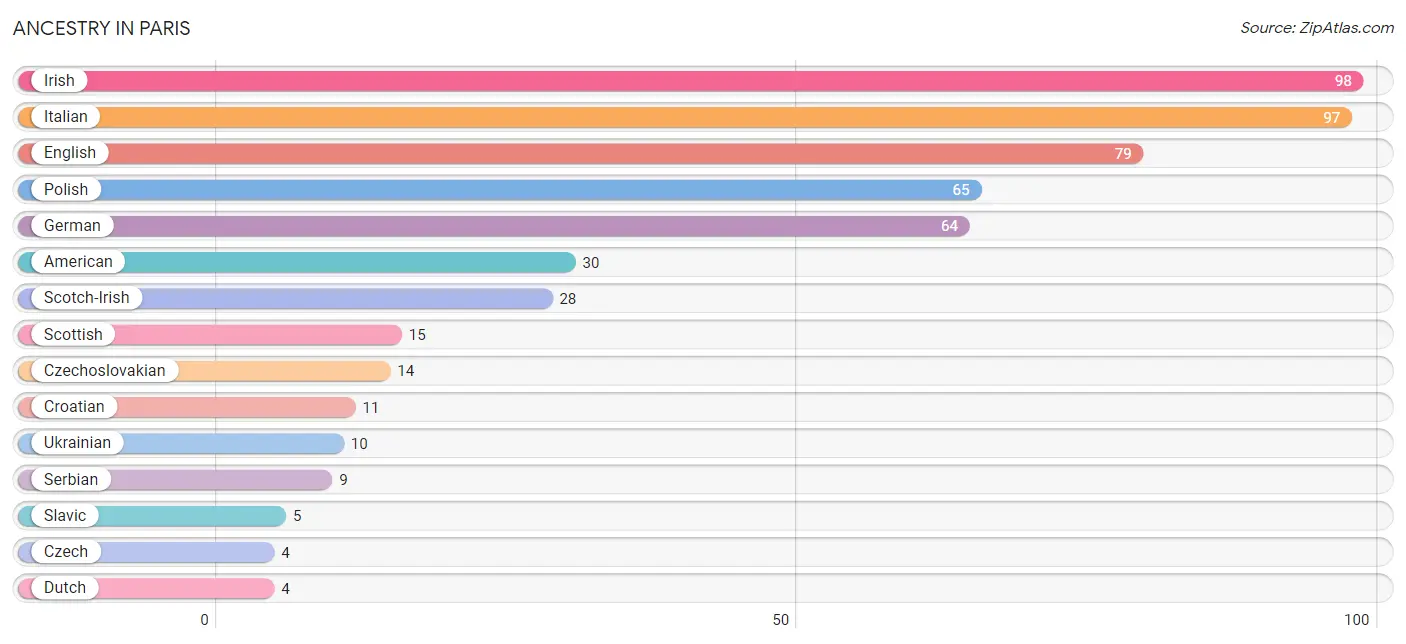
| Ancestry | # Population | % Population |
| American | 30 | 4.7% |
| Croatian | 11 | 1.7% |
| Czech | 4 | 0.6% |
| Czechoslovakian | 14 | 2.2% |
| Dutch | 4 | 0.6% |
| English | 79 | 12.4% |
| German | 64 | 10.1% |
| Irish | 98 | 15.4% |
| Italian | 97 | 15.3% |
| Polish | 65 | 10.2% |
| Scotch-Irish | 28 | 4.4% |
| Scottish | 15 | 2.4% |
| Serbian | 9 | 1.4% |
| Slavic | 5 | 0.8% |
| Ukrainian | 10 | 1.6% | View All 15 Rows |
Immigrants in Paris

| Immigration Origin | # Population | % Population | View All 0 Rows |
Sex and Age in Paris
Sex and Age in Paris
The most populous age groups in Paris are 50 to 54 Years (47 | 15.5%) for men and 20 to 24 Years (52 | 15.7%) for women.
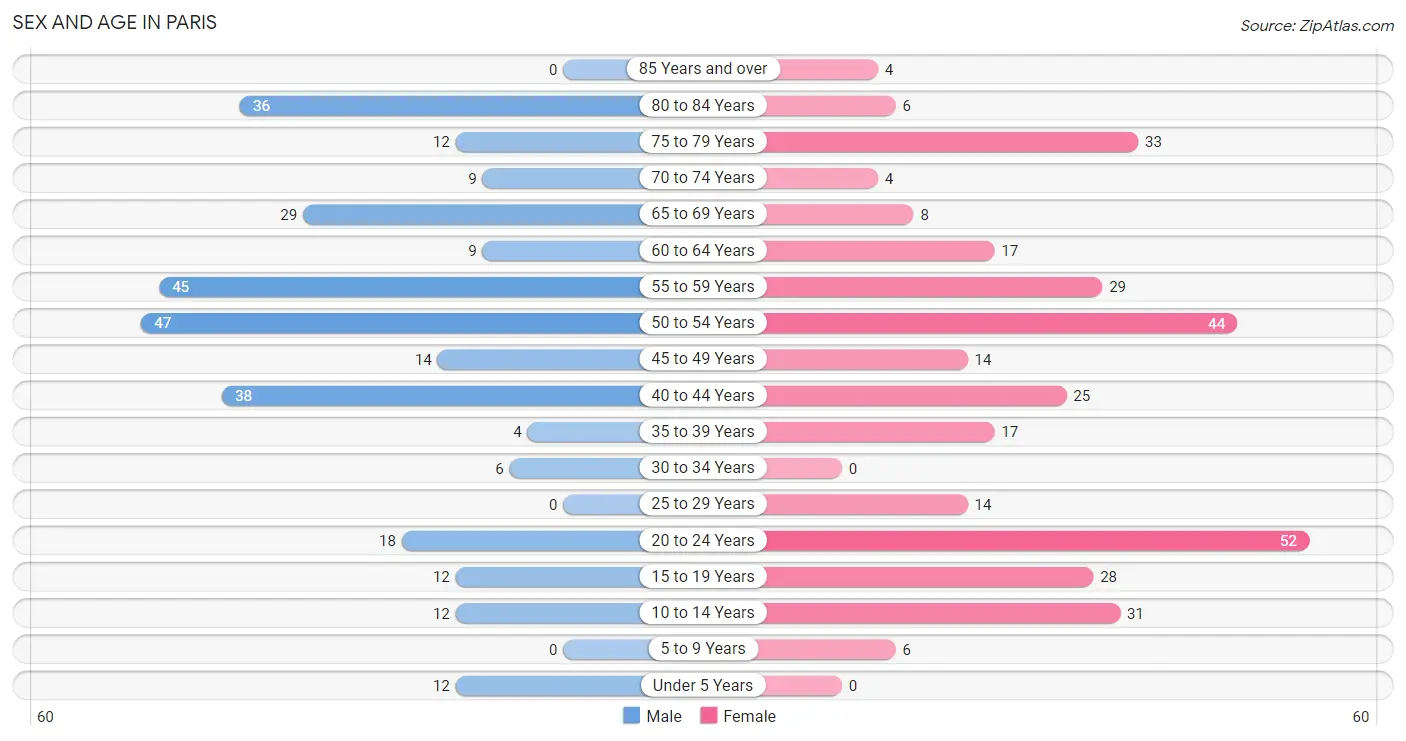
| Age Bracket | Male | Female |
| Under 5 Years | 12 (4.0%) | 0 (0.0%) |
| 5 to 9 Years | 0 (0.0%) | 6 (1.8%) |
| 10 to 14 Years | 12 (4.0%) | 31 (9.3%) |
| 15 to 19 Years | 12 (4.0%) | 28 (8.4%) |
| 20 to 24 Years | 18 (5.9%) | 52 (15.7%) |
| 25 to 29 Years | 0 (0.0%) | 14 (4.2%) |
| 30 to 34 Years | 6 (2.0%) | 0 (0.0%) |
| 35 to 39 Years | 4 (1.3%) | 17 (5.1%) |
| 40 to 44 Years | 38 (12.5%) | 25 (7.5%) |
| 45 to 49 Years | 14 (4.6%) | 14 (4.2%) |
| 50 to 54 Years | 47 (15.5%) | 44 (13.3%) |
| 55 to 59 Years | 45 (14.8%) | 29 (8.7%) |
| 60 to 64 Years | 9 (3.0%) | 17 (5.1%) |
| 65 to 69 Years | 29 (9.6%) | 8 (2.4%) |
| 70 to 74 Years | 9 (3.0%) | 4 (1.2%) |
| 75 to 79 Years | 12 (4.0%) | 33 (9.9%) |
| 80 to 84 Years | 36 (11.9%) | 6 (1.8%) |
| 85 Years and over | 0 (0.0%) | 4 (1.2%) |
| Total | 303 (100.0%) | 332 (100.0%) |
Families and Households in Paris
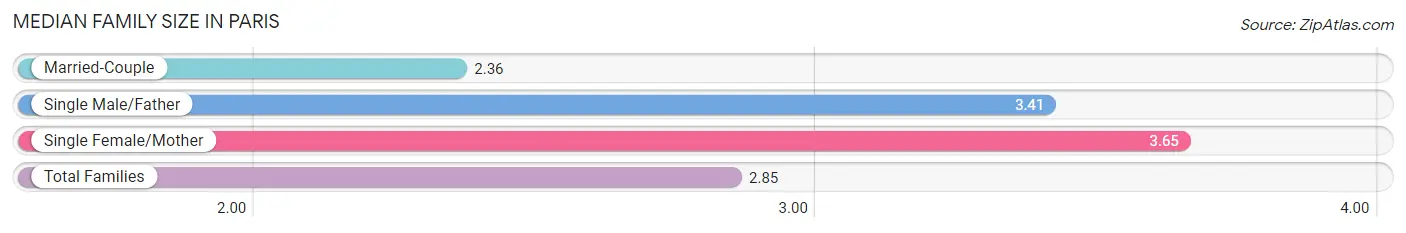
Median Family Size in Paris
The median family size in Paris is 2.85 persons per family, with single female/mother families (51 | 28.0%) accounting for the largest median family size of 3.65 persons per family. On the other hand, married-couple families (109 | 59.9%) represent the smallest median family size with 2.36 persons per family.
| Family Type | # Families | Family Size |
| Married-Couple | 109 (59.9%) | 2.36 |
| Single Male/Father | 22 (12.1%) | 3.41 |
| Single Female/Mother | 51 (28.0%) | 3.65 |
| Total Families | 182 (100.0%) | 2.85 |
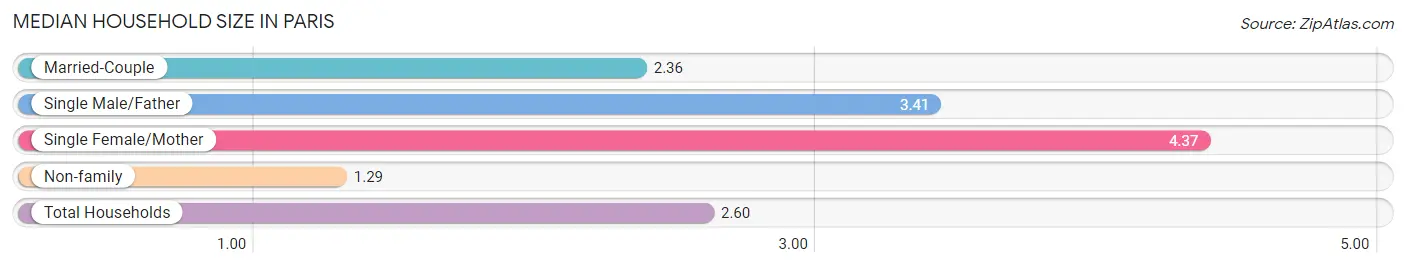
Median Household Size in Paris
The median household size in Paris is 2.60 persons per household, with single female/mother households (51 | 20.9%) accounting for the largest median household size of 4.37 persons per household. non-family households (62 | 25.4%) represent the smallest median household size with 1.29 persons per household.
| Household Type | # Households | Household Size |
| Married-Couple | 109 (44.7%) | 2.36 |
| Single Male/Father | 22 (9.0%) | 3.41 |
| Single Female/Mother | 51 (20.9%) | 4.37 |
| Non-family | 62 (25.4%) | 1.29 |
| Total Households | 244 (100.0%) | 2.60 |
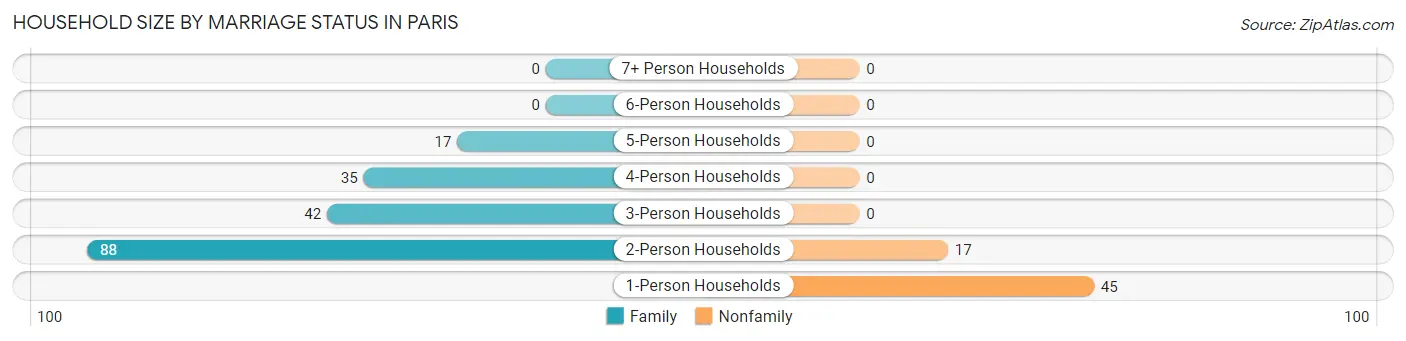
Household Size by Marriage Status in Paris
Out of a total of 244 households in Paris, 182 (74.6%) are family households, while 62 (25.4%) are nonfamily households. The most numerous type of family households are 2-person households, comprising 88, and the most common type of nonfamily households are 1-person households, comprising 45.
| Household Size | Family Households | Nonfamily Households |
| 1-Person Households | - | 45 (18.4%) |
| 2-Person Households | 88 (36.1%) | 17 (7.0%) |
| 3-Person Households | 42 (17.2%) | 0 (0.0%) |
| 4-Person Households | 35 (14.3%) | 0 (0.0%) |
| 5-Person Households | 17 (7.0%) | 0 (0.0%) |
| 6-Person Households | 0 (0.0%) | 0 (0.0%) |
| 7+ Person Households | 0 (0.0%) | 0 (0.0%) |
| Total | 182 (74.6%) | 62 (25.4%) |
Female Fertility in Paris
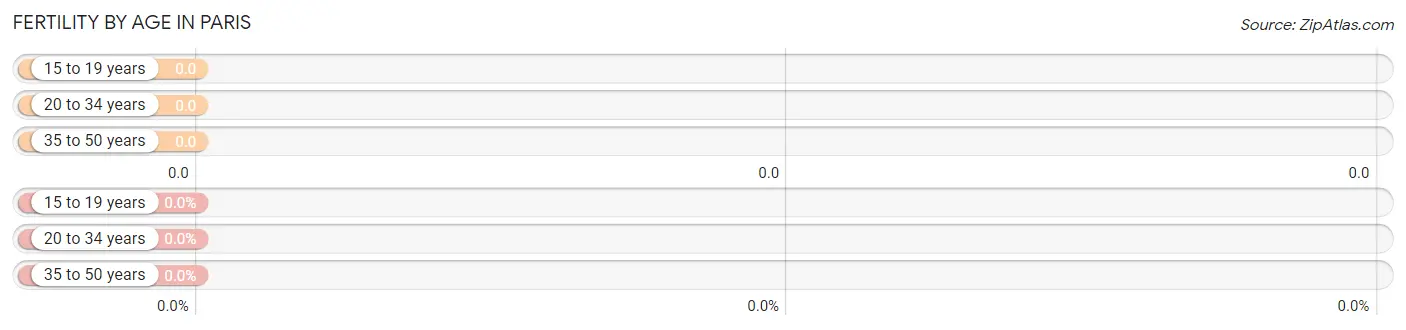
Fertility by Age in Paris
| Age Bracket | Women with Births | Births / 1,000 Women |
| 15 to 19 years | 0 (0.0%) | 0.0 |
| 20 to 34 years | 0 (0.0%) | 0.0 |
| 35 to 50 years | 0 (0.0%) | 0.0 |
| Total | 0 (0.0%) | 0.0 |
Fertility by Age by Marriage Status in Paris
| Age Bracket | Married | Unmarried |
| 15 to 19 years | 0 (0.0%) | 0 (0.0%) |
| 20 to 34 years | 0 (0.0%) | 0 (0.0%) |
| 35 to 50 years | 0 (0.0%) | 0 (0.0%) |
| Total | 0 (0.0%) | 0 (0.0%) |
Fertility by Education in Paris
| Educational Attainment | Women with Births | Births / 1,000 Women |
| Less than High School | 0 (0.0%) | 0.0 |
| High School Diploma | 0 (0.0%) | 0.0 |
| College or Associate's Degree | 0 (0.0%) | 0.0 |
| Bachelor's Degree | 0 (0.0%) | 0.0 |
| Graduate Degree | 0 (0.0%) | 0.0 |
| Total | 0 (0.0%) | 0.0 |
Fertility by Education by Marriage Status in Paris
| Educational Attainment | Married | Unmarried |
| Less than High School | 0 (0.0%) | 0 (0.0%) |
| High School Diploma | 0 (0.0%) | 0 (0.0%) |
| College or Associate's Degree | 0 (0.0%) | 0 (0.0%) |
| Bachelor's Degree | 0 (0.0%) | 0 (0.0%) |
| Graduate Degree | 0 (0.0%) | 0 (0.0%) |
| Total | 0 (0.0%) | 0 (0.0%) |
Employment Characteristics in Paris
Employment by Class of Employer in Paris
Among the 294 employed individuals in Paris, private company employees (247 | 84.0%), local government employees (29 | 9.9%), and not-for-profit organizations (11 | 3.7%) make up the most common classes of employment.
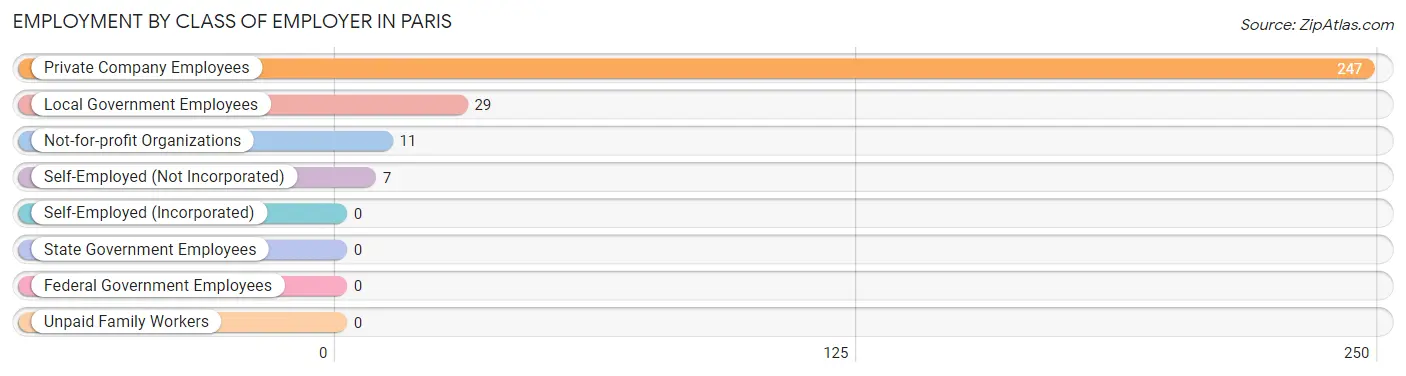
| Employer Class | # Employees | % Employees |
| Private Company Employees | 247 | 84.0% |
| Self-Employed (Incorporated) | 0 | 0.0% |
| Self-Employed (Not Incorporated) | 7 | 2.4% |
| Not-for-profit Organizations | 11 | 3.7% |
| Local Government Employees | 29 | 9.9% |
| State Government Employees | 0 | 0.0% |
| Federal Government Employees | 0 | 0.0% |
| Unpaid Family Workers | 0 | 0.0% |
| Total | 294 | 100.0% |
Employment Status by Age in Paris
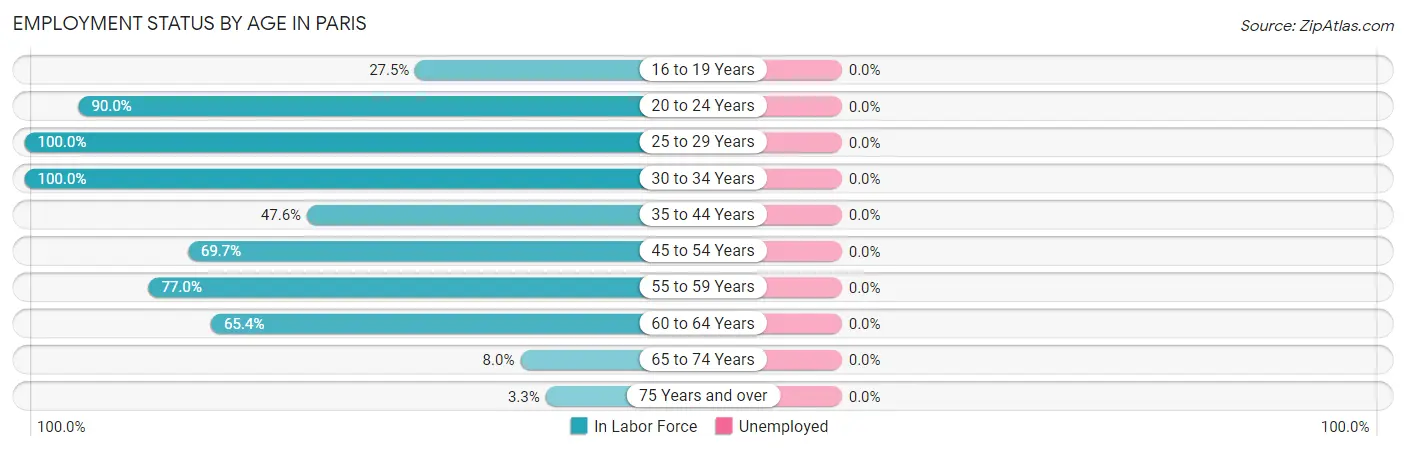
| Age Bracket | In Labor Force | Unemployed |
| 16 to 19 Years | 11 (27.5%) | 0 (0.0%) |
| 20 to 24 Years | 63 (90.0%) | 0 (0.0%) |
| 25 to 29 Years | 14 (100.0%) | 0 (0.0%) |
| 30 to 34 Years | 6 (100.0%) | 0 (0.0%) |
| 35 to 44 Years | 40 (47.6%) | 0 (0.0%) |
| 45 to 54 Years | 83 (69.7%) | 0 (0.0%) |
| 55 to 59 Years | 57 (77.0%) | 0 (0.0%) |
| 60 to 64 Years | 17 (65.4%) | 0 (0.0%) |
| 65 to 74 Years | 4 (8.0%) | 0 (0.0%) |
| 75 Years and over | 3 (3.3%) | 0 (0.0%) |
| Total | 298 (51.9%) | 0 (0.0%) |
Employment Status by Educational Attainment in Paris
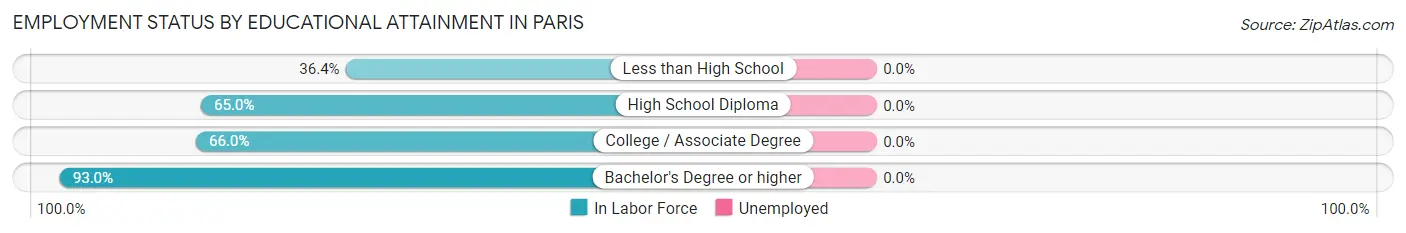
| Educational Attainment | In Labor Force | Unemployed |
| Less than High School | 12 (36.4%) | 0 (0.0%) |
| High School Diploma | 117 (65.0%) | 0 (0.0%) |
| College / Associate Degree | 35 (66.0%) | 0 (0.0%) |
| Bachelor's Degree or higher | 53 (93.0%) | 0 (0.0%) |
| Total | 217 (67.2%) | 0 (0.0%) |
Employment Occupations by Sex in Paris
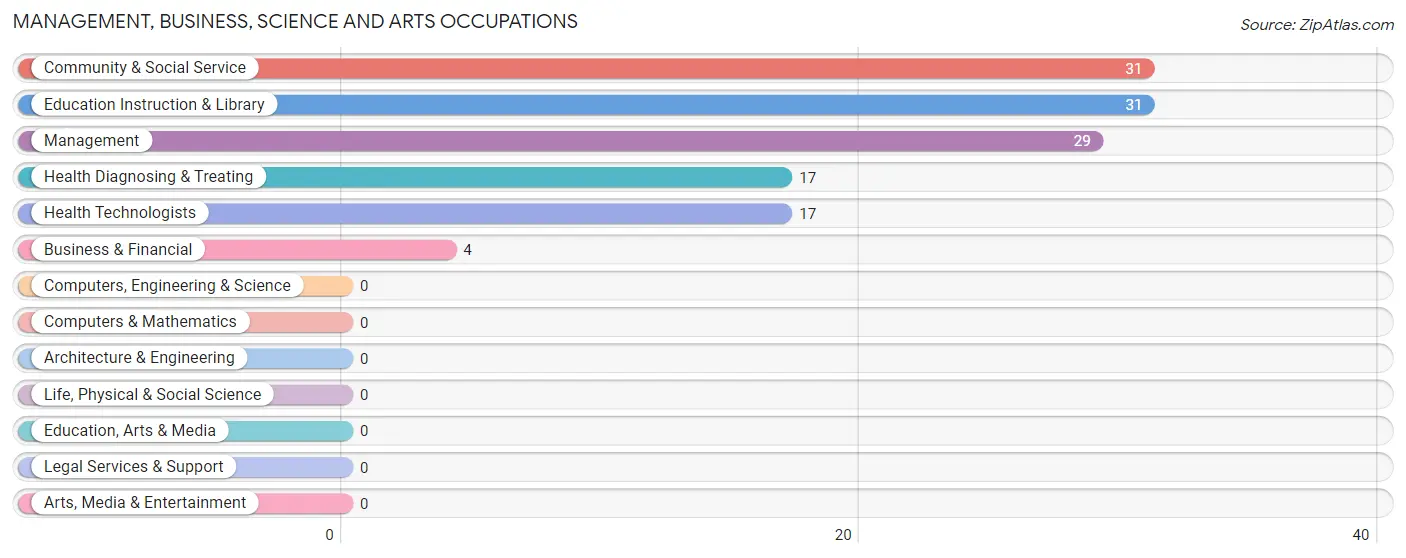
Management, Business, Science and Arts Occupations
The most common Management, Business, Science and Arts occupations in Paris are Community & Social Service (31 | 10.4%), Education Instruction & Library (31 | 10.4%), Management (29 | 9.7%), Health Diagnosing & Treating (17 | 5.7%), and Health Technologists (17 | 5.7%).
Management, Business, Science and Arts Occupations by Sex
Within the Management, Business, Science and Arts occupations in Paris, the most male-oriented occupations are Community & Social Service (74.2%), Education Instruction & Library (74.2%), and Management (65.5%), while the most female-oriented occupations are Business & Financial (100.0%), Health Diagnosing & Treating (100.0%), and Health Technologists (100.0%).
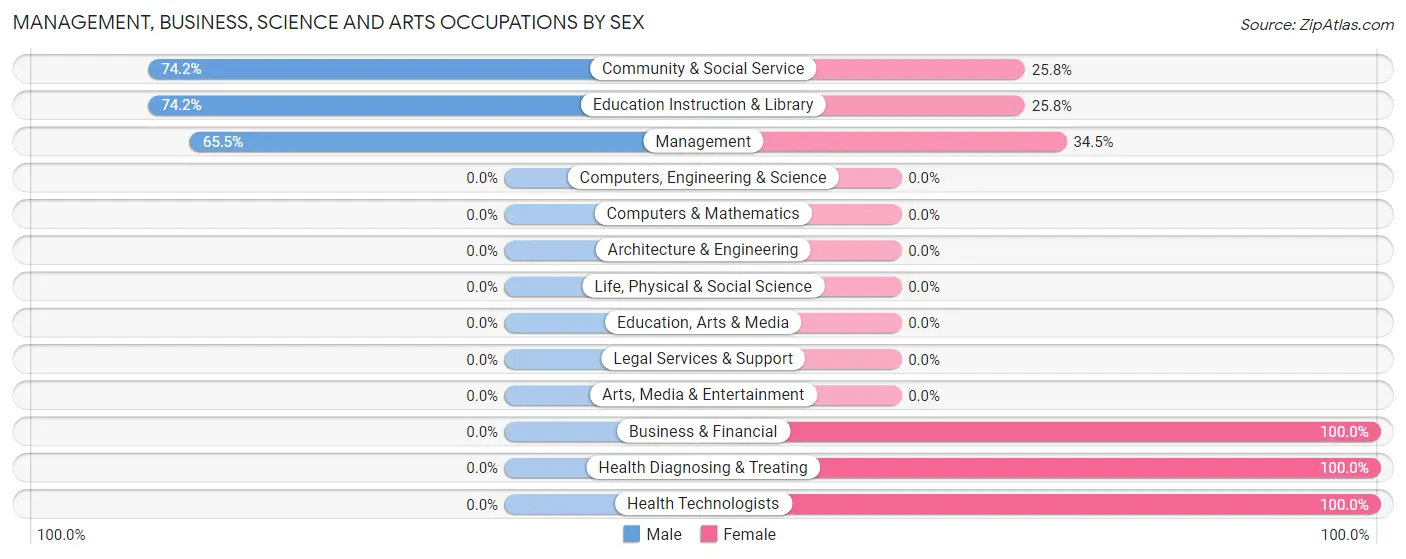
| Occupation | Male | Female |
| Management | 19 (65.5%) | 10 (34.5%) |
| Business & Financial | 0 (0.0%) | 4 (100.0%) |
| Computers, Engineering & Science | 0 (0.0%) | 0 (0.0%) |
| Computers & Mathematics | 0 (0.0%) | 0 (0.0%) |
| Architecture & Engineering | 0 (0.0%) | 0 (0.0%) |
| Life, Physical & Social Science | 0 (0.0%) | 0 (0.0%) |
| Community & Social Service | 23 (74.2%) | 8 (25.8%) |
| Education, Arts & Media | 0 (0.0%) | 0 (0.0%) |
| Legal Services & Support | 0 (0.0%) | 0 (0.0%) |
| Education Instruction & Library | 23 (74.2%) | 8 (25.8%) |
| Arts, Media & Entertainment | 0 (0.0%) | 0 (0.0%) |
| Health Diagnosing & Treating | 0 (0.0%) | 17 (100.0%) |
| Health Technologists | 0 (0.0%) | 17 (100.0%) |
| Total (Category) | 42 (51.8%) | 39 (48.1%) |
| Total (Overall) | 125 (41.9%) | 173 (58.1%) |
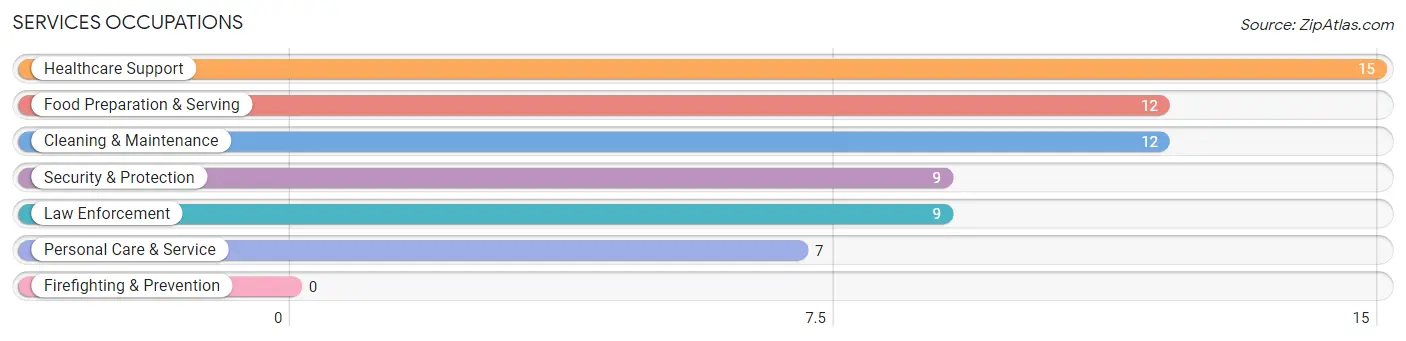
Services Occupations
The most common Services occupations in Paris are Healthcare Support (15 | 5.0%), Food Preparation & Serving (12 | 4.0%), Cleaning & Maintenance (12 | 4.0%), Security & Protection (9 | 3.0%), and Law Enforcement (9 | 3.0%).
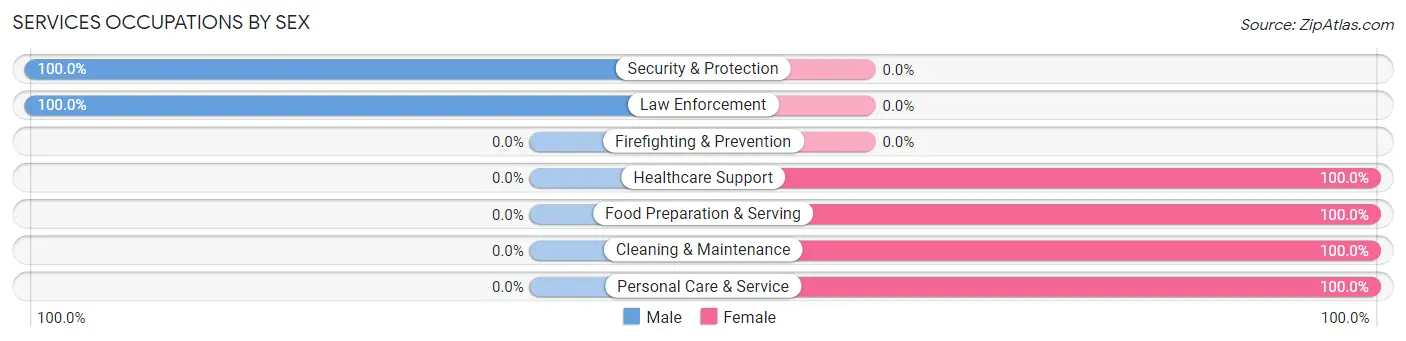
Services Occupations by Sex
Within the Services occupations in Paris, the most male-oriented occupations are Security & Protection (100.0%), and Law Enforcement (100.0%), while the most female-oriented occupations are Healthcare Support (100.0%), Food Preparation & Serving (100.0%), and Cleaning & Maintenance (100.0%).
| Occupation | Male | Female |
| Healthcare Support | 0 (0.0%) | 15 (100.0%) |
| Security & Protection | 9 (100.0%) | 0 (0.0%) |
| Firefighting & Prevention | 0 (0.0%) | 0 (0.0%) |
| Law Enforcement | 9 (100.0%) | 0 (0.0%) |
| Food Preparation & Serving | 0 (0.0%) | 12 (100.0%) |
| Cleaning & Maintenance | 0 (0.0%) | 12 (100.0%) |
| Personal Care & Service | 0 (0.0%) | 7 (100.0%) |
| Total (Category) | 9 (16.4%) | 46 (83.6%) |
| Total (Overall) | 125 (41.9%) | 173 (58.1%) |
Sales and Office Occupations
The most common Sales and Office occupations in Paris are Office & Administration (61 | 20.5%), and Sales & Related (40 | 13.4%).

Sales and Office Occupations by Sex

| Occupation | Male | Female |
| Sales & Related | 4 (10.0%) | 36 (90.0%) |
| Office & Administration | 15 (24.6%) | 46 (75.4%) |
| Total (Category) | 19 (18.8%) | 82 (81.2%) |
| Total (Overall) | 125 (41.9%) | 173 (58.1%) |
Natural Resources, Construction and Maintenance Occupations
The most common Natural Resources, Construction and Maintenance occupations in Paris are , and Installation, Maintenance & Repair (12 | 4.0%).

Natural Resources, Construction and Maintenance Occupations by Sex

| Occupation | Male | Female |
| Farming, Fishing & Forestry | 0 (0.0%) | 0 (0.0%) |
| Construction & Extraction | 0 (0.0%) | 0 (0.0%) |
| Installation, Maintenance & Repair | 12 (100.0%) | 0 (0.0%) |
| Total (Category) | 12 (100.0%) | 0 (0.0%) |
| Total (Overall) | 125 (41.9%) | 173 (58.1%) |
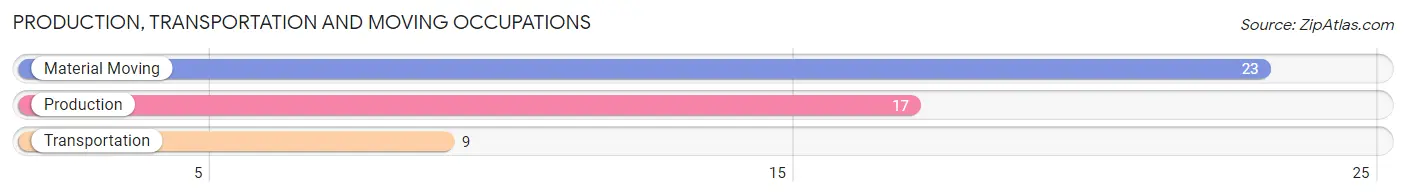
Production, Transportation and Moving Occupations
The most common Production, Transportation and Moving occupations in Paris are Material Moving (23 | 7.7%), Production (17 | 5.7%), and Transportation (9 | 3.0%).
Production, Transportation and Moving Occupations by Sex
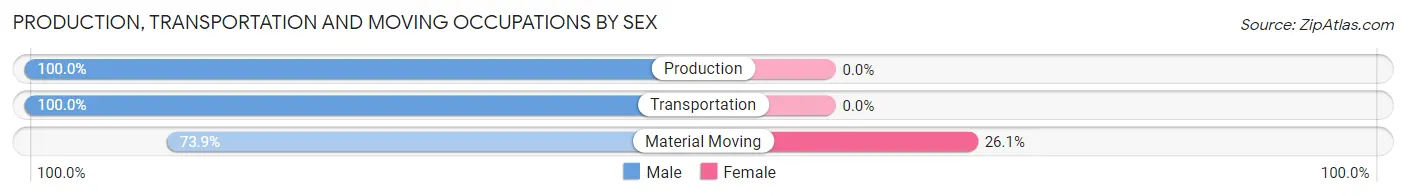
| Occupation | Male | Female |
| Production | 17 (100.0%) | 0 (0.0%) |
| Transportation | 9 (100.0%) | 0 (0.0%) |
| Material Moving | 17 (73.9%) | 6 (26.1%) |
| Total (Category) | 43 (87.8%) | 6 (12.2%) |
| Total (Overall) | 125 (41.9%) | 173 (58.1%) |
Employment Industries by Sex in Paris
Employment Industries in Paris
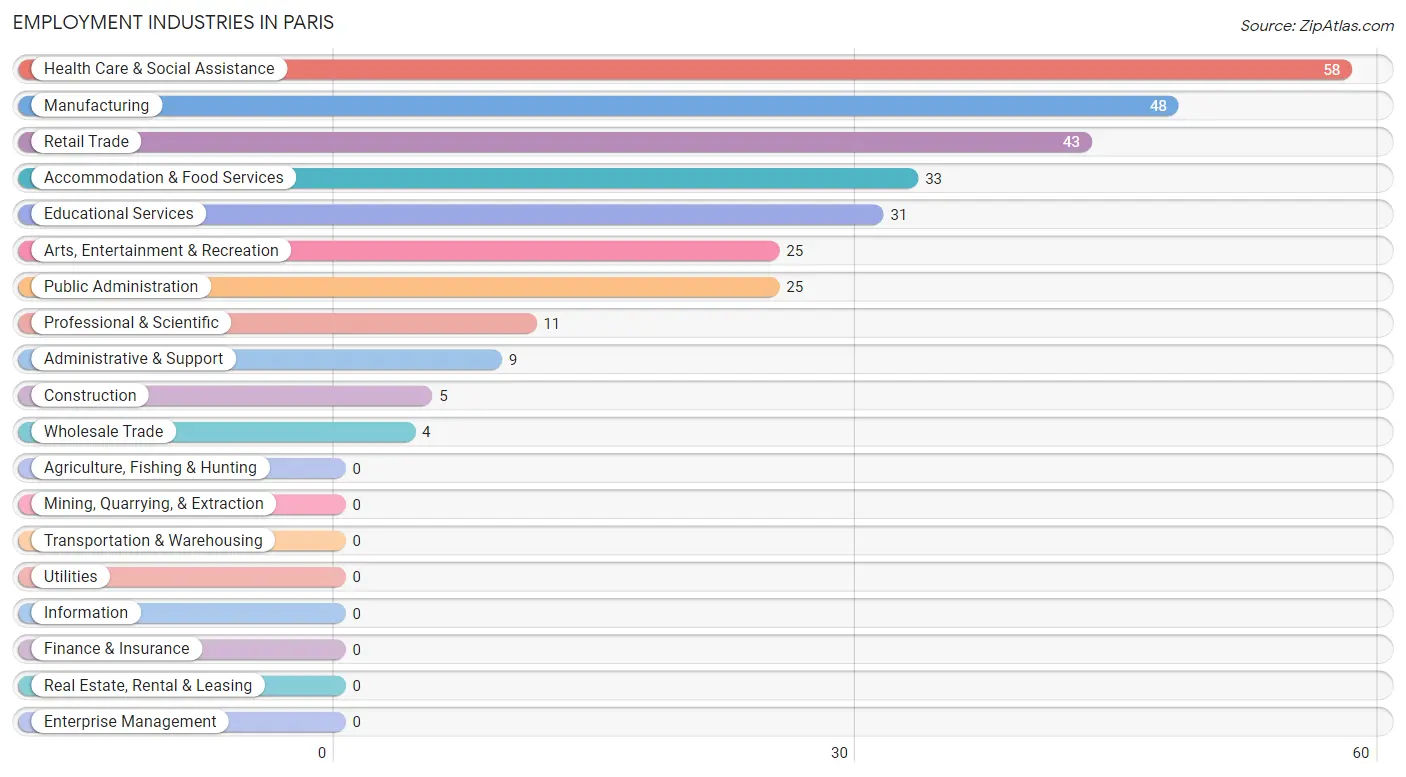
The major employment industries in Paris include Health Care & Social Assistance (58 | 19.5%), Manufacturing (48 | 16.1%), Retail Trade (43 | 14.4%), Accommodation & Food Services (33 | 11.1%), and Educational Services (31 | 10.4%).
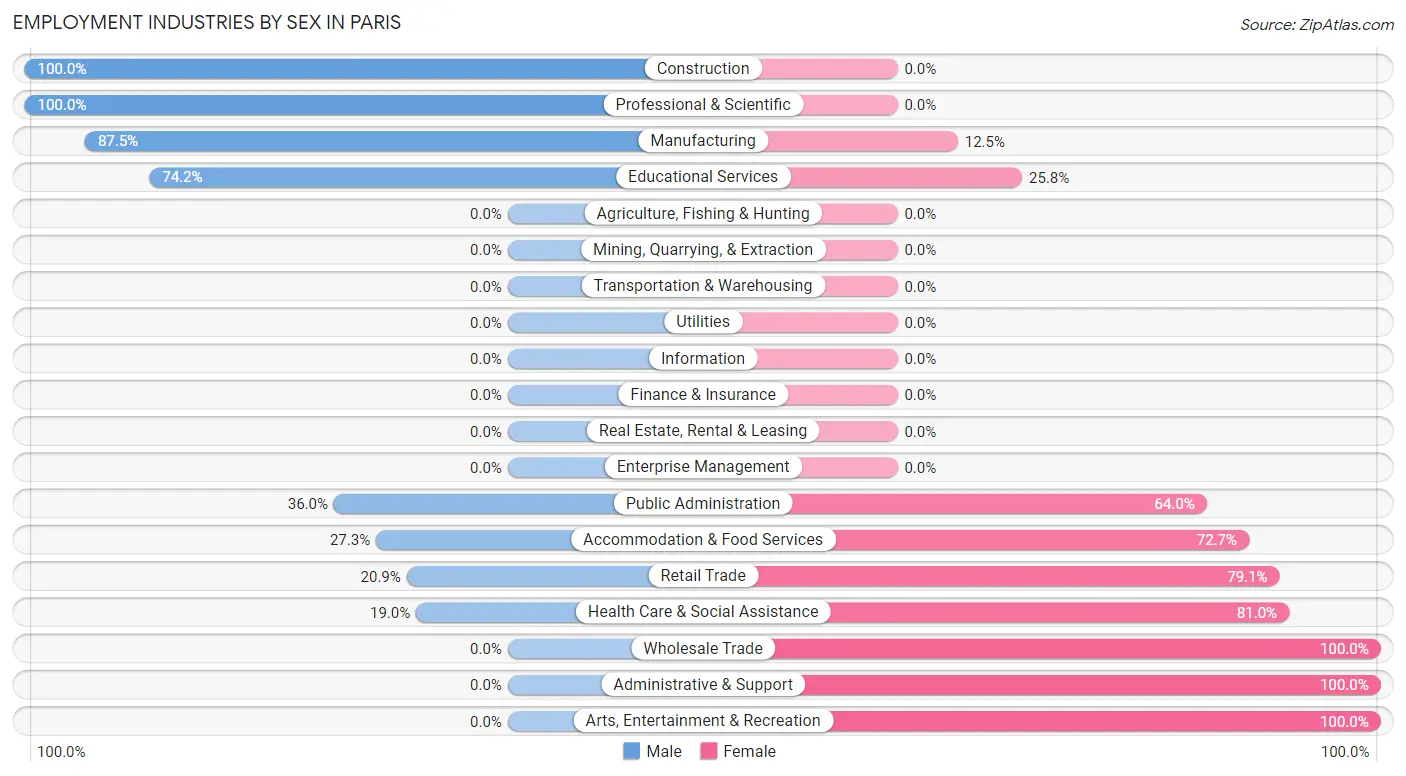
Employment Industries by Sex in Paris
The Paris industries that see more men than women are Construction (100.0%), Professional & Scientific (100.0%), and Manufacturing (87.5%), whereas the industries that tend to have a higher number of women are Wholesale Trade (100.0%), Administrative & Support (100.0%), and Arts, Entertainment & Recreation (100.0%).
| Industry | Male | Female |
| Agriculture, Fishing & Hunting | 0 (0.0%) | 0 (0.0%) |
| Mining, Quarrying, & Extraction | 0 (0.0%) | 0 (0.0%) |
| Construction | 5 (100.0%) | 0 (0.0%) |
| Manufacturing | 42 (87.5%) | 6 (12.5%) |
| Wholesale Trade | 0 (0.0%) | 4 (100.0%) |
| Retail Trade | 9 (20.9%) | 34 (79.1%) |
| Transportation & Warehousing | 0 (0.0%) | 0 (0.0%) |
| Utilities | 0 (0.0%) | 0 (0.0%) |
| Information | 0 (0.0%) | 0 (0.0%) |
| Finance & Insurance | 0 (0.0%) | 0 (0.0%) |
| Real Estate, Rental & Leasing | 0 (0.0%) | 0 (0.0%) |
| Professional & Scientific | 11 (100.0%) | 0 (0.0%) |
| Enterprise Management | 0 (0.0%) | 0 (0.0%) |
| Administrative & Support | 0 (0.0%) | 9 (100.0%) |
| Educational Services | 23 (74.2%) | 8 (25.8%) |
| Health Care & Social Assistance | 11 (19.0%) | 47 (81.0%) |
| Arts, Entertainment & Recreation | 0 (0.0%) | 25 (100.0%) |
| Accommodation & Food Services | 9 (27.3%) | 24 (72.7%) |
| Public Administration | 9 (36.0%) | 16 (64.0%) |
| Total | 125 (41.9%) | 173 (58.1%) |
Education in Paris
School Enrollment in Paris
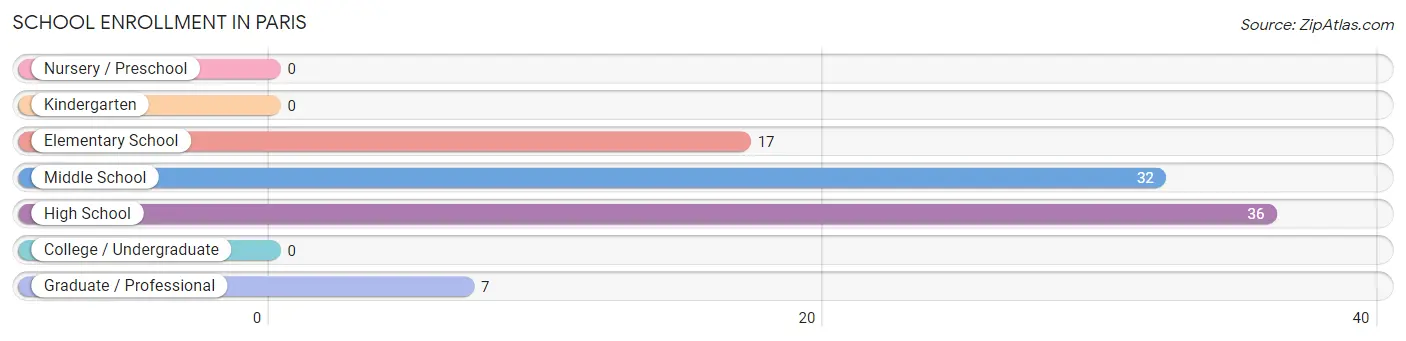
The most common levels of schooling among the 92 students in Paris are high school (36 | 39.1%), middle school (32 | 34.8%), and elementary school (17 | 18.5%).
| School Level | # Students | % Students |
| Nursery / Preschool | 0 | 0.0% |
| Kindergarten | 0 | 0.0% |
| Elementary School | 17 | 18.5% |
| Middle School | 32 | 34.8% |
| High School | 36 | 39.1% |
| College / Undergraduate | 0 | 0.0% |
| Graduate / Professional | 7 | 7.6% |
| Total | 92 | 100.0% |
School Enrollment by Age by Funding Source in Paris
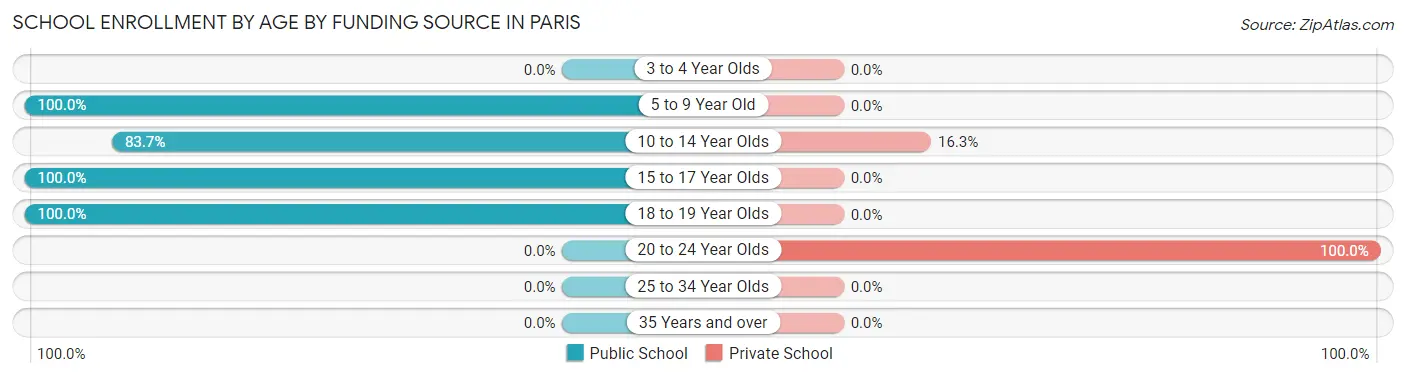
Out of a total of 92 students who are enrolled in schools in Paris, 14 (15.2%) attend a private institution, while the remaining 78 (84.8%) are enrolled in public schools. The age group of 20 to 24 year olds has the highest likelihood of being enrolled in private schools, with 7 (100.0% in the age bracket) enrolled. Conversely, the age group of 5 to 9 year old has the lowest likelihood of being enrolled in a private school, with 6 (100.0% in the age bracket) attending a public institution.
| Age Bracket | Public School | Private School |
| 3 to 4 Year Olds | 0 (0.0%) | 0 (0.0%) |
| 5 to 9 Year Old | 6 (100.0%) | 0 (0.0%) |
| 10 to 14 Year Olds | 36 (83.7%) | 7 (16.3%) |
| 15 to 17 Year Olds | 15 (100.0%) | 0 (0.0%) |
| 18 to 19 Year Olds | 21 (100.0%) | 0 (0.0%) |
| 20 to 24 Year Olds | 0 (0.0%) | 7 (100.0%) |
| 25 to 34 Year Olds | 0 (0.0%) | 0 (0.0%) |
| 35 Years and over | 0 (0.0%) | 0 (0.0%) |
| Total | 78 (84.8%) | 14 (15.2%) |
Educational Attainment by Field of Study in Paris
Social sciences (11 | 19.3%), education (10 | 17.5%), communications (8 | 14.0%), physical & health sciences (6 | 10.5%), and psychology (6 | 10.5%) are the most common fields of study among 57 individuals in Paris who have obtained a bachelor's degree or higher.
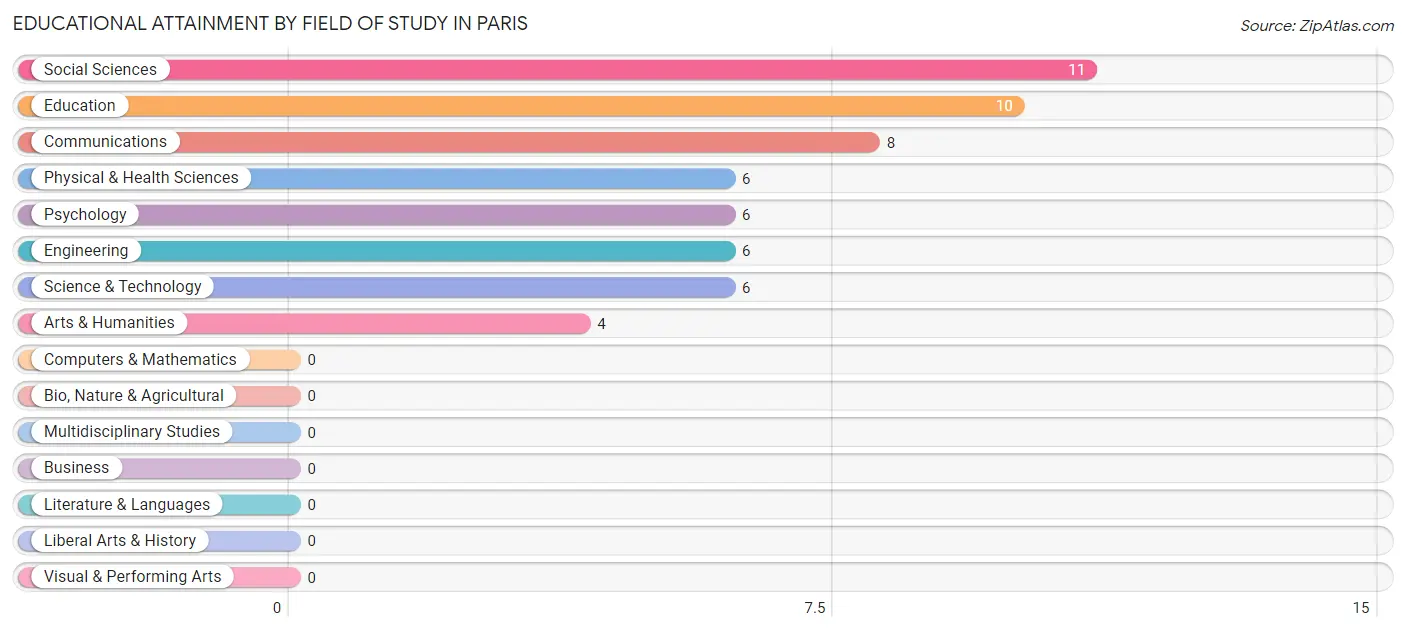
| Field of Study | # Graduates | % Graduates |
| Computers & Mathematics | 0 | 0.0% |
| Bio, Nature & Agricultural | 0 | 0.0% |
| Physical & Health Sciences | 6 | 10.5% |
| Psychology | 6 | 10.5% |
| Social Sciences | 11 | 19.3% |
| Engineering | 6 | 10.5% |
| Multidisciplinary Studies | 0 | 0.0% |
| Science & Technology | 6 | 10.5% |
| Business | 0 | 0.0% |
| Education | 10 | 17.5% |
| Literature & Languages | 0 | 0.0% |
| Liberal Arts & History | 0 | 0.0% |
| Visual & Performing Arts | 0 | 0.0% |
| Communications | 8 | 14.0% |
| Arts & Humanities | 4 | 7.0% |
| Total | 57 | 100.0% |
Transportation & Commute in Paris
Vehicle Availability by Sex in Paris
The most prevalent vehicle ownership categories in Paris are males with 2 vehicles (63, accounting for 50.4%) and females with 2 vehicles (86, making up 37.3%).
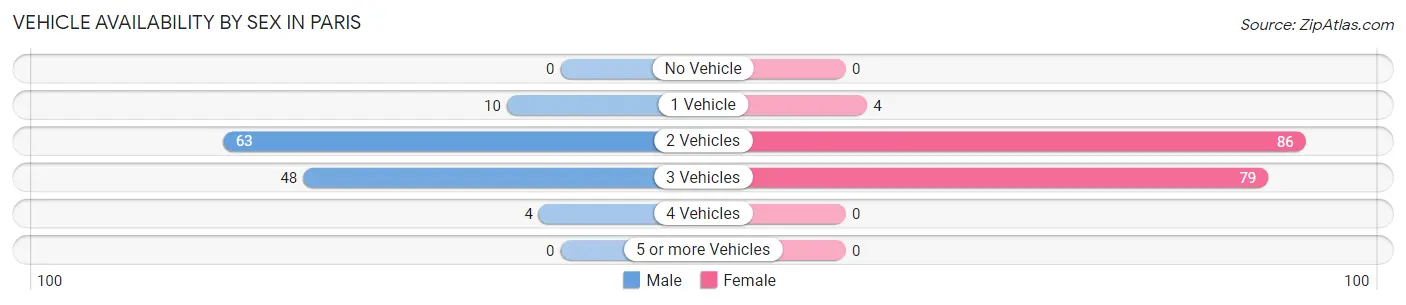
| Vehicles Available | Male | Female |
| No Vehicle | 0 (0.0%) | 0 (0.0%) |
| 1 Vehicle | 10 (8.0%) | 4 (2.4%) |
| 2 Vehicles | 63 (50.4%) | 86 (50.9%) |
| 3 Vehicles | 48 (38.4%) | 79 (46.8%) |
| 4 Vehicles | 4 (3.2%) | 0 (0.0%) |
| 5 or more Vehicles | 0 (0.0%) | 0 (0.0%) |
| Total | 125 (100.0%) | 169 (100.0%) |
Commute Time in Paris
The most frequently occuring commute durations in Paris are 15 to 19 minutes (67 commuters, 23.9%), 10 to 14 minutes (44 commuters, 15.7%), and 5 to 9 minutes (39 commuters, 13.9%).
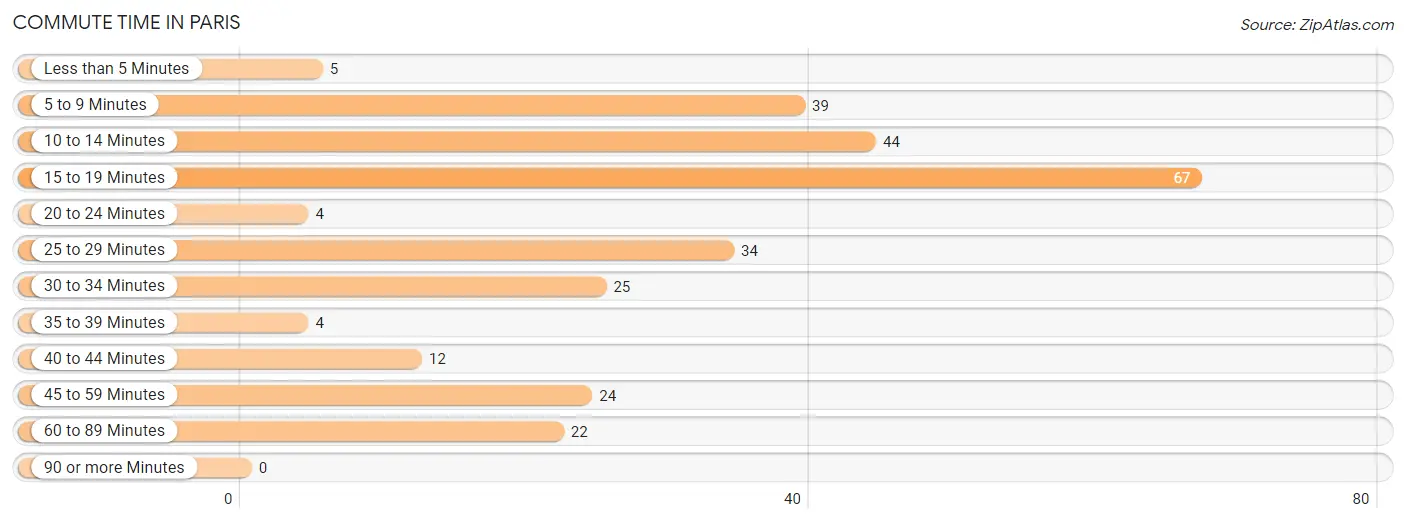
| Commute Time | # Commuters | % Commuters |
| Less than 5 Minutes | 5 | 1.8% |
| 5 to 9 Minutes | 39 | 13.9% |
| 10 to 14 Minutes | 44 | 15.7% |
| 15 to 19 Minutes | 67 | 23.9% |
| 20 to 24 Minutes | 4 | 1.4% |
| 25 to 29 Minutes | 34 | 12.1% |
| 30 to 34 Minutes | 25 | 8.9% |
| 35 to 39 Minutes | 4 | 1.4% |
| 40 to 44 Minutes | 12 | 4.3% |
| 45 to 59 Minutes | 24 | 8.6% |
| 60 to 89 Minutes | 22 | 7.9% |
| 90 or more Minutes | 0 | 0.0% |
Commute Time by Sex in Paris
The most common commute times in Paris are 15 to 19 minutes (23 commuters, 19.5%) for males and 15 to 19 minutes (44 commuters, 27.2%) for females.
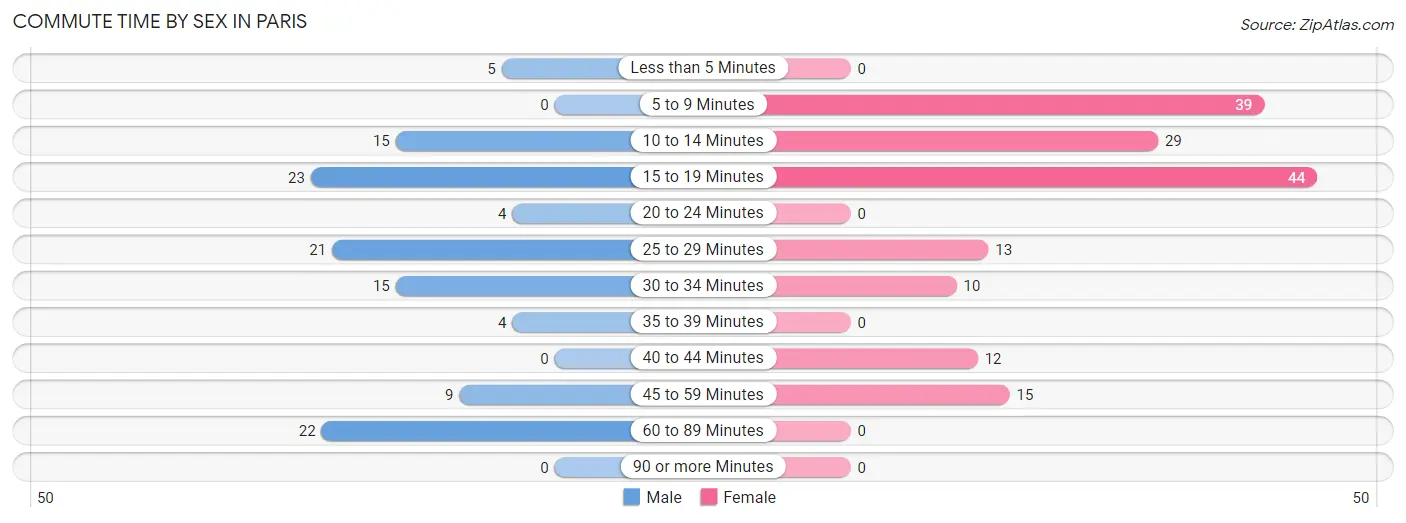
| Commute Time | Male | Female |
| Less than 5 Minutes | 5 (4.2%) | 0 (0.0%) |
| 5 to 9 Minutes | 0 (0.0%) | 39 (24.1%) |
| 10 to 14 Minutes | 15 (12.7%) | 29 (17.9%) |
| 15 to 19 Minutes | 23 (19.5%) | 44 (27.2%) |
| 20 to 24 Minutes | 4 (3.4%) | 0 (0.0%) |
| 25 to 29 Minutes | 21 (17.8%) | 13 (8.0%) |
| 30 to 34 Minutes | 15 (12.7%) | 10 (6.2%) |
| 35 to 39 Minutes | 4 (3.4%) | 0 (0.0%) |
| 40 to 44 Minutes | 0 (0.0%) | 12 (7.4%) |
| 45 to 59 Minutes | 9 (7.6%) | 15 (9.3%) |
| 60 to 89 Minutes | 22 (18.6%) | 0 (0.0%) |
| 90 or more Minutes | 0 (0.0%) | 0 (0.0%) |
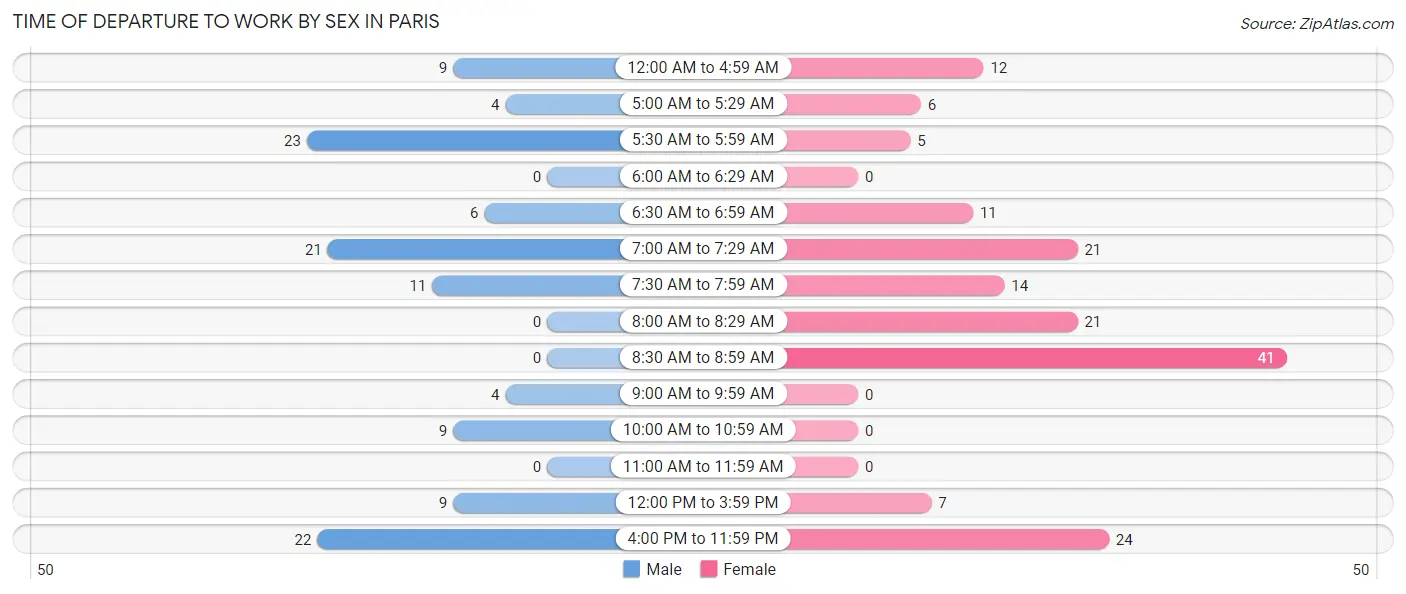
Time of Departure to Work by Sex in Paris
The most frequent times of departure to work in Paris are 5:30 AM to 5:59 AM (23, 19.5%) for males and 8:30 AM to 8:59 AM (41, 25.3%) for females.
| Time of Departure | Male | Female |
| 12:00 AM to 4:59 AM | 9 (7.6%) | 12 (7.4%) |
| 5:00 AM to 5:29 AM | 4 (3.4%) | 6 (3.7%) |
| 5:30 AM to 5:59 AM | 23 (19.5%) | 5 (3.1%) |
| 6:00 AM to 6:29 AM | 0 (0.0%) | 0 (0.0%) |
| 6:30 AM to 6:59 AM | 6 (5.1%) | 11 (6.8%) |
| 7:00 AM to 7:29 AM | 21 (17.8%) | 21 (13.0%) |
| 7:30 AM to 7:59 AM | 11 (9.3%) | 14 (8.6%) |
| 8:00 AM to 8:29 AM | 0 (0.0%) | 21 (13.0%) |
| 8:30 AM to 8:59 AM | 0 (0.0%) | 41 (25.3%) |
| 9:00 AM to 9:59 AM | 4 (3.4%) | 0 (0.0%) |
| 10:00 AM to 10:59 AM | 9 (7.6%) | 0 (0.0%) |
| 11:00 AM to 11:59 AM | 0 (0.0%) | 0 (0.0%) |
| 12:00 PM to 3:59 PM | 9 (7.6%) | 7 (4.3%) |
| 4:00 PM to 11:59 PM | 22 (18.6%) | 24 (14.8%) |
| Total | 118 (100.0%) | 162 (100.0%) |
Housing Occupancy in Paris
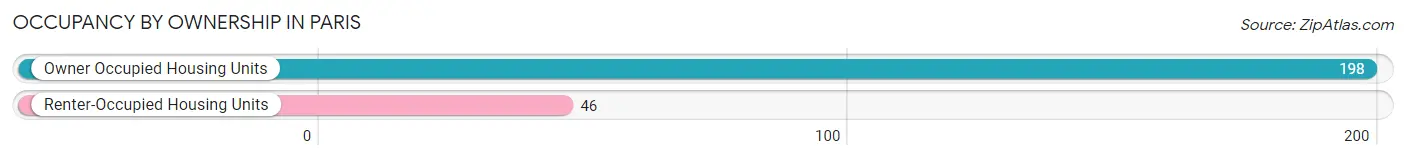
Occupancy by Ownership in Paris
Of the total 244 dwellings in Paris, owner-occupied units account for 198 (81.1%), while renter-occupied units make up 46 (18.9%).
| Occupancy | # Housing Units | % Housing Units |
| Owner Occupied Housing Units | 198 | 81.1% |
| Renter-Occupied Housing Units | 46 | 18.9% |
| Total Occupied Housing Units | 244 | 100.0% |
Occupancy by Household Size in Paris
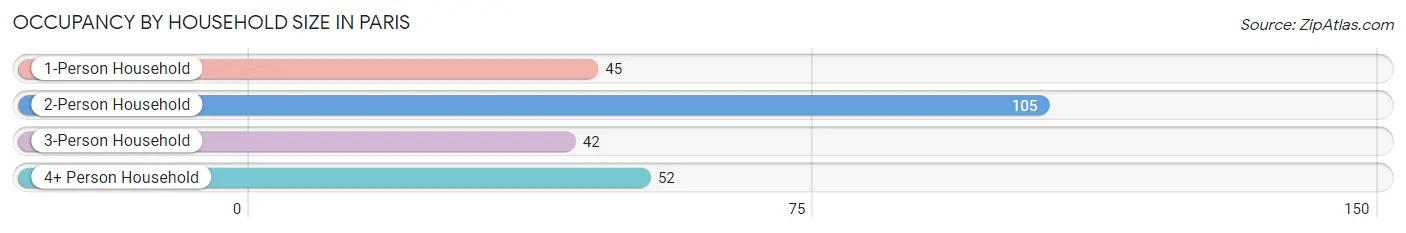
| Household Size | # Housing Units | % Housing Units |
| 1-Person Household | 45 | 18.4% |
| 2-Person Household | 105 | 43.0% |
| 3-Person Household | 42 | 17.2% |
| 4+ Person Household | 52 | 21.3% |
| Total Housing Units | 244 | 100.0% |
Occupancy by Ownership by Household Size in Paris
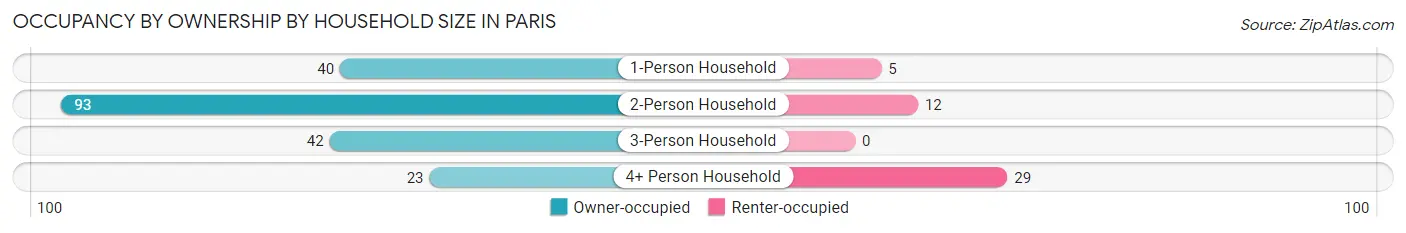
| Household Size | Owner-occupied | Renter-occupied |
| 1-Person Household | 40 (88.9%) | 5 (11.1%) |
| 2-Person Household | 93 (88.6%) | 12 (11.4%) |
| 3-Person Household | 42 (100.0%) | 0 (0.0%) |
| 4+ Person Household | 23 (44.2%) | 29 (55.8%) |
| Total Housing Units | 198 (81.1%) | 46 (18.9%) |
Occupancy by Educational Attainment in Paris
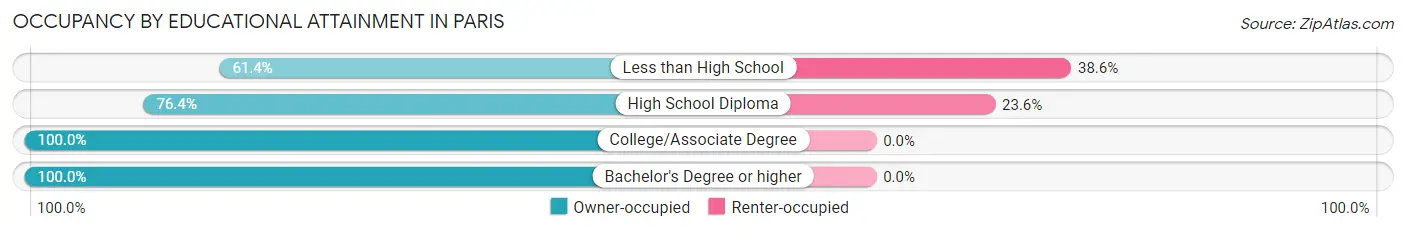
| Household Size | Owner-occupied | Renter-occupied |
| Less than High School | 27 (61.4%) | 17 (38.6%) |
| High School Diploma | 94 (76.4%) | 29 (23.6%) |
| College/Associate Degree | 57 (100.0%) | 0 (0.0%) |
| Bachelor's Degree or higher | 20 (100.0%) | 0 (0.0%) |
Occupancy by Age of Householder in Paris
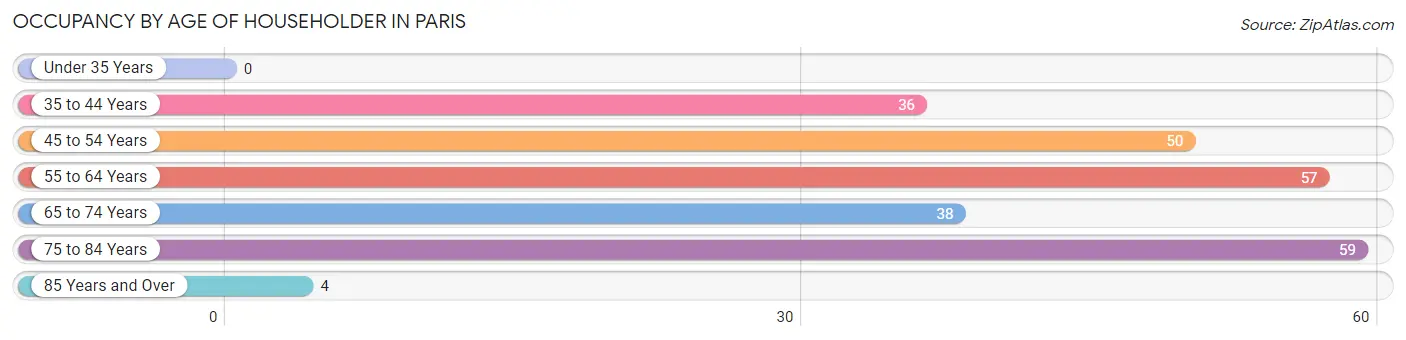
| Age Bracket | # Households | % Households |
| Under 35 Years | 0 | 0.0% |
| 35 to 44 Years | 36 | 14.7% |
| 45 to 54 Years | 50 | 20.5% |
| 55 to 64 Years | 57 | 23.4% |
| 65 to 74 Years | 38 | 15.6% |
| 75 to 84 Years | 59 | 24.2% |
| 85 Years and Over | 4 | 1.6% |
| Total | 244 | 100.0% |
Housing Finances in Paris
Median Income by Occupancy in Paris
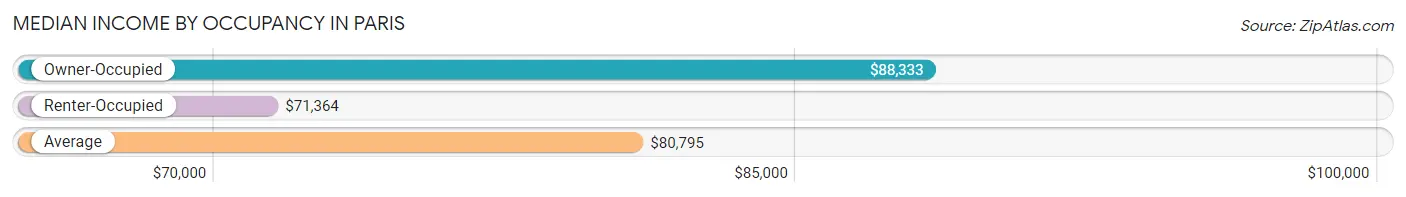
| Occupancy Type | # Households | Median Income |
| Owner-Occupied | 198 (81.1%) | $88,333 |
| Renter-Occupied | 46 (18.9%) | $71,364 |
| Average | 244 (100.0%) | $80,795 |
Occupancy by Householder Income Bracket in Paris
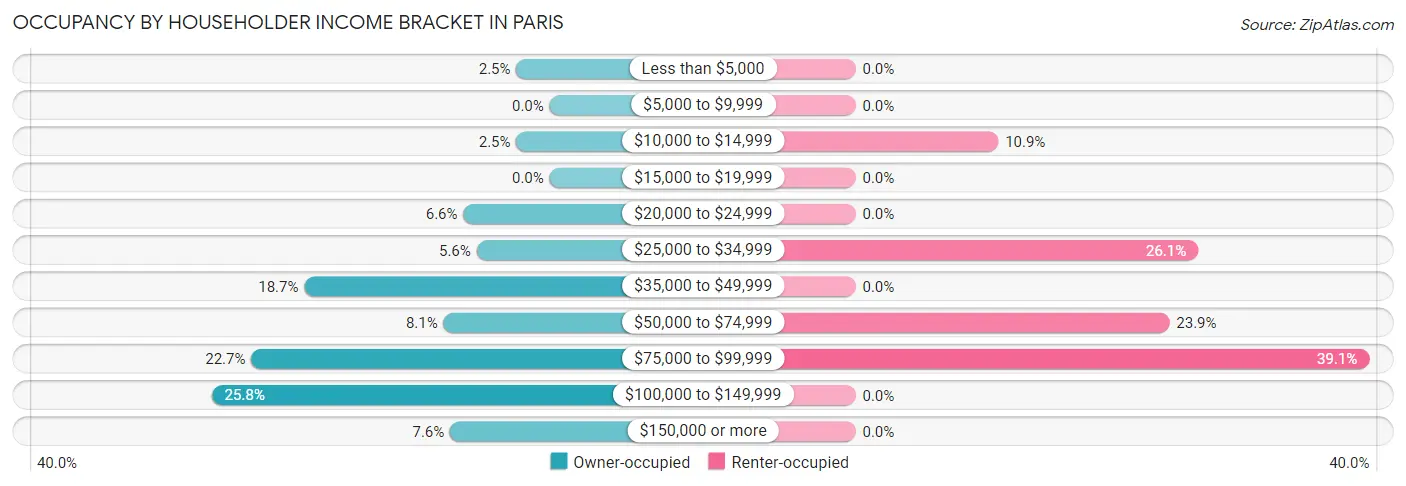
| Income Bracket | Owner-occupied | Renter-occupied |
| Less than $5,000 | 5 (2.5%) | 0 (0.0%) |
| $5,000 to $9,999 | 0 (0.0%) | 0 (0.0%) |
| $10,000 to $14,999 | 5 (2.5%) | 5 (10.9%) |
| $15,000 to $19,999 | 0 (0.0%) | 0 (0.0%) |
| $20,000 to $24,999 | 13 (6.6%) | 0 (0.0%) |
| $25,000 to $34,999 | 11 (5.6%) | 12 (26.1%) |
| $35,000 to $49,999 | 37 (18.7%) | 0 (0.0%) |
| $50,000 to $74,999 | 16 (8.1%) | 11 (23.9%) |
| $75,000 to $99,999 | 45 (22.7%) | 18 (39.1%) |
| $100,000 to $149,999 | 51 (25.8%) | 0 (0.0%) |
| $150,000 or more | 15 (7.6%) | 0 (0.0%) |
| Total | 198 (100.0%) | 46 (100.0%) |
Monthly Housing Cost Tiers in Paris
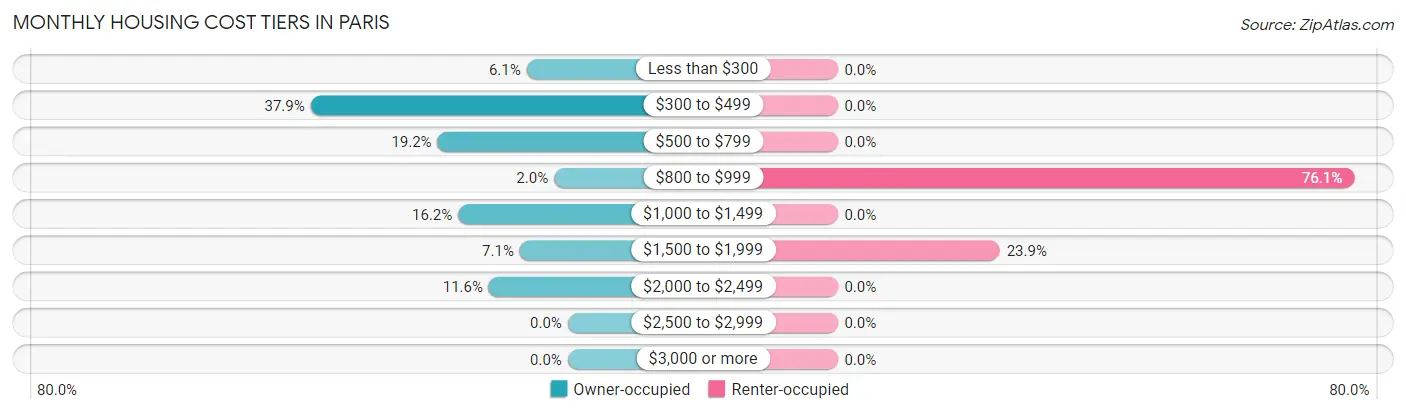
| Monthly Cost | Owner-occupied | Renter-occupied |
| Less than $300 | 12 (6.1%) | 0 (0.0%) |
| $300 to $499 | 75 (37.9%) | 0 (0.0%) |
| $500 to $799 | 38 (19.2%) | 0 (0.0%) |
| $800 to $999 | 4 (2.0%) | 35 (76.1%) |
| $1,000 to $1,499 | 32 (16.2%) | 0 (0.0%) |
| $1,500 to $1,999 | 14 (7.1%) | 11 (23.9%) |
| $2,000 to $2,499 | 23 (11.6%) | 0 (0.0%) |
| $2,500 to $2,999 | 0 (0.0%) | 0 (0.0%) |
| $3,000 or more | 0 (0.0%) | 0 (0.0%) |
| Total | 198 (100.0%) | 46 (100.0%) |
Physical Housing Characteristics in Paris
Housing Structures in Paris
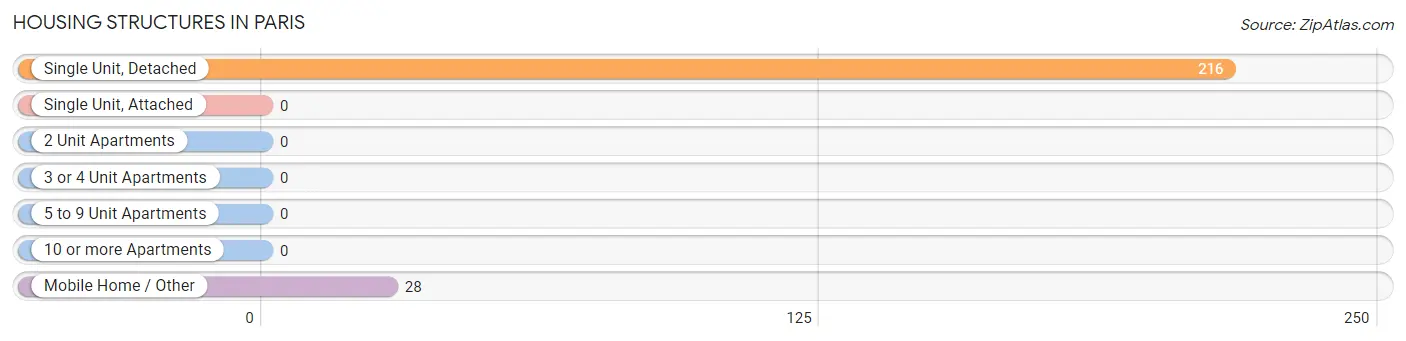
| Structure Type | # Housing Units | % Housing Units |
| Single Unit, Detached | 216 | 88.5% |
| Single Unit, Attached | 0 | 0.0% |
| 2 Unit Apartments | 0 | 0.0% |
| 3 or 4 Unit Apartments | 0 | 0.0% |
| 5 to 9 Unit Apartments | 0 | 0.0% |
| 10 or more Apartments | 0 | 0.0% |
| Mobile Home / Other | 28 | 11.5% |
| Total | 244 | 100.0% |
Housing Structures by Occupancy in Paris
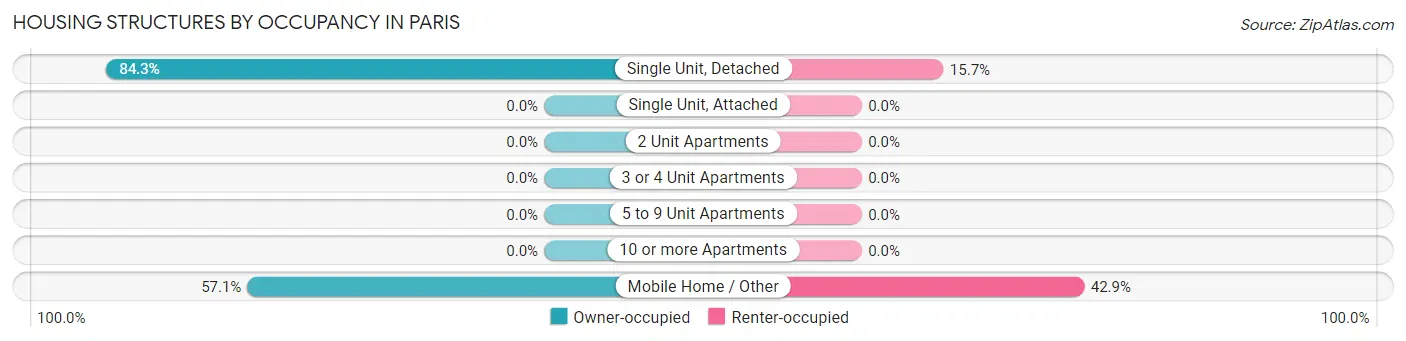
| Structure Type | Owner-occupied | Renter-occupied |
| Single Unit, Detached | 182 (84.3%) | 34 (15.7%) |
| Single Unit, Attached | 0 (0.0%) | 0 (0.0%) |
| 2 Unit Apartments | 0 (0.0%) | 0 (0.0%) |
| 3 or 4 Unit Apartments | 0 (0.0%) | 0 (0.0%) |
| 5 to 9 Unit Apartments | 0 (0.0%) | 0 (0.0%) |
| 10 or more Apartments | 0 (0.0%) | 0 (0.0%) |
| Mobile Home / Other | 16 (57.1%) | 12 (42.9%) |
| Total | 198 (81.1%) | 46 (18.9%) |
Housing Structures by Number of Rooms in Paris
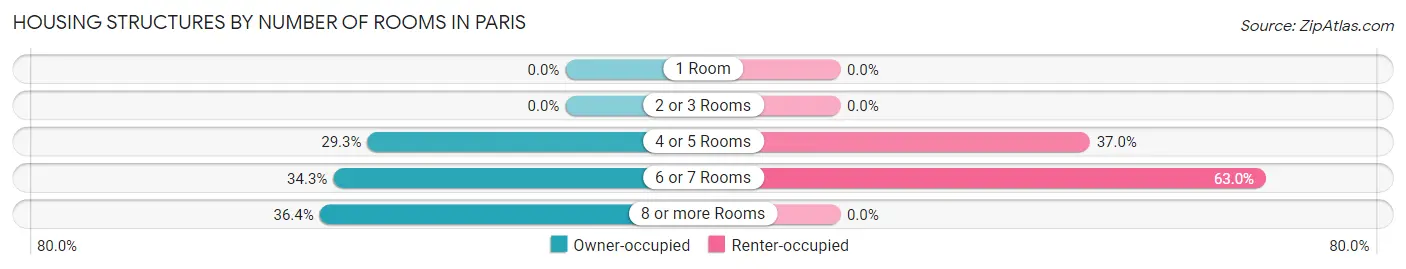
| Number of Rooms | Owner-occupied | Renter-occupied |
| 1 Room | 0 (0.0%) | 0 (0.0%) |
| 2 or 3 Rooms | 0 (0.0%) | 0 (0.0%) |
| 4 or 5 Rooms | 58 (29.3%) | 17 (37.0%) |
| 6 or 7 Rooms | 68 (34.3%) | 29 (63.0%) |
| 8 or more Rooms | 72 (36.4%) | 0 (0.0%) |
| Total | 198 (100.0%) | 46 (100.0%) |
Housing Structure by Heating Type in Paris
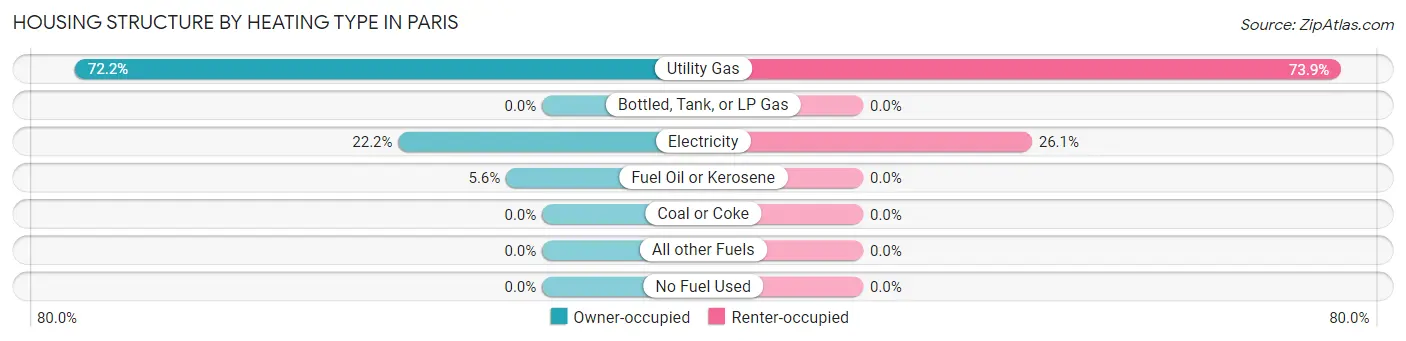
| Heating Type | Owner-occupied | Renter-occupied |
| Utility Gas | 143 (72.2%) | 34 (73.9%) |
| Bottled, Tank, or LP Gas | 0 (0.0%) | 0 (0.0%) |
| Electricity | 44 (22.2%) | 12 (26.1%) |
| Fuel Oil or Kerosene | 11 (5.6%) | 0 (0.0%) |
| Coal or Coke | 0 (0.0%) | 0 (0.0%) |
| All other Fuels | 0 (0.0%) | 0 (0.0%) |
| No Fuel Used | 0 (0.0%) | 0 (0.0%) |
| Total | 198 (100.0%) | 46 (100.0%) |
Household Vehicle Usage in Paris
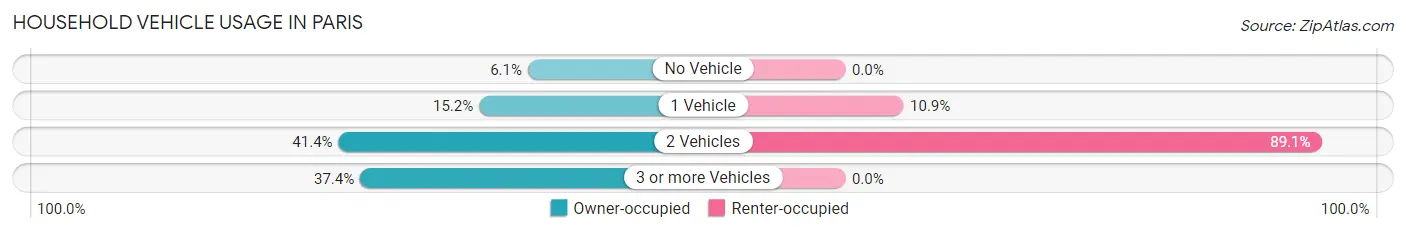
| Vehicles per Household | Owner-occupied | Renter-occupied |
| No Vehicle | 12 (6.1%) | 0 (0.0%) |
| 1 Vehicle | 30 (15.1%) | 5 (10.9%) |
| 2 Vehicles | 82 (41.4%) | 41 (89.1%) |
| 3 or more Vehicles | 74 (37.4%) | 0 (0.0%) |
| Total | 198 (100.0%) | 46 (100.0%) |
Real Estate & Mortgages in Paris
Real Estate and Mortgage Overview in Paris
| Characteristic | Without Mortgage | With Mortgage |
| Housing Units | 123 | 75 |
| Median Property Value | $173,400 | $171,700 |
| Median Household Income | $65,208 | $6 |
| Monthly Housing Costs | $381 | $0 |
| Real Estate Taxes | $1,664 | $0 |
Property Value by Mortgage Status in Paris
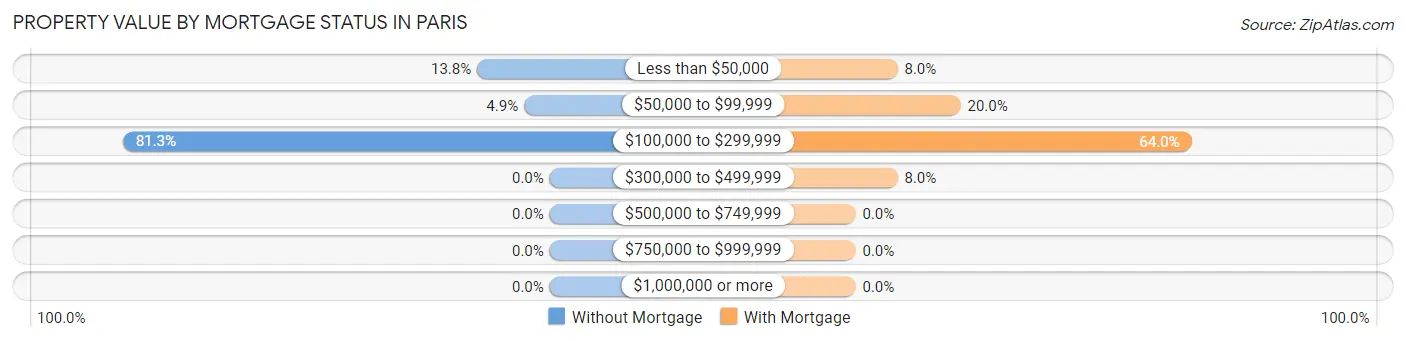
| Property Value | Without Mortgage | With Mortgage |
| Less than $50,000 | 17 (13.8%) | 6 (8.0%) |
| $50,000 to $99,999 | 6 (4.9%) | 15 (20.0%) |
| $100,000 to $299,999 | 100 (81.3%) | 48 (64.0%) |
| $300,000 to $499,999 | 0 (0.0%) | 6 (8.0%) |
| $500,000 to $749,999 | 0 (0.0%) | 0 (0.0%) |
| $750,000 to $999,999 | 0 (0.0%) | 0 (0.0%) |
| $1,000,000 or more | 0 (0.0%) | 0 (0.0%) |
| Total | 123 (100.0%) | 75 (100.0%) |
Household Income by Mortgage Status in Paris
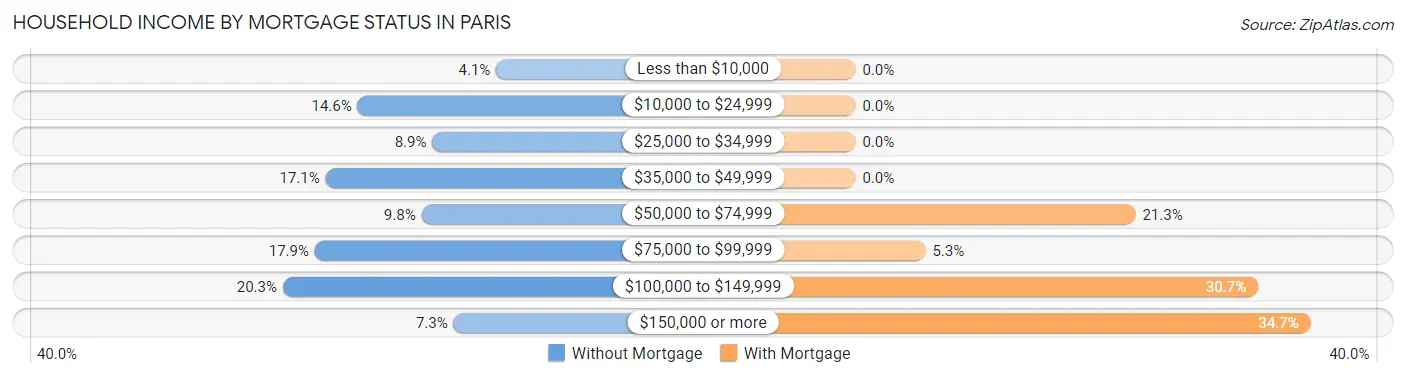
| Household Income | Without Mortgage | With Mortgage |
| Less than $10,000 | 5 (4.1%) | 0 (0.0%) |
| $10,000 to $24,999 | 18 (14.6%) | 0 (0.0%) |
| $25,000 to $34,999 | 11 (8.9%) | 0 (0.0%) |
| $35,000 to $49,999 | 21 (17.1%) | 0 (0.0%) |
| $50,000 to $74,999 | 12 (9.8%) | 16 (21.3%) |
| $75,000 to $99,999 | 22 (17.9%) | 4 (5.3%) |
| $100,000 to $149,999 | 25 (20.3%) | 23 (30.7%) |
| $150,000 or more | 9 (7.3%) | 26 (34.7%) |
| Total | 123 (100.0%) | 75 (100.0%) |
Property Value to Household Income Ratio in Paris
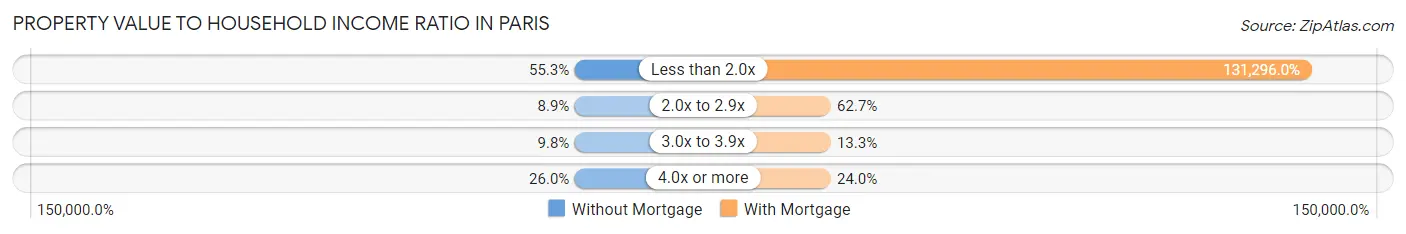
| Value-to-Income Ratio | Without Mortgage | With Mortgage |
| Less than 2.0x | 68 (55.3%) | 98,472 (131,296.0%) |
| 2.0x to 2.9x | 11 (8.9%) | 47 (62.7%) |
| 3.0x to 3.9x | 12 (9.8%) | 10 (13.3%) |
| 4.0x or more | 32 (26.0%) | 18 (24.0%) |
| Total | 123 (100.0%) | 75 (100.0%) |
Real Estate Taxes by Mortgage Status in Paris
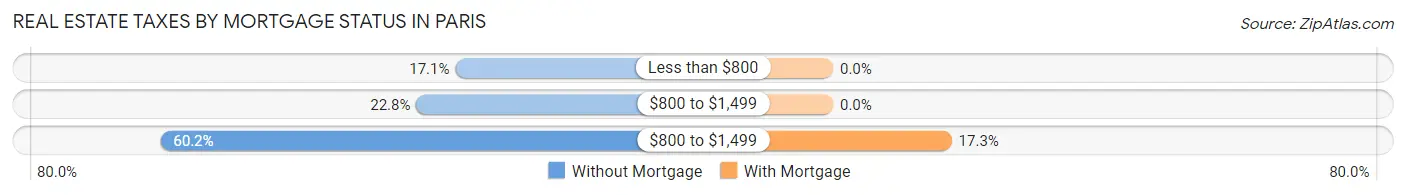
| Property Taxes | Without Mortgage | With Mortgage |
| Less than $800 | 21 (17.1%) | 0 (0.0%) |
| $800 to $1,499 | 28 (22.8%) | 0 (0.0%) |
| $800 to $1,499 | 74 (60.2%) | 13 (17.3%) |
| Total | 123 (100.0%) | 75 (100.0%) |
Health & Disability in Paris
Health Insurance Coverage by Age in Paris
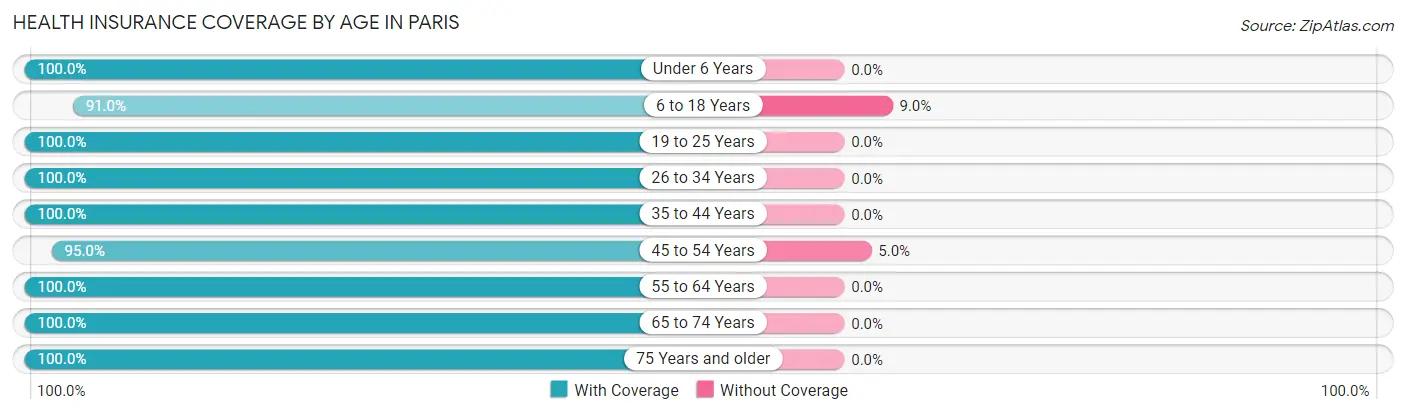
| Age Bracket | With Coverage | Without Coverage |
| Under 6 Years | 12 (100.0%) | 0 (0.0%) |
| 6 to 18 Years | 81 (91.0%) | 8 (9.0%) |
| 19 to 25 Years | 70 (100.0%) | 0 (0.0%) |
| 26 to 34 Years | 20 (100.0%) | 0 (0.0%) |
| 35 to 44 Years | 84 (100.0%) | 0 (0.0%) |
| 45 to 54 Years | 113 (95.0%) | 6 (5.0%) |
| 55 to 64 Years | 100 (100.0%) | 0 (0.0%) |
| 65 to 74 Years | 50 (100.0%) | 0 (0.0%) |
| 75 Years and older | 91 (100.0%) | 0 (0.0%) |
| Total | 621 (97.8%) | 14 (2.2%) |
Health Insurance Coverage by Citizenship Status in Paris

| Citizenship Status | With Coverage | Without Coverage |
| Native Born | 12 (100.0%) | 0 (0.0%) |
| Foreign Born, Citizen | 81 (91.0%) | 8 (9.0%) |
| Foreign Born, not a Citizen | 70 (100.0%) | 0 (0.0%) |
Health Insurance Coverage by Household Income in Paris
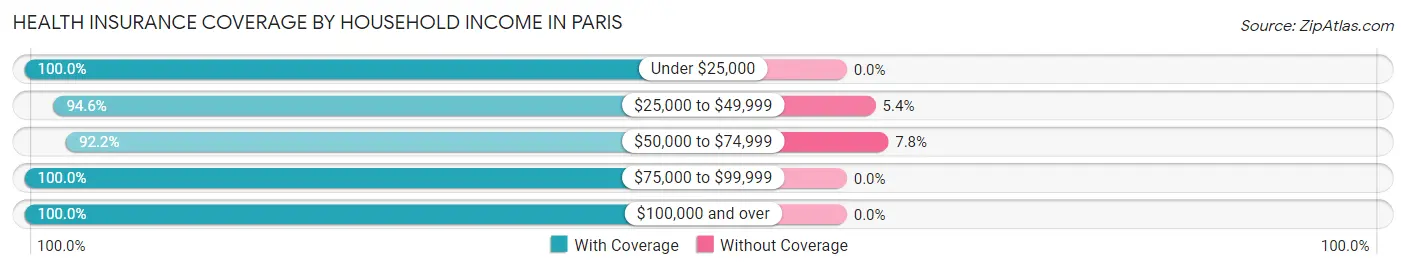
| Household Income | With Coverage | Without Coverage |
| Under $25,000 | 34 (100.0%) | 0 (0.0%) |
| $25,000 to $49,999 | 105 (94.6%) | 6 (5.4%) |
| $50,000 to $74,999 | 95 (92.2%) | 8 (7.8%) |
| $75,000 to $99,999 | 231 (100.0%) | 0 (0.0%) |
| $100,000 and over | 156 (100.0%) | 0 (0.0%) |
Public vs Private Health Insurance Coverage by Age in Paris
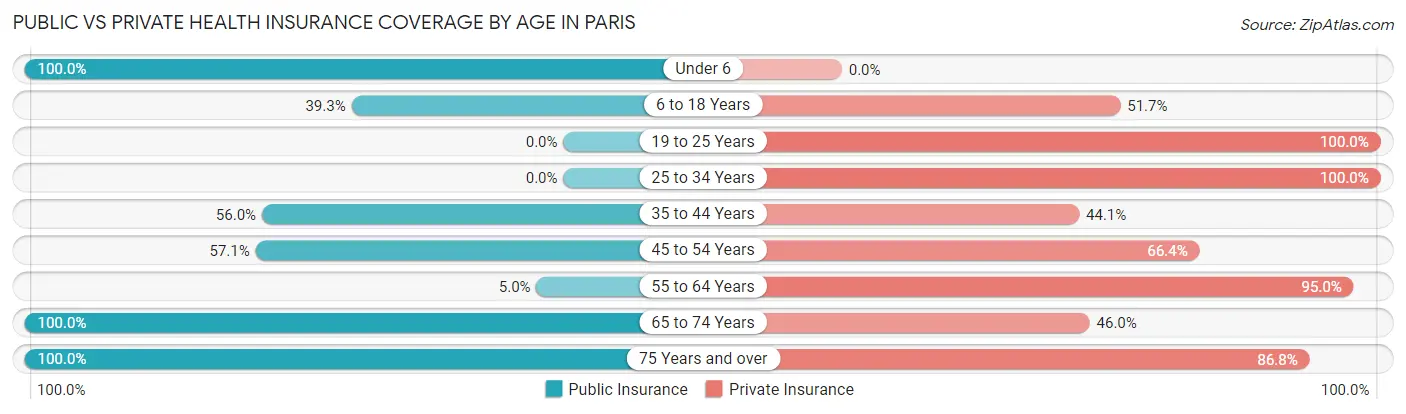
| Age Bracket | Public Insurance | Private Insurance |
| Under 6 | 12 (100.0%) | 0 (0.0%) |
| 6 to 18 Years | 35 (39.3%) | 46 (51.7%) |
| 19 to 25 Years | 0 (0.0%) | 70 (100.0%) |
| 25 to 34 Years | 0 (0.0%) | 20 (100.0%) |
| 35 to 44 Years | 47 (55.9%) | 37 (44.1%) |
| 45 to 54 Years | 68 (57.1%) | 79 (66.4%) |
| 55 to 64 Years | 5 (5.0%) | 95 (95.0%) |
| 65 to 74 Years | 50 (100.0%) | 23 (46.0%) |
| 75 Years and over | 91 (100.0%) | 79 (86.8%) |
| Total | 308 (48.5%) | 449 (70.7%) |
Disability Status by Sex by Age in Paris
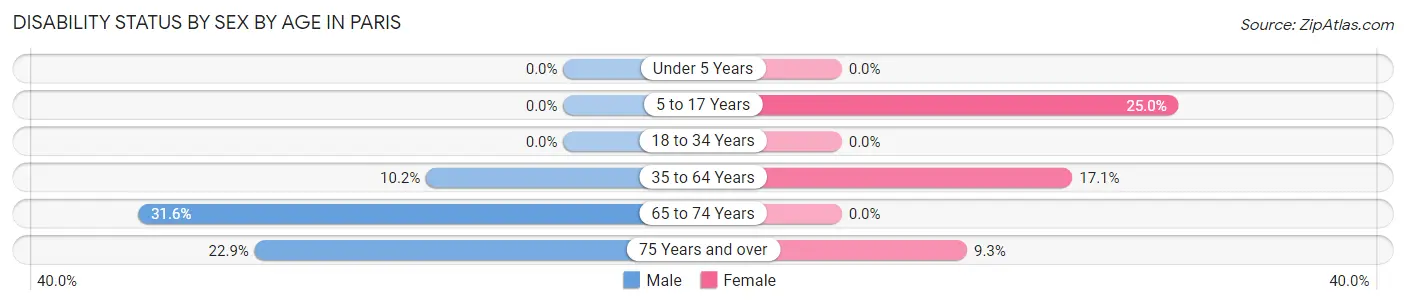
| Age Bracket | Male | Female |
| Under 5 Years | 0 (0.0%) | 0 (0.0%) |
| 5 to 17 Years | 0 (0.0%) | 11 (25.0%) |
| 18 to 34 Years | 0 (0.0%) | 0 (0.0%) |
| 35 to 64 Years | 16 (10.2%) | 25 (17.1%) |
| 65 to 74 Years | 12 (31.6%) | 0 (0.0%) |
| 75 Years and over | 11 (22.9%) | 4 (9.3%) |
Disability Class by Sex by Age in Paris
Disability Class: Hearing Difficulty
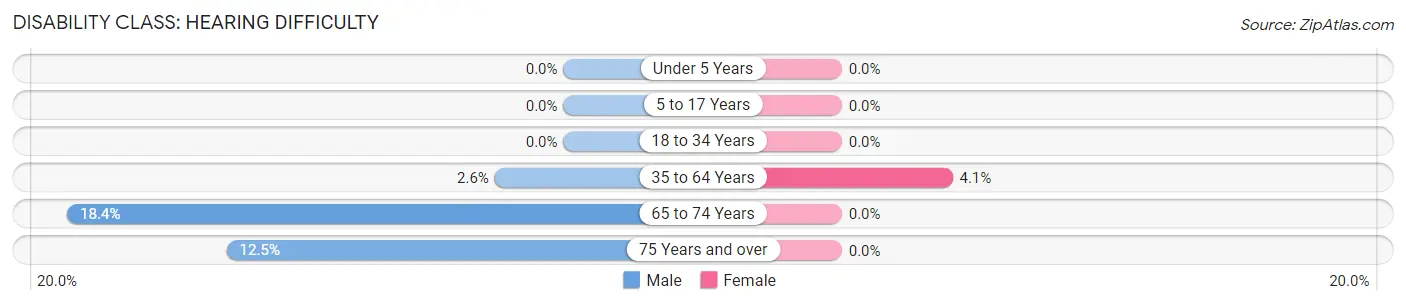
| Age Bracket | Male | Female |
| Under 5 Years | 0 (0.0%) | 0 (0.0%) |
| 5 to 17 Years | 0 (0.0%) | 0 (0.0%) |
| 18 to 34 Years | 0 (0.0%) | 0 (0.0%) |
| 35 to 64 Years | 4 (2.5%) | 6 (4.1%) |
| 65 to 74 Years | 7 (18.4%) | 0 (0.0%) |
| 75 Years and over | 6 (12.5%) | 0 (0.0%) |
Disability Class: Vision Difficulty
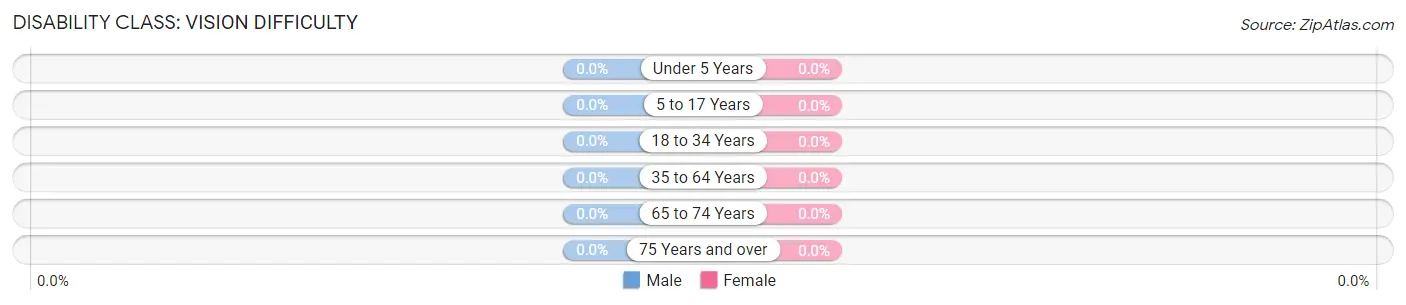
| Age Bracket | Male | Female |
| Under 5 Years | 0 (0.0%) | 0 (0.0%) |
| 5 to 17 Years | 0 (0.0%) | 0 (0.0%) |
| 18 to 34 Years | 0 (0.0%) | 0 (0.0%) |
| 35 to 64 Years | 0 (0.0%) | 0 (0.0%) |
| 65 to 74 Years | 0 (0.0%) | 0 (0.0%) |
| 75 Years and over | 0 (0.0%) | 0 (0.0%) |
Disability Class: Cognitive Difficulty

| Age Bracket | Male | Female |
| 5 to 17 Years | 0 (0.0%) | 0 (0.0%) |
| 18 to 34 Years | 0 (0.0%) | 0 (0.0%) |
| 35 to 64 Years | 6 (3.8%) | 15 (10.3%) |
| 65 to 74 Years | 0 (0.0%) | 0 (0.0%) |
| 75 Years and over | 0 (0.0%) | 0 (0.0%) |
Disability Class: Ambulatory Difficulty
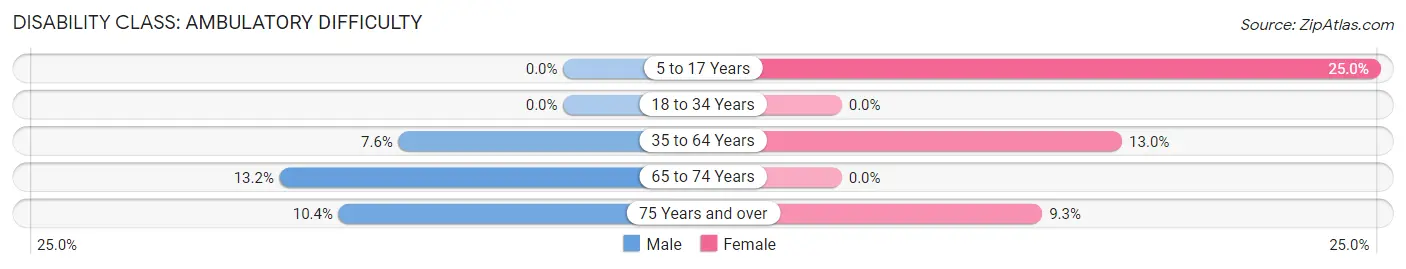
| Age Bracket | Male | Female |
| 5 to 17 Years | 0 (0.0%) | 11 (25.0%) |
| 18 to 34 Years | 0 (0.0%) | 0 (0.0%) |
| 35 to 64 Years | 12 (7.6%) | 19 (13.0%) |
| 65 to 74 Years | 5 (13.2%) | 0 (0.0%) |
| 75 Years and over | 5 (10.4%) | 4 (9.3%) |
Disability Class: Self-Care Difficulty
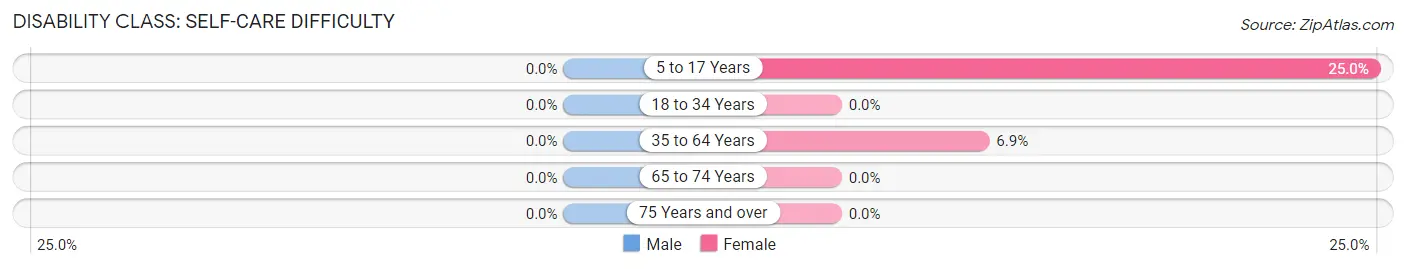
| Age Bracket | Male | Female |
| 5 to 17 Years | 0 (0.0%) | 11 (25.0%) |
| 18 to 34 Years | 0 (0.0%) | 0 (0.0%) |
| 35 to 64 Years | 0 (0.0%) | 10 (6.9%) |
| 65 to 74 Years | 0 (0.0%) | 0 (0.0%) |
| 75 Years and over | 0 (0.0%) | 0 (0.0%) |
Technology Access in Paris
Computing Device Access in Paris
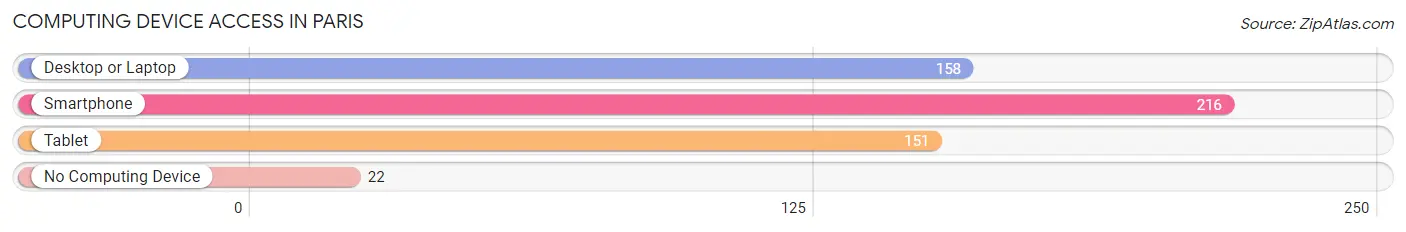
| Device Type | # Households | % Households |
| Desktop or Laptop | 158 | 64.7% |
| Smartphone | 216 | 88.5% |
| Tablet | 151 | 61.9% |
| No Computing Device | 22 | 9.0% |
| Total | 244 | 100.0% |
Internet Access in Paris
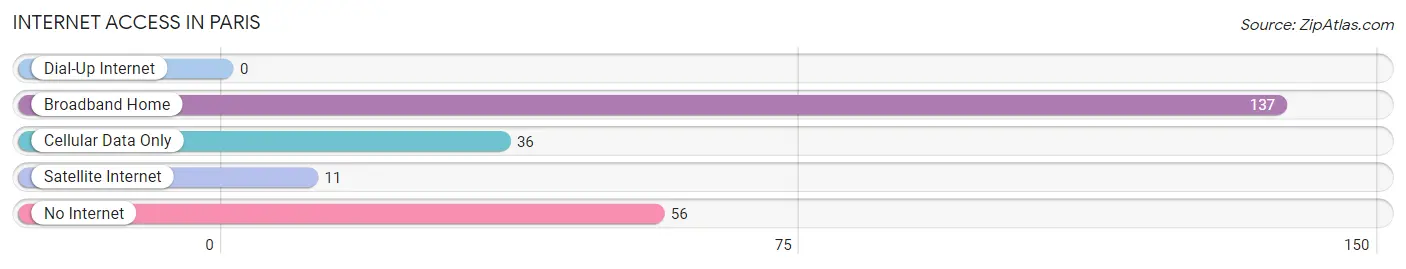
| Internet Type | # Households | % Households |
| Dial-Up Internet | 0 | 0.0% |
| Broadband Home | 137 | 56.1% |
| Cellular Data Only | 36 | 14.7% |
| Satellite Internet | 11 | 4.5% |
| No Internet | 56 | 23.0% |
| Total | 244 | 100.0% |
Paris Summary
Paris is a city located in the state of Pennsylvania, in the United States of America. It is the county seat of Clarion County and is located in the northwestern part of the state. The city is situated in the foothills of the Allegheny Mountains and is part of the Pittsburgh metropolitan area. As of the 2010 census, the population of Paris was 2,521.
History
The area that is now Paris was first settled in the late 1700s by a group of settlers from Scotland. The settlement was originally known as “New Scotland” and was located near the present-day site of the city. In 1816, the settlement was renamed “Paris” after the French city of the same name. The city was officially incorporated in 1837.
In the late 1800s, the city experienced a period of growth and development. The Pennsylvania Railroad was built through the city in 1871, and the city became a major hub for the railroad. The city also became a center for the lumber industry, with several sawmills and lumber yards located in the city.
Geography
Paris is located in the northwestern part of Pennsylvania, in Clarion County. The city is situated in the foothills of the Allegheny Mountains and is part of the Pittsburgh metropolitan area. The city is located at the intersection of U.S. Route 322 and Pennsylvania Route 268.
The city has a total area of 1.3 square miles, all of which is land. The city is located in a hilly area, with the highest point in the city being 890 feet above sea level. The city is located near the Clarion River, which flows through the city.
Economy
The economy of Paris is largely based on the lumber industry. The city is home to several sawmills and lumber yards, which provide employment for many of the city’s residents. The city is also home to several manufacturing companies, including a plastics manufacturer and a metal fabrication company.
The city is also home to several retail stores, restaurants, and other businesses. The city is served by the Clarion County Airport, which is located just outside of the city limits.
Demographics
As of the 2010 census, the population of Paris was 2,521. The population density was 1,919.7 people per square mile. The racial makeup of the city was 97.3% White, 0.7% African American, 0.2% Native American, 0.2% Asian, 0.1% from other races, and 1.5% from two or more races. Hispanic or Latino of any race were 0.7% of the population.
The median income for a household in the city was $35,938, and the median income for a family was $41,250. The per capita income for the city was $17,845. About 11.2% of families and 14.2% of the population were below the poverty line, including 19.2% of those under age 18 and 8.2% of those age 65 or over.
Common Questions
What is Per Capita Income in Paris?
Per Capita income in Paris is $34,274.
What is the Median Family Income in Paris?
Median Family Income in Paris is $88,542.
What is the Median Household income in Paris?
Median Household Income in Paris is $80,795.
What is Income or Wage Gap in Paris?
Income or Wage Gap in Paris is 25.0%.
Women in Paris earn 75.0 cents for every dollar earned by a man.
What is Inequality or Gini Index in Paris?
Inequality or Gini Index in Paris is 0.37.
What is the Total Population of Paris?
Total Population of Paris is 635.
What is the Total Male Population of Paris?
Total Male Population of Paris is 303.
What is the Total Female Population of Paris?
Total Female Population of Paris is 332.
What is the Ratio of Males per 100 Females in Paris?
There are 91.27 Males per 100 Females in Paris.
What is the Ratio of Females per 100 Males in Paris?
There are 109.57 Females per 100 Males in Paris.
What is the Median Population Age in Paris?
Median Population Age in Paris is 50.6 Years.
What is the Average Family Size in Paris
Average Family Size in Paris is 2.9 People.
What is the Average Household Size in Paris
Average Household Size in Paris is 2.6 People.
How Large is the Labor Force in Paris?
There are 298 People in the Labor Forcein in Paris.
What is the Percentage of People in the Labor Force in Paris?
51.9% of People are in the Labor Force in Paris.