Montrose borough, PA Map & Demographics
Montrose borough Overview
$31,795
PER CAPITA INCOME
$80,250
AVG FAMILY INCOME
$50,250
AVG HOUSEHOLD INCOME
25.3%
WAGE / INCOME GAP [ % ]
74.7¢/ $1
WAGE / INCOME GAP [ $ ]
0.46
INEQUALITY / GINI INDEX
1,396
TOTAL POPULATION
741
MALE POPULATION
655
FEMALE POPULATION
113.13
MALES / 100 FEMALES
88.39
FEMALES / 100 MALES
43.6
MEDIAN AGE
3.2
AVG FAMILY SIZE
2.3
AVG HOUSEHOLD SIZE
675
LABOR FORCE [ PEOPLE ]
59.3%
PERCENT IN LABOR FORCE
8.0%
UNEMPLOYMENT RATE
Income in Montrose borough
Income Overview in Montrose borough
Per Capita Income in Montrose borough is $31,795, while median incomes of families and households are $80,250 and $50,250 respectively.
| Characteristic | Number | Measure |
| Per Capita Income | 1,396 | $31,795 |
| Median Family Income | 312 | $80,250 |
| Mean Family Income | 312 | $89,100 |
| Median Household Income | 616 | $50,250 |
| Mean Household Income | 616 | $67,908 |
| Income Deficit | 312 | $0 |
| Wage / Income Gap (%) | 1,396 | 25.27% |
| Wage / Income Gap ($) | 1,396 | 74.73¢ per $1 |
| Gini / Inequality Index | 1,396 | 0.46 |
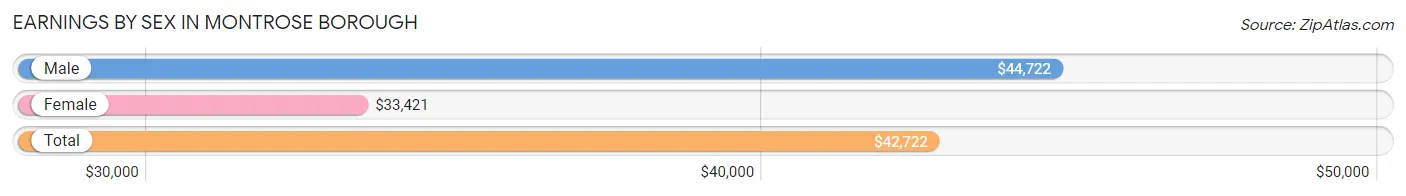
Earnings by Sex in Montrose borough
Average Earnings in Montrose borough are $42,722, $44,722 for men and $33,421 for women, a difference of 25.3%.
| Sex | Number | Average Earnings |
| Male | 410 (61.0%) | $44,722 |
| Female | 262 (39.0%) | $33,421 |
| Total | 672 (100.0%) | $42,722 |
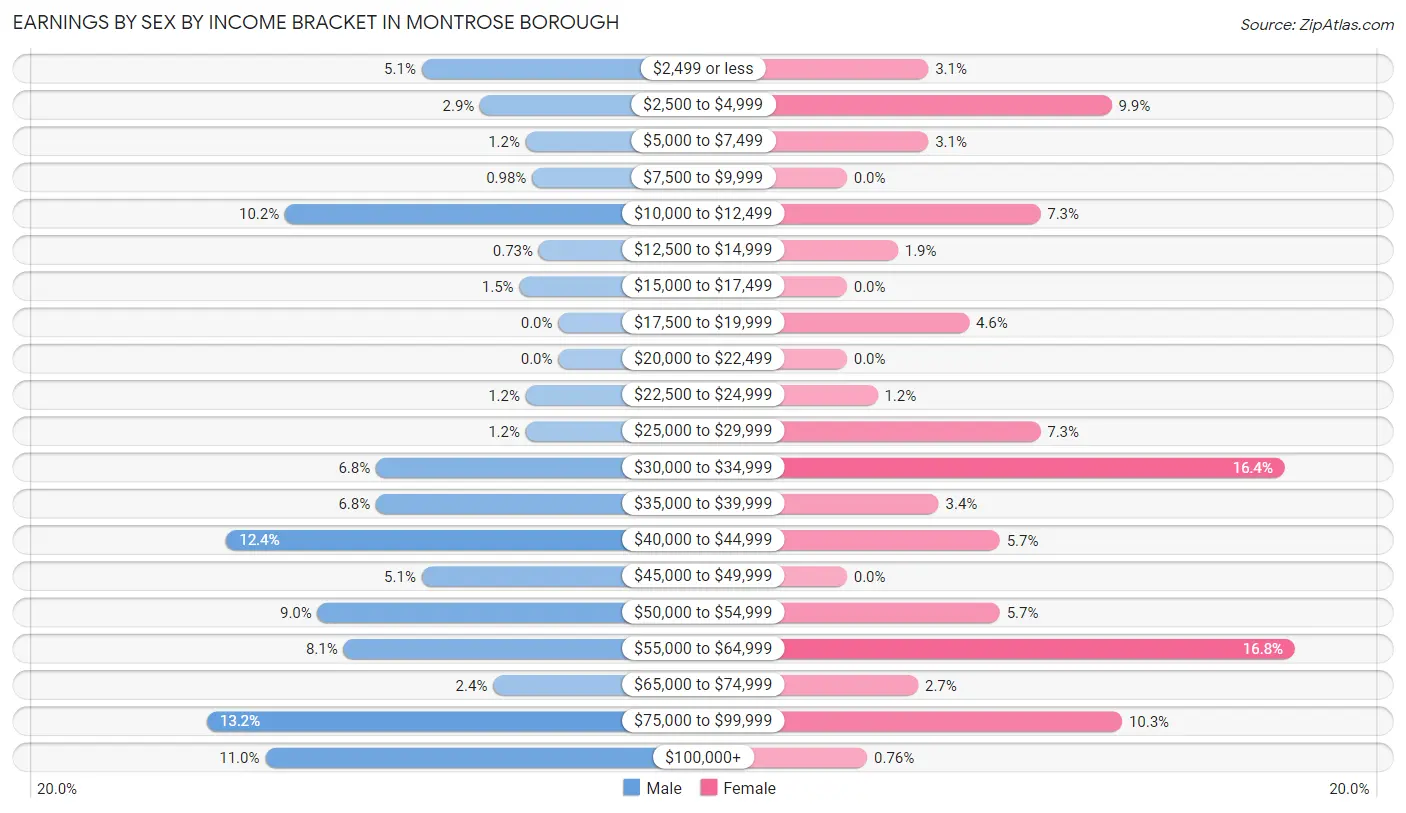
Earnings by Sex by Income Bracket in Montrose borough
The most common earnings brackets in Montrose borough are $75,000 to $99,999 for men (54 | 13.2%) and $55,000 to $64,999 for women (44 | 16.8%).
| Income | Male | Female |
| $2,499 or less | 21 (5.1%) | 8 (3.0%) |
| $2,500 to $4,999 | 12 (2.9%) | 26 (9.9%) |
| $5,000 to $7,499 | 5 (1.2%) | 8 (3.0%) |
| $7,500 to $9,999 | 4 (1.0%) | 0 (0.0%) |
| $10,000 to $12,499 | 42 (10.2%) | 19 (7.2%) |
| $12,500 to $14,999 | 3 (0.7%) | 5 (1.9%) |
| $15,000 to $17,499 | 6 (1.5%) | 0 (0.0%) |
| $17,500 to $19,999 | 0 (0.0%) | 12 (4.6%) |
| $20,000 to $22,499 | 0 (0.0%) | 0 (0.0%) |
| $22,500 to $24,999 | 5 (1.2%) | 3 (1.1%) |
| $25,000 to $29,999 | 5 (1.2%) | 19 (7.2%) |
| $30,000 to $34,999 | 28 (6.8%) | 43 (16.4%) |
| $35,000 to $39,999 | 28 (6.8%) | 9 (3.4%) |
| $40,000 to $44,999 | 51 (12.4%) | 15 (5.7%) |
| $45,000 to $49,999 | 21 (5.1%) | 0 (0.0%) |
| $50,000 to $54,999 | 37 (9.0%) | 15 (5.7%) |
| $55,000 to $64,999 | 33 (8.1%) | 44 (16.8%) |
| $65,000 to $74,999 | 10 (2.4%) | 7 (2.7%) |
| $75,000 to $99,999 | 54 (13.2%) | 27 (10.3%) |
| $100,000+ | 45 (11.0%) | 2 (0.8%) |
| Total | 410 (100.0%) | 262 (100.0%) |
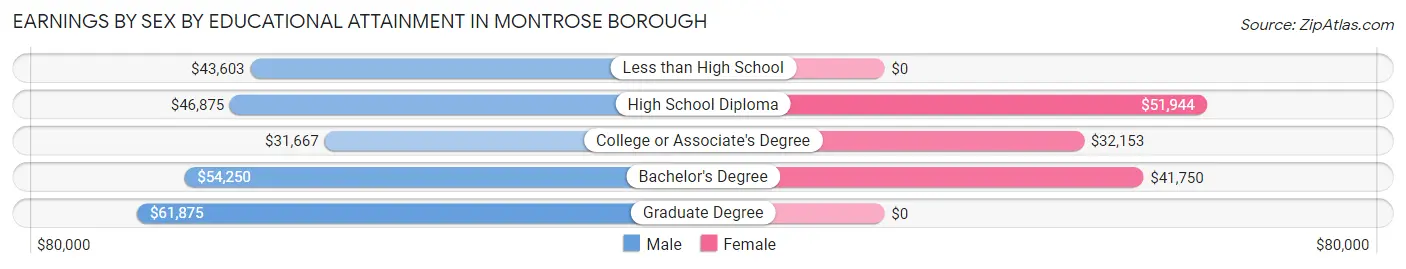
Earnings by Sex by Educational Attainment in Montrose borough
Average earnings in Montrose borough are $46,696 for men and $33,684 for women, a difference of 27.9%. Men with an educational attainment of graduate degree enjoy the highest average annual earnings of $61,875, while those with college or associate's degree education earn the least with $31,667. Women with an educational attainment of high school diploma earn the most with the average annual earnings of $51,944, while those with college or associate's degree education have the smallest earnings of $32,153.
| Educational Attainment | Male Income | Female Income |
| Less than High School | $43,603 | $0 |
| High School Diploma | $46,875 | $51,944 |
| College or Associate's Degree | $31,667 | $32,153 |
| Bachelor's Degree | $54,250 | $41,750 |
| Graduate Degree | $61,875 | $0 |
| Total | $46,696 | $33,684 |
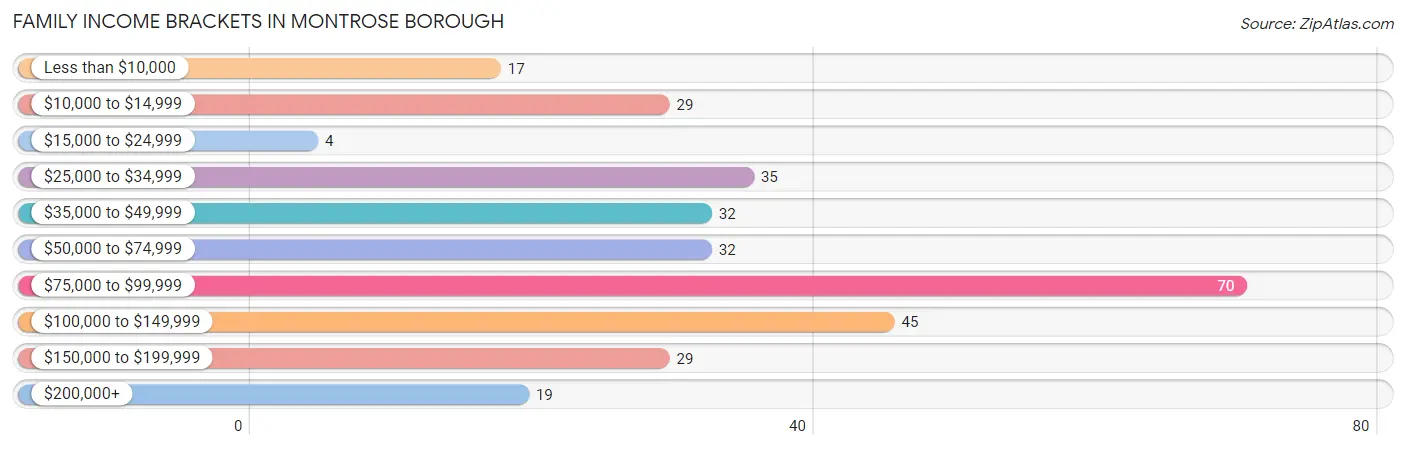
Family Income in Montrose borough
Family Income Brackets in Montrose borough
According to the Montrose borough family income data, there are 70 families falling into the $75,000 to $99,999 income range, which is the most common income bracket and makes up 22.4% of all families. Conversely, the $15,000 to $24,999 income bracket is the least frequent group with only 4 families (1.3%) belonging to this category.
| Income Bracket | # Families | % Families |
| Less than $10,000 | 17 | 5.4% |
| $10,000 to $14,999 | 29 | 9.3% |
| $15,000 to $24,999 | 4 | 1.3% |
| $25,000 to $34,999 | 35 | 11.2% |
| $35,000 to $49,999 | 32 | 10.3% |
| $50,000 to $74,999 | 32 | 10.3% |
| $75,000 to $99,999 | 70 | 22.4% |
| $100,000 to $149,999 | 45 | 14.4% |
| $150,000 to $199,999 | 29 | 9.3% |
| $200,000+ | 19 | 6.1% |
Family Income by Famaliy Size in Montrose borough
4-person families (88 | 28.2%) account for the highest median family income in Montrose borough with $88,068 per family, while 2-person families (178 | 57.1%) have the highest median income of $34,375 per family member.
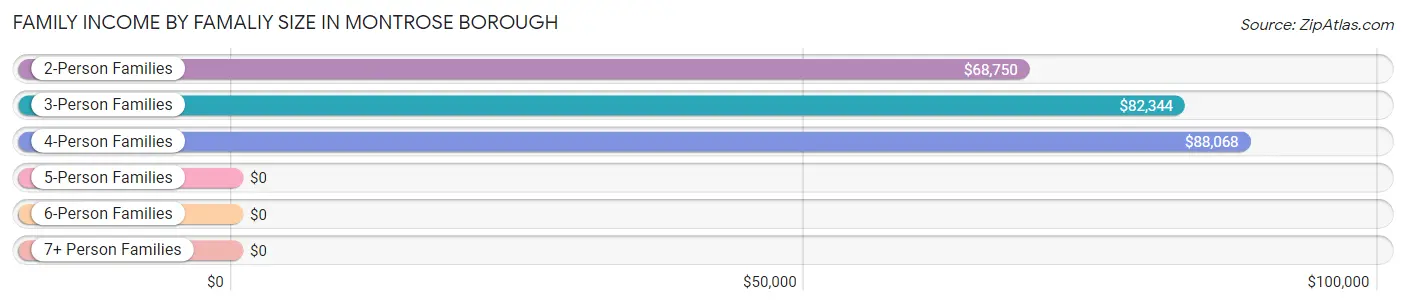
| Income Bracket | # Families | Median Income |
| 2-Person Families | 178 (57.1%) | $68,750 |
| 3-Person Families | 23 (7.4%) | $82,344 |
| 4-Person Families | 88 (28.2%) | $88,068 |
| 5-Person Families | 2 (0.6%) | $0 |
| 6-Person Families | 2 (0.6%) | $0 |
| 7+ Person Families | 19 (6.1%) | $0 |
| Total | 312 (100.0%) | $80,250 |
Family Income by Number of Earners in Montrose borough
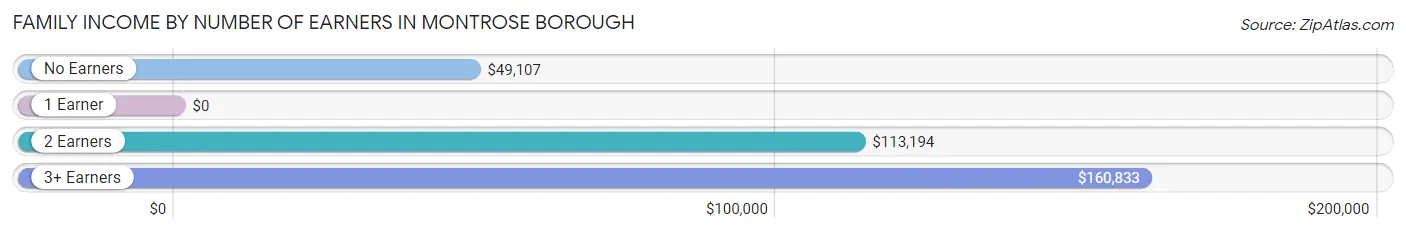
| Number of Earners | # Families | Median Income |
| No Earners | 54 (17.3%) | $49,107 |
| 1 Earner | 125 (40.1%) | $0 |
| 2 Earners | 123 (39.4%) | $113,194 |
| 3+ Earners | 10 (3.2%) | $160,833 |
| Total | 312 (100.0%) | $80,250 |
Household Income in Montrose borough
Household Income Brackets in Montrose borough
With 99 households falling in the category, the $50,000 to $74,999 income range is the most frequent in Montrose borough, accounting for 16.1% of all households. In contrast, only 21 households (3.4%) fall into the $200,000+ income bracket, making it the least populous group.
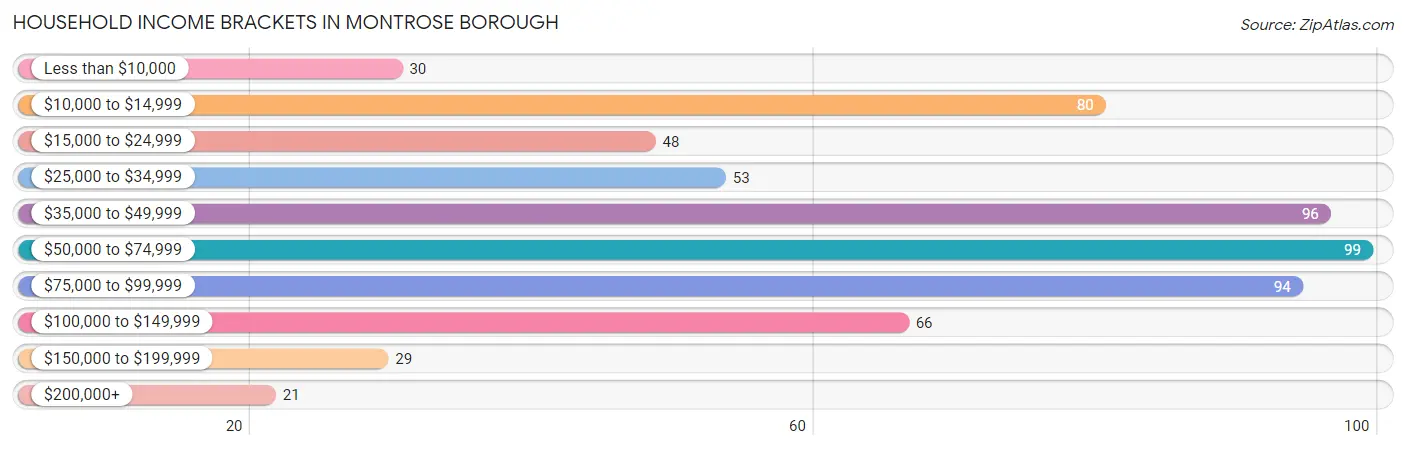
| Income Bracket | # Households | % Households |
| Less than $10,000 | 30 | 4.9% |
| $10,000 to $14,999 | 80 | 13.0% |
| $15,000 to $24,999 | 48 | 7.8% |
| $25,000 to $34,999 | 53 | 8.6% |
| $35,000 to $49,999 | 96 | 15.6% |
| $50,000 to $74,999 | 99 | 16.1% |
| $75,000 to $99,999 | 94 | 15.3% |
| $100,000 to $149,999 | 66 | 10.7% |
| $150,000 to $199,999 | 29 | 4.7% |
| $200,000+ | 21 | 3.4% |
Household Income by Householder Age in Montrose borough
The median household income in Montrose borough is $50,250, with the highest median household income of $75,833 found in the 45 to 64 years age bracket for the primary householder. A total of 216 households (35.1%) fall into this category. Meanwhile, the 15 to 24 years age bracket for the primary householder has the lowest median household income of $0, with 21 households (3.4%) in this group.
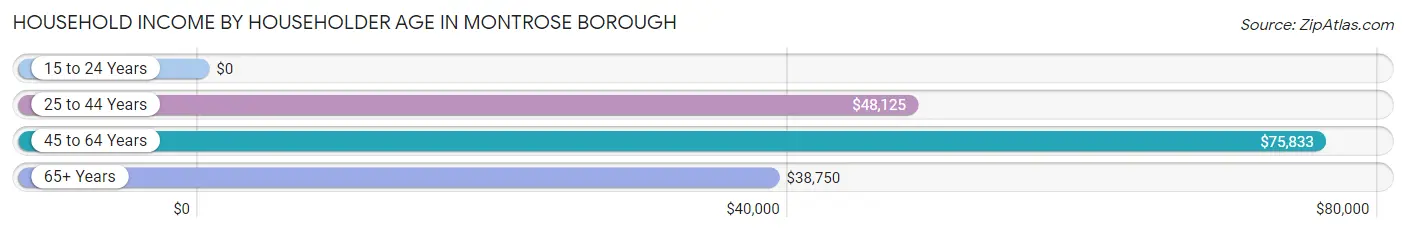
| Income Bracket | # Households | Median Income |
| 15 to 24 Years | 21 (3.4%) | $0 |
| 25 to 44 Years | 161 (26.1%) | $48,125 |
| 45 to 64 Years | 216 (35.1%) | $75,833 |
| 65+ Years | 218 (35.4%) | $38,750 |
| Total | 616 (100.0%) | $50,250 |
Poverty in Montrose borough
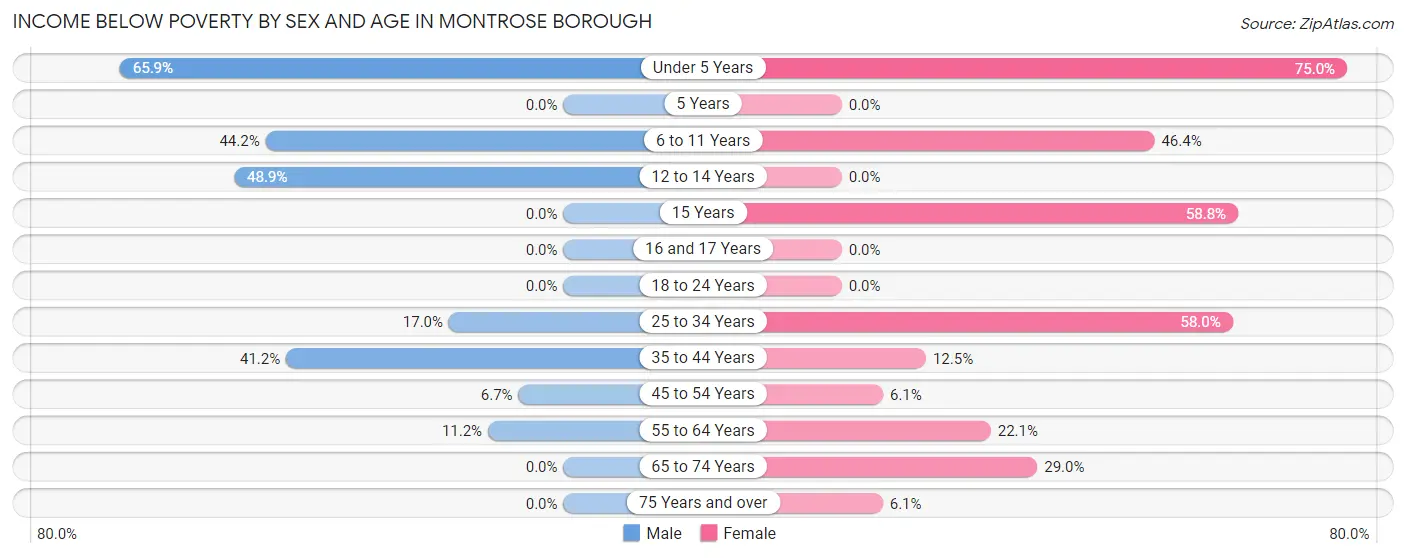
Income Below Poverty by Sex and Age in Montrose borough
With 20.1% poverty level for males and 26.3% for females among the residents of Montrose borough, under 5 year old males and under 5 year old females are the most vulnerable to poverty, with 27 males (65.8%) and 3 females (75.0%) in their respective age groups living below the poverty level.
| Age Bracket | Male | Female |
| Under 5 Years | 27 (65.8%) | 3 (75.0%) |
| 5 Years | 0 (0.0%) | 0 (0.0%) |
| 6 to 11 Years | 23 (44.2%) | 26 (46.4%) |
| 12 to 14 Years | 22 (48.9%) | 0 (0.0%) |
| 15 Years | 0 (0.0%) | 30 (58.8%) |
| 16 and 17 Years | 0 (0.0%) | 0 (0.0%) |
| 18 to 24 Years | 0 (0.0%) | 0 (0.0%) |
| 25 to 34 Years | 17 (17.0%) | 47 (58.0%) |
| 35 to 44 Years | 42 (41.2%) | 11 (12.5%) |
| 45 to 54 Years | 4 (6.7%) | 3 (6.1%) |
| 55 to 64 Years | 14 (11.2%) | 27 (22.1%) |
| 65 to 74 Years | 0 (0.0%) | 18 (29.0%) |
| 75 Years and over | 0 (0.0%) | 7 (6.1%) |
| Total | 149 (20.1%) | 172 (26.3%) |
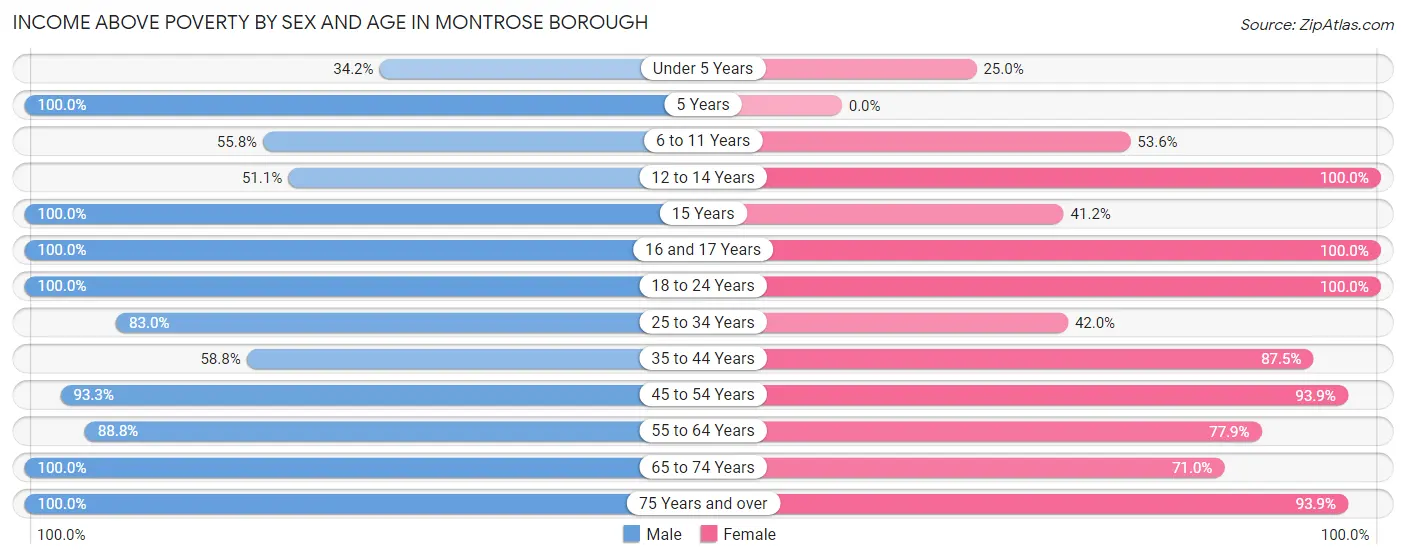
Income Above Poverty by Sex and Age in Montrose borough
According to the poverty statistics in Montrose borough, males aged 5 years and females aged 12 to 14 years are the age groups that are most secure financially, with 100.0% of males and 100.0% of females in these age groups living above the poverty line.
| Age Bracket | Male | Female |
| Under 5 Years | 14 (34.2%) | 1 (25.0%) |
| 5 Years | 2 (100.0%) | 0 (0.0%) |
| 6 to 11 Years | 29 (55.8%) | 30 (53.6%) |
| 12 to 14 Years | 23 (51.1%) | 4 (100.0%) |
| 15 Years | 3 (100.0%) | 21 (41.2%) |
| 16 and 17 Years | 12 (100.0%) | 6 (100.0%) |
| 18 to 24 Years | 57 (100.0%) | 17 (100.0%) |
| 25 to 34 Years | 83 (83.0%) | 34 (42.0%) |
| 35 to 44 Years | 60 (58.8%) | 77 (87.5%) |
| 45 to 54 Years | 56 (93.3%) | 46 (93.9%) |
| 55 to 64 Years | 111 (88.8%) | 95 (77.9%) |
| 65 to 74 Years | 102 (100.0%) | 44 (71.0%) |
| 75 Years and over | 40 (100.0%) | 108 (93.9%) |
| Total | 592 (79.9%) | 483 (73.7%) |
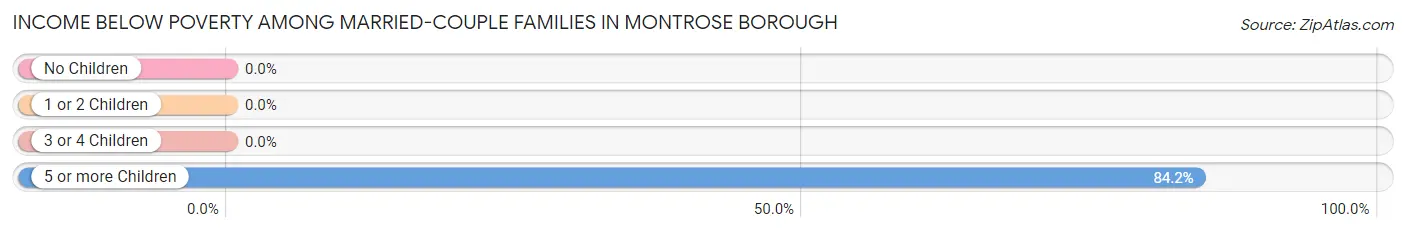
Income Below Poverty Among Married-Couple Families in Montrose borough
The poverty statistics for married-couple families in Montrose borough show that 7.2% or 16 of the total 223 families live below the poverty line. Families with 5 or more children have the highest poverty rate of 84.2%, comprising of 16 families. On the other hand, families with no children have the lowest poverty rate of 0.0%, which includes 0 families.
| Children | Above Poverty | Below Poverty |
| No Children | 153 (100.0%) | 0 (0.0%) |
| 1 or 2 Children | 47 (100.0%) | 0 (0.0%) |
| 3 or 4 Children | 4 (100.0%) | 0 (0.0%) |
| 5 or more Children | 3 (15.8%) | 16 (84.2%) |
| Total | 207 (92.8%) | 16 (7.2%) |
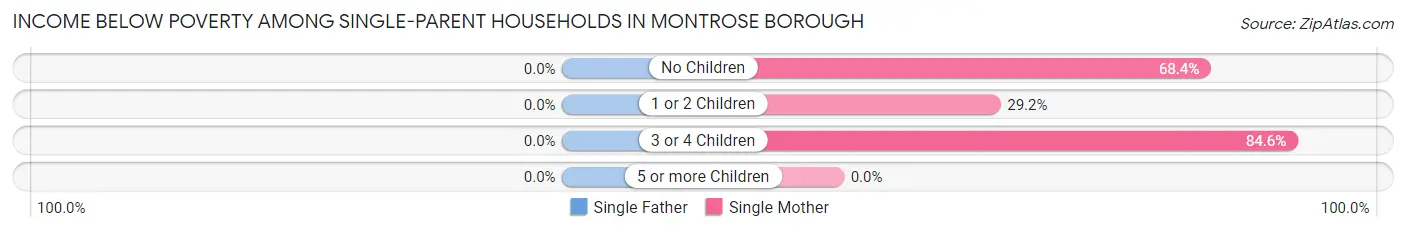
Income Below Poverty Among Single-Parent Households in Montrose borough
| Children | Single Father | Single Mother |
| No Children | 0 (0.0%) | 13 (68.4%) |
| 1 or 2 Children | 0 (0.0%) | 7 (29.2%) |
| 3 or 4 Children | 0 (0.0%) | 11 (84.6%) |
| 5 or more Children | 0 (0.0%) | 0 (0.0%) |
| Total | 0 (0.0%) | 31 (55.4%) |
Income Below Poverty Among Married-Couple vs Single-Parent Households in Montrose borough
The poverty data for Montrose borough shows that 16 of the married-couple family households (7.2%) and 31 of the single-parent households (34.8%) are living below the poverty level. Within the married-couple family households, those with 5 or more children have the highest poverty rate, with 16 households (84.2%) falling below the poverty line. Among the single-parent households, those with 3 or 4 children have the highest poverty rate, with 11 household (84.6%) living below poverty.
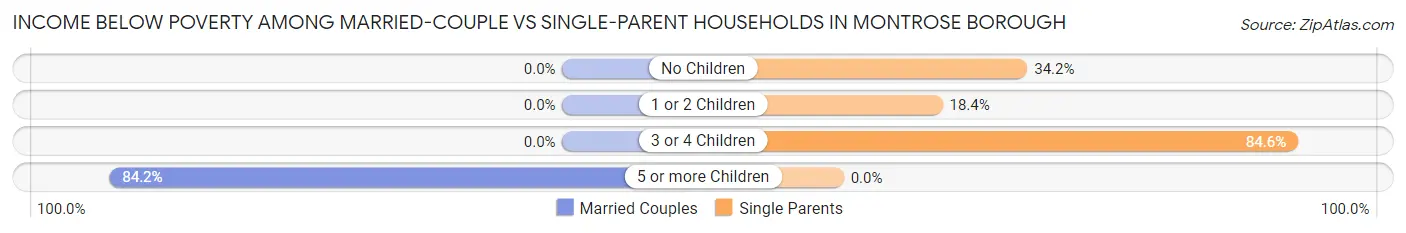
| Children | Married-Couple Families | Single-Parent Households |
| No Children | 0 (0.0%) | 13 (34.2%) |
| 1 or 2 Children | 0 (0.0%) | 7 (18.4%) |
| 3 or 4 Children | 0 (0.0%) | 11 (84.6%) |
| 5 or more Children | 16 (84.2%) | 0 (0.0%) |
| Total | 16 (7.2%) | 31 (34.8%) |
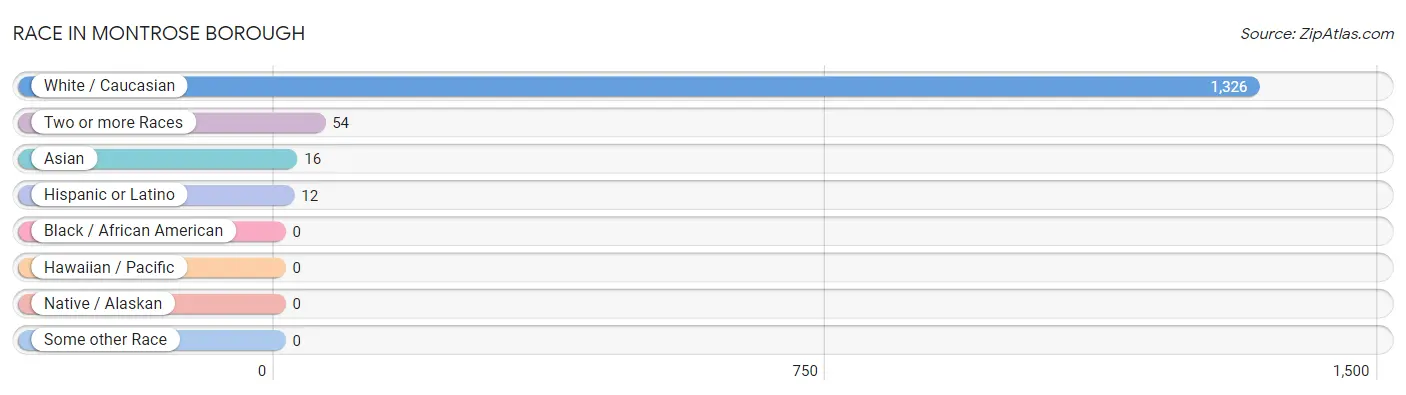
Race in Montrose borough
The most populous races in Montrose borough are White / Caucasian (1,326 | 95.0%), Two or more Races (54 | 3.9%), and Asian (16 | 1.1%).
| Race | # Population | % Population |
| Asian | 16 | 1.1% |
| Black / African American | 0 | 0.0% |
| Hawaiian / Pacific | 0 | 0.0% |
| Hispanic or Latino | 12 | 0.9% |
| Native / Alaskan | 0 | 0.0% |
| White / Caucasian | 1,326 | 95.0% |
| Two or more Races | 54 | 3.9% |
| Some other Race | 0 | 0.0% |
| Total | 1,396 | 100.0% |
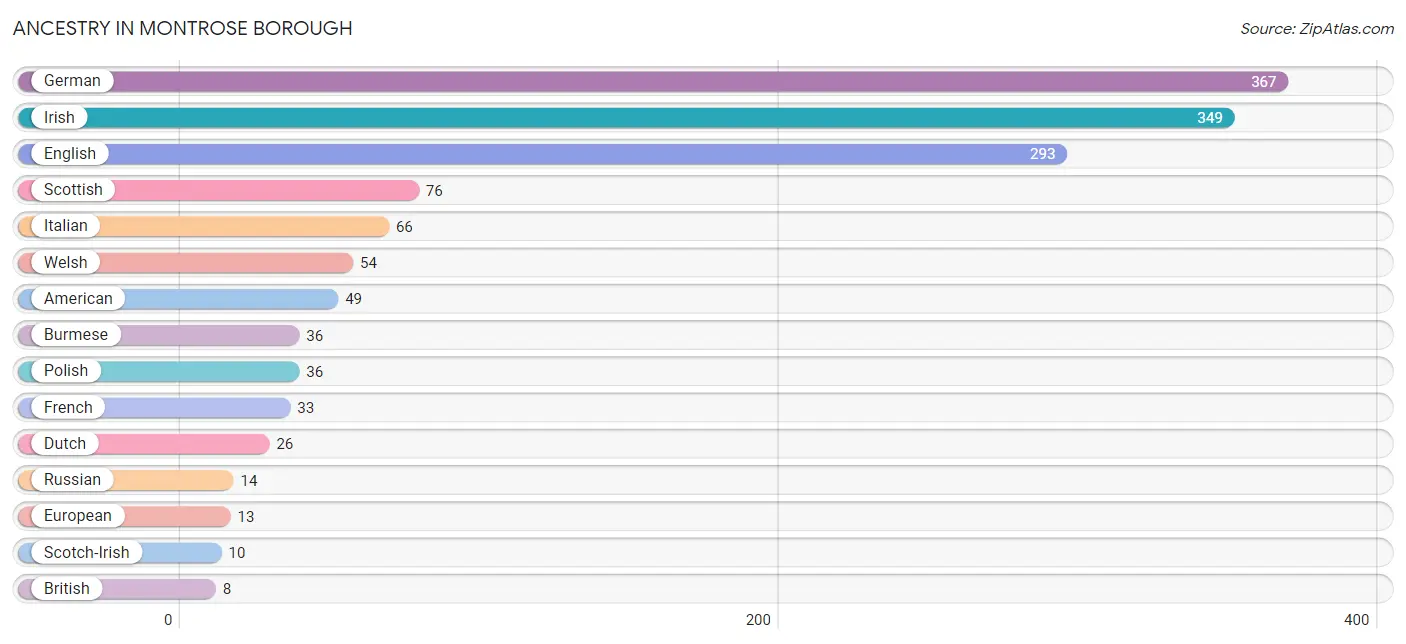
Ancestry in Montrose borough
The most populous ancestries reported in Montrose borough are German (367 | 26.3%), Irish (349 | 25.0%), English (293 | 21.0%), Scottish (76 | 5.4%), and Italian (66 | 4.7%), together accounting for 82.5% of all Montrose borough residents.
| Ancestry | # Population | % Population |
| Alsatian | 3 | 0.2% |
| American | 49 | 3.5% |
| Austrian | 2 | 0.1% |
| British | 8 | 0.6% |
| Burmese | 36 | 2.6% |
| Cherokee | 6 | 0.4% |
| Chippewa | 2 | 0.1% |
| Dutch | 26 | 1.9% |
| English | 293 | 21.0% |
| European | 13 | 0.9% |
| Finnish | 3 | 0.2% |
| French | 33 | 2.4% |
| German | 367 | 26.3% |
| Irish | 349 | 25.0% |
| Italian | 66 | 4.7% |
| Lithuanian | 3 | 0.2% |
| Mexican | 2 | 0.1% |
| Pennsylvania German | 5 | 0.4% |
| Polish | 36 | 2.6% |
| Romanian | 3 | 0.2% |
| Russian | 14 | 1.0% |
| Scotch-Irish | 10 | 0.7% |
| Scottish | 76 | 5.4% |
| Swiss | 3 | 0.2% |
| Welsh | 54 | 3.9% | View All 25 Rows |
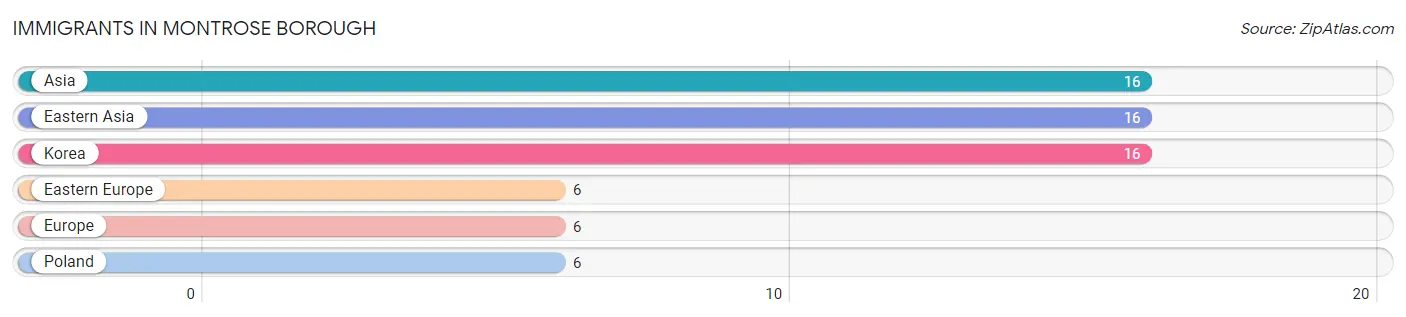
Immigrants in Montrose borough
The most numerous immigrant groups reported in Montrose borough came from Asia (16 | 1.1%), Eastern Asia (16 | 1.1%), Korea (16 | 1.1%), Eastern Europe (6 | 0.4%), and Europe (6 | 0.4%), together accounting for 4.3% of all Montrose borough residents.
| Immigration Origin | # Population | % Population |
| Asia | 16 | 1.1% |
| Eastern Asia | 16 | 1.1% |
| Eastern Europe | 6 | 0.4% |
| Europe | 6 | 0.4% |
| Korea | 16 | 1.1% |
| Poland | 6 | 0.4% | View All 6 Rows |
Sex and Age in Montrose borough
Sex and Age in Montrose borough
The most populous age groups in Montrose borough are 55 to 59 Years (85 | 11.5%) for men and 55 to 59 Years (77 | 11.8%) for women.
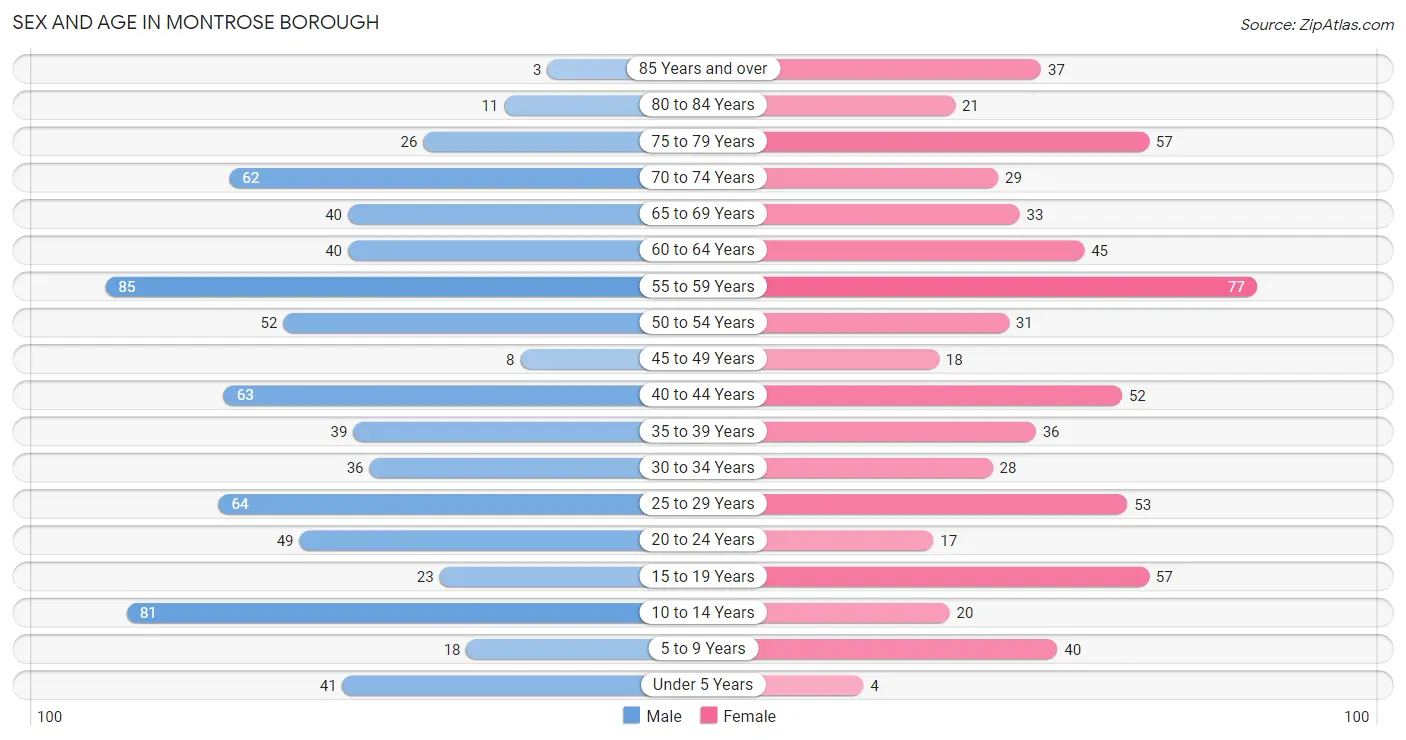
| Age Bracket | Male | Female |
| Under 5 Years | 41 (5.5%) | 4 (0.6%) |
| 5 to 9 Years | 18 (2.4%) | 40 (6.1%) |
| 10 to 14 Years | 81 (10.9%) | 20 (3.0%) |
| 15 to 19 Years | 23 (3.1%) | 57 (8.7%) |
| 20 to 24 Years | 49 (6.6%) | 17 (2.6%) |
| 25 to 29 Years | 64 (8.6%) | 53 (8.1%) |
| 30 to 34 Years | 36 (4.9%) | 28 (4.3%) |
| 35 to 39 Years | 39 (5.3%) | 36 (5.5%) |
| 40 to 44 Years | 63 (8.5%) | 52 (7.9%) |
| 45 to 49 Years | 8 (1.1%) | 18 (2.8%) |
| 50 to 54 Years | 52 (7.0%) | 31 (4.7%) |
| 55 to 59 Years | 85 (11.5%) | 77 (11.8%) |
| 60 to 64 Years | 40 (5.4%) | 45 (6.9%) |
| 65 to 69 Years | 40 (5.4%) | 33 (5.0%) |
| 70 to 74 Years | 62 (8.4%) | 29 (4.4%) |
| 75 to 79 Years | 26 (3.5%) | 57 (8.7%) |
| 80 to 84 Years | 11 (1.5%) | 21 (3.2%) |
| 85 Years and over | 3 (0.4%) | 37 (5.7%) |
| Total | 741 (100.0%) | 655 (100.0%) |
Families and Households in Montrose borough
Median Family Size in Montrose borough
The median family size in Montrose borough is 3.23 persons per family, with single male/father families (33 | 10.6%) accounting for the largest median family size of 3.48 persons per family. On the other hand, married-couple families (223 | 71.5%) represent the smallest median family size with 3.17 persons per family.
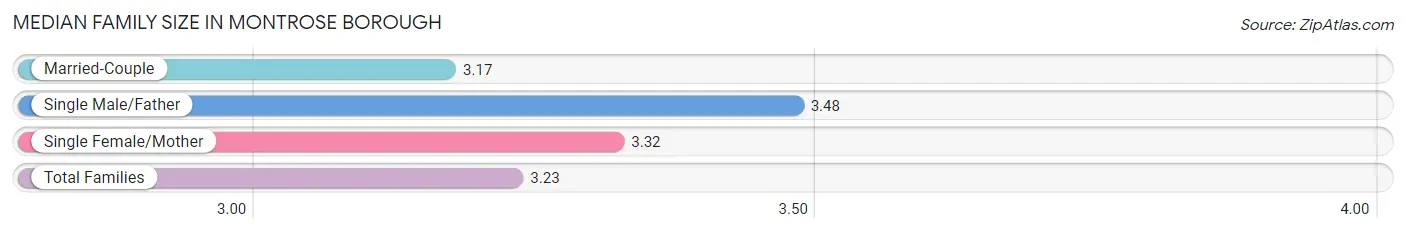
| Family Type | # Families | Family Size |
| Married-Couple | 223 (71.5%) | 3.17 |
| Single Male/Father | 33 (10.6%) | 3.48 |
| Single Female/Mother | 56 (17.9%) | 3.32 |
| Total Families | 312 (100.0%) | 3.23 |
Median Household Size in Montrose borough
The median household size in Montrose borough is 2.27 persons per household, with single male/father households (33 | 5.4%) accounting for the largest median household size of 3.7 persons per household. non-family households (304 | 49.3%) represent the smallest median household size with 1.24 persons per household.
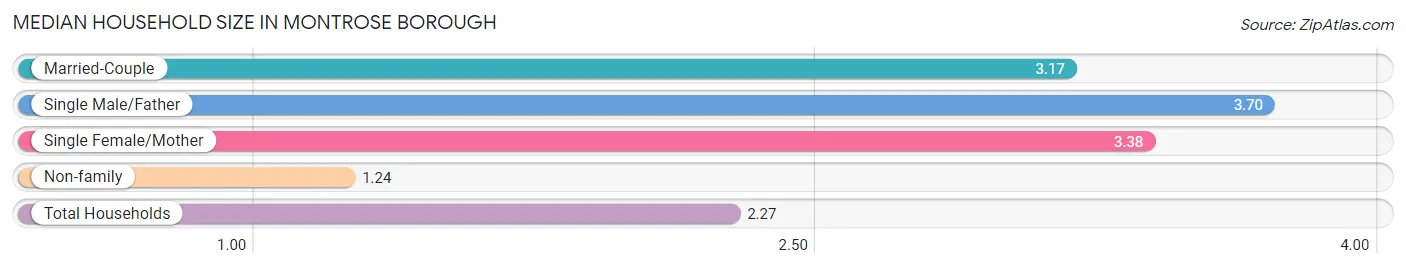
| Household Type | # Households | Household Size |
| Married-Couple | 223 (36.2%) | 3.17 |
| Single Male/Father | 33 (5.4%) | 3.70 |
| Single Female/Mother | 56 (9.1%) | 3.38 |
| Non-family | 304 (49.3%) | 1.24 |
| Total Households | 616 (100.0%) | 2.27 |
Household Size by Marriage Status in Montrose borough
Out of a total of 616 households in Montrose borough, 312 (50.6%) are family households, while 304 (49.3%) are nonfamily households. The most numerous type of family households are 2-person households, comprising 168, and the most common type of nonfamily households are 1-person households, comprising 273.
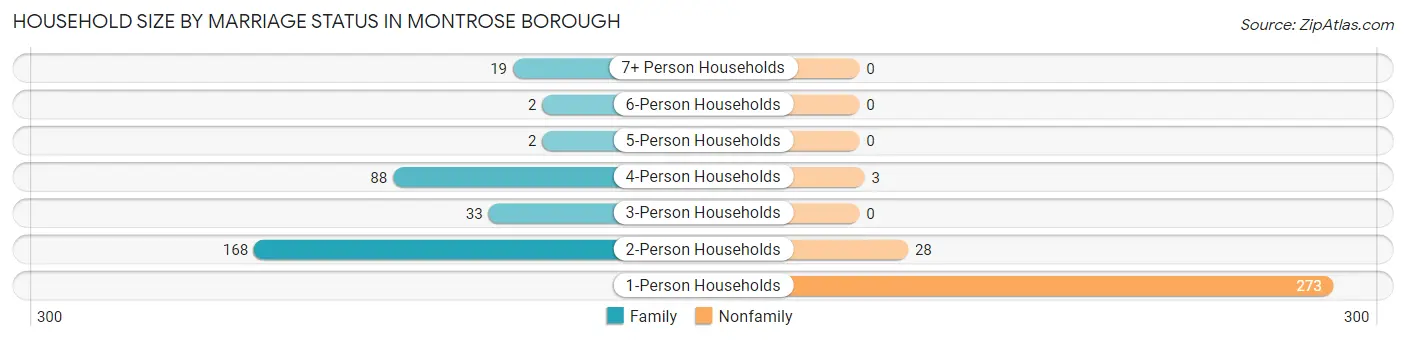
| Household Size | Family Households | Nonfamily Households |
| 1-Person Households | - | 273 (44.3%) |
| 2-Person Households | 168 (27.3%) | 28 (4.5%) |
| 3-Person Households | 33 (5.4%) | 0 (0.0%) |
| 4-Person Households | 88 (14.3%) | 3 (0.5%) |
| 5-Person Households | 2 (0.3%) | 0 (0.0%) |
| 6-Person Households | 2 (0.3%) | 0 (0.0%) |
| 7+ Person Households | 19 (3.1%) | 0 (0.0%) |
| Total | 312 (50.6%) | 304 (49.3%) |
Female Fertility in Montrose borough
Fertility by Age in Montrose borough
Average fertility rate in Montrose borough is 31.0 births per 1,000 women. Women in the age bracket of 20 to 34 years have the highest fertility rate with 82.0 births per 1,000 women. Women in the age bracket of 20 to 34 years acount for 100.0% of all women with births.
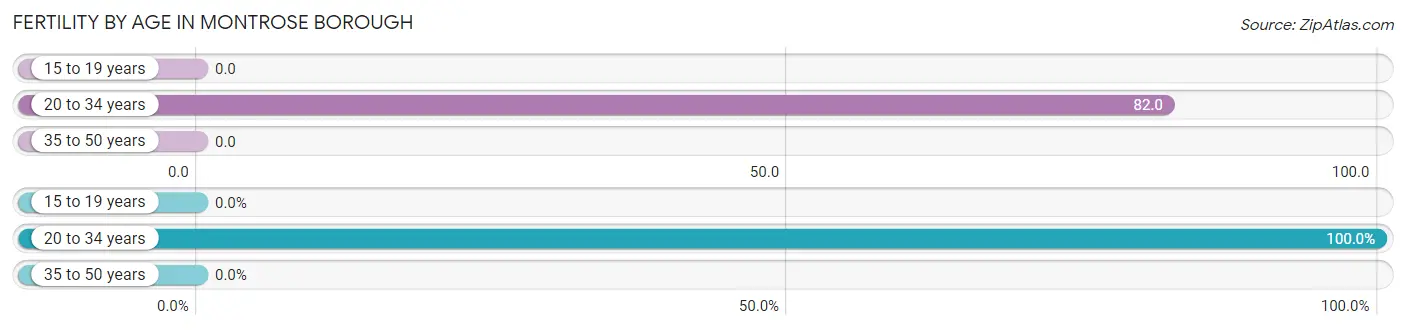
| Age Bracket | Women with Births | Births / 1,000 Women |
| 15 to 19 years | 0 (0.0%) | 0.0 |
| 20 to 34 years | 8 (100.0%) | 82.0 |
| 35 to 50 years | 0 (0.0%) | 0.0 |
| Total | 8 (100.0%) | 31.0 |
Fertility by Age by Marriage Status in Montrose borough
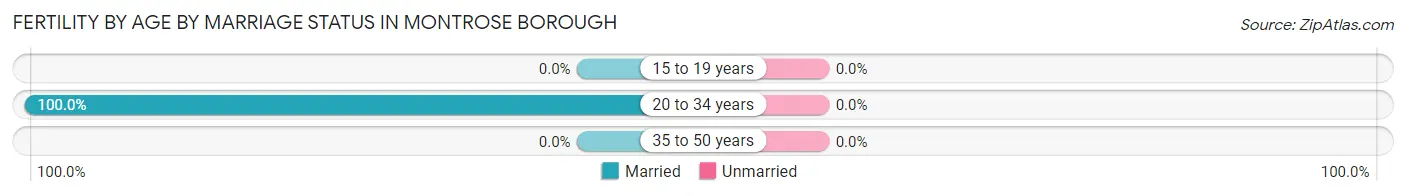
| Age Bracket | Married | Unmarried |
| 15 to 19 years | 0 (0.0%) | 0 (0.0%) |
| 20 to 34 years | 8 (100.0%) | 0 (0.0%) |
| 35 to 50 years | 0 (0.0%) | 0 (0.0%) |
| Total | 8 (100.0%) | 0 (0.0%) |
Fertility by Education in Montrose borough
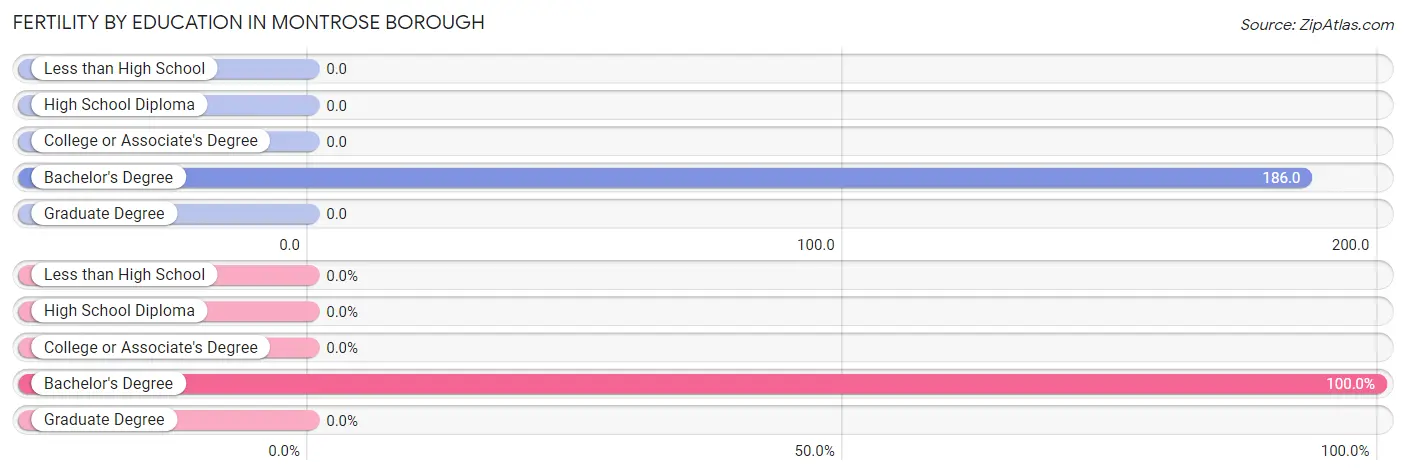
| Educational Attainment | Women with Births | Births / 1,000 Women |
| Less than High School | 0 (0.0%) | 0.0 |
| High School Diploma | 0 (0.0%) | 0.0 |
| College or Associate's Degree | 0 (0.0%) | 0.0 |
| Bachelor's Degree | 8 (100.0%) | 186.0 |
| Graduate Degree | 0 (0.0%) | 0.0 |
| Total | 8 (100.0%) | 31.0 |
Fertility by Education by Marriage Status in Montrose borough
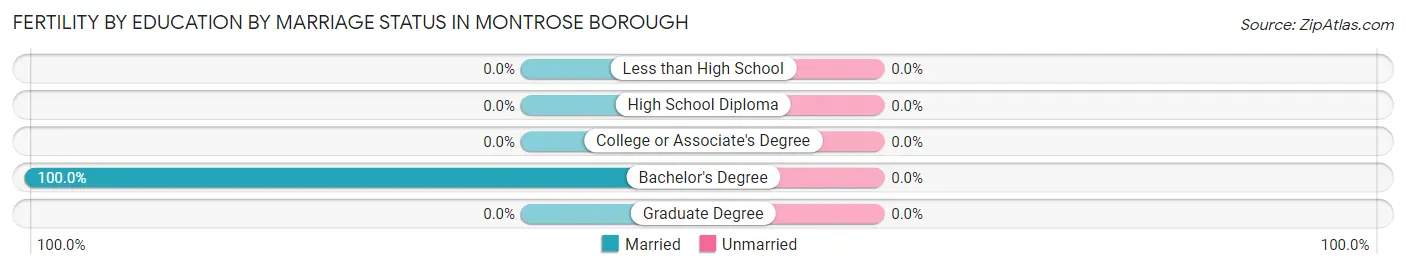
| Educational Attainment | Married | Unmarried |
| Less than High School | 0 (0.0%) | 0 (0.0%) |
| High School Diploma | 0 (0.0%) | 0 (0.0%) |
| College or Associate's Degree | 0 (0.0%) | 0 (0.0%) |
| Bachelor's Degree | 8 (100.0%) | 0 (0.0%) |
| Graduate Degree | 0 (0.0%) | 0 (0.0%) |
| Total | 8 (100.0%) | 0 (0.0%) |
Employment Characteristics in Montrose borough
Employment by Class of Employer in Montrose borough
Among the 612 employed individuals in Montrose borough, private company employees (456 | 74.5%), not-for-profit organizations (58 | 9.5%), and self-employed (not incorporated) (37 | 6.0%) make up the most common classes of employment.
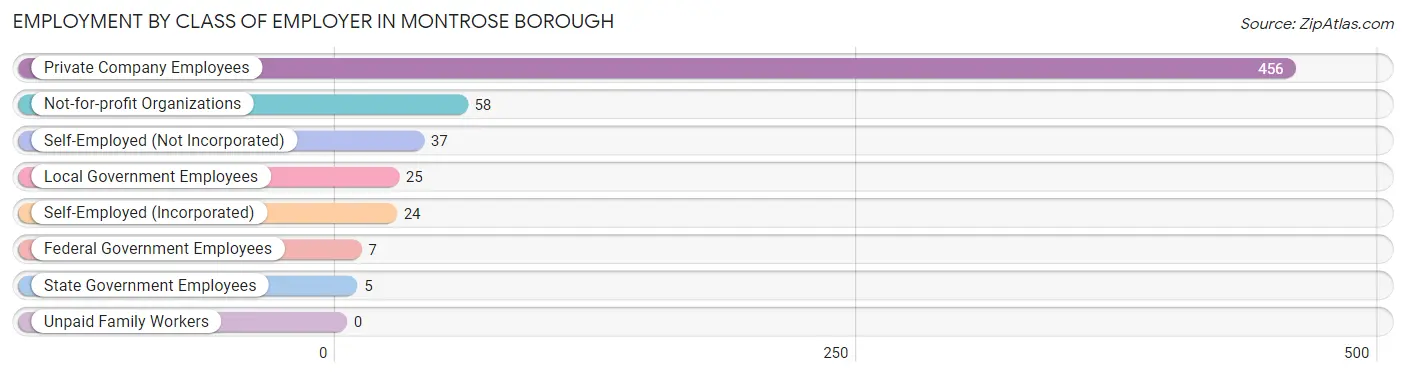
| Employer Class | # Employees | % Employees |
| Private Company Employees | 456 | 74.5% |
| Self-Employed (Incorporated) | 24 | 3.9% |
| Self-Employed (Not Incorporated) | 37 | 6.0% |
| Not-for-profit Organizations | 58 | 9.5% |
| Local Government Employees | 25 | 4.1% |
| State Government Employees | 5 | 0.8% |
| Federal Government Employees | 7 | 1.1% |
| Unpaid Family Workers | 0 | 0.0% |
| Total | 612 | 100.0% |
Employment Status by Age in Montrose borough
According to the labor force statistics for Montrose borough, out of the total population over 16 years of age (1,138), 59.3% or 675 individuals are in the labor force, with 8.0% or 54 of them unemployed. The age group with the highest labor force participation rate is 60 to 64 years, with 94.1% or 80 individuals in the labor force. Within the labor force, the 20 to 24 years age range has the highest percentage of unemployed individuals, with 38.7% or 24 of them being unemployed.
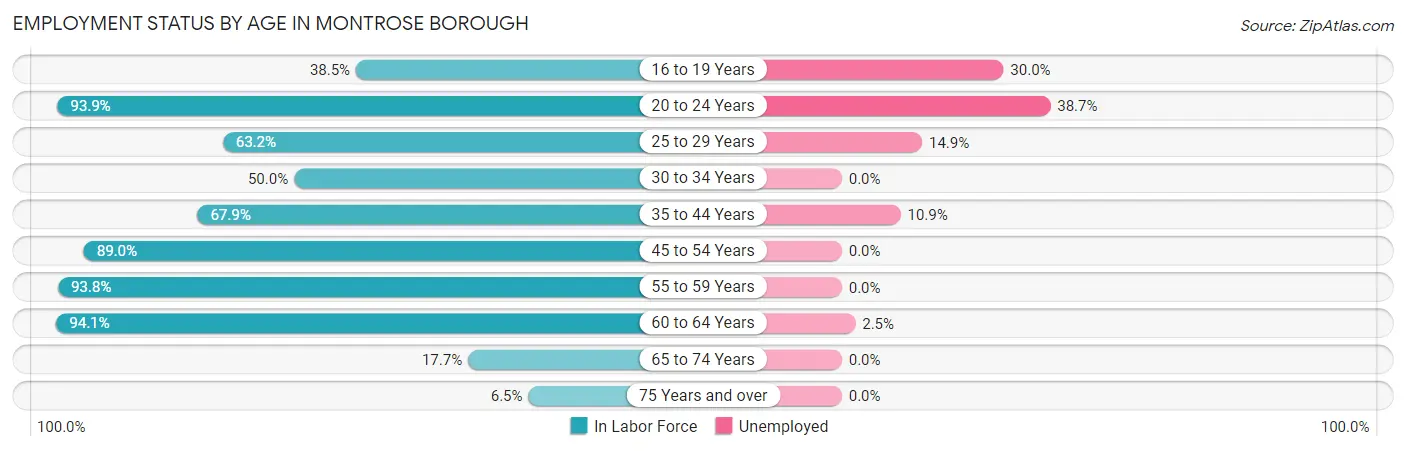
| Age Bracket | In Labor Force | Unemployed |
| 16 to 19 Years | 10 (38.5%) | 3 (30.0%) |
| 20 to 24 Years | 62 (93.9%) | 24 (38.7%) |
| 25 to 29 Years | 74 (63.2%) | 11 (14.9%) |
| 30 to 34 Years | 32 (50.0%) | 0 (0.0%) |
| 35 to 44 Years | 129 (67.9%) | 14 (10.9%) |
| 45 to 54 Years | 97 (89.0%) | 0 (0.0%) |
| 55 to 59 Years | 152 (93.8%) | 0 (0.0%) |
| 60 to 64 Years | 80 (94.1%) | 2 (2.5%) |
| 65 to 74 Years | 29 (17.7%) | 0 (0.0%) |
| 75 Years and over | 10 (6.5%) | 0 (0.0%) |
| Total | 675 (59.3%) | 54 (8.0%) |
Employment Status by Educational Attainment in Montrose borough
According to labor force statistics for Montrose borough, 77.6% of individuals (564) out of the total population between 25 and 64 years of age (727) are in the labor force, with 4.8% or 27 of them being unemployed. The group with the highest labor force participation rate are those with the educational attainment of college / associate degree, with 85.5% or 136 individuals in the labor force. Within the labor force, individuals with less than high school education have the highest percentage of unemployment, with 19.2% or 14 of them being unemployed.
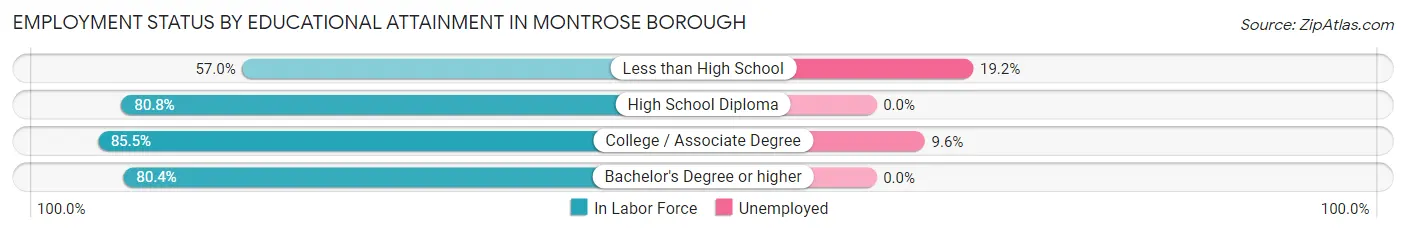
| Educational Attainment | In Labor Force | Unemployed |
| Less than High School | 73 (57.0%) | 25 (19.2%) |
| High School Diploma | 240 (80.8%) | 0 (0.0%) |
| College / Associate Degree | 136 (85.5%) | 15 (9.6%) |
| Bachelor's Degree or higher | 115 (80.4%) | 0 (0.0%) |
| Total | 564 (77.6%) | 35 (4.8%) |
Employment Occupations by Sex in Montrose borough
Management, Business, Science and Arts Occupations
The most common Management, Business, Science and Arts occupations in Montrose borough are Community & Social Service (47 | 7.6%), Management (46 | 7.4%), Business & Financial (38 | 6.1%), Health Diagnosing & Treating (32 | 5.1%), and Health Technologists (29 | 4.7%).
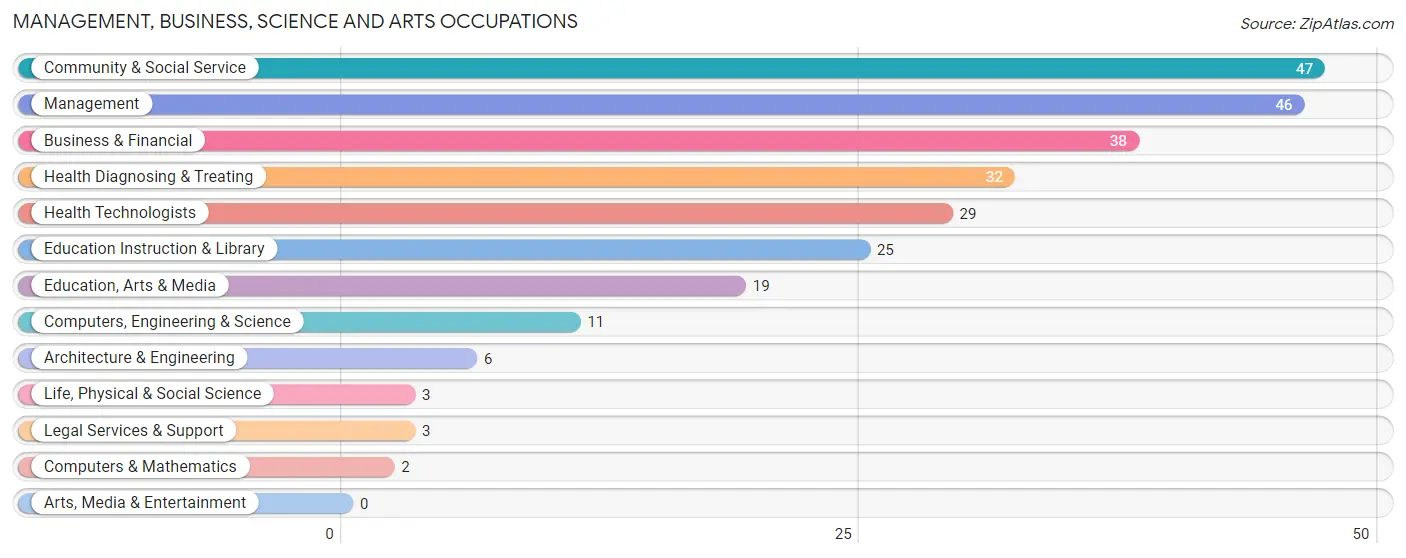
Management, Business, Science and Arts Occupations by Sex
Within the Management, Business, Science and Arts occupations in Montrose borough, the most male-oriented occupations are Computers & Mathematics (100.0%), Life, Physical & Social Science (100.0%), and Business & Financial (73.7%), while the most female-oriented occupations are Legal Services & Support (100.0%), Education Instruction & Library (80.0%), and Management (78.3%).
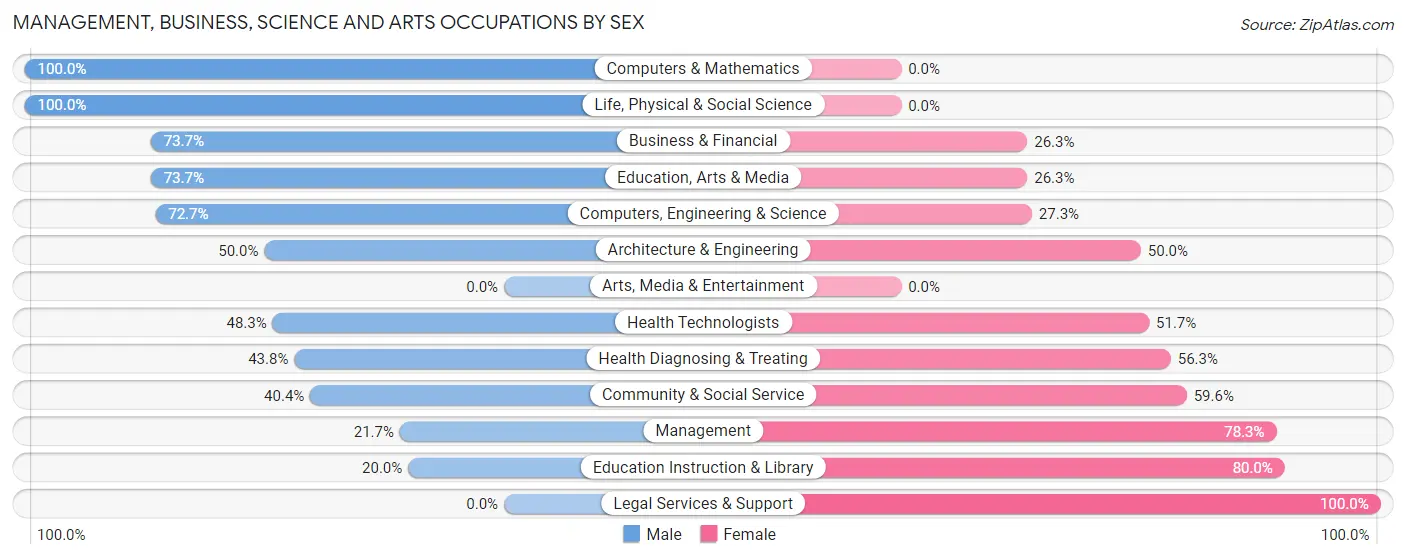
| Occupation | Male | Female |
| Management | 10 (21.7%) | 36 (78.3%) |
| Business & Financial | 28 (73.7%) | 10 (26.3%) |
| Computers, Engineering & Science | 8 (72.7%) | 3 (27.3%) |
| Computers & Mathematics | 2 (100.0%) | 0 (0.0%) |
| Architecture & Engineering | 3 (50.0%) | 3 (50.0%) |
| Life, Physical & Social Science | 3 (100.0%) | 0 (0.0%) |
| Community & Social Service | 19 (40.4%) | 28 (59.6%) |
| Education, Arts & Media | 14 (73.7%) | 5 (26.3%) |
| Legal Services & Support | 0 (0.0%) | 3 (100.0%) |
| Education Instruction & Library | 5 (20.0%) | 20 (80.0%) |
| Arts, Media & Entertainment | 0 (0.0%) | 0 (0.0%) |
| Health Diagnosing & Treating | 14 (43.8%) | 18 (56.2%) |
| Health Technologists | 14 (48.3%) | 15 (51.7%) |
| Total (Category) | 79 (45.4%) | 95 (54.6%) |
| Total (Overall) | 388 (62.5%) | 233 (37.5%) |
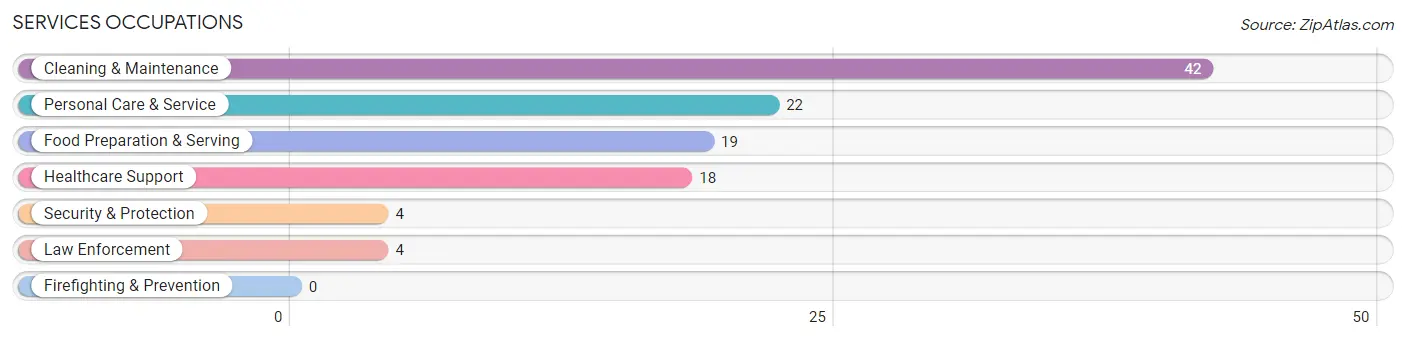
Services Occupations
The most common Services occupations in Montrose borough are Cleaning & Maintenance (42 | 6.8%), Personal Care & Service (22 | 3.5%), Food Preparation & Serving (19 | 3.1%), Healthcare Support (18 | 2.9%), and Security & Protection (4 | 0.6%).
Services Occupations by Sex
Within the Services occupations in Montrose borough, the most male-oriented occupations are Security & Protection (100.0%), Law Enforcement (100.0%), and Cleaning & Maintenance (100.0%), while the most female-oriented occupations are Healthcare Support (83.3%), Food Preparation & Serving (78.9%), and Personal Care & Service (59.1%).
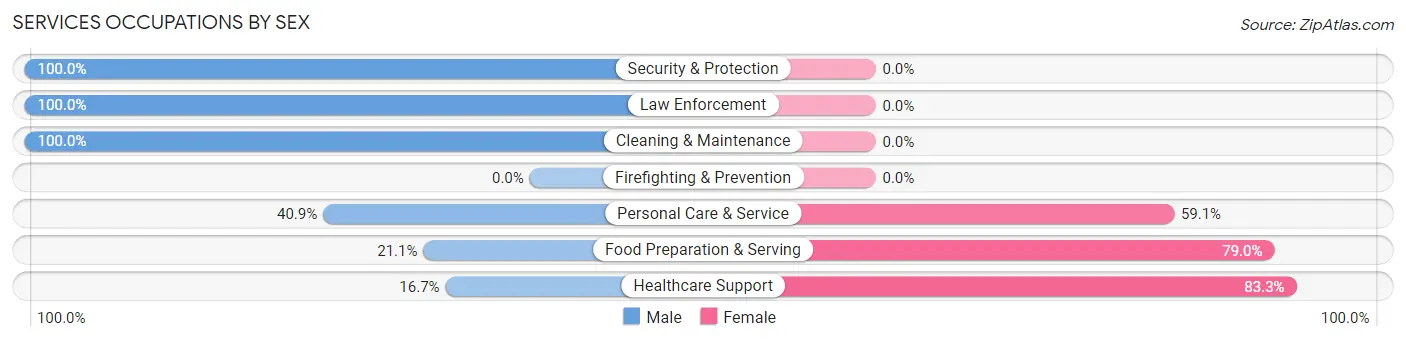
| Occupation | Male | Female |
| Healthcare Support | 3 (16.7%) | 15 (83.3%) |
| Security & Protection | 4 (100.0%) | 0 (0.0%) |
| Firefighting & Prevention | 0 (0.0%) | 0 (0.0%) |
| Law Enforcement | 4 (100.0%) | 0 (0.0%) |
| Food Preparation & Serving | 4 (21.0%) | 15 (78.9%) |
| Cleaning & Maintenance | 42 (100.0%) | 0 (0.0%) |
| Personal Care & Service | 9 (40.9%) | 13 (59.1%) |
| Total (Category) | 62 (59.1%) | 43 (40.9%) |
| Total (Overall) | 388 (62.5%) | 233 (37.5%) |
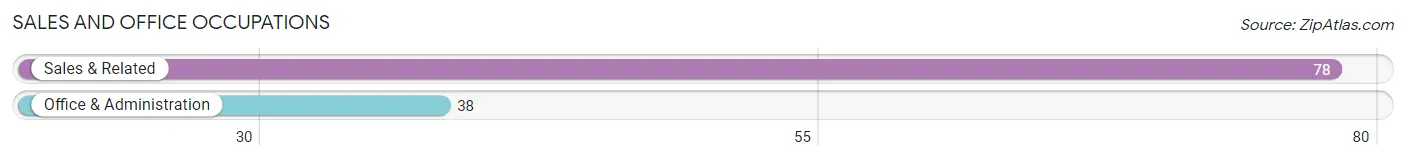
Sales and Office Occupations
The most common Sales and Office occupations in Montrose borough are Sales & Related (78 | 12.6%), and Office & Administration (38 | 6.1%).
Sales and Office Occupations by Sex
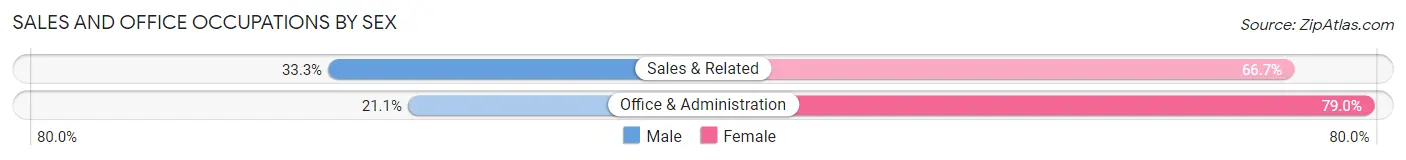
| Occupation | Male | Female |
| Sales & Related | 26 (33.3%) | 52 (66.7%) |
| Office & Administration | 8 (21.0%) | 30 (78.9%) |
| Total (Category) | 34 (29.3%) | 82 (70.7%) |
| Total (Overall) | 388 (62.5%) | 233 (37.5%) |
Natural Resources, Construction and Maintenance Occupations
The most common Natural Resources, Construction and Maintenance occupations in Montrose borough are Installation, Maintenance & Repair (62 | 10.0%), Construction & Extraction (49 | 7.9%), and Farming, Fishing & Forestry (3 | 0.5%).
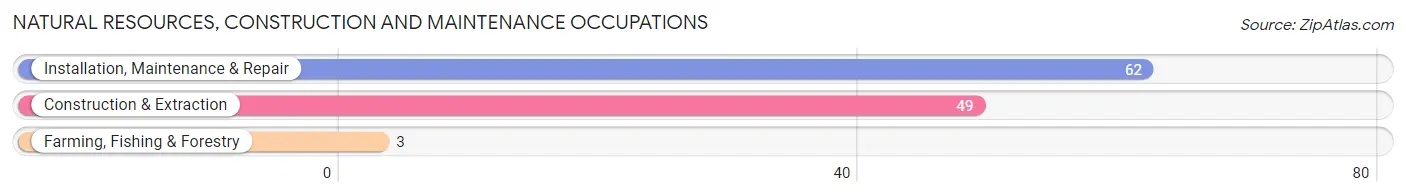
Natural Resources, Construction and Maintenance Occupations by Sex

| Occupation | Male | Female |
| Farming, Fishing & Forestry | 3 (100.0%) | 0 (0.0%) |
| Construction & Extraction | 45 (91.8%) | 4 (8.2%) |
| Installation, Maintenance & Repair | 62 (100.0%) | 0 (0.0%) |
| Total (Category) | 110 (96.5%) | 4 (3.5%) |
| Total (Overall) | 388 (62.5%) | 233 (37.5%) |
Production, Transportation and Moving Occupations
The most common Production, Transportation and Moving occupations in Montrose borough are Production (53 | 8.5%), Transportation (32 | 5.1%), and Material Moving (27 | 4.3%).
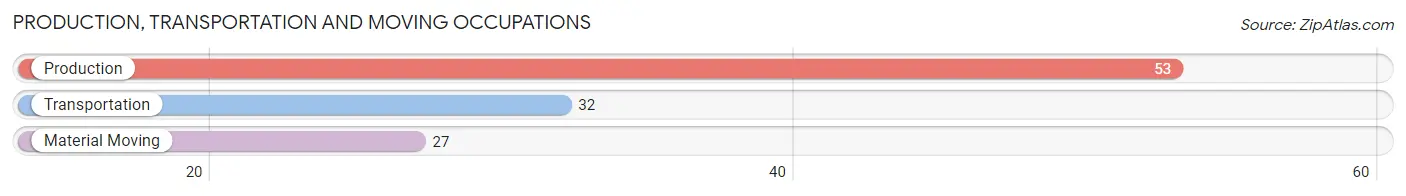
Production, Transportation and Moving Occupations by Sex
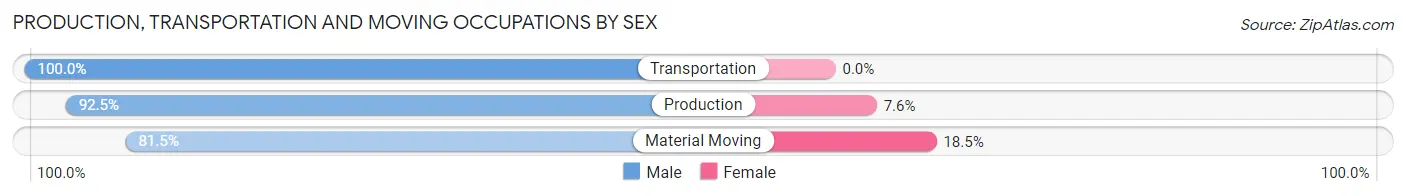
| Occupation | Male | Female |
| Production | 49 (92.4%) | 4 (7.5%) |
| Transportation | 32 (100.0%) | 0 (0.0%) |
| Material Moving | 22 (81.5%) | 5 (18.5%) |
| Total (Category) | 103 (92.0%) | 9 (8.0%) |
| Total (Overall) | 388 (62.5%) | 233 (37.5%) |
Employment Industries by Sex in Montrose borough
Employment Industries in Montrose borough
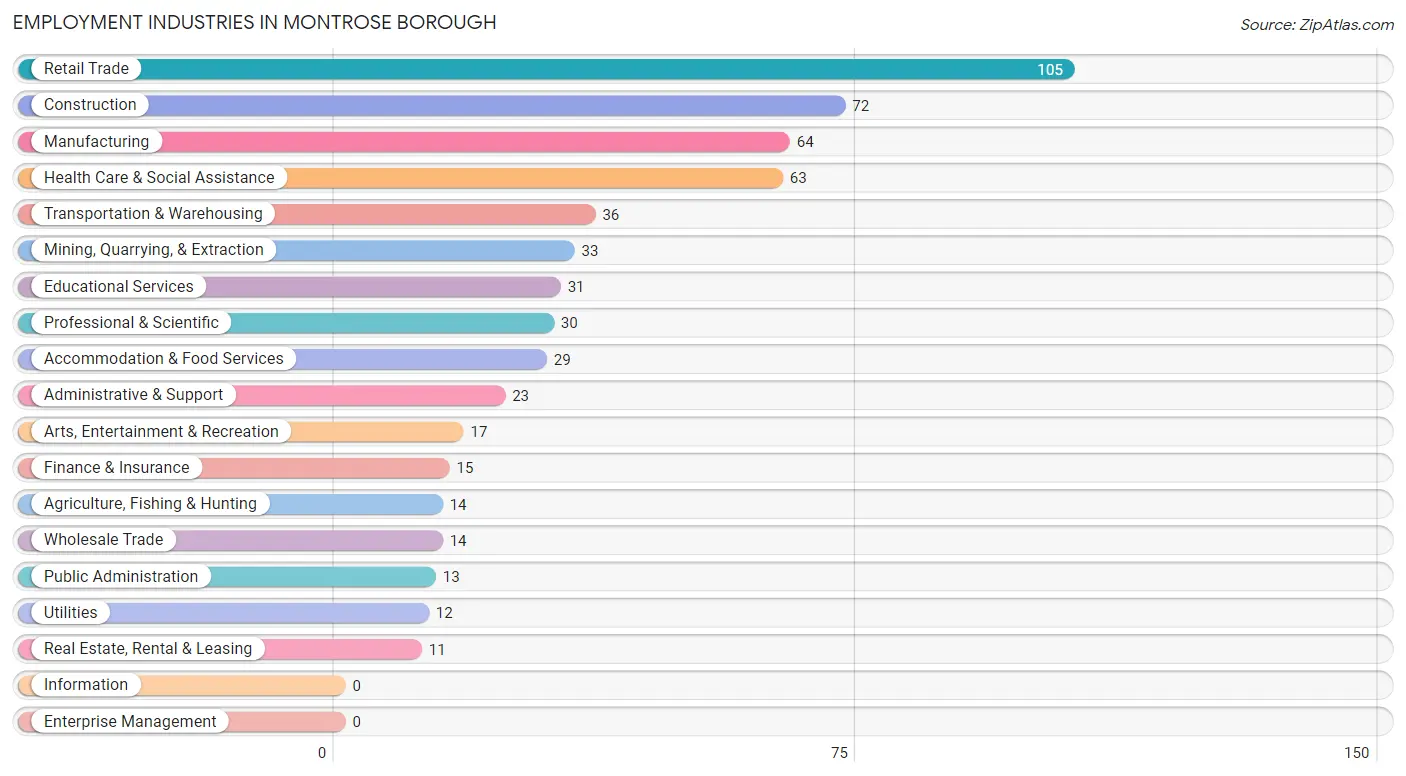
The major employment industries in Montrose borough include Retail Trade (105 | 16.9%), Construction (72 | 11.6%), Manufacturing (64 | 10.3%), Health Care & Social Assistance (63 | 10.1%), and Transportation & Warehousing (36 | 5.8%).
Employment Industries by Sex in Montrose borough
The Montrose borough industries that see more men than women are Mining, Quarrying, & Extraction (100.0%), Utilities (100.0%), and Transportation & Warehousing (94.4%), whereas the industries that tend to have a higher number of women are Health Care & Social Assistance (92.1%), Educational Services (83.9%), and Public Administration (53.8%).

| Industry | Male | Female |
| Agriculture, Fishing & Hunting | 7 (50.0%) | 7 (50.0%) |
| Mining, Quarrying, & Extraction | 33 (100.0%) | 0 (0.0%) |
| Construction | 50 (69.4%) | 22 (30.6%) |
| Manufacturing | 50 (78.1%) | 14 (21.9%) |
| Wholesale Trade | 7 (50.0%) | 7 (50.0%) |
| Retail Trade | 64 (61.0%) | 41 (39.1%) |
| Transportation & Warehousing | 34 (94.4%) | 2 (5.6%) |
| Utilities | 12 (100.0%) | 0 (0.0%) |
| Information | 0 (0.0%) | 0 (0.0%) |
| Finance & Insurance | 11 (73.3%) | 4 (26.7%) |
| Real Estate, Rental & Leasing | 6 (54.5%) | 5 (45.5%) |
| Professional & Scientific | 21 (70.0%) | 9 (30.0%) |
| Enterprise Management | 0 (0.0%) | 0 (0.0%) |
| Administrative & Support | 14 (60.9%) | 9 (39.1%) |
| Educational Services | 5 (16.1%) | 26 (83.9%) |
| Health Care & Social Assistance | 5 (7.9%) | 58 (92.1%) |
| Arts, Entertainment & Recreation | 14 (82.4%) | 3 (17.6%) |
| Accommodation & Food Services | 14 (48.3%) | 15 (51.7%) |
| Public Administration | 6 (46.2%) | 7 (53.8%) |
| Total | 388 (62.5%) | 233 (37.5%) |
Education in Montrose borough
School Enrollment in Montrose borough
The most common levels of schooling among the 293 students in Montrose borough are middle school (87 | 29.7%), elementary school (59 | 20.1%), and high school (58 | 19.8%).
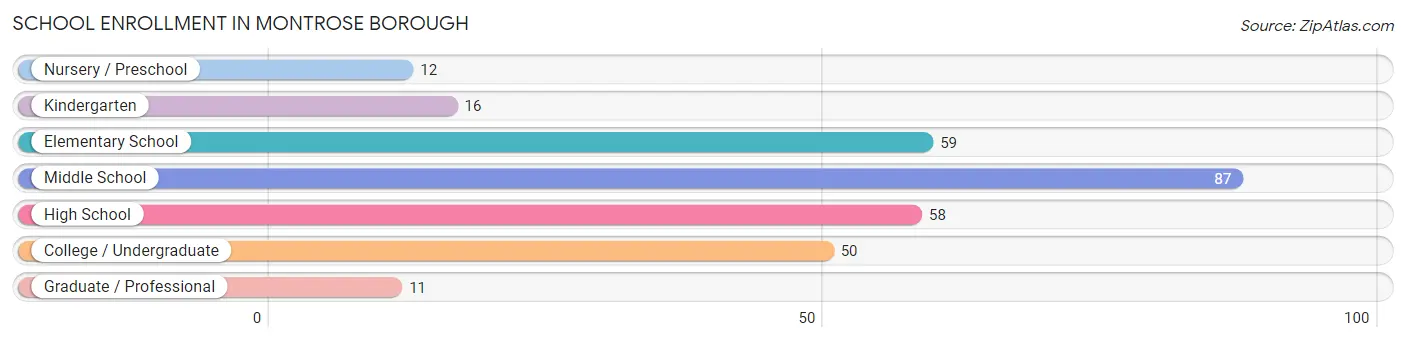
| School Level | # Students | % Students |
| Nursery / Preschool | 12 | 4.1% |
| Kindergarten | 16 | 5.5% |
| Elementary School | 59 | 20.1% |
| Middle School | 87 | 29.7% |
| High School | 58 | 19.8% |
| College / Undergraduate | 50 | 17.1% |
| Graduate / Professional | 11 | 3.7% |
| Total | 293 | 100.0% |
School Enrollment by Age by Funding Source in Montrose borough
Out of a total of 293 students who are enrolled in schools in Montrose borough, 109 (37.2%) attend a private institution, while the remaining 184 (62.8%) are enrolled in public schools. The age group of 20 to 24 year olds has the highest likelihood of being enrolled in private schools, with 17 (100.0% in the age bracket) enrolled. Conversely, the age group of 15 to 17 year olds has the lowest likelihood of being enrolled in a private school, with 51 (94.4% in the age bracket) attending a public institution.
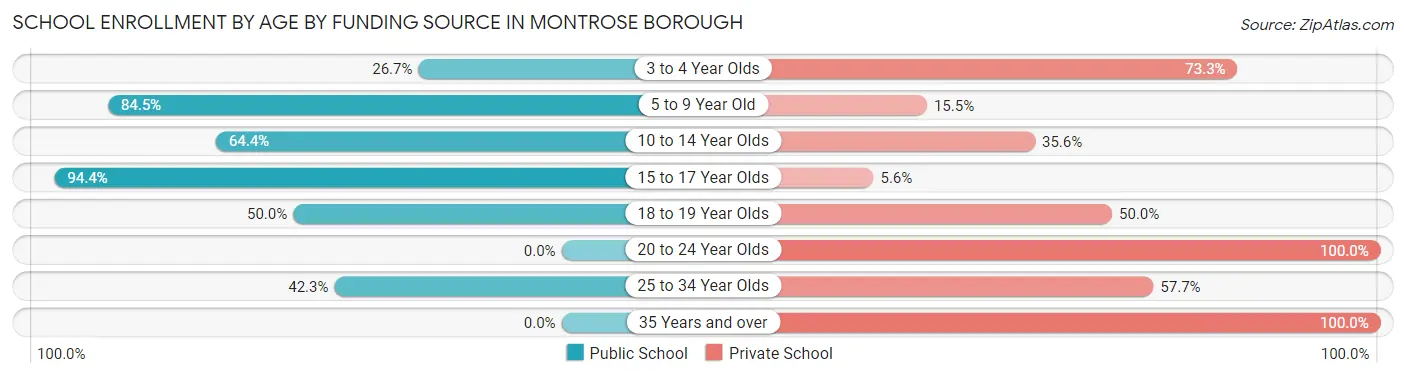
| Age Bracket | Public School | Private School |
| 3 to 4 Year Olds | 4 (26.7%) | 11 (73.3%) |
| 5 to 9 Year Old | 49 (84.5%) | 9 (15.5%) |
| 10 to 14 Year Olds | 65 (64.4%) | 36 (35.6%) |
| 15 to 17 Year Olds | 51 (94.4%) | 3 (5.6%) |
| 18 to 19 Year Olds | 4 (50.0%) | 4 (50.0%) |
| 20 to 24 Year Olds | 0 (0.0%) | 17 (100.0%) |
| 25 to 34 Year Olds | 11 (42.3%) | 15 (57.7%) |
| 35 Years and over | 0 (0.0%) | 14 (100.0%) |
| Total | 184 (62.8%) | 109 (37.2%) |
Educational Attainment by Field of Study in Montrose borough
Education (65 | 29.0%), science & technology (36 | 16.1%), social sciences (29 | 13.0%), liberal arts & history (20 | 8.9%), and arts & humanities (19 | 8.5%) are the most common fields of study among 224 individuals in Montrose borough who have obtained a bachelor's degree or higher.
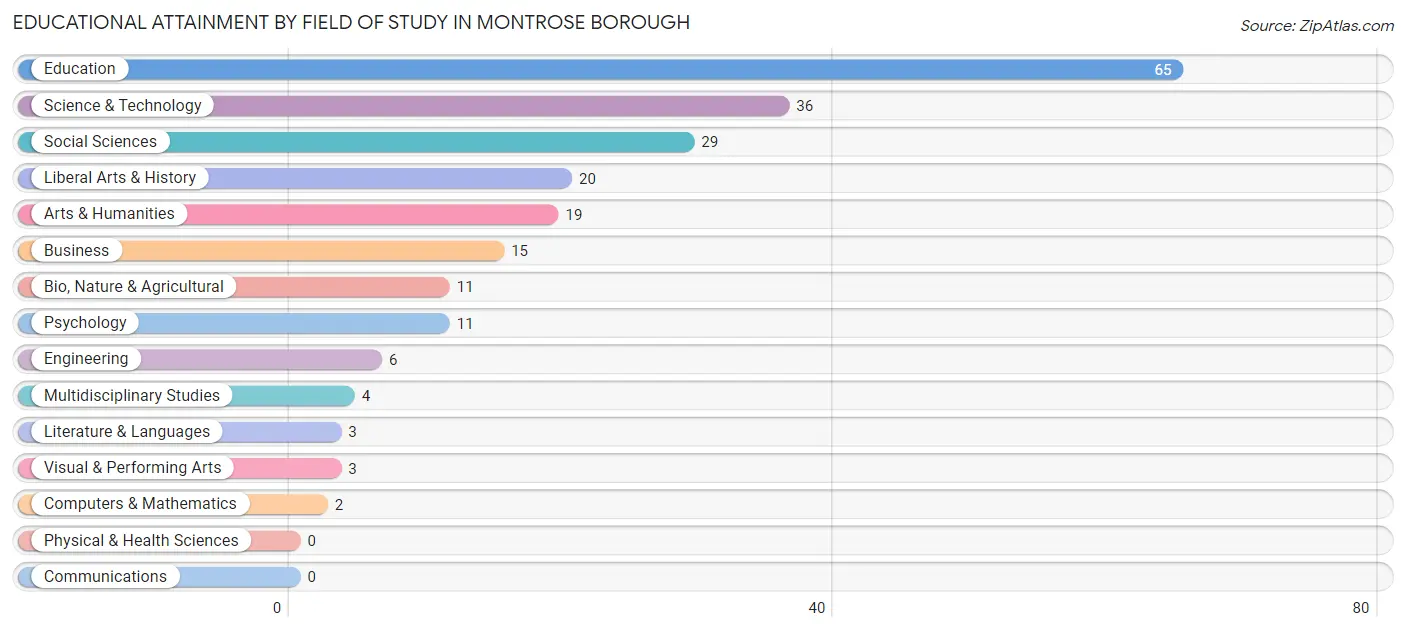
| Field of Study | # Graduates | % Graduates |
| Computers & Mathematics | 2 | 0.9% |
| Bio, Nature & Agricultural | 11 | 4.9% |
| Physical & Health Sciences | 0 | 0.0% |
| Psychology | 11 | 4.9% |
| Social Sciences | 29 | 13.0% |
| Engineering | 6 | 2.7% |
| Multidisciplinary Studies | 4 | 1.8% |
| Science & Technology | 36 | 16.1% |
| Business | 15 | 6.7% |
| Education | 65 | 29.0% |
| Literature & Languages | 3 | 1.3% |
| Liberal Arts & History | 20 | 8.9% |
| Visual & Performing Arts | 3 | 1.3% |
| Communications | 0 | 0.0% |
| Arts & Humanities | 19 | 8.5% |
| Total | 224 | 100.0% |
Transportation & Commute in Montrose borough
Vehicle Availability by Sex in Montrose borough
The most prevalent vehicle ownership categories in Montrose borough are males with 1 vehicle (188, accounting for 49.2%) and females with 1 vehicle (108, making up 81.7%).
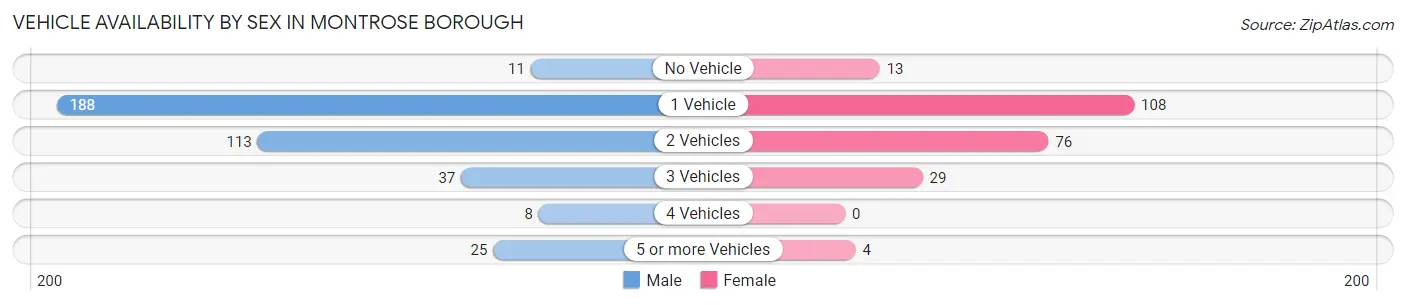
| Vehicles Available | Male | Female |
| No Vehicle | 11 (2.9%) | 13 (5.7%) |
| 1 Vehicle | 188 (49.2%) | 108 (47.0%) |
| 2 Vehicles | 113 (29.6%) | 76 (33.0%) |
| 3 Vehicles | 37 (9.7%) | 29 (12.6%) |
| 4 Vehicles | 8 (2.1%) | 0 (0.0%) |
| 5 or more Vehicles | 25 (6.5%) | 4 (1.7%) |
| Total | 382 (100.0%) | 230 (100.0%) |
Commute Time in Montrose borough
The most frequently occuring commute durations in Montrose borough are 5 to 9 minutes (172 commuters, 32.7%), 15 to 19 minutes (67 commuters, 12.7%), and 10 to 14 minutes (64 commuters, 12.2%).
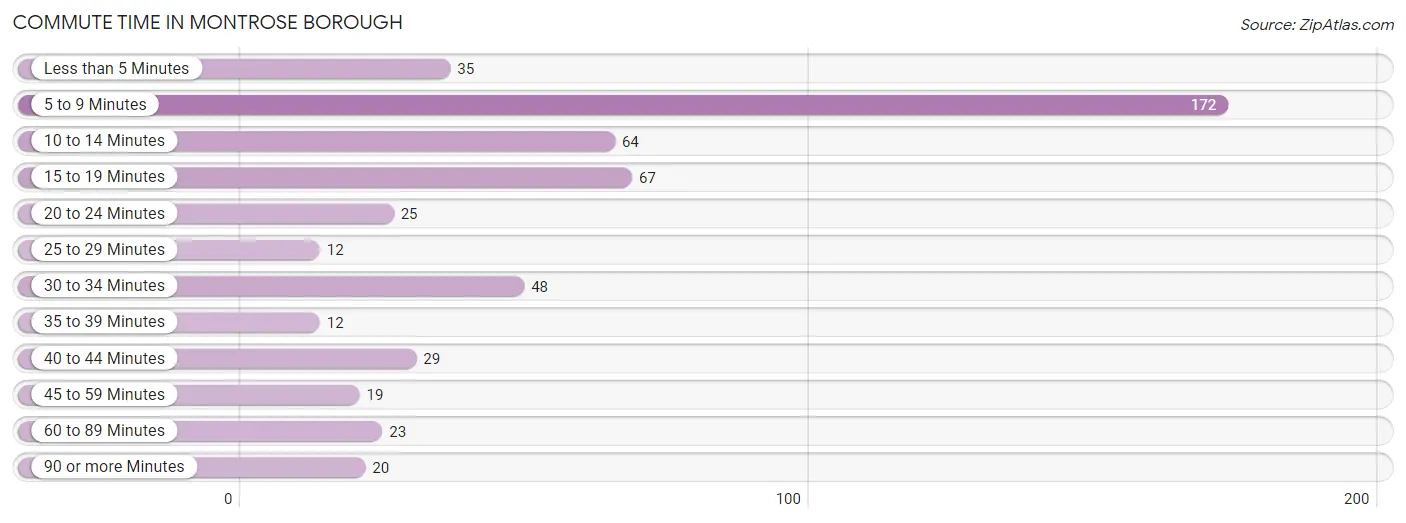
| Commute Time | # Commuters | % Commuters |
| Less than 5 Minutes | 35 | 6.7% |
| 5 to 9 Minutes | 172 | 32.7% |
| 10 to 14 Minutes | 64 | 12.2% |
| 15 to 19 Minutes | 67 | 12.7% |
| 20 to 24 Minutes | 25 | 4.8% |
| 25 to 29 Minutes | 12 | 2.3% |
| 30 to 34 Minutes | 48 | 9.1% |
| 35 to 39 Minutes | 12 | 2.3% |
| 40 to 44 Minutes | 29 | 5.5% |
| 45 to 59 Minutes | 19 | 3.6% |
| 60 to 89 Minutes | 23 | 4.4% |
| 90 or more Minutes | 20 | 3.8% |
Commute Time by Sex in Montrose borough
The most common commute times in Montrose borough are 5 to 9 minutes (99 commuters, 30.7%) for males and 5 to 9 minutes (73 commuters, 35.8%) for females.
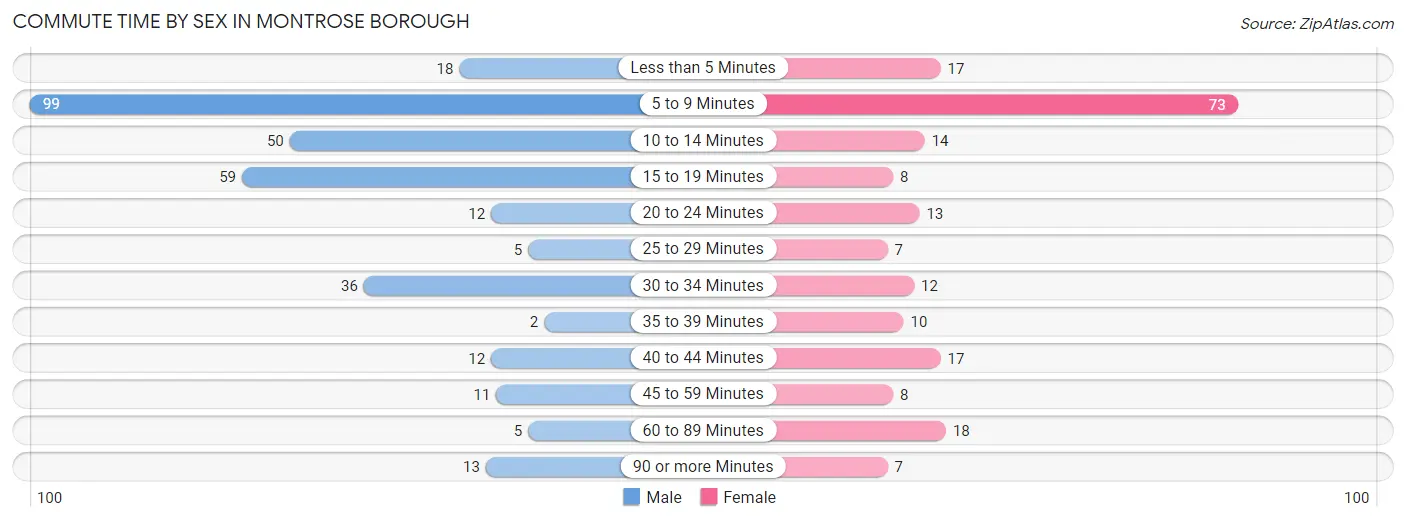
| Commute Time | Male | Female |
| Less than 5 Minutes | 18 (5.6%) | 17 (8.3%) |
| 5 to 9 Minutes | 99 (30.7%) | 73 (35.8%) |
| 10 to 14 Minutes | 50 (15.5%) | 14 (6.9%) |
| 15 to 19 Minutes | 59 (18.3%) | 8 (3.9%) |
| 20 to 24 Minutes | 12 (3.7%) | 13 (6.4%) |
| 25 to 29 Minutes | 5 (1.5%) | 7 (3.4%) |
| 30 to 34 Minutes | 36 (11.2%) | 12 (5.9%) |
| 35 to 39 Minutes | 2 (0.6%) | 10 (4.9%) |
| 40 to 44 Minutes | 12 (3.7%) | 17 (8.3%) |
| 45 to 59 Minutes | 11 (3.4%) | 8 (3.9%) |
| 60 to 89 Minutes | 5 (1.5%) | 18 (8.8%) |
| 90 or more Minutes | 13 (4.0%) | 7 (3.4%) |
Time of Departure to Work by Sex in Montrose borough
The most frequent times of departure to work in Montrose borough are 12:00 AM to 4:59 AM (64, 19.9%) for males and 7:30 AM to 7:59 AM (50, 24.5%) for females.
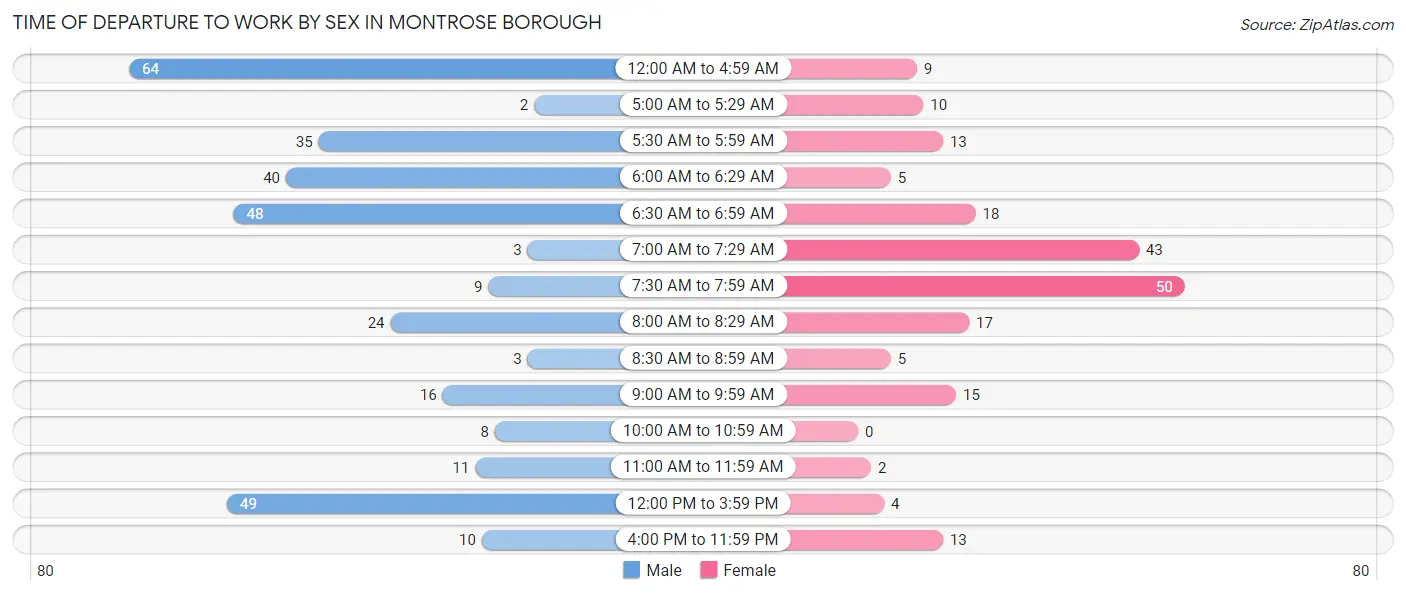
| Time of Departure | Male | Female |
| 12:00 AM to 4:59 AM | 64 (19.9%) | 9 (4.4%) |
| 5:00 AM to 5:29 AM | 2 (0.6%) | 10 (4.9%) |
| 5:30 AM to 5:59 AM | 35 (10.9%) | 13 (6.4%) |
| 6:00 AM to 6:29 AM | 40 (12.4%) | 5 (2.5%) |
| 6:30 AM to 6:59 AM | 48 (14.9%) | 18 (8.8%) |
| 7:00 AM to 7:29 AM | 3 (0.9%) | 43 (21.1%) |
| 7:30 AM to 7:59 AM | 9 (2.8%) | 50 (24.5%) |
| 8:00 AM to 8:29 AM | 24 (7.4%) | 17 (8.3%) |
| 8:30 AM to 8:59 AM | 3 (0.9%) | 5 (2.5%) |
| 9:00 AM to 9:59 AM | 16 (5.0%) | 15 (7.3%) |
| 10:00 AM to 10:59 AM | 8 (2.5%) | 0 (0.0%) |
| 11:00 AM to 11:59 AM | 11 (3.4%) | 2 (1.0%) |
| 12:00 PM to 3:59 PM | 49 (15.2%) | 4 (2.0%) |
| 4:00 PM to 11:59 PM | 10 (3.1%) | 13 (6.4%) |
| Total | 322 (100.0%) | 204 (100.0%) |
Housing Occupancy in Montrose borough
Occupancy by Ownership in Montrose borough
Of the total 616 dwellings in Montrose borough, owner-occupied units account for 316 (51.3%), while renter-occupied units make up 300 (48.7%).
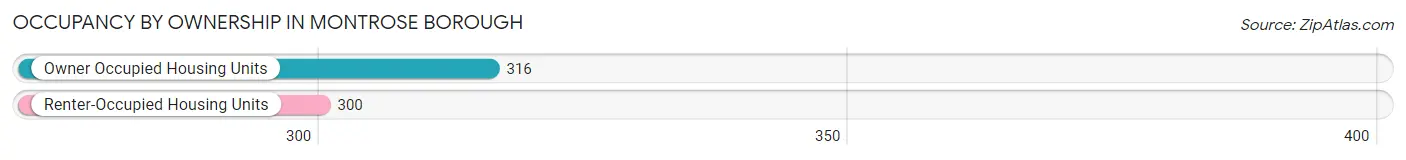
| Occupancy | # Housing Units | % Housing Units |
| Owner Occupied Housing Units | 316 | 51.3% |
| Renter-Occupied Housing Units | 300 | 48.7% |
| Total Occupied Housing Units | 616 | 100.0% |
Occupancy by Household Size in Montrose borough
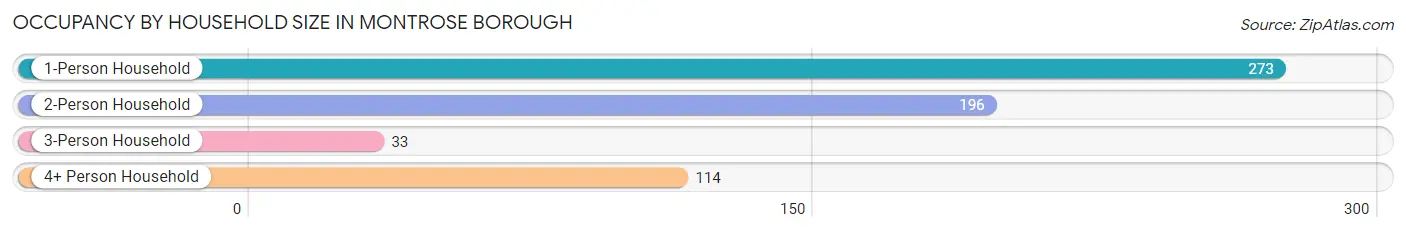
| Household Size | # Housing Units | % Housing Units |
| 1-Person Household | 273 | 44.3% |
| 2-Person Household | 196 | 31.8% |
| 3-Person Household | 33 | 5.4% |
| 4+ Person Household | 114 | 18.5% |
| Total Housing Units | 616 | 100.0% |
Occupancy by Ownership by Household Size in Montrose borough
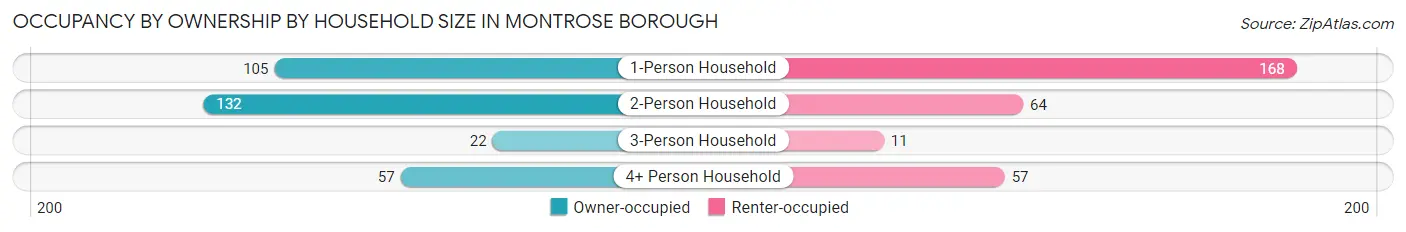
| Household Size | Owner-occupied | Renter-occupied |
| 1-Person Household | 105 (38.5%) | 168 (61.5%) |
| 2-Person Household | 132 (67.3%) | 64 (32.7%) |
| 3-Person Household | 22 (66.7%) | 11 (33.3%) |
| 4+ Person Household | 57 (50.0%) | 57 (50.0%) |
| Total Housing Units | 316 (51.3%) | 300 (48.7%) |
Occupancy by Educational Attainment in Montrose borough
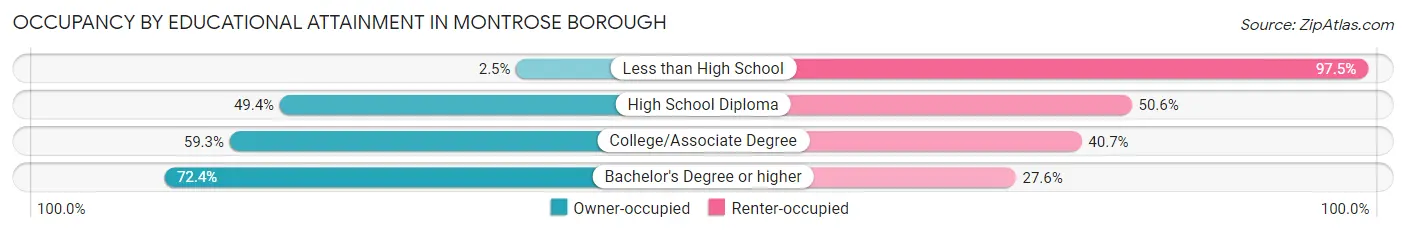
| Household Size | Owner-occupied | Renter-occupied |
| Less than High School | 2 (2.5%) | 78 (97.5%) |
| High School Diploma | 118 (49.4%) | 121 (50.6%) |
| College/Associate Degree | 86 (59.3%) | 59 (40.7%) |
| Bachelor's Degree or higher | 110 (72.4%) | 42 (27.6%) |
Occupancy by Age of Householder in Montrose borough
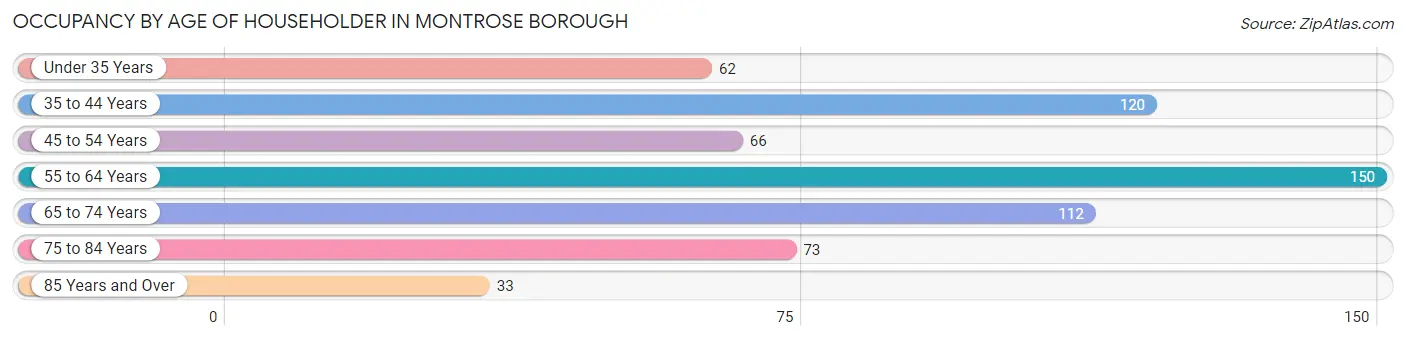
| Age Bracket | # Households | % Households |
| Under 35 Years | 62 | 10.1% |
| 35 to 44 Years | 120 | 19.5% |
| 45 to 54 Years | 66 | 10.7% |
| 55 to 64 Years | 150 | 24.3% |
| 65 to 74 Years | 112 | 18.2% |
| 75 to 84 Years | 73 | 11.8% |
| 85 Years and Over | 33 | 5.4% |
| Total | 616 | 100.0% |
Housing Finances in Montrose borough
Median Income by Occupancy in Montrose borough
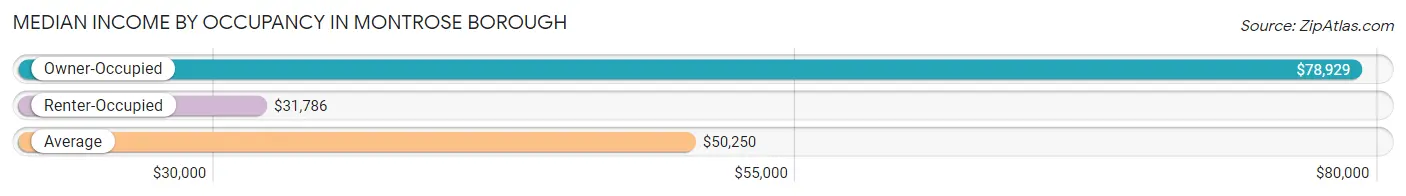
| Occupancy Type | # Households | Median Income |
| Owner-Occupied | 316 (51.3%) | $78,929 |
| Renter-Occupied | 300 (48.7%) | $31,786 |
| Average | 616 (100.0%) | $50,250 |
Occupancy by Householder Income Bracket in Montrose borough
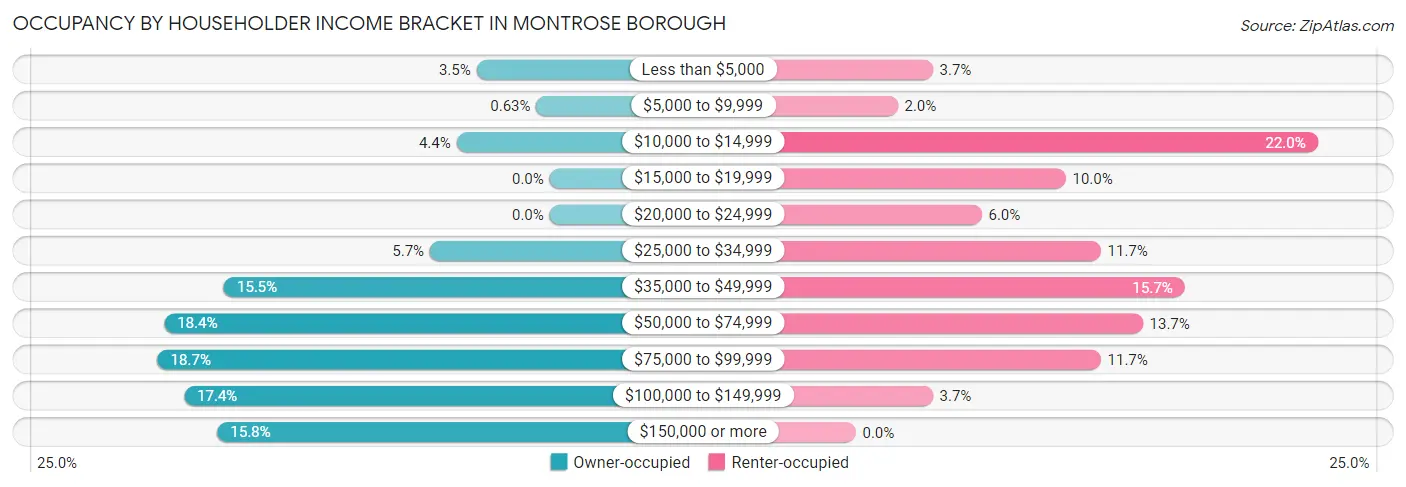
| Income Bracket | Owner-occupied | Renter-occupied |
| Less than $5,000 | 11 (3.5%) | 11 (3.7%) |
| $5,000 to $9,999 | 2 (0.6%) | 6 (2.0%) |
| $10,000 to $14,999 | 14 (4.4%) | 66 (22.0%) |
| $15,000 to $19,999 | 0 (0.0%) | 30 (10.0%) |
| $20,000 to $24,999 | 0 (0.0%) | 18 (6.0%) |
| $25,000 to $34,999 | 18 (5.7%) | 35 (11.7%) |
| $35,000 to $49,999 | 49 (15.5%) | 47 (15.7%) |
| $50,000 to $74,999 | 58 (18.3%) | 41 (13.7%) |
| $75,000 to $99,999 | 59 (18.7%) | 35 (11.7%) |
| $100,000 to $149,999 | 55 (17.4%) | 11 (3.7%) |
| $150,000 or more | 50 (15.8%) | 0 (0.0%) |
| Total | 316 (100.0%) | 300 (100.0%) |
Monthly Housing Cost Tiers in Montrose borough
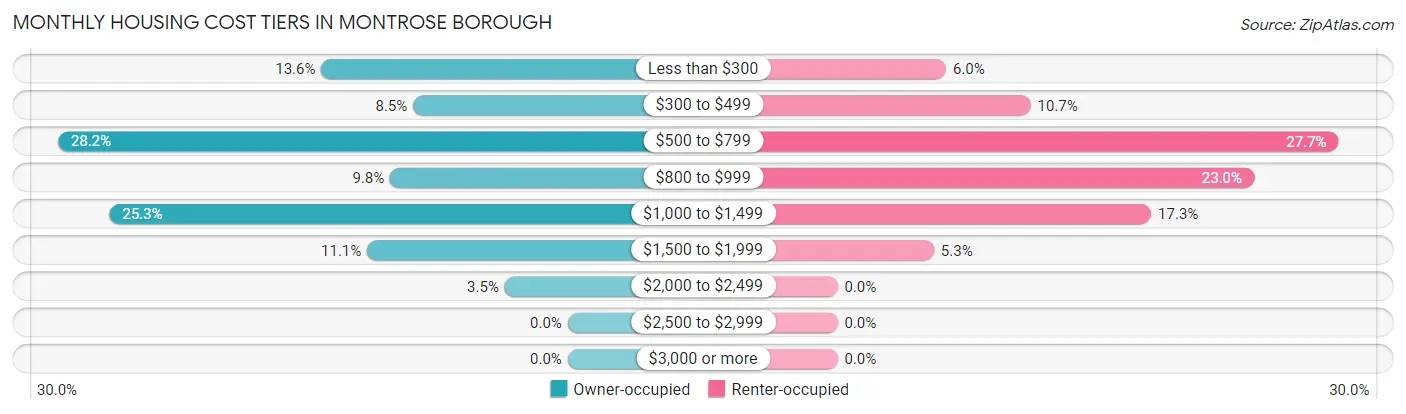
| Monthly Cost | Owner-occupied | Renter-occupied |
| Less than $300 | 43 (13.6%) | 18 (6.0%) |
| $300 to $499 | 27 (8.5%) | 32 (10.7%) |
| $500 to $799 | 89 (28.2%) | 83 (27.7%) |
| $800 to $999 | 31 (9.8%) | 69 (23.0%) |
| $1,000 to $1,499 | 80 (25.3%) | 52 (17.3%) |
| $1,500 to $1,999 | 35 (11.1%) | 16 (5.3%) |
| $2,000 to $2,499 | 11 (3.5%) | 0 (0.0%) |
| $2,500 to $2,999 | 0 (0.0%) | 0 (0.0%) |
| $3,000 or more | 0 (0.0%) | 0 (0.0%) |
| Total | 316 (100.0%) | 300 (100.0%) |
Physical Housing Characteristics in Montrose borough
Housing Structures in Montrose borough
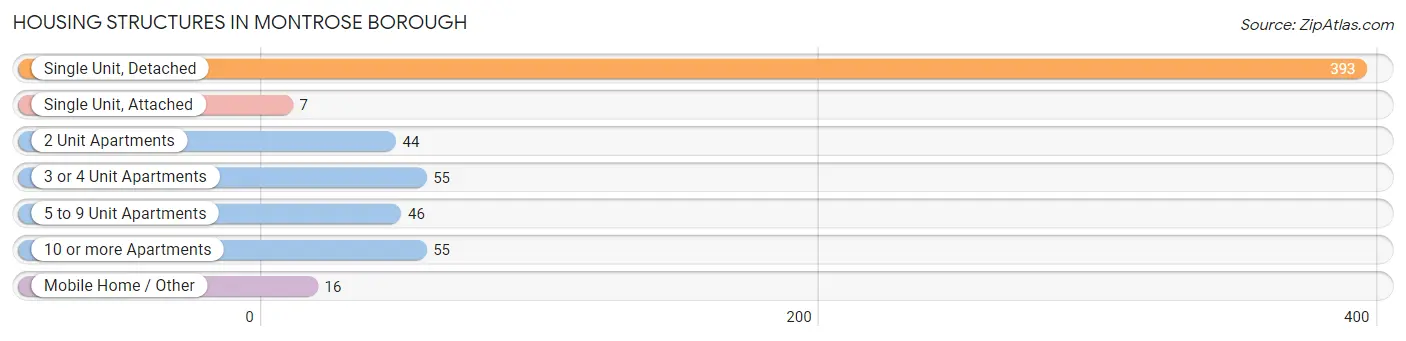
| Structure Type | # Housing Units | % Housing Units |
| Single Unit, Detached | 393 | 63.8% |
| Single Unit, Attached | 7 | 1.1% |
| 2 Unit Apartments | 44 | 7.1% |
| 3 or 4 Unit Apartments | 55 | 8.9% |
| 5 to 9 Unit Apartments | 46 | 7.5% |
| 10 or more Apartments | 55 | 8.9% |
| Mobile Home / Other | 16 | 2.6% |
| Total | 616 | 100.0% |
Housing Structures by Occupancy in Montrose borough
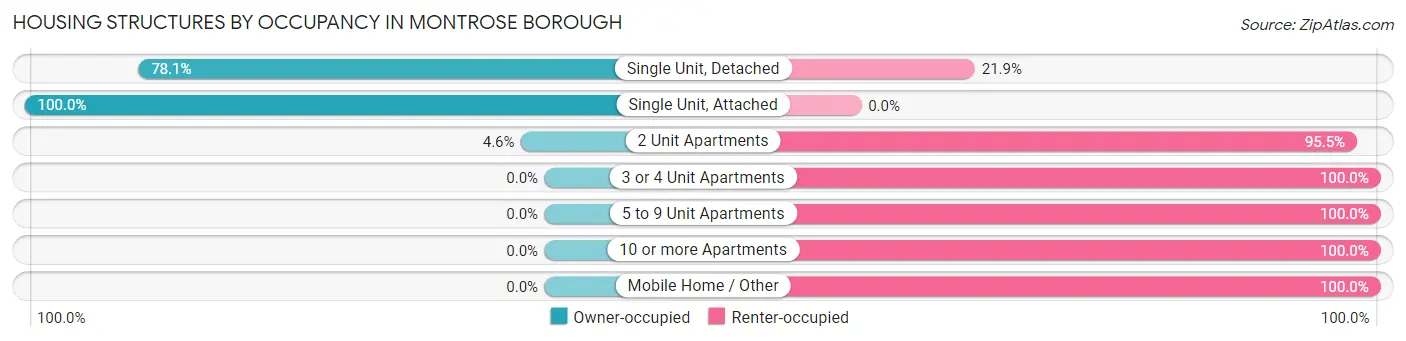
| Structure Type | Owner-occupied | Renter-occupied |
| Single Unit, Detached | 307 (78.1%) | 86 (21.9%) |
| Single Unit, Attached | 7 (100.0%) | 0 (0.0%) |
| 2 Unit Apartments | 2 (4.5%) | 42 (95.5%) |
| 3 or 4 Unit Apartments | 0 (0.0%) | 55 (100.0%) |
| 5 to 9 Unit Apartments | 0 (0.0%) | 46 (100.0%) |
| 10 or more Apartments | 0 (0.0%) | 55 (100.0%) |
| Mobile Home / Other | 0 (0.0%) | 16 (100.0%) |
| Total | 316 (51.3%) | 300 (48.7%) |
Housing Structures by Number of Rooms in Montrose borough
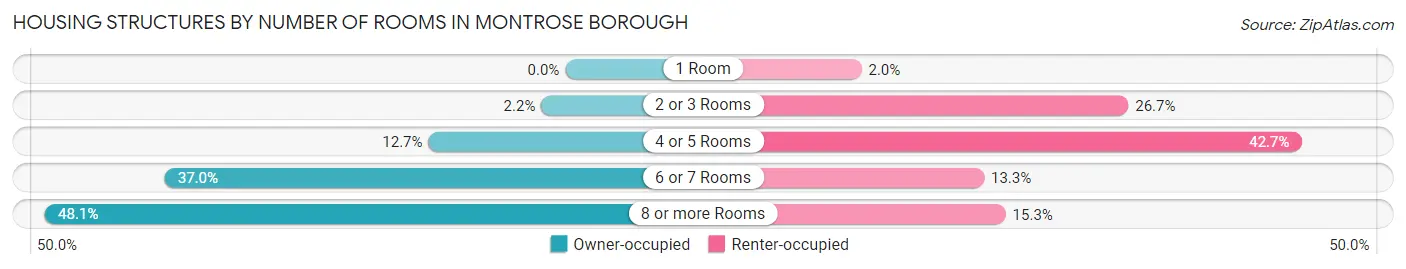
| Number of Rooms | Owner-occupied | Renter-occupied |
| 1 Room | 0 (0.0%) | 6 (2.0%) |
| 2 or 3 Rooms | 7 (2.2%) | 80 (26.7%) |
| 4 or 5 Rooms | 40 (12.7%) | 128 (42.7%) |
| 6 or 7 Rooms | 117 (37.0%) | 40 (13.3%) |
| 8 or more Rooms | 152 (48.1%) | 46 (15.3%) |
| Total | 316 (100.0%) | 300 (100.0%) |
Housing Structure by Heating Type in Montrose borough
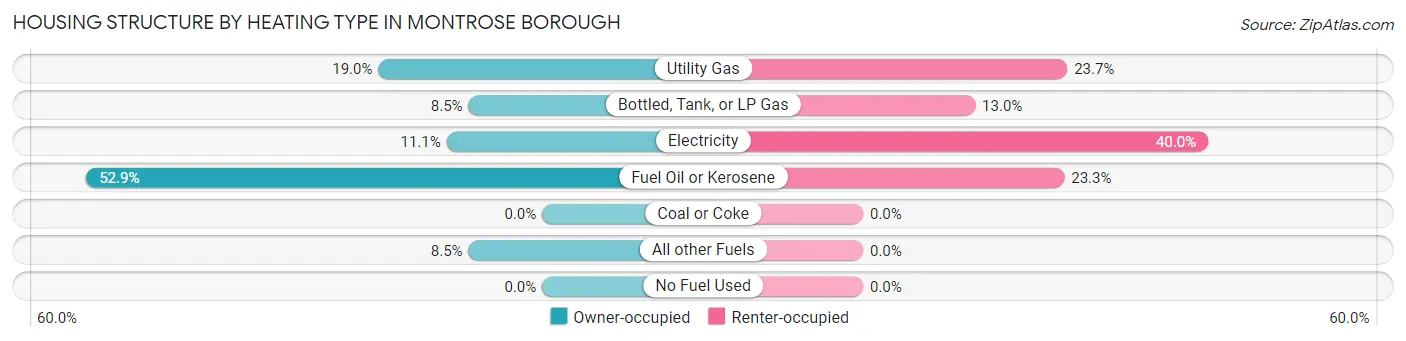
| Heating Type | Owner-occupied | Renter-occupied |
| Utility Gas | 60 (19.0%) | 71 (23.7%) |
| Bottled, Tank, or LP Gas | 27 (8.5%) | 39 (13.0%) |
| Electricity | 35 (11.1%) | 120 (40.0%) |
| Fuel Oil or Kerosene | 167 (52.8%) | 70 (23.3%) |
| Coal or Coke | 0 (0.0%) | 0 (0.0%) |
| All other Fuels | 27 (8.5%) | 0 (0.0%) |
| No Fuel Used | 0 (0.0%) | 0 (0.0%) |
| Total | 316 (100.0%) | 300 (100.0%) |
Household Vehicle Usage in Montrose borough
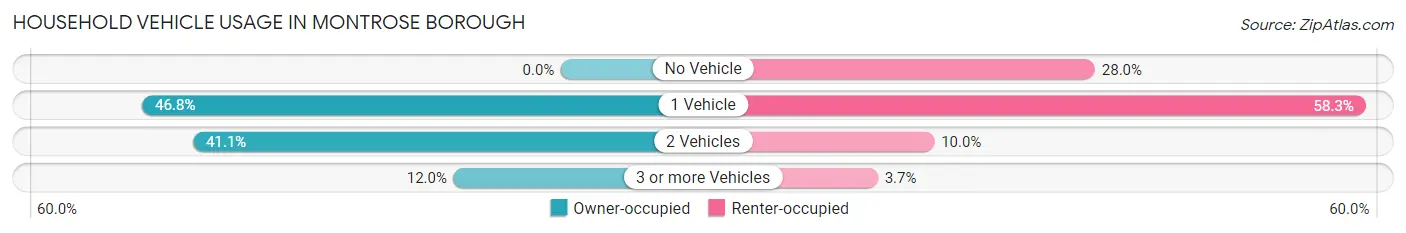
| Vehicles per Household | Owner-occupied | Renter-occupied |
| No Vehicle | 0 (0.0%) | 84 (28.0%) |
| 1 Vehicle | 148 (46.8%) | 175 (58.3%) |
| 2 Vehicles | 130 (41.1%) | 30 (10.0%) |
| 3 or more Vehicles | 38 (12.0%) | 11 (3.7%) |
| Total | 316 (100.0%) | 300 (100.0%) |
Real Estate & Mortgages in Montrose borough
Real Estate and Mortgage Overview in Montrose borough
| Characteristic | Without Mortgage | With Mortgage |
| Housing Units | 147 | 169 |
| Median Property Value | $106,700 | $159,600 |
| Median Household Income | $80,795 | $24 |
| Monthly Housing Costs | $513 | $0 |
| Real Estate Taxes | $1,800 | $0 |
Property Value by Mortgage Status in Montrose borough
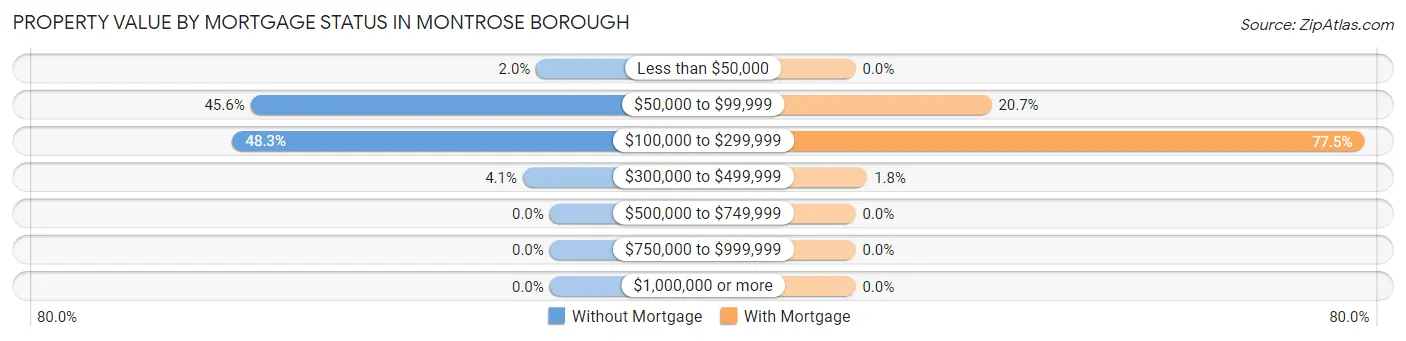
| Property Value | Without Mortgage | With Mortgage |
| Less than $50,000 | 3 (2.0%) | 0 (0.0%) |
| $50,000 to $99,999 | 67 (45.6%) | 35 (20.7%) |
| $100,000 to $299,999 | 71 (48.3%) | 131 (77.5%) |
| $300,000 to $499,999 | 6 (4.1%) | 3 (1.8%) |
| $500,000 to $749,999 | 0 (0.0%) | 0 (0.0%) |
| $750,000 to $999,999 | 0 (0.0%) | 0 (0.0%) |
| $1,000,000 or more | 0 (0.0%) | 0 (0.0%) |
| Total | 147 (100.0%) | 169 (100.0%) |
Household Income by Mortgage Status in Montrose borough
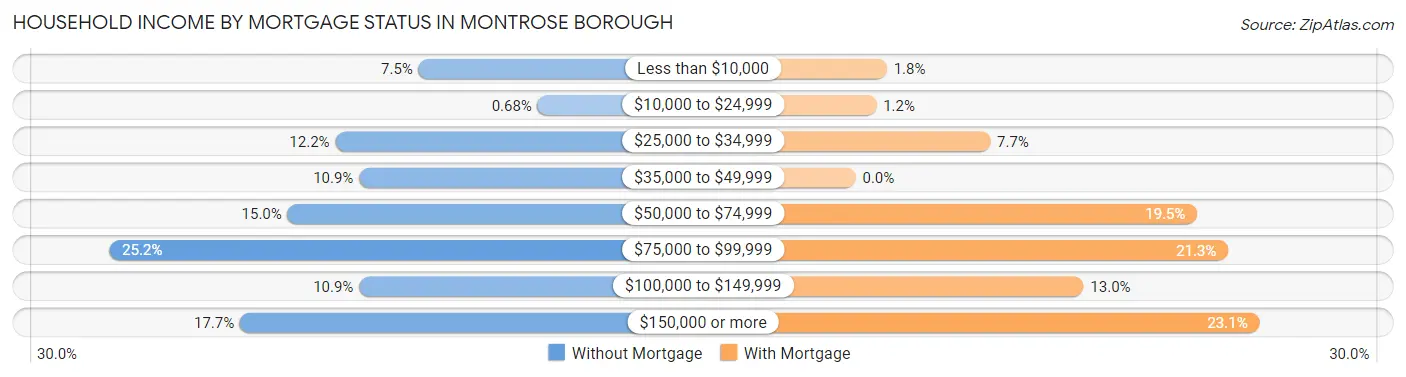
| Household Income | Without Mortgage | With Mortgage |
| Less than $10,000 | 11 (7.5%) | 3 (1.8%) |
| $10,000 to $24,999 | 1 (0.7%) | 2 (1.2%) |
| $25,000 to $34,999 | 18 (12.2%) | 13 (7.7%) |
| $35,000 to $49,999 | 16 (10.9%) | 0 (0.0%) |
| $50,000 to $74,999 | 22 (15.0%) | 33 (19.5%) |
| $75,000 to $99,999 | 37 (25.2%) | 36 (21.3%) |
| $100,000 to $149,999 | 16 (10.9%) | 22 (13.0%) |
| $150,000 or more | 26 (17.7%) | 39 (23.1%) |
| Total | 147 (100.0%) | 169 (100.0%) |
Property Value to Household Income Ratio in Montrose borough
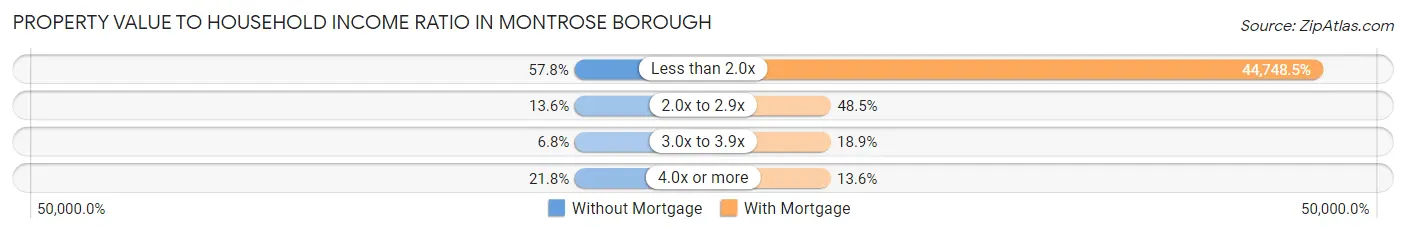
| Value-to-Income Ratio | Without Mortgage | With Mortgage |
| Less than 2.0x | 85 (57.8%) | 75,625 (44,748.5%) |
| 2.0x to 2.9x | 20 (13.6%) | 82 (48.5%) |
| 3.0x to 3.9x | 10 (6.8%) | 32 (18.9%) |
| 4.0x or more | 32 (21.8%) | 23 (13.6%) |
| Total | 147 (100.0%) | 169 (100.0%) |
Real Estate Taxes by Mortgage Status in Montrose borough
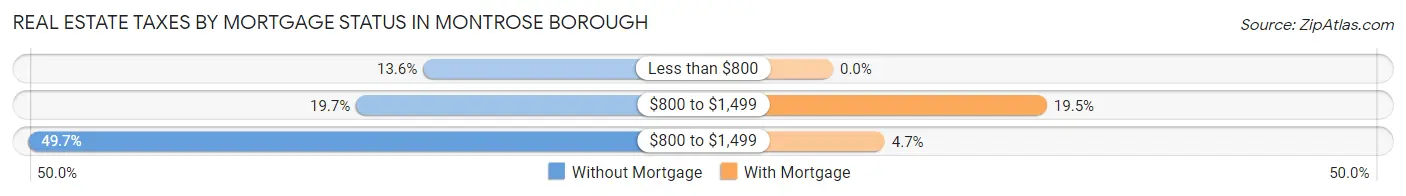
| Property Taxes | Without Mortgage | With Mortgage |
| Less than $800 | 20 (13.6%) | 0 (0.0%) |
| $800 to $1,499 | 29 (19.7%) | 33 (19.5%) |
| $800 to $1,499 | 73 (49.7%) | 8 (4.7%) |
| Total | 147 (100.0%) | 169 (100.0%) |
Health & Disability in Montrose borough
Health Insurance Coverage by Age in Montrose borough
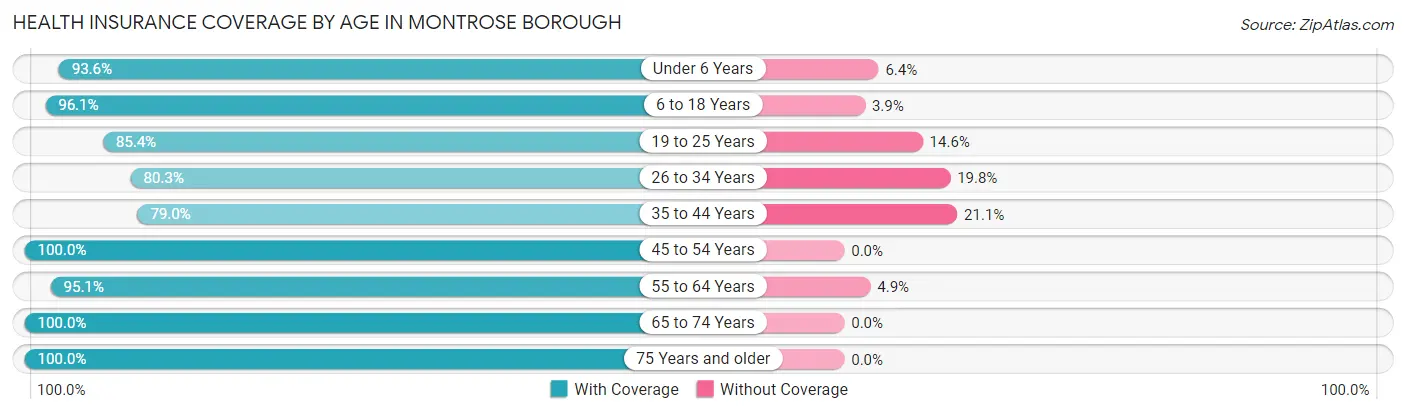
| Age Bracket | With Coverage | Without Coverage |
| Under 6 Years | 44 (93.6%) | 3 (6.4%) |
| 6 to 18 Years | 224 (96.1%) | 9 (3.9%) |
| 19 to 25 Years | 76 (85.4%) | 13 (14.6%) |
| 26 to 34 Years | 130 (80.2%) | 32 (19.8%) |
| 35 to 44 Years | 150 (78.9%) | 40 (21.0%) |
| 45 to 54 Years | 109 (100.0%) | 0 (0.0%) |
| 55 to 64 Years | 235 (95.1%) | 12 (4.9%) |
| 65 to 74 Years | 164 (100.0%) | 0 (0.0%) |
| 75 Years and older | 155 (100.0%) | 0 (0.0%) |
| Total | 1,287 (92.2%) | 109 (7.8%) |
Health Insurance Coverage by Citizenship Status in Montrose borough
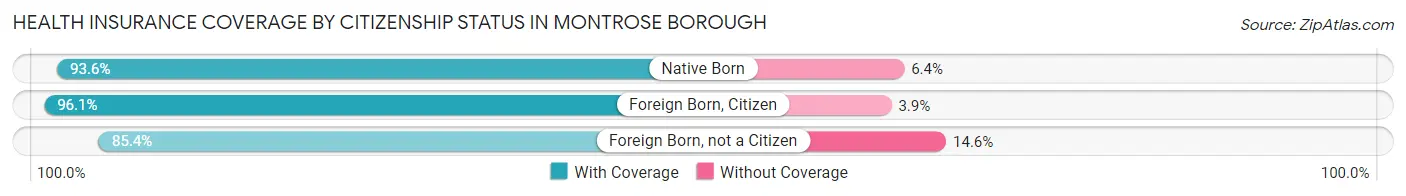
| Citizenship Status | With Coverage | Without Coverage |
| Native Born | 44 (93.6%) | 3 (6.4%) |
| Foreign Born, Citizen | 224 (96.1%) | 9 (3.9%) |
| Foreign Born, not a Citizen | 76 (85.4%) | 13 (14.6%) |
Health Insurance Coverage by Household Income in Montrose borough
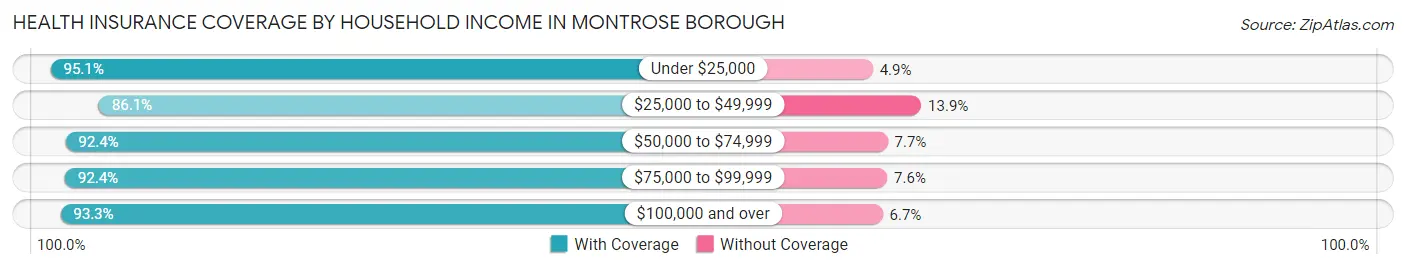
| Household Income | With Coverage | Without Coverage |
| Under $25,000 | 333 (95.1%) | 17 (4.9%) |
| $25,000 to $49,999 | 210 (86.1%) | 34 (13.9%) |
| $50,000 to $74,999 | 169 (92.3%) | 14 (7.6%) |
| $75,000 to $99,999 | 269 (92.4%) | 22 (7.6%) |
| $100,000 and over | 306 (93.3%) | 22 (6.7%) |
Public vs Private Health Insurance Coverage by Age in Montrose borough
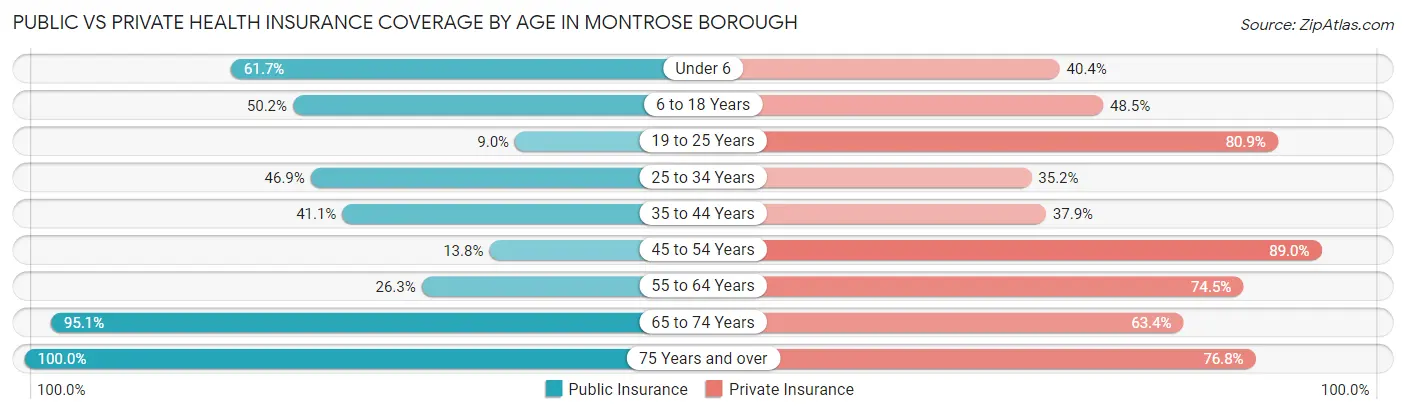
| Age Bracket | Public Insurance | Private Insurance |
| Under 6 | 29 (61.7%) | 19 (40.4%) |
| 6 to 18 Years | 117 (50.2%) | 113 (48.5%) |
| 19 to 25 Years | 8 (9.0%) | 72 (80.9%) |
| 25 to 34 Years | 76 (46.9%) | 57 (35.2%) |
| 35 to 44 Years | 78 (41.0%) | 72 (37.9%) |
| 45 to 54 Years | 15 (13.8%) | 97 (89.0%) |
| 55 to 64 Years | 65 (26.3%) | 184 (74.5%) |
| 65 to 74 Years | 156 (95.1%) | 104 (63.4%) |
| 75 Years and over | 155 (100.0%) | 119 (76.8%) |
| Total | 699 (50.1%) | 837 (60.0%) |
Disability Status by Sex by Age in Montrose borough
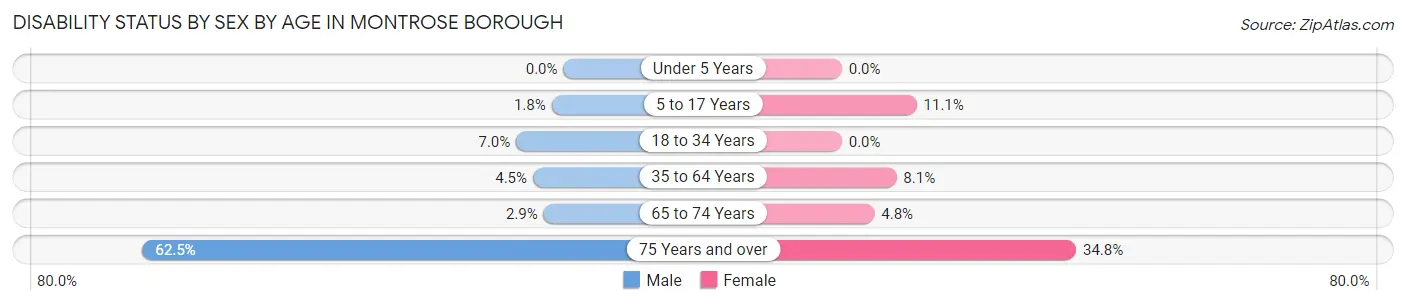
| Age Bracket | Male | Female |
| Under 5 Years | 0 (0.0%) | 0 (0.0%) |
| 5 to 17 Years | 2 (1.8%) | 13 (11.1%) |
| 18 to 34 Years | 11 (7.0%) | 0 (0.0%) |
| 35 to 64 Years | 13 (4.5%) | 21 (8.1%) |
| 65 to 74 Years | 3 (2.9%) | 3 (4.8%) |
| 75 Years and over | 25 (62.5%) | 40 (34.8%) |
Disability Class by Sex by Age in Montrose borough
Disability Class: Hearing Difficulty
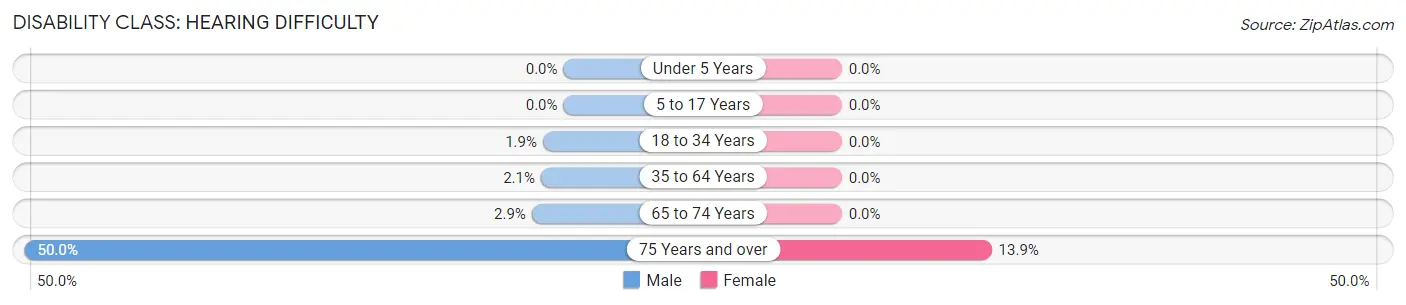
| Age Bracket | Male | Female |
| Under 5 Years | 0 (0.0%) | 0 (0.0%) |
| 5 to 17 Years | 0 (0.0%) | 0 (0.0%) |
| 18 to 34 Years | 3 (1.9%) | 0 (0.0%) |
| 35 to 64 Years | 6 (2.1%) | 0 (0.0%) |
| 65 to 74 Years | 3 (2.9%) | 0 (0.0%) |
| 75 Years and over | 20 (50.0%) | 16 (13.9%) |
Disability Class: Vision Difficulty
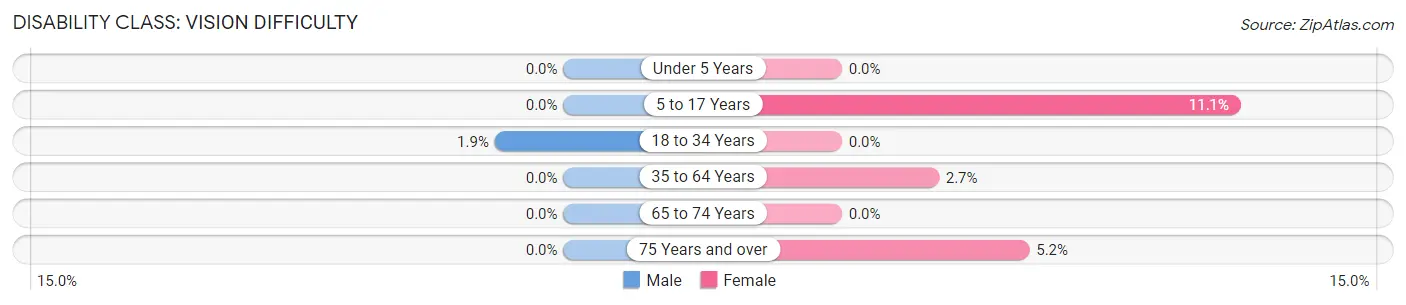
| Age Bracket | Male | Female |
| Under 5 Years | 0 (0.0%) | 0 (0.0%) |
| 5 to 17 Years | 0 (0.0%) | 13 (11.1%) |
| 18 to 34 Years | 3 (1.9%) | 0 (0.0%) |
| 35 to 64 Years | 0 (0.0%) | 7 (2.7%) |
| 65 to 74 Years | 0 (0.0%) | 0 (0.0%) |
| 75 Years and over | 0 (0.0%) | 6 (5.2%) |
Disability Class: Cognitive Difficulty
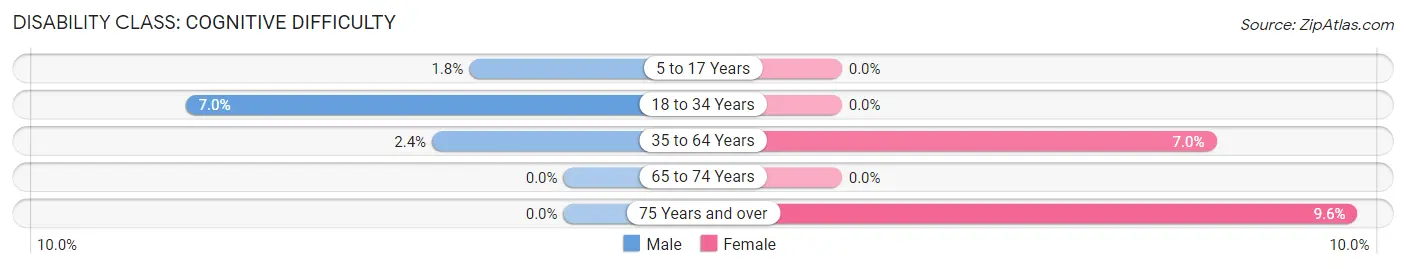
| Age Bracket | Male | Female |
| 5 to 17 Years | 2 (1.8%) | 0 (0.0%) |
| 18 to 34 Years | 11 (7.0%) | 0 (0.0%) |
| 35 to 64 Years | 7 (2.4%) | 18 (7.0%) |
| 65 to 74 Years | 0 (0.0%) | 0 (0.0%) |
| 75 Years and over | 0 (0.0%) | 11 (9.6%) |
Disability Class: Ambulatory Difficulty
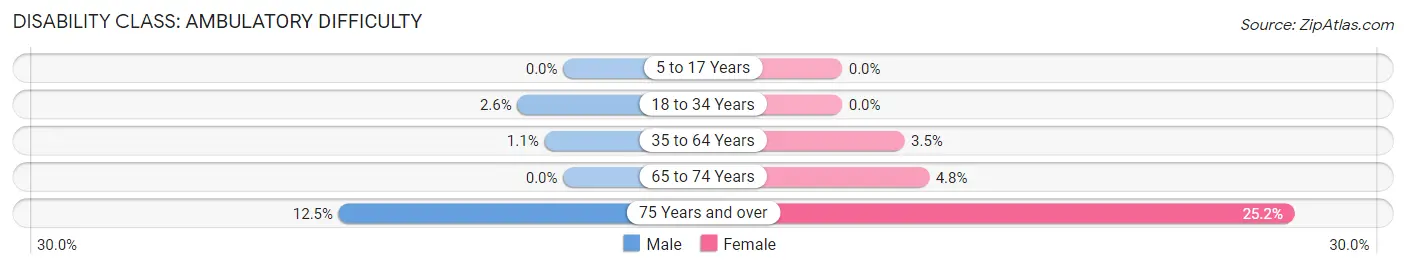
| Age Bracket | Male | Female |
| 5 to 17 Years | 0 (0.0%) | 0 (0.0%) |
| 18 to 34 Years | 4 (2.5%) | 0 (0.0%) |
| 35 to 64 Years | 3 (1.1%) | 9 (3.5%) |
| 65 to 74 Years | 0 (0.0%) | 3 (4.8%) |
| 75 Years and over | 5 (12.5%) | 29 (25.2%) |
Disability Class: Self-Care Difficulty
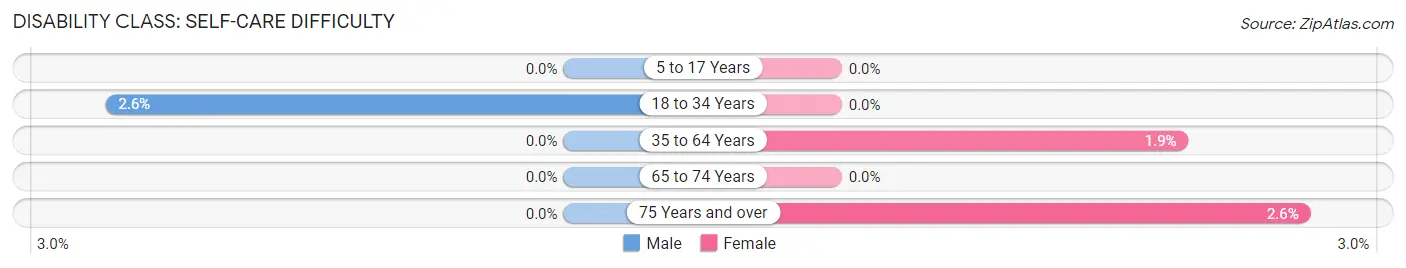
| Age Bracket | Male | Female |
| 5 to 17 Years | 0 (0.0%) | 0 (0.0%) |
| 18 to 34 Years | 4 (2.5%) | 0 (0.0%) |
| 35 to 64 Years | 0 (0.0%) | 5 (1.9%) |
| 65 to 74 Years | 0 (0.0%) | 0 (0.0%) |
| 75 Years and over | 0 (0.0%) | 3 (2.6%) |
Technology Access in Montrose borough
Computing Device Access in Montrose borough
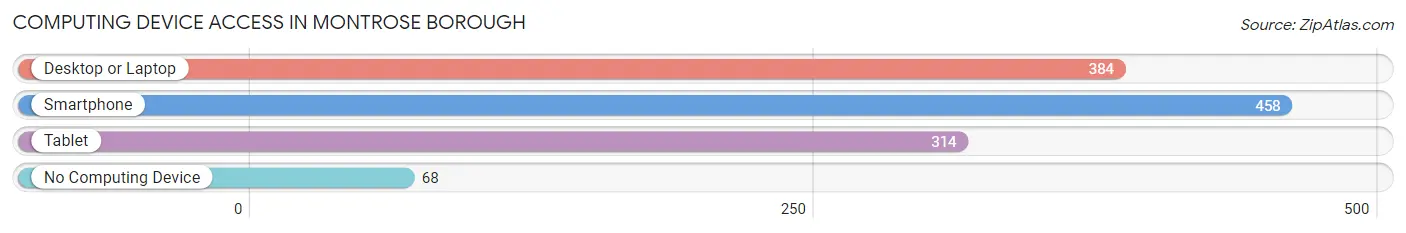
| Device Type | # Households | % Households |
| Desktop or Laptop | 384 | 62.3% |
| Smartphone | 458 | 74.4% |
| Tablet | 314 | 51.0% |
| No Computing Device | 68 | 11.0% |
| Total | 616 | 100.0% |
Internet Access in Montrose borough
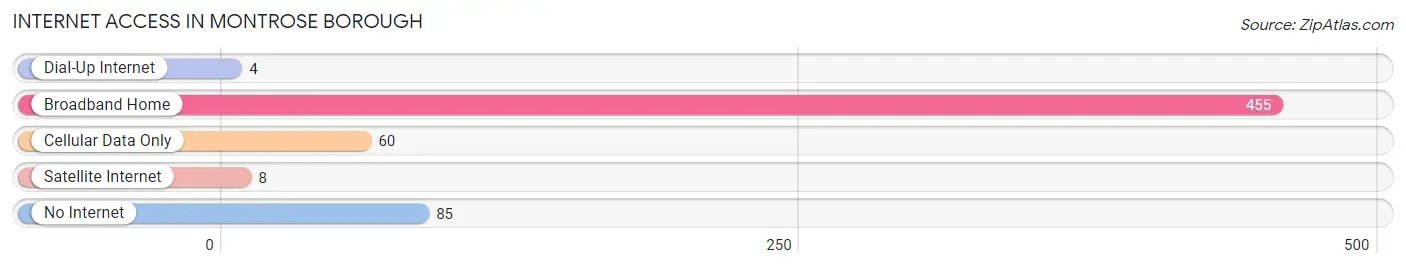
| Internet Type | # Households | % Households |
| Dial-Up Internet | 4 | 0.6% |
| Broadband Home | 455 | 73.9% |
| Cellular Data Only | 60 | 9.7% |
| Satellite Internet | 8 | 1.3% |
| No Internet | 85 | 13.8% |
| Total | 616 | 100.0% |
Montrose borough Summary
Montrose Borough is a small borough located in Susquehanna County, Pennsylvania. It is situated in the Endless Mountains region of the state, and is part of the Scranton–Wilkes-Barre–Hazleton Metropolitan Statistical Area. The borough was incorporated in 1859 and has a population of approximately 1,800 people.
History
Montrose was first settled in 1786 by a group of settlers from Connecticut. The town was originally known as "Newtown," but was later renamed "Montrose" after the Battle of Montrose in Scotland. The town was officially incorporated in 1859.
In the late 19th century, Montrose was a popular tourist destination due to its proximity to the Endless Mountains. The town was home to several hotels, including the Montrose House, which was built in 1876 and is still standing today.
In the early 20th century, Montrose was a major center for the lumber industry. The town was home to several sawmills and lumber yards, and the lumber industry was the primary source of employment for many of the town's residents.
Geography
Montrose is located in the Endless Mountains region of Pennsylvania. The borough is situated in the Susquehanna River Valley, and is surrounded by rolling hills and forests. The borough is located approximately 30 miles north of Scranton and 60 miles south of Binghamton, New York.
The borough covers an area of 1.2 square miles, and is located at an elevation of 1,400 feet. The borough is located in the Susquehanna River watershed, and is bordered by Bridgewater Township to the north, Choconut Township to the east, Liberty Township to the south, and Dimock Township to the west.
Economy
The economy of Montrose is largely based on tourism and retail. The borough is home to several small businesses, including restaurants, shops, and galleries. The town is also home to several bed and breakfasts, which attract visitors from all over the region.
The borough is also home to several manufacturing companies, including a paper mill and a plastics factory. The paper mill is the largest employer in the borough, and employs over 200 people.
Demographics
As of the 2010 census, the population of Montrose was 1,788. The racial makeup of the borough was 97.2% White, 0.7% African American, 0.3% Native American, 0.3% Asian, 0.1% Pacific Islander, 0.3% from other races, and 1.2% from two or more races. Hispanic or Latino of any race were 1.2% of the population.
The median household income in Montrose was $37,917, and the median family income was $45,000. The per capita income for the borough was $19,945. About 11.2% of families and 14.2% of the population were below the poverty line, including 19.2% of those under age 18 and 8.2% of those age 65 or over.
Conclusion
Montrose Borough is a small borough located in Susquehanna County, Pennsylvania. It is situated in the Endless Mountains region of the state, and is part of the Scranton–Wilkes-Barre–Hazleton Metropolitan Statistical Area. The borough was incorporated in 1859 and has a population of approximately 1,800 people. The economy of Montrose is largely based on tourism and retail, and the borough is home to several small businesses, manufacturing companies, and bed and breakfasts. The racial makeup of the borough is predominantly white, and the median household income is $37,917.
Common Questions
What is Per Capita Income in Montrose borough?
Per Capita income in Montrose borough is $31,795.
What is the Median Family Income in Montrose borough?
Median Family Income in Montrose borough is $80,250.
What is the Median Household income in Montrose borough?
Median Household Income in Montrose borough is $50,250.
What is Income or Wage Gap in Montrose borough?
Income or Wage Gap in Montrose borough is 25.3%.
Women in Montrose borough earn 74.7 cents for every dollar earned by a man.
What is Inequality or Gini Index in Montrose borough?
Inequality or Gini Index in Montrose borough is 0.46.
What is the Total Population of Montrose borough?
Total Population of Montrose borough is 1,396.
What is the Total Male Population of Montrose borough?
Total Male Population of Montrose borough is 741.
What is the Total Female Population of Montrose borough?
Total Female Population of Montrose borough is 655.
What is the Ratio of Males per 100 Females in Montrose borough?
There are 113.13 Males per 100 Females in Montrose borough.
What is the Ratio of Females per 100 Males in Montrose borough?
There are 88.39 Females per 100 Males in Montrose borough.
What is the Median Population Age in Montrose borough?
Median Population Age in Montrose borough is 43.6 Years.
What is the Average Family Size in Montrose borough
Average Family Size in Montrose borough is 3.2 People.
What is the Average Household Size in Montrose borough
Average Household Size in Montrose borough is 2.3 People.
How Large is the Labor Force in Montrose borough?
There are 675 People in the Labor Forcein in Montrose borough.
What is the Percentage of People in the Labor Force in Montrose borough?
59.3% of People are in the Labor Force in Montrose borough.
What is the Unemployment Rate in Montrose borough?
Unemployment Rate in Montrose borough is 8.0%.