Orchard Hills, PA Map & Demographics
Orchard Hills Map
Orchard Hills Overview
$30,473
PER CAPITA INCOME
$59,590
AVG FAMILY INCOME
$58,358
AVG HOUSEHOLD INCOME
21.8%
WAGE / INCOME GAP [ % ]
78.2¢/ $1
WAGE / INCOME GAP [ $ ]
0.35
INEQUALITY / GINI INDEX
1,920
TOTAL POPULATION
1,050
MALE POPULATION
870
FEMALE POPULATION
120.69
MALES / 100 FEMALES
82.86
FEMALES / 100 MALES
55.8
MEDIAN AGE
2.8
AVG FAMILY SIZE
2.5
AVG HOUSEHOLD SIZE
831
LABOR FORCE [ PEOPLE ]
46.0%
PERCENT IN LABOR FORCE
2.9%
UNEMPLOYMENT RATE
Income in Orchard Hills
Income Overview in Orchard Hills
Per Capita Income in Orchard Hills is $30,473, while median incomes of families and households are $59,590 and $58,358 respectively.
| Characteristic | Number | Measure |
| Per Capita Income | 1,920 | $30,473 |
| Median Family Income | 574 | $59,590 |
| Mean Family Income | 574 | $78,476 |
| Median Household Income | 758 | $58,358 |
| Mean Household Income | 758 | $73,028 |
| Income Deficit | 574 | $0 |
| Wage / Income Gap (%) | 1,920 | 21.80% |
| Wage / Income Gap ($) | 1,920 | 78.20¢ per $1 |
| Gini / Inequality Index | 1,920 | 0.35 |
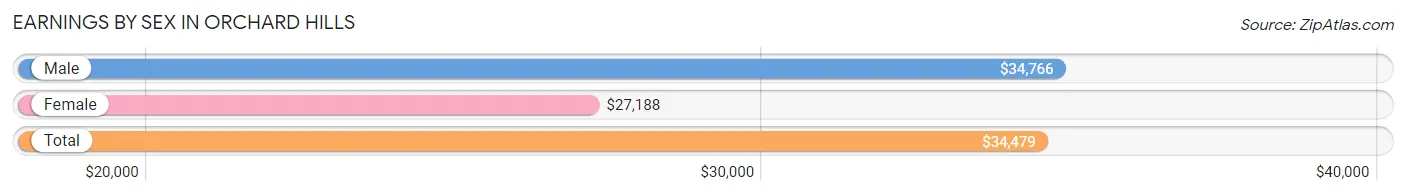
Earnings by Sex in Orchard Hills
Average Earnings in Orchard Hills are $34,479, $34,766 for men and $27,188 for women, a difference of 21.8%.
| Sex | Number | Average Earnings |
| Male | 527 (62.4%) | $34,766 |
| Female | 317 (37.6%) | $27,188 |
| Total | 844 (100.0%) | $34,479 |
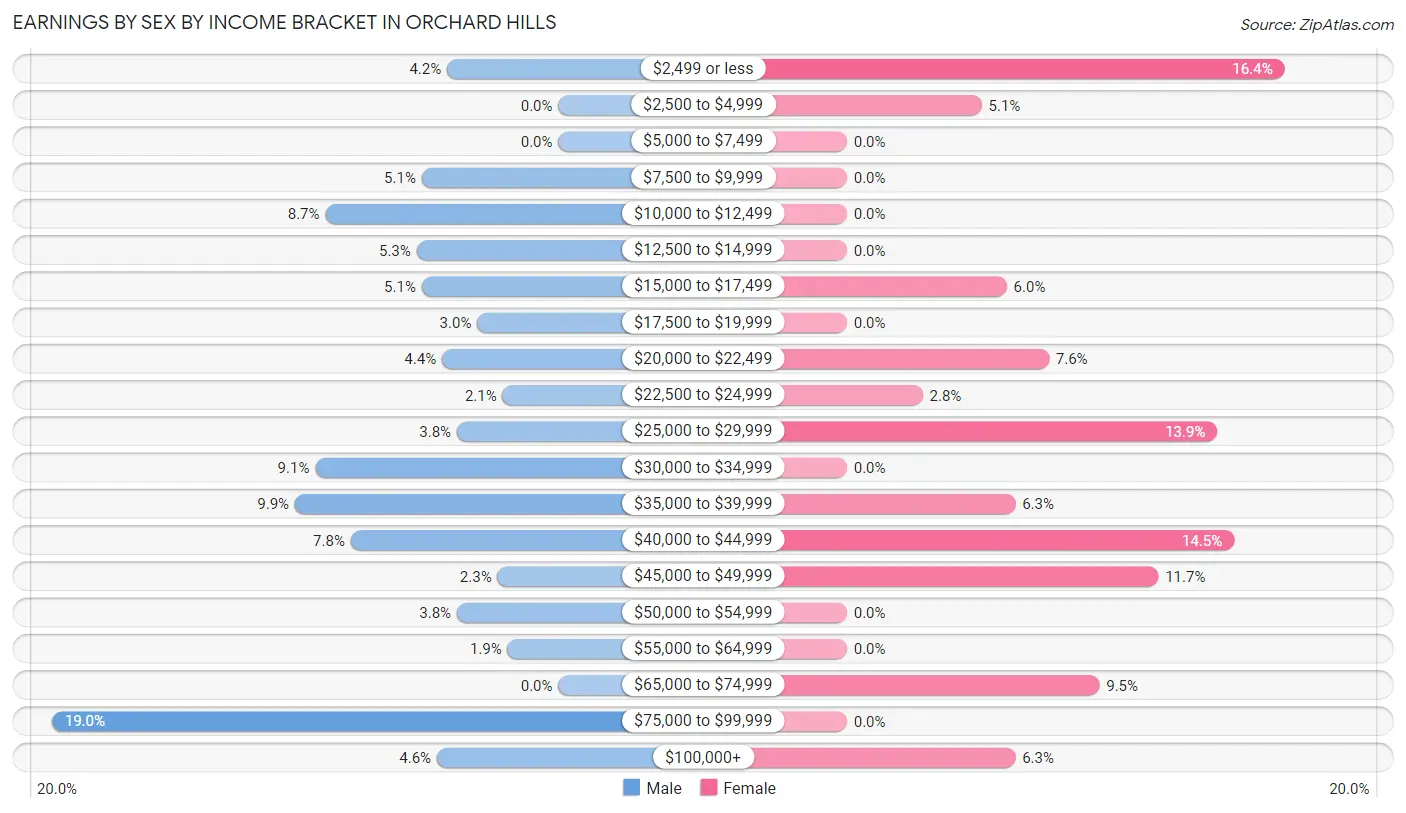
Earnings by Sex by Income Bracket in Orchard Hills
The most common earnings brackets in Orchard Hills are $75,000 to $99,999 for men (100 | 19.0%) and $2,499 or less for women (52 | 16.4%).
| Income | Male | Female |
| $2,499 or less | 22 (4.2%) | 52 (16.4%) |
| $2,500 to $4,999 | 0 (0.0%) | 16 (5.1%) |
| $5,000 to $7,499 | 0 (0.0%) | 0 (0.0%) |
| $7,500 to $9,999 | 27 (5.1%) | 0 (0.0%) |
| $10,000 to $12,499 | 46 (8.7%) | 0 (0.0%) |
| $12,500 to $14,999 | 28 (5.3%) | 0 (0.0%) |
| $15,000 to $17,499 | 27 (5.1%) | 19 (6.0%) |
| $17,500 to $19,999 | 16 (3.0%) | 0 (0.0%) |
| $20,000 to $22,499 | 23 (4.4%) | 24 (7.6%) |
| $22,500 to $24,999 | 11 (2.1%) | 9 (2.8%) |
| $25,000 to $29,999 | 20 (3.8%) | 44 (13.9%) |
| $30,000 to $34,999 | 48 (9.1%) | 0 (0.0%) |
| $35,000 to $39,999 | 52 (9.9%) | 20 (6.3%) |
| $40,000 to $44,999 | 41 (7.8%) | 46 (14.5%) |
| $45,000 to $49,999 | 12 (2.3%) | 37 (11.7%) |
| $50,000 to $54,999 | 20 (3.8%) | 0 (0.0%) |
| $55,000 to $64,999 | 10 (1.9%) | 0 (0.0%) |
| $65,000 to $74,999 | 0 (0.0%) | 30 (9.5%) |
| $75,000 to $99,999 | 100 (19.0%) | 0 (0.0%) |
| $100,000+ | 24 (4.5%) | 20 (6.3%) |
| Total | 527 (100.0%) | 317 (100.0%) |
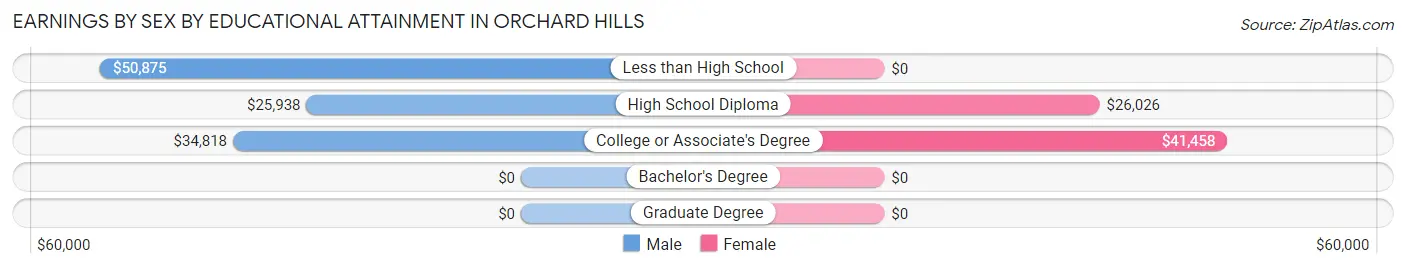
Earnings by Sex by Educational Attainment in Orchard Hills
Average earnings in Orchard Hills are $35,451 for men and $40,272 for women, a difference of 12.0%. Men with an educational attainment of less than high school enjoy the highest average annual earnings of $50,875, while those with high school diploma education earn the least with $25,938. Women with an educational attainment of college or associate's degree earn the most with the average annual earnings of $41,458, while those with high school diploma education have the smallest earnings of $26,026.
| Educational Attainment | Male Income | Female Income |
| Less than High School | $50,875 | $0 |
| High School Diploma | $25,938 | $26,026 |
| College or Associate's Degree | $34,818 | $41,458 |
| Bachelor's Degree | - | - |
| Graduate Degree | - | - |
| Total | $35,451 | $40,272 |
Family Income in Orchard Hills
Family Income Brackets in Orchard Hills
According to the Orchard Hills family income data, there are 173 families falling into the $75,000 to $99,999 income range, which is the most common income bracket and makes up 30.1% of all families.
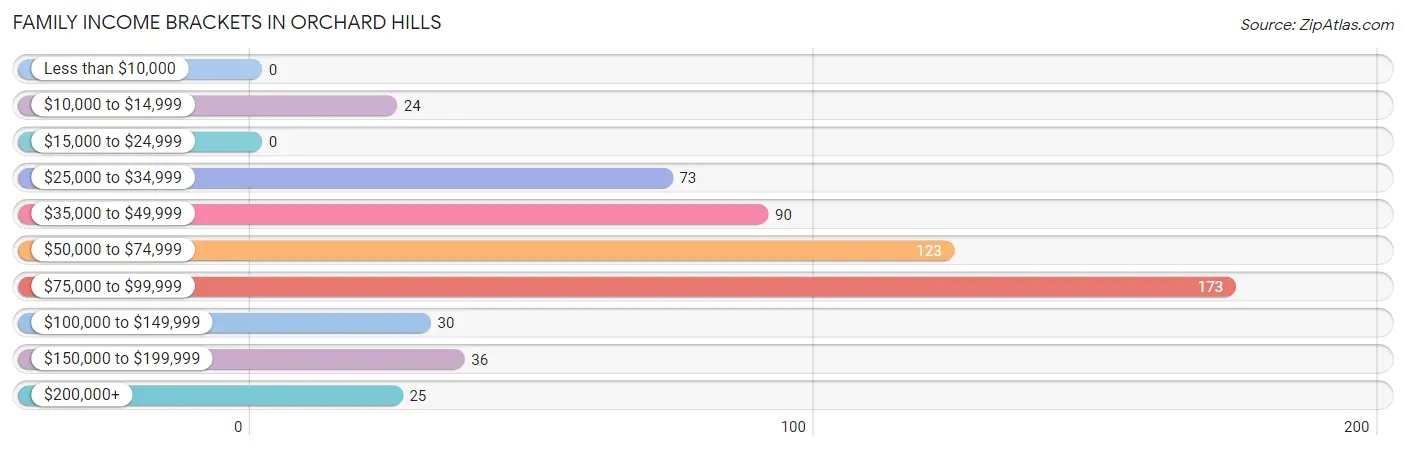
| Income Bracket | # Families | % Families |
| Less than $10,000 | 0 | 0.0% |
| $10,000 to $14,999 | 24 | 4.2% |
| $15,000 to $24,999 | 0 | 0.0% |
| $25,000 to $34,999 | 73 | 12.7% |
| $35,000 to $49,999 | 90 | 15.7% |
| $50,000 to $74,999 | 123 | 21.4% |
| $75,000 to $99,999 | 173 | 30.1% |
| $100,000 to $149,999 | 30 | 5.2% |
| $150,000 to $199,999 | 36 | 6.3% |
| $200,000+ | 25 | 4.4% |
Family Income by Famaliy Size in Orchard Hills
4-person families (97 | 16.9%) account for the highest median family income in Orchard Hills with $89,813 per family, while 2-person families (295 | 51.4%) have the highest median income of $29,599 per family member.
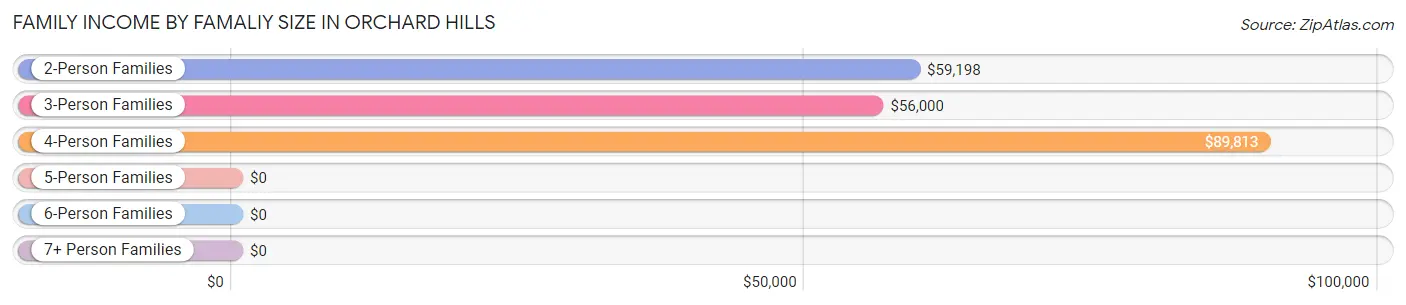
| Income Bracket | # Families | Median Income |
| 2-Person Families | 295 (51.4%) | $59,198 |
| 3-Person Families | 182 (31.7%) | $56,000 |
| 4-Person Families | 97 (16.9%) | $89,813 |
| 5-Person Families | 0 (0.0%) | $0 |
| 6-Person Families | 0 (0.0%) | $0 |
| 7+ Person Families | 0 (0.0%) | $0 |
| Total | 574 (100.0%) | $59,590 |
Family Income by Number of Earners in Orchard Hills
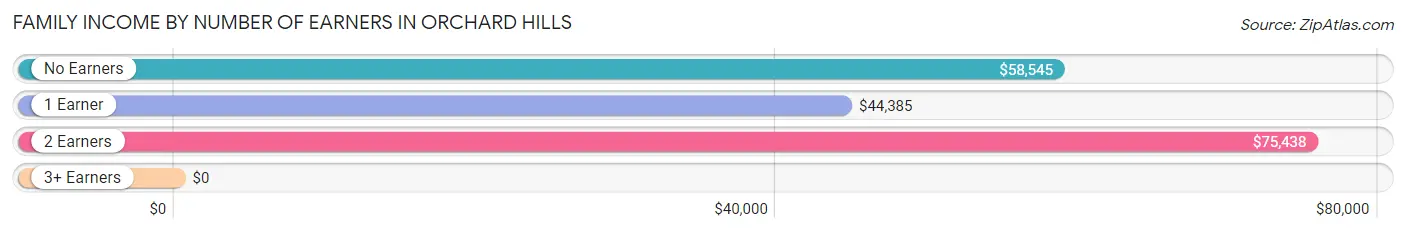
| Number of Earners | # Families | Median Income |
| No Earners | 208 (36.2%) | $58,545 |
| 1 Earner | 190 (33.1%) | $44,385 |
| 2 Earners | 91 (15.9%) | $75,438 |
| 3+ Earners | 85 (14.8%) | $0 |
| Total | 574 (100.0%) | $59,590 |
Household Income in Orchard Hills
Household Income Brackets in Orchard Hills
With 198 households falling in the category, the $75,000 to $99,999 income range is the most frequent in Orchard Hills, accounting for 26.1% of all households. In contrast, only 14 households (1.8%) fall into the less than $10,000 income bracket, making it the least populous group.
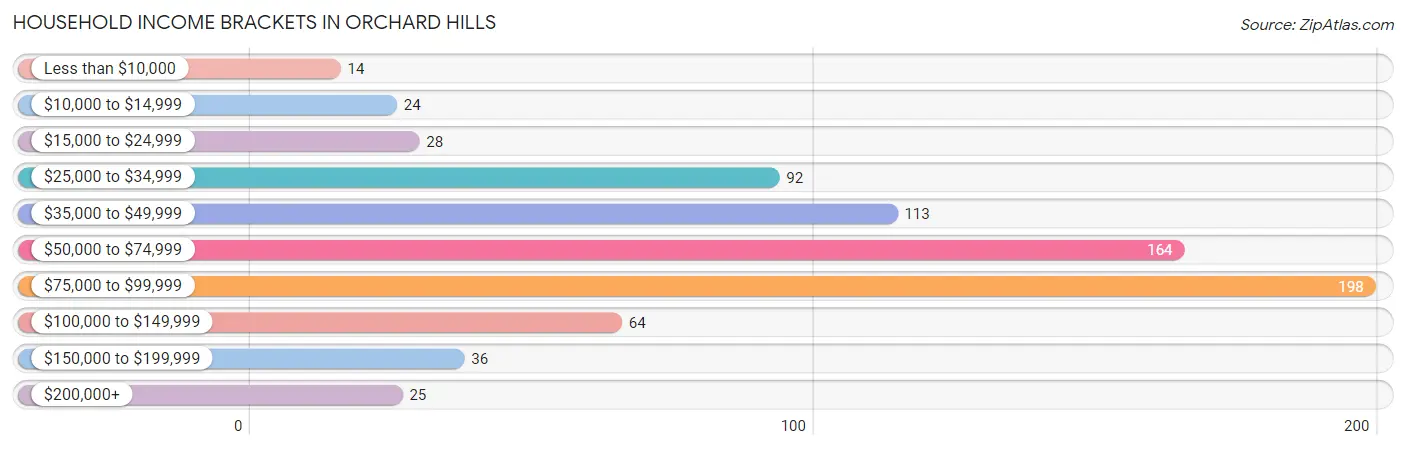
| Income Bracket | # Households | % Households |
| Less than $10,000 | 14 | 1.8% |
| $10,000 to $14,999 | 24 | 3.2% |
| $15,000 to $24,999 | 28 | 3.7% |
| $25,000 to $34,999 | 92 | 12.1% |
| $35,000 to $49,999 | 113 | 14.9% |
| $50,000 to $74,999 | 164 | 21.6% |
| $75,000 to $99,999 | 198 | 26.1% |
| $100,000 to $149,999 | 64 | 8.4% |
| $150,000 to $199,999 | 36 | 4.7% |
| $200,000+ | 25 | 3.3% |
Household Income by Householder Age in Orchard Hills
The median household income in Orchard Hills is $58,358, with the highest median household income of $88,875 found in the 25 to 44 years age bracket for the primary householder. A total of 102 households (13.5%) fall into this category. Meanwhile, the 15 to 24 years age bracket for the primary householder has the lowest median household income of $0, with 32 households (4.2%) in this group.
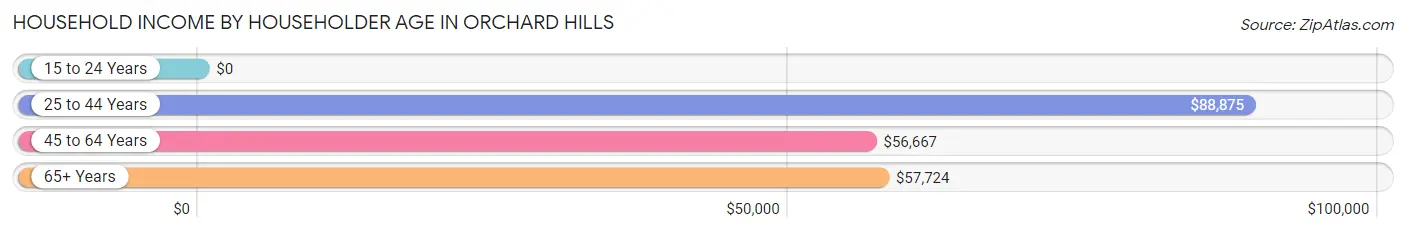
| Income Bracket | # Households | Median Income |
| 15 to 24 Years | 32 (4.2%) | $0 |
| 25 to 44 Years | 102 (13.5%) | $88,875 |
| 45 to 64 Years | 352 (46.4%) | $56,667 |
| 65+ Years | 272 (35.9%) | $57,724 |
| Total | 758 (100.0%) | $58,358 |
Poverty in Orchard Hills
Income Below Poverty by Sex and Age in Orchard Hills
With 12.8% poverty level for males and 6.3% for females among the residents of Orchard Hills, 5 year old males and 6 to 11 year old females are the most vulnerable to poverty, with 19 males (100.0%) and 19 females (46.3%) in their respective age groups living below the poverty level.
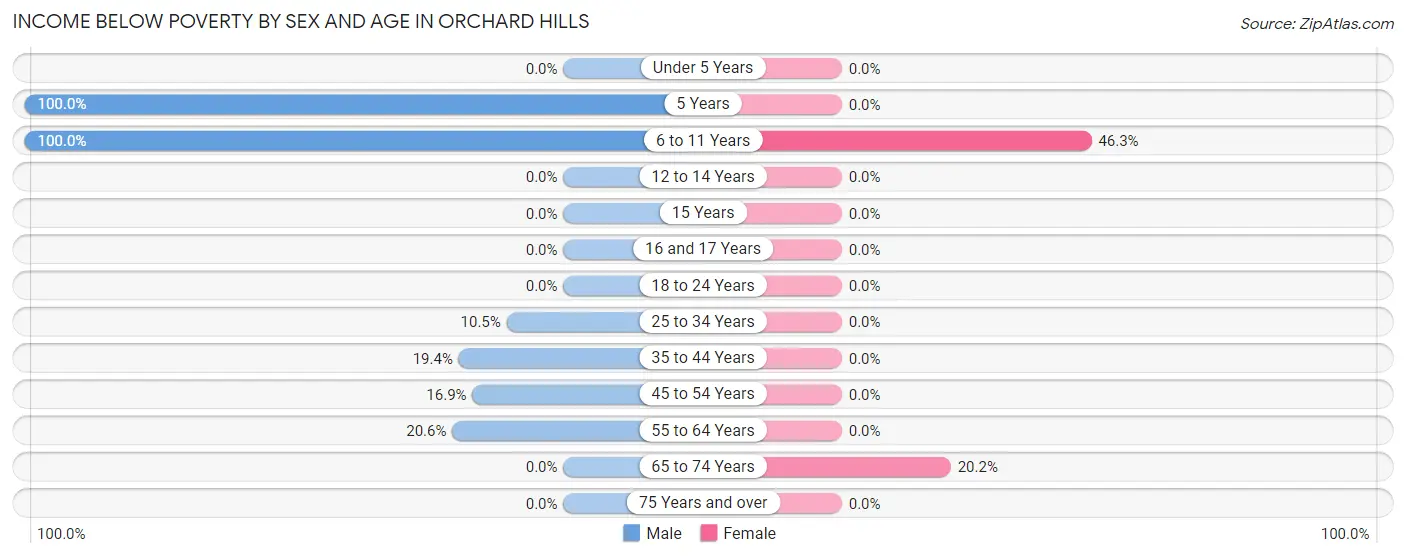
| Age Bracket | Male | Female |
| Under 5 Years | 0 (0.0%) | 0 (0.0%) |
| 5 Years | 19 (100.0%) | 0 (0.0%) |
| 6 to 11 Years | 20 (100.0%) | 19 (46.3%) |
| 12 to 14 Years | 0 (0.0%) | 0 (0.0%) |
| 15 Years | 0 (0.0%) | 0 (0.0%) |
| 16 and 17 Years | 0 (0.0%) | 0 (0.0%) |
| 18 to 24 Years | 0 (0.0%) | 0 (0.0%) |
| 25 to 34 Years | 22 (10.5%) | 0 (0.0%) |
| 35 to 44 Years | 20 (19.4%) | 0 (0.0%) |
| 45 to 54 Years | 13 (16.9%) | 0 (0.0%) |
| 55 to 64 Years | 40 (20.6%) | 0 (0.0%) |
| 65 to 74 Years | 0 (0.0%) | 36 (20.2%) |
| 75 Years and over | 0 (0.0%) | 0 (0.0%) |
| Total | 134 (12.8%) | 55 (6.3%) |
Income Above Poverty by Sex and Age in Orchard Hills
According to the poverty statistics in Orchard Hills, males aged under 5 years and females aged under 5 years are the age groups that are most secure financially, with 100.0% of males and 100.0% of females in these age groups living above the poverty line.
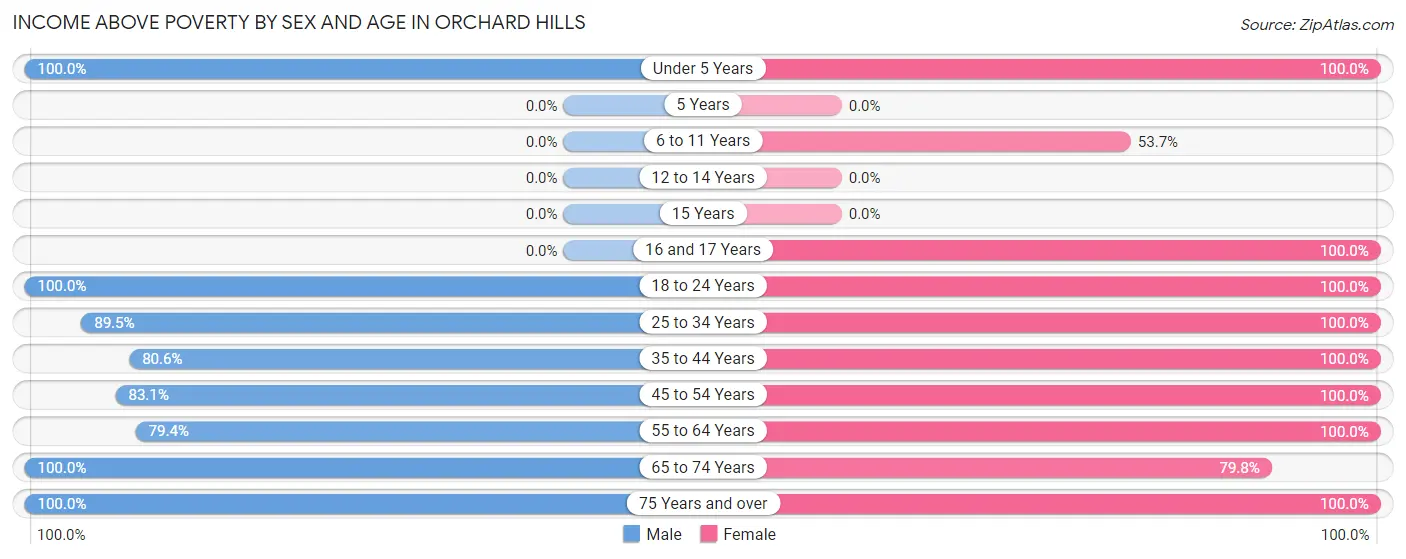
| Age Bracket | Male | Female |
| Under 5 Years | 14 (100.0%) | 20 (100.0%) |
| 5 Years | 0 (0.0%) | 0 (0.0%) |
| 6 to 11 Years | 0 (0.0%) | 22 (53.7%) |
| 12 to 14 Years | 0 (0.0%) | 0 (0.0%) |
| 15 Years | 0 (0.0%) | 0 (0.0%) |
| 16 and 17 Years | 0 (0.0%) | 16 (100.0%) |
| 18 to 24 Years | 107 (100.0%) | 55 (100.0%) |
| 25 to 34 Years | 187 (89.5%) | 76 (100.0%) |
| 35 to 44 Years | 83 (80.6%) | 81 (100.0%) |
| 45 to 54 Years | 64 (83.1%) | 111 (100.0%) |
| 55 to 64 Years | 154 (79.4%) | 185 (100.0%) |
| 65 to 74 Years | 139 (100.0%) | 142 (79.8%) |
| 75 Years and over | 168 (100.0%) | 107 (100.0%) |
| Total | 916 (87.2%) | 815 (93.7%) |
Income Below Poverty Among Married-Couple Families in Orchard Hills
The poverty statistics for married-couple families in Orchard Hills show that 5.4% or 24 of the total 440 families live below the poverty line. Families with no children have the highest poverty rate of 6.0%, comprising of 24 families. On the other hand, families with 1 or 2 children have the lowest poverty rate of 0.0%, which includes 0 families.
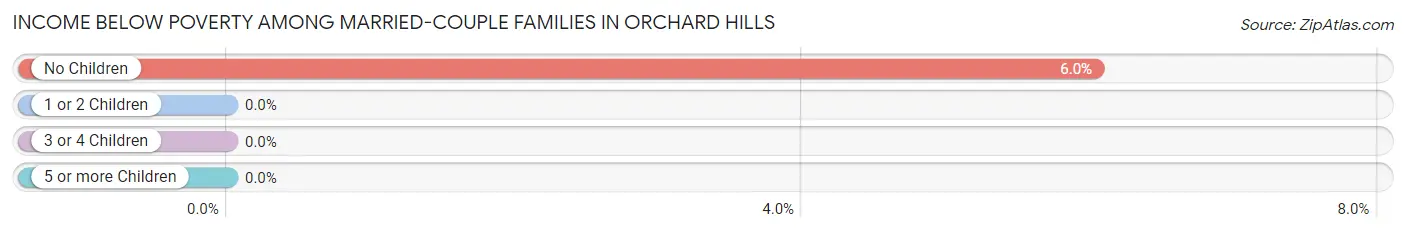
| Children | Above Poverty | Below Poverty |
| No Children | 374 (94.0%) | 24 (6.0%) |
| 1 or 2 Children | 42 (100.0%) | 0 (0.0%) |
| 3 or 4 Children | 0 (0.0%) | 0 (0.0%) |
| 5 or more Children | 0 (0.0%) | 0 (0.0%) |
| Total | 416 (94.6%) | 24 (5.4%) |
Income Below Poverty Among Single-Parent Households in Orchard Hills
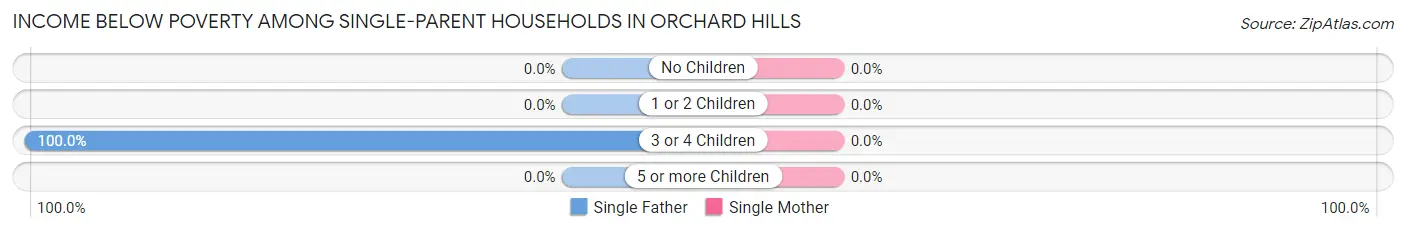
| Children | Single Father | Single Mother |
| No Children | 0 (0.0%) | 0 (0.0%) |
| 1 or 2 Children | 0 (0.0%) | 0 (0.0%) |
| 3 or 4 Children | 20 (100.0%) | 0 (0.0%) |
| 5 or more Children | 0 (0.0%) | 0 (0.0%) |
| Total | 20 (47.6%) | 0 (0.0%) |
Income Below Poverty Among Married-Couple vs Single-Parent Households in Orchard Hills
The poverty data for Orchard Hills shows that 24 of the married-couple family households (5.4%) and 20 of the single-parent households (14.9%) are living below the poverty level. Within the married-couple family households, those with no children have the highest poverty rate, with 24 households (6.0%) falling below the poverty line. Among the single-parent households, those with 3 or 4 children have the highest poverty rate, with 20 household (100.0%) living below poverty.
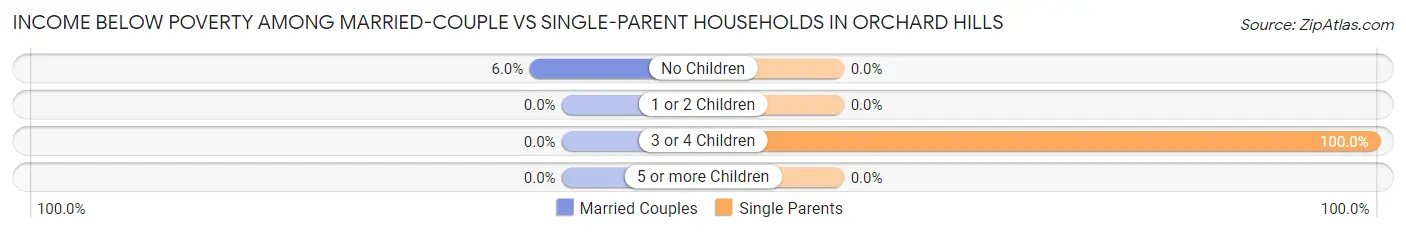
| Children | Married-Couple Families | Single-Parent Households |
| No Children | 24 (6.0%) | 0 (0.0%) |
| 1 or 2 Children | 0 (0.0%) | 0 (0.0%) |
| 3 or 4 Children | 0 (0.0%) | 20 (100.0%) |
| 5 or more Children | 0 (0.0%) | 0 (0.0%) |
| Total | 24 (5.4%) | 20 (14.9%) |
Race in Orchard Hills
The most populous races in Orchard Hills are White / Caucasian (1,859 | 96.8%), and Two or more Races (61 | 3.2%).
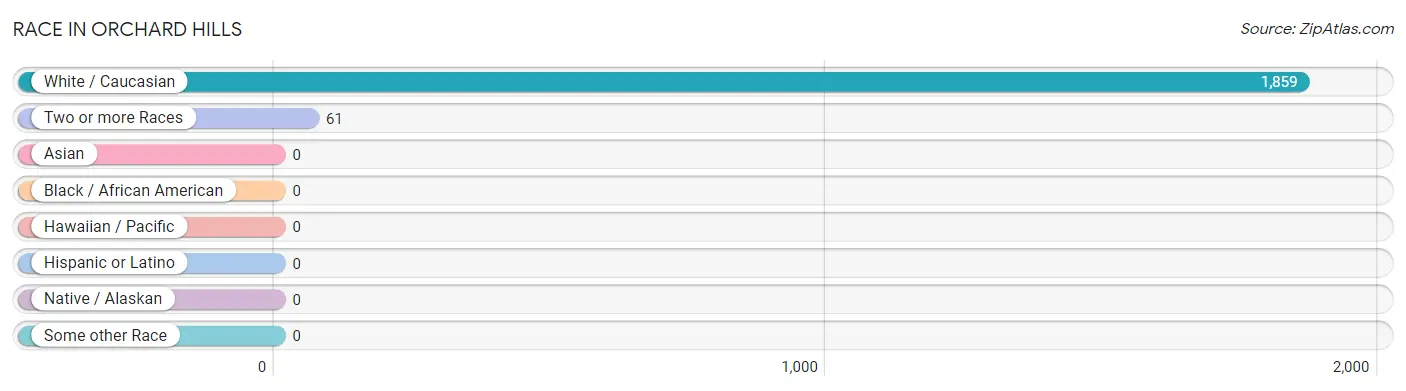
| Race | # Population | % Population |
| Asian | 0 | 0.0% |
| Black / African American | 0 | 0.0% |
| Hawaiian / Pacific | 0 | 0.0% |
| Hispanic or Latino | 0 | 0.0% |
| Native / Alaskan | 0 | 0.0% |
| White / Caucasian | 1,859 | 96.8% |
| Two or more Races | 61 | 3.2% |
| Some other Race | 0 | 0.0% |
| Total | 1,920 | 100.0% |
Ancestry in Orchard Hills
The most populous ancestries reported in Orchard Hills are German (663 | 34.5%), Italian (405 | 21.1%), Irish (384 | 20.0%), Dutch (120 | 6.2%), and English (109 | 5.7%), together accounting for 87.5% of all Orchard Hills residents.
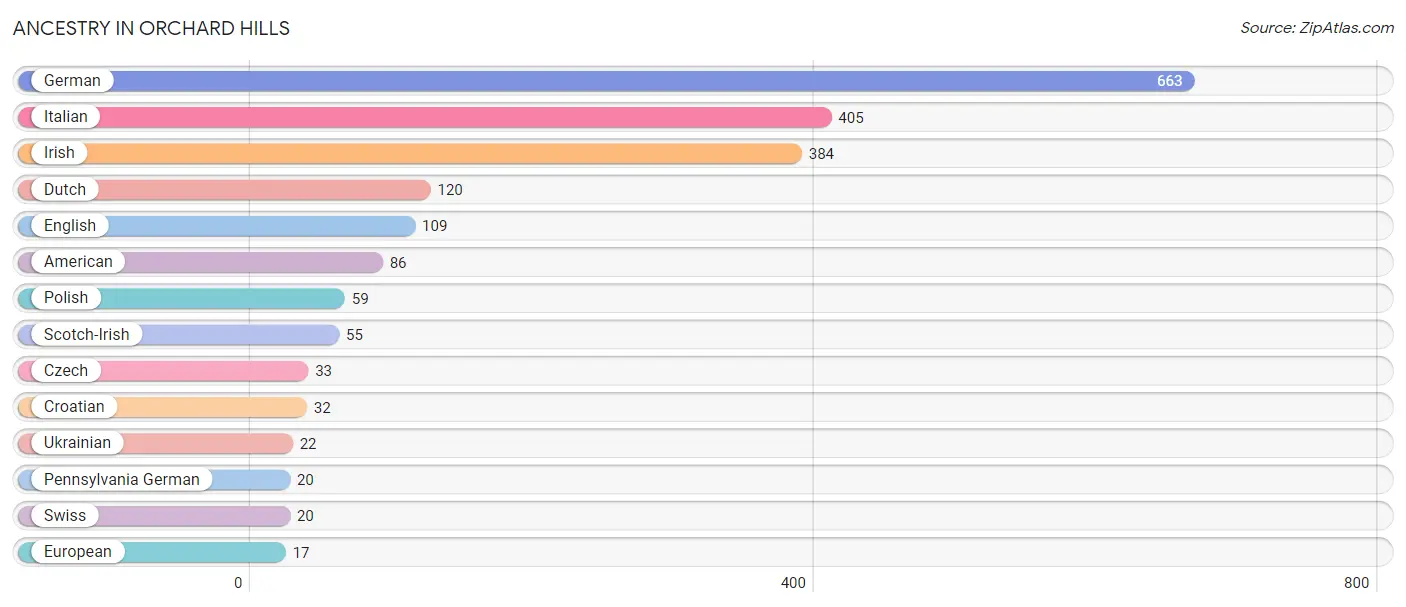
| Ancestry | # Population | % Population |
| American | 86 | 4.5% |
| Croatian | 32 | 1.7% |
| Czech | 33 | 1.7% |
| Dutch | 120 | 6.2% |
| English | 109 | 5.7% |
| European | 17 | 0.9% |
| German | 663 | 34.5% |
| Irish | 384 | 20.0% |
| Italian | 405 | 21.1% |
| Pennsylvania German | 20 | 1.0% |
| Polish | 59 | 3.1% |
| Scotch-Irish | 55 | 2.9% |
| Swiss | 20 | 1.0% |
| Ukrainian | 22 | 1.1% | View All 14 Rows |
Immigrants in Orchard Hills

| Immigration Origin | # Population | % Population | View All 0 Rows |
Sex and Age in Orchard Hills
Sex and Age in Orchard Hills
The most populous age groups in Orchard Hills are 80 to 84 Years (139 | 13.2%) for men and 60 to 64 Years (129 | 14.8%) for women.
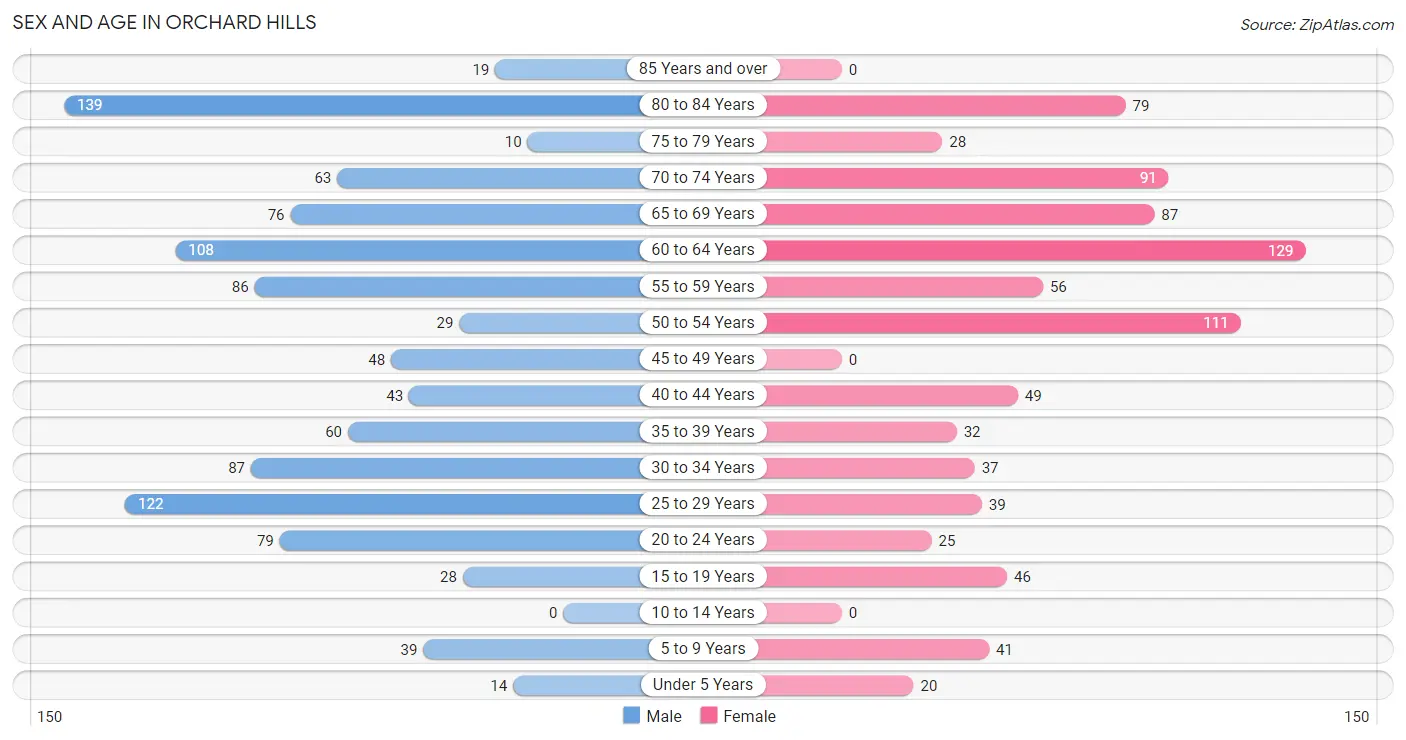
| Age Bracket | Male | Female |
| Under 5 Years | 14 (1.3%) | 20 (2.3%) |
| 5 to 9 Years | 39 (3.7%) | 41 (4.7%) |
| 10 to 14 Years | 0 (0.0%) | 0 (0.0%) |
| 15 to 19 Years | 28 (2.7%) | 46 (5.3%) |
| 20 to 24 Years | 79 (7.5%) | 25 (2.9%) |
| 25 to 29 Years | 122 (11.6%) | 39 (4.5%) |
| 30 to 34 Years | 87 (8.3%) | 37 (4.3%) |
| 35 to 39 Years | 60 (5.7%) | 32 (3.7%) |
| 40 to 44 Years | 43 (4.1%) | 49 (5.6%) |
| 45 to 49 Years | 48 (4.6%) | 0 (0.0%) |
| 50 to 54 Years | 29 (2.8%) | 111 (12.8%) |
| 55 to 59 Years | 86 (8.2%) | 56 (6.4%) |
| 60 to 64 Years | 108 (10.3%) | 129 (14.8%) |
| 65 to 69 Years | 76 (7.2%) | 87 (10.0%) |
| 70 to 74 Years | 63 (6.0%) | 91 (10.5%) |
| 75 to 79 Years | 10 (0.9%) | 28 (3.2%) |
| 80 to 84 Years | 139 (13.2%) | 79 (9.1%) |
| 85 Years and over | 19 (1.8%) | 0 (0.0%) |
| Total | 1,050 (100.0%) | 870 (100.0%) |
Families and Households in Orchard Hills
Median Family Size in Orchard Hills
The median family size in Orchard Hills is 2.81 persons per family, with single male/father families (42 | 7.3%) accounting for the largest median family size of 4.19 persons per family. On the other hand, married-couple families (440 | 76.7%) represent the smallest median family size with 2.65 persons per family.
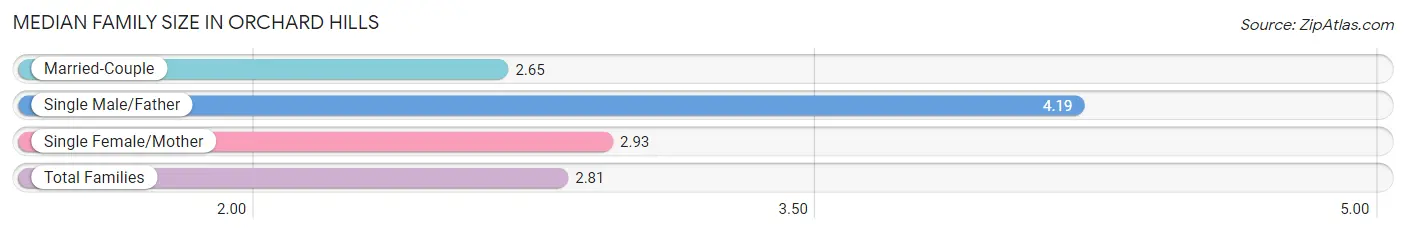
| Family Type | # Families | Family Size |
| Married-Couple | 440 (76.7%) | 2.65 |
| Single Male/Father | 42 (7.3%) | 4.19 |
| Single Female/Mother | 92 (16.0%) | 2.93 |
| Total Families | 574 (100.0%) | 2.81 |
Median Household Size in Orchard Hills
The median household size in Orchard Hills is 2.53 persons per household, with single male/father households (42 | 5.5%) accounting for the largest median household size of 4.64 persons per household. non-family households (184 | 24.3%) represent the smallest median household size with 1.49 persons per household.
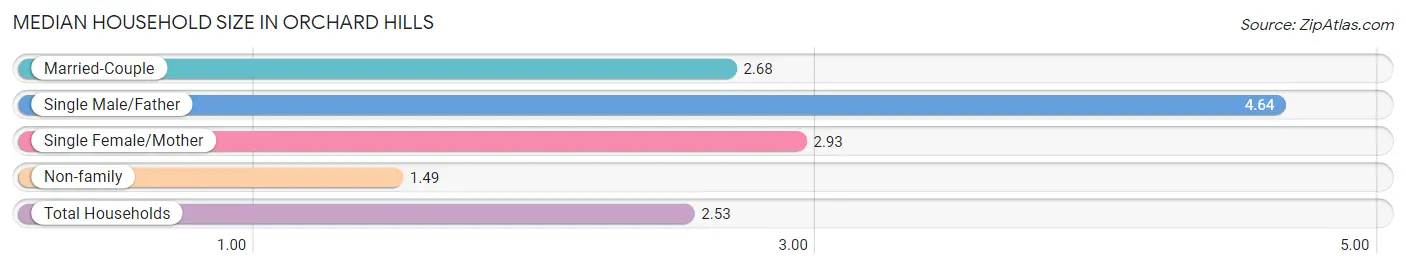
| Household Type | # Households | Household Size |
| Married-Couple | 440 (58.1%) | 2.68 |
| Single Male/Father | 42 (5.5%) | 4.64 |
| Single Female/Mother | 92 (12.1%) | 2.93 |
| Non-family | 184 (24.3%) | 1.49 |
| Total Households | 758 (100.0%) | 2.53 |
Household Size by Marriage Status in Orchard Hills
Out of a total of 758 households in Orchard Hills, 574 (75.7%) are family households, while 184 (24.3%) are nonfamily households. The most numerous type of family households are 2-person households, comprising 270, and the most common type of nonfamily households are 1-person households, comprising 105.
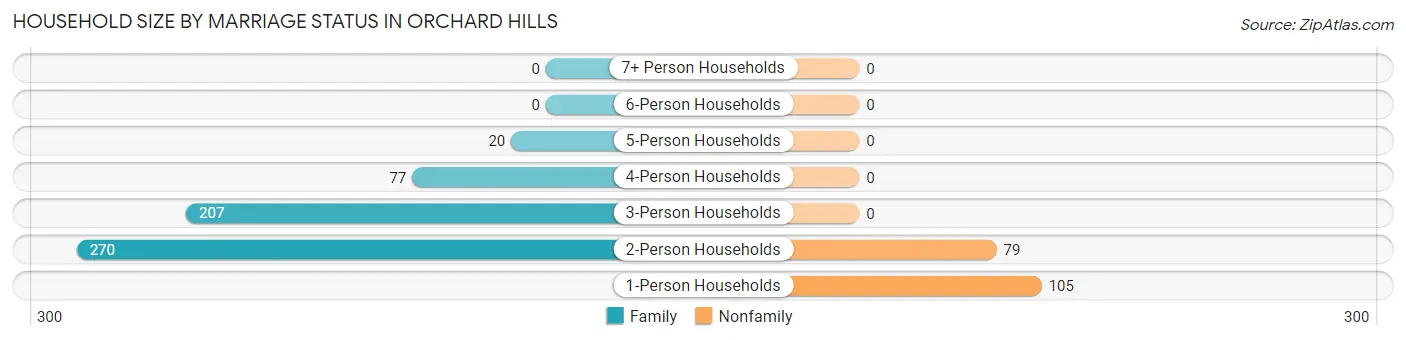
| Household Size | Family Households | Nonfamily Households |
| 1-Person Households | - | 105 (13.9%) |
| 2-Person Households | 270 (35.6%) | 79 (10.4%) |
| 3-Person Households | 207 (27.3%) | 0 (0.0%) |
| 4-Person Households | 77 (10.2%) | 0 (0.0%) |
| 5-Person Households | 20 (2.6%) | 0 (0.0%) |
| 6-Person Households | 0 (0.0%) | 0 (0.0%) |
| 7+ Person Households | 0 (0.0%) | 0 (0.0%) |
| Total | 574 (75.7%) | 184 (24.3%) |
Female Fertility in Orchard Hills
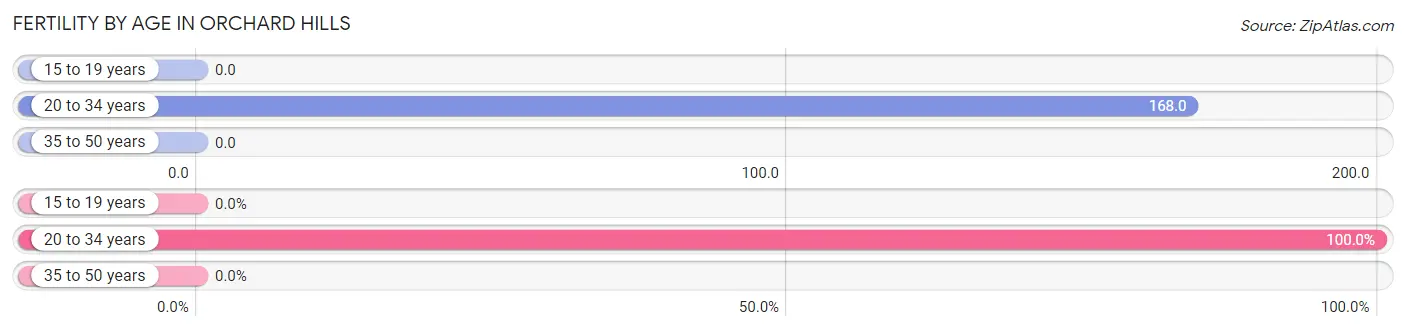
Fertility by Age in Orchard Hills
Average fertility rate in Orchard Hills is 75.0 births per 1,000 women. Women in the age bracket of 20 to 34 years have the highest fertility rate with 168.0 births per 1,000 women. Women in the age bracket of 20 to 34 years acount for 100.0% of all women with births.
| Age Bracket | Women with Births | Births / 1,000 Women |
| 15 to 19 years | 0 (0.0%) | 0.0 |
| 20 to 34 years | 17 (100.0%) | 168.0 |
| 35 to 50 years | 0 (0.0%) | 0.0 |
| Total | 17 (100.0%) | 75.0 |
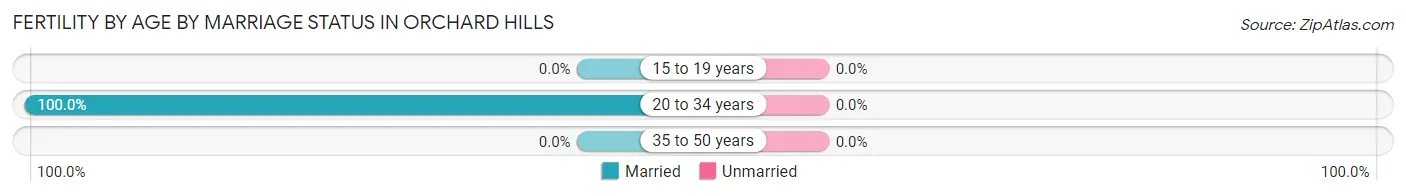
Fertility by Age by Marriage Status in Orchard Hills
| Age Bracket | Married | Unmarried |
| 15 to 19 years | 0 (0.0%) | 0 (0.0%) |
| 20 to 34 years | 17 (100.0%) | 0 (0.0%) |
| 35 to 50 years | 0 (0.0%) | 0 (0.0%) |
| Total | 17 (100.0%) | 0 (0.0%) |
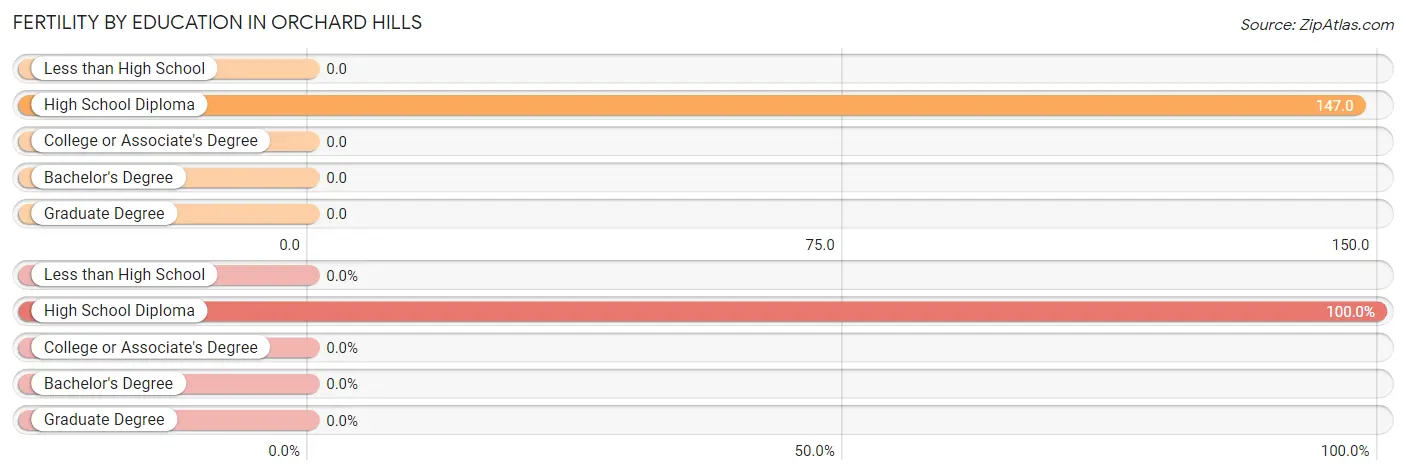
Fertility by Education in Orchard Hills
| Educational Attainment | Women with Births | Births / 1,000 Women |
| Less than High School | 0 (0.0%) | 0.0 |
| High School Diploma | 17 (100.0%) | 147.0 |
| College or Associate's Degree | 0 (0.0%) | 0.0 |
| Bachelor's Degree | 0 (0.0%) | 0.0 |
| Graduate Degree | 0 (0.0%) | 0.0 |
| Total | 17 (100.0%) | 75.0 |
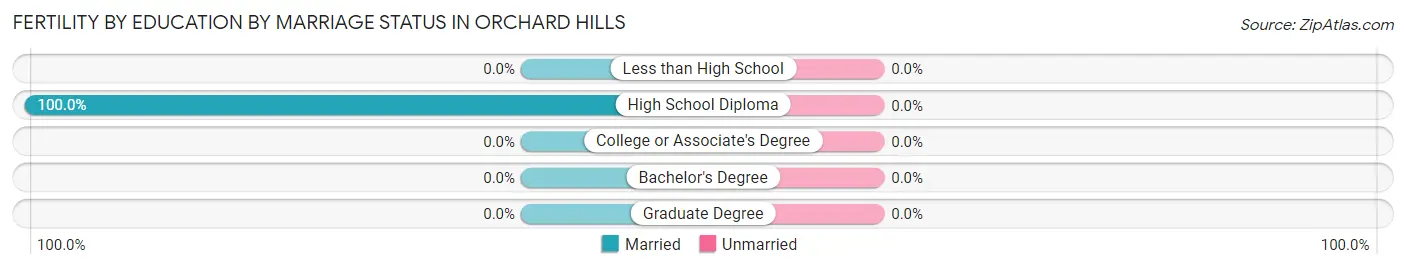
Fertility by Education by Marriage Status in Orchard Hills
| Educational Attainment | Married | Unmarried |
| Less than High School | 0 (0.0%) | 0 (0.0%) |
| High School Diploma | 17 (100.0%) | 0 (0.0%) |
| College or Associate's Degree | 0 (0.0%) | 0 (0.0%) |
| Bachelor's Degree | 0 (0.0%) | 0 (0.0%) |
| Graduate Degree | 0 (0.0%) | 0 (0.0%) |
| Total | 17 (100.0%) | 0 (0.0%) |
Employment Characteristics in Orchard Hills
Employment by Class of Employer in Orchard Hills
Among the 806 employed individuals in Orchard Hills, private company employees (712 | 88.3%), local government employees (43 | 5.3%), and not-for-profit organizations (20 | 2.5%) make up the most common classes of employment.
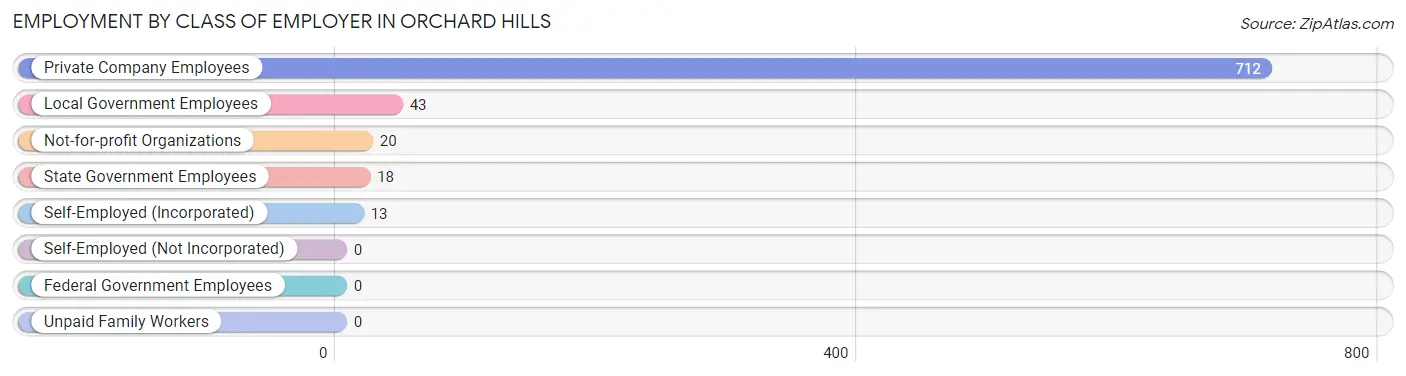
| Employer Class | # Employees | % Employees |
| Private Company Employees | 712 | 88.3% |
| Self-Employed (Incorporated) | 13 | 1.6% |
| Self-Employed (Not Incorporated) | 0 | 0.0% |
| Not-for-profit Organizations | 20 | 2.5% |
| Local Government Employees | 43 | 5.3% |
| State Government Employees | 18 | 2.2% |
| Federal Government Employees | 0 | 0.0% |
| Unpaid Family Workers | 0 | 0.0% |
| Total | 806 | 100.0% |
Employment Status by Age in Orchard Hills
According to the labor force statistics for Orchard Hills, out of the total population over 16 years of age (1,806), 46.0% or 831 individuals are in the labor force, with 2.9% or 24 of them unemployed. The age group with the highest labor force participation rate is 16 to 19 years, with 100.0% or 74 individuals in the labor force. Within the labor force, the 60 to 64 years age range has the highest percentage of unemployed individuals, with 24.2% or 24 of them being unemployed.
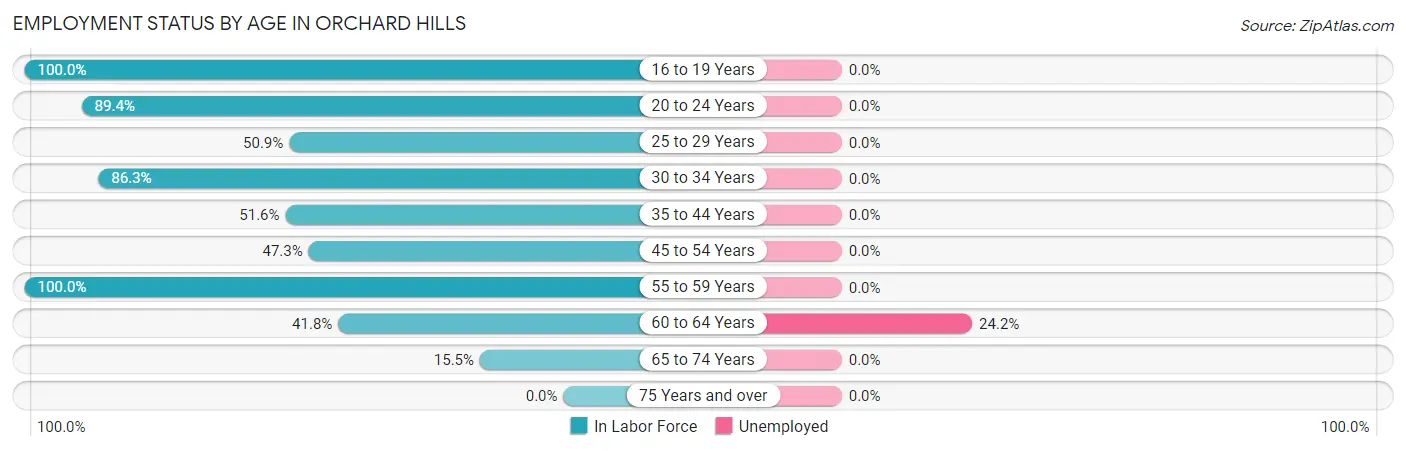
| Age Bracket | In Labor Force | Unemployed |
| 16 to 19 Years | 74 (100.0%) | 0 (0.0%) |
| 20 to 24 Years | 93 (89.4%) | 0 (0.0%) |
| 25 to 29 Years | 82 (50.9%) | 0 (0.0%) |
| 30 to 34 Years | 107 (86.3%) | 0 (0.0%) |
| 35 to 44 Years | 95 (51.6%) | 0 (0.0%) |
| 45 to 54 Years | 89 (47.3%) | 0 (0.0%) |
| 55 to 59 Years | 142 (100.0%) | 0 (0.0%) |
| 60 to 64 Years | 99 (41.8%) | 24 (24.2%) |
| 65 to 74 Years | 49 (15.5%) | 0 (0.0%) |
| 75 Years and over | 0 (0.0%) | 0 (0.0%) |
| Total | 831 (46.0%) | 24 (2.9%) |
Employment Status by Educational Attainment in Orchard Hills
According to labor force statistics for Orchard Hills, 59.3% of individuals (614) out of the total population between 25 and 64 years of age (1,036) are in the labor force, with 3.9% or 24 of them being unemployed. The group with the highest labor force participation rate are those with the educational attainment of high school diploma, with 66.0% or 309 individuals in the labor force. Within the labor force, individuals with less than high school education have the highest percentage of unemployment, with 32.9% or 24 of them being unemployed.
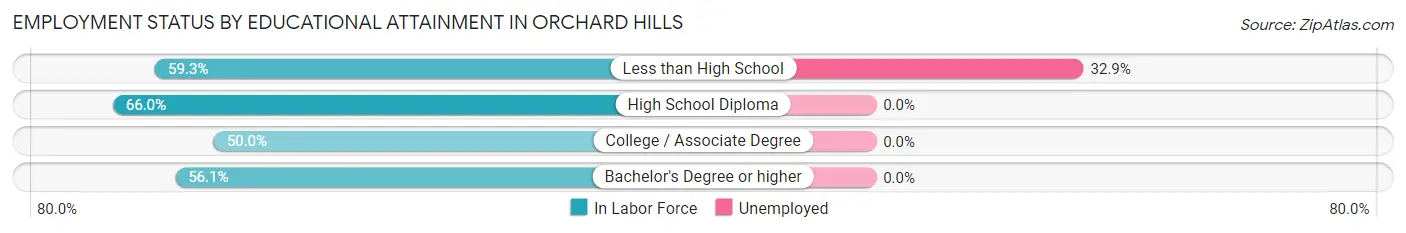
| Educational Attainment | In Labor Force | Unemployed |
| Less than High School | 73 (59.3%) | 40 (32.9%) |
| High School Diploma | 309 (66.0%) | 0 (0.0%) |
| College / Associate Degree | 145 (50.0%) | 0 (0.0%) |
| Bachelor's Degree or higher | 87 (56.1%) | 0 (0.0%) |
| Total | 614 (59.3%) | 40 (3.9%) |
Employment Occupations by Sex in Orchard Hills
Management, Business, Science and Arts Occupations
The most common Management, Business, Science and Arts occupations in Orchard Hills are Community & Social Service (43 | 5.3%), Education Instruction & Library (43 | 5.3%), Computers, Engineering & Science (40 | 5.0%), Architecture & Engineering (24 | 3.0%), and Management (18 | 2.2%).
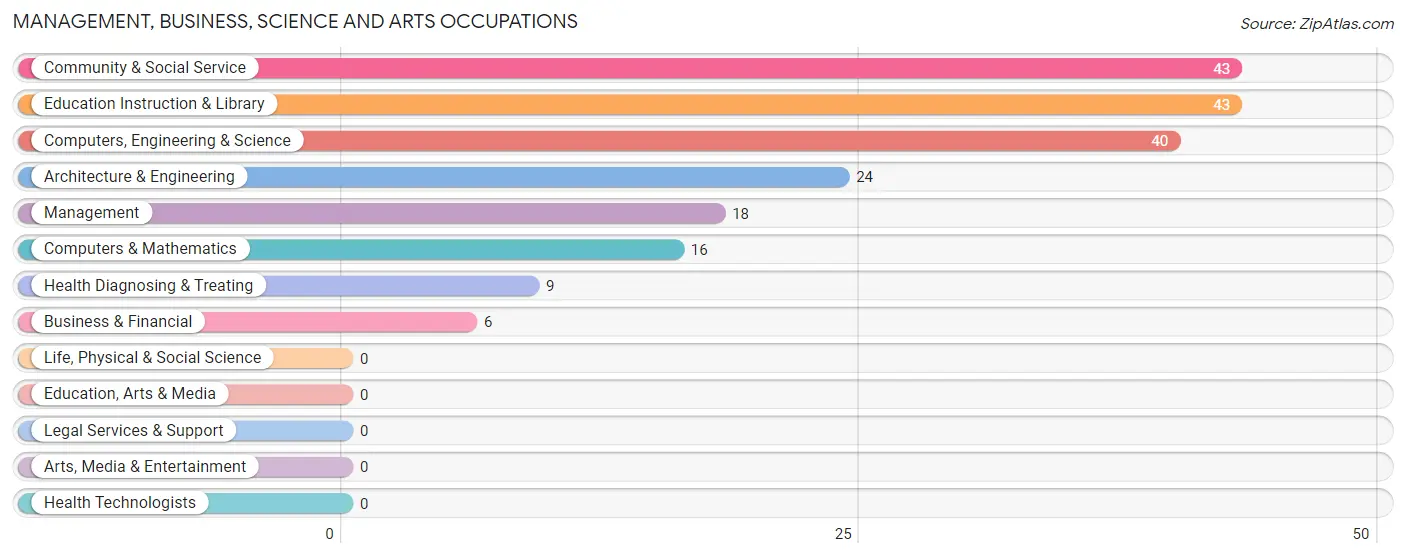
Management, Business, Science and Arts Occupations by Sex
Within the Management, Business, Science and Arts occupations in Orchard Hills, the most male-oriented occupations are Management (100.0%), Business & Financial (100.0%), and Computers, Engineering & Science (100.0%), while the most female-oriented occupations are Health Diagnosing & Treating (100.0%), Community & Social Service (46.5%), and Education Instruction & Library (46.5%).
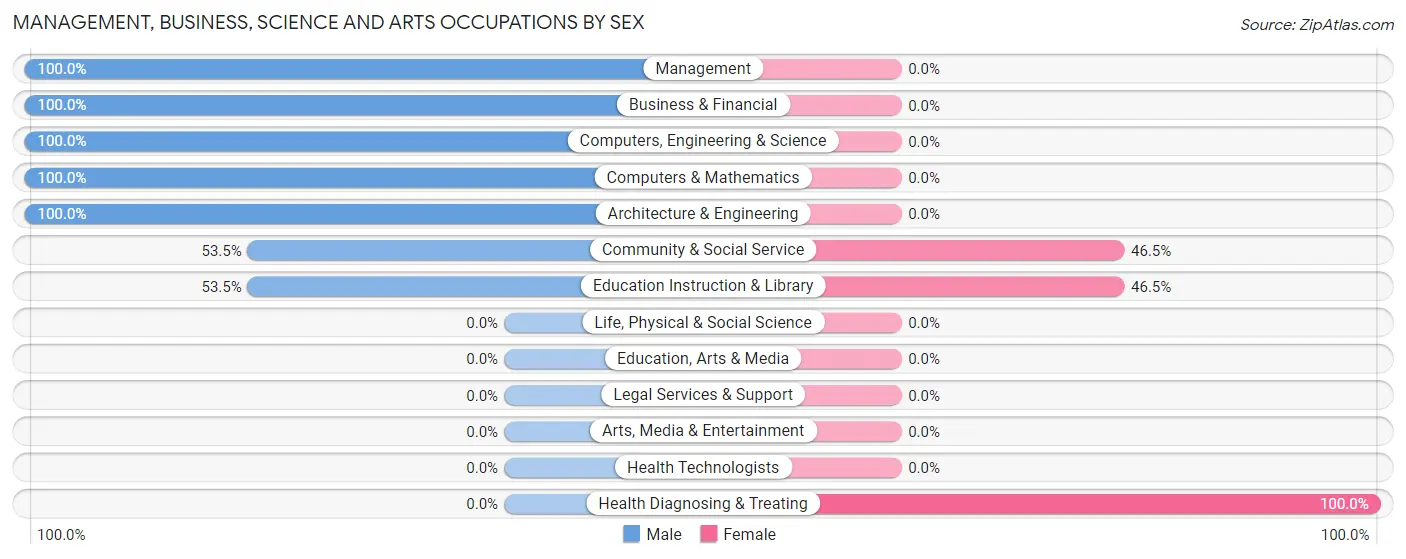
| Occupation | Male | Female |
| Management | 18 (100.0%) | 0 (0.0%) |
| Business & Financial | 6 (100.0%) | 0 (0.0%) |
| Computers, Engineering & Science | 40 (100.0%) | 0 (0.0%) |
| Computers & Mathematics | 16 (100.0%) | 0 (0.0%) |
| Architecture & Engineering | 24 (100.0%) | 0 (0.0%) |
| Life, Physical & Social Science | 0 (0.0%) | 0 (0.0%) |
| Community & Social Service | 23 (53.5%) | 20 (46.5%) |
| Education, Arts & Media | 0 (0.0%) | 0 (0.0%) |
| Legal Services & Support | 0 (0.0%) | 0 (0.0%) |
| Education Instruction & Library | 23 (53.5%) | 20 (46.5%) |
| Arts, Media & Entertainment | 0 (0.0%) | 0 (0.0%) |
| Health Diagnosing & Treating | 0 (0.0%) | 9 (100.0%) |
| Health Technologists | 0 (0.0%) | 0 (0.0%) |
| Total (Category) | 87 (75.0%) | 29 (25.0%) |
| Total (Overall) | 489 (60.7%) | 317 (39.3%) |
Services Occupations
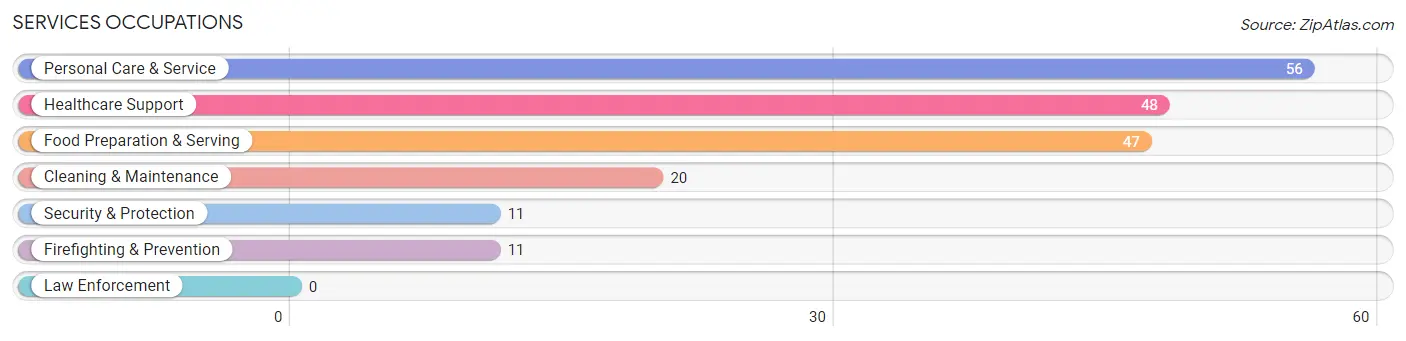
The most common Services occupations in Orchard Hills are Personal Care & Service (56 | 7.0%), Healthcare Support (48 | 6.0%), Food Preparation & Serving (47 | 5.8%), Cleaning & Maintenance (20 | 2.5%), and Security & Protection (11 | 1.4%).
Services Occupations by Sex
Within the Services occupations in Orchard Hills, the most male-oriented occupations are Security & Protection (100.0%), Firefighting & Prevention (100.0%), and Food Preparation & Serving (100.0%), while the most female-oriented occupations are Healthcare Support (100.0%), Cleaning & Maintenance (100.0%), and Personal Care & Service (100.0%).
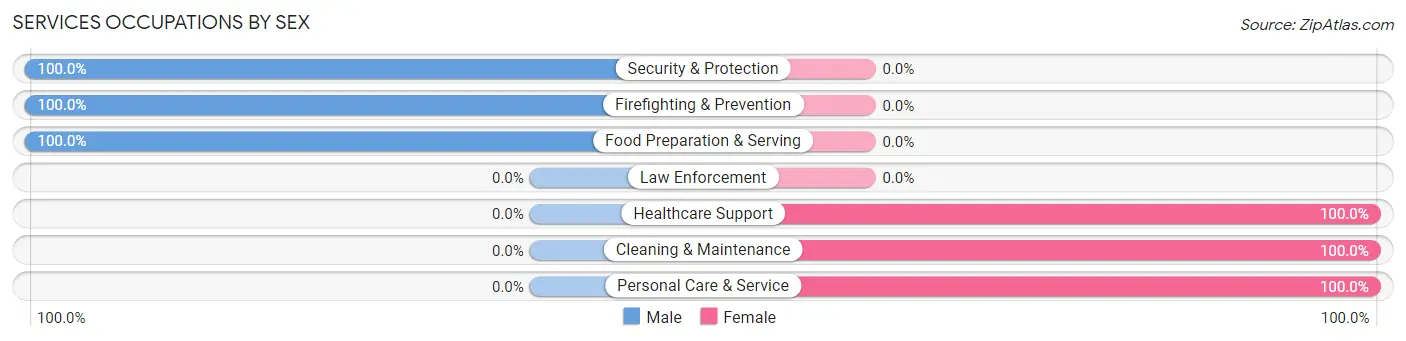
| Occupation | Male | Female |
| Healthcare Support | 0 (0.0%) | 48 (100.0%) |
| Security & Protection | 11 (100.0%) | 0 (0.0%) |
| Firefighting & Prevention | 11 (100.0%) | 0 (0.0%) |
| Law Enforcement | 0 (0.0%) | 0 (0.0%) |
| Food Preparation & Serving | 47 (100.0%) | 0 (0.0%) |
| Cleaning & Maintenance | 0 (0.0%) | 20 (100.0%) |
| Personal Care & Service | 0 (0.0%) | 56 (100.0%) |
| Total (Category) | 58 (31.9%) | 124 (68.1%) |
| Total (Overall) | 489 (60.7%) | 317 (39.3%) |
Sales and Office Occupations
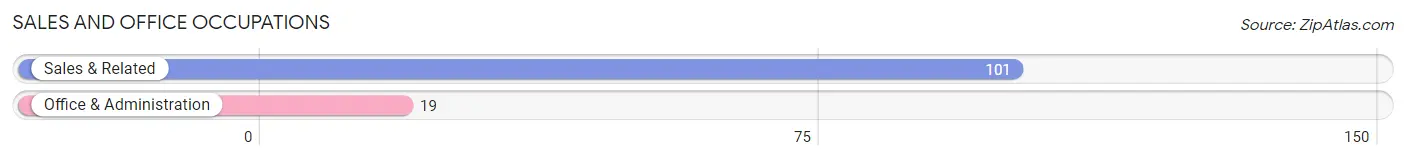
The most common Sales and Office occupations in Orchard Hills are Sales & Related (101 | 12.5%), and Office & Administration (19 | 2.4%).
Sales and Office Occupations by Sex
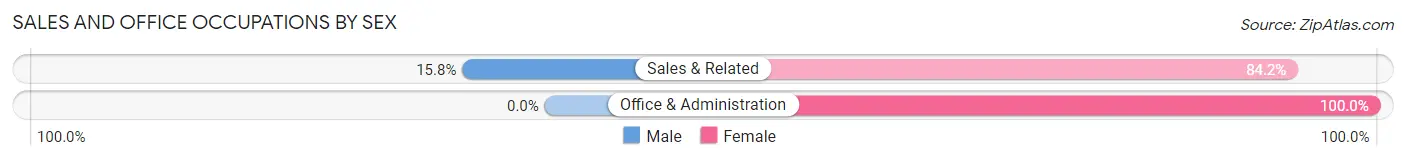
| Occupation | Male | Female |
| Sales & Related | 16 (15.8%) | 85 (84.2%) |
| Office & Administration | 0 (0.0%) | 19 (100.0%) |
| Total (Category) | 16 (13.3%) | 104 (86.7%) |
| Total (Overall) | 489 (60.7%) | 317 (39.3%) |
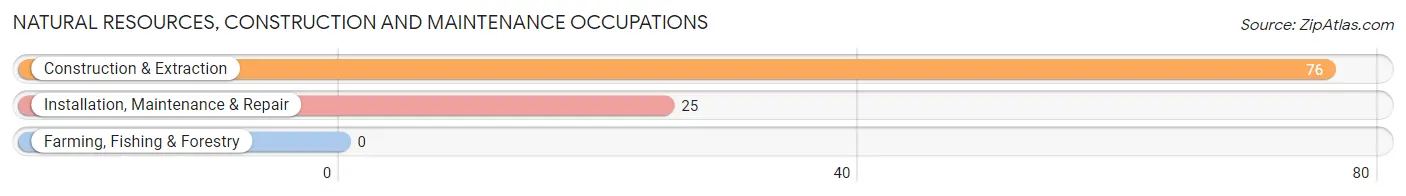
Natural Resources, Construction and Maintenance Occupations
The most common Natural Resources, Construction and Maintenance occupations in Orchard Hills are Construction & Extraction (76 | 9.4%), and Installation, Maintenance & Repair (25 | 3.1%).
Natural Resources, Construction and Maintenance Occupations by Sex
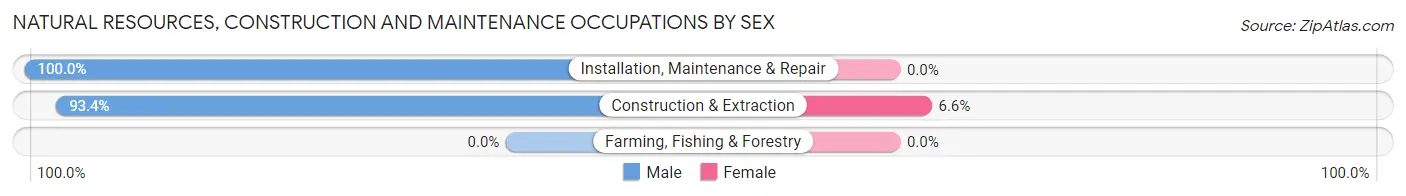
| Occupation | Male | Female |
| Farming, Fishing & Forestry | 0 (0.0%) | 0 (0.0%) |
| Construction & Extraction | 71 (93.4%) | 5 (6.6%) |
| Installation, Maintenance & Repair | 25 (100.0%) | 0 (0.0%) |
| Total (Category) | 96 (95.1%) | 5 (5.0%) |
| Total (Overall) | 489 (60.7%) | 317 (39.3%) |
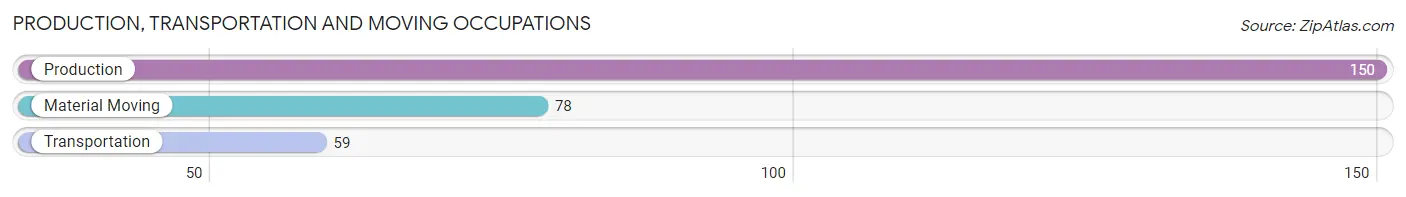
Production, Transportation and Moving Occupations
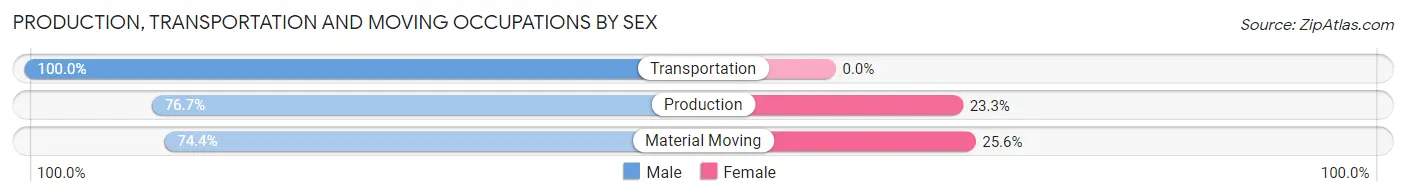
The most common Production, Transportation and Moving occupations in Orchard Hills are Production (150 | 18.6%), Material Moving (78 | 9.7%), and Transportation (59 | 7.3%).
Production, Transportation and Moving Occupations by Sex
| Occupation | Male | Female |
| Production | 115 (76.7%) | 35 (23.3%) |
| Transportation | 59 (100.0%) | 0 (0.0%) |
| Material Moving | 58 (74.4%) | 20 (25.6%) |
| Total (Category) | 232 (80.8%) | 55 (19.2%) |
| Total (Overall) | 489 (60.7%) | 317 (39.3%) |
Employment Industries by Sex in Orchard Hills
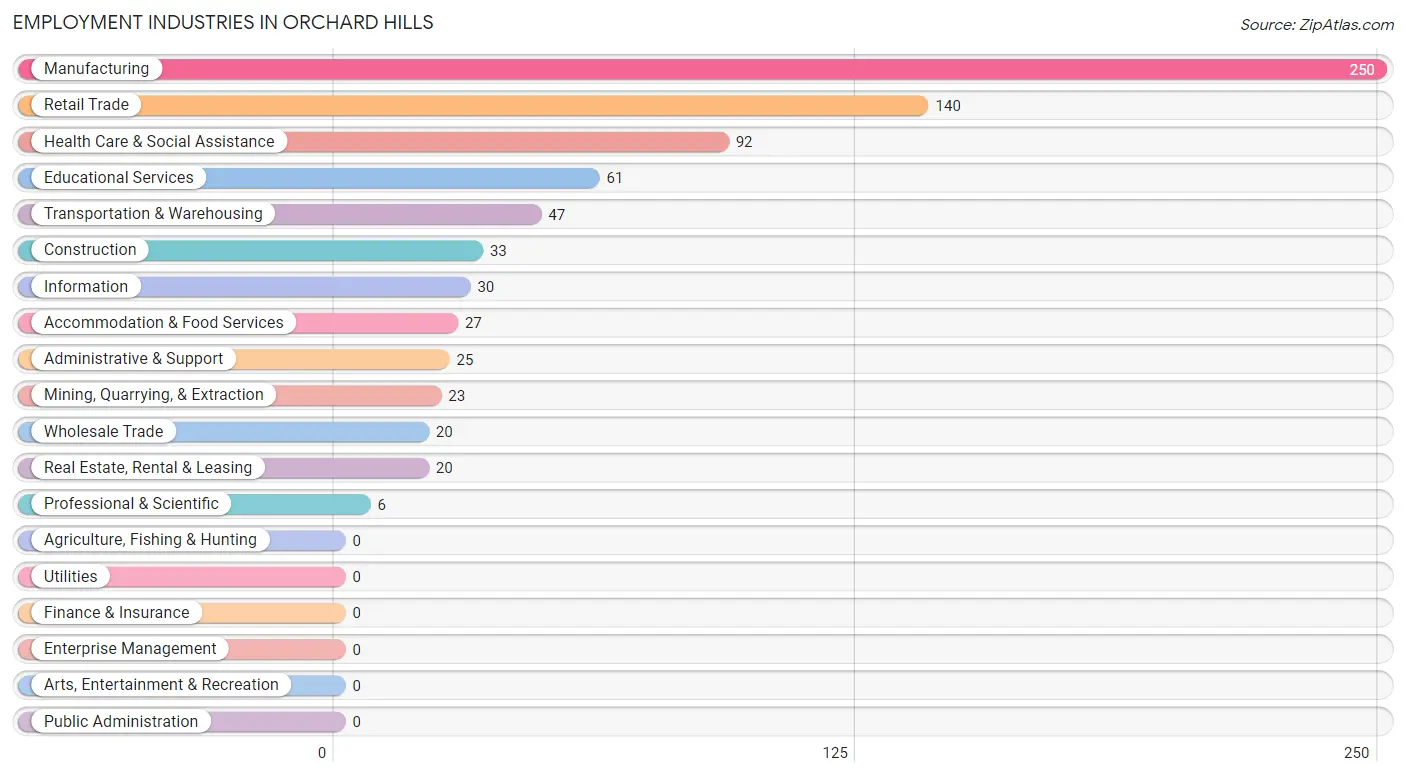
Employment Industries in Orchard Hills
The major employment industries in Orchard Hills include Manufacturing (250 | 31.0%), Retail Trade (140 | 17.4%), Health Care & Social Assistance (92 | 11.4%), Educational Services (61 | 7.6%), and Transportation & Warehousing (47 | 5.8%).
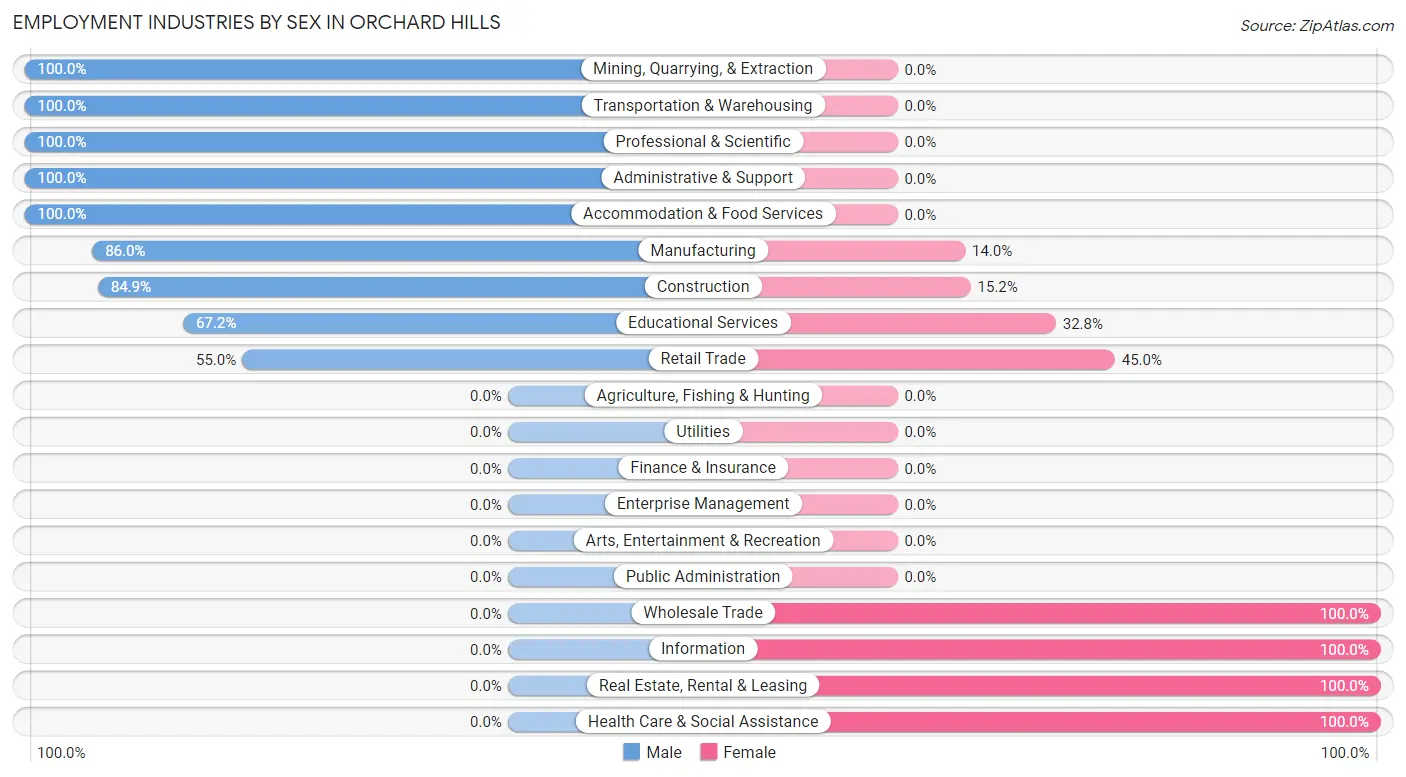
Employment Industries by Sex in Orchard Hills
The Orchard Hills industries that see more men than women are Mining, Quarrying, & Extraction (100.0%), Transportation & Warehousing (100.0%), and Professional & Scientific (100.0%), whereas the industries that tend to have a higher number of women are Wholesale Trade (100.0%), Information (100.0%), and Real Estate, Rental & Leasing (100.0%).
| Industry | Male | Female |
| Agriculture, Fishing & Hunting | 0 (0.0%) | 0 (0.0%) |
| Mining, Quarrying, & Extraction | 23 (100.0%) | 0 (0.0%) |
| Construction | 28 (84.9%) | 5 (15.1%) |
| Manufacturing | 215 (86.0%) | 35 (14.0%) |
| Wholesale Trade | 0 (0.0%) | 20 (100.0%) |
| Retail Trade | 77 (55.0%) | 63 (45.0%) |
| Transportation & Warehousing | 47 (100.0%) | 0 (0.0%) |
| Utilities | 0 (0.0%) | 0 (0.0%) |
| Information | 0 (0.0%) | 30 (100.0%) |
| Finance & Insurance | 0 (0.0%) | 0 (0.0%) |
| Real Estate, Rental & Leasing | 0 (0.0%) | 20 (100.0%) |
| Professional & Scientific | 6 (100.0%) | 0 (0.0%) |
| Enterprise Management | 0 (0.0%) | 0 (0.0%) |
| Administrative & Support | 25 (100.0%) | 0 (0.0%) |
| Educational Services | 41 (67.2%) | 20 (32.8%) |
| Health Care & Social Assistance | 0 (0.0%) | 92 (100.0%) |
| Arts, Entertainment & Recreation | 0 (0.0%) | 0 (0.0%) |
| Accommodation & Food Services | 27 (100.0%) | 0 (0.0%) |
| Public Administration | 0 (0.0%) | 0 (0.0%) |
| Total | 489 (60.7%) | 317 (39.3%) |
Education in Orchard Hills
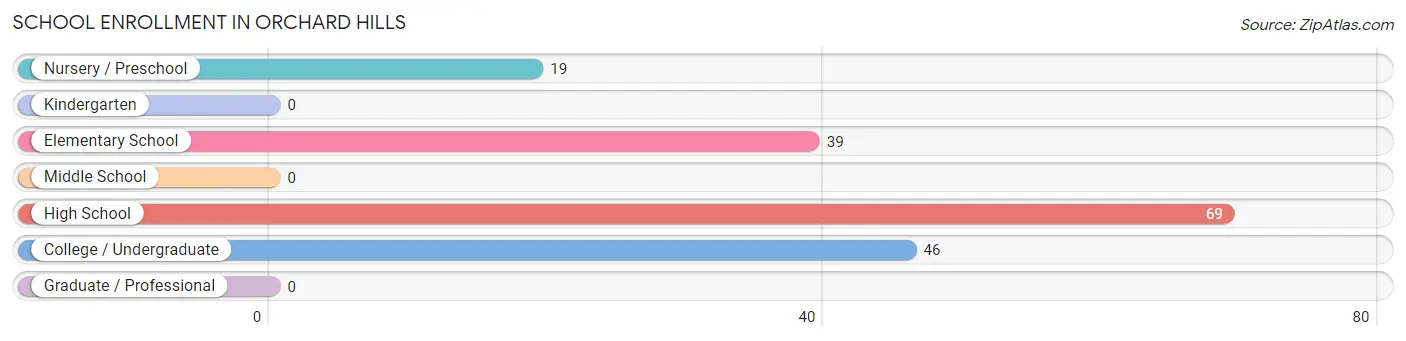
School Enrollment in Orchard Hills
The most common levels of schooling among the 173 students in Orchard Hills are high school (69 | 39.9%), college / undergraduate (46 | 26.6%), and elementary school (39 | 22.5%).
| School Level | # Students | % Students |
| Nursery / Preschool | 19 | 11.0% |
| Kindergarten | 0 | 0.0% |
| Elementary School | 39 | 22.5% |
| Middle School | 0 | 0.0% |
| High School | 69 | 39.9% |
| College / Undergraduate | 46 | 26.6% |
| Graduate / Professional | 0 | 0.0% |
| Total | 173 | 100.0% |
School Enrollment by Age by Funding Source in Orchard Hills
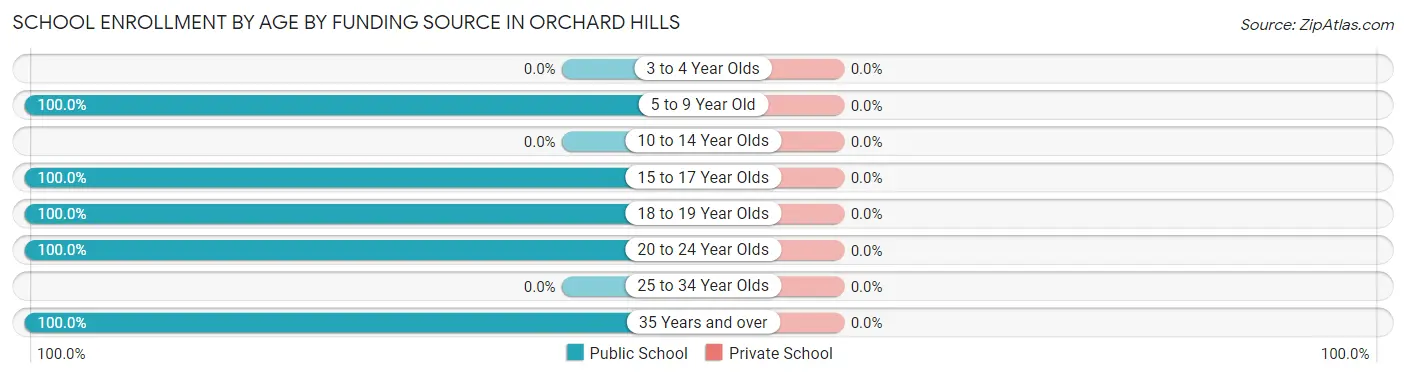
| Age Bracket | Public School | Private School |
| 3 to 4 Year Olds | 0 (0.0%) | 0 (0.0%) |
| 5 to 9 Year Old | 58 (100.0%) | 0 (0.0%) |
| 10 to 14 Year Olds | 0 (0.0%) | 0 (0.0%) |
| 15 to 17 Year Olds | 16 (100.0%) | 0 (0.0%) |
| 18 to 19 Year Olds | 58 (100.0%) | 0 (0.0%) |
| 20 to 24 Year Olds | 11 (100.0%) | 0 (0.0%) |
| 25 to 34 Year Olds | 0 (0.0%) | 0 (0.0%) |
| 35 Years and over | 30 (100.0%) | 0 (0.0%) |
| Total | 173 (100.0%) | 0 (0.0%) |
Educational Attainment by Field of Study in Orchard Hills
Education (195 | 67.7%), business (51 | 17.7%), engineering (29 | 10.1%), and arts & humanities (13 | 4.5%) are the most common fields of study among 288 individuals in Orchard Hills who have obtained a bachelor's degree or higher.
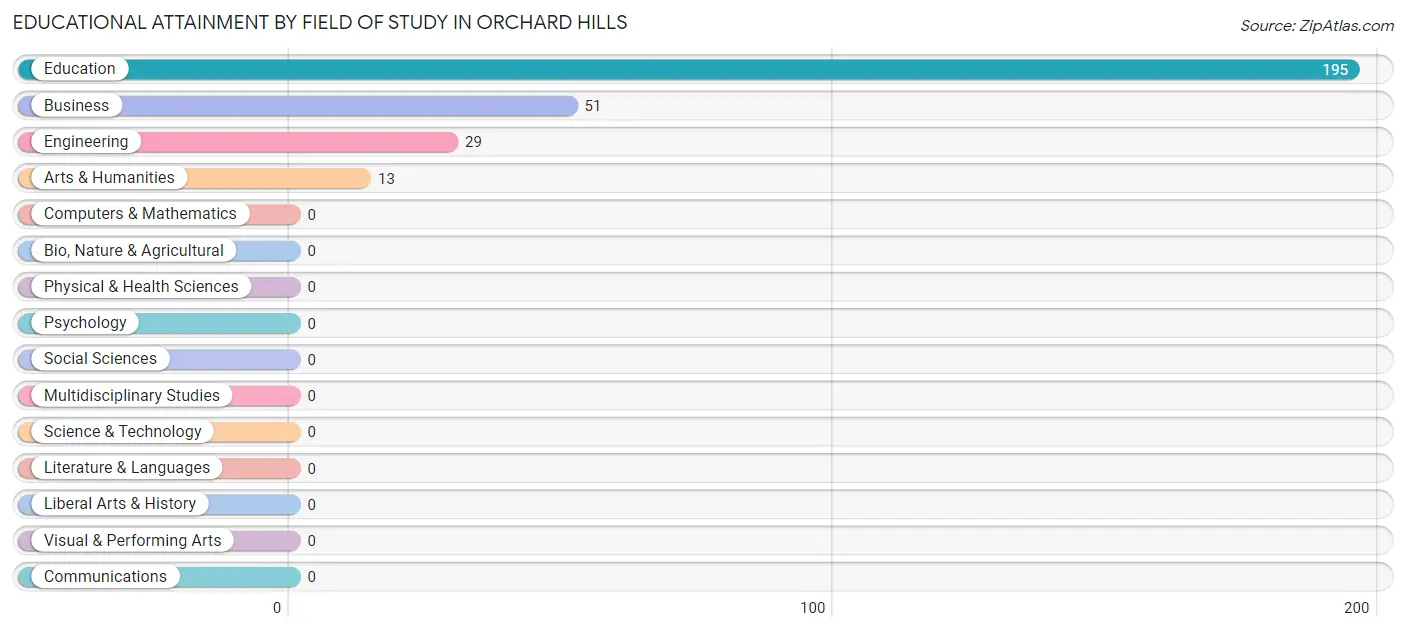
| Field of Study | # Graduates | % Graduates |
| Computers & Mathematics | 0 | 0.0% |
| Bio, Nature & Agricultural | 0 | 0.0% |
| Physical & Health Sciences | 0 | 0.0% |
| Psychology | 0 | 0.0% |
| Social Sciences | 0 | 0.0% |
| Engineering | 29 | 10.1% |
| Multidisciplinary Studies | 0 | 0.0% |
| Science & Technology | 0 | 0.0% |
| Business | 51 | 17.7% |
| Education | 195 | 67.7% |
| Literature & Languages | 0 | 0.0% |
| Liberal Arts & History | 0 | 0.0% |
| Visual & Performing Arts | 0 | 0.0% |
| Communications | 0 | 0.0% |
| Arts & Humanities | 13 | 4.5% |
| Total | 288 | 100.0% |
Transportation & Commute in Orchard Hills
Vehicle Availability by Sex in Orchard Hills
The most prevalent vehicle ownership categories in Orchard Hills are males with 2 vehicles (210, accounting for 42.9%) and females with 2 vehicles (117, making up 66.2%).
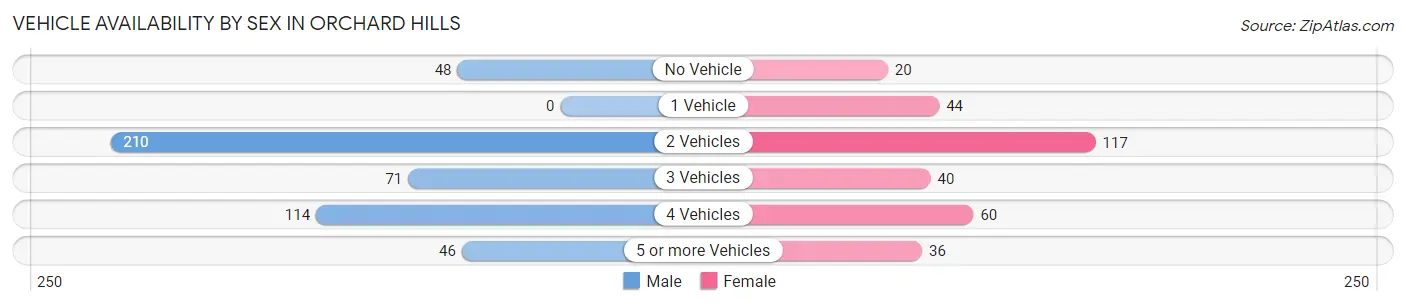
| Vehicles Available | Male | Female |
| No Vehicle | 48 (9.8%) | 20 (6.3%) |
| 1 Vehicle | 0 (0.0%) | 44 (13.9%) |
| 2 Vehicles | 210 (42.9%) | 117 (36.9%) |
| 3 Vehicles | 71 (14.5%) | 40 (12.6%) |
| 4 Vehicles | 114 (23.3%) | 60 (18.9%) |
| 5 or more Vehicles | 46 (9.4%) | 36 (11.4%) |
| Total | 489 (100.0%) | 317 (100.0%) |
Commute Time in Orchard Hills
The most frequently occuring commute durations in Orchard Hills are 15 to 19 minutes (191 commuters, 24.4%), 45 to 59 minutes (113 commuters, 14.4%), and 5 to 9 minutes (85 commuters, 10.8%).
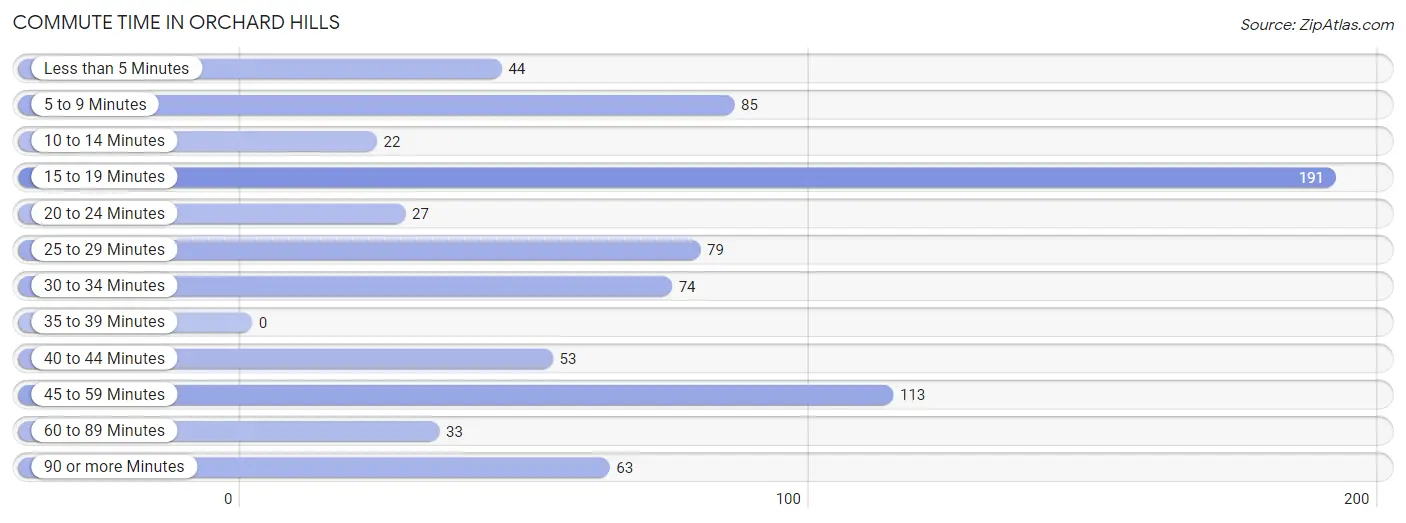
| Commute Time | # Commuters | % Commuters |
| Less than 5 Minutes | 44 | 5.6% |
| 5 to 9 Minutes | 85 | 10.8% |
| 10 to 14 Minutes | 22 | 2.8% |
| 15 to 19 Minutes | 191 | 24.4% |
| 20 to 24 Minutes | 27 | 3.4% |
| 25 to 29 Minutes | 79 | 10.1% |
| 30 to 34 Minutes | 74 | 9.4% |
| 35 to 39 Minutes | 0 | 0.0% |
| 40 to 44 Minutes | 53 | 6.8% |
| 45 to 59 Minutes | 113 | 14.4% |
| 60 to 89 Minutes | 33 | 4.2% |
| 90 or more Minutes | 63 | 8.0% |
Commute Time by Sex in Orchard Hills
The most common commute times in Orchard Hills are 15 to 19 minutes (95 commuters, 19.4%) for males and 15 to 19 minutes (96 commuters, 32.5%) for females.
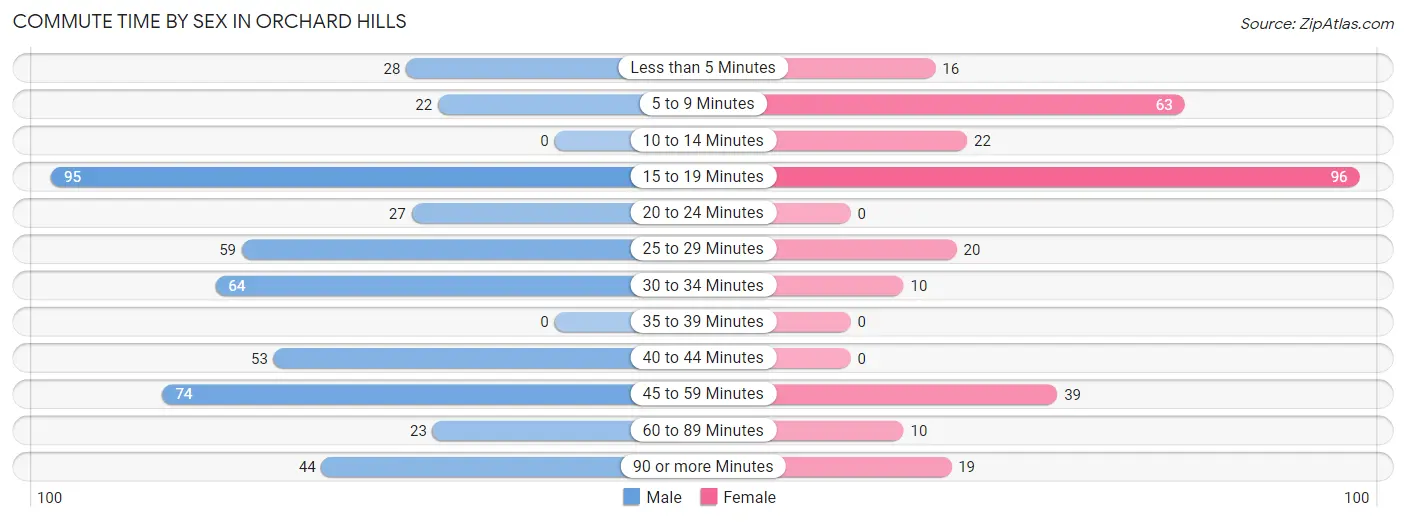
| Commute Time | Male | Female |
| Less than 5 Minutes | 28 (5.7%) | 16 (5.4%) |
| 5 to 9 Minutes | 22 (4.5%) | 63 (21.4%) |
| 10 to 14 Minutes | 0 (0.0%) | 22 (7.5%) |
| 15 to 19 Minutes | 95 (19.4%) | 96 (32.5%) |
| 20 to 24 Minutes | 27 (5.5%) | 0 (0.0%) |
| 25 to 29 Minutes | 59 (12.1%) | 20 (6.8%) |
| 30 to 34 Minutes | 64 (13.1%) | 10 (3.4%) |
| 35 to 39 Minutes | 0 (0.0%) | 0 (0.0%) |
| 40 to 44 Minutes | 53 (10.8%) | 0 (0.0%) |
| 45 to 59 Minutes | 74 (15.1%) | 39 (13.2%) |
| 60 to 89 Minutes | 23 (4.7%) | 10 (3.4%) |
| 90 or more Minutes | 44 (9.0%) | 19 (6.4%) |
Time of Departure to Work by Sex in Orchard Hills
The most frequent times of departure to work in Orchard Hills are 6:00 AM to 6:29 AM (97, 19.8%) for males and 12:00 PM to 3:59 PM (76, 25.8%) for females.
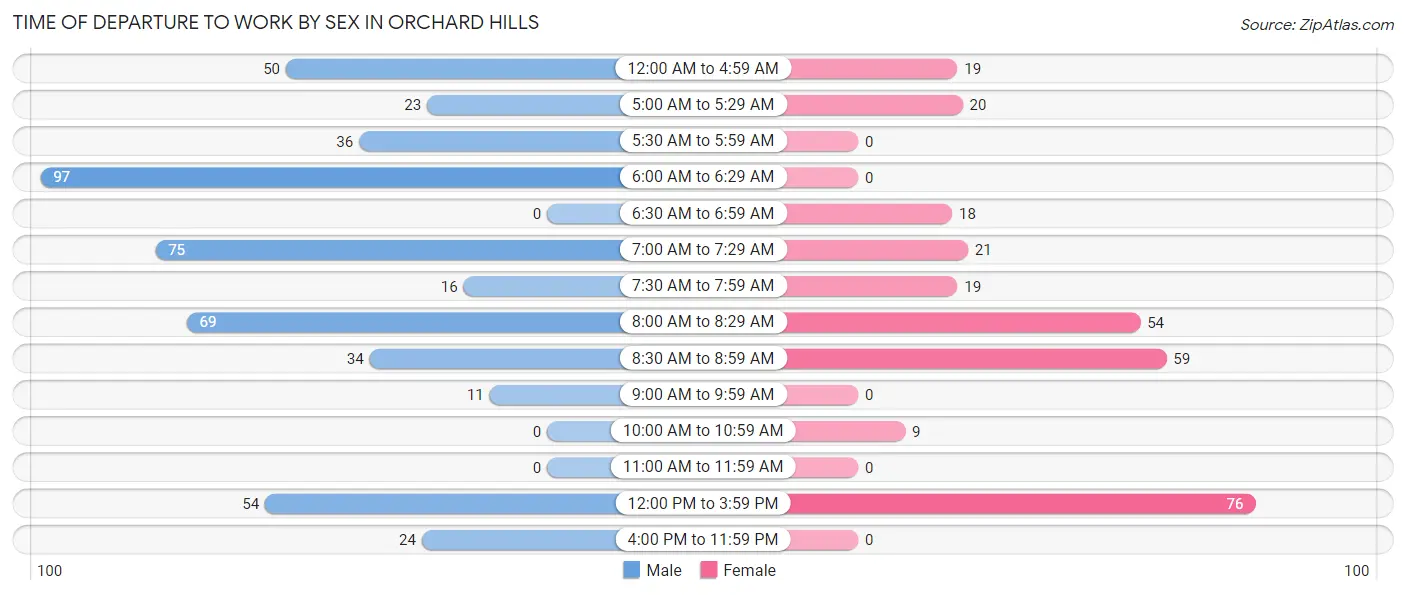
| Time of Departure | Male | Female |
| 12:00 AM to 4:59 AM | 50 (10.2%) | 19 (6.4%) |
| 5:00 AM to 5:29 AM | 23 (4.7%) | 20 (6.8%) |
| 5:30 AM to 5:59 AM | 36 (7.4%) | 0 (0.0%) |
| 6:00 AM to 6:29 AM | 97 (19.8%) | 0 (0.0%) |
| 6:30 AM to 6:59 AM | 0 (0.0%) | 18 (6.1%) |
| 7:00 AM to 7:29 AM | 75 (15.3%) | 21 (7.1%) |
| 7:30 AM to 7:59 AM | 16 (3.3%) | 19 (6.4%) |
| 8:00 AM to 8:29 AM | 69 (14.1%) | 54 (18.3%) |
| 8:30 AM to 8:59 AM | 34 (7.0%) | 59 (20.0%) |
| 9:00 AM to 9:59 AM | 11 (2.2%) | 0 (0.0%) |
| 10:00 AM to 10:59 AM | 0 (0.0%) | 9 (3.0%) |
| 11:00 AM to 11:59 AM | 0 (0.0%) | 0 (0.0%) |
| 12:00 PM to 3:59 PM | 54 (11.0%) | 76 (25.8%) |
| 4:00 PM to 11:59 PM | 24 (4.9%) | 0 (0.0%) |
| Total | 489 (100.0%) | 295 (100.0%) |
Housing Occupancy in Orchard Hills
Occupancy by Ownership in Orchard Hills
Of the total 758 dwellings in Orchard Hills, owner-occupied units account for 616 (81.3%), while renter-occupied units make up 142 (18.7%).
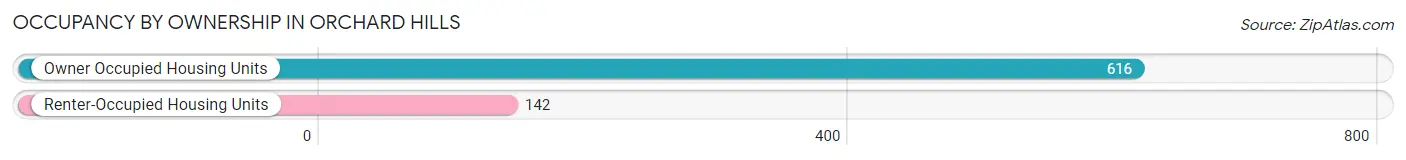
| Occupancy | # Housing Units | % Housing Units |
| Owner Occupied Housing Units | 616 | 81.3% |
| Renter-Occupied Housing Units | 142 | 18.7% |
| Total Occupied Housing Units | 758 | 100.0% |
Occupancy by Household Size in Orchard Hills
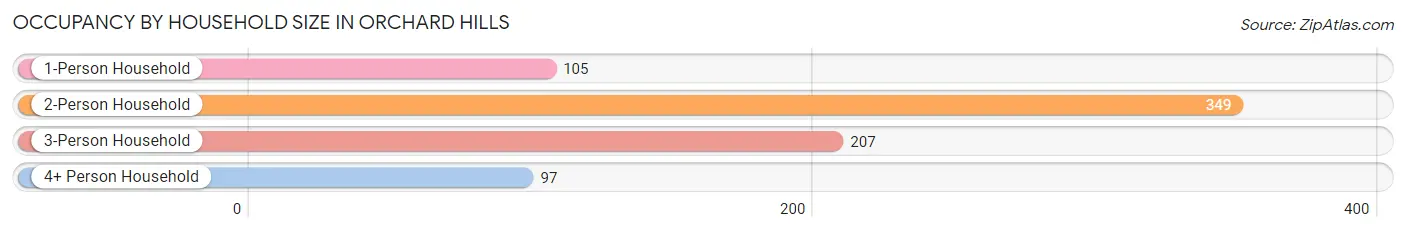
| Household Size | # Housing Units | % Housing Units |
| 1-Person Household | 105 | 13.9% |
| 2-Person Household | 349 | 46.0% |
| 3-Person Household | 207 | 27.3% |
| 4+ Person Household | 97 | 12.8% |
| Total Housing Units | 758 | 100.0% |
Occupancy by Ownership by Household Size in Orchard Hills
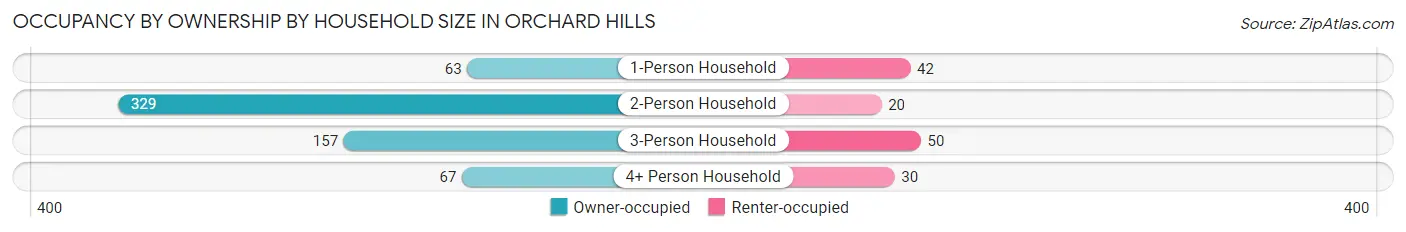
| Household Size | Owner-occupied | Renter-occupied |
| 1-Person Household | 63 (60.0%) | 42 (40.0%) |
| 2-Person Household | 329 (94.3%) | 20 (5.7%) |
| 3-Person Household | 157 (75.8%) | 50 (24.1%) |
| 4+ Person Household | 67 (69.1%) | 30 (30.9%) |
| Total Housing Units | 616 (81.3%) | 142 (18.7%) |
Occupancy by Educational Attainment in Orchard Hills
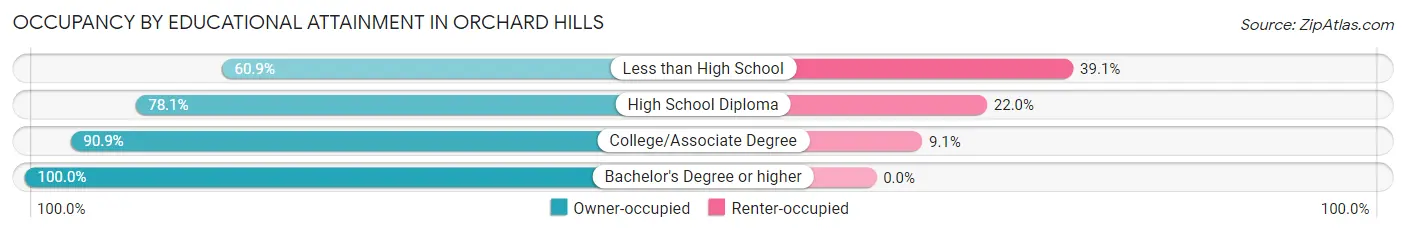
| Household Size | Owner-occupied | Renter-occupied |
| Less than High School | 78 (60.9%) | 50 (39.1%) |
| High School Diploma | 256 (78.0%) | 72 (22.0%) |
| College/Associate Degree | 200 (90.9%) | 20 (9.1%) |
| Bachelor's Degree or higher | 82 (100.0%) | 0 (0.0%) |
Occupancy by Age of Householder in Orchard Hills
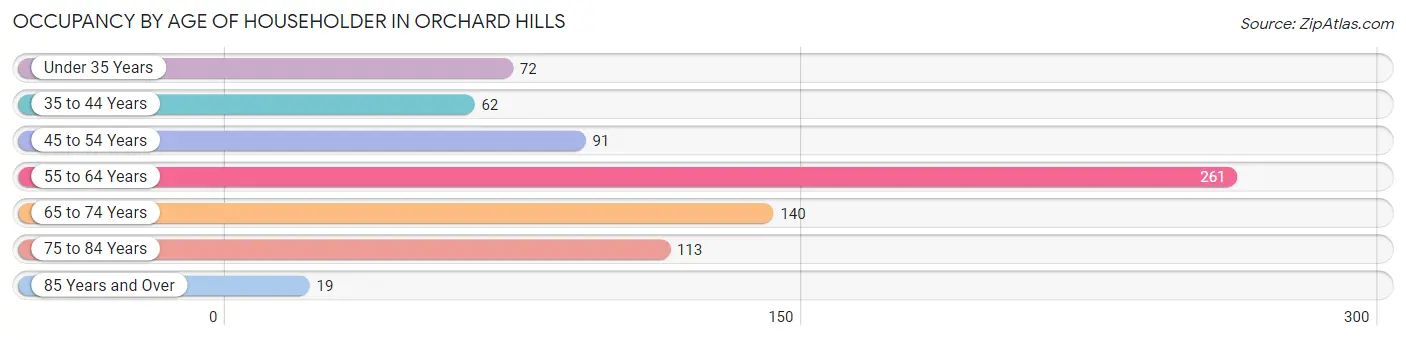
| Age Bracket | # Households | % Households |
| Under 35 Years | 72 | 9.5% |
| 35 to 44 Years | 62 | 8.2% |
| 45 to 54 Years | 91 | 12.0% |
| 55 to 64 Years | 261 | 34.4% |
| 65 to 74 Years | 140 | 18.5% |
| 75 to 84 Years | 113 | 14.9% |
| 85 Years and Over | 19 | 2.5% |
| Total | 758 | 100.0% |
Housing Finances in Orchard Hills
Median Income by Occupancy in Orchard Hills
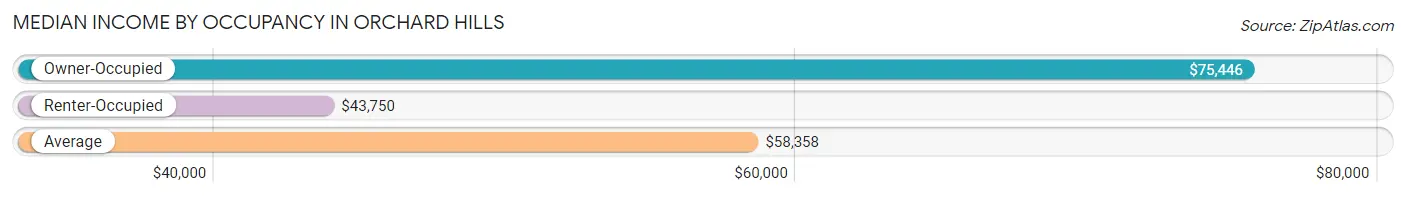
| Occupancy Type | # Households | Median Income |
| Owner-Occupied | 616 (81.3%) | $75,446 |
| Renter-Occupied | 142 (18.7%) | $43,750 |
| Average | 758 (100.0%) | $58,358 |
Occupancy by Householder Income Bracket in Orchard Hills
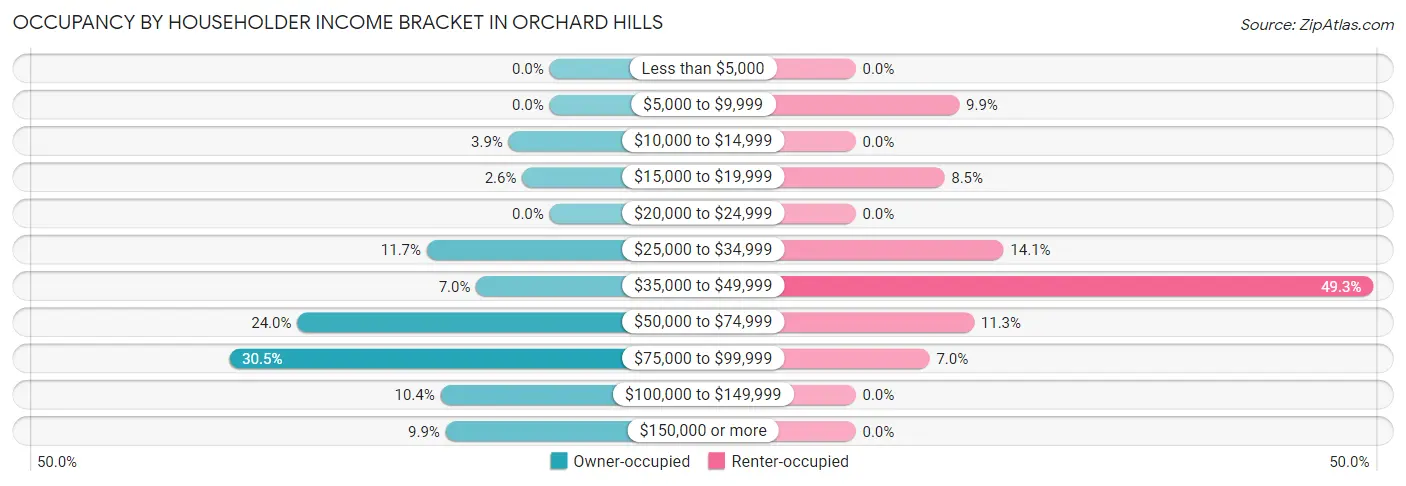
| Income Bracket | Owner-occupied | Renter-occupied |
| Less than $5,000 | 0 (0.0%) | 0 (0.0%) |
| $5,000 to $9,999 | 0 (0.0%) | 14 (9.9%) |
| $10,000 to $14,999 | 24 (3.9%) | 0 (0.0%) |
| $15,000 to $19,999 | 16 (2.6%) | 12 (8.5%) |
| $20,000 to $24,999 | 0 (0.0%) | 0 (0.0%) |
| $25,000 to $34,999 | 72 (11.7%) | 20 (14.1%) |
| $35,000 to $49,999 | 43 (7.0%) | 70 (49.3%) |
| $50,000 to $74,999 | 148 (24.0%) | 16 (11.3%) |
| $75,000 to $99,999 | 188 (30.5%) | 10 (7.0%) |
| $100,000 to $149,999 | 64 (10.4%) | 0 (0.0%) |
| $150,000 or more | 61 (9.9%) | 0 (0.0%) |
| Total | 616 (100.0%) | 142 (100.0%) |
Monthly Housing Cost Tiers in Orchard Hills
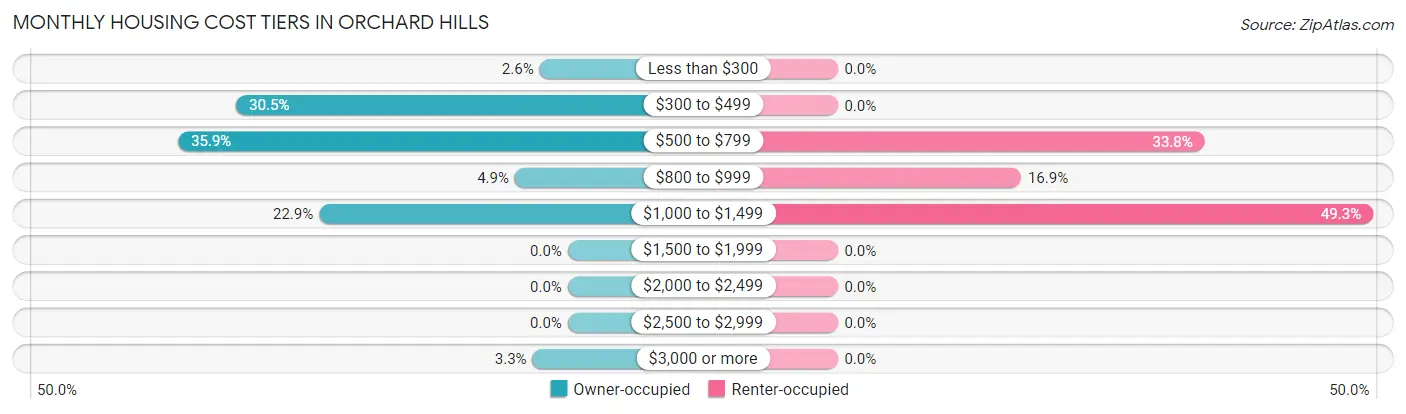
| Monthly Cost | Owner-occupied | Renter-occupied |
| Less than $300 | 16 (2.6%) | 0 (0.0%) |
| $300 to $499 | 188 (30.5%) | 0 (0.0%) |
| $500 to $799 | 221 (35.9%) | 48 (33.8%) |
| $800 to $999 | 30 (4.9%) | 24 (16.9%) |
| $1,000 to $1,499 | 141 (22.9%) | 70 (49.3%) |
| $1,500 to $1,999 | 0 (0.0%) | 0 (0.0%) |
| $2,000 to $2,499 | 0 (0.0%) | 0 (0.0%) |
| $2,500 to $2,999 | 0 (0.0%) | 0 (0.0%) |
| $3,000 or more | 20 (3.3%) | 0 (0.0%) |
| Total | 616 (100.0%) | 142 (100.0%) |
Physical Housing Characteristics in Orchard Hills
Housing Structures in Orchard Hills
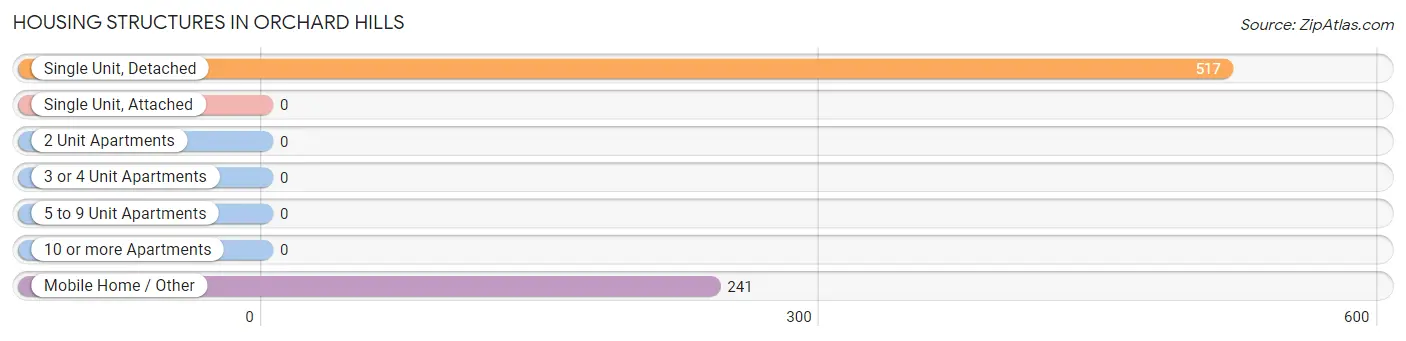
| Structure Type | # Housing Units | % Housing Units |
| Single Unit, Detached | 517 | 68.2% |
| Single Unit, Attached | 0 | 0.0% |
| 2 Unit Apartments | 0 | 0.0% |
| 3 or 4 Unit Apartments | 0 | 0.0% |
| 5 to 9 Unit Apartments | 0 | 0.0% |
| 10 or more Apartments | 0 | 0.0% |
| Mobile Home / Other | 241 | 31.8% |
| Total | 758 | 100.0% |
Housing Structures by Occupancy in Orchard Hills
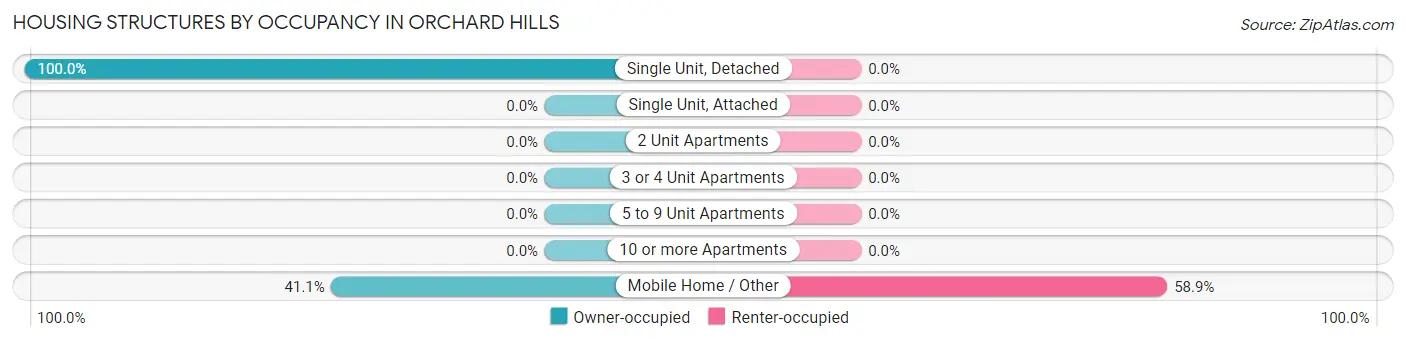
| Structure Type | Owner-occupied | Renter-occupied |
| Single Unit, Detached | 517 (100.0%) | 0 (0.0%) |
| Single Unit, Attached | 0 (0.0%) | 0 (0.0%) |
| 2 Unit Apartments | 0 (0.0%) | 0 (0.0%) |
| 3 or 4 Unit Apartments | 0 (0.0%) | 0 (0.0%) |
| 5 to 9 Unit Apartments | 0 (0.0%) | 0 (0.0%) |
| 10 or more Apartments | 0 (0.0%) | 0 (0.0%) |
| Mobile Home / Other | 99 (41.1%) | 142 (58.9%) |
| Total | 616 (81.3%) | 142 (18.7%) |
Housing Structures by Number of Rooms in Orchard Hills
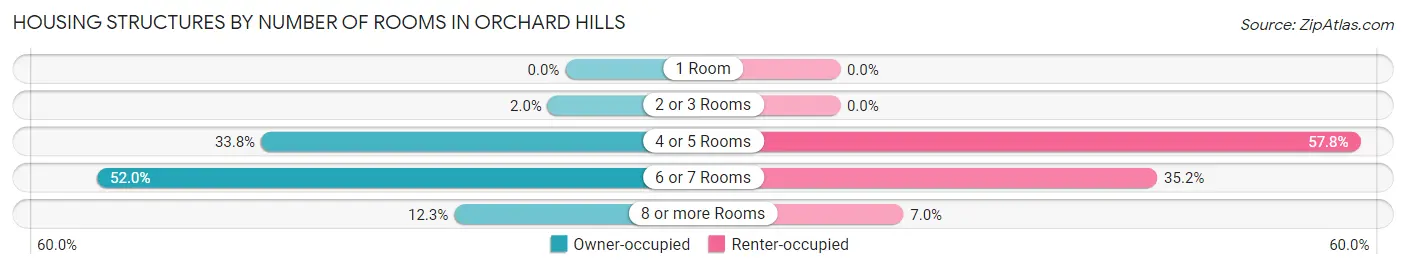
| Number of Rooms | Owner-occupied | Renter-occupied |
| 1 Room | 0 (0.0%) | 0 (0.0%) |
| 2 or 3 Rooms | 12 (1.9%) | 0 (0.0%) |
| 4 or 5 Rooms | 208 (33.8%) | 82 (57.8%) |
| 6 or 7 Rooms | 320 (51.9%) | 50 (35.2%) |
| 8 or more Rooms | 76 (12.3%) | 10 (7.0%) |
| Total | 616 (100.0%) | 142 (100.0%) |
Housing Structure by Heating Type in Orchard Hills
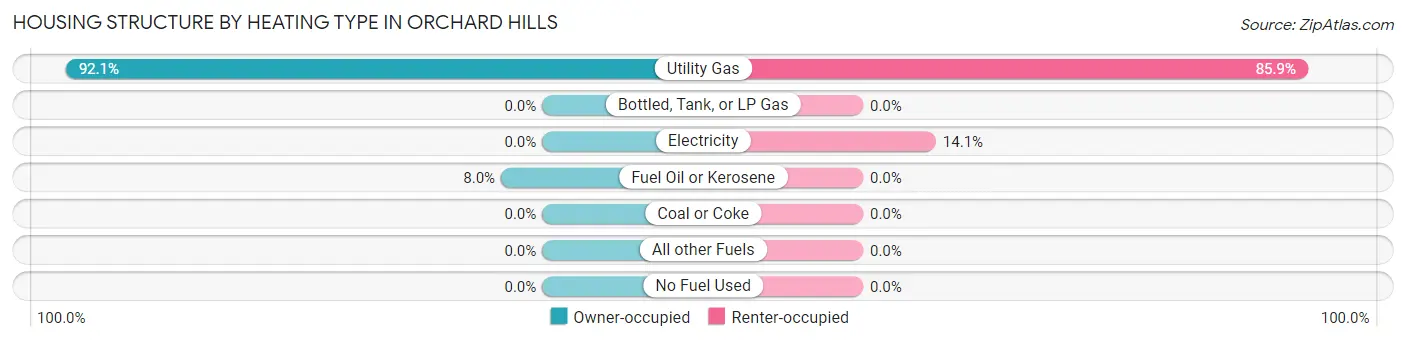
| Heating Type | Owner-occupied | Renter-occupied |
| Utility Gas | 567 (92.0%) | 122 (85.9%) |
| Bottled, Tank, or LP Gas | 0 (0.0%) | 0 (0.0%) |
| Electricity | 0 (0.0%) | 20 (14.1%) |
| Fuel Oil or Kerosene | 49 (8.0%) | 0 (0.0%) |
| Coal or Coke | 0 (0.0%) | 0 (0.0%) |
| All other Fuels | 0 (0.0%) | 0 (0.0%) |
| No Fuel Used | 0 (0.0%) | 0 (0.0%) |
| Total | 616 (100.0%) | 142 (100.0%) |
Household Vehicle Usage in Orchard Hills
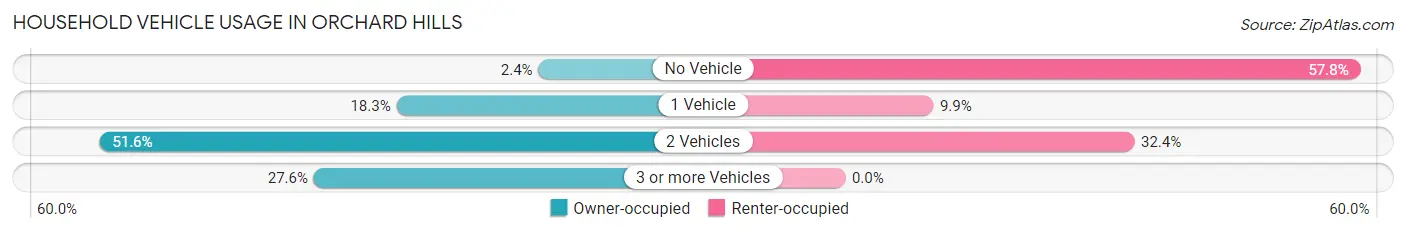
| Vehicles per Household | Owner-occupied | Renter-occupied |
| No Vehicle | 15 (2.4%) | 82 (57.8%) |
| 1 Vehicle | 113 (18.3%) | 14 (9.9%) |
| 2 Vehicles | 318 (51.6%) | 46 (32.4%) |
| 3 or more Vehicles | 170 (27.6%) | 0 (0.0%) |
| Total | 616 (100.0%) | 142 (100.0%) |
Real Estate & Mortgages in Orchard Hills
Real Estate and Mortgage Overview in Orchard Hills
| Characteristic | Without Mortgage | With Mortgage |
| Housing Units | 344 | 272 |
| Median Property Value | $105,800 | $87,700 |
| Median Household Income | $58,507 | $61 |
| Monthly Housing Costs | $473 | $20 |
| Real Estate Taxes | $2,161 | $0 |
Property Value by Mortgage Status in Orchard Hills
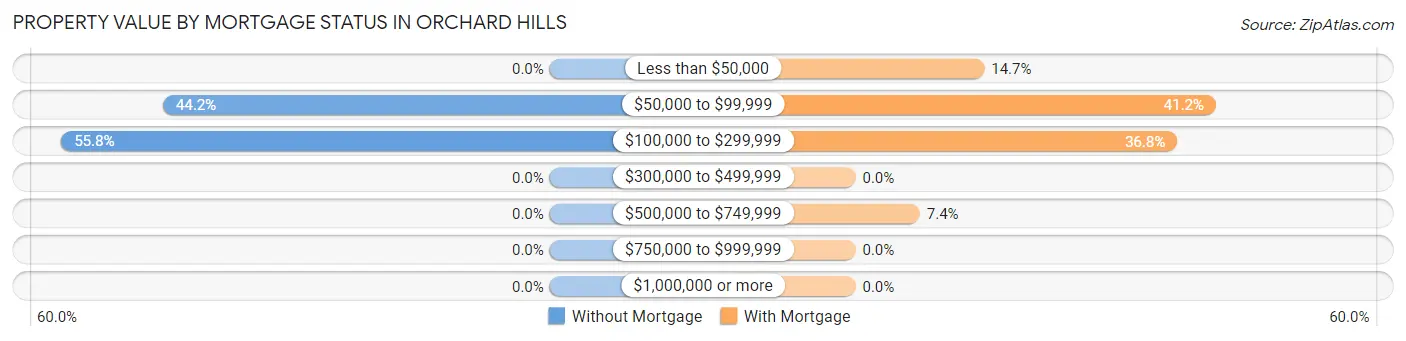
| Property Value | Without Mortgage | With Mortgage |
| Less than $50,000 | 0 (0.0%) | 40 (14.7%) |
| $50,000 to $99,999 | 152 (44.2%) | 112 (41.2%) |
| $100,000 to $299,999 | 192 (55.8%) | 100 (36.8%) |
| $300,000 to $499,999 | 0 (0.0%) | 0 (0.0%) |
| $500,000 to $749,999 | 0 (0.0%) | 20 (7.3%) |
| $750,000 to $999,999 | 0 (0.0%) | 0 (0.0%) |
| $1,000,000 or more | 0 (0.0%) | 0 (0.0%) |
| Total | 344 (100.0%) | 272 (100.0%) |
Household Income by Mortgage Status in Orchard Hills
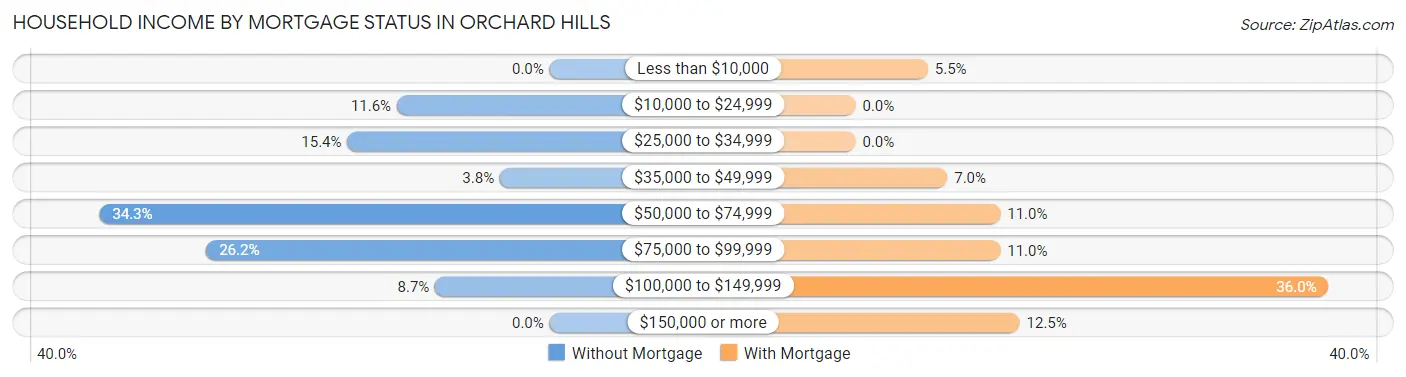
| Household Income | Without Mortgage | With Mortgage |
| Less than $10,000 | 0 (0.0%) | 15 (5.5%) |
| $10,000 to $24,999 | 40 (11.6%) | 0 (0.0%) |
| $25,000 to $34,999 | 53 (15.4%) | 0 (0.0%) |
| $35,000 to $49,999 | 13 (3.8%) | 19 (7.0%) |
| $50,000 to $74,999 | 118 (34.3%) | 30 (11.0%) |
| $75,000 to $99,999 | 90 (26.2%) | 30 (11.0%) |
| $100,000 to $149,999 | 30 (8.7%) | 98 (36.0%) |
| $150,000 or more | 0 (0.0%) | 34 (12.5%) |
| Total | 344 (100.0%) | 272 (100.0%) |
Property Value to Household Income Ratio in Orchard Hills
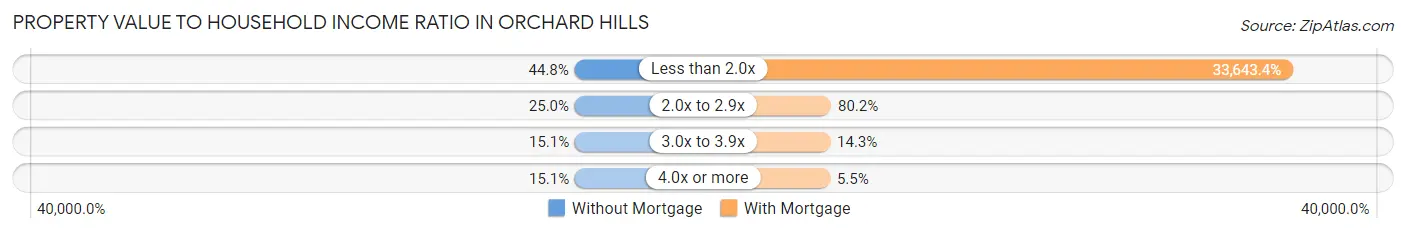
| Value-to-Income Ratio | Without Mortgage | With Mortgage |
| Less than 2.0x | 154 (44.8%) | 91,510 (33,643.4%) |
| 2.0x to 2.9x | 86 (25.0%) | 218 (80.1%) |
| 3.0x to 3.9x | 52 (15.1%) | 39 (14.3%) |
| 4.0x or more | 52 (15.1%) | 15 (5.5%) |
| Total | 344 (100.0%) | 272 (100.0%) |
Real Estate Taxes by Mortgage Status in Orchard Hills
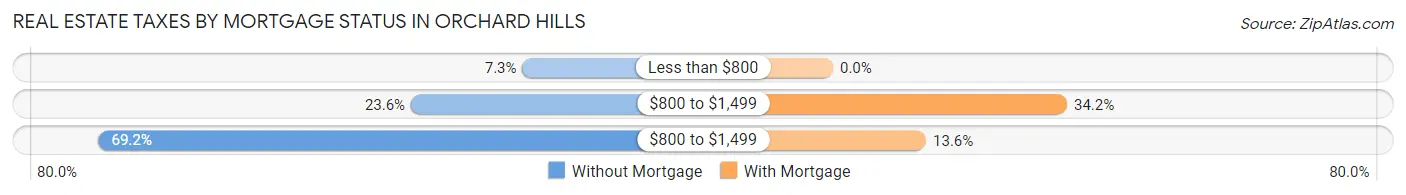
| Property Taxes | Without Mortgage | With Mortgage |
| Less than $800 | 25 (7.3%) | 0 (0.0%) |
| $800 to $1,499 | 81 (23.5%) | 93 (34.2%) |
| $800 to $1,499 | 238 (69.2%) | 37 (13.6%) |
| Total | 344 (100.0%) | 272 (100.0%) |
Health & Disability in Orchard Hills
Health Insurance Coverage by Age in Orchard Hills
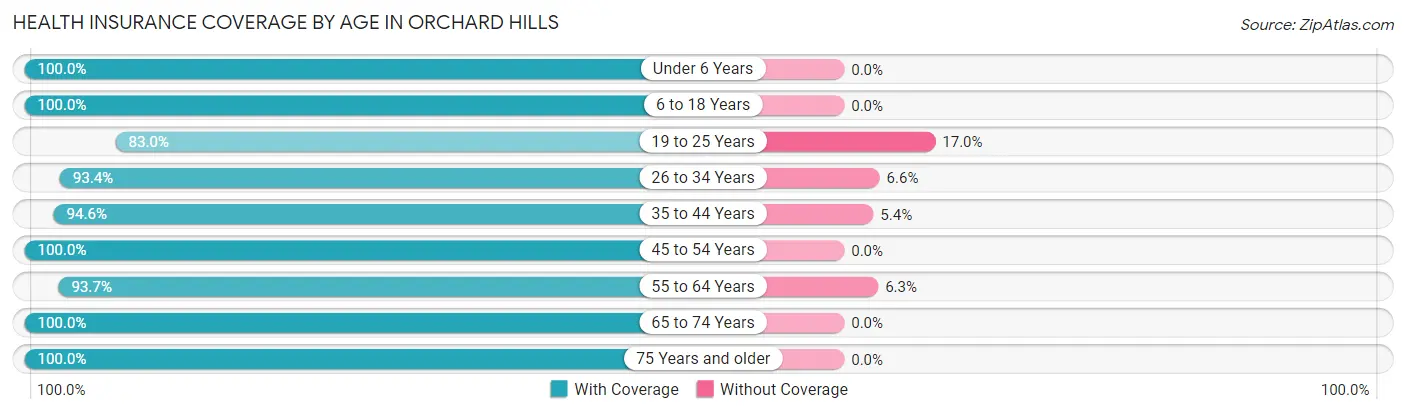
| Age Bracket | With Coverage | Without Coverage |
| Under 6 Years | 53 (100.0%) | 0 (0.0%) |
| 6 to 18 Years | 107 (100.0%) | 0 (0.0%) |
| 19 to 25 Years | 132 (83.0%) | 27 (17.0%) |
| 26 to 34 Years | 241 (93.4%) | 17 (6.6%) |
| 35 to 44 Years | 174 (94.6%) | 10 (5.4%) |
| 45 to 54 Years | 188 (100.0%) | 0 (0.0%) |
| 55 to 64 Years | 355 (93.7%) | 24 (6.3%) |
| 65 to 74 Years | 317 (100.0%) | 0 (0.0%) |
| 75 Years and older | 275 (100.0%) | 0 (0.0%) |
| Total | 1,842 (95.9%) | 78 (4.1%) |
Health Insurance Coverage by Citizenship Status in Orchard Hills
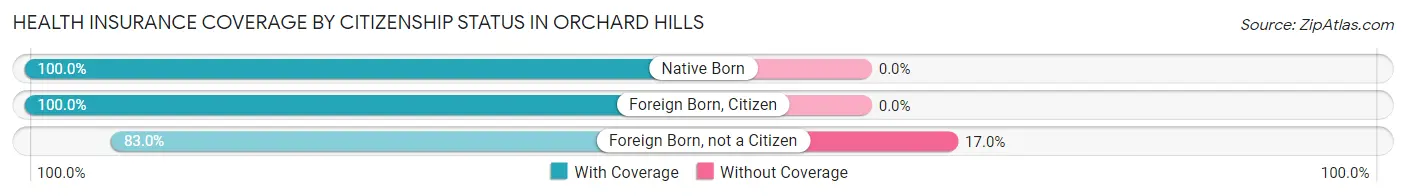
| Citizenship Status | With Coverage | Without Coverage |
| Native Born | 53 (100.0%) | 0 (0.0%) |
| Foreign Born, Citizen | 107 (100.0%) | 0 (0.0%) |
| Foreign Born, not a Citizen | 132 (83.0%) | 27 (17.0%) |
Health Insurance Coverage by Household Income in Orchard Hills
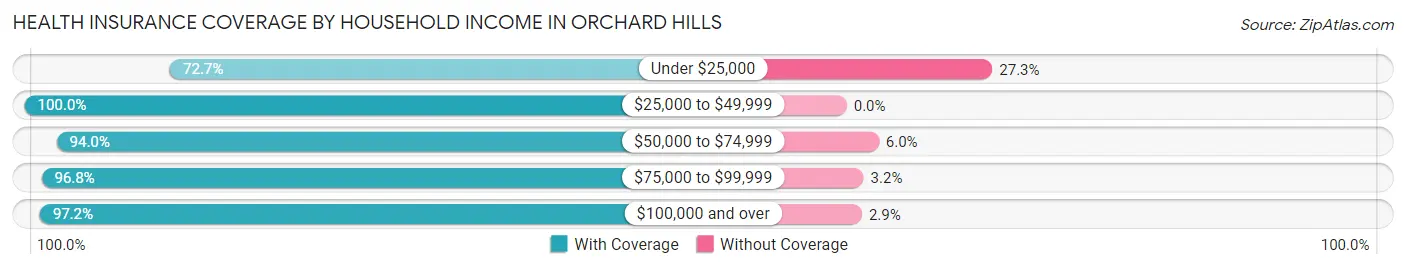
| Household Income | With Coverage | Without Coverage |
| Under $25,000 | 64 (72.7%) | 24 (27.3%) |
| $25,000 to $49,999 | 493 (100.0%) | 0 (0.0%) |
| $50,000 to $74,999 | 423 (94.0%) | 27 (6.0%) |
| $75,000 to $99,999 | 521 (96.8%) | 17 (3.2%) |
| $100,000 and over | 341 (97.2%) | 10 (2.9%) |
Public vs Private Health Insurance Coverage by Age in Orchard Hills
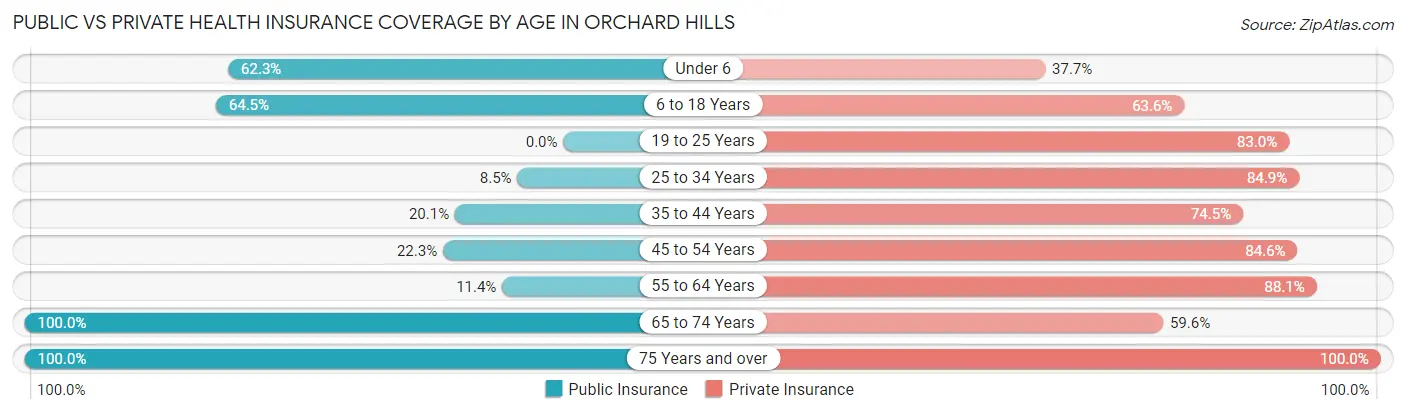
| Age Bracket | Public Insurance | Private Insurance |
| Under 6 | 33 (62.3%) | 20 (37.7%) |
| 6 to 18 Years | 69 (64.5%) | 68 (63.5%) |
| 19 to 25 Years | 0 (0.0%) | 132 (83.0%) |
| 25 to 34 Years | 22 (8.5%) | 219 (84.9%) |
| 35 to 44 Years | 37 (20.1%) | 137 (74.5%) |
| 45 to 54 Years | 42 (22.3%) | 159 (84.6%) |
| 55 to 64 Years | 43 (11.4%) | 334 (88.1%) |
| 65 to 74 Years | 317 (100.0%) | 189 (59.6%) |
| 75 Years and over | 275 (100.0%) | 275 (100.0%) |
| Total | 838 (43.6%) | 1,533 (79.8%) |
Disability Status by Sex by Age in Orchard Hills
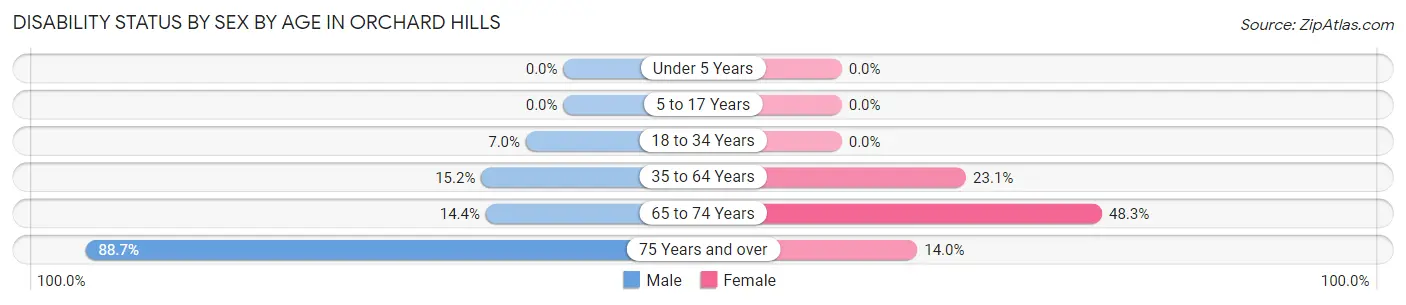
| Age Bracket | Male | Female |
| Under 5 Years | 0 (0.0%) | 0 (0.0%) |
| 5 to 17 Years | 0 (0.0%) | 0 (0.0%) |
| 18 to 34 Years | 22 (7.0%) | 0 (0.0%) |
| 35 to 64 Years | 57 (15.2%) | 87 (23.1%) |
| 65 to 74 Years | 20 (14.4%) | 86 (48.3%) |
| 75 Years and over | 149 (88.7%) | 15 (14.0%) |
Disability Class by Sex by Age in Orchard Hills
Disability Class: Hearing Difficulty
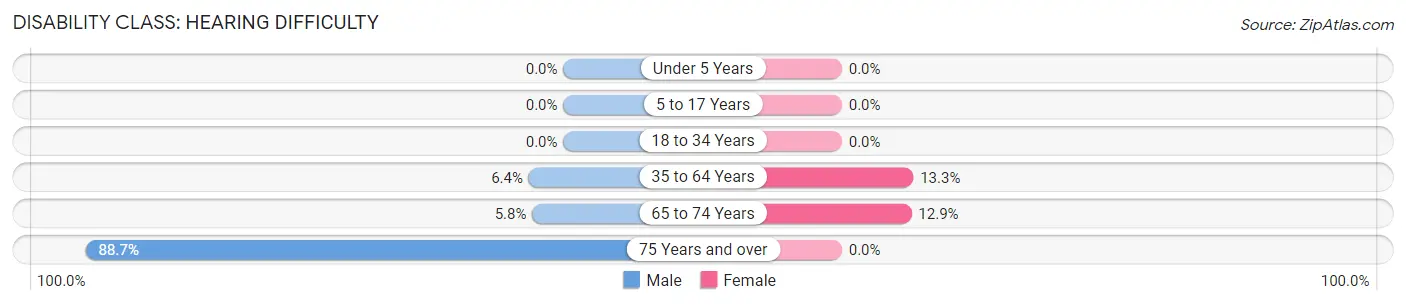
| Age Bracket | Male | Female |
| Under 5 Years | 0 (0.0%) | 0 (0.0%) |
| 5 to 17 Years | 0 (0.0%) | 0 (0.0%) |
| 18 to 34 Years | 0 (0.0%) | 0 (0.0%) |
| 35 to 64 Years | 24 (6.4%) | 50 (13.3%) |
| 65 to 74 Years | 8 (5.8%) | 23 (12.9%) |
| 75 Years and over | 149 (88.7%) | 0 (0.0%) |
Disability Class: Vision Difficulty
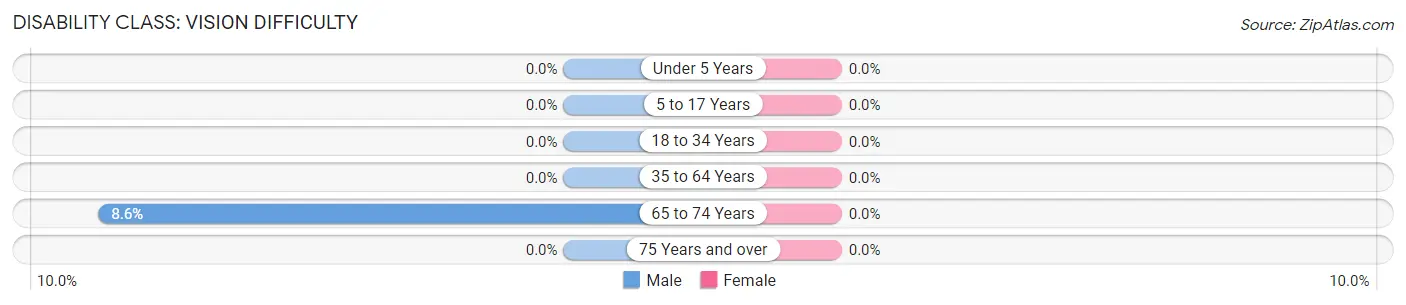
| Age Bracket | Male | Female |
| Under 5 Years | 0 (0.0%) | 0 (0.0%) |
| 5 to 17 Years | 0 (0.0%) | 0 (0.0%) |
| 18 to 34 Years | 0 (0.0%) | 0 (0.0%) |
| 35 to 64 Years | 0 (0.0%) | 0 (0.0%) |
| 65 to 74 Years | 12 (8.6%) | 0 (0.0%) |
| 75 Years and over | 0 (0.0%) | 0 (0.0%) |
Disability Class: Cognitive Difficulty
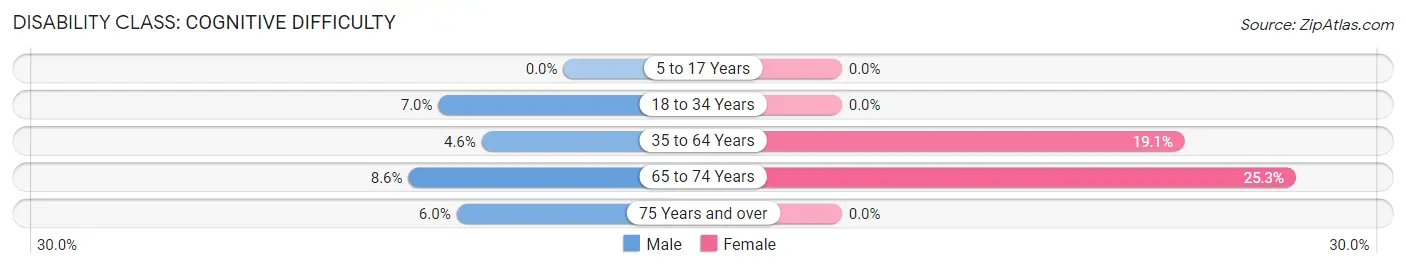
| Age Bracket | Male | Female |
| 5 to 17 Years | 0 (0.0%) | 0 (0.0%) |
| 18 to 34 Years | 22 (7.0%) | 0 (0.0%) |
| 35 to 64 Years | 17 (4.5%) | 72 (19.1%) |
| 65 to 74 Years | 12 (8.6%) | 45 (25.3%) |
| 75 Years and over | 10 (5.9%) | 0 (0.0%) |
Disability Class: Ambulatory Difficulty
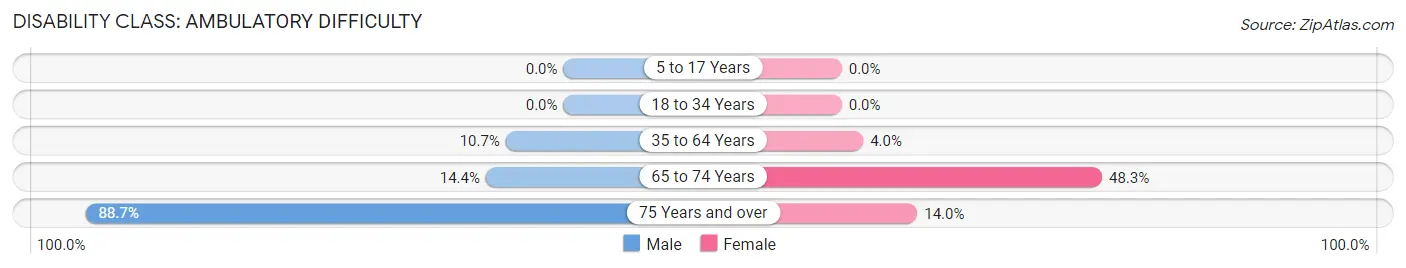
| Age Bracket | Male | Female |
| 5 to 17 Years | 0 (0.0%) | 0 (0.0%) |
| 18 to 34 Years | 0 (0.0%) | 0 (0.0%) |
| 35 to 64 Years | 40 (10.7%) | 15 (4.0%) |
| 65 to 74 Years | 20 (14.4%) | 86 (48.3%) |
| 75 Years and over | 149 (88.7%) | 15 (14.0%) |
Disability Class: Self-Care Difficulty
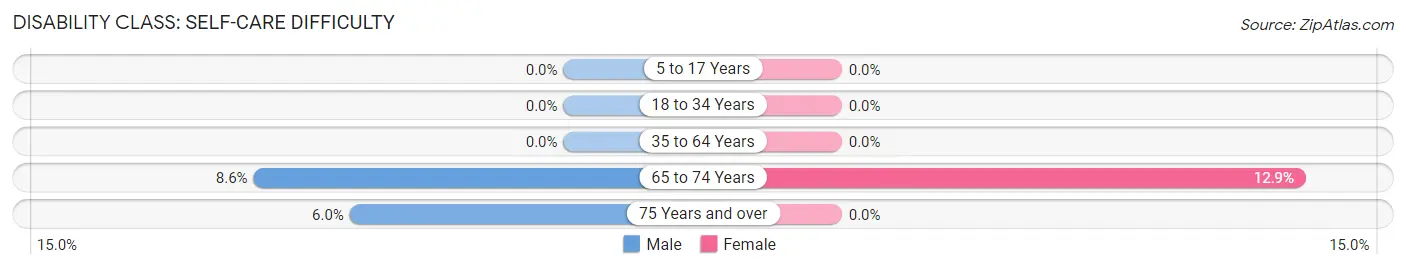
| Age Bracket | Male | Female |
| 5 to 17 Years | 0 (0.0%) | 0 (0.0%) |
| 18 to 34 Years | 0 (0.0%) | 0 (0.0%) |
| 35 to 64 Years | 0 (0.0%) | 0 (0.0%) |
| 65 to 74 Years | 12 (8.6%) | 23 (12.9%) |
| 75 Years and over | 10 (5.9%) | 0 (0.0%) |
Technology Access in Orchard Hills
Computing Device Access in Orchard Hills
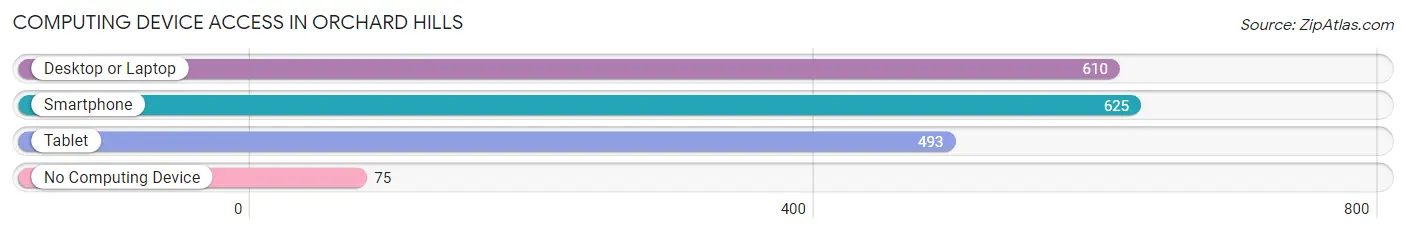
| Device Type | # Households | % Households |
| Desktop or Laptop | 610 | 80.5% |
| Smartphone | 625 | 82.5% |
| Tablet | 493 | 65.0% |
| No Computing Device | 75 | 9.9% |
| Total | 758 | 100.0% |
Internet Access in Orchard Hills
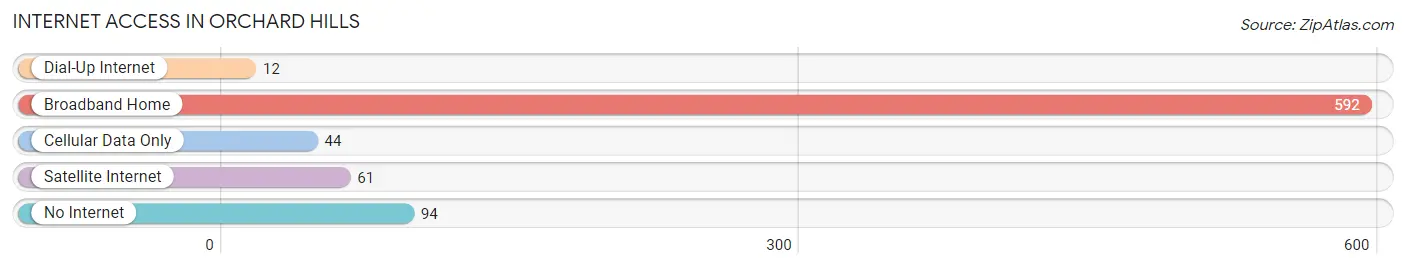
| Internet Type | # Households | % Households |
| Dial-Up Internet | 12 | 1.6% |
| Broadband Home | 592 | 78.1% |
| Cellular Data Only | 44 | 5.8% |
| Satellite Internet | 61 | 8.1% |
| No Internet | 94 | 12.4% |
| Total | 758 | 100.0% |
Orchard Hills Summary
Orchard Hills, Pennsylvania is a small borough located in the southwestern corner of Allegheny County. It is situated on the banks of the Monongahela River, just north of the city of Pittsburgh. The borough was founded in 1876 and is home to a population of approximately 1,500 people.
History
The area that is now Orchard Hills was originally inhabited by the Shawnee and Delaware Native American tribes. The first European settlers arrived in the area in the late 1700s, and the area was officially incorporated as a borough in 1876. The borough was named after the many apple orchards that were planted in the area by the early settlers.
In the late 1800s, the borough was home to several coal mines, which provided employment for many of the residents. The coal industry declined in the early 1900s, and the borough began to transition to a more residential area. The borough was also home to several steel mills, which provided employment for many of the residents.
Geography
Orchard Hills is located in the southwestern corner of Allegheny County, Pennsylvania. It is situated on the banks of the Monongahela River, just north of the city of Pittsburgh. The borough is bordered by the boroughs of West Mifflin and Dravosburg to the north, and the boroughs of Elizabeth and West Elizabeth to the south. The borough is approximately 4.5 square miles in size and is home to a population of approximately 1,500 people.
The borough is located in a hilly region of the Allegheny Mountains, and the terrain is mostly wooded. The borough is home to several parks, including Orchard Hills Park, which features a playground, picnic area, and walking trails.
Economy
The economy of Orchard Hills is largely based on the service industry. The borough is home to several restaurants, retail stores, and other businesses. The borough is also home to several manufacturing companies, including a steel mill and a paper mill.
The borough is also home to several educational institutions, including the Orchard Hills School District, which serves the borough and the surrounding area. The district is home to two elementary schools, one middle school, and one high school.
Demographics
As of the 2010 census, the population of Orchard Hills was 1,500. The racial makeup of the borough was 97.3% White, 0.7% African American, 0.3% Native American, 0.3% Asian, and 1.3% from other races. The median household income was $41,250, and the median family income was $50,000.
The borough is home to a large number of churches, including the Orchard Hills United Methodist Church, the Orchard Hills Presbyterian Church, and the Orchard Hills Baptist Church. The borough is also home to several civic organizations, including the Orchard Hills Lions Club and the Orchard Hills Historical Society.
Common Questions
What is Per Capita Income in Orchard Hills?
Per Capita income in Orchard Hills is $30,473.
What is the Median Family Income in Orchard Hills?
Median Family Income in Orchard Hills is $59,590.
What is the Median Household income in Orchard Hills?
Median Household Income in Orchard Hills is $58,358.
What is Income or Wage Gap in Orchard Hills?
Income or Wage Gap in Orchard Hills is 21.8%.
Women in Orchard Hills earn 78.2 cents for every dollar earned by a man.
What is Inequality or Gini Index in Orchard Hills?
Inequality or Gini Index in Orchard Hills is 0.35.
What is the Total Population of Orchard Hills?
Total Population of Orchard Hills is 1,920.
What is the Total Male Population of Orchard Hills?
Total Male Population of Orchard Hills is 1,050.
What is the Total Female Population of Orchard Hills?
Total Female Population of Orchard Hills is 870.
What is the Ratio of Males per 100 Females in Orchard Hills?
There are 120.69 Males per 100 Females in Orchard Hills.
What is the Ratio of Females per 100 Males in Orchard Hills?
There are 82.86 Females per 100 Males in Orchard Hills.
What is the Median Population Age in Orchard Hills?
Median Population Age in Orchard Hills is 55.8 Years.
What is the Average Family Size in Orchard Hills
Average Family Size in Orchard Hills is 2.8 People.
What is the Average Household Size in Orchard Hills
Average Household Size in Orchard Hills is 2.5 People.
How Large is the Labor Force in Orchard Hills?
There are 831 People in the Labor Forcein in Orchard Hills.
What is the Percentage of People in the Labor Force in Orchard Hills?
46.0% of People are in the Labor Force in Orchard Hills.
What is the Unemployment Rate in Orchard Hills?
Unemployment Rate in Orchard Hills is 2.9%.