Thompson borough, PA Map & Demographics
Thompson borough Overview
$22,393
PER CAPITA INCOME
$53,125
AVG FAMILY INCOME
$53,333
AVG HOUSEHOLD INCOME
38.3%
WAGE / INCOME GAP [ % ]
61.7¢/ $1
WAGE / INCOME GAP [ $ ]
0.36
INEQUALITY / GINI INDEX
291
TOTAL POPULATION
173
MALE POPULATION
118
FEMALE POPULATION
146.61
MALES / 100 FEMALES
68.21
FEMALES / 100 MALES
34.9
MEDIAN AGE
3.7
AVG FAMILY SIZE
3.2
AVG HOUSEHOLD SIZE
143
LABOR FORCE [ PEOPLE ]
71.1%
PERCENT IN LABOR FORCE
11.2%
UNEMPLOYMENT RATE
Income in Thompson borough
Income Overview in Thompson borough
Per Capita Income in Thompson borough is $22,393, while median incomes of families and households are $53,125 and $53,333 respectively.
| Characteristic | Number | Measure |
| Per Capita Income | 291 | $22,393 |
| Median Family Income | 71 | $53,125 |
| Mean Family Income | 71 | $66,194 |
| Median Household Income | 90 | $53,333 |
| Mean Household Income | 90 | $62,944 |
| Income Deficit | 71 | $0 |
| Wage / Income Gap (%) | 291 | 38.29% |
| Wage / Income Gap ($) | 291 | 61.71¢ per $1 |
| Gini / Inequality Index | 291 | 0.36 |
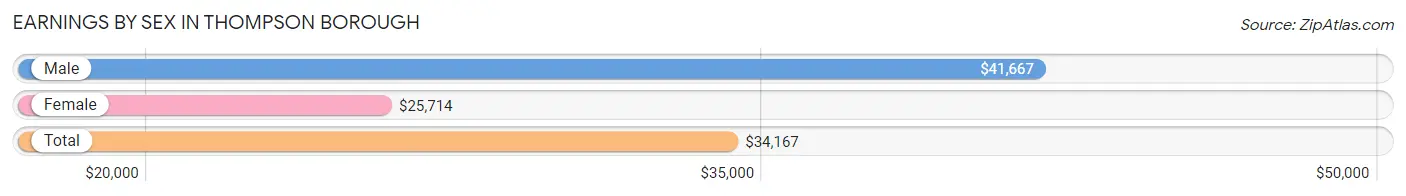
Earnings by Sex in Thompson borough
Average Earnings in Thompson borough are $34,167, $41,667 for men and $25,714 for women, a difference of 38.3%.
| Sex | Number | Average Earnings |
| Male | 78 (52.7%) | $41,667 |
| Female | 70 (47.3%) | $25,714 |
| Total | 148 (100.0%) | $34,167 |
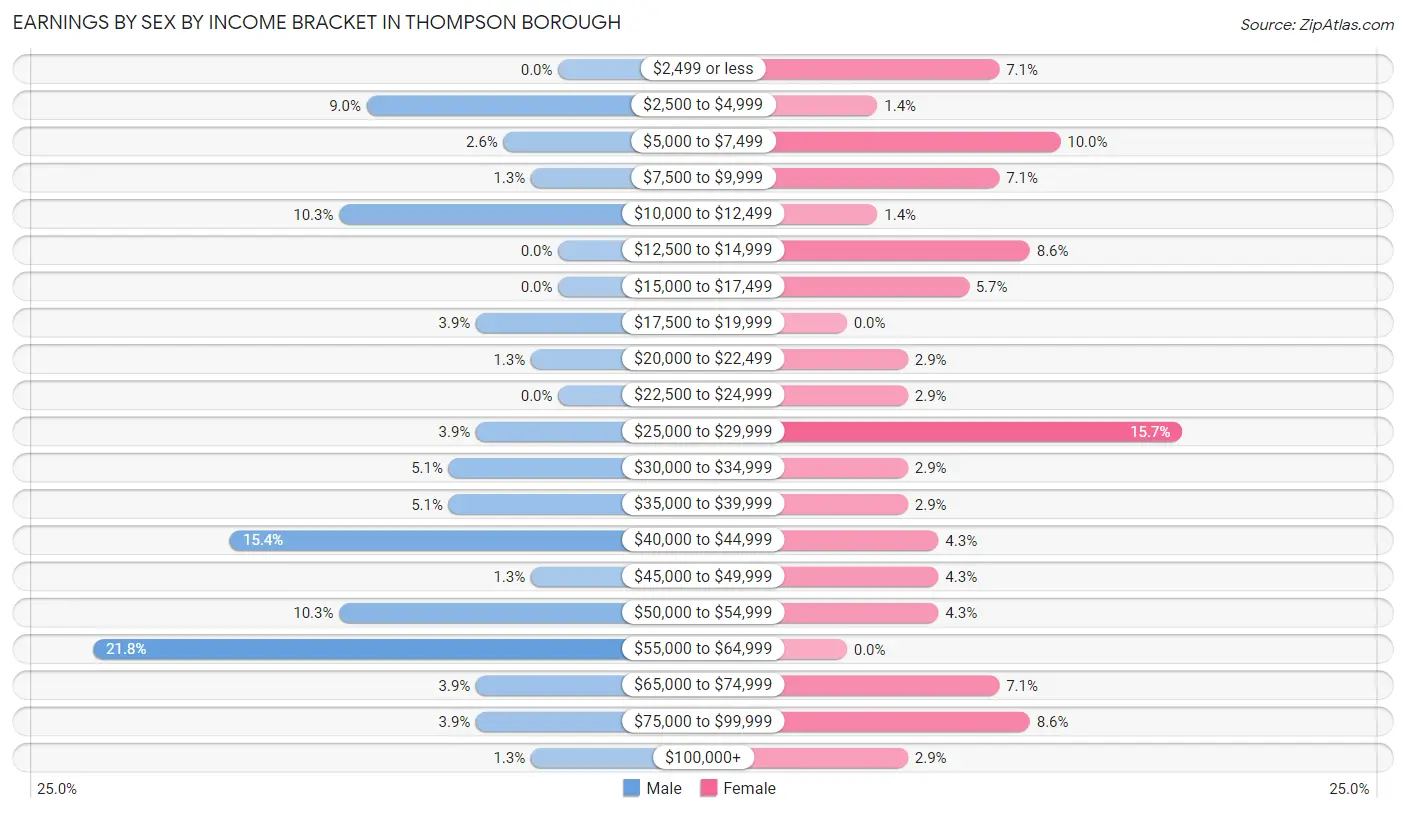
Earnings by Sex by Income Bracket in Thompson borough
The most common earnings brackets in Thompson borough are $55,000 to $64,999 for men (17 | 21.8%) and $25,000 to $29,999 for women (11 | 15.7%).
| Income | Male | Female |
| $2,499 or less | 0 (0.0%) | 5 (7.1%) |
| $2,500 to $4,999 | 7 (9.0%) | 1 (1.4%) |
| $5,000 to $7,499 | 2 (2.6%) | 7 (10.0%) |
| $7,500 to $9,999 | 1 (1.3%) | 5 (7.1%) |
| $10,000 to $12,499 | 8 (10.3%) | 1 (1.4%) |
| $12,500 to $14,999 | 0 (0.0%) | 6 (8.6%) |
| $15,000 to $17,499 | 0 (0.0%) | 4 (5.7%) |
| $17,500 to $19,999 | 3 (3.8%) | 0 (0.0%) |
| $20,000 to $22,499 | 1 (1.3%) | 2 (2.9%) |
| $22,500 to $24,999 | 0 (0.0%) | 2 (2.9%) |
| $25,000 to $29,999 | 3 (3.8%) | 11 (15.7%) |
| $30,000 to $34,999 | 4 (5.1%) | 2 (2.9%) |
| $35,000 to $39,999 | 4 (5.1%) | 2 (2.9%) |
| $40,000 to $44,999 | 12 (15.4%) | 3 (4.3%) |
| $45,000 to $49,999 | 1 (1.3%) | 3 (4.3%) |
| $50,000 to $54,999 | 8 (10.3%) | 3 (4.3%) |
| $55,000 to $64,999 | 17 (21.8%) | 0 (0.0%) |
| $65,000 to $74,999 | 3 (3.8%) | 5 (7.1%) |
| $75,000 to $99,999 | 3 (3.8%) | 6 (8.6%) |
| $100,000+ | 1 (1.3%) | 2 (2.9%) |
| Total | 78 (100.0%) | 70 (100.0%) |
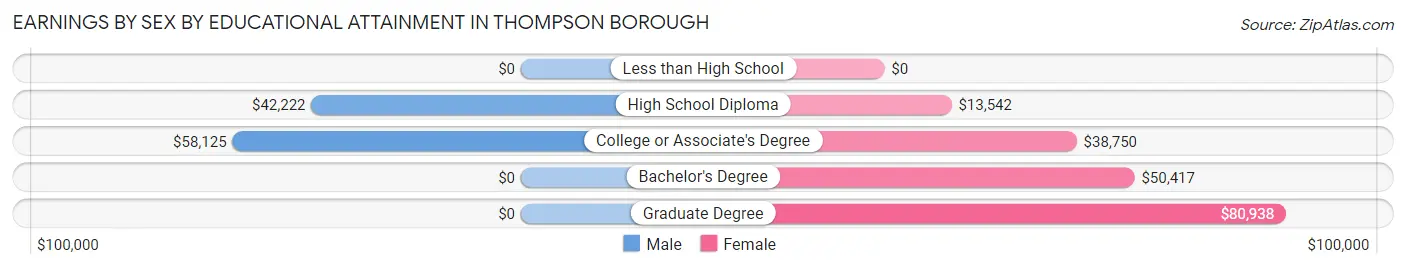
Earnings by Sex by Educational Attainment in Thompson borough
Average earnings in Thompson borough are $43,750 for men and $27,143 for women, a difference of 38.0%. Men with an educational attainment of college or associate's degree enjoy the highest average annual earnings of $58,125, while those with high school diploma education earn the least with $42,222. Women with an educational attainment of graduate degree earn the most with the average annual earnings of $80,938, while those with high school diploma education have the smallest earnings of $13,542.
| Educational Attainment | Male Income | Female Income |
| Less than High School | - | - |
| High School Diploma | $42,222 | $13,542 |
| College or Associate's Degree | $58,125 | $38,750 |
| Bachelor's Degree | - | - |
| Graduate Degree | - | - |
| Total | $43,750 | $27,143 |
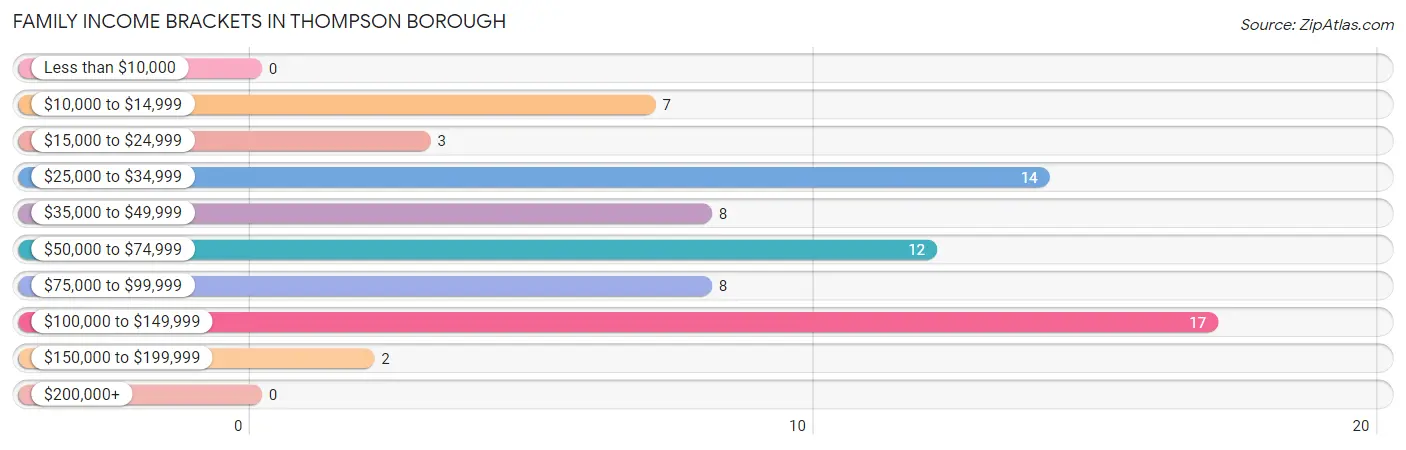
Family Income in Thompson borough
Family Income Brackets in Thompson borough
According to the Thompson borough family income data, there are 17 families falling into the $100,000 to $149,999 income range, which is the most common income bracket and makes up 23.9% of all families.
| Income Bracket | # Families | % Families |
| Less than $10,000 | 0 | 0.0% |
| $10,000 to $14,999 | 7 | 9.9% |
| $15,000 to $24,999 | 3 | 4.2% |
| $25,000 to $34,999 | 14 | 19.7% |
| $35,000 to $49,999 | 8 | 11.3% |
| $50,000 to $74,999 | 12 | 16.9% |
| $75,000 to $99,999 | 8 | 11.3% |
| $100,000 to $149,999 | 17 | 23.9% |
| $150,000 to $199,999 | 2 | 2.8% |
| $200,000+ | 0 | 0.0% |
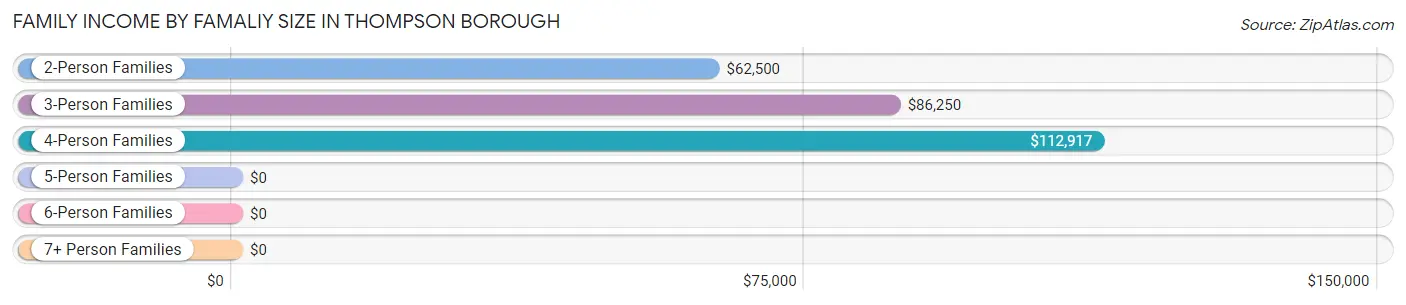
Family Income by Famaliy Size in Thompson borough
4-person families (17 | 23.9%) account for the highest median family income in Thompson borough with $112,917 per family, while 2-person families (30 | 42.2%) have the highest median income of $31,250 per family member.
| Income Bracket | # Families | Median Income |
| 2-Person Families | 30 (42.2%) | $62,500 |
| 3-Person Families | 14 (19.7%) | $86,250 |
| 4-Person Families | 17 (23.9%) | $112,917 |
| 5-Person Families | 1 (1.4%) | $0 |
| 6-Person Families | 8 (11.3%) | $0 |
| 7+ Person Families | 1 (1.4%) | $0 |
| Total | 71 (100.0%) | $53,125 |
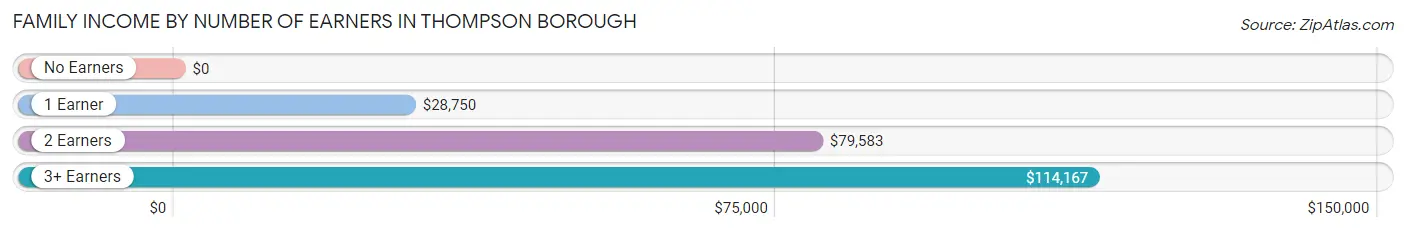
Family Income by Number of Earners in Thompson borough
| Number of Earners | # Families | Median Income |
| No Earners | 6 (8.5%) | $0 |
| 1 Earner | 30 (42.2%) | $28,750 |
| 2 Earners | 27 (38.0%) | $79,583 |
| 3+ Earners | 8 (11.3%) | $114,167 |
| Total | 71 (100.0%) | $53,125 |
Household Income in Thompson borough
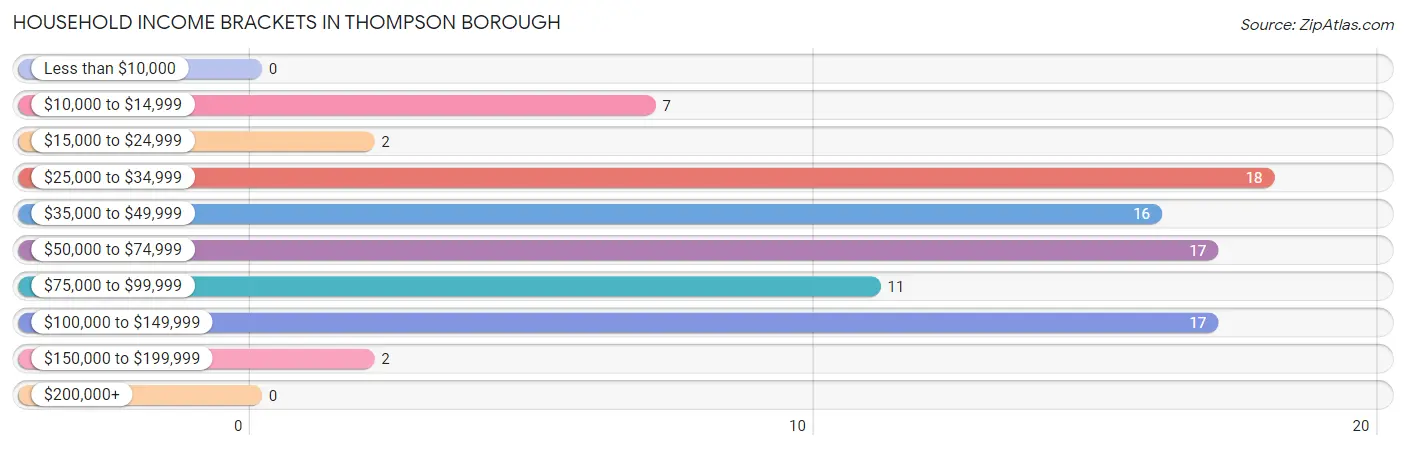
Household Income Brackets in Thompson borough
With 18 households falling in the category, the $25,000 to $34,999 income range is the most frequent in Thompson borough, accounting for 20.0% of all households.
| Income Bracket | # Households | % Households |
| Less than $10,000 | 0 | 0.0% |
| $10,000 to $14,999 | 7 | 7.8% |
| $15,000 to $24,999 | 2 | 2.2% |
| $25,000 to $34,999 | 18 | 20.0% |
| $35,000 to $49,999 | 16 | 17.8% |
| $50,000 to $74,999 | 17 | 18.9% |
| $75,000 to $99,999 | 11 | 12.2% |
| $100,000 to $149,999 | 17 | 18.9% |
| $150,000 to $199,999 | 2 | 2.2% |
| $200,000+ | 0 | 0.0% |
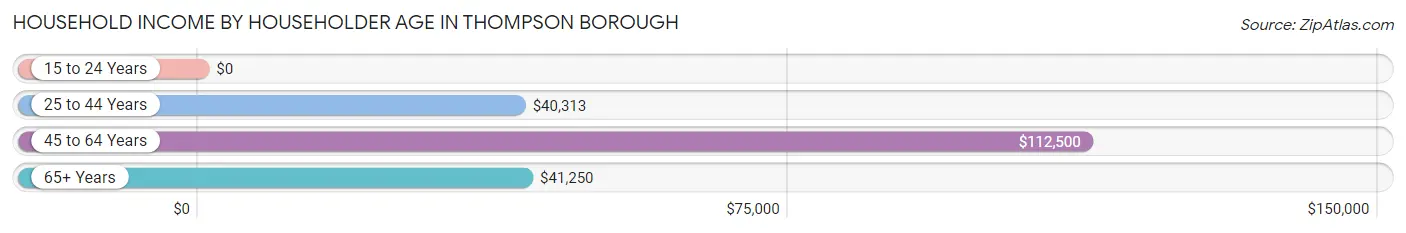
Household Income by Householder Age in Thompson borough
The median household income in Thompson borough is $53,333, with the highest median household income of $112,500 found in the 45 to 64 years age bracket for the primary householder. A total of 28 households (31.1%) fall into this category. Meanwhile, the 15 to 24 years age bracket for the primary householder has the lowest median household income of $0, with 2 households (2.2%) in this group.
| Income Bracket | # Households | Median Income |
| 15 to 24 Years | 2 (2.2%) | $0 |
| 25 to 44 Years | 45 (50.0%) | $40,313 |
| 45 to 64 Years | 28 (31.1%) | $112,500 |
| 65+ Years | 15 (16.7%) | $41,250 |
| Total | 90 (100.0%) | $53,333 |
Poverty in Thompson borough
Income Below Poverty by Sex and Age in Thompson borough
With 28.3% poverty level for males and 26.3% for females among the residents of Thompson borough, 5 year old males and 5 year old females are the most vulnerable to poverty, with 8 males (100.0%) and 4 females (100.0%) in their respective age groups living below the poverty level.
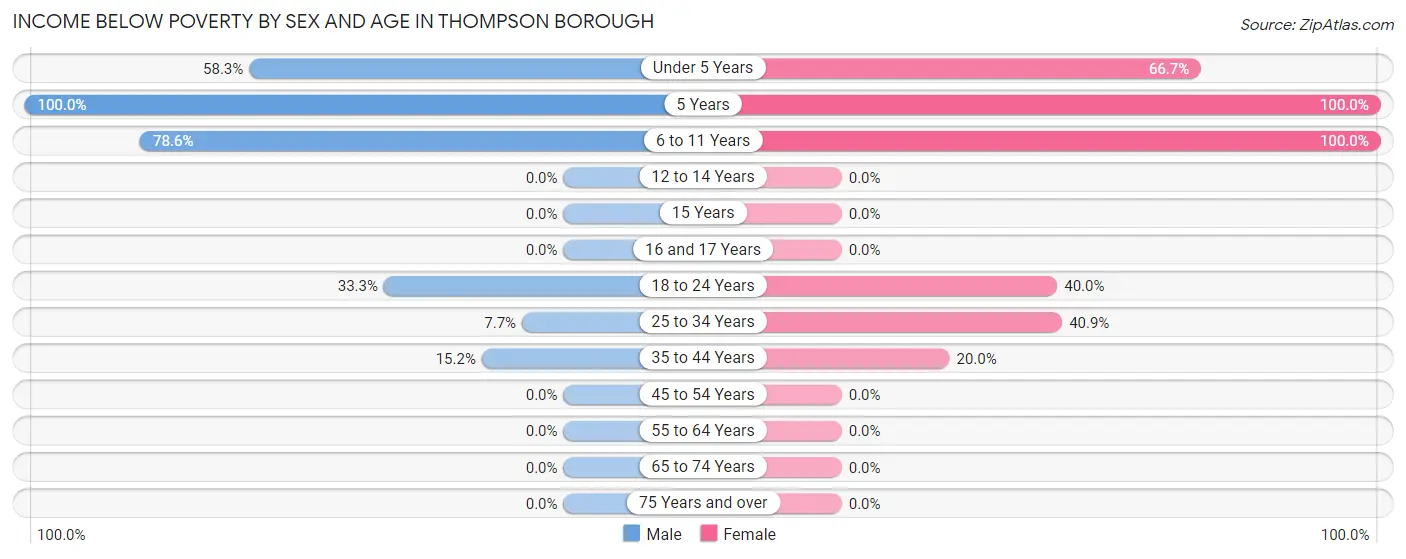
| Age Bracket | Male | Female |
| Under 5 Years | 21 (58.3%) | 10 (66.7%) |
| 5 Years | 8 (100.0%) | 4 (100.0%) |
| 6 to 11 Years | 11 (78.6%) | 3 (100.0%) |
| 12 to 14 Years | 0 (0.0%) | 0 (0.0%) |
| 15 Years | 0 (0.0%) | 0 (0.0%) |
| 16 and 17 Years | 0 (0.0%) | 0 (0.0%) |
| 18 to 24 Years | 3 (33.3%) | 2 (40.0%) |
| 25 to 34 Years | 1 (7.7%) | 9 (40.9%) |
| 35 to 44 Years | 5 (15.1%) | 3 (20.0%) |
| 45 to 54 Years | 0 (0.0%) | 0 (0.0%) |
| 55 to 64 Years | 0 (0.0%) | 0 (0.0%) |
| 65 to 74 Years | 0 (0.0%) | 0 (0.0%) |
| 75 Years and over | 0 (0.0%) | 0 (0.0%) |
| Total | 49 (28.3%) | 31 (26.3%) |
Income Above Poverty by Sex and Age in Thompson borough
According to the poverty statistics in Thompson borough, males aged 12 to 14 years and females aged 12 to 14 years are the age groups that are most secure financially, with 100.0% of males and 100.0% of females in these age groups living above the poverty line.
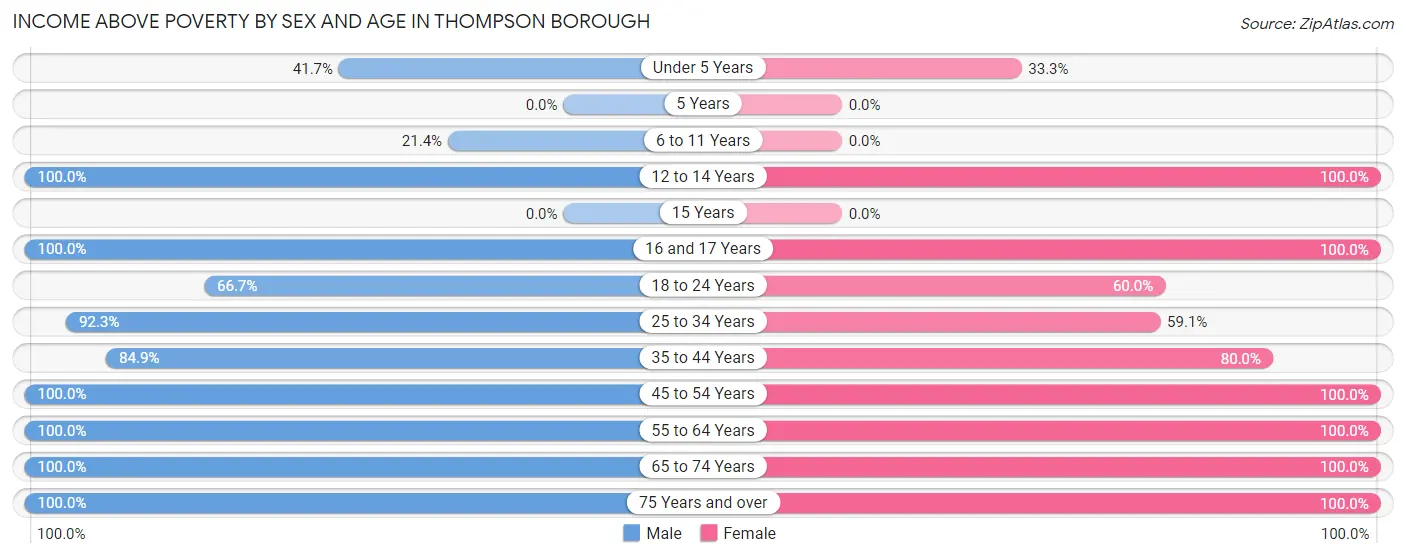
| Age Bracket | Male | Female |
| Under 5 Years | 15 (41.7%) | 5 (33.3%) |
| 5 Years | 0 (0.0%) | 0 (0.0%) |
| 6 to 11 Years | 3 (21.4%) | 0 (0.0%) |
| 12 to 14 Years | 2 (100.0%) | 8 (100.0%) |
| 15 Years | 0 (0.0%) | 0 (0.0%) |
| 16 and 17 Years | 4 (100.0%) | 3 (100.0%) |
| 18 to 24 Years | 6 (66.7%) | 3 (60.0%) |
| 25 to 34 Years | 12 (92.3%) | 13 (59.1%) |
| 35 to 44 Years | 28 (84.9%) | 12 (80.0%) |
| 45 to 54 Years | 28 (100.0%) | 22 (100.0%) |
| 55 to 64 Years | 8 (100.0%) | 10 (100.0%) |
| 65 to 74 Years | 13 (100.0%) | 8 (100.0%) |
| 75 Years and over | 5 (100.0%) | 3 (100.0%) |
| Total | 124 (71.7%) | 87 (73.7%) |
Income Below Poverty Among Married-Couple Families in Thompson borough
The poverty statistics for married-couple families in Thompson borough show that 7.7% or 4 of the total 52 families live below the poverty line. Families with 1 or 2 children have the highest poverty rate of 17.4%, comprising of 4 families. On the other hand, families with no children have the lowest poverty rate of 0.0%, which includes 0 families.

| Children | Above Poverty | Below Poverty |
| No Children | 28 (100.0%) | 0 (0.0%) |
| 1 or 2 Children | 19 (82.6%) | 4 (17.4%) |
| 3 or 4 Children | 1 (100.0%) | 0 (0.0%) |
| 5 or more Children | 0 (0.0%) | 0 (0.0%) |
| Total | 48 (92.3%) | 4 (7.7%) |
Income Below Poverty Among Single-Parent Households in Thompson borough
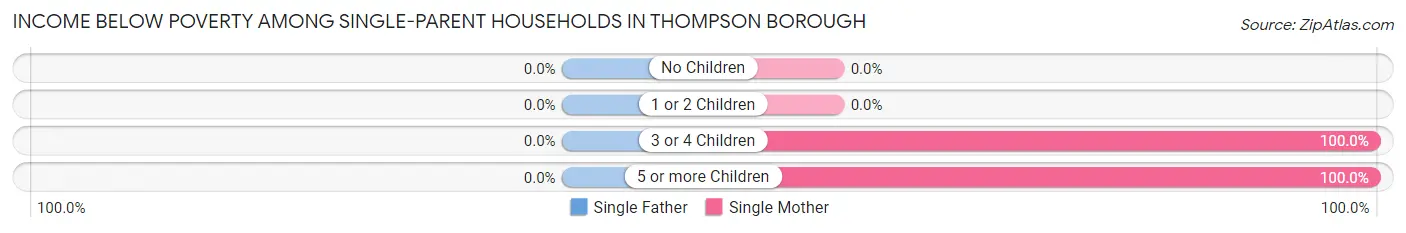
| Children | Single Father | Single Mother |
| No Children | 0 (0.0%) | 0 (0.0%) |
| 1 or 2 Children | 0 (0.0%) | 0 (0.0%) |
| 3 or 4 Children | 0 (0.0%) | 2 (100.0%) |
| 5 or more Children | 0 (0.0%) | 7 (100.0%) |
| Total | 0 (0.0%) | 9 (90.0%) |
Income Below Poverty Among Married-Couple vs Single-Parent Households in Thompson borough
The poverty data for Thompson borough shows that 4 of the married-couple family households (7.7%) and 9 of the single-parent households (47.4%) are living below the poverty level. Within the married-couple family households, those with 1 or 2 children have the highest poverty rate, with 4 households (17.4%) falling below the poverty line. Among the single-parent households, those with 3 or 4 children have the highest poverty rate, with 2 household (100.0%) living below poverty.
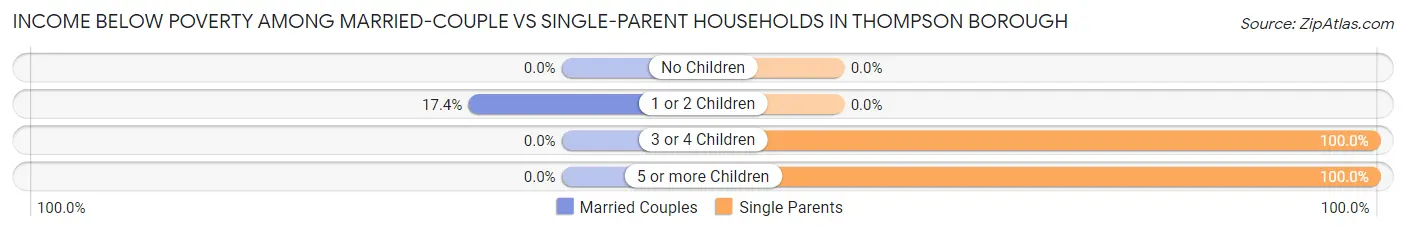
| Children | Married-Couple Families | Single-Parent Households |
| No Children | 0 (0.0%) | 0 (0.0%) |
| 1 or 2 Children | 4 (17.4%) | 0 (0.0%) |
| 3 or 4 Children | 0 (0.0%) | 2 (100.0%) |
| 5 or more Children | 0 (0.0%) | 7 (100.0%) |
| Total | 4 (7.7%) | 9 (47.4%) |
Race in Thompson borough
The most populous races in Thompson borough are White / Caucasian (283 | 97.3%), Two or more Races (7 | 2.4%), and Black / African American (1 | 0.3%).
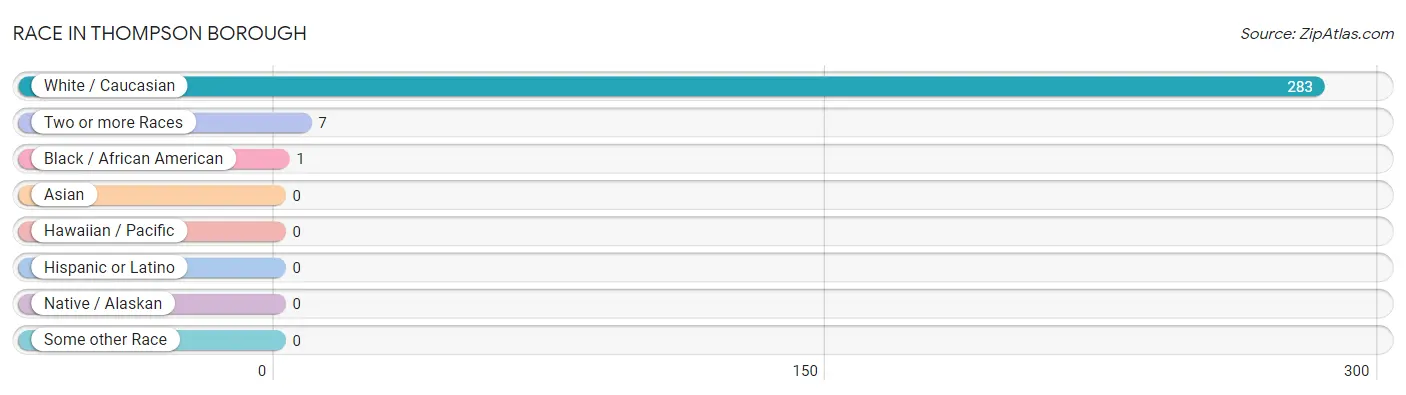
| Race | # Population | % Population |
| Asian | 0 | 0.0% |
| Black / African American | 1 | 0.3% |
| Hawaiian / Pacific | 0 | 0.0% |
| Hispanic or Latino | 0 | 0.0% |
| Native / Alaskan | 0 | 0.0% |
| White / Caucasian | 283 | 97.3% |
| Two or more Races | 7 | 2.4% |
| Some other Race | 0 | 0.0% |
| Total | 291 | 100.0% |
Ancestry in Thompson borough
The most populous ancestries reported in Thompson borough are Italian (60 | 20.6%), German (51 | 17.5%), Irish (36 | 12.4%), Polish (28 | 9.6%), and English (21 | 7.2%), together accounting for 67.4% of all Thompson borough residents.
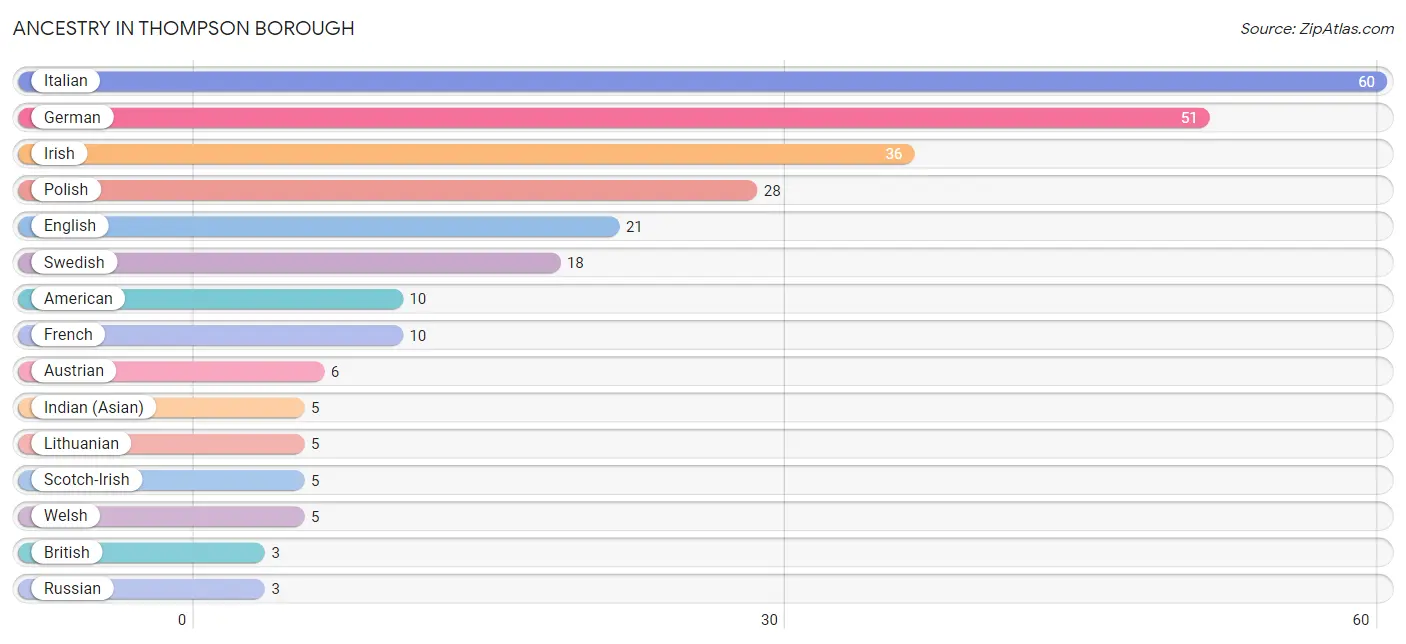
| Ancestry | # Population | % Population |
| American | 10 | 3.4% |
| Austrian | 6 | 2.1% |
| British | 3 | 1.0% |
| Cherokee | 1 | 0.3% |
| Eastern European | 1 | 0.3% |
| English | 21 | 7.2% |
| French | 10 | 3.4% |
| French Canadian | 2 | 0.7% |
| German | 51 | 17.5% |
| Greek | 2 | 0.7% |
| Indian (Asian) | 5 | 1.7% |
| Irish | 36 | 12.4% |
| Italian | 60 | 20.6% |
| Lithuanian | 5 | 1.7% |
| Polish | 28 | 9.6% |
| Russian | 3 | 1.0% |
| Scotch-Irish | 5 | 1.7% |
| Scottish | 3 | 1.0% |
| Swedish | 18 | 6.2% |
| Welsh | 5 | 1.7% | View All 20 Rows |
Immigrants in Thompson borough
The most numerous immigrant groups reported in Thompson borough came from Europe (2 | 0.7%), Italy (2 | 0.7%), and Southern Europe (2 | 0.7%), together accounting for 2.1% of all Thompson borough residents.
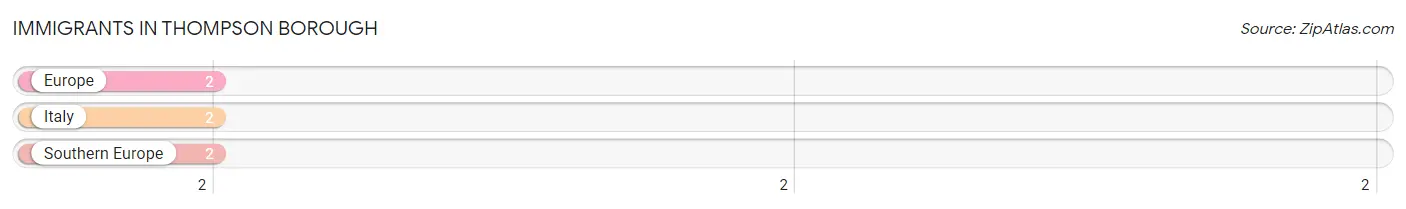
| Immigration Origin | # Population | % Population |
| Europe | 2 | 0.7% |
| Italy | 2 | 0.7% |
| Southern Europe | 2 | 0.7% | View All 3 Rows |
Sex and Age in Thompson borough
Sex and Age in Thompson borough
The most populous age groups in Thompson borough are Under 5 Years (36 | 20.8%) for men and Under 5 Years (15 | 12.7%) for women.
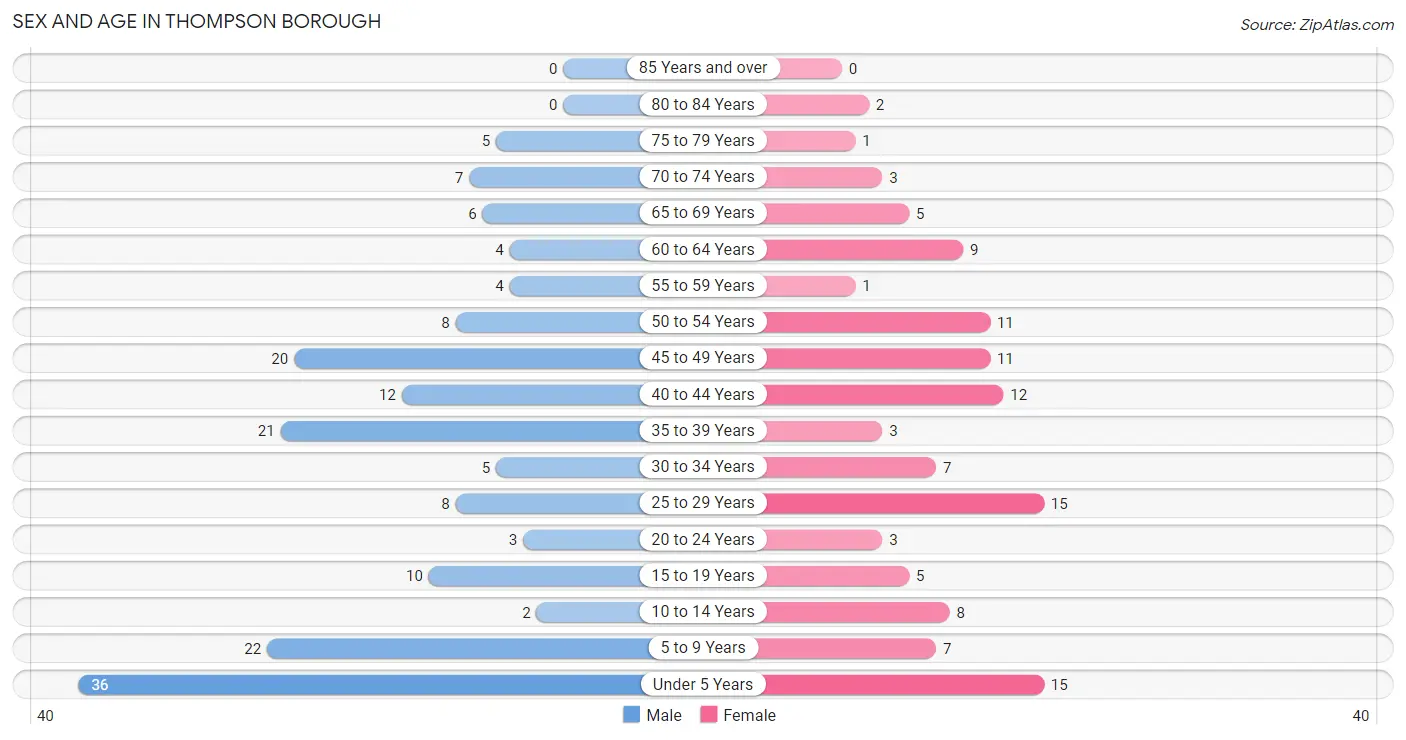
| Age Bracket | Male | Female |
| Under 5 Years | 36 (20.8%) | 15 (12.7%) |
| 5 to 9 Years | 22 (12.7%) | 7 (5.9%) |
| 10 to 14 Years | 2 (1.2%) | 8 (6.8%) |
| 15 to 19 Years | 10 (5.8%) | 5 (4.2%) |
| 20 to 24 Years | 3 (1.7%) | 3 (2.5%) |
| 25 to 29 Years | 8 (4.6%) | 15 (12.7%) |
| 30 to 34 Years | 5 (2.9%) | 7 (5.9%) |
| 35 to 39 Years | 21 (12.1%) | 3 (2.5%) |
| 40 to 44 Years | 12 (6.9%) | 12 (10.2%) |
| 45 to 49 Years | 20 (11.6%) | 11 (9.3%) |
| 50 to 54 Years | 8 (4.6%) | 11 (9.3%) |
| 55 to 59 Years | 4 (2.3%) | 1 (0.9%) |
| 60 to 64 Years | 4 (2.3%) | 9 (7.6%) |
| 65 to 69 Years | 6 (3.5%) | 5 (4.2%) |
| 70 to 74 Years | 7 (4.1%) | 3 (2.5%) |
| 75 to 79 Years | 5 (2.9%) | 1 (0.9%) |
| 80 to 84 Years | 0 (0.0%) | 2 (1.7%) |
| 85 Years and over | 0 (0.0%) | 0 (0.0%) |
| Total | 173 (100.0%) | 118 (100.0%) |
Families and Households in Thompson borough
Median Family Size in Thompson borough
The median family size in Thompson borough is 3.70 persons per family, with single female/mother families (10 | 14.1%) accounting for the largest median family size of 6.4 persons per family. On the other hand, single male/father families (9 | 12.7%) represent the smallest median family size with 2.67 persons per family.
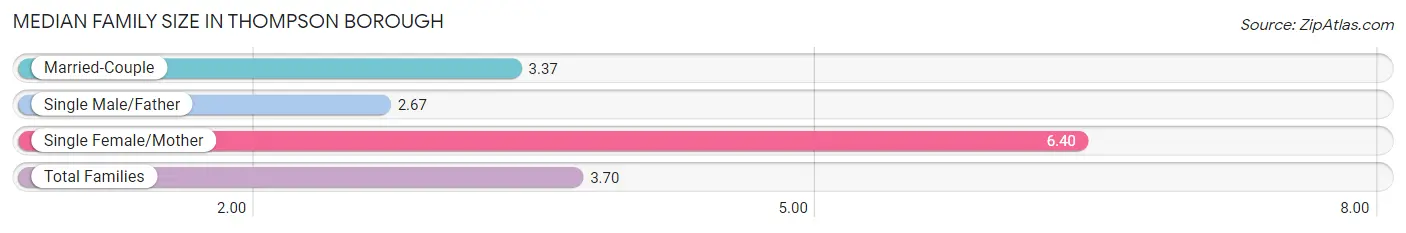
| Family Type | # Families | Family Size |
| Married-Couple | 52 (73.2%) | 3.37 |
| Single Male/Father | 9 (12.7%) | 2.67 |
| Single Female/Mother | 10 (14.1%) | 6.40 |
| Total Families | 71 (100.0%) | 3.70 |
Median Household Size in Thompson borough
The median household size in Thompson borough is 3.23 persons per household, with single female/mother households (10 | 11.1%) accounting for the largest median household size of 6.5 persons per household. non-family households (19 | 21.1%) represent the smallest median household size with 1.16 persons per household.
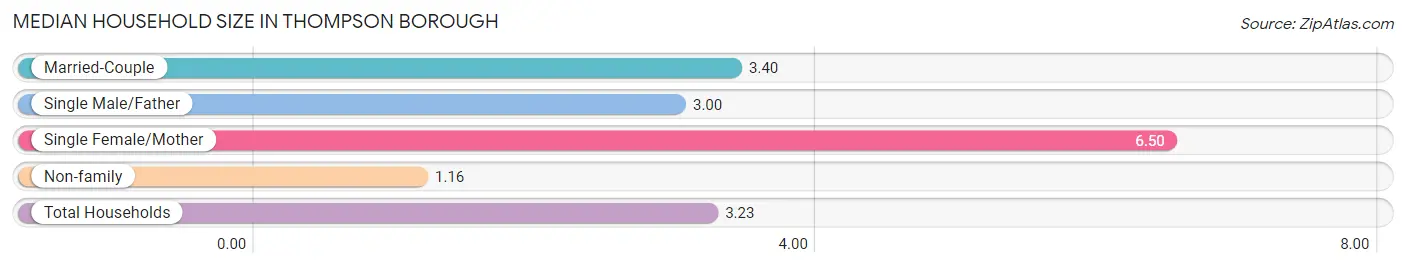
| Household Type | # Households | Household Size |
| Married-Couple | 52 (57.8%) | 3.40 |
| Single Male/Father | 9 (10.0%) | 3.00 |
| Single Female/Mother | 10 (11.1%) | 6.50 |
| Non-family | 19 (21.1%) | 1.16 |
| Total Households | 90 (100.0%) | 3.23 |
Household Size by Marriage Status in Thompson borough
Out of a total of 90 households in Thompson borough, 71 (78.9%) are family households, while 19 (21.1%) are nonfamily households. The most numerous type of family households are 2-person households, comprising 30, and the most common type of nonfamily households are 1-person households, comprising 14.
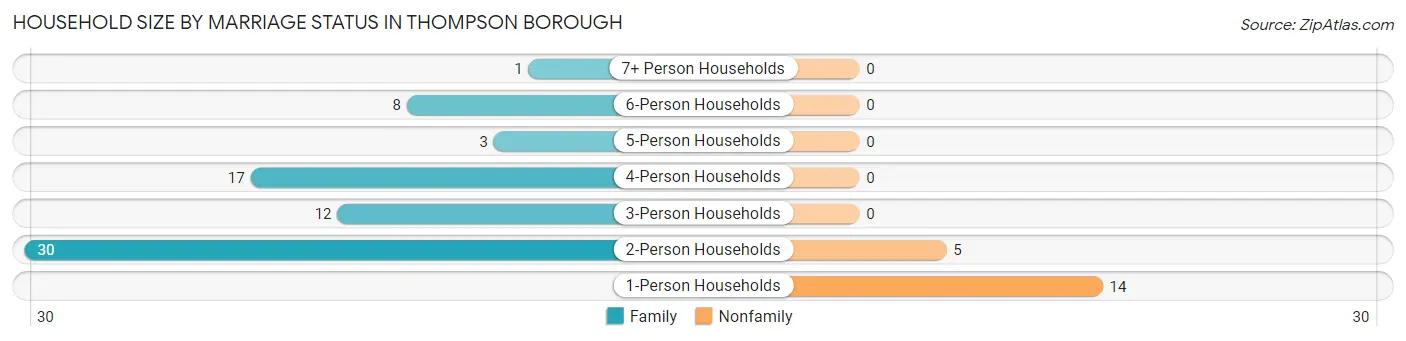
| Household Size | Family Households | Nonfamily Households |
| 1-Person Households | - | 14 (15.6%) |
| 2-Person Households | 30 (33.3%) | 5 (5.6%) |
| 3-Person Households | 12 (13.3%) | 0 (0.0%) |
| 4-Person Households | 17 (18.9%) | 0 (0.0%) |
| 5-Person Households | 3 (3.3%) | 0 (0.0%) |
| 6-Person Households | 8 (8.9%) | 0 (0.0%) |
| 7+ Person Households | 1 (1.1%) | 0 (0.0%) |
| Total | 71 (78.9%) | 19 (21.1%) |
Female Fertility in Thompson borough
Fertility by Age in Thompson borough
Average fertility rate in Thompson borough is 237.0 births per 1,000 women. Women in the age bracket of 20 to 34 years have the highest fertility rate with 560.0 births per 1,000 women. Women in the age bracket of 20 to 34 years acount for 100.0% of all women with births.
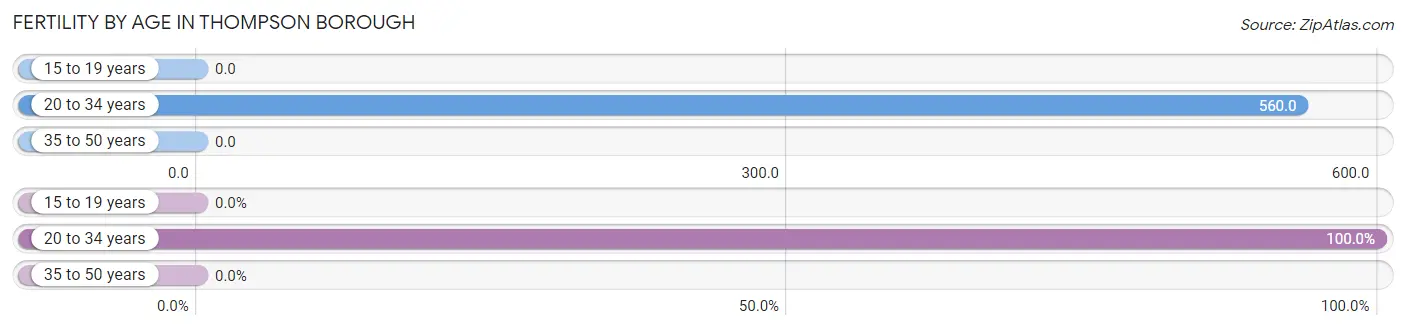
| Age Bracket | Women with Births | Births / 1,000 Women |
| 15 to 19 years | 0 (0.0%) | 0.0 |
| 20 to 34 years | 14 (100.0%) | 560.0 |
| 35 to 50 years | 0 (0.0%) | 0.0 |
| Total | 14 (100.0%) | 237.0 |
Fertility by Age by Marriage Status in Thompson borough
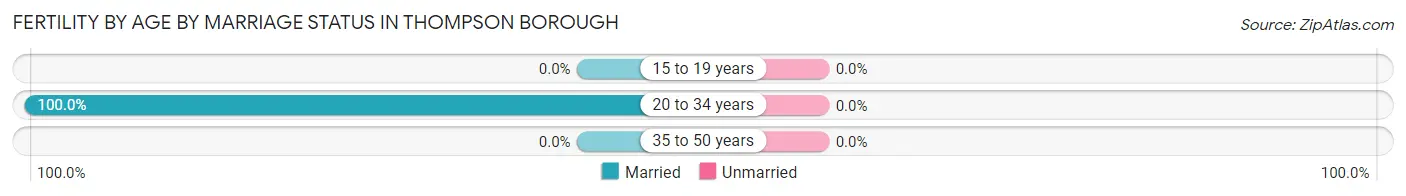
| Age Bracket | Married | Unmarried |
| 15 to 19 years | 0 (0.0%) | 0 (0.0%) |
| 20 to 34 years | 14 (100.0%) | 0 (0.0%) |
| 35 to 50 years | 0 (0.0%) | 0 (0.0%) |
| Total | 14 (100.0%) | 0 (0.0%) |
Fertility by Education in Thompson borough
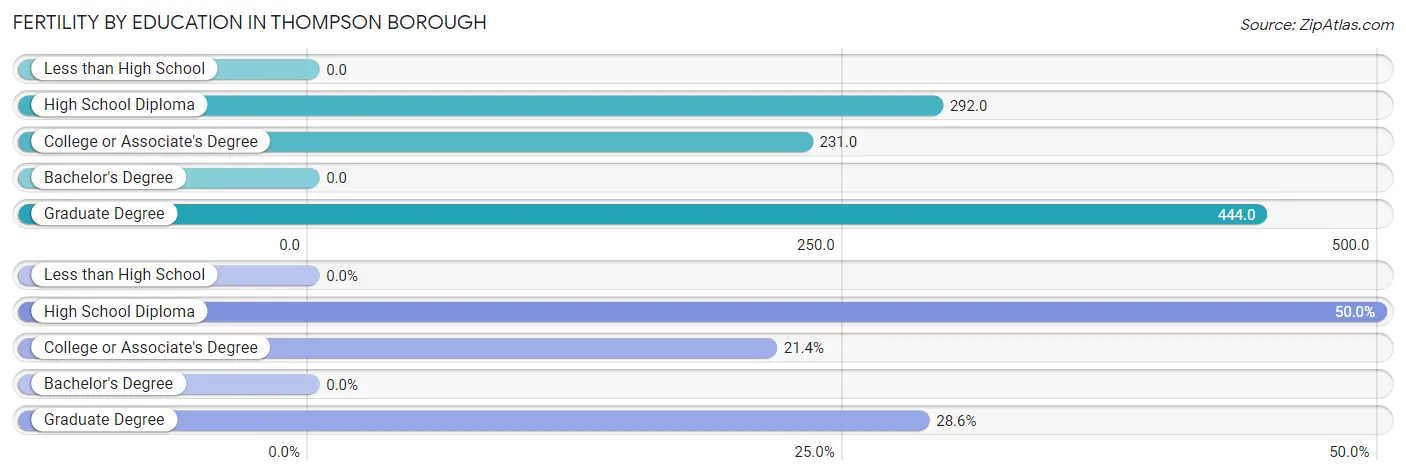
| Educational Attainment | Women with Births | Births / 1,000 Women |
| Less than High School | 0 (0.0%) | 0.0 |
| High School Diploma | 7 (50.0%) | 292.0 |
| College or Associate's Degree | 3 (21.4%) | 231.0 |
| Bachelor's Degree | 0 (0.0%) | 0.0 |
| Graduate Degree | 4 (28.6%) | 444.0 |
| Total | 14 (100.0%) | 237.0 |
Fertility by Education by Marriage Status in Thompson borough
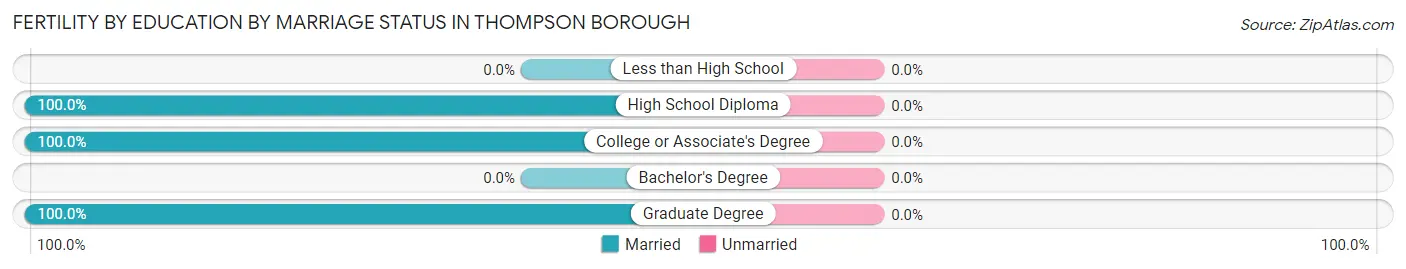
| Educational Attainment | Married | Unmarried |
| Less than High School | 0 (0.0%) | 0 (0.0%) |
| High School Diploma | 7 (100.0%) | 0 (0.0%) |
| College or Associate's Degree | 3 (100.0%) | 0 (0.0%) |
| Bachelor's Degree | 0 (0.0%) | 0 (0.0%) |
| Graduate Degree | 4 (100.0%) | 0 (0.0%) |
| Total | 14 (100.0%) | 0 (0.0%) |
Employment Characteristics in Thompson borough
Employment by Class of Employer in Thompson borough
Among the 126 employed individuals in Thompson borough, private company employees (85 | 67.5%), self-employed (not incorporated) (19 | 15.1%), and state government employees (7 | 5.6%) make up the most common classes of employment.
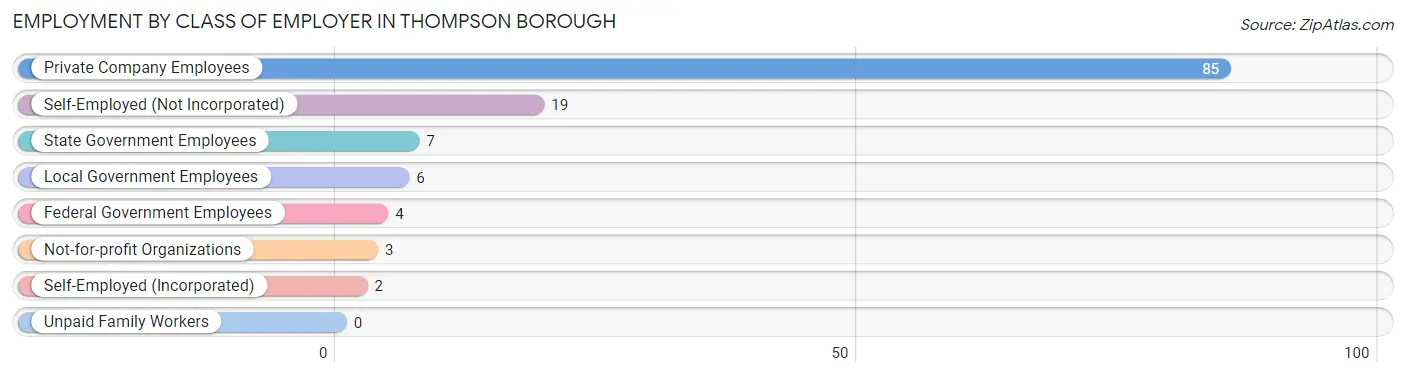
| Employer Class | # Employees | % Employees |
| Private Company Employees | 85 | 67.5% |
| Self-Employed (Incorporated) | 2 | 1.6% |
| Self-Employed (Not Incorporated) | 19 | 15.1% |
| Not-for-profit Organizations | 3 | 2.4% |
| Local Government Employees | 6 | 4.8% |
| State Government Employees | 7 | 5.6% |
| Federal Government Employees | 4 | 3.2% |
| Unpaid Family Workers | 0 | 0.0% |
| Total | 126 | 100.0% |
Employment Status by Age in Thompson borough
According to the labor force statistics for Thompson borough, out of the total population over 16 years of age (201), 71.1% or 143 individuals are in the labor force, with 11.2% or 16 of them unemployed. The age group with the highest labor force participation rate is 25 to 29 years, with 95.7% or 22 individuals in the labor force. Within the labor force, the 60 to 64 years age range has the highest percentage of unemployed individuals, with 66.7% or 6 of them being unemployed.
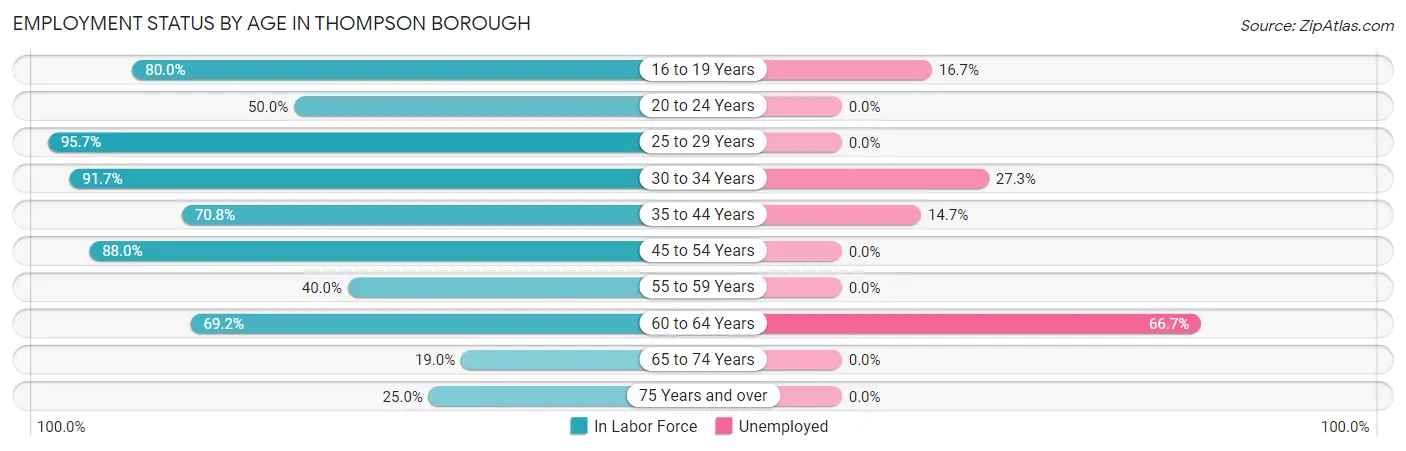
| Age Bracket | In Labor Force | Unemployed |
| 16 to 19 Years | 12 (80.0%) | 2 (16.7%) |
| 20 to 24 Years | 3 (50.0%) | 0 (0.0%) |
| 25 to 29 Years | 22 (95.7%) | 0 (0.0%) |
| 30 to 34 Years | 11 (91.7%) | 3 (27.3%) |
| 35 to 44 Years | 34 (70.8%) | 5 (14.7%) |
| 45 to 54 Years | 44 (88.0%) | 0 (0.0%) |
| 55 to 59 Years | 2 (40.0%) | 0 (0.0%) |
| 60 to 64 Years | 9 (69.2%) | 6 (66.7%) |
| 65 to 74 Years | 4 (19.0%) | 0 (0.0%) |
| 75 Years and over | 2 (25.0%) | 0 (0.0%) |
| Total | 143 (71.1%) | 16 (11.2%) |
Employment Status by Educational Attainment in Thompson borough
According to labor force statistics for Thompson borough, 80.8% of individuals (122) out of the total population between 25 and 64 years of age (151) are in the labor force, with 11.5% or 14 of them being unemployed. The group with the highest labor force participation rate are those with the educational attainment of bachelor's degree or higher, with 96.0% or 24 individuals in the labor force. Within the labor force, individuals with high school diploma education have the highest percentage of unemployment, with 16.7% or 10 of them being unemployed.
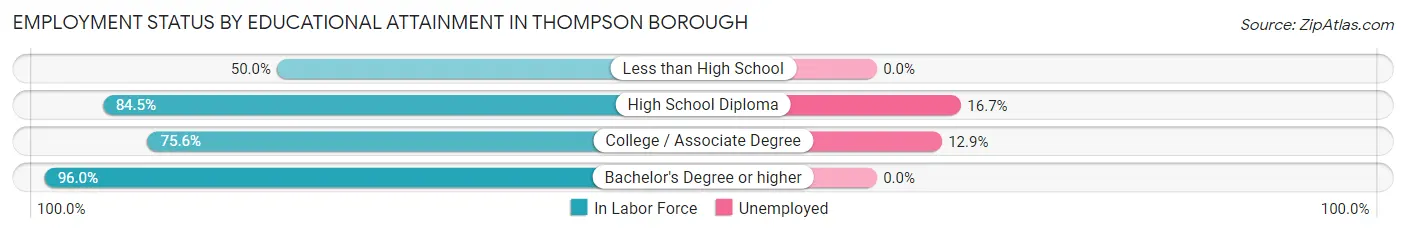
| Educational Attainment | In Labor Force | Unemployed |
| Less than High School | 7 (50.0%) | 0 (0.0%) |
| High School Diploma | 60 (84.5%) | 12 (16.7%) |
| College / Associate Degree | 31 (75.6%) | 5 (12.9%) |
| Bachelor's Degree or higher | 24 (96.0%) | 0 (0.0%) |
| Total | 122 (80.8%) | 17 (11.5%) |
Employment Occupations by Sex in Thompson borough
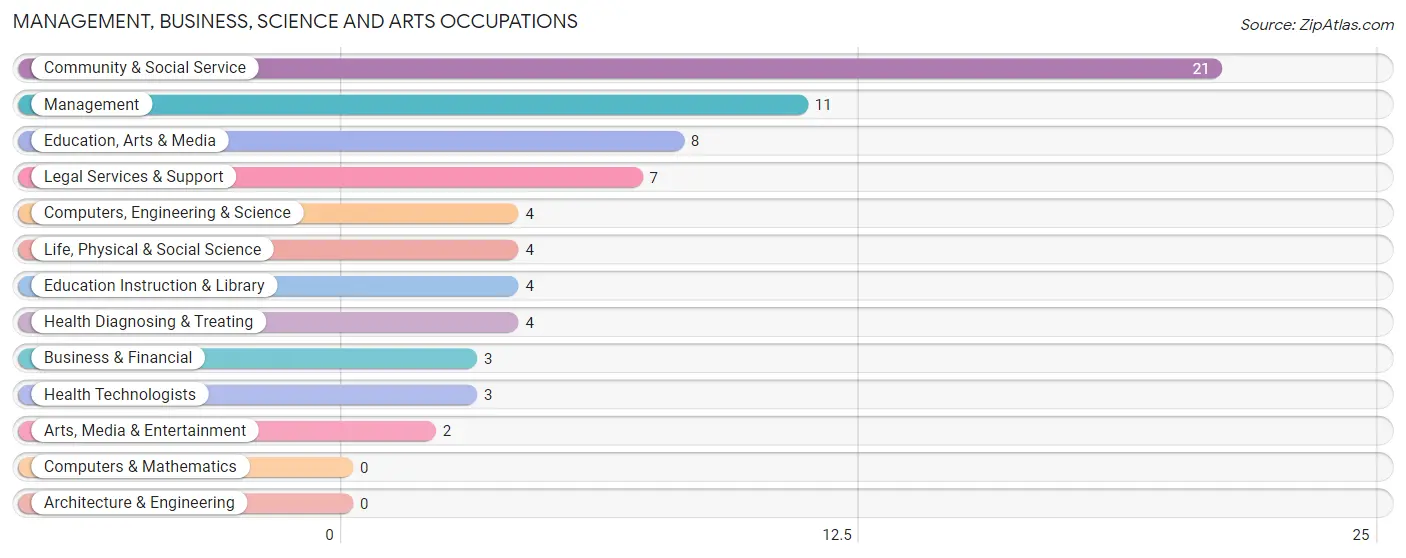
Management, Business, Science and Arts Occupations
The most common Management, Business, Science and Arts occupations in Thompson borough are Community & Social Service (21 | 16.5%), Management (11 | 8.7%), Education, Arts & Media (8 | 6.3%), Legal Services & Support (7 | 5.5%), and Computers, Engineering & Science (4 | 3.2%).
Management, Business, Science and Arts Occupations by Sex
Within the Management, Business, Science and Arts occupations in Thompson borough, the most male-oriented occupations are Arts, Media & Entertainment (100.0%), Education, Arts & Media (50.0%), and Community & Social Service (28.6%), while the most female-oriented occupations are Business & Financial (100.0%), Computers, Engineering & Science (100.0%), and Life, Physical & Social Science (100.0%).
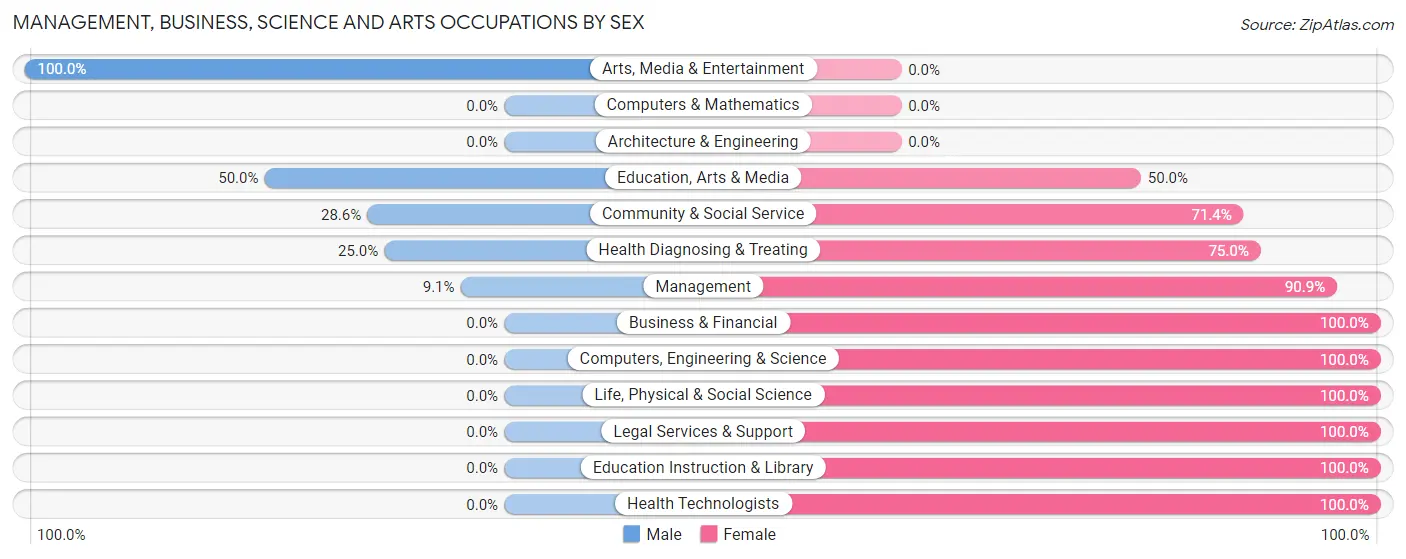
| Occupation | Male | Female |
| Management | 1 (9.1%) | 10 (90.9%) |
| Business & Financial | 0 (0.0%) | 3 (100.0%) |
| Computers, Engineering & Science | 0 (0.0%) | 4 (100.0%) |
| Computers & Mathematics | 0 (0.0%) | 0 (0.0%) |
| Architecture & Engineering | 0 (0.0%) | 0 (0.0%) |
| Life, Physical & Social Science | 0 (0.0%) | 4 (100.0%) |
| Community & Social Service | 6 (28.6%) | 15 (71.4%) |
| Education, Arts & Media | 4 (50.0%) | 4 (50.0%) |
| Legal Services & Support | 0 (0.0%) | 7 (100.0%) |
| Education Instruction & Library | 0 (0.0%) | 4 (100.0%) |
| Arts, Media & Entertainment | 2 (100.0%) | 0 (0.0%) |
| Health Diagnosing & Treating | 1 (25.0%) | 3 (75.0%) |
| Health Technologists | 0 (0.0%) | 3 (100.0%) |
| Total (Category) | 8 (18.6%) | 35 (81.4%) |
| Total (Overall) | 72 (56.7%) | 55 (43.3%) |
Services Occupations
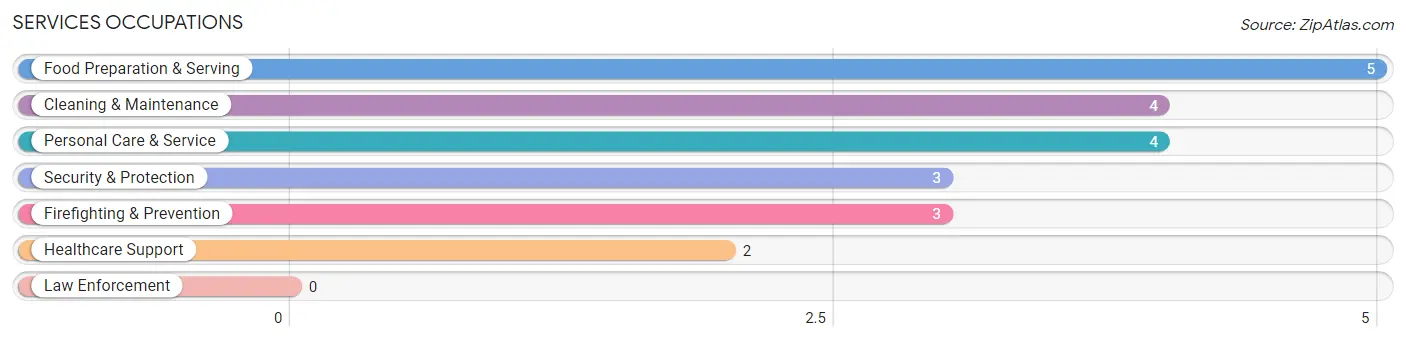
The most common Services occupations in Thompson borough are Food Preparation & Serving (5 | 3.9%), Cleaning & Maintenance (4 | 3.2%), Personal Care & Service (4 | 3.2%), Security & Protection (3 | 2.4%), and Firefighting & Prevention (3 | 2.4%).
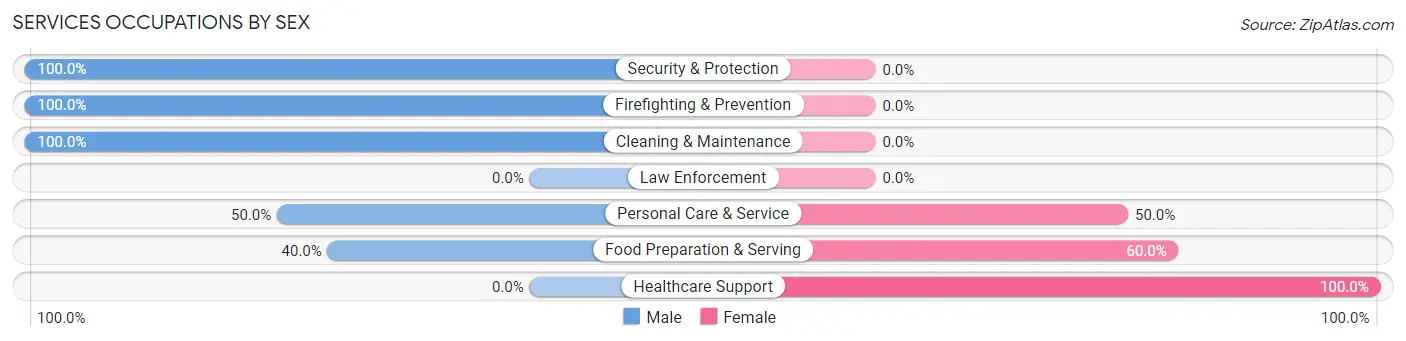
Services Occupations by Sex
Within the Services occupations in Thompson borough, the most male-oriented occupations are Security & Protection (100.0%), Firefighting & Prevention (100.0%), and Cleaning & Maintenance (100.0%), while the most female-oriented occupations are Healthcare Support (100.0%), Food Preparation & Serving (60.0%), and Personal Care & Service (50.0%).
| Occupation | Male | Female |
| Healthcare Support | 0 (0.0%) | 2 (100.0%) |
| Security & Protection | 3 (100.0%) | 0 (0.0%) |
| Firefighting & Prevention | 3 (100.0%) | 0 (0.0%) |
| Law Enforcement | 0 (0.0%) | 0 (0.0%) |
| Food Preparation & Serving | 2 (40.0%) | 3 (60.0%) |
| Cleaning & Maintenance | 4 (100.0%) | 0 (0.0%) |
| Personal Care & Service | 2 (50.0%) | 2 (50.0%) |
| Total (Category) | 11 (61.1%) | 7 (38.9%) |
| Total (Overall) | 72 (56.7%) | 55 (43.3%) |
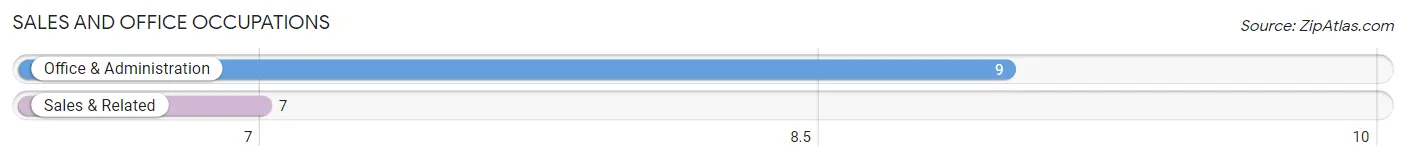
Sales and Office Occupations
The most common Sales and Office occupations in Thompson borough are Office & Administration (9 | 7.1%), and Sales & Related (7 | 5.5%).
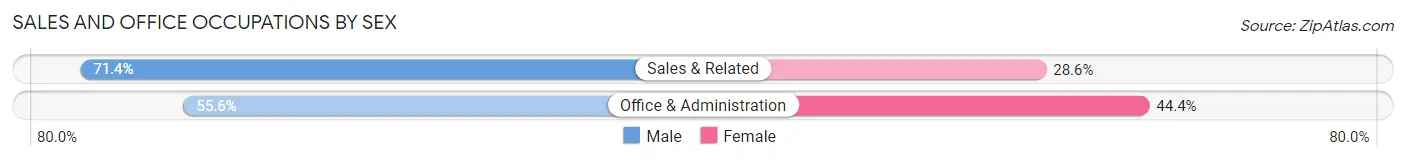
Sales and Office Occupations by Sex
| Occupation | Male | Female |
| Sales & Related | 5 (71.4%) | 2 (28.6%) |
| Office & Administration | 5 (55.6%) | 4 (44.4%) |
| Total (Category) | 10 (62.5%) | 6 (37.5%) |
| Total (Overall) | 72 (56.7%) | 55 (43.3%) |
Natural Resources, Construction and Maintenance Occupations
The most common Natural Resources, Construction and Maintenance occupations in Thompson borough are Construction & Extraction (12 | 9.5%), and Installation, Maintenance & Repair (9 | 7.1%).
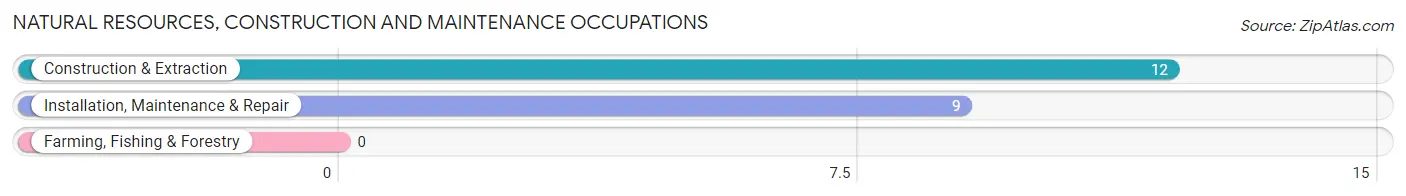
Natural Resources, Construction and Maintenance Occupations by Sex
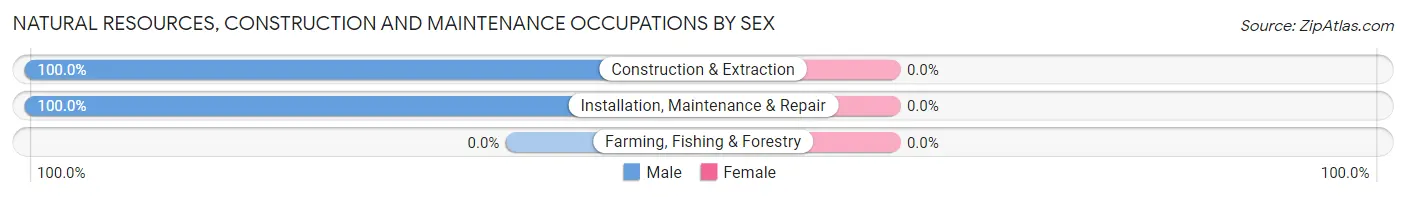
| Occupation | Male | Female |
| Farming, Fishing & Forestry | 0 (0.0%) | 0 (0.0%) |
| Construction & Extraction | 12 (100.0%) | 0 (0.0%) |
| Installation, Maintenance & Repair | 9 (100.0%) | 0 (0.0%) |
| Total (Category) | 21 (100.0%) | 0 (0.0%) |
| Total (Overall) | 72 (56.7%) | 55 (43.3%) |
Production, Transportation and Moving Occupations
The most common Production, Transportation and Moving occupations in Thompson borough are Material Moving (20 | 15.8%), Transportation (6 | 4.7%), and Production (3 | 2.4%).
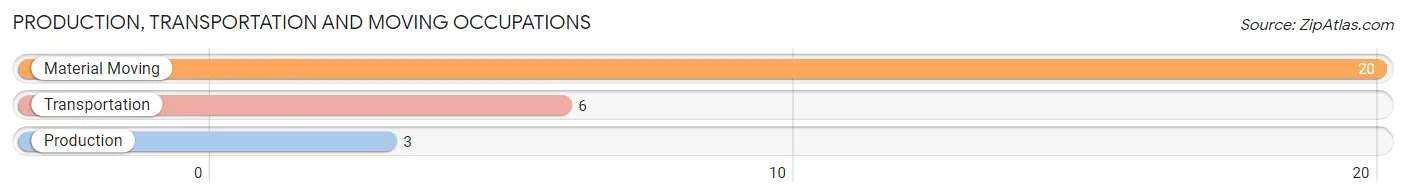
Production, Transportation and Moving Occupations by Sex
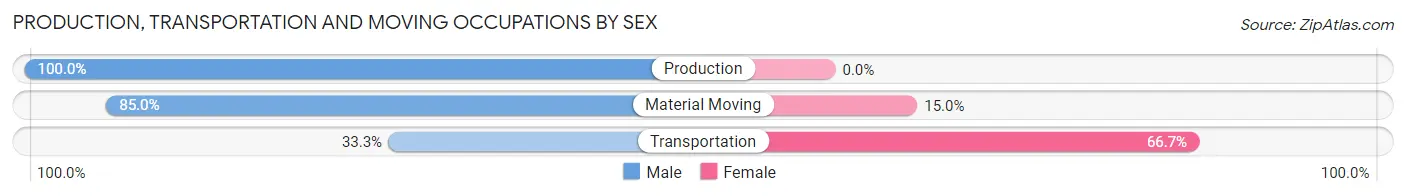
| Occupation | Male | Female |
| Production | 3 (100.0%) | 0 (0.0%) |
| Transportation | 2 (33.3%) | 4 (66.7%) |
| Material Moving | 17 (85.0%) | 3 (15.0%) |
| Total (Category) | 22 (75.9%) | 7 (24.1%) |
| Total (Overall) | 72 (56.7%) | 55 (43.3%) |
Employment Industries by Sex in Thompson borough
Employment Industries in Thompson borough
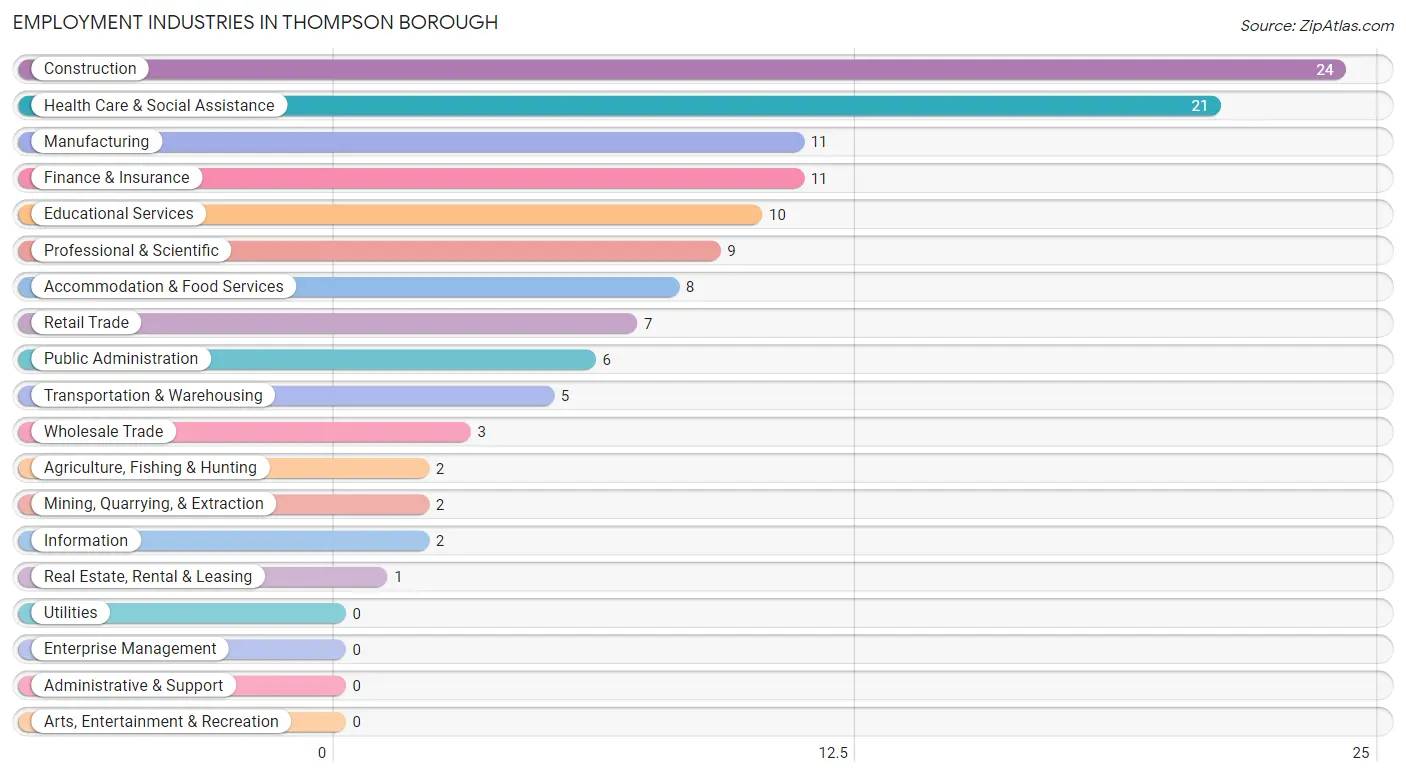
The major employment industries in Thompson borough include Construction (24 | 18.9%), Health Care & Social Assistance (21 | 16.5%), Manufacturing (11 | 8.7%), Finance & Insurance (11 | 8.7%), and Educational Services (10 | 7.9%).
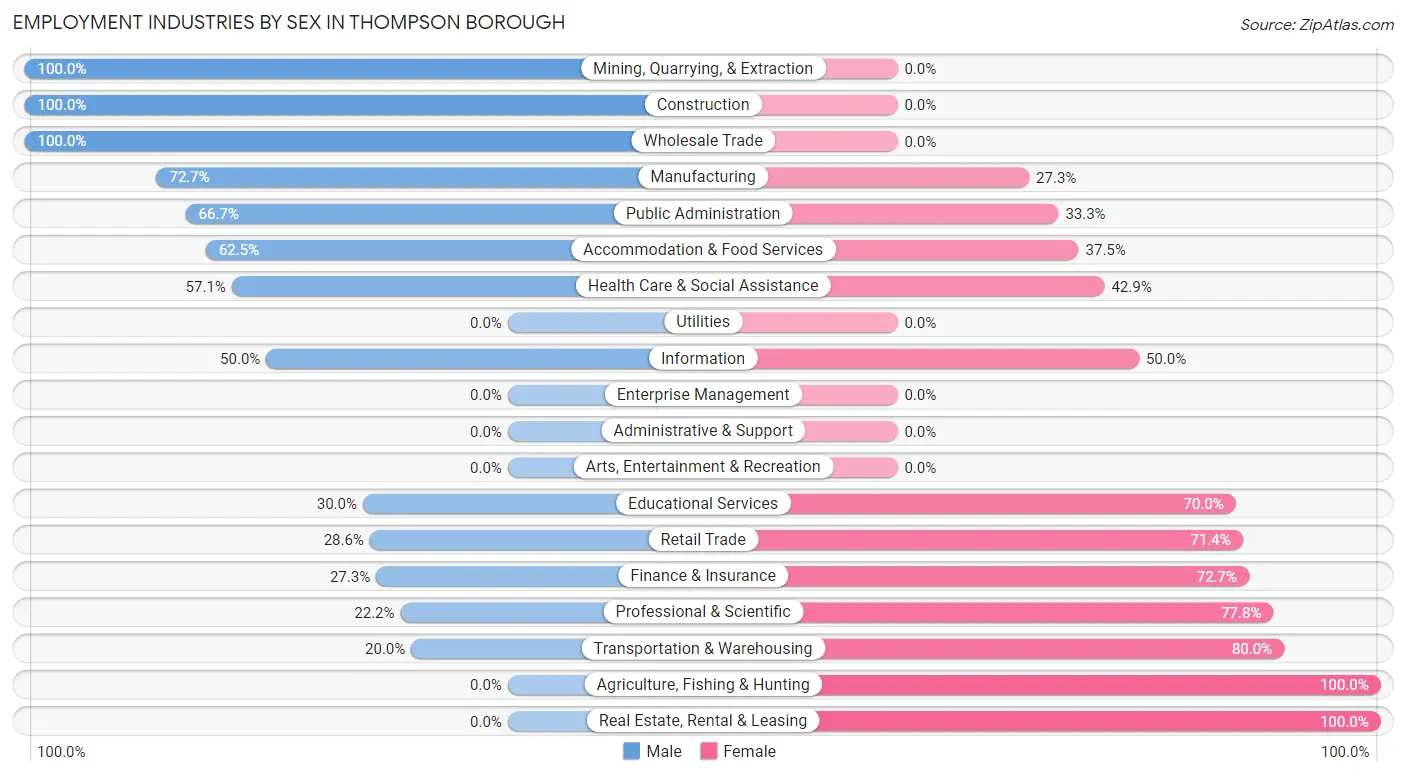
Employment Industries by Sex in Thompson borough
The Thompson borough industries that see more men than women are Mining, Quarrying, & Extraction (100.0%), Construction (100.0%), and Wholesale Trade (100.0%), whereas the industries that tend to have a higher number of women are Agriculture, Fishing & Hunting (100.0%), Real Estate, Rental & Leasing (100.0%), and Transportation & Warehousing (80.0%).
| Industry | Male | Female |
| Agriculture, Fishing & Hunting | 0 (0.0%) | 2 (100.0%) |
| Mining, Quarrying, & Extraction | 2 (100.0%) | 0 (0.0%) |
| Construction | 24 (100.0%) | 0 (0.0%) |
| Manufacturing | 8 (72.7%) | 3 (27.3%) |
| Wholesale Trade | 3 (100.0%) | 0 (0.0%) |
| Retail Trade | 2 (28.6%) | 5 (71.4%) |
| Transportation & Warehousing | 1 (20.0%) | 4 (80.0%) |
| Utilities | 0 (0.0%) | 0 (0.0%) |
| Information | 1 (50.0%) | 1 (50.0%) |
| Finance & Insurance | 3 (27.3%) | 8 (72.7%) |
| Real Estate, Rental & Leasing | 0 (0.0%) | 1 (100.0%) |
| Professional & Scientific | 2 (22.2%) | 7 (77.8%) |
| Enterprise Management | 0 (0.0%) | 0 (0.0%) |
| Administrative & Support | 0 (0.0%) | 0 (0.0%) |
| Educational Services | 3 (30.0%) | 7 (70.0%) |
| Health Care & Social Assistance | 12 (57.1%) | 9 (42.9%) |
| Arts, Entertainment & Recreation | 0 (0.0%) | 0 (0.0%) |
| Accommodation & Food Services | 5 (62.5%) | 3 (37.5%) |
| Public Administration | 4 (66.7%) | 2 (33.3%) |
| Total | 72 (56.7%) | 55 (43.3%) |
Education in Thompson borough
School Enrollment in Thompson borough
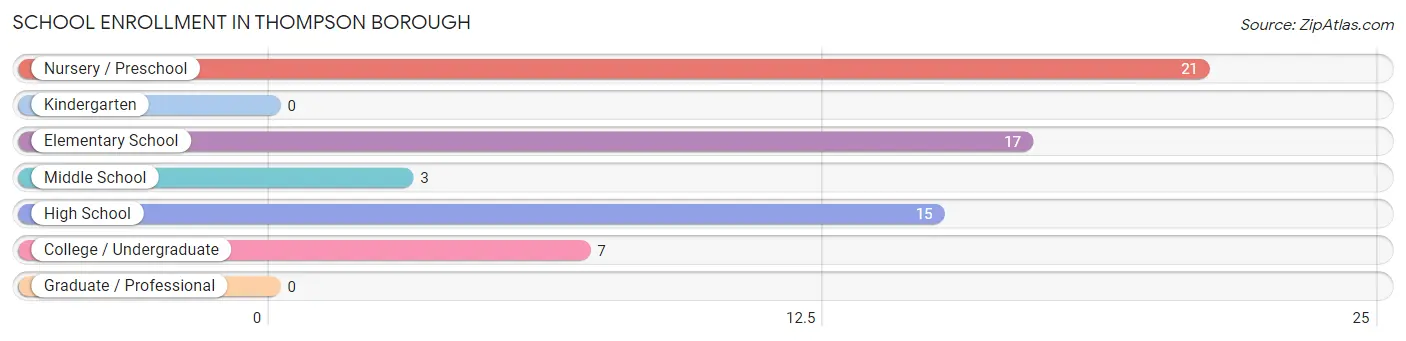
The most common levels of schooling among the 63 students in Thompson borough are nursery / preschool (21 | 33.3%), elementary school (17 | 27.0%), and high school (15 | 23.8%).
| School Level | # Students | % Students |
| Nursery / Preschool | 21 | 33.3% |
| Kindergarten | 0 | 0.0% |
| Elementary School | 17 | 27.0% |
| Middle School | 3 | 4.8% |
| High School | 15 | 23.8% |
| College / Undergraduate | 7 | 11.1% |
| Graduate / Professional | 0 | 0.0% |
| Total | 63 | 100.0% |
School Enrollment by Age by Funding Source in Thompson borough
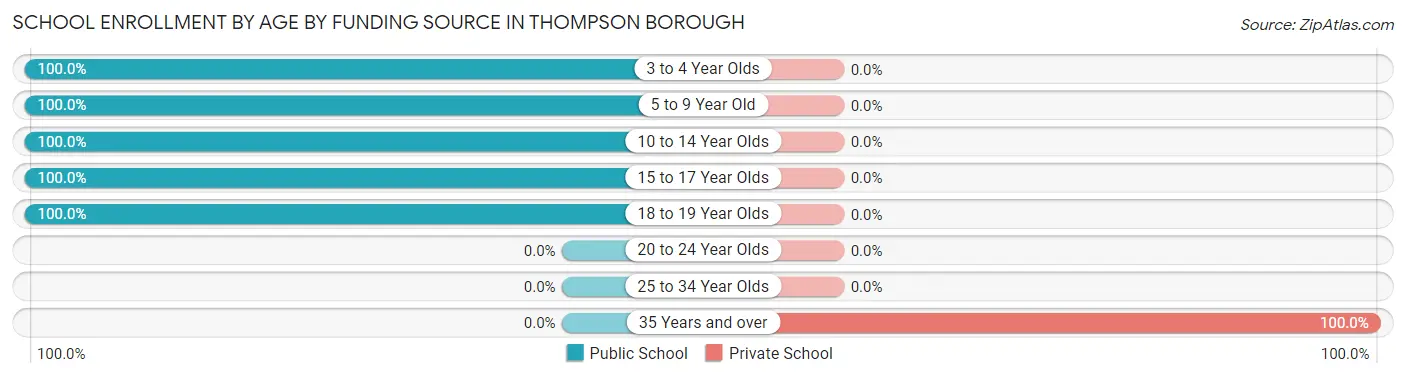
Out of a total of 63 students who are enrolled in schools in Thompson borough, 3 (4.8%) attend a private institution, while the remaining 60 (95.2%) are enrolled in public schools. The age group of 35 years and over has the highest likelihood of being enrolled in private schools, with 3 (100.0% in the age bracket) enrolled. Conversely, the age group of 3 to 4 year olds has the lowest likelihood of being enrolled in a private school, with 9 (100.0% in the age bracket) attending a public institution.
| Age Bracket | Public School | Private School |
| 3 to 4 Year Olds | 9 (100.0%) | 0 (0.0%) |
| 5 to 9 Year Old | 29 (100.0%) | 0 (0.0%) |
| 10 to 14 Year Olds | 10 (100.0%) | 0 (0.0%) |
| 15 to 17 Year Olds | 4 (100.0%) | 0 (0.0%) |
| 18 to 19 Year Olds | 8 (100.0%) | 0 (0.0%) |
| 20 to 24 Year Olds | 0 (0.0%) | 0 (0.0%) |
| 25 to 34 Year Olds | 0 (0.0%) | 0 (0.0%) |
| 35 Years and over | 0 (0.0%) | 3 (100.0%) |
| Total | 60 (95.2%) | 3 (4.8%) |
Educational Attainment by Field of Study in Thompson borough
Psychology (5 | 17.9%), social sciences (5 | 17.9%), bio, nature & agricultural (4 | 14.3%), science & technology (4 | 14.3%), and education (3 | 10.7%) are the most common fields of study among 28 individuals in Thompson borough who have obtained a bachelor's degree or higher.
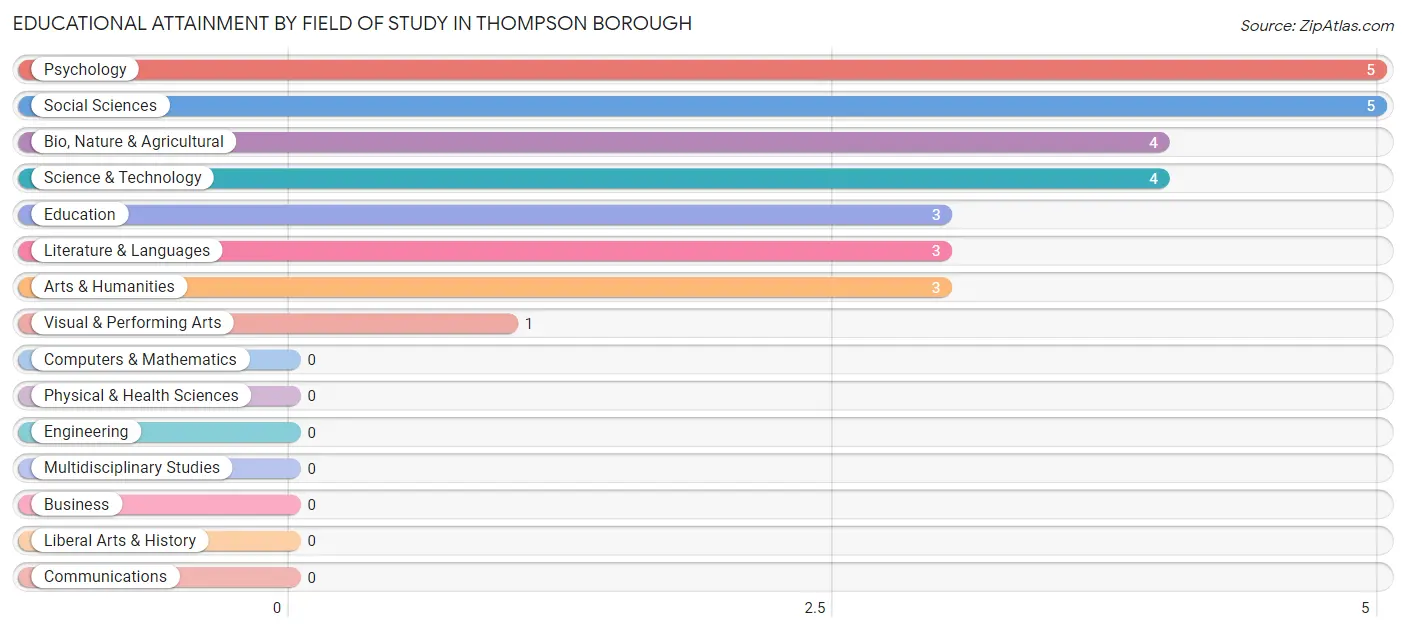
| Field of Study | # Graduates | % Graduates |
| Computers & Mathematics | 0 | 0.0% |
| Bio, Nature & Agricultural | 4 | 14.3% |
| Physical & Health Sciences | 0 | 0.0% |
| Psychology | 5 | 17.9% |
| Social Sciences | 5 | 17.9% |
| Engineering | 0 | 0.0% |
| Multidisciplinary Studies | 0 | 0.0% |
| Science & Technology | 4 | 14.3% |
| Business | 0 | 0.0% |
| Education | 3 | 10.7% |
| Literature & Languages | 3 | 10.7% |
| Liberal Arts & History | 0 | 0.0% |
| Visual & Performing Arts | 1 | 3.6% |
| Communications | 0 | 0.0% |
| Arts & Humanities | 3 | 10.7% |
| Total | 28 | 100.0% |
Transportation & Commute in Thompson borough
Vehicle Availability by Sex in Thompson borough
The most prevalent vehicle ownership categories in Thompson borough are males with 3 vehicles (26, accounting for 36.6%) and females with 3 vehicles (13, making up 47.3%).
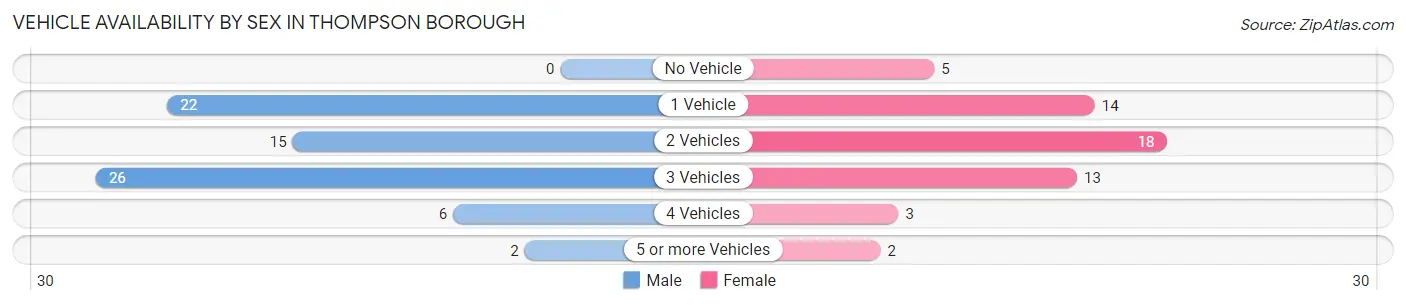
| Vehicles Available | Male | Female |
| No Vehicle | 0 (0.0%) | 5 (9.1%) |
| 1 Vehicle | 22 (31.0%) | 14 (25.5%) |
| 2 Vehicles | 15 (21.1%) | 18 (32.7%) |
| 3 Vehicles | 26 (36.6%) | 13 (23.6%) |
| 4 Vehicles | 6 (8.5%) | 3 (5.4%) |
| 5 or more Vehicles | 2 (2.8%) | 2 (3.6%) |
| Total | 71 (100.0%) | 55 (100.0%) |
Commute Time in Thompson borough
The most frequently occuring commute durations in Thompson borough are 30 to 34 minutes (23 commuters, 20.9%), 45 to 59 minutes (17 commuters, 15.4%), and 25 to 29 minutes (14 commuters, 12.7%).
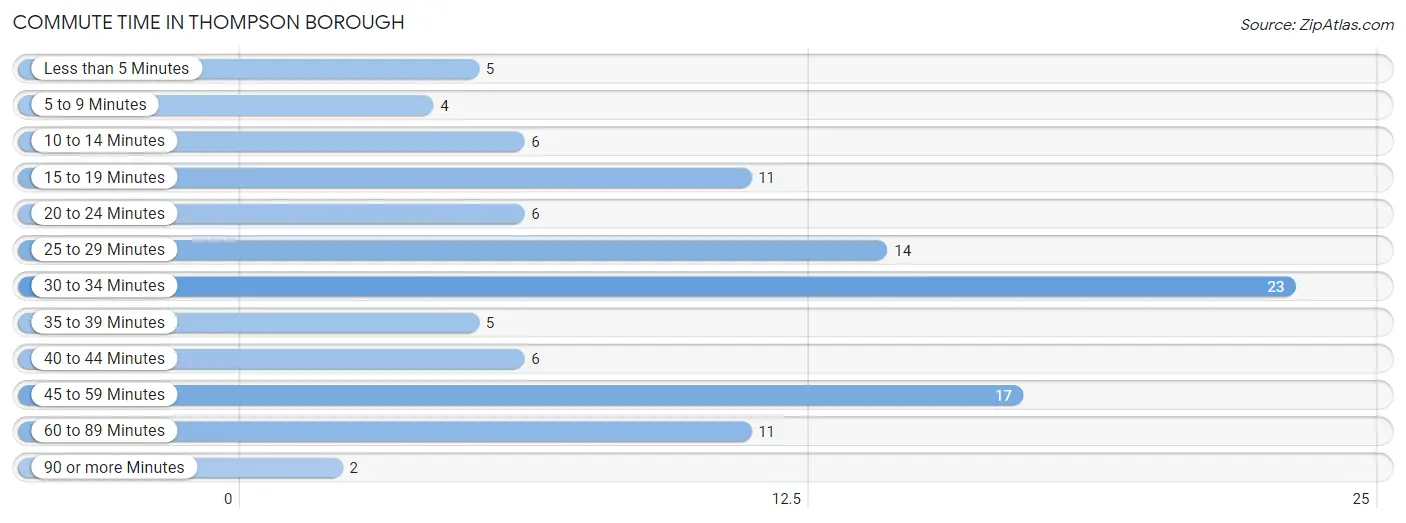
| Commute Time | # Commuters | % Commuters |
| Less than 5 Minutes | 5 | 4.5% |
| 5 to 9 Minutes | 4 | 3.6% |
| 10 to 14 Minutes | 6 | 5.4% |
| 15 to 19 Minutes | 11 | 10.0% |
| 20 to 24 Minutes | 6 | 5.4% |
| 25 to 29 Minutes | 14 | 12.7% |
| 30 to 34 Minutes | 23 | 20.9% |
| 35 to 39 Minutes | 5 | 4.5% |
| 40 to 44 Minutes | 6 | 5.4% |
| 45 to 59 Minutes | 17 | 15.4% |
| 60 to 89 Minutes | 11 | 10.0% |
| 90 or more Minutes | 2 | 1.8% |
Commute Time by Sex in Thompson borough
The most common commute times in Thompson borough are 25 to 29 minutes (14 commuters, 22.2%) for males and 45 to 59 minutes (14 commuters, 29.8%) for females.
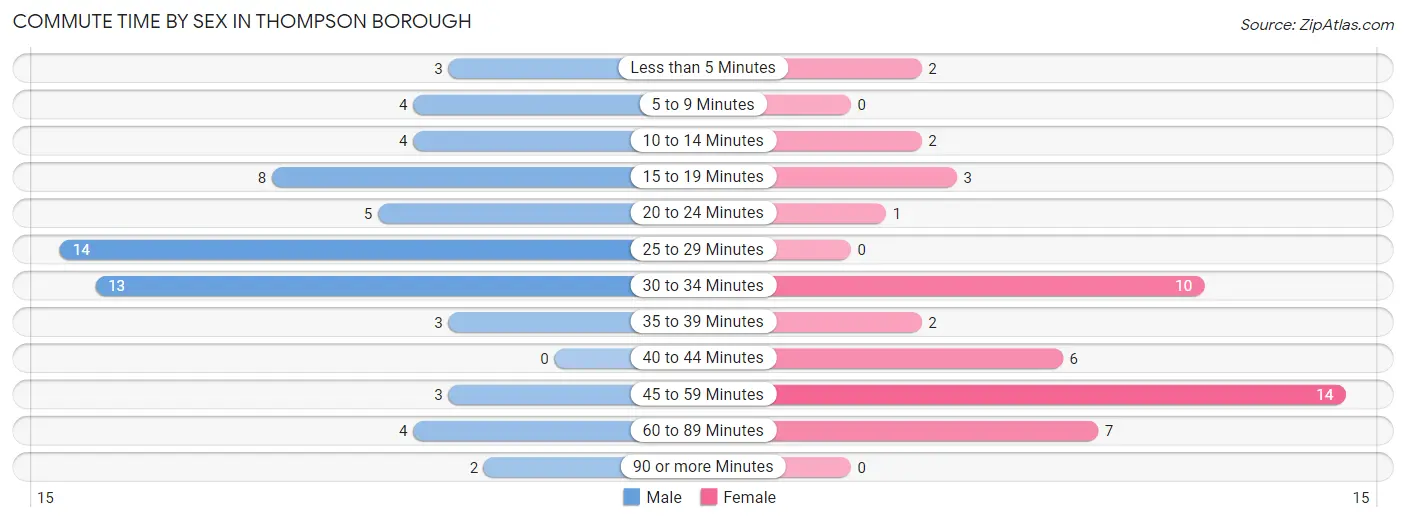
| Commute Time | Male | Female |
| Less than 5 Minutes | 3 (4.8%) | 2 (4.3%) |
| 5 to 9 Minutes | 4 (6.4%) | 0 (0.0%) |
| 10 to 14 Minutes | 4 (6.4%) | 2 (4.3%) |
| 15 to 19 Minutes | 8 (12.7%) | 3 (6.4%) |
| 20 to 24 Minutes | 5 (7.9%) | 1 (2.1%) |
| 25 to 29 Minutes | 14 (22.2%) | 0 (0.0%) |
| 30 to 34 Minutes | 13 (20.6%) | 10 (21.3%) |
| 35 to 39 Minutes | 3 (4.8%) | 2 (4.3%) |
| 40 to 44 Minutes | 0 (0.0%) | 6 (12.8%) |
| 45 to 59 Minutes | 3 (4.8%) | 14 (29.8%) |
| 60 to 89 Minutes | 4 (6.4%) | 7 (14.9%) |
| 90 or more Minutes | 2 (3.2%) | 0 (0.0%) |
Time of Departure to Work by Sex in Thompson borough
The most frequent times of departure to work in Thompson borough are 9:00 AM to 9:59 AM (11, 17.5%) for males and 7:00 AM to 7:29 AM (14, 29.8%) for females.
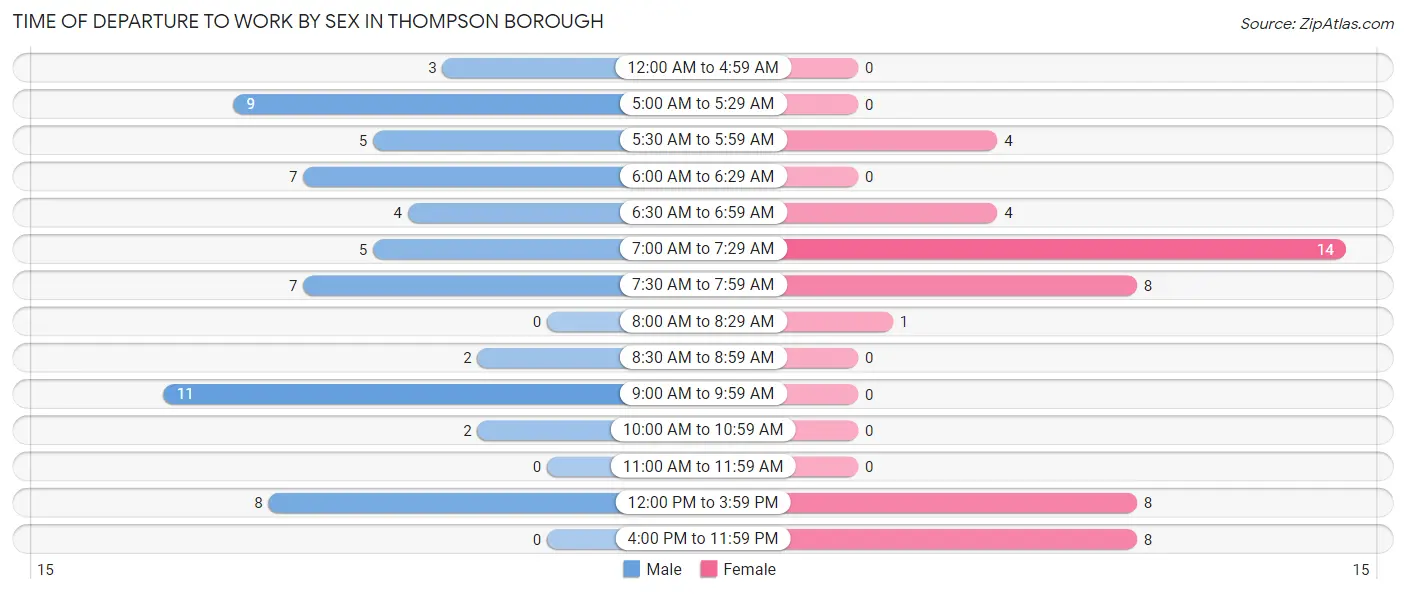
| Time of Departure | Male | Female |
| 12:00 AM to 4:59 AM | 3 (4.8%) | 0 (0.0%) |
| 5:00 AM to 5:29 AM | 9 (14.3%) | 0 (0.0%) |
| 5:30 AM to 5:59 AM | 5 (7.9%) | 4 (8.5%) |
| 6:00 AM to 6:29 AM | 7 (11.1%) | 0 (0.0%) |
| 6:30 AM to 6:59 AM | 4 (6.4%) | 4 (8.5%) |
| 7:00 AM to 7:29 AM | 5 (7.9%) | 14 (29.8%) |
| 7:30 AM to 7:59 AM | 7 (11.1%) | 8 (17.0%) |
| 8:00 AM to 8:29 AM | 0 (0.0%) | 1 (2.1%) |
| 8:30 AM to 8:59 AM | 2 (3.2%) | 0 (0.0%) |
| 9:00 AM to 9:59 AM | 11 (17.5%) | 0 (0.0%) |
| 10:00 AM to 10:59 AM | 2 (3.2%) | 0 (0.0%) |
| 11:00 AM to 11:59 AM | 0 (0.0%) | 0 (0.0%) |
| 12:00 PM to 3:59 PM | 8 (12.7%) | 8 (17.0%) |
| 4:00 PM to 11:59 PM | 0 (0.0%) | 8 (17.0%) |
| Total | 63 (100.0%) | 47 (100.0%) |
Housing Occupancy in Thompson borough
Occupancy by Ownership in Thompson borough
Of the total 90 dwellings in Thompson borough, owner-occupied units account for 55 (61.1%), while renter-occupied units make up 35 (38.9%).
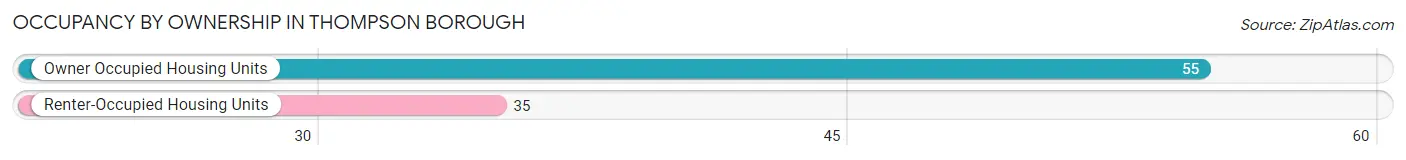
| Occupancy | # Housing Units | % Housing Units |
| Owner Occupied Housing Units | 55 | 61.1% |
| Renter-Occupied Housing Units | 35 | 38.9% |
| Total Occupied Housing Units | 90 | 100.0% |
Occupancy by Household Size in Thompson borough
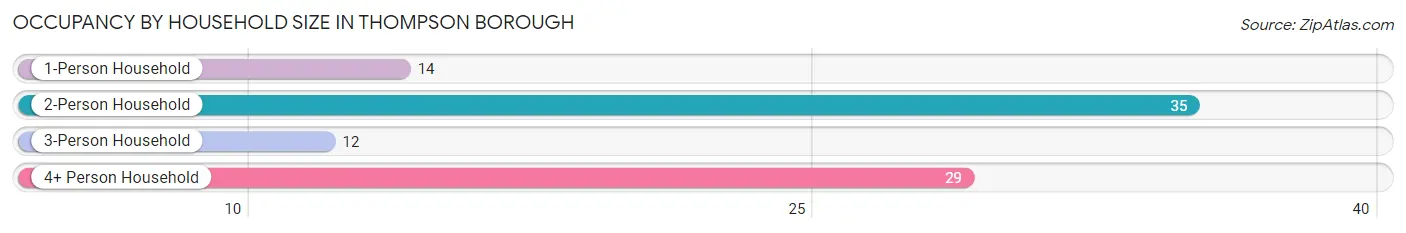
| Household Size | # Housing Units | % Housing Units |
| 1-Person Household | 14 | 15.6% |
| 2-Person Household | 35 | 38.9% |
| 3-Person Household | 12 | 13.3% |
| 4+ Person Household | 29 | 32.2% |
| Total Housing Units | 90 | 100.0% |
Occupancy by Ownership by Household Size in Thompson borough
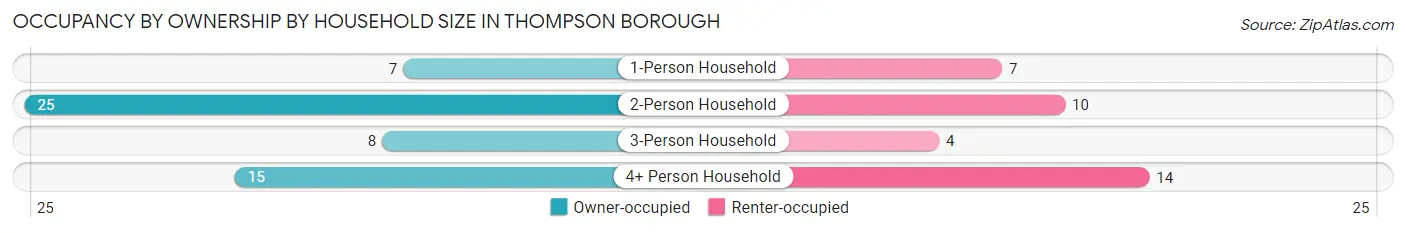
| Household Size | Owner-occupied | Renter-occupied |
| 1-Person Household | 7 (50.0%) | 7 (50.0%) |
| 2-Person Household | 25 (71.4%) | 10 (28.6%) |
| 3-Person Household | 8 (66.7%) | 4 (33.3%) |
| 4+ Person Household | 15 (51.7%) | 14 (48.3%) |
| Total Housing Units | 55 (61.1%) | 35 (38.9%) |
Occupancy by Educational Attainment in Thompson borough
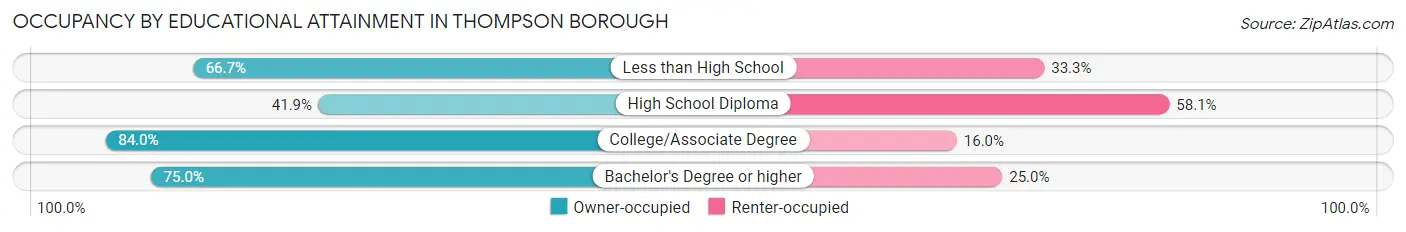
| Household Size | Owner-occupied | Renter-occupied |
| Less than High School | 4 (66.7%) | 2 (33.3%) |
| High School Diploma | 18 (41.9%) | 25 (58.1%) |
| College/Associate Degree | 21 (84.0%) | 4 (16.0%) |
| Bachelor's Degree or higher | 12 (75.0%) | 4 (25.0%) |
Occupancy by Age of Householder in Thompson borough
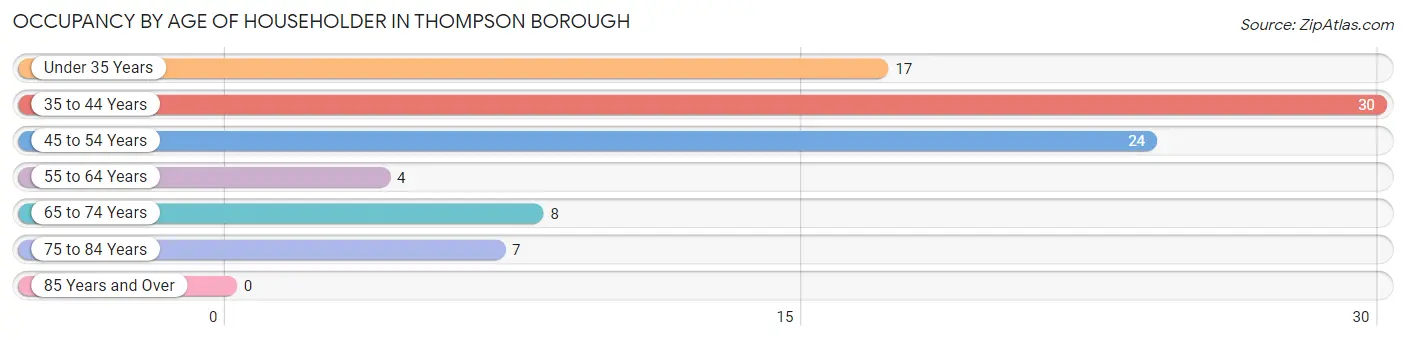
| Age Bracket | # Households | % Households |
| Under 35 Years | 17 | 18.9% |
| 35 to 44 Years | 30 | 33.3% |
| 45 to 54 Years | 24 | 26.7% |
| 55 to 64 Years | 4 | 4.4% |
| 65 to 74 Years | 8 | 8.9% |
| 75 to 84 Years | 7 | 7.8% |
| 85 Years and Over | 0 | 0.0% |
| Total | 90 | 100.0% |
Housing Finances in Thompson borough
Median Income by Occupancy in Thompson borough
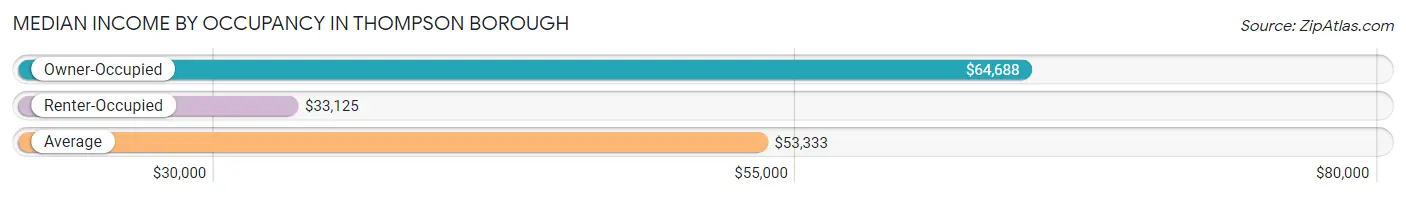
| Occupancy Type | # Households | Median Income |
| Owner-Occupied | 55 (61.1%) | $64,688 |
| Renter-Occupied | 35 (38.9%) | $33,125 |
| Average | 90 (100.0%) | $53,333 |
Occupancy by Householder Income Bracket in Thompson borough
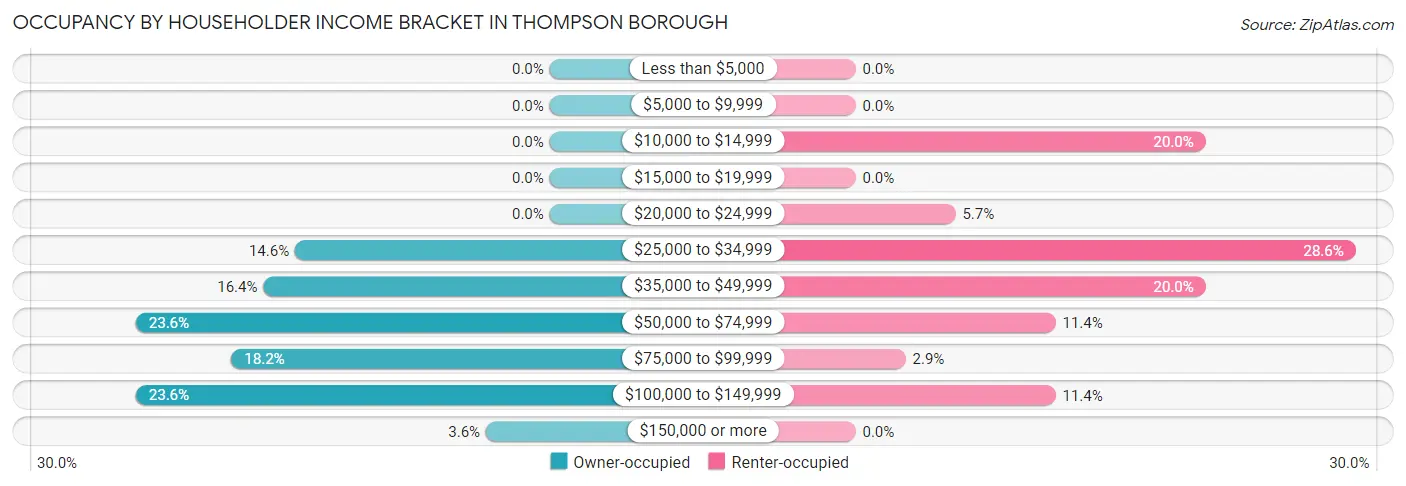
| Income Bracket | Owner-occupied | Renter-occupied |
| Less than $5,000 | 0 (0.0%) | 0 (0.0%) |
| $5,000 to $9,999 | 0 (0.0%) | 0 (0.0%) |
| $10,000 to $14,999 | 0 (0.0%) | 7 (20.0%) |
| $15,000 to $19,999 | 0 (0.0%) | 0 (0.0%) |
| $20,000 to $24,999 | 0 (0.0%) | 2 (5.7%) |
| $25,000 to $34,999 | 8 (14.5%) | 10 (28.6%) |
| $35,000 to $49,999 | 9 (16.4%) | 7 (20.0%) |
| $50,000 to $74,999 | 13 (23.6%) | 4 (11.4%) |
| $75,000 to $99,999 | 10 (18.2%) | 1 (2.9%) |
| $100,000 to $149,999 | 13 (23.6%) | 4 (11.4%) |
| $150,000 or more | 2 (3.6%) | 0 (0.0%) |
| Total | 55 (100.0%) | 35 (100.0%) |
Monthly Housing Cost Tiers in Thompson borough
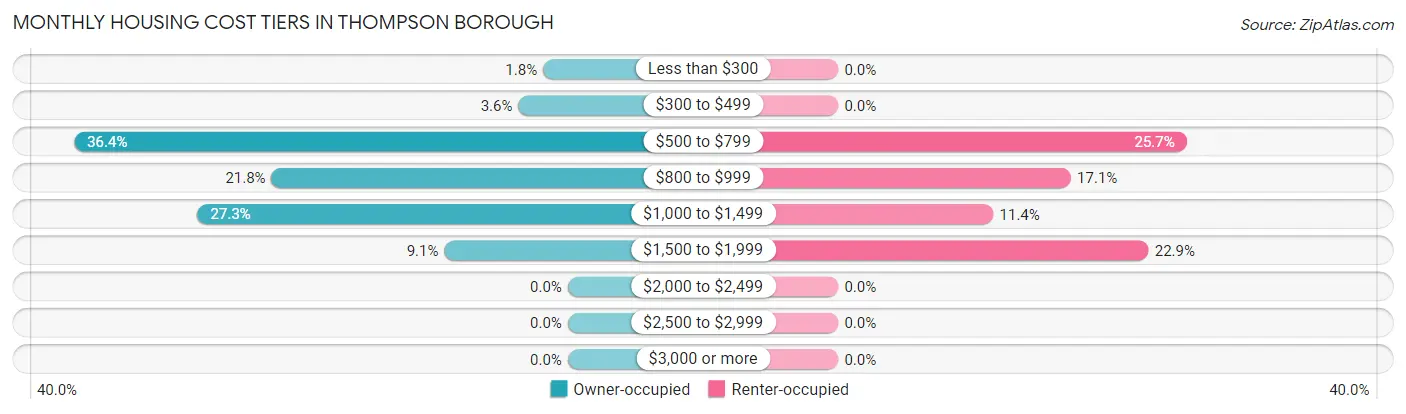
| Monthly Cost | Owner-occupied | Renter-occupied |
| Less than $300 | 1 (1.8%) | 0 (0.0%) |
| $300 to $499 | 2 (3.6%) | 0 (0.0%) |
| $500 to $799 | 20 (36.4%) | 9 (25.7%) |
| $800 to $999 | 12 (21.8%) | 6 (17.1%) |
| $1,000 to $1,499 | 15 (27.3%) | 4 (11.4%) |
| $1,500 to $1,999 | 5 (9.1%) | 8 (22.9%) |
| $2,000 to $2,499 | 0 (0.0%) | 0 (0.0%) |
| $2,500 to $2,999 | 0 (0.0%) | 0 (0.0%) |
| $3,000 or more | 0 (0.0%) | 0 (0.0%) |
| Total | 55 (100.0%) | 35 (100.0%) |
Physical Housing Characteristics in Thompson borough
Housing Structures in Thompson borough
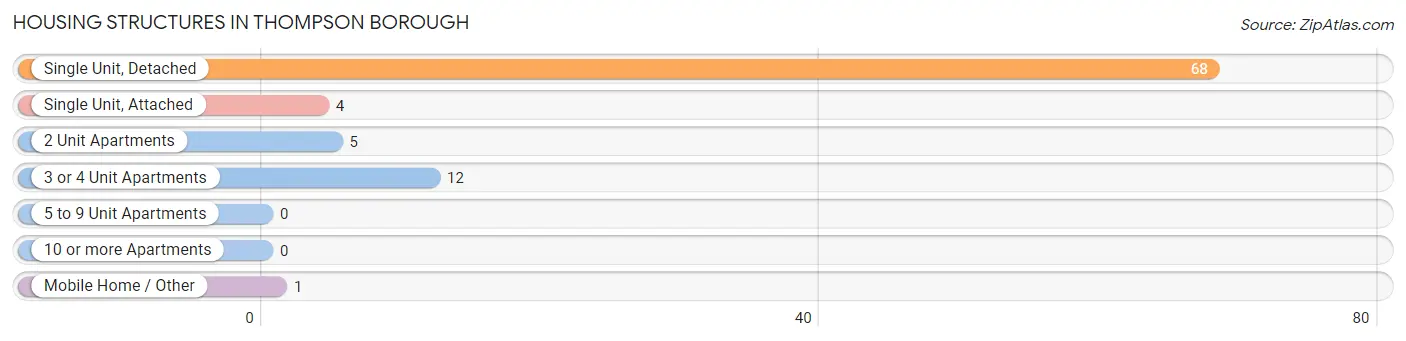
| Structure Type | # Housing Units | % Housing Units |
| Single Unit, Detached | 68 | 75.6% |
| Single Unit, Attached | 4 | 4.4% |
| 2 Unit Apartments | 5 | 5.6% |
| 3 or 4 Unit Apartments | 12 | 13.3% |
| 5 to 9 Unit Apartments | 0 | 0.0% |
| 10 or more Apartments | 0 | 0.0% |
| Mobile Home / Other | 1 | 1.1% |
| Total | 90 | 100.0% |
Housing Structures by Occupancy in Thompson borough
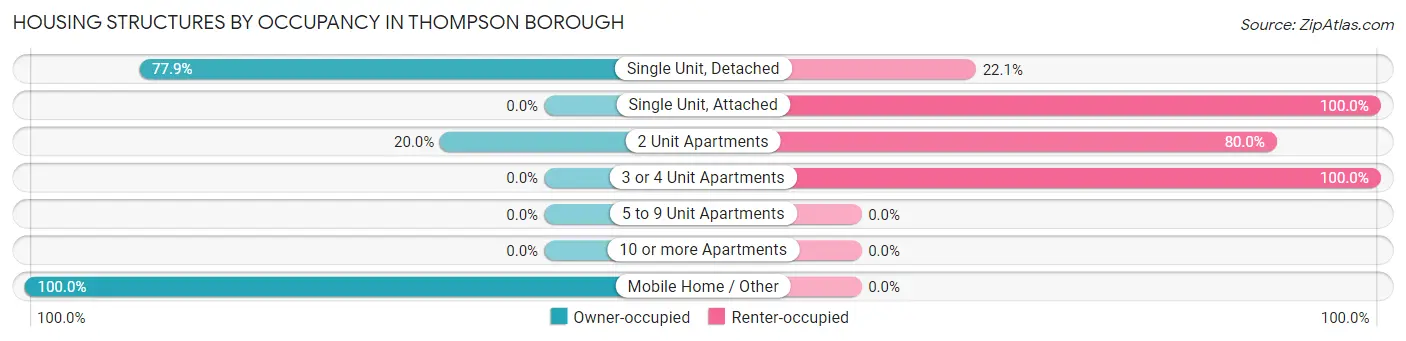
| Structure Type | Owner-occupied | Renter-occupied |
| Single Unit, Detached | 53 (77.9%) | 15 (22.1%) |
| Single Unit, Attached | 0 (0.0%) | 4 (100.0%) |
| 2 Unit Apartments | 1 (20.0%) | 4 (80.0%) |
| 3 or 4 Unit Apartments | 0 (0.0%) | 12 (100.0%) |
| 5 to 9 Unit Apartments | 0 (0.0%) | 0 (0.0%) |
| 10 or more Apartments | 0 (0.0%) | 0 (0.0%) |
| Mobile Home / Other | 1 (100.0%) | 0 (0.0%) |
| Total | 55 (61.1%) | 35 (38.9%) |
Housing Structures by Number of Rooms in Thompson borough
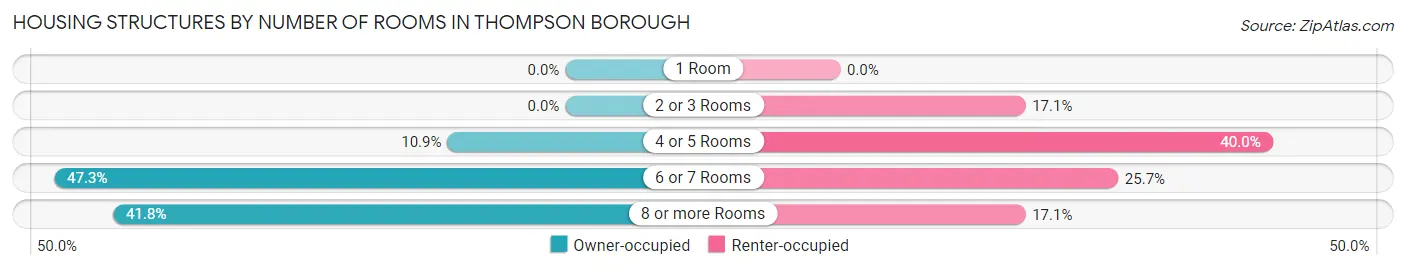
| Number of Rooms | Owner-occupied | Renter-occupied |
| 1 Room | 0 (0.0%) | 0 (0.0%) |
| 2 or 3 Rooms | 0 (0.0%) | 6 (17.1%) |
| 4 or 5 Rooms | 6 (10.9%) | 14 (40.0%) |
| 6 or 7 Rooms | 26 (47.3%) | 9 (25.7%) |
| 8 or more Rooms | 23 (41.8%) | 6 (17.1%) |
| Total | 55 (100.0%) | 35 (100.0%) |
Housing Structure by Heating Type in Thompson borough
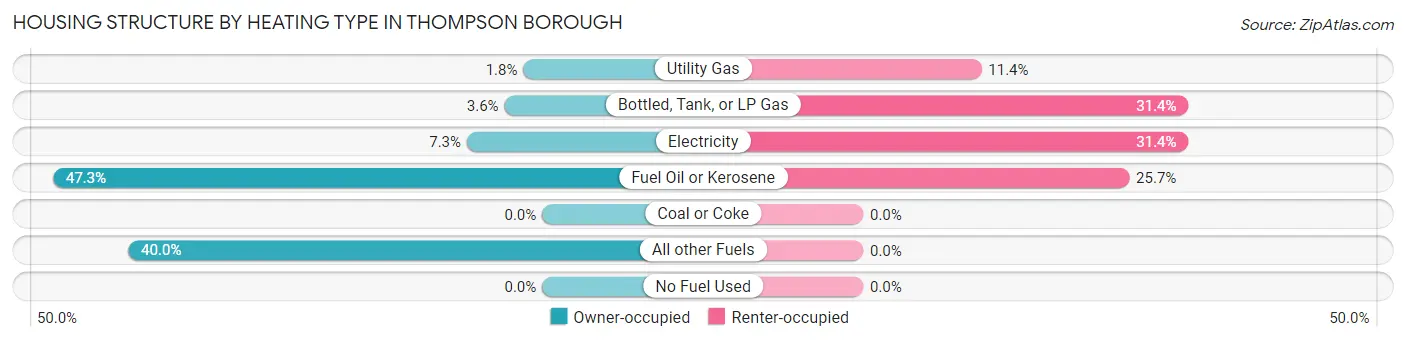
| Heating Type | Owner-occupied | Renter-occupied |
| Utility Gas | 1 (1.8%) | 4 (11.4%) |
| Bottled, Tank, or LP Gas | 2 (3.6%) | 11 (31.4%) |
| Electricity | 4 (7.3%) | 11 (31.4%) |
| Fuel Oil or Kerosene | 26 (47.3%) | 9 (25.7%) |
| Coal or Coke | 0 (0.0%) | 0 (0.0%) |
| All other Fuels | 22 (40.0%) | 0 (0.0%) |
| No Fuel Used | 0 (0.0%) | 0 (0.0%) |
| Total | 55 (100.0%) | 35 (100.0%) |
Household Vehicle Usage in Thompson borough
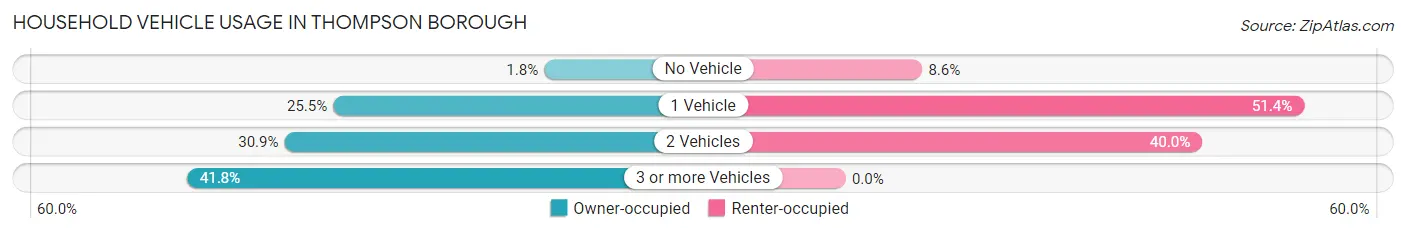
| Vehicles per Household | Owner-occupied | Renter-occupied |
| No Vehicle | 1 (1.8%) | 3 (8.6%) |
| 1 Vehicle | 14 (25.5%) | 18 (51.4%) |
| 2 Vehicles | 17 (30.9%) | 14 (40.0%) |
| 3 or more Vehicles | 23 (41.8%) | 0 (0.0%) |
| Total | 55 (100.0%) | 35 (100.0%) |
Real Estate & Mortgages in Thompson borough
Real Estate and Mortgage Overview in Thompson borough
| Characteristic | Without Mortgage | With Mortgage |
| Housing Units | 24 | 31 |
| Median Property Value | $125,000 | $122,500 |
| Median Household Income | $53,750 | $2 |
| Monthly Housing Costs | $638 | $0 |
| Real Estate Taxes | $2,167 | $0 |
Property Value by Mortgage Status in Thompson borough
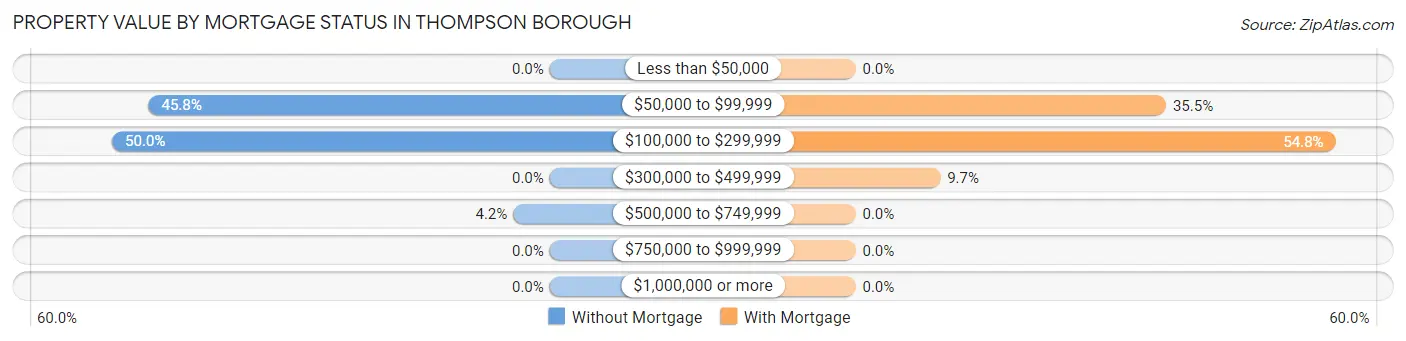
| Property Value | Without Mortgage | With Mortgage |
| Less than $50,000 | 0 (0.0%) | 0 (0.0%) |
| $50,000 to $99,999 | 11 (45.8%) | 11 (35.5%) |
| $100,000 to $299,999 | 12 (50.0%) | 17 (54.8%) |
| $300,000 to $499,999 | 0 (0.0%) | 3 (9.7%) |
| $500,000 to $749,999 | 1 (4.2%) | 0 (0.0%) |
| $750,000 to $999,999 | 0 (0.0%) | 0 (0.0%) |
| $1,000,000 or more | 0 (0.0%) | 0 (0.0%) |
| Total | 24 (100.0%) | 31 (100.0%) |
Household Income by Mortgage Status in Thompson borough
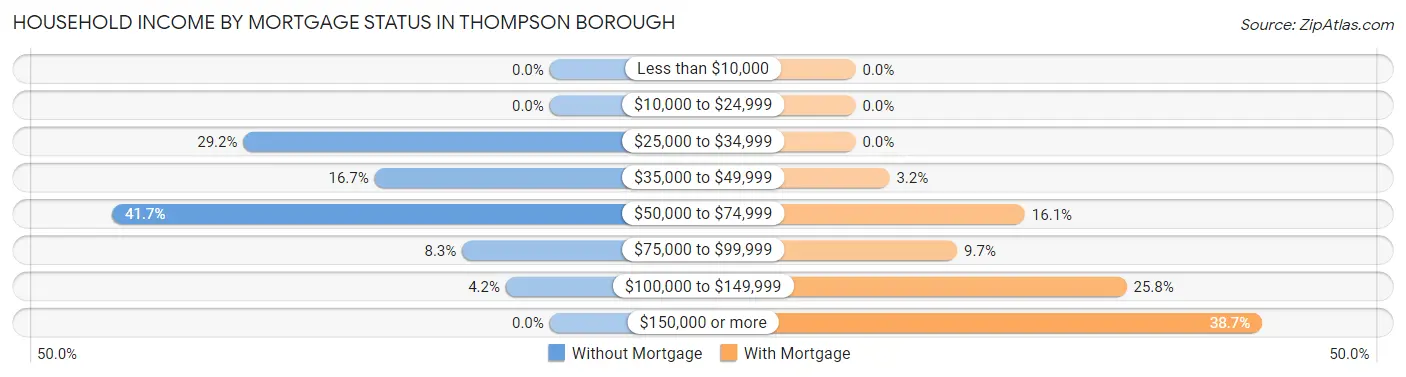
| Household Income | Without Mortgage | With Mortgage |
| Less than $10,000 | 0 (0.0%) | 0 (0.0%) |
| $10,000 to $24,999 | 0 (0.0%) | 0 (0.0%) |
| $25,000 to $34,999 | 7 (29.2%) | 0 (0.0%) |
| $35,000 to $49,999 | 4 (16.7%) | 1 (3.2%) |
| $50,000 to $74,999 | 10 (41.7%) | 5 (16.1%) |
| $75,000 to $99,999 | 2 (8.3%) | 3 (9.7%) |
| $100,000 to $149,999 | 1 (4.2%) | 8 (25.8%) |
| $150,000 or more | 0 (0.0%) | 12 (38.7%) |
| Total | 24 (100.0%) | 31 (100.0%) |
Property Value to Household Income Ratio in Thompson borough
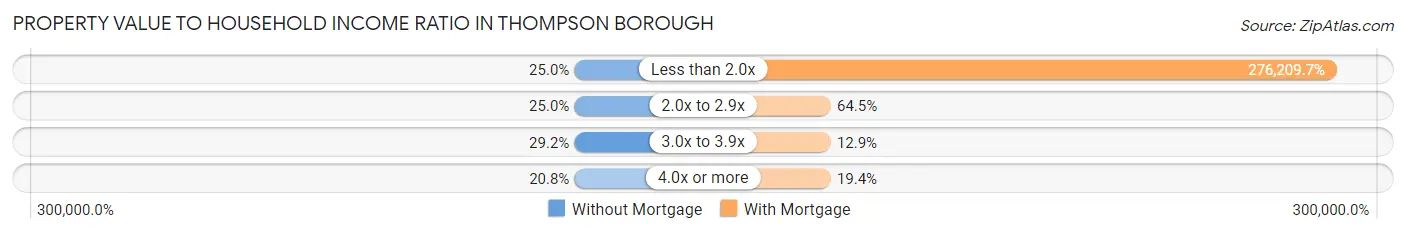
| Value-to-Income Ratio | Without Mortgage | With Mortgage |
| Less than 2.0x | 6 (25.0%) | 85,625 (276,209.7%) |
| 2.0x to 2.9x | 6 (25.0%) | 20 (64.5%) |
| 3.0x to 3.9x | 7 (29.2%) | 4 (12.9%) |
| 4.0x or more | 5 (20.8%) | 6 (19.4%) |
| Total | 24 (100.0%) | 31 (100.0%) |
Real Estate Taxes by Mortgage Status in Thompson borough
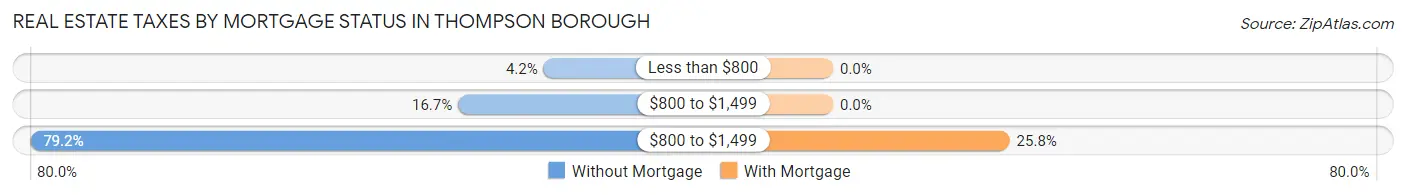
| Property Taxes | Without Mortgage | With Mortgage |
| Less than $800 | 1 (4.2%) | 0 (0.0%) |
| $800 to $1,499 | 4 (16.7%) | 0 (0.0%) |
| $800 to $1,499 | 19 (79.2%) | 8 (25.8%) |
| Total | 24 (100.0%) | 31 (100.0%) |
Health & Disability in Thompson borough
Health Insurance Coverage by Age in Thompson borough
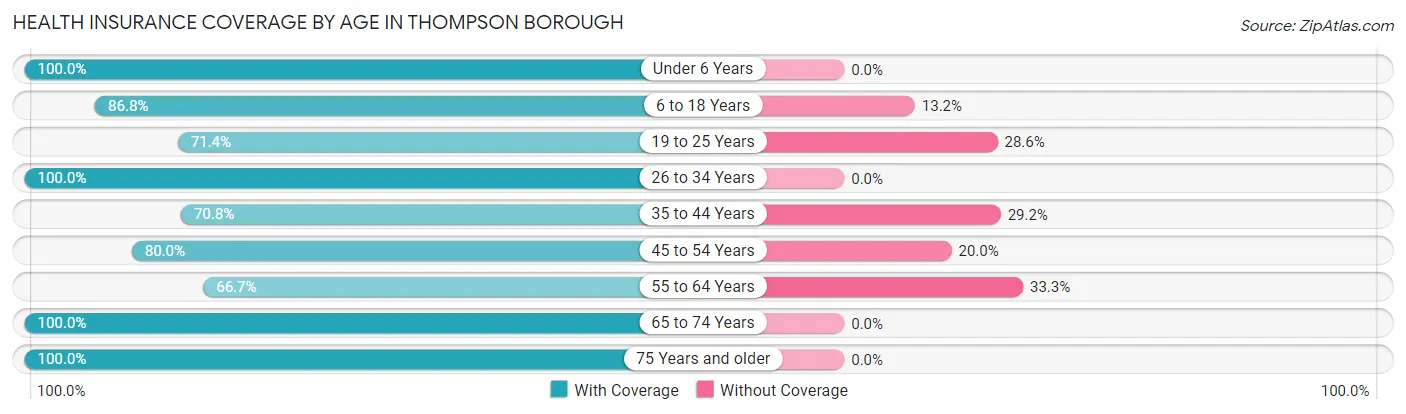
| Age Bracket | With Coverage | Without Coverage |
| Under 6 Years | 63 (100.0%) | 0 (0.0%) |
| 6 to 18 Years | 33 (86.8%) | 5 (13.2%) |
| 19 to 25 Years | 10 (71.4%) | 4 (28.6%) |
| 26 to 34 Years | 31 (100.0%) | 0 (0.0%) |
| 35 to 44 Years | 34 (70.8%) | 14 (29.2%) |
| 45 to 54 Years | 40 (80.0%) | 10 (20.0%) |
| 55 to 64 Years | 12 (66.7%) | 6 (33.3%) |
| 65 to 74 Years | 21 (100.0%) | 0 (0.0%) |
| 75 Years and older | 8 (100.0%) | 0 (0.0%) |
| Total | 252 (86.6%) | 39 (13.4%) |
Health Insurance Coverage by Citizenship Status in Thompson borough
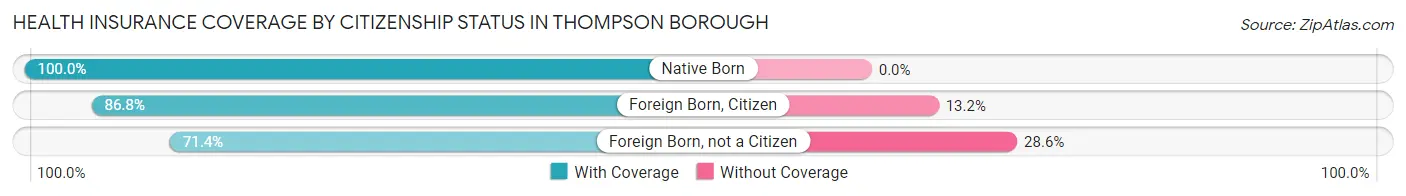
| Citizenship Status | With Coverage | Without Coverage |
| Native Born | 63 (100.0%) | 0 (0.0%) |
| Foreign Born, Citizen | 33 (86.8%) | 5 (13.2%) |
| Foreign Born, not a Citizen | 10 (71.4%) | 4 (28.6%) |
Health Insurance Coverage by Household Income in Thompson borough
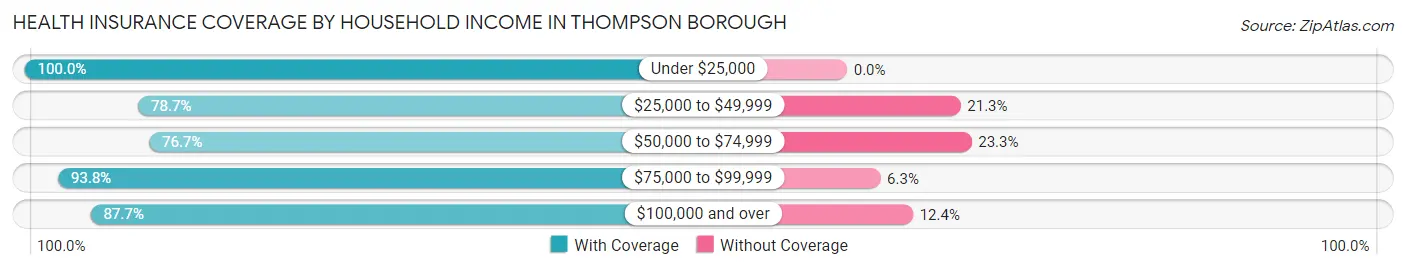
| Household Income | With Coverage | Without Coverage |
| Under $25,000 | 54 (100.0%) | 0 (0.0%) |
| $25,000 to $49,999 | 74 (78.7%) | 20 (21.3%) |
| $50,000 to $74,999 | 23 (76.7%) | 7 (23.3%) |
| $75,000 to $99,999 | 30 (93.8%) | 2 (6.2%) |
| $100,000 and over | 71 (87.6%) | 10 (12.3%) |
Public vs Private Health Insurance Coverage by Age in Thompson borough
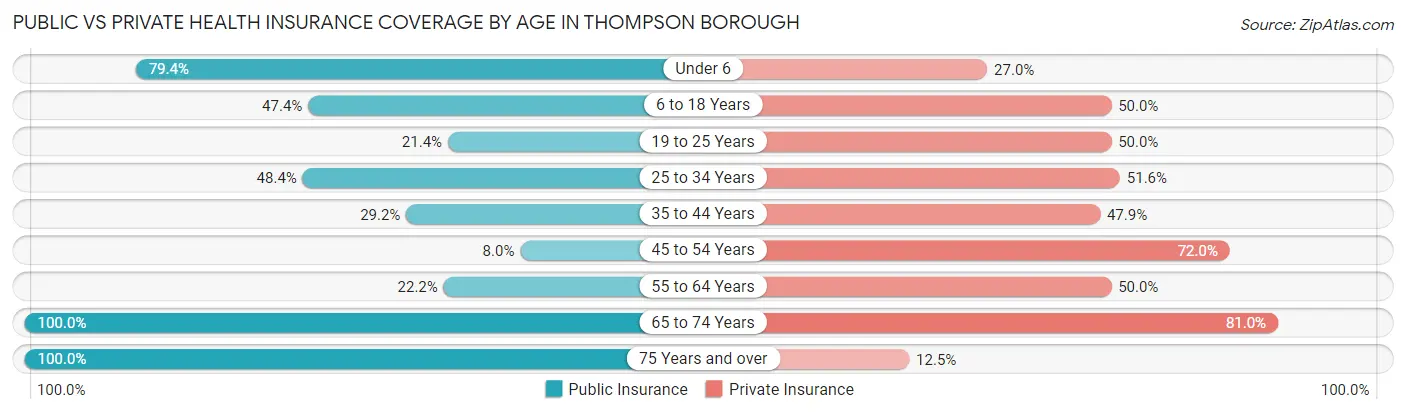
| Age Bracket | Public Insurance | Private Insurance |
| Under 6 | 50 (79.4%) | 17 (27.0%) |
| 6 to 18 Years | 18 (47.4%) | 19 (50.0%) |
| 19 to 25 Years | 3 (21.4%) | 7 (50.0%) |
| 25 to 34 Years | 15 (48.4%) | 16 (51.6%) |
| 35 to 44 Years | 14 (29.2%) | 23 (47.9%) |
| 45 to 54 Years | 4 (8.0%) | 36 (72.0%) |
| 55 to 64 Years | 4 (22.2%) | 9 (50.0%) |
| 65 to 74 Years | 21 (100.0%) | 17 (80.9%) |
| 75 Years and over | 8 (100.0%) | 1 (12.5%) |
| Total | 137 (47.1%) | 145 (49.8%) |
Disability Status by Sex by Age in Thompson borough
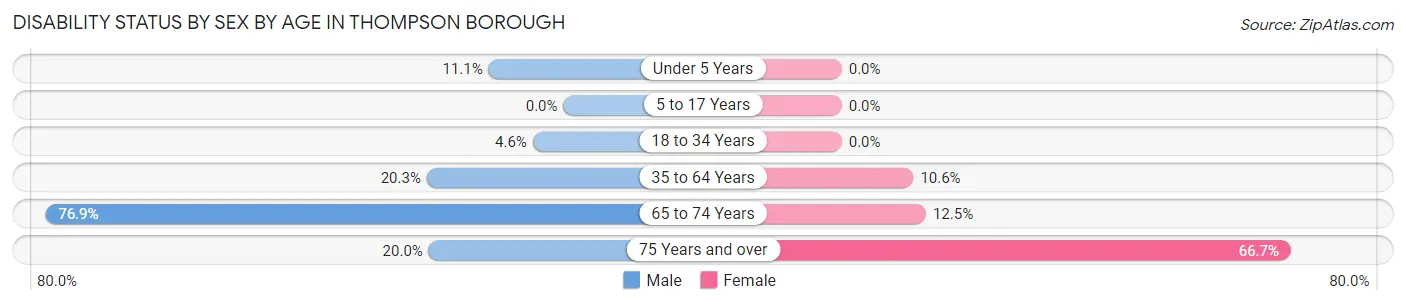
| Age Bracket | Male | Female |
| Under 5 Years | 4 (11.1%) | 0 (0.0%) |
| 5 to 17 Years | 0 (0.0%) | 0 (0.0%) |
| 18 to 34 Years | 1 (4.5%) | 0 (0.0%) |
| 35 to 64 Years | 14 (20.3%) | 5 (10.6%) |
| 65 to 74 Years | 10 (76.9%) | 1 (12.5%) |
| 75 Years and over | 1 (20.0%) | 2 (66.7%) |
Disability Class by Sex by Age in Thompson borough
Disability Class: Hearing Difficulty
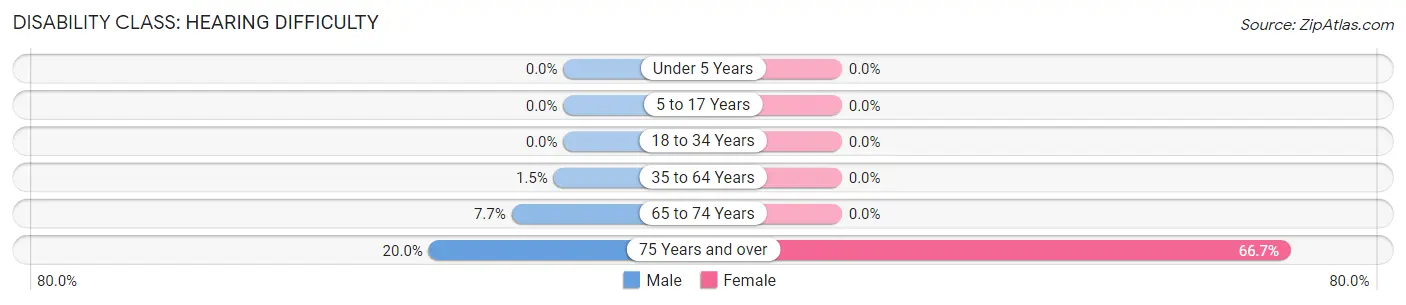
| Age Bracket | Male | Female |
| Under 5 Years | 0 (0.0%) | 0 (0.0%) |
| 5 to 17 Years | 0 (0.0%) | 0 (0.0%) |
| 18 to 34 Years | 0 (0.0%) | 0 (0.0%) |
| 35 to 64 Years | 1 (1.5%) | 0 (0.0%) |
| 65 to 74 Years | 1 (7.7%) | 0 (0.0%) |
| 75 Years and over | 1 (20.0%) | 2 (66.7%) |
Disability Class: Vision Difficulty
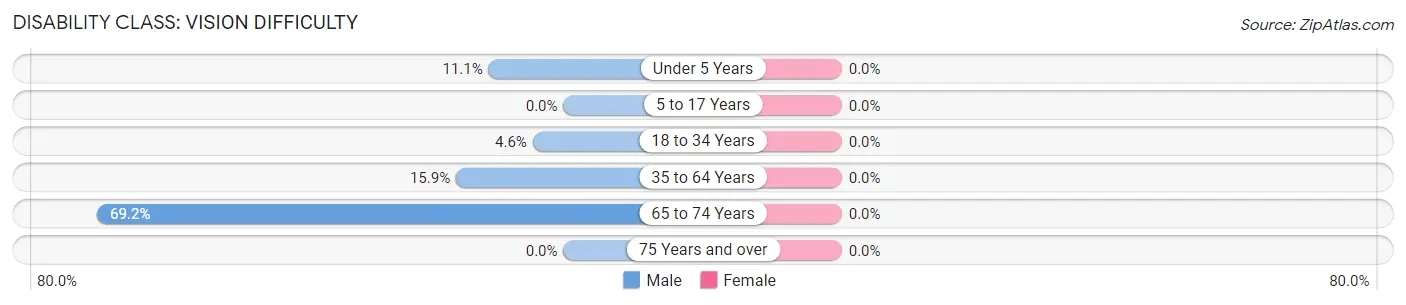
| Age Bracket | Male | Female |
| Under 5 Years | 4 (11.1%) | 0 (0.0%) |
| 5 to 17 Years | 0 (0.0%) | 0 (0.0%) |
| 18 to 34 Years | 1 (4.5%) | 0 (0.0%) |
| 35 to 64 Years | 11 (15.9%) | 0 (0.0%) |
| 65 to 74 Years | 9 (69.2%) | 0 (0.0%) |
| 75 Years and over | 0 (0.0%) | 0 (0.0%) |
Disability Class: Cognitive Difficulty
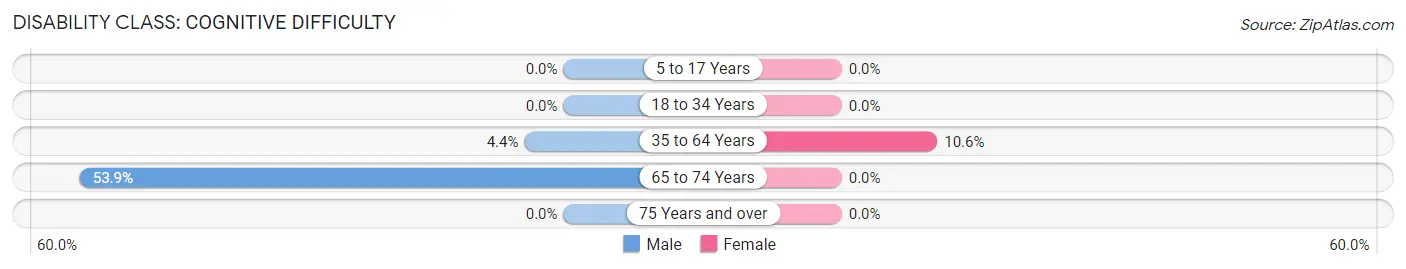
| Age Bracket | Male | Female |
| 5 to 17 Years | 0 (0.0%) | 0 (0.0%) |
| 18 to 34 Years | 0 (0.0%) | 0 (0.0%) |
| 35 to 64 Years | 3 (4.3%) | 5 (10.6%) |
| 65 to 74 Years | 7 (53.8%) | 0 (0.0%) |
| 75 Years and over | 0 (0.0%) | 0 (0.0%) |
Disability Class: Ambulatory Difficulty
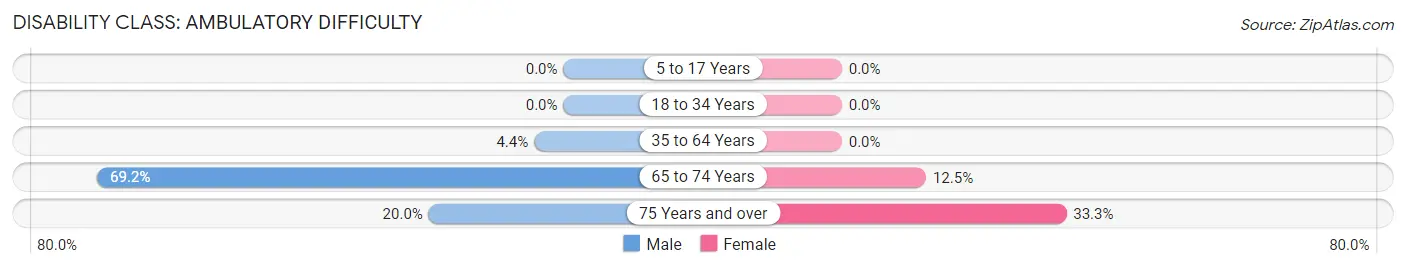
| Age Bracket | Male | Female |
| 5 to 17 Years | 0 (0.0%) | 0 (0.0%) |
| 18 to 34 Years | 0 (0.0%) | 0 (0.0%) |
| 35 to 64 Years | 3 (4.3%) | 0 (0.0%) |
| 65 to 74 Years | 9 (69.2%) | 1 (12.5%) |
| 75 Years and over | 1 (20.0%) | 1 (33.3%) |
Disability Class: Self-Care Difficulty
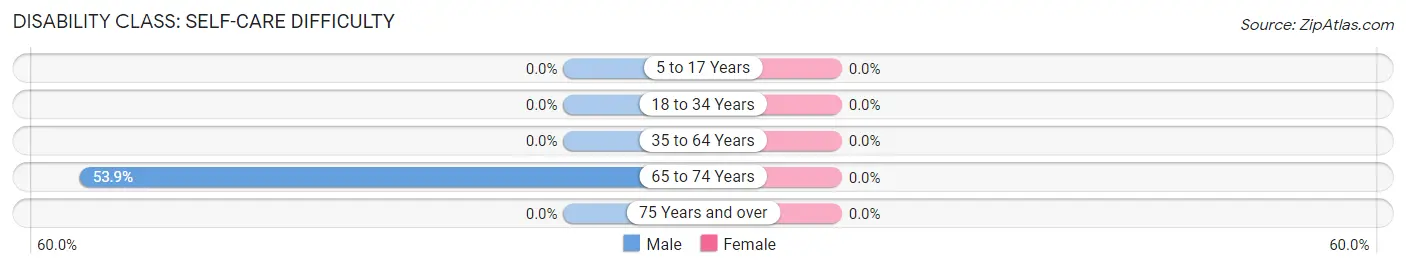
| Age Bracket | Male | Female |
| 5 to 17 Years | 0 (0.0%) | 0 (0.0%) |
| 18 to 34 Years | 0 (0.0%) | 0 (0.0%) |
| 35 to 64 Years | 0 (0.0%) | 0 (0.0%) |
| 65 to 74 Years | 7 (53.8%) | 0 (0.0%) |
| 75 Years and over | 0 (0.0%) | 0 (0.0%) |
Technology Access in Thompson borough
Computing Device Access in Thompson borough
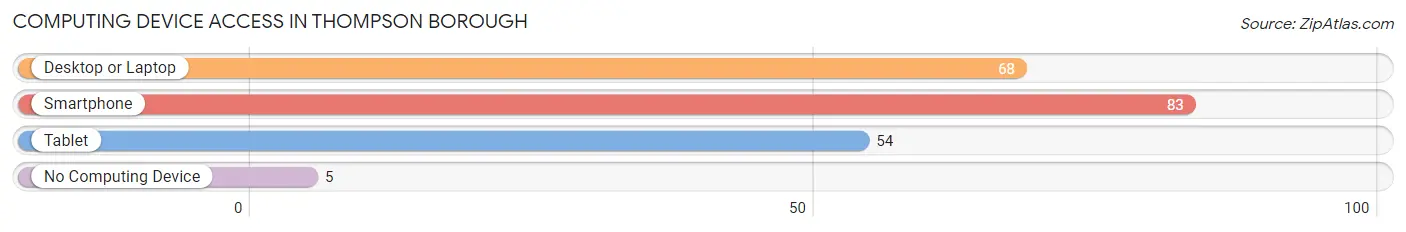
| Device Type | # Households | % Households |
| Desktop or Laptop | 68 | 75.6% |
| Smartphone | 83 | 92.2% |
| Tablet | 54 | 60.0% |
| No Computing Device | 5 | 5.6% |
| Total | 90 | 100.0% |
Internet Access in Thompson borough
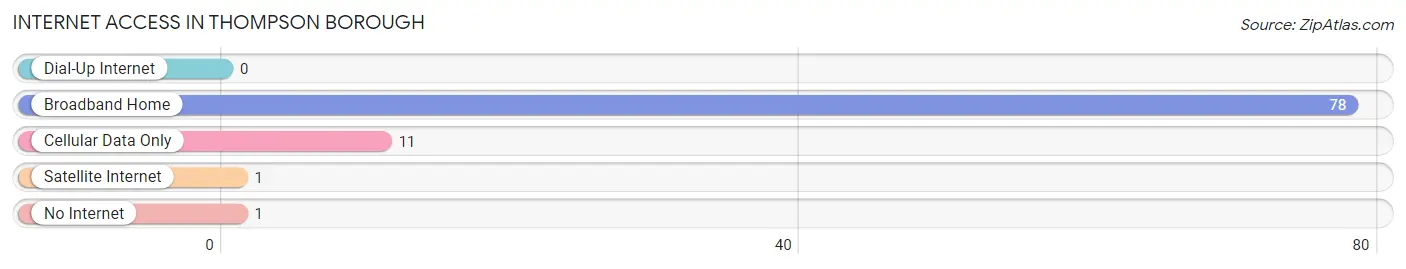
| Internet Type | # Households | % Households |
| Dial-Up Internet | 0 | 0.0% |
| Broadband Home | 78 | 86.7% |
| Cellular Data Only | 11 | 12.2% |
| Satellite Internet | 1 | 1.1% |
| No Internet | 1 | 1.1% |
| Total | 90 | 100.0% |
Thompson borough Summary
History
Thompson Borough is a small borough located in Pike County, Pennsylvania. It is situated in the northern part of the county, near the border of Wayne County. The borough was founded in 1845 and was named after the Thompson family, who were early settlers in the area.
The first settlers in the area were the Lenape Indians, who lived in the area for centuries before the arrival of Europeans. The first Europeans to settle in the area were the Dutch, who arrived in the late 1600s. They were followed by the English, who established a trading post in the area in 1750.
The area was part of the original Wayne County, which was established in 1798. In 1845, the area was split off from Wayne County and became part of Pike County. The same year, the borough of Thompson was established.
The borough was originally a farming community, with many of the early settlers being farmers. The area was also known for its iron ore deposits, which were mined in the late 1800s and early 1900s. The iron ore was used to make steel, which was used in the construction of bridges and other structures.
The borough was also home to several small businesses, including a sawmill, a gristmill, a tannery, and a blacksmith shop. The borough also had a post office, which was established in 1845.
In the late 1800s and early 1900s, the borough was home to several resorts, which attracted visitors from all over the region. The resorts included the Thompson House, the Thompson Hotel, and the Thompson Inn.
Geography
Thompson Borough is located in northern Pike County, Pennsylvania. It is situated in the Pocono Mountains, near the border of Wayne County. The borough is bordered by Lackawaxen Township to the north, Blooming Grove Township to the east, Palmyra Township to the south, and Greene Township to the west.
The borough covers an area of 1.2 square miles, all of which is land. The terrain is mostly hilly, with some flat areas. The highest point in the borough is 1,890 feet above sea level.
The climate in the borough is humid continental, with cold winters and warm summers. The average annual temperature is 46 degrees Fahrenheit. The average annual precipitation is 40 inches.
Economy
The economy of Thompson Borough is largely based on tourism. The borough is home to several resorts, which attract visitors from all over the region. The resorts include the Thompson House, the Thompson Hotel, and the Thompson Inn.
The borough is also home to several small businesses, including a sawmill, a gristmill, a tannery, and a blacksmith shop. The borough also has a post office, which was established in 1845.
Demographics
As of the 2010 census, the population of Thompson Borough was 1,093. The racial makeup of the borough was 97.3% White, 0.7% African American, 0.2% Native American, 0.2% Asian, 0.2% from other races, and 1.4% from two or more races. Hispanic or Latino of any race were 1.2% of the population.
The median household income in the borough was $45,000, and the median family income was $50,000. The per capita income was $20,000. About 8.3% of families and 10.2% of the population were below the poverty line.
Common Questions
What is Per Capita Income in Thompson borough?
Per Capita income in Thompson borough is $22,393.
What is the Median Family Income in Thompson borough?
Median Family Income in Thompson borough is $53,125.
What is the Median Household income in Thompson borough?
Median Household Income in Thompson borough is $53,333.
What is Income or Wage Gap in Thompson borough?
Income or Wage Gap in Thompson borough is 38.3%.
Women in Thompson borough earn 61.7 cents for every dollar earned by a man.
What is Inequality or Gini Index in Thompson borough?
Inequality or Gini Index in Thompson borough is 0.36.
What is the Total Population of Thompson borough?
Total Population of Thompson borough is 291.
What is the Total Male Population of Thompson borough?
Total Male Population of Thompson borough is 173.
What is the Total Female Population of Thompson borough?
Total Female Population of Thompson borough is 118.
What is the Ratio of Males per 100 Females in Thompson borough?
There are 146.61 Males per 100 Females in Thompson borough.
What is the Ratio of Females per 100 Males in Thompson borough?
There are 68.21 Females per 100 Males in Thompson borough.
What is the Median Population Age in Thompson borough?
Median Population Age in Thompson borough is 34.9 Years.
What is the Average Family Size in Thompson borough
Average Family Size in Thompson borough is 3.7 People.
What is the Average Household Size in Thompson borough
Average Household Size in Thompson borough is 3.2 People.
How Large is the Labor Force in Thompson borough?
There are 143 People in the Labor Forcein in Thompson borough.
What is the Percentage of People in the Labor Force in Thompson borough?
71.1% of People are in the Labor Force in Thompson borough.
What is the Unemployment Rate in Thompson borough?
Unemployment Rate in Thompson borough is 11.2%.