Spring Valley, OH Map & Demographics
Spring Valley Map
Spring Valley Overview
$25,673
PER CAPITA INCOME
$75,714
AVG FAMILY INCOME
$67,813
AVG HOUSEHOLD INCOME
51.5%
WAGE / INCOME GAP [ % ]
48.5¢/ $1
WAGE / INCOME GAP [ $ ]
0.35
INEQUALITY / GINI INDEX
606
TOTAL POPULATION
291
MALE POPULATION
315
FEMALE POPULATION
92.38
MALES / 100 FEMALES
108.25
FEMALES / 100 MALES
48.2
MEDIAN AGE
3.8
AVG FAMILY SIZE
3.2
AVG HOUSEHOLD SIZE
256
LABOR FORCE [ PEOPLE ]
54.5%
PERCENT IN LABOR FORCE
2.0%
UNEMPLOYMENT RATE
Spring Valley Zip Codes
Spring Valley Area Codes
Income in Spring Valley
Income Overview in Spring Valley
Per Capita Income in Spring Valley is $25,673, while median incomes of families and households are $75,714 and $67,813 respectively.
| Characteristic | Number | Measure |
| Per Capita Income | 606 | $25,673 |
| Median Family Income | 132 | $75,714 |
| Mean Family Income | 132 | $84,411 |
| Median Household Income | 191 | $67,813 |
| Mean Household Income | 191 | $74,830 |
| Income Deficit | 132 | $0 |
| Wage / Income Gap (%) | 606 | 51.45% |
| Wage / Income Gap ($) | 606 | 48.55¢ per $1 |
| Gini / Inequality Index | 606 | 0.35 |
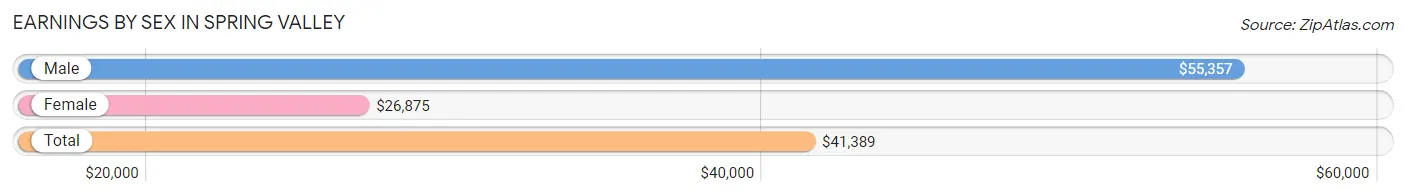
Earnings by Sex in Spring Valley
Average Earnings in Spring Valley are $41,389, $55,357 for men and $26,875 for women, a difference of 51.4%.
| Sex | Number | Average Earnings |
| Male | 130 (48.1%) | $55,357 |
| Female | 140 (51.8%) | $26,875 |
| Total | 270 (100.0%) | $41,389 |
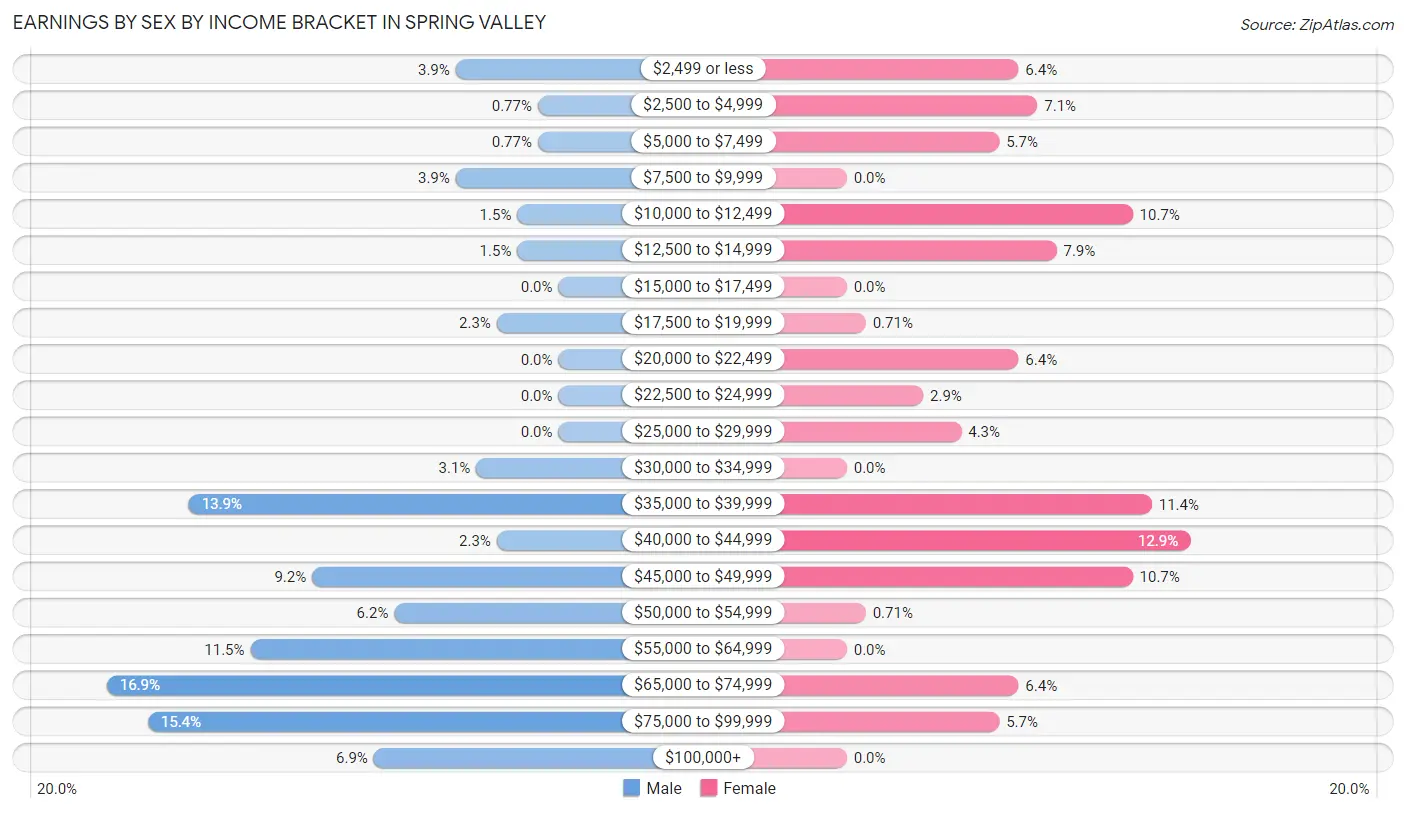
Earnings by Sex by Income Bracket in Spring Valley
The most common earnings brackets in Spring Valley are $65,000 to $74,999 for men (22 | 16.9%) and $40,000 to $44,999 for women (18 | 12.9%).
| Income | Male | Female |
| $2,499 or less | 5 (3.8%) | 9 (6.4%) |
| $2,500 to $4,999 | 1 (0.8%) | 10 (7.1%) |
| $5,000 to $7,499 | 1 (0.8%) | 8 (5.7%) |
| $7,500 to $9,999 | 5 (3.8%) | 0 (0.0%) |
| $10,000 to $12,499 | 2 (1.5%) | 15 (10.7%) |
| $12,500 to $14,999 | 2 (1.5%) | 11 (7.9%) |
| $15,000 to $17,499 | 0 (0.0%) | 0 (0.0%) |
| $17,500 to $19,999 | 3 (2.3%) | 1 (0.7%) |
| $20,000 to $22,499 | 0 (0.0%) | 9 (6.4%) |
| $22,500 to $24,999 | 0 (0.0%) | 4 (2.9%) |
| $25,000 to $29,999 | 0 (0.0%) | 6 (4.3%) |
| $30,000 to $34,999 | 4 (3.1%) | 0 (0.0%) |
| $35,000 to $39,999 | 18 (13.9%) | 16 (11.4%) |
| $40,000 to $44,999 | 3 (2.3%) | 18 (12.9%) |
| $45,000 to $49,999 | 12 (9.2%) | 15 (10.7%) |
| $50,000 to $54,999 | 8 (6.1%) | 1 (0.7%) |
| $55,000 to $64,999 | 15 (11.5%) | 0 (0.0%) |
| $65,000 to $74,999 | 22 (16.9%) | 9 (6.4%) |
| $75,000 to $99,999 | 20 (15.4%) | 8 (5.7%) |
| $100,000+ | 9 (6.9%) | 0 (0.0%) |
| Total | 130 (100.0%) | 140 (100.0%) |
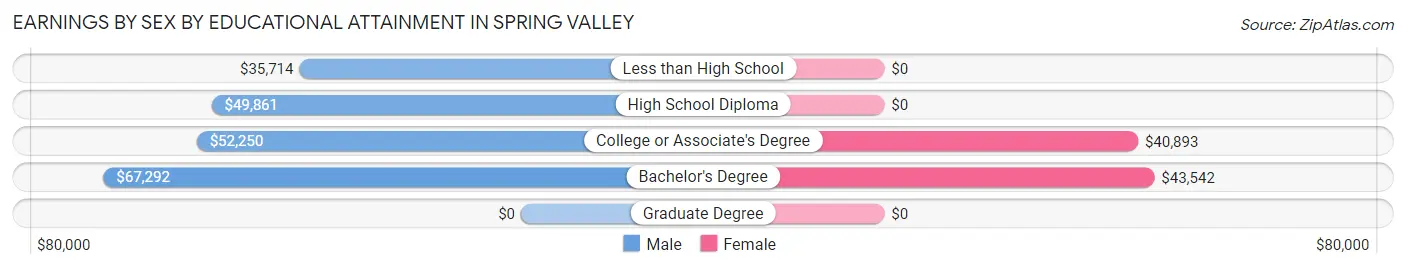
Earnings by Sex by Educational Attainment in Spring Valley
Average earnings in Spring Valley are $55,714 for men and $35,625 for women, a difference of 36.1%. Men with an educational attainment of bachelor's degree enjoy the highest average annual earnings of $67,292, while those with less than high school education earn the least with $35,714. Women with an educational attainment of bachelor's degree earn the most with the average annual earnings of $43,542, while those with college or associate's degree education have the smallest earnings of $40,893.
| Educational Attainment | Male Income | Female Income |
| Less than High School | $35,714 | $0 |
| High School Diploma | $49,861 | $0 |
| College or Associate's Degree | $52,250 | $40,893 |
| Bachelor's Degree | $67,292 | $43,542 |
| Graduate Degree | - | - |
| Total | $55,714 | $35,625 |
Family Income in Spring Valley
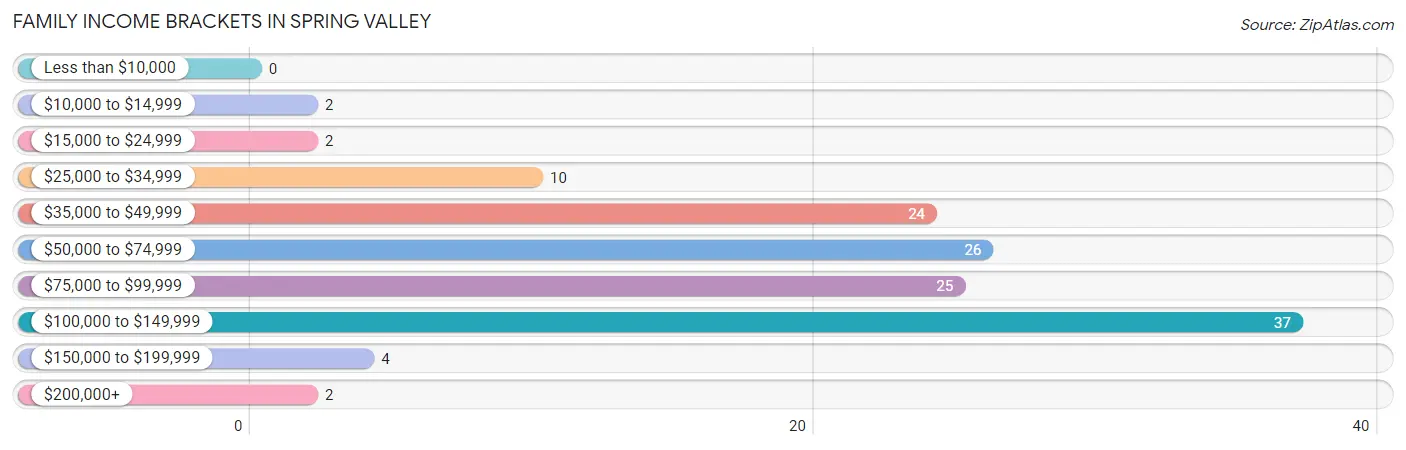
Family Income Brackets in Spring Valley
According to the Spring Valley family income data, there are 37 families falling into the $100,000 to $149,999 income range, which is the most common income bracket and makes up 28.0% of all families.
| Income Bracket | # Families | % Families |
| Less than $10,000 | 0 | 0.0% |
| $10,000 to $14,999 | 2 | 1.5% |
| $15,000 to $24,999 | 2 | 1.5% |
| $25,000 to $34,999 | 10 | 7.6% |
| $35,000 to $49,999 | 24 | 18.2% |
| $50,000 to $74,999 | 26 | 19.7% |
| $75,000 to $99,999 | 25 | 18.9% |
| $100,000 to $149,999 | 37 | 28.0% |
| $150,000 to $199,999 | 4 | 3.0% |
| $200,000+ | 2 | 1.5% |
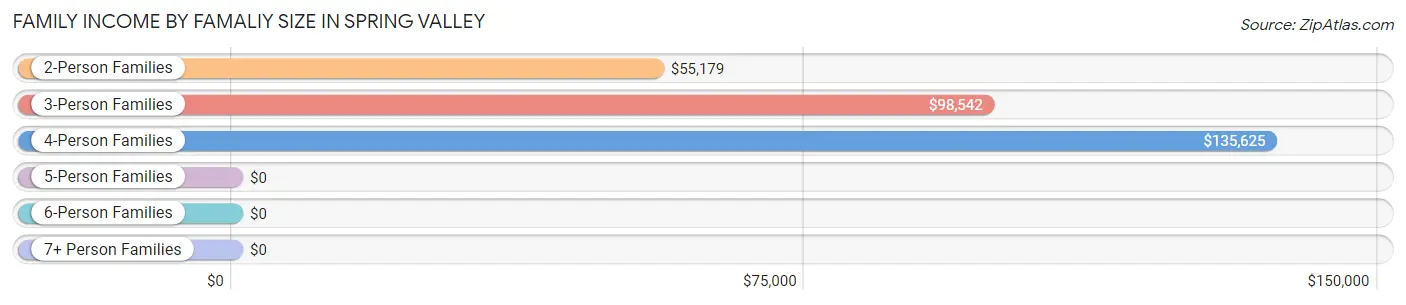
Family Income by Famaliy Size in Spring Valley
4-person families (17 | 12.9%) account for the highest median family income in Spring Valley with $135,625 per family, while 4-person families (17 | 12.9%) have the highest median income of $33,906 per family member.
| Income Bracket | # Families | Median Income |
| 2-Person Families | 77 (58.3%) | $55,179 |
| 3-Person Families | 33 (25.0%) | $98,542 |
| 4-Person Families | 17 (12.9%) | $135,625 |
| 5-Person Families | 0 (0.0%) | $0 |
| 6-Person Families | 5 (3.8%) | $0 |
| 7+ Person Families | 0 (0.0%) | $0 |
| Total | 132 (100.0%) | $75,714 |
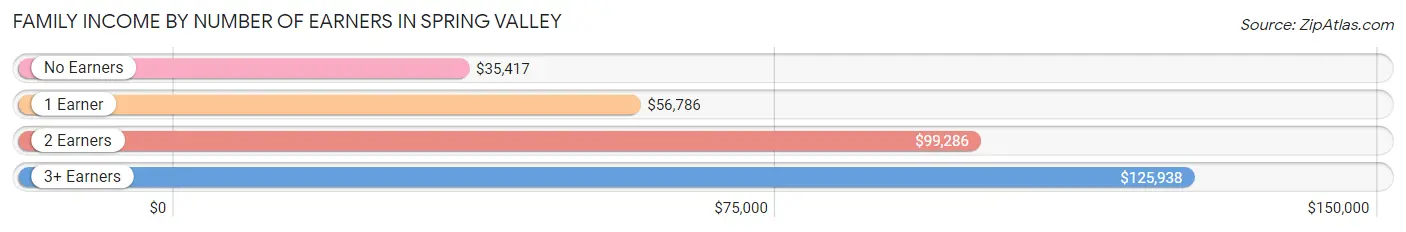
Family Income by Number of Earners in Spring Valley
The median family income in Spring Valley is $75,714, with families comprising 3+ earners (9) having the highest median family income of $125,938, while families with no earners (9) have the lowest median family income of $35,417, accounting for 6.8% and 6.8% of families, respectively.
| Number of Earners | # Families | Median Income |
| No Earners | 9 (6.8%) | $35,417 |
| 1 Earner | 44 (33.3%) | $56,786 |
| 2 Earners | 70 (53.0%) | $99,286 |
| 3+ Earners | 9 (6.8%) | $125,938 |
| Total | 132 (100.0%) | $75,714 |
Household Income in Spring Valley
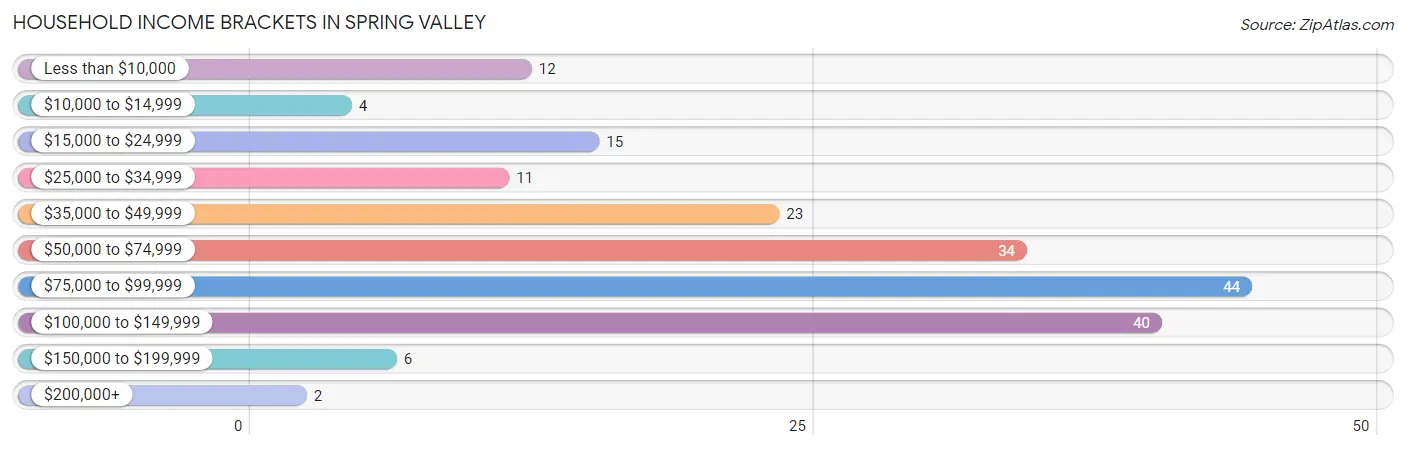
Household Income Brackets in Spring Valley
With 44 households falling in the category, the $75,000 to $99,999 income range is the most frequent in Spring Valley, accounting for 23.0% of all households. In contrast, only 2 households (1.1%) fall into the $200,000+ income bracket, making it the least populous group.
| Income Bracket | # Households | % Households |
| Less than $10,000 | 12 | 6.3% |
| $10,000 to $14,999 | 4 | 2.1% |
| $15,000 to $24,999 | 15 | 7.9% |
| $25,000 to $34,999 | 11 | 5.8% |
| $35,000 to $49,999 | 23 | 12.0% |
| $50,000 to $74,999 | 34 | 17.8% |
| $75,000 to $99,999 | 44 | 23.0% |
| $100,000 to $149,999 | 40 | 20.9% |
| $150,000 to $199,999 | 6 | 3.1% |
| $200,000+ | 2 | 1.0% |
Household Income by Householder Age in Spring Valley
The median household income in Spring Valley is $67,813, with the highest median household income of $90,000 found in the 45 to 64 years age bracket for the primary householder. A total of 74 households (38.7%) fall into this category.
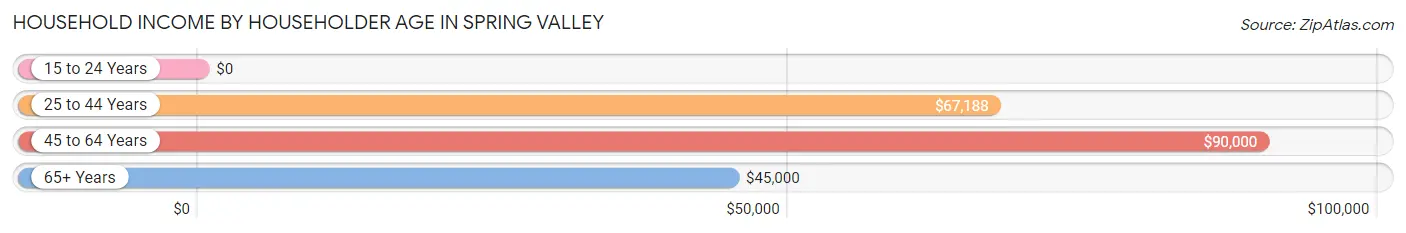
| Income Bracket | # Households | Median Income |
| 15 to 24 Years | 0 (0.0%) | $0 |
| 25 to 44 Years | 73 (38.2%) | $67,188 |
| 45 to 64 Years | 74 (38.7%) | $90,000 |
| 65+ Years | 44 (23.0%) | $45,000 |
| Total | 191 (100.0%) | $67,813 |
Poverty in Spring Valley
Income Below Poverty by Sex and Age in Spring Valley
With 9.3% poverty level for males and 6.0% for females among the residents of Spring Valley, 18 to 24 year old males and 6 to 11 year old females are the most vulnerable to poverty, with 2 males (50.0%) and 2 females (28.6%) in their respective age groups living below the poverty level.
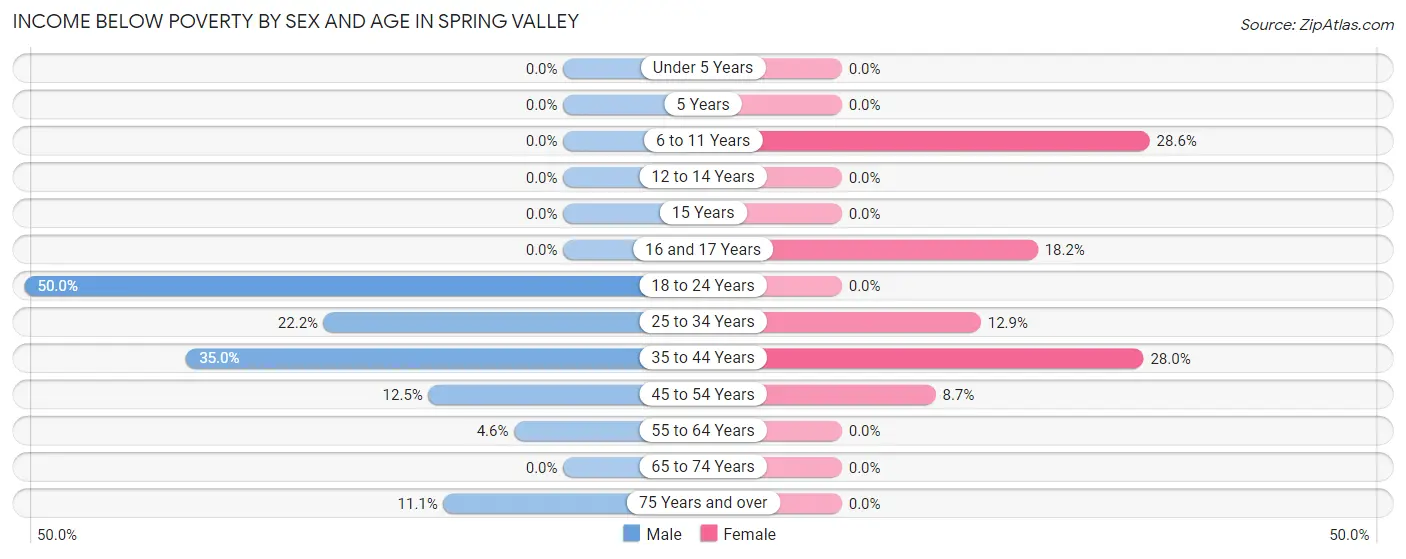
| Age Bracket | Male | Female |
| Under 5 Years | 0 (0.0%) | 0 (0.0%) |
| 5 Years | 0 (0.0%) | 0 (0.0%) |
| 6 to 11 Years | 0 (0.0%) | 2 (28.6%) |
| 12 to 14 Years | 0 (0.0%) | 0 (0.0%) |
| 15 Years | 0 (0.0%) | 0 (0.0%) |
| 16 and 17 Years | 0 (0.0%) | 2 (18.2%) |
| 18 to 24 Years | 2 (50.0%) | 0 (0.0%) |
| 25 to 34 Years | 10 (22.2%) | 4 (12.9%) |
| 35 to 44 Years | 7 (35.0%) | 7 (28.0%) |
| 45 to 54 Years | 4 (12.5%) | 4 (8.7%) |
| 55 to 64 Years | 2 (4.5%) | 0 (0.0%) |
| 65 to 74 Years | 0 (0.0%) | 0 (0.0%) |
| 75 Years and over | 2 (11.1%) | 0 (0.0%) |
| Total | 27 (9.3%) | 19 (6.0%) |
Income Above Poverty by Sex and Age in Spring Valley
According to the poverty statistics in Spring Valley, males aged under 5 years and females aged under 5 years are the age groups that are most secure financially, with 100.0% of males and 100.0% of females in these age groups living above the poverty line.
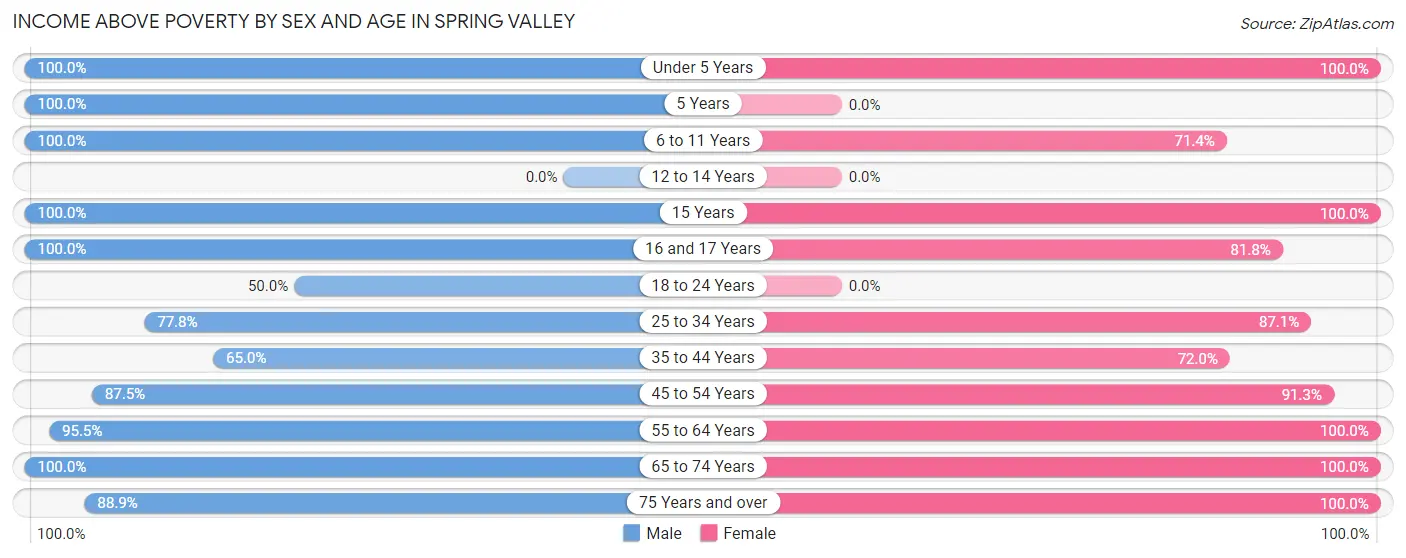
| Age Bracket | Male | Female |
| Under 5 Years | 23 (100.0%) | 12 (100.0%) |
| 5 Years | 4 (100.0%) | 0 (0.0%) |
| 6 to 11 Years | 15 (100.0%) | 5 (71.4%) |
| 12 to 14 Years | 0 (0.0%) | 0 (0.0%) |
| 15 Years | 65 (100.0%) | 7 (100.0%) |
| 16 and 17 Years | 1 (100.0%) | 9 (81.8%) |
| 18 to 24 Years | 2 (50.0%) | 0 (0.0%) |
| 25 to 34 Years | 35 (77.8%) | 27 (87.1%) |
| 35 to 44 Years | 13 (65.0%) | 18 (72.0%) |
| 45 to 54 Years | 28 (87.5%) | 42 (91.3%) |
| 55 to 64 Years | 42 (95.5%) | 30 (100.0%) |
| 65 to 74 Years | 18 (100.0%) | 21 (100.0%) |
| 75 Years and over | 16 (88.9%) | 124 (100.0%) |
| Total | 262 (90.7%) | 295 (94.0%) |
Income Below Poverty Among Married-Couple Families in Spring Valley
The poverty statistics for married-couple families in Spring Valley show that 2.0% or 2 of the total 100 families live below the poverty line. Families with 1 or 2 children have the highest poverty rate of 6.5%, comprising of 2 families. On the other hand, families with no children have the lowest poverty rate of 0.0%, which includes 0 families.
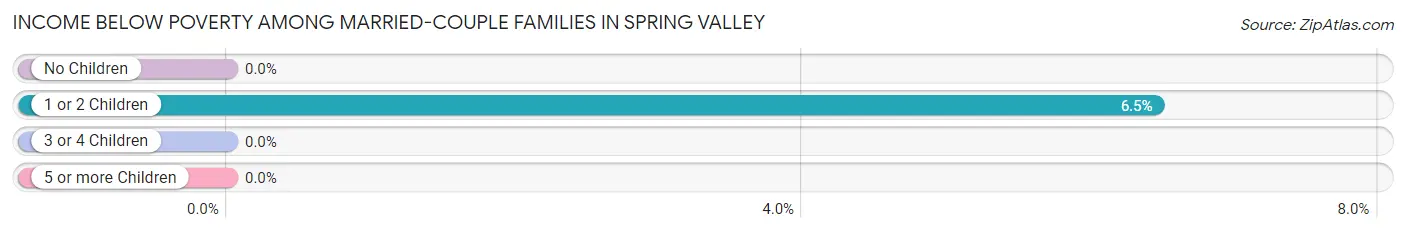
| Children | Above Poverty | Below Poverty |
| No Children | 64 (100.0%) | 0 (0.0%) |
| 1 or 2 Children | 29 (93.5%) | 2 (6.5%) |
| 3 or 4 Children | 5 (100.0%) | 0 (0.0%) |
| 5 or more Children | 0 (0.0%) | 0 (0.0%) |
| Total | 98 (98.0%) | 2 (2.0%) |
Income Below Poverty Among Single-Parent Households in Spring Valley
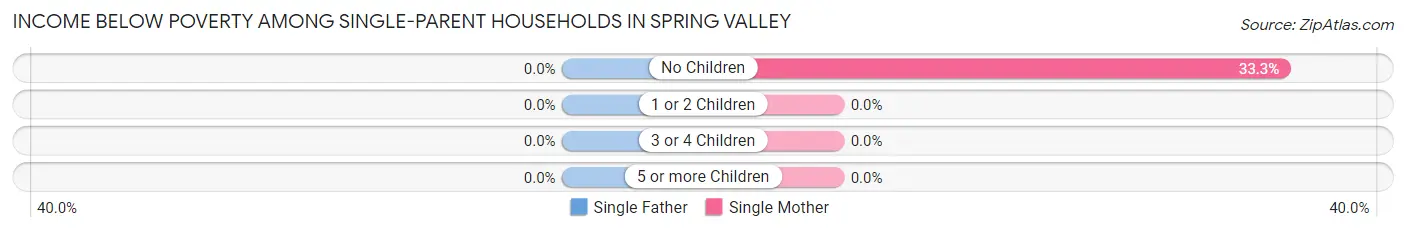
| Children | Single Father | Single Mother |
| No Children | 0 (0.0%) | 2 (33.3%) |
| 1 or 2 Children | 0 (0.0%) | 0 (0.0%) |
| 3 or 4 Children | 0 (0.0%) | 0 (0.0%) |
| 5 or more Children | 0 (0.0%) | 0 (0.0%) |
| Total | 0 (0.0%) | 2 (9.5%) |
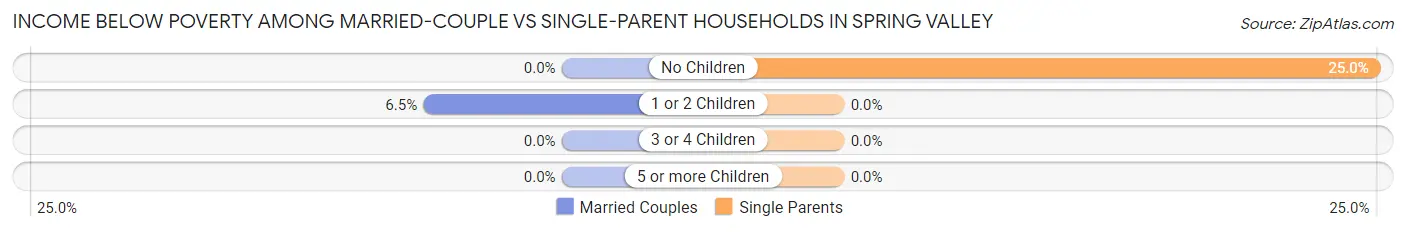
Income Below Poverty Among Married-Couple vs Single-Parent Households in Spring Valley
The poverty data for Spring Valley shows that 2 of the married-couple family households (2.0%) and 2 of the single-parent households (6.2%) are living below the poverty level. Within the married-couple family households, those with 1 or 2 children have the highest poverty rate, with 2 households (6.5%) falling below the poverty line. Among the single-parent households, those with no children have the highest poverty rate, with 2 household (25.0%) living below poverty.
| Children | Married-Couple Families | Single-Parent Households |
| No Children | 0 (0.0%) | 2 (25.0%) |
| 1 or 2 Children | 2 (6.5%) | 0 (0.0%) |
| 3 or 4 Children | 0 (0.0%) | 0 (0.0%) |
| 5 or more Children | 0 (0.0%) | 0 (0.0%) |
| Total | 2 (2.0%) | 2 (6.2%) |
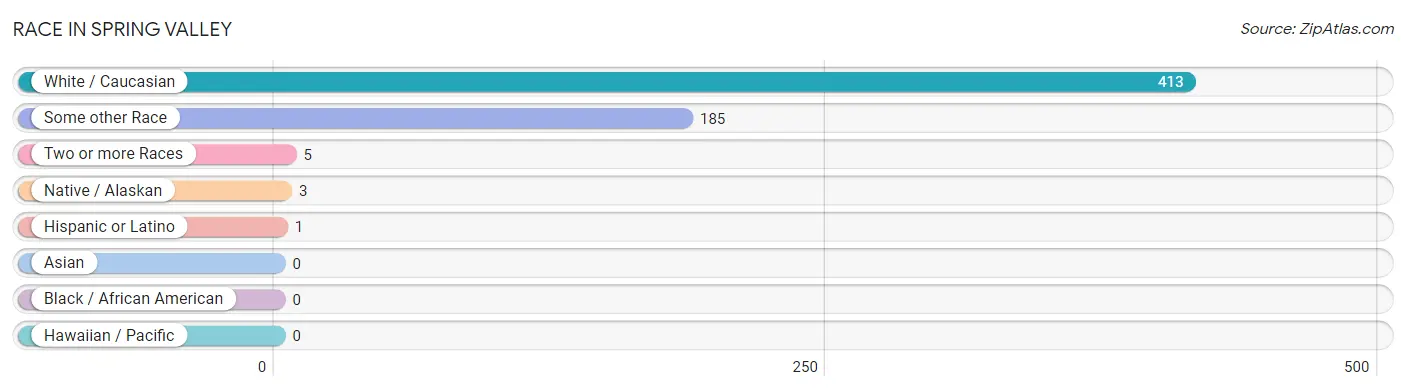
Race in Spring Valley
The most populous races in Spring Valley are White / Caucasian (413 | 68.1%), Some other Race (185 | 30.5%), and Two or more Races (5 | 0.8%).
| Race | # Population | % Population |
| Asian | 0 | 0.0% |
| Black / African American | 0 | 0.0% |
| Hawaiian / Pacific | 0 | 0.0% |
| Hispanic or Latino | 1 | 0.2% |
| Native / Alaskan | 3 | 0.5% |
| White / Caucasian | 413 | 68.1% |
| Two or more Races | 5 | 0.8% |
| Some other Race | 185 | 30.5% |
| Total | 606 | 100.0% |
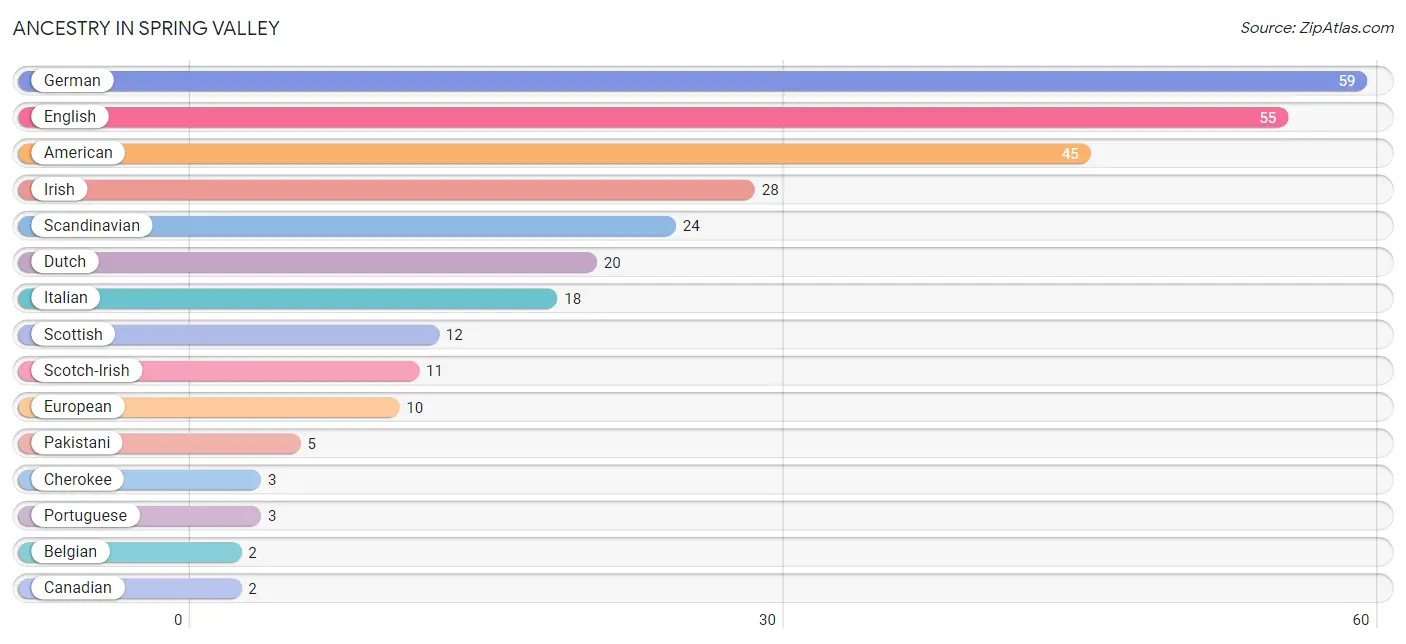
Ancestry in Spring Valley
The most populous ancestries reported in Spring Valley are German (59 | 9.7%), English (55 | 9.1%), American (45 | 7.4%), Irish (28 | 4.6%), and Scandinavian (24 | 4.0%), together accounting for 34.8% of all Spring Valley residents.
| Ancestry | # Population | % Population |
| American | 45 | 7.4% |
| Belgian | 2 | 0.3% |
| Canadian | 2 | 0.3% |
| Cherokee | 3 | 0.5% |
| Dutch | 20 | 3.3% |
| English | 55 | 9.1% |
| European | 10 | 1.7% |
| German | 59 | 9.7% |
| Irish | 28 | 4.6% |
| Italian | 18 | 3.0% |
| Norwegian | 2 | 0.3% |
| Pakistani | 5 | 0.8% |
| Portuguese | 3 | 0.5% |
| Puerto Rican | 1 | 0.2% |
| Scandinavian | 24 | 4.0% |
| Scotch-Irish | 11 | 1.8% |
| Scottish | 12 | 2.0% |
| Swedish | 1 | 0.2% | View All 18 Rows |
Immigrants in Spring Valley
The most numerous immigrant groups reported in Spring Valley came from , and Canada (2 | 0.3%), together accounting for 0.3% of all Spring Valley residents.

| Immigration Origin | # Population | % Population |
| Canada | 2 | 0.3% | View All 1 Rows |
Sex and Age in Spring Valley
Sex and Age in Spring Valley
The most populous age groups in Spring Valley are 15 to 19 Years (69 | 23.7%) for men and 80 to 84 Years (117 | 37.1%) for women.
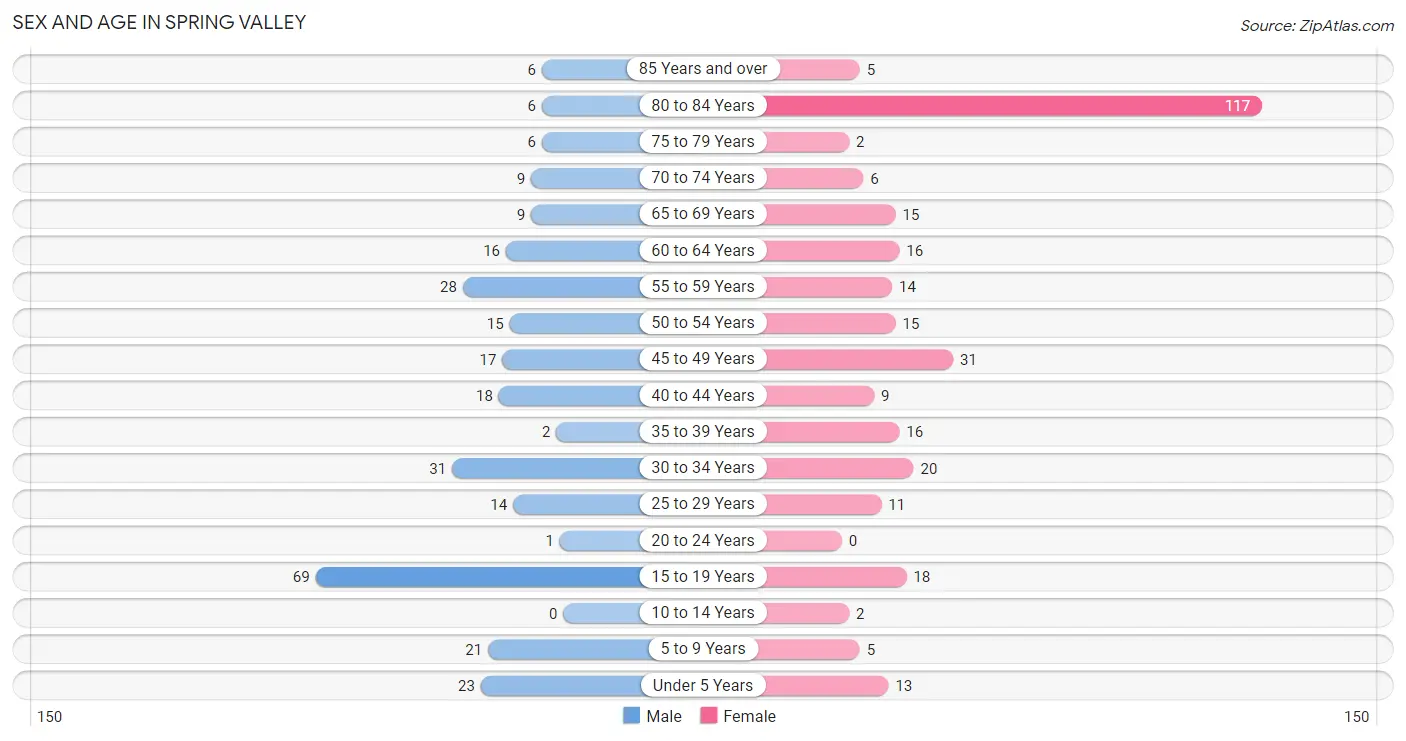
| Age Bracket | Male | Female |
| Under 5 Years | 23 (7.9%) | 13 (4.1%) |
| 5 to 9 Years | 21 (7.2%) | 5 (1.6%) |
| 10 to 14 Years | 0 (0.0%) | 2 (0.6%) |
| 15 to 19 Years | 69 (23.7%) | 18 (5.7%) |
| 20 to 24 Years | 1 (0.3%) | 0 (0.0%) |
| 25 to 29 Years | 14 (4.8%) | 11 (3.5%) |
| 30 to 34 Years | 31 (10.6%) | 20 (6.4%) |
| 35 to 39 Years | 2 (0.7%) | 16 (5.1%) |
| 40 to 44 Years | 18 (6.2%) | 9 (2.9%) |
| 45 to 49 Years | 17 (5.8%) | 31 (9.8%) |
| 50 to 54 Years | 15 (5.1%) | 15 (4.8%) |
| 55 to 59 Years | 28 (9.6%) | 14 (4.4%) |
| 60 to 64 Years | 16 (5.5%) | 16 (5.1%) |
| 65 to 69 Years | 9 (3.1%) | 15 (4.8%) |
| 70 to 74 Years | 9 (3.1%) | 6 (1.9%) |
| 75 to 79 Years | 6 (2.1%) | 2 (0.6%) |
| 80 to 84 Years | 6 (2.1%) | 117 (37.1%) |
| 85 Years and over | 6 (2.1%) | 5 (1.6%) |
| Total | 291 (100.0%) | 315 (100.0%) |
Families and Households in Spring Valley
Median Family Size in Spring Valley
The median family size in Spring Valley is 3.84 persons per family, with single female/mother families (21 | 15.9%) accounting for the largest median family size of 10.1 persons per family. On the other hand, single male/father families (11 | 8.3%) represent the smallest median family size with 2.09 persons per family.
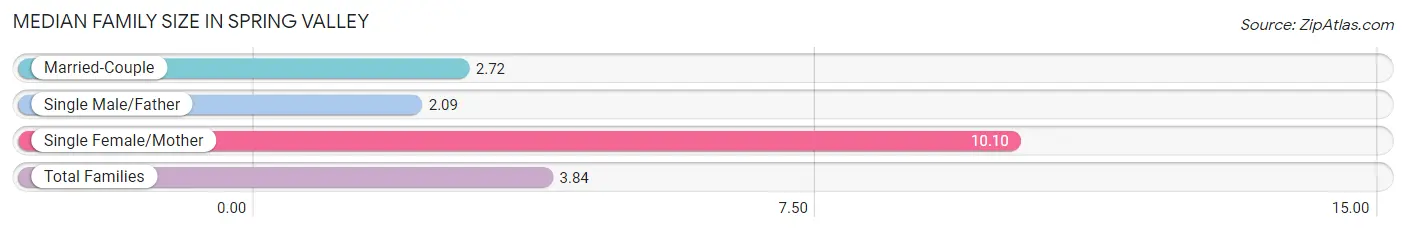
| Family Type | # Families | Family Size |
| Married-Couple | 100 (75.8%) | 2.72 |
| Single Male/Father | 11 (8.3%) | 2.09 |
| Single Female/Mother | 21 (15.9%) | 10.10 |
| Total Families | 132 (100.0%) | 3.84 |
Median Household Size in Spring Valley
The median household size in Spring Valley is 3.17 persons per household, with single female/mother households (21 | 11.0%) accounting for the largest median household size of 10.52 persons per household. non-family households (59 | 30.9%) represent the smallest median household size with 1.44 persons per household.
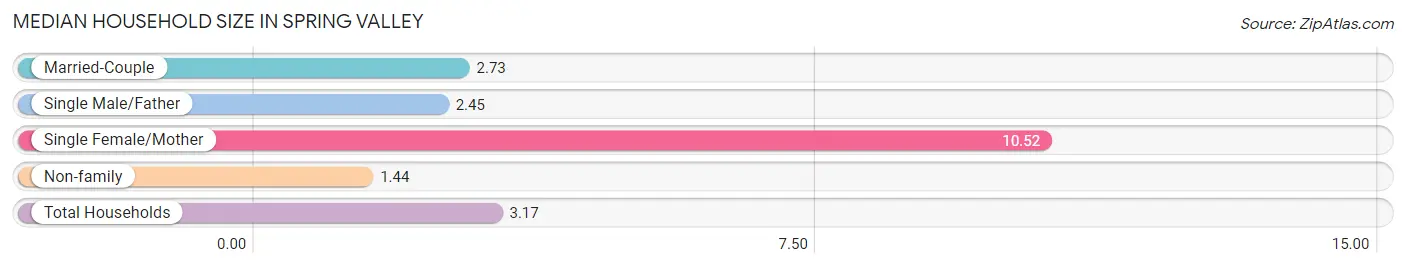
| Household Type | # Households | Household Size |
| Married-Couple | 100 (52.4%) | 2.73 |
| Single Male/Father | 11 (5.8%) | 2.45 |
| Single Female/Mother | 21 (11.0%) | 10.52 |
| Non-family | 59 (30.9%) | 1.44 |
| Total Households | 191 (100.0%) | 3.17 |
Household Size by Marriage Status in Spring Valley
Out of a total of 191 households in Spring Valley, 132 (69.1%) are family households, while 59 (30.9%) are nonfamily households. The most numerous type of family households are 2-person households, comprising 68, and the most common type of nonfamily households are 1-person households, comprising 43.
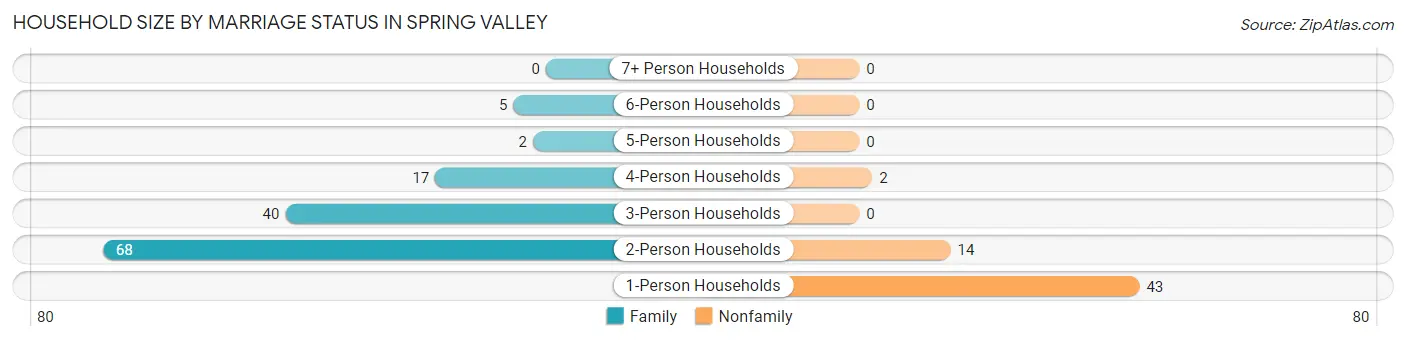
| Household Size | Family Households | Nonfamily Households |
| 1-Person Households | - | 43 (22.5%) |
| 2-Person Households | 68 (35.6%) | 14 (7.3%) |
| 3-Person Households | 40 (20.9%) | 0 (0.0%) |
| 4-Person Households | 17 (8.9%) | 2 (1.1%) |
| 5-Person Households | 2 (1.1%) | 0 (0.0%) |
| 6-Person Households | 5 (2.6%) | 0 (0.0%) |
| 7+ Person Households | 0 (0.0%) | 0 (0.0%) |
| Total | 132 (69.1%) | 59 (30.9%) |
Female Fertility in Spring Valley
Fertility by Age in Spring Valley
Average fertility rate in Spring Valley is 19.0 births per 1,000 women. Women in the age bracket of 20 to 34 years have the highest fertility rate with 65.0 births per 1,000 women. Women in the age bracket of 20 to 34 years acount for 100.0% of all women with births.
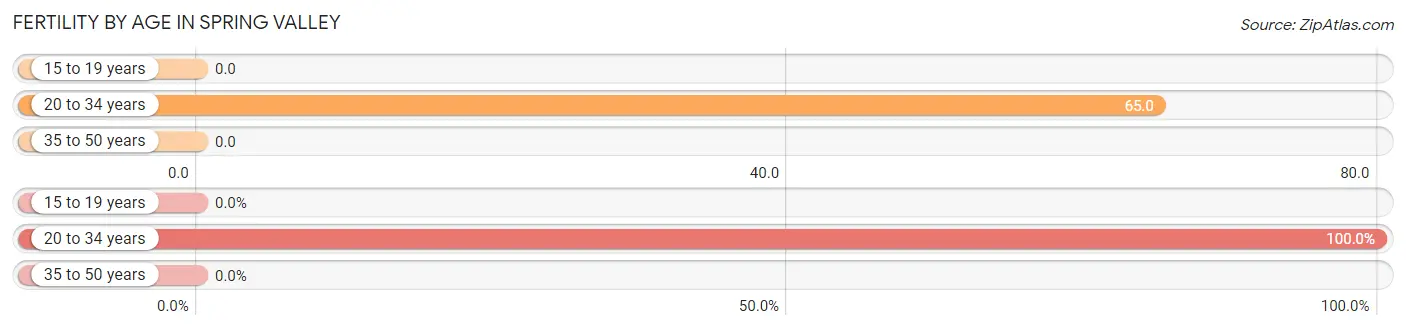
| Age Bracket | Women with Births | Births / 1,000 Women |
| 15 to 19 years | 0 (0.0%) | 0.0 |
| 20 to 34 years | 2 (100.0%) | 65.0 |
| 35 to 50 years | 0 (0.0%) | 0.0 |
| Total | 2 (100.0%) | 19.0 |
Fertility by Age by Marriage Status in Spring Valley
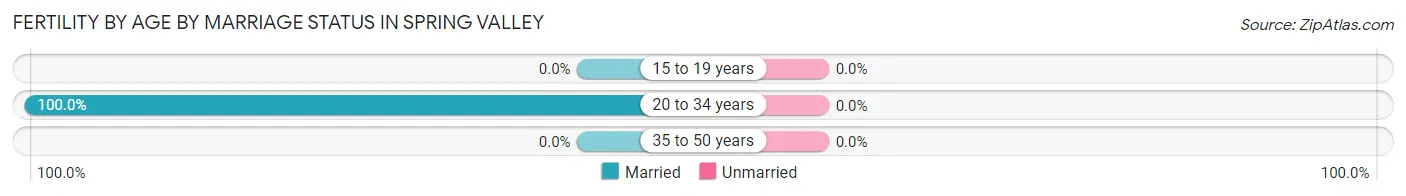
| Age Bracket | Married | Unmarried |
| 15 to 19 years | 0 (0.0%) | 0 (0.0%) |
| 20 to 34 years | 2 (100.0%) | 0 (0.0%) |
| 35 to 50 years | 0 (0.0%) | 0 (0.0%) |
| Total | 2 (100.0%) | 0 (0.0%) |
Fertility by Education in Spring Valley
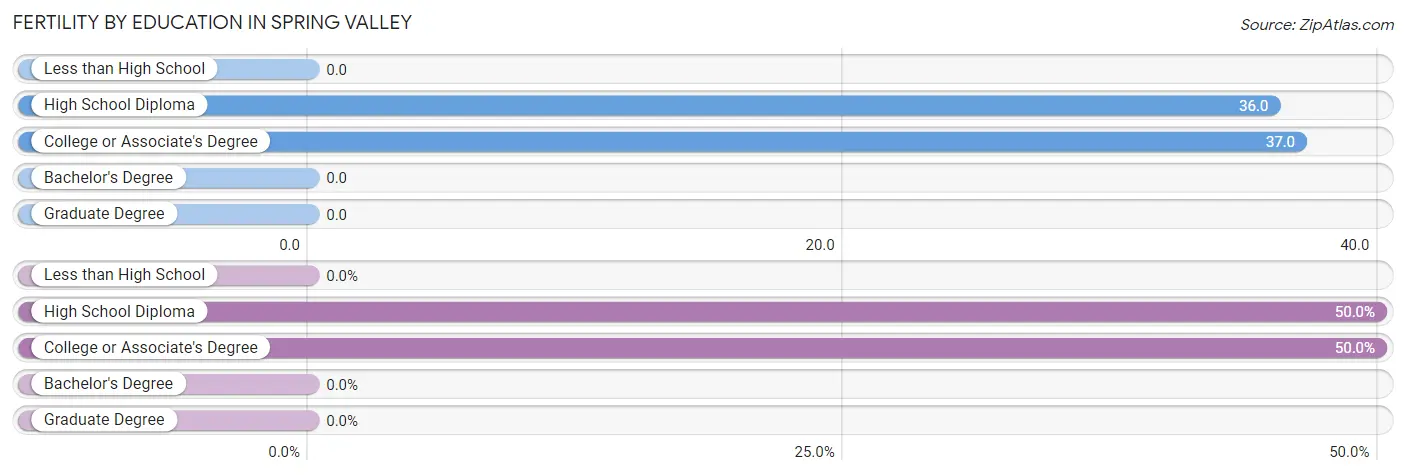
| Educational Attainment | Women with Births | Births / 1,000 Women |
| Less than High School | 0 (0.0%) | 0.0 |
| High School Diploma | 1 (50.0%) | 36.0 |
| College or Associate's Degree | 1 (50.0%) | 37.0 |
| Bachelor's Degree | 0 (0.0%) | 0.0 |
| Graduate Degree | 0 (0.0%) | 0.0 |
| Total | 2 (100.0%) | 19.0 |
Fertility by Education by Marriage Status in Spring Valley
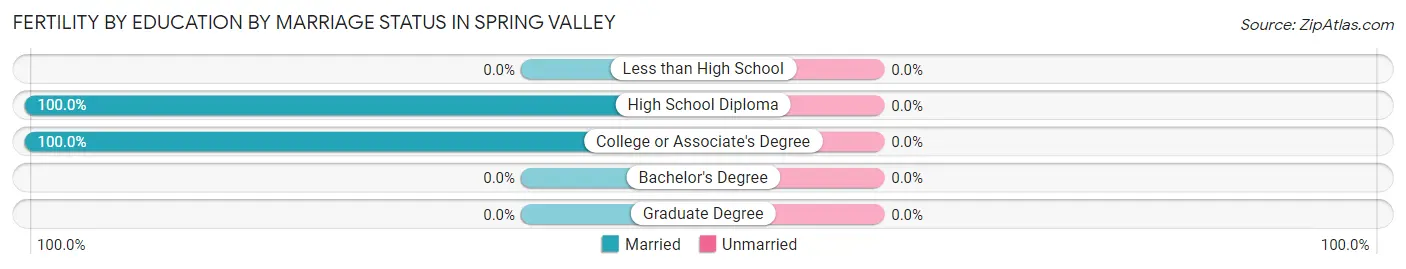
| Educational Attainment | Married | Unmarried |
| Less than High School | 0 (0.0%) | 0 (0.0%) |
| High School Diploma | 1 (100.0%) | 0 (0.0%) |
| College or Associate's Degree | 1 (100.0%) | 0 (0.0%) |
| Bachelor's Degree | 0 (0.0%) | 0 (0.0%) |
| Graduate Degree | 0 (0.0%) | 0 (0.0%) |
| Total | 2 (100.0%) | 0 (0.0%) |
Employment Characteristics in Spring Valley
Employment by Class of Employer in Spring Valley
Among the 243 employed individuals in Spring Valley, private company employees (162 | 66.7%), local government employees (38 | 15.6%), and not-for-profit organizations (11 | 4.5%) make up the most common classes of employment.
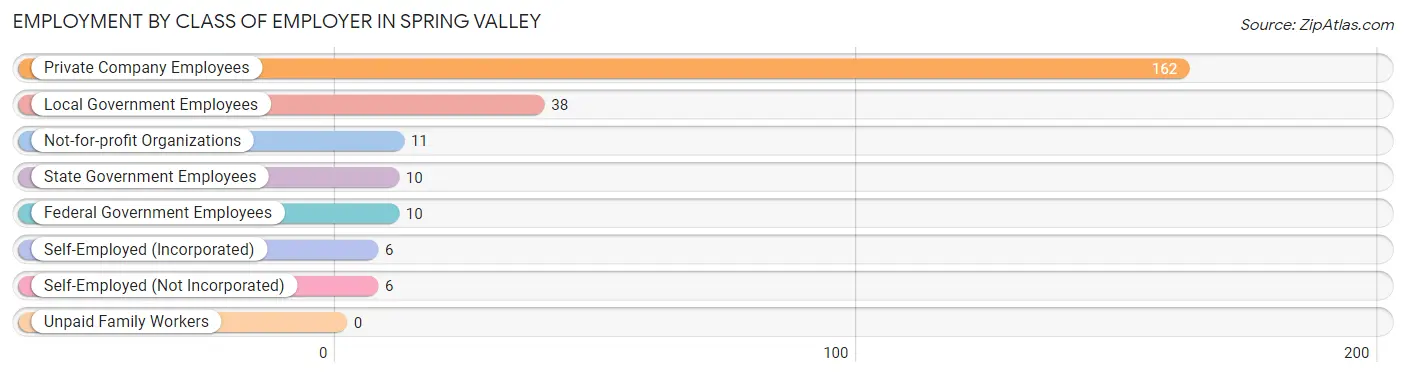
| Employer Class | # Employees | % Employees |
| Private Company Employees | 162 | 66.7% |
| Self-Employed (Incorporated) | 6 | 2.5% |
| Self-Employed (Not Incorporated) | 6 | 2.5% |
| Not-for-profit Organizations | 11 | 4.5% |
| Local Government Employees | 38 | 15.6% |
| State Government Employees | 10 | 4.1% |
| Federal Government Employees | 10 | 4.1% |
| Unpaid Family Workers | 0 | 0.0% |
| Total | 243 | 100.0% |
Employment Status by Age in Spring Valley
According to the labor force statistics for Spring Valley, out of the total population over 16 years of age (470), 54.5% or 256 individuals are in the labor force, with 2.0% or 5 of them unemployed. The age group with the highest labor force participation rate is 45 to 54 years, with 97.4% or 76 individuals in the labor force. Within the labor force, the 75 years and over age range has the highest percentage of unemployed individuals, with 33.3% or 2 of them being unemployed.
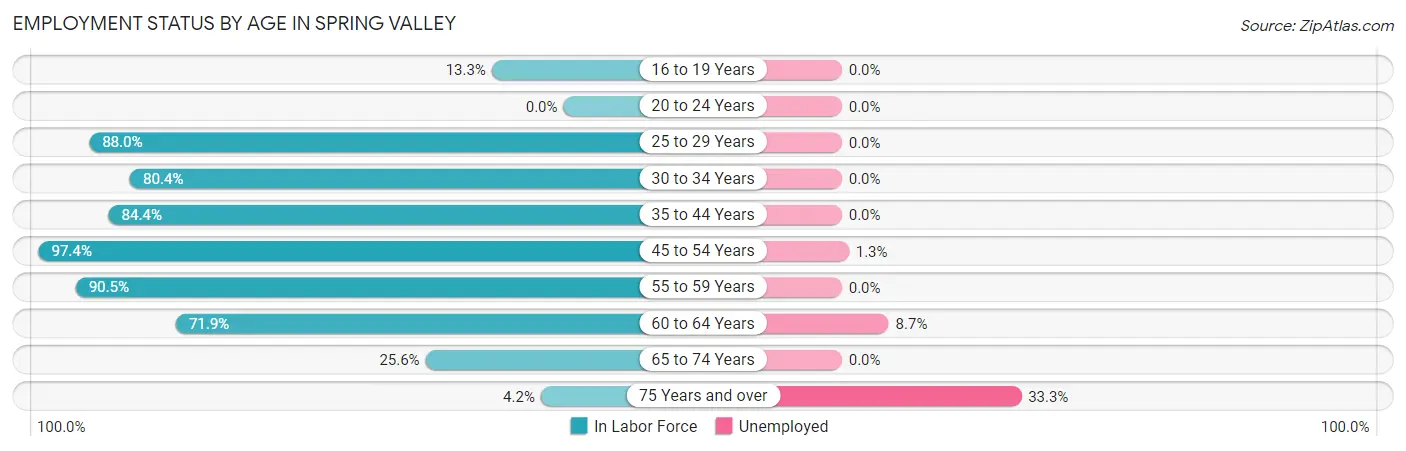
| Age Bracket | In Labor Force | Unemployed |
| 16 to 19 Years | 2 (13.3%) | 0 (0.0%) |
| 20 to 24 Years | 0 (0.0%) | 0 (0.0%) |
| 25 to 29 Years | 22 (88.0%) | 0 (0.0%) |
| 30 to 34 Years | 41 (80.4%) | 0 (0.0%) |
| 35 to 44 Years | 38 (84.4%) | 0 (0.0%) |
| 45 to 54 Years | 76 (97.4%) | 1 (1.3%) |
| 55 to 59 Years | 38 (90.5%) | 0 (0.0%) |
| 60 to 64 Years | 23 (71.9%) | 2 (8.7%) |
| 65 to 74 Years | 10 (25.6%) | 0 (0.0%) |
| 75 Years and over | 6 (4.2%) | 2 (33.3%) |
| Total | 256 (54.5%) | 5 (2.0%) |
Employment Status by Educational Attainment in Spring Valley
According to labor force statistics for Spring Valley, 87.2% of individuals (238) out of the total population between 25 and 64 years of age (273) are in the labor force, with 1.3% or 3 of them being unemployed. The group with the highest labor force participation rate are those with the educational attainment of bachelor's degree or higher, with 100.0% or 76 individuals in the labor force. Within the labor force, individuals with high school diploma education have the highest percentage of unemployment, with 3.3% or 3 of them being unemployed.
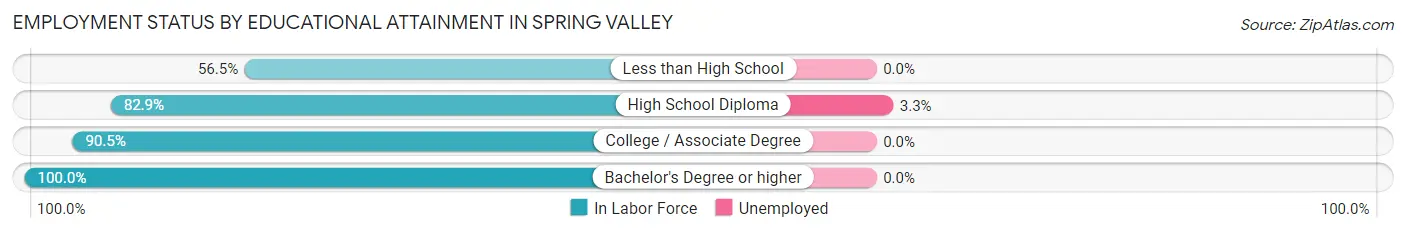
| Educational Attainment | In Labor Force | Unemployed |
| Less than High School | 13 (56.5%) | 0 (0.0%) |
| High School Diploma | 92 (82.9%) | 4 (3.3%) |
| College / Associate Degree | 57 (90.5%) | 0 (0.0%) |
| Bachelor's Degree or higher | 76 (100.0%) | 0 (0.0%) |
| Total | 238 (87.2%) | 4 (1.3%) |
Employment Occupations by Sex in Spring Valley
Management, Business, Science and Arts Occupations
The most common Management, Business, Science and Arts occupations in Spring Valley are Community & Social Service (39 | 15.5%), Education Instruction & Library (25 | 10.0%), Management (20 | 8.0%), Health Diagnosing & Treating (11 | 4.4%), and Business & Financial (10 | 4.0%).
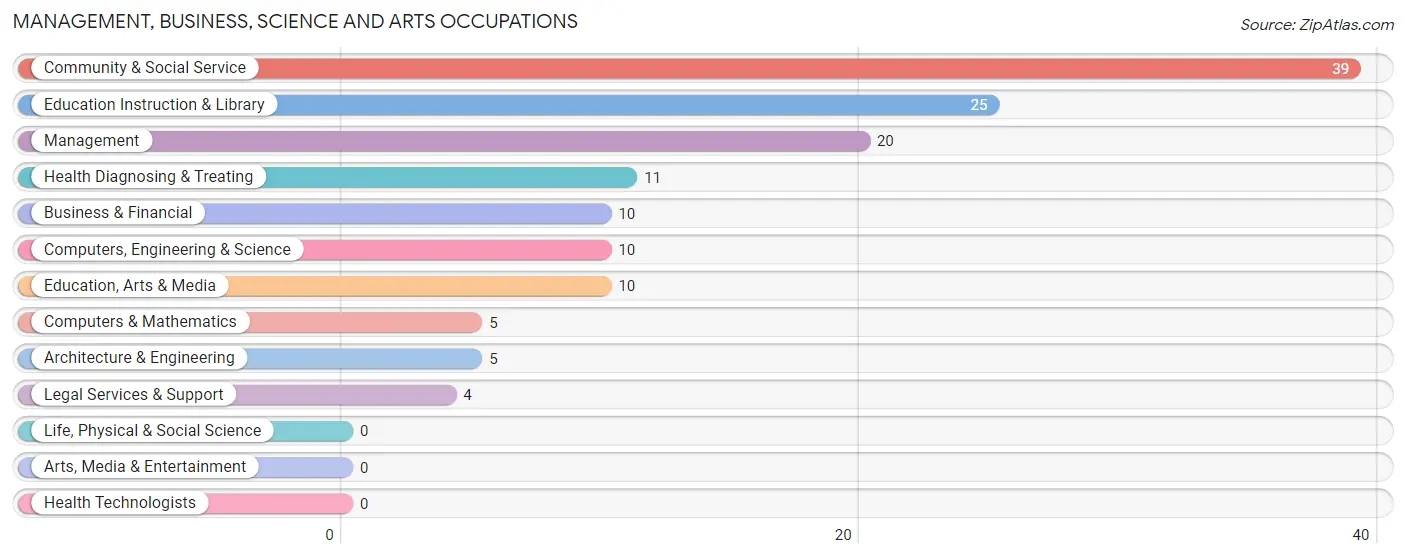
Management, Business, Science and Arts Occupations by Sex
Within the Management, Business, Science and Arts occupations in Spring Valley, the most male-oriented occupations are Computers, Engineering & Science (100.0%), Computers & Mathematics (100.0%), and Architecture & Engineering (100.0%), while the most female-oriented occupations are Business & Financial (100.0%), Education, Arts & Media (100.0%), and Education Instruction & Library (92.0%).
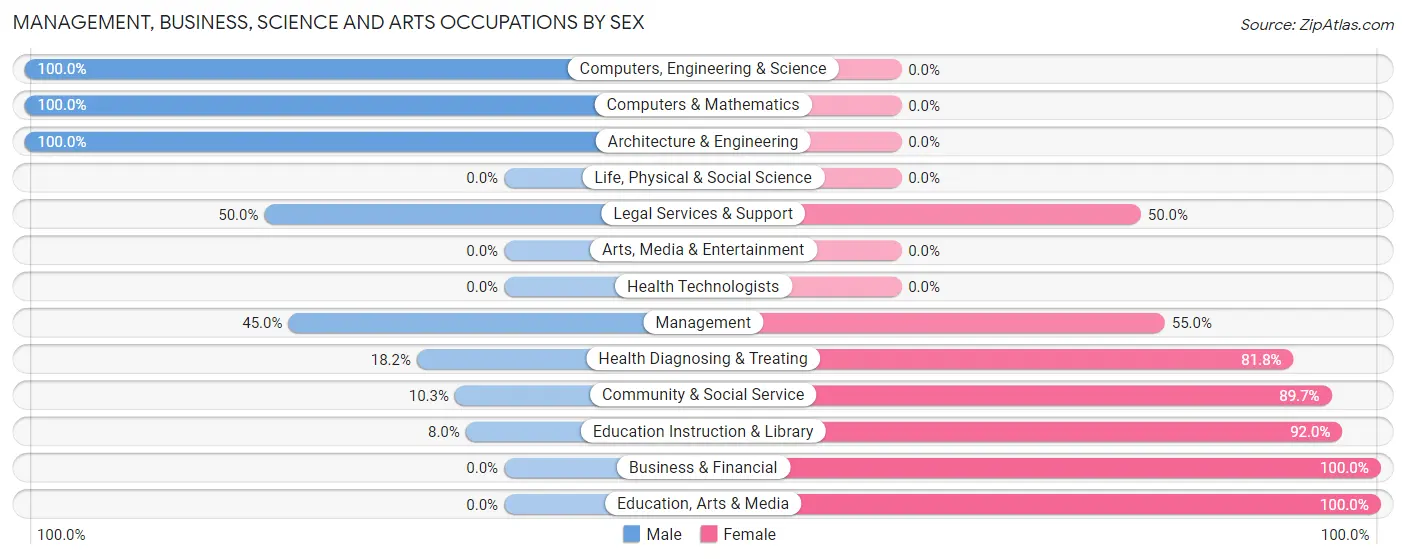
| Occupation | Male | Female |
| Management | 9 (45.0%) | 11 (55.0%) |
| Business & Financial | 0 (0.0%) | 10 (100.0%) |
| Computers, Engineering & Science | 10 (100.0%) | 0 (0.0%) |
| Computers & Mathematics | 5 (100.0%) | 0 (0.0%) |
| Architecture & Engineering | 5 (100.0%) | 0 (0.0%) |
| Life, Physical & Social Science | 0 (0.0%) | 0 (0.0%) |
| Community & Social Service | 4 (10.3%) | 35 (89.7%) |
| Education, Arts & Media | 0 (0.0%) | 10 (100.0%) |
| Legal Services & Support | 2 (50.0%) | 2 (50.0%) |
| Education Instruction & Library | 2 (8.0%) | 23 (92.0%) |
| Arts, Media & Entertainment | 0 (0.0%) | 0 (0.0%) |
| Health Diagnosing & Treating | 2 (18.2%) | 9 (81.8%) |
| Health Technologists | 0 (0.0%) | 0 (0.0%) |
| Total (Category) | 25 (27.8%) | 65 (72.2%) |
| Total (Overall) | 123 (49.0%) | 128 (51.0%) |
Services Occupations
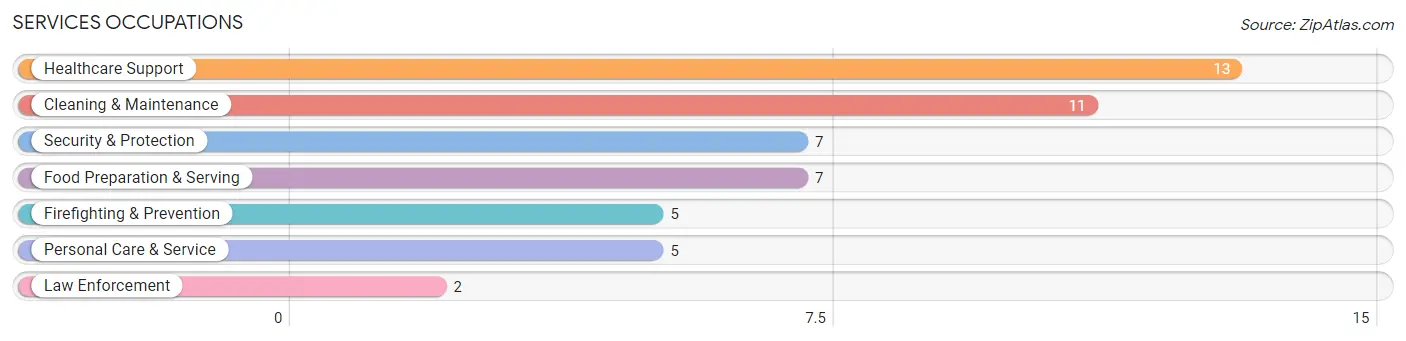
The most common Services occupations in Spring Valley are Healthcare Support (13 | 5.2%), Cleaning & Maintenance (11 | 4.4%), Security & Protection (7 | 2.8%), Food Preparation & Serving (7 | 2.8%), and Firefighting & Prevention (5 | 2.0%).
Services Occupations by Sex
Within the Services occupations in Spring Valley, the most male-oriented occupations are Security & Protection (100.0%), Firefighting & Prevention (100.0%), and Law Enforcement (100.0%), while the most female-oriented occupations are Healthcare Support (100.0%), Personal Care & Service (100.0%), and Food Preparation & Serving (85.7%).
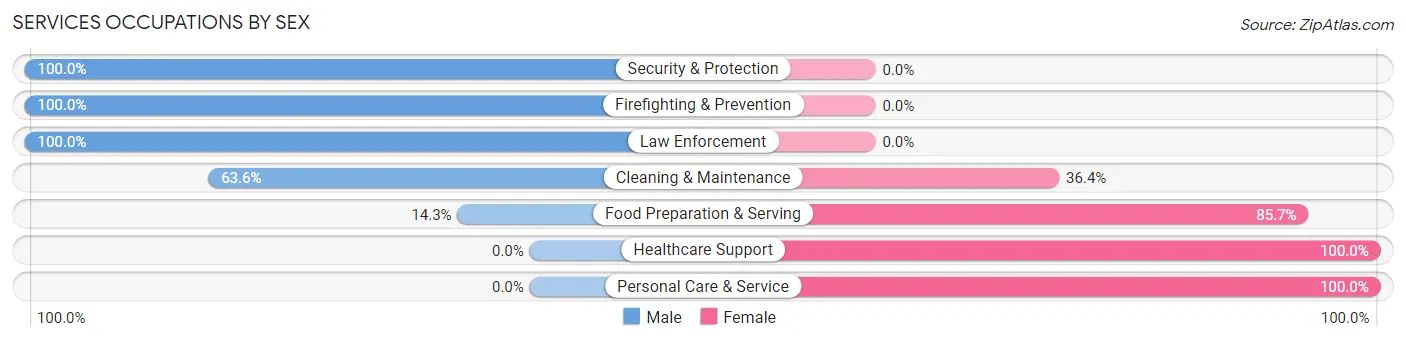
| Occupation | Male | Female |
| Healthcare Support | 0 (0.0%) | 13 (100.0%) |
| Security & Protection | 7 (100.0%) | 0 (0.0%) |
| Firefighting & Prevention | 5 (100.0%) | 0 (0.0%) |
| Law Enforcement | 2 (100.0%) | 0 (0.0%) |
| Food Preparation & Serving | 1 (14.3%) | 6 (85.7%) |
| Cleaning & Maintenance | 7 (63.6%) | 4 (36.4%) |
| Personal Care & Service | 0 (0.0%) | 5 (100.0%) |
| Total (Category) | 15 (34.9%) | 28 (65.1%) |
| Total (Overall) | 123 (49.0%) | 128 (51.0%) |
Sales and Office Occupations
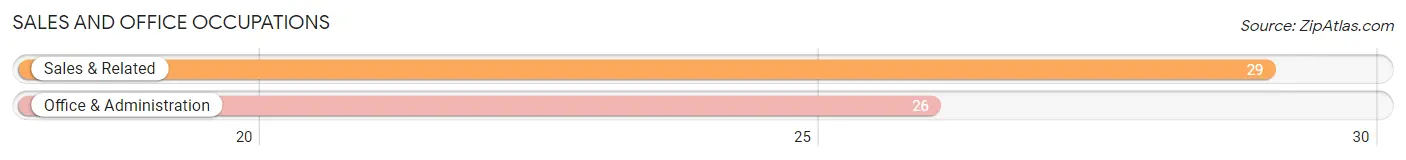
The most common Sales and Office occupations in Spring Valley are Sales & Related (29 | 11.6%), and Office & Administration (26 | 10.4%).
Sales and Office Occupations by Sex
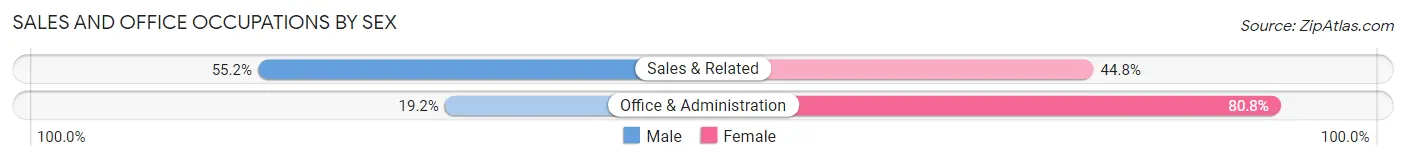
| Occupation | Male | Female |
| Sales & Related | 16 (55.2%) | 13 (44.8%) |
| Office & Administration | 5 (19.2%) | 21 (80.8%) |
| Total (Category) | 21 (38.2%) | 34 (61.8%) |
| Total (Overall) | 123 (49.0%) | 128 (51.0%) |
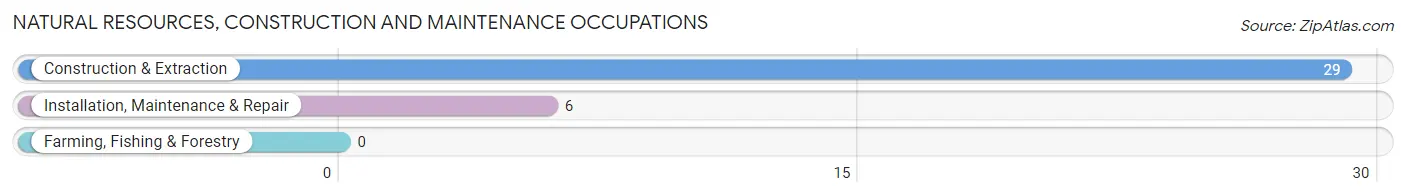
Natural Resources, Construction and Maintenance Occupations
The most common Natural Resources, Construction and Maintenance occupations in Spring Valley are Construction & Extraction (29 | 11.6%), and Installation, Maintenance & Repair (6 | 2.4%).
Natural Resources, Construction and Maintenance Occupations by Sex
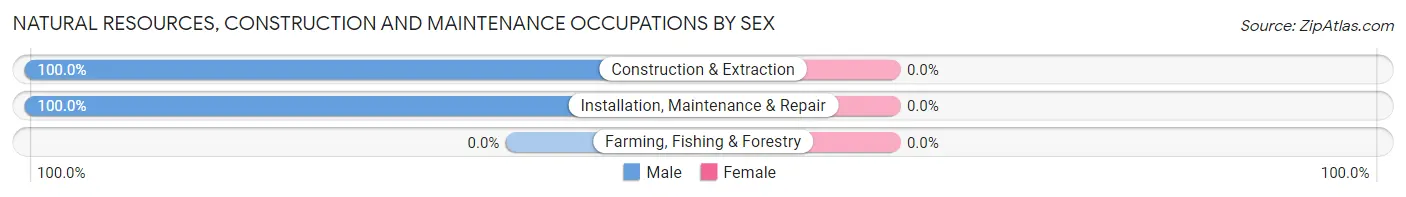
| Occupation | Male | Female |
| Farming, Fishing & Forestry | 0 (0.0%) | 0 (0.0%) |
| Construction & Extraction | 29 (100.0%) | 0 (0.0%) |
| Installation, Maintenance & Repair | 6 (100.0%) | 0 (0.0%) |
| Total (Category) | 35 (100.0%) | 0 (0.0%) |
| Total (Overall) | 123 (49.0%) | 128 (51.0%) |
Production, Transportation and Moving Occupations
The most common Production, Transportation and Moving occupations in Spring Valley are Production (21 | 8.4%), Transportation (4 | 1.6%), and Material Moving (3 | 1.2%).
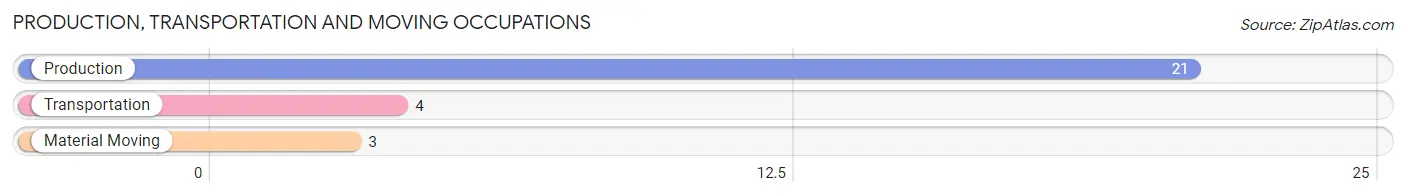
Production, Transportation and Moving Occupations by Sex
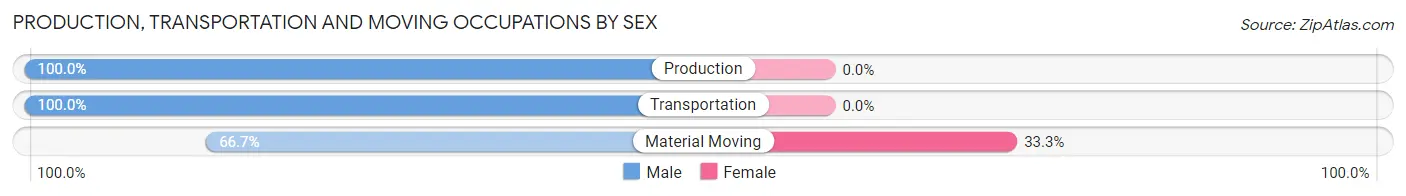
| Occupation | Male | Female |
| Production | 21 (100.0%) | 0 (0.0%) |
| Transportation | 4 (100.0%) | 0 (0.0%) |
| Material Moving | 2 (66.7%) | 1 (33.3%) |
| Total (Category) | 27 (96.4%) | 1 (3.6%) |
| Total (Overall) | 123 (49.0%) | 128 (51.0%) |
Employment Industries by Sex in Spring Valley
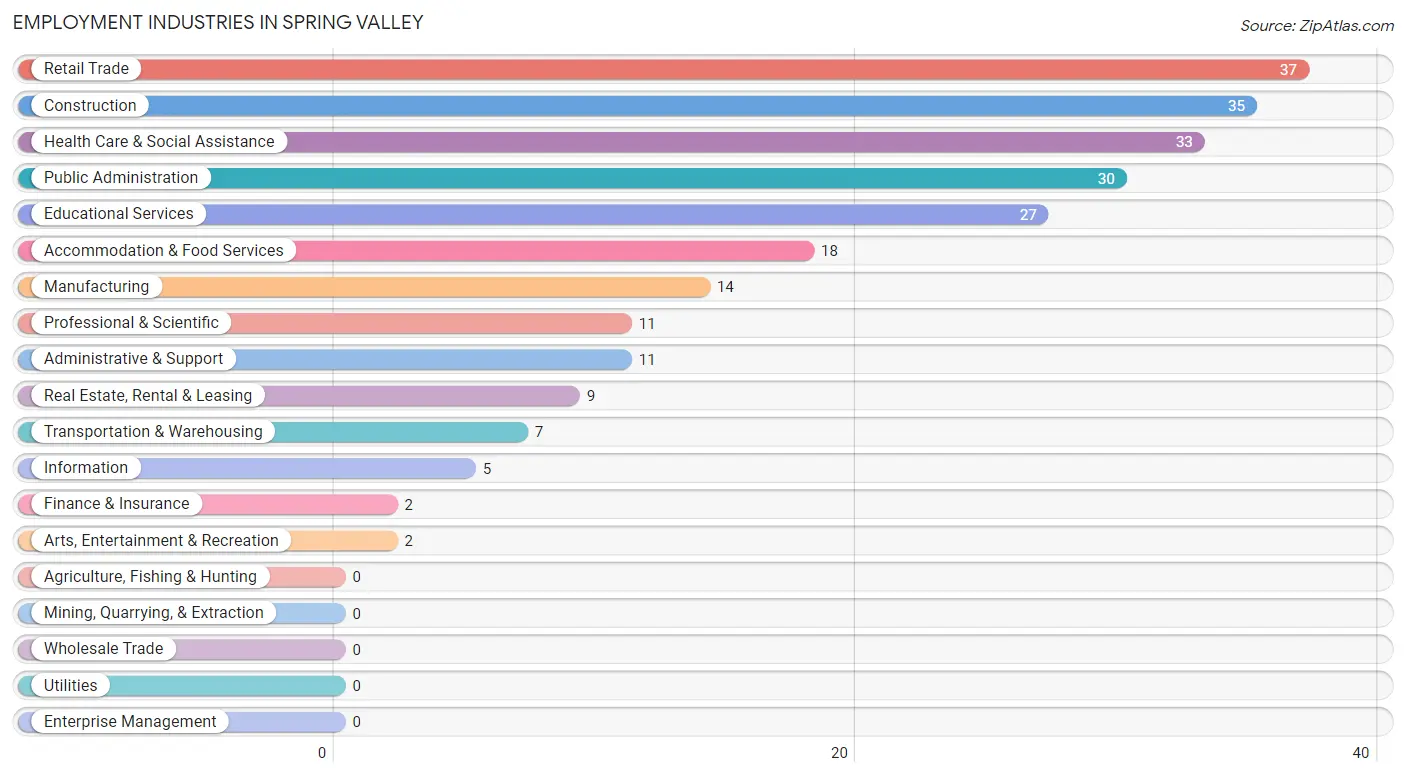
Employment Industries in Spring Valley
The major employment industries in Spring Valley include Retail Trade (37 | 14.7%), Construction (35 | 13.9%), Health Care & Social Assistance (33 | 13.2%), Public Administration (30 | 11.9%), and Educational Services (27 | 10.8%).
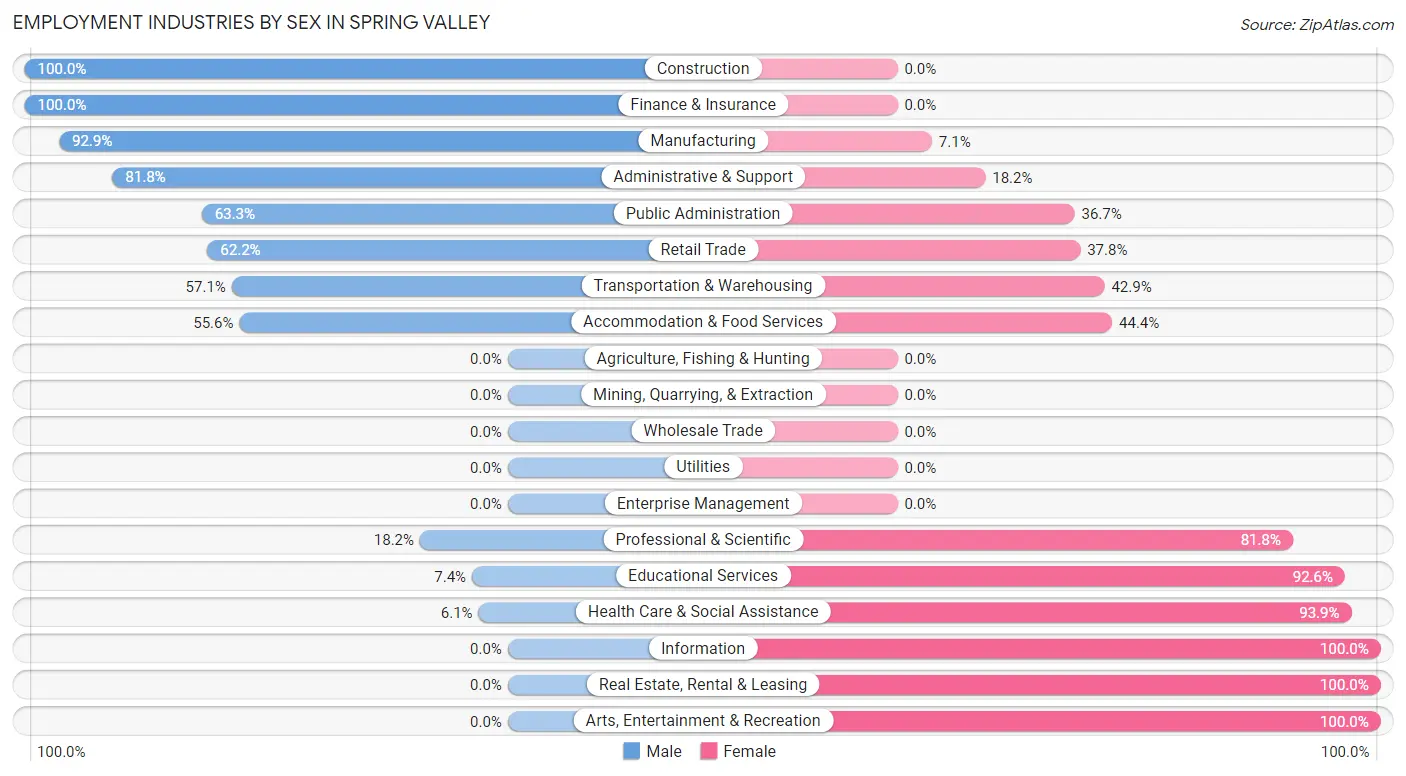
Employment Industries by Sex in Spring Valley
The Spring Valley industries that see more men than women are Construction (100.0%), Finance & Insurance (100.0%), and Manufacturing (92.9%), whereas the industries that tend to have a higher number of women are Information (100.0%), Real Estate, Rental & Leasing (100.0%), and Arts, Entertainment & Recreation (100.0%).
| Industry | Male | Female |
| Agriculture, Fishing & Hunting | 0 (0.0%) | 0 (0.0%) |
| Mining, Quarrying, & Extraction | 0 (0.0%) | 0 (0.0%) |
| Construction | 35 (100.0%) | 0 (0.0%) |
| Manufacturing | 13 (92.9%) | 1 (7.1%) |
| Wholesale Trade | 0 (0.0%) | 0 (0.0%) |
| Retail Trade | 23 (62.2%) | 14 (37.8%) |
| Transportation & Warehousing | 4 (57.1%) | 3 (42.9%) |
| Utilities | 0 (0.0%) | 0 (0.0%) |
| Information | 0 (0.0%) | 5 (100.0%) |
| Finance & Insurance | 2 (100.0%) | 0 (0.0%) |
| Real Estate, Rental & Leasing | 0 (0.0%) | 9 (100.0%) |
| Professional & Scientific | 2 (18.2%) | 9 (81.8%) |
| Enterprise Management | 0 (0.0%) | 0 (0.0%) |
| Administrative & Support | 9 (81.8%) | 2 (18.2%) |
| Educational Services | 2 (7.4%) | 25 (92.6%) |
| Health Care & Social Assistance | 2 (6.1%) | 31 (93.9%) |
| Arts, Entertainment & Recreation | 0 (0.0%) | 2 (100.0%) |
| Accommodation & Food Services | 10 (55.6%) | 8 (44.4%) |
| Public Administration | 19 (63.3%) | 11 (36.7%) |
| Total | 123 (49.0%) | 128 (51.0%) |
Education in Spring Valley
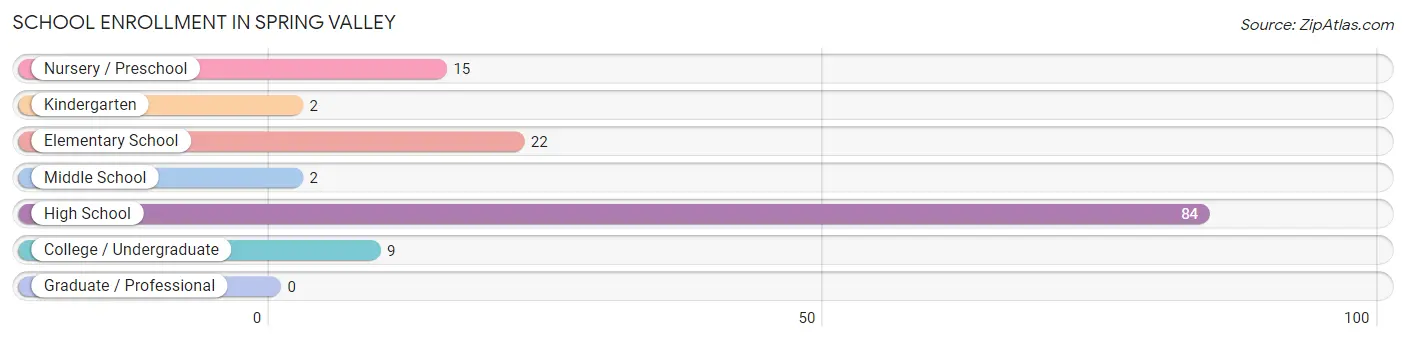
School Enrollment in Spring Valley
The most common levels of schooling among the 134 students in Spring Valley are high school (84 | 62.7%), elementary school (22 | 16.4%), and nursery / preschool (15 | 11.2%).
| School Level | # Students | % Students |
| Nursery / Preschool | 15 | 11.2% |
| Kindergarten | 2 | 1.5% |
| Elementary School | 22 | 16.4% |
| Middle School | 2 | 1.5% |
| High School | 84 | 62.7% |
| College / Undergraduate | 9 | 6.7% |
| Graduate / Professional | 0 | 0.0% |
| Total | 134 | 100.0% |
School Enrollment by Age by Funding Source in Spring Valley
Out of a total of 134 students who are enrolled in schools in Spring Valley, 76 (56.7%) attend a private institution, while the remaining 58 (43.3%) are enrolled in public schools. The age group of 15 to 17 year olds has the highest likelihood of being enrolled in private schools, with 65 (77.4% in the age bracket) enrolled. Conversely, the age group of 10 to 14 year olds has the lowest likelihood of being enrolled in a private school, with 2 (100.0% in the age bracket) attending a public institution.
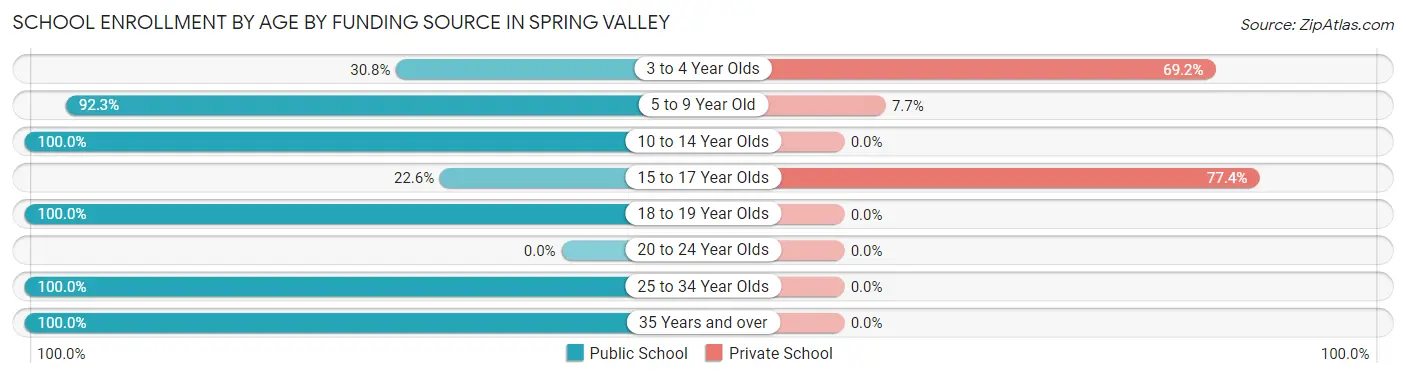
| Age Bracket | Public School | Private School |
| 3 to 4 Year Olds | 4 (30.8%) | 9 (69.2%) |
| 5 to 9 Year Old | 24 (92.3%) | 2 (7.7%) |
| 10 to 14 Year Olds | 2 (100.0%) | 0 (0.0%) |
| 15 to 17 Year Olds | 19 (22.6%) | 65 (77.4%) |
| 18 to 19 Year Olds | 1 (100.0%) | 0 (0.0%) |
| 20 to 24 Year Olds | 0 (0.0%) | 0 (0.0%) |
| 25 to 34 Year Olds | 2 (100.0%) | 0 (0.0%) |
| 35 Years and over | 6 (100.0%) | 0 (0.0%) |
| Total | 58 (43.3%) | 76 (56.7%) |
Educational Attainment by Field of Study in Spring Valley
Physical & health sciences (15 | 15.6%), bio, nature & agricultural (13 | 13.5%), engineering (10 | 10.4%), visual & performing arts (10 | 10.4%), and arts & humanities (9 | 9.4%) are the most common fields of study among 96 individuals in Spring Valley who have obtained a bachelor's degree or higher.
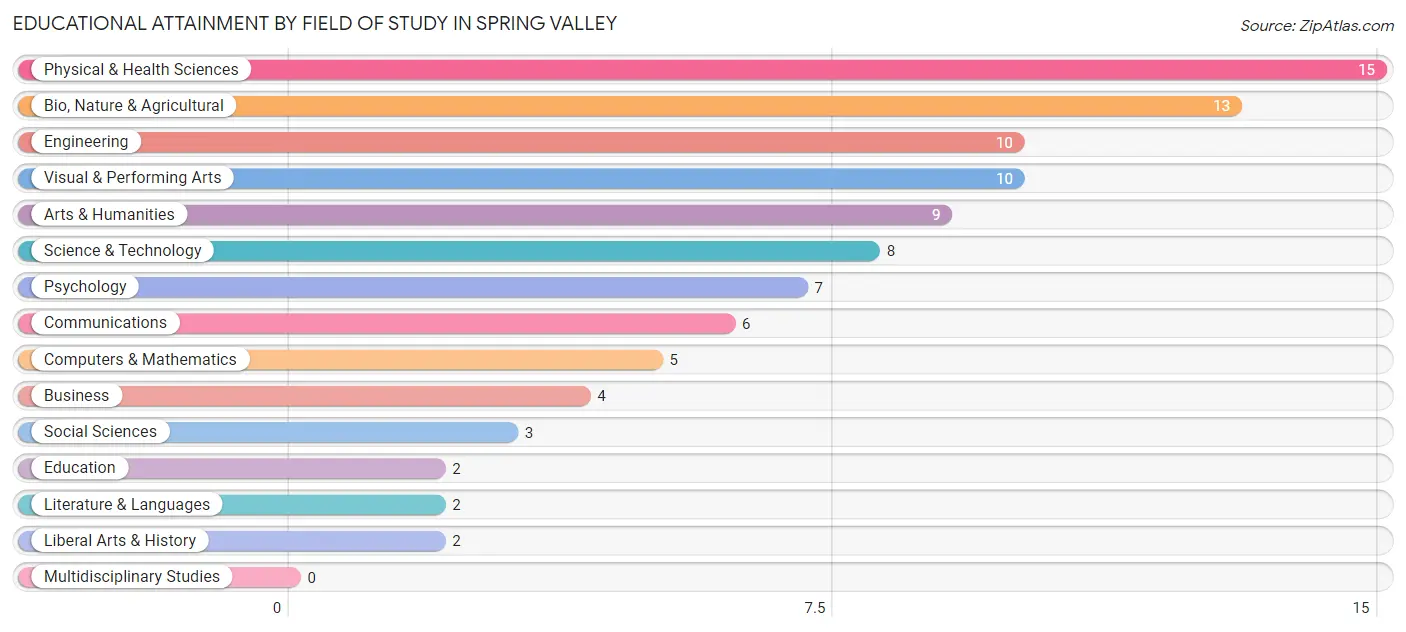
| Field of Study | # Graduates | % Graduates |
| Computers & Mathematics | 5 | 5.2% |
| Bio, Nature & Agricultural | 13 | 13.5% |
| Physical & Health Sciences | 15 | 15.6% |
| Psychology | 7 | 7.3% |
| Social Sciences | 3 | 3.1% |
| Engineering | 10 | 10.4% |
| Multidisciplinary Studies | 0 | 0.0% |
| Science & Technology | 8 | 8.3% |
| Business | 4 | 4.2% |
| Education | 2 | 2.1% |
| Literature & Languages | 2 | 2.1% |
| Liberal Arts & History | 2 | 2.1% |
| Visual & Performing Arts | 10 | 10.4% |
| Communications | 6 | 6.2% |
| Arts & Humanities | 9 | 9.4% |
| Total | 96 | 100.0% |
Transportation & Commute in Spring Valley
Vehicle Availability by Sex in Spring Valley
The most prevalent vehicle ownership categories in Spring Valley are males with 2 vehicles (53, accounting for 45.7%) and females with 2 vehicles (72, making up 41.7%).
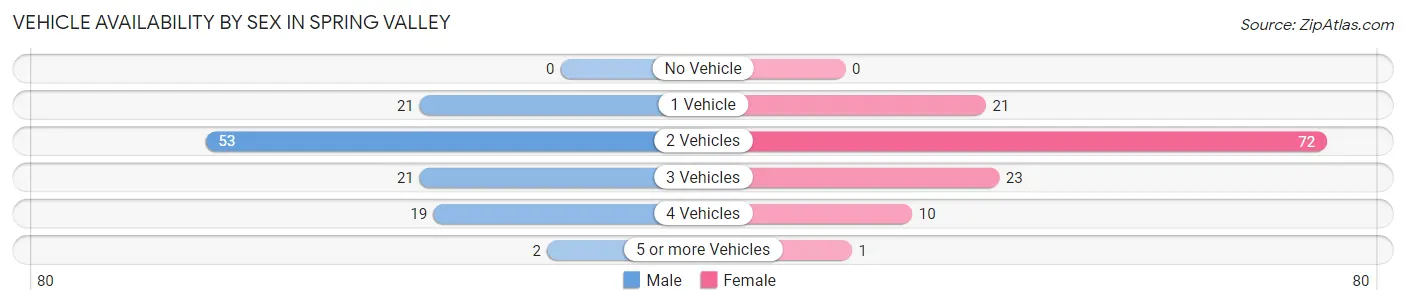
| Vehicles Available | Male | Female |
| No Vehicle | 0 (0.0%) | 0 (0.0%) |
| 1 Vehicle | 21 (18.1%) | 21 (16.5%) |
| 2 Vehicles | 53 (45.7%) | 72 (56.7%) |
| 3 Vehicles | 21 (18.1%) | 23 (18.1%) |
| 4 Vehicles | 19 (16.4%) | 10 (7.9%) |
| 5 or more Vehicles | 2 (1.7%) | 1 (0.8%) |
| Total | 116 (100.0%) | 127 (100.0%) |
Commute Time in Spring Valley
The most frequently occuring commute durations in Spring Valley are 15 to 19 minutes (43 commuters, 20.3%), 35 to 39 minutes (38 commuters, 17.9%), and 25 to 29 minutes (24 commuters, 11.3%).
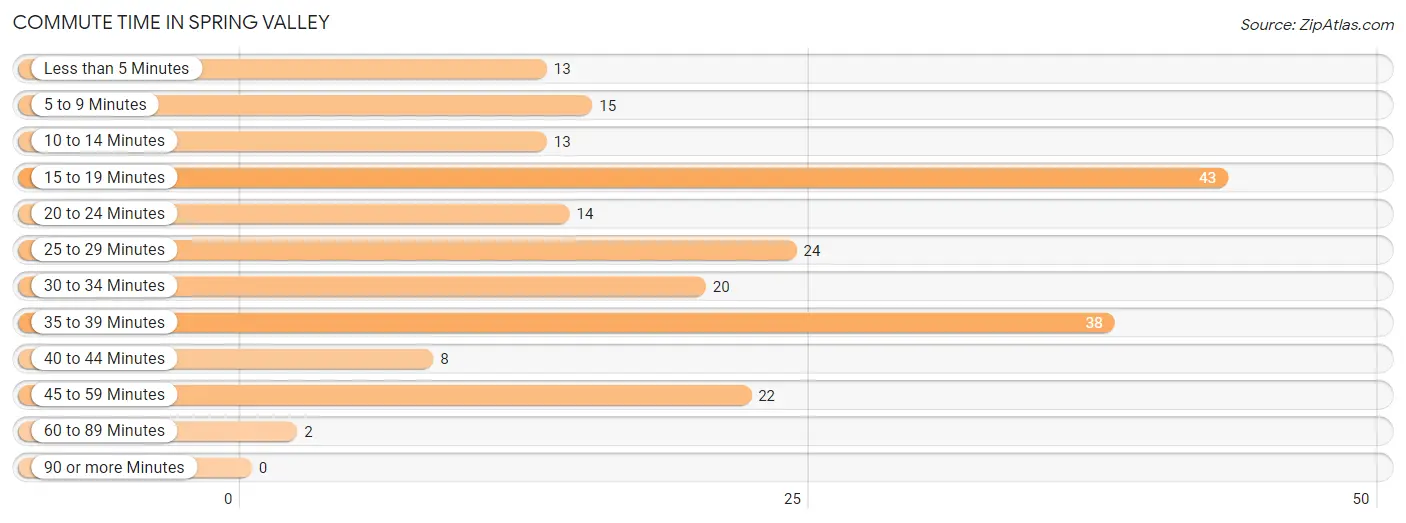
| Commute Time | # Commuters | % Commuters |
| Less than 5 Minutes | 13 | 6.1% |
| 5 to 9 Minutes | 15 | 7.1% |
| 10 to 14 Minutes | 13 | 6.1% |
| 15 to 19 Minutes | 43 | 20.3% |
| 20 to 24 Minutes | 14 | 6.6% |
| 25 to 29 Minutes | 24 | 11.3% |
| 30 to 34 Minutes | 20 | 9.4% |
| 35 to 39 Minutes | 38 | 17.9% |
| 40 to 44 Minutes | 8 | 3.8% |
| 45 to 59 Minutes | 22 | 10.4% |
| 60 to 89 Minutes | 2 | 0.9% |
| 90 or more Minutes | 0 | 0.0% |
Commute Time by Sex in Spring Valley
The most common commute times in Spring Valley are 15 to 19 minutes (21 commuters, 19.3%) for males and 35 to 39 minutes (23 commuters, 22.3%) for females.
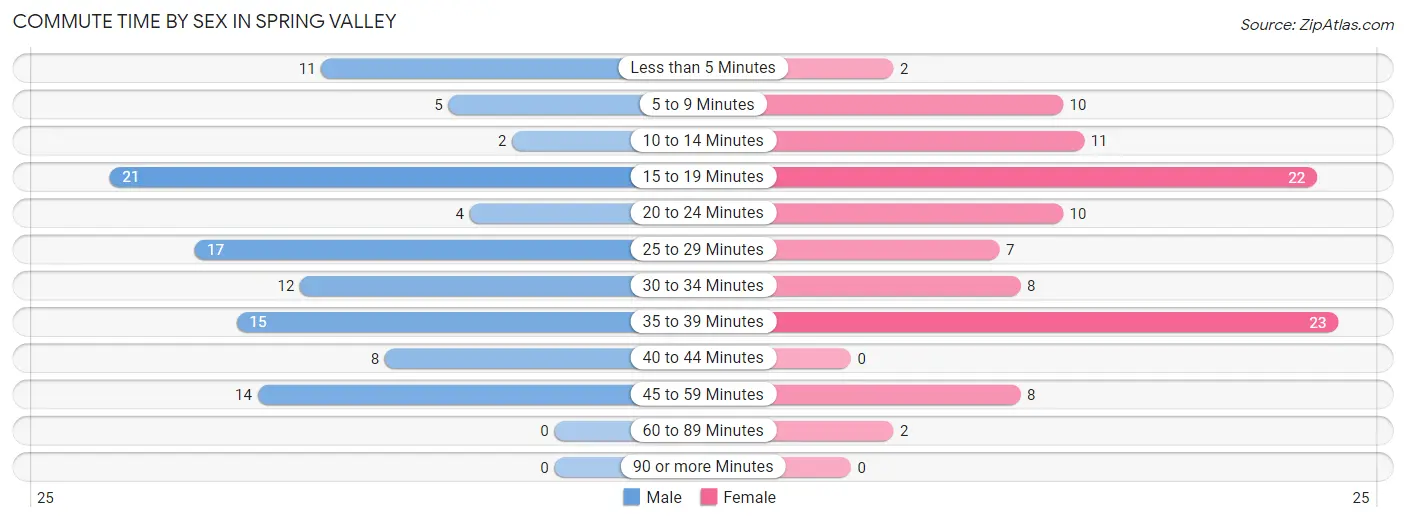
| Commute Time | Male | Female |
| Less than 5 Minutes | 11 (10.1%) | 2 (1.9%) |
| 5 to 9 Minutes | 5 (4.6%) | 10 (9.7%) |
| 10 to 14 Minutes | 2 (1.8%) | 11 (10.7%) |
| 15 to 19 Minutes | 21 (19.3%) | 22 (21.4%) |
| 20 to 24 Minutes | 4 (3.7%) | 10 (9.7%) |
| 25 to 29 Minutes | 17 (15.6%) | 7 (6.8%) |
| 30 to 34 Minutes | 12 (11.0%) | 8 (7.8%) |
| 35 to 39 Minutes | 15 (13.8%) | 23 (22.3%) |
| 40 to 44 Minutes | 8 (7.3%) | 0 (0.0%) |
| 45 to 59 Minutes | 14 (12.8%) | 8 (7.8%) |
| 60 to 89 Minutes | 0 (0.0%) | 2 (1.9%) |
| 90 or more Minutes | 0 (0.0%) | 0 (0.0%) |
Time of Departure to Work by Sex in Spring Valley
The most frequent times of departure to work in Spring Valley are 6:00 AM to 6:29 AM (25, 22.9%) for males and 8:00 AM to 8:29 AM (19, 18.4%) for females.
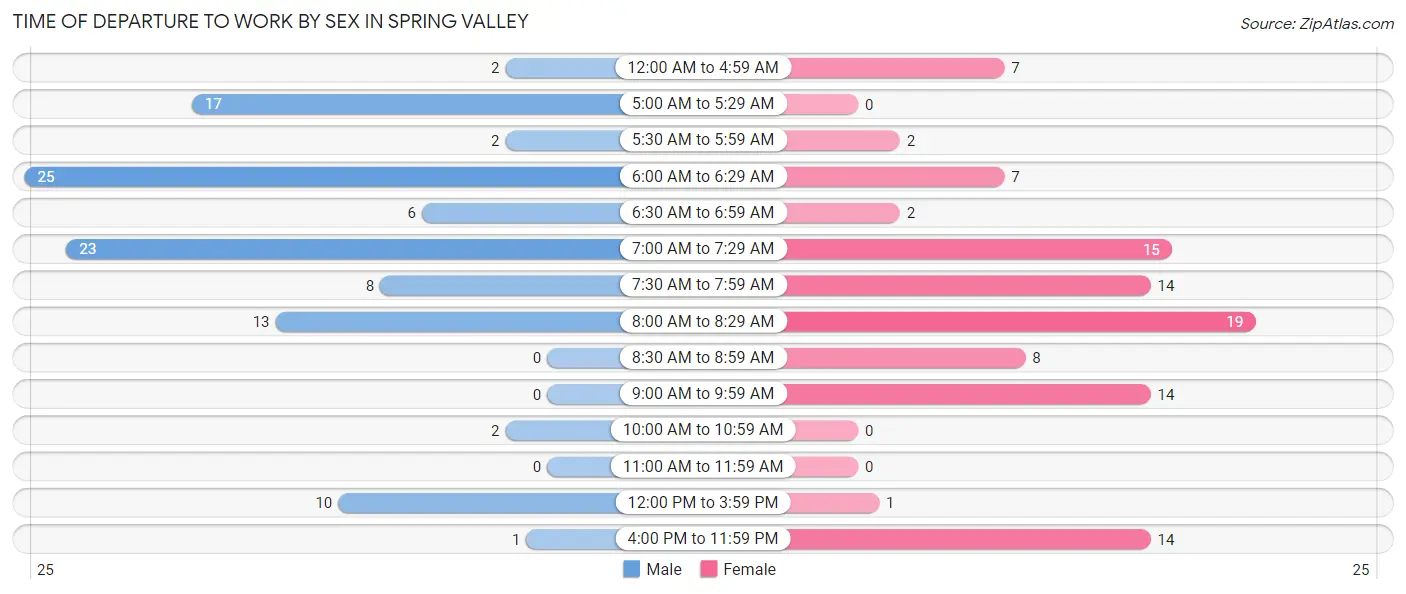
| Time of Departure | Male | Female |
| 12:00 AM to 4:59 AM | 2 (1.8%) | 7 (6.8%) |
| 5:00 AM to 5:29 AM | 17 (15.6%) | 0 (0.0%) |
| 5:30 AM to 5:59 AM | 2 (1.8%) | 2 (1.9%) |
| 6:00 AM to 6:29 AM | 25 (22.9%) | 7 (6.8%) |
| 6:30 AM to 6:59 AM | 6 (5.5%) | 2 (1.9%) |
| 7:00 AM to 7:29 AM | 23 (21.1%) | 15 (14.6%) |
| 7:30 AM to 7:59 AM | 8 (7.3%) | 14 (13.6%) |
| 8:00 AM to 8:29 AM | 13 (11.9%) | 19 (18.4%) |
| 8:30 AM to 8:59 AM | 0 (0.0%) | 8 (7.8%) |
| 9:00 AM to 9:59 AM | 0 (0.0%) | 14 (13.6%) |
| 10:00 AM to 10:59 AM | 2 (1.8%) | 0 (0.0%) |
| 11:00 AM to 11:59 AM | 0 (0.0%) | 0 (0.0%) |
| 12:00 PM to 3:59 PM | 10 (9.2%) | 1 (1.0%) |
| 4:00 PM to 11:59 PM | 1 (0.9%) | 14 (13.6%) |
| Total | 109 (100.0%) | 103 (100.0%) |
Housing Occupancy in Spring Valley
Occupancy by Ownership in Spring Valley
Of the total 191 dwellings in Spring Valley, owner-occupied units account for 157 (82.2%), while renter-occupied units make up 34 (17.8%).
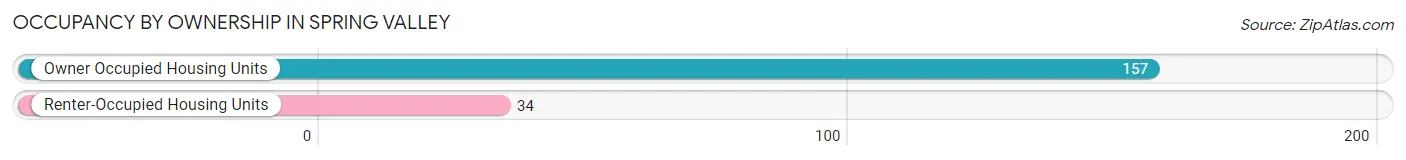
| Occupancy | # Housing Units | % Housing Units |
| Owner Occupied Housing Units | 157 | 82.2% |
| Renter-Occupied Housing Units | 34 | 17.8% |
| Total Occupied Housing Units | 191 | 100.0% |
Occupancy by Household Size in Spring Valley
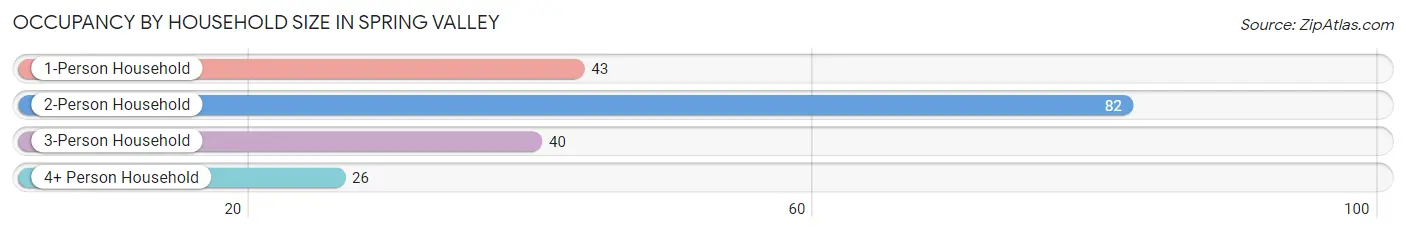
| Household Size | # Housing Units | % Housing Units |
| 1-Person Household | 43 | 22.5% |
| 2-Person Household | 82 | 42.9% |
| 3-Person Household | 40 | 20.9% |
| 4+ Person Household | 26 | 13.6% |
| Total Housing Units | 191 | 100.0% |
Occupancy by Ownership by Household Size in Spring Valley
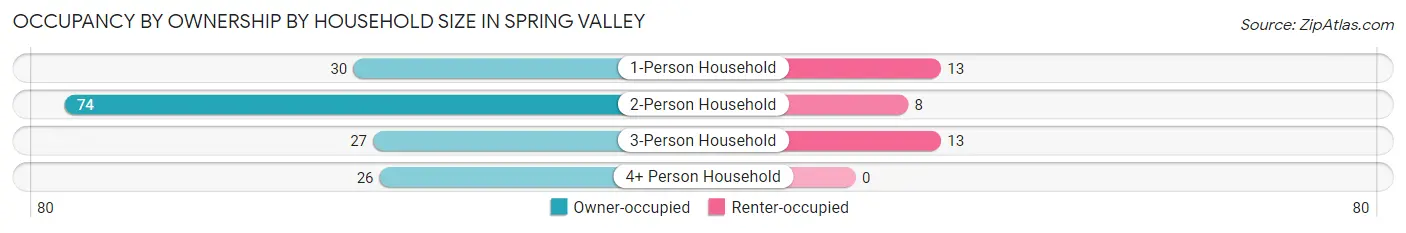
| Household Size | Owner-occupied | Renter-occupied |
| 1-Person Household | 30 (69.8%) | 13 (30.2%) |
| 2-Person Household | 74 (90.2%) | 8 (9.8%) |
| 3-Person Household | 27 (67.5%) | 13 (32.5%) |
| 4+ Person Household | 26 (100.0%) | 0 (0.0%) |
| Total Housing Units | 157 (82.2%) | 34 (17.8%) |
Occupancy by Educational Attainment in Spring Valley
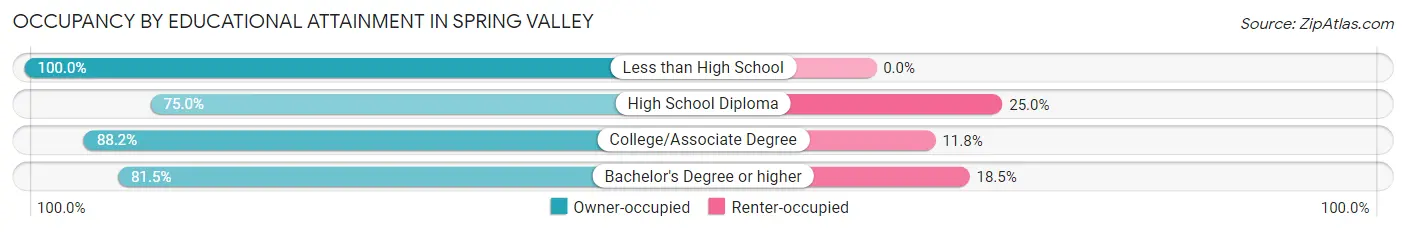
| Household Size | Owner-occupied | Renter-occupied |
| Less than High School | 14 (100.0%) | 0 (0.0%) |
| High School Diploma | 54 (75.0%) | 18 (25.0%) |
| College/Associate Degree | 45 (88.2%) | 6 (11.8%) |
| Bachelor's Degree or higher | 44 (81.5%) | 10 (18.5%) |
Occupancy by Age of Householder in Spring Valley
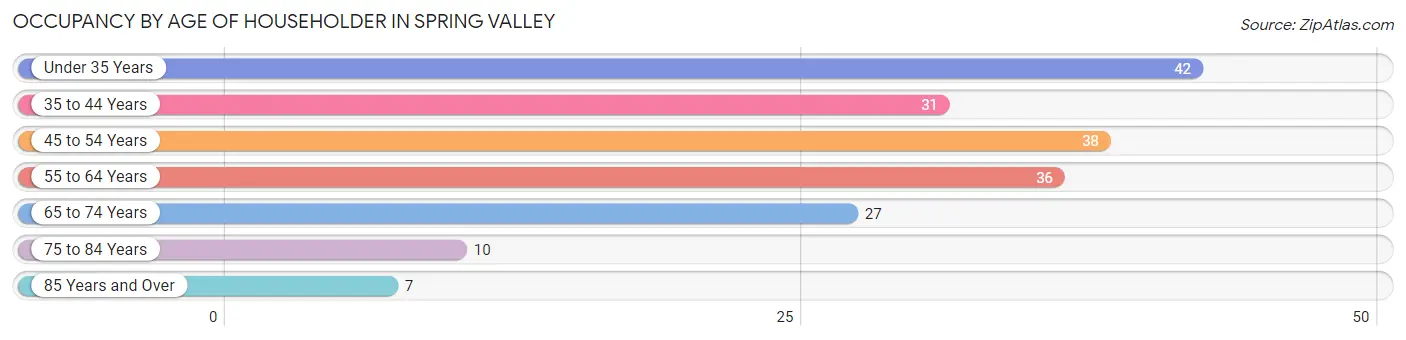
| Age Bracket | # Households | % Households |
| Under 35 Years | 42 | 22.0% |
| 35 to 44 Years | 31 | 16.2% |
| 45 to 54 Years | 38 | 19.9% |
| 55 to 64 Years | 36 | 18.9% |
| 65 to 74 Years | 27 | 14.1% |
| 75 to 84 Years | 10 | 5.2% |
| 85 Years and Over | 7 | 3.7% |
| Total | 191 | 100.0% |
Housing Finances in Spring Valley
Median Income by Occupancy in Spring Valley
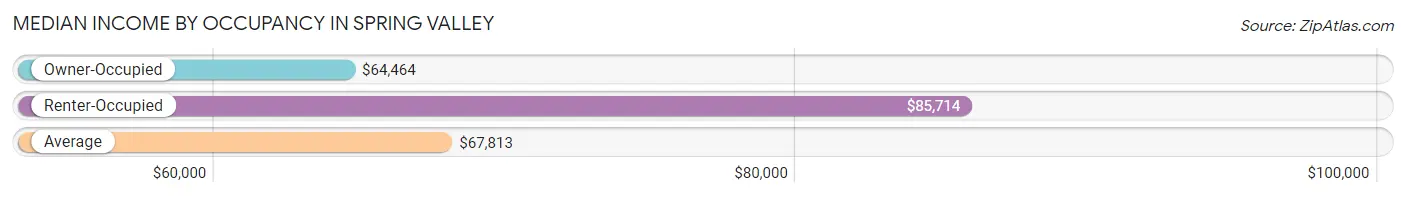
| Occupancy Type | # Households | Median Income |
| Owner-Occupied | 157 (82.2%) | $64,464 |
| Renter-Occupied | 34 (17.8%) | $85,714 |
| Average | 191 (100.0%) | $67,813 |
Occupancy by Householder Income Bracket in Spring Valley
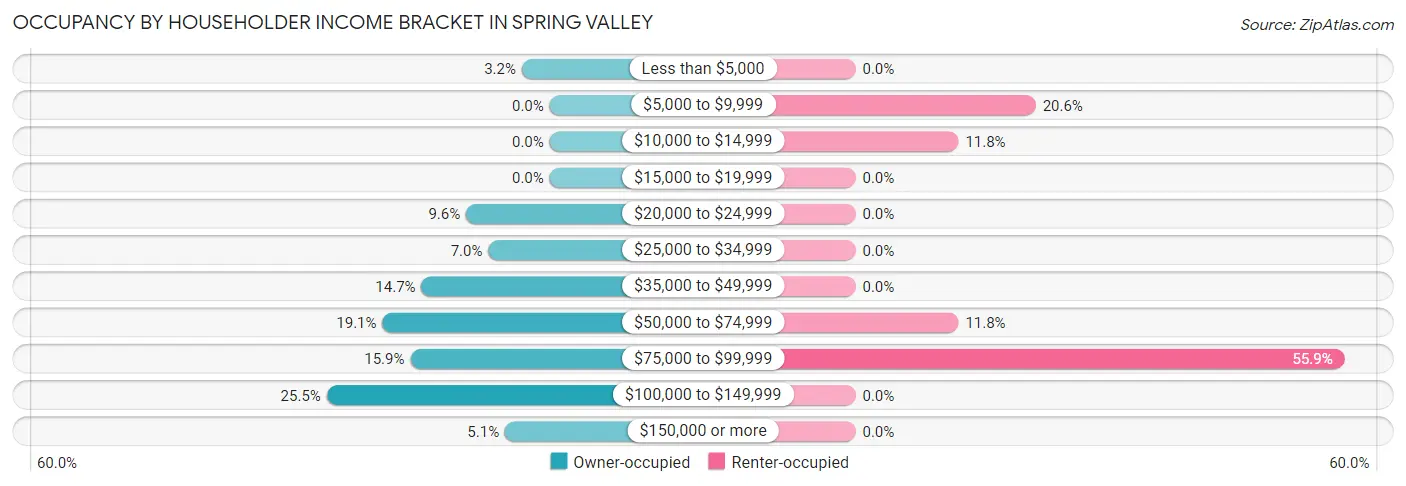
| Income Bracket | Owner-occupied | Renter-occupied |
| Less than $5,000 | 5 (3.2%) | 0 (0.0%) |
| $5,000 to $9,999 | 0 (0.0%) | 7 (20.6%) |
| $10,000 to $14,999 | 0 (0.0%) | 4 (11.8%) |
| $15,000 to $19,999 | 0 (0.0%) | 0 (0.0%) |
| $20,000 to $24,999 | 15 (9.6%) | 0 (0.0%) |
| $25,000 to $34,999 | 11 (7.0%) | 0 (0.0%) |
| $35,000 to $49,999 | 23 (14.6%) | 0 (0.0%) |
| $50,000 to $74,999 | 30 (19.1%) | 4 (11.8%) |
| $75,000 to $99,999 | 25 (15.9%) | 19 (55.9%) |
| $100,000 to $149,999 | 40 (25.5%) | 0 (0.0%) |
| $150,000 or more | 8 (5.1%) | 0 (0.0%) |
| Total | 157 (100.0%) | 34 (100.0%) |
Monthly Housing Cost Tiers in Spring Valley
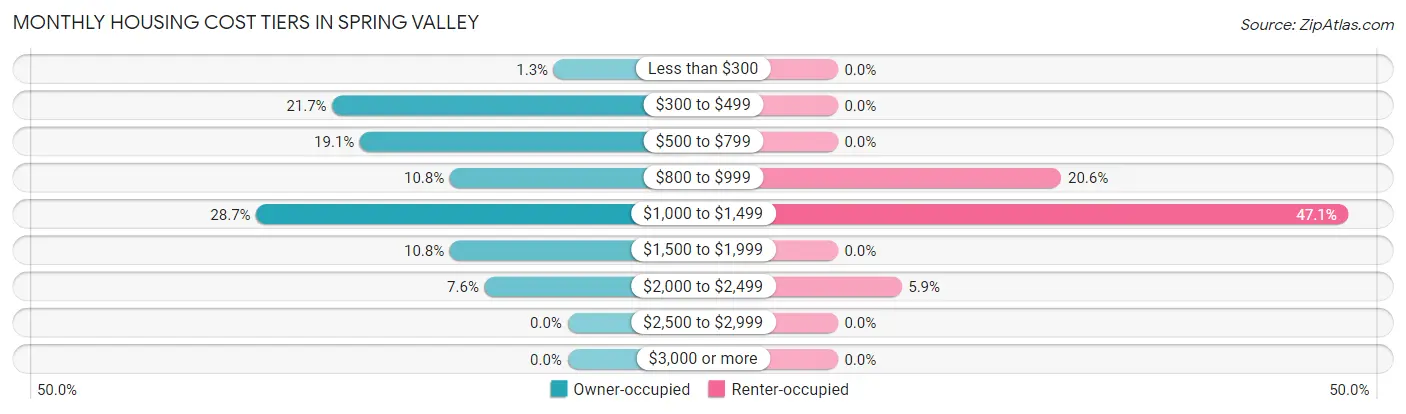
| Monthly Cost | Owner-occupied | Renter-occupied |
| Less than $300 | 2 (1.3%) | 0 (0.0%) |
| $300 to $499 | 34 (21.7%) | 0 (0.0%) |
| $500 to $799 | 30 (19.1%) | 0 (0.0%) |
| $800 to $999 | 17 (10.8%) | 7 (20.6%) |
| $1,000 to $1,499 | 45 (28.7%) | 16 (47.1%) |
| $1,500 to $1,999 | 17 (10.8%) | 0 (0.0%) |
| $2,000 to $2,499 | 12 (7.6%) | 2 (5.9%) |
| $2,500 to $2,999 | 0 (0.0%) | 0 (0.0%) |
| $3,000 or more | 0 (0.0%) | 0 (0.0%) |
| Total | 157 (100.0%) | 34 (100.0%) |
Physical Housing Characteristics in Spring Valley
Housing Structures in Spring Valley
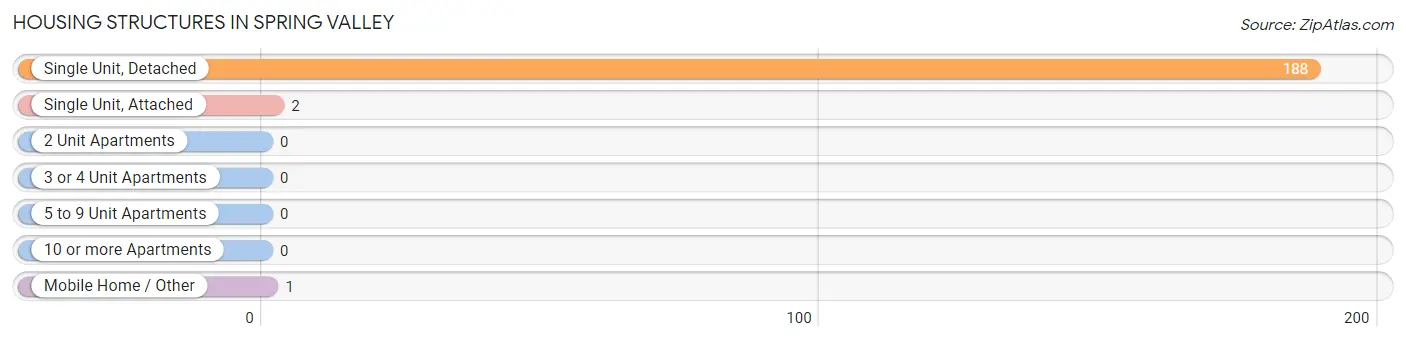
| Structure Type | # Housing Units | % Housing Units |
| Single Unit, Detached | 188 | 98.4% |
| Single Unit, Attached | 2 | 1.1% |
| 2 Unit Apartments | 0 | 0.0% |
| 3 or 4 Unit Apartments | 0 | 0.0% |
| 5 to 9 Unit Apartments | 0 | 0.0% |
| 10 or more Apartments | 0 | 0.0% |
| Mobile Home / Other | 1 | 0.5% |
| Total | 191 | 100.0% |
Housing Structures by Occupancy in Spring Valley
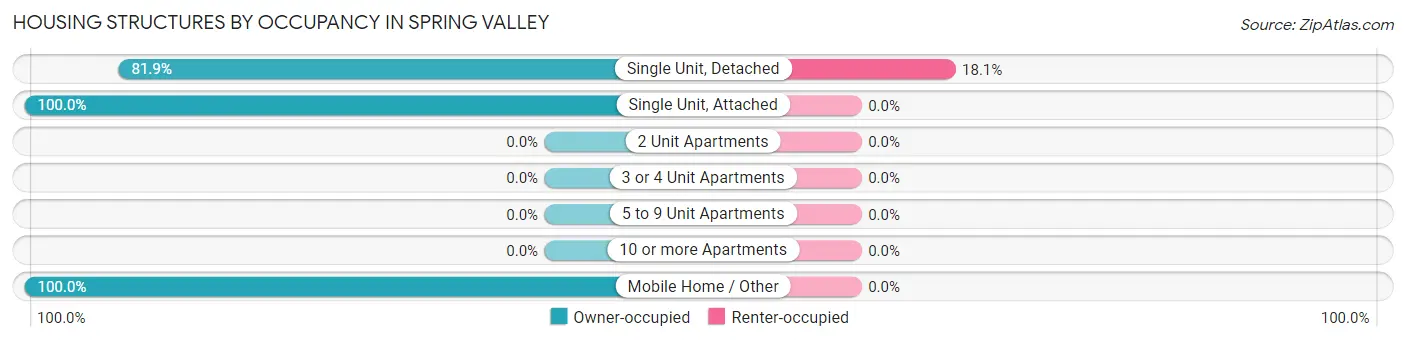
| Structure Type | Owner-occupied | Renter-occupied |
| Single Unit, Detached | 154 (81.9%) | 34 (18.1%) |
| Single Unit, Attached | 2 (100.0%) | 0 (0.0%) |
| 2 Unit Apartments | 0 (0.0%) | 0 (0.0%) |
| 3 or 4 Unit Apartments | 0 (0.0%) | 0 (0.0%) |
| 5 to 9 Unit Apartments | 0 (0.0%) | 0 (0.0%) |
| 10 or more Apartments | 0 (0.0%) | 0 (0.0%) |
| Mobile Home / Other | 1 (100.0%) | 0 (0.0%) |
| Total | 157 (82.2%) | 34 (17.8%) |
Housing Structures by Number of Rooms in Spring Valley
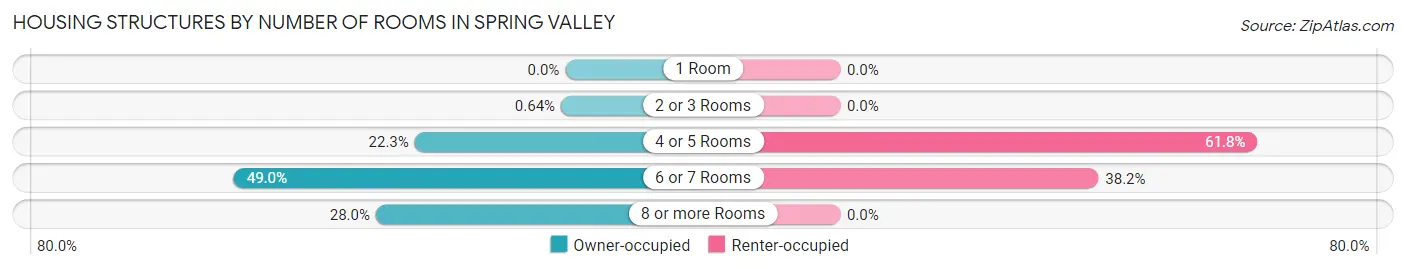
| Number of Rooms | Owner-occupied | Renter-occupied |
| 1 Room | 0 (0.0%) | 0 (0.0%) |
| 2 or 3 Rooms | 1 (0.6%) | 0 (0.0%) |
| 4 or 5 Rooms | 35 (22.3%) | 21 (61.8%) |
| 6 or 7 Rooms | 77 (49.0%) | 13 (38.2%) |
| 8 or more Rooms | 44 (28.0%) | 0 (0.0%) |
| Total | 157 (100.0%) | 34 (100.0%) |
Housing Structure by Heating Type in Spring Valley
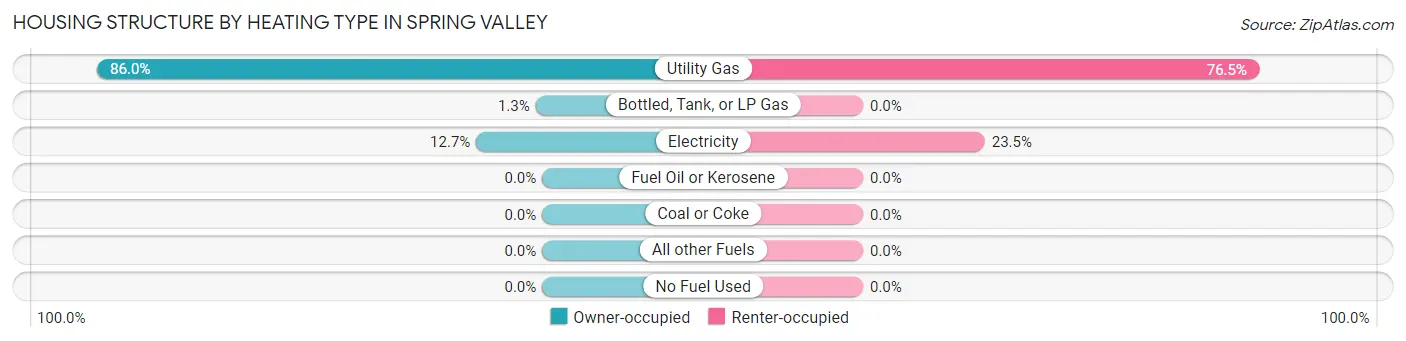
| Heating Type | Owner-occupied | Renter-occupied |
| Utility Gas | 135 (86.0%) | 26 (76.5%) |
| Bottled, Tank, or LP Gas | 2 (1.3%) | 0 (0.0%) |
| Electricity | 20 (12.7%) | 8 (23.5%) |
| Fuel Oil or Kerosene | 0 (0.0%) | 0 (0.0%) |
| Coal or Coke | 0 (0.0%) | 0 (0.0%) |
| All other Fuels | 0 (0.0%) | 0 (0.0%) |
| No Fuel Used | 0 (0.0%) | 0 (0.0%) |
| Total | 157 (100.0%) | 34 (100.0%) |
Household Vehicle Usage in Spring Valley
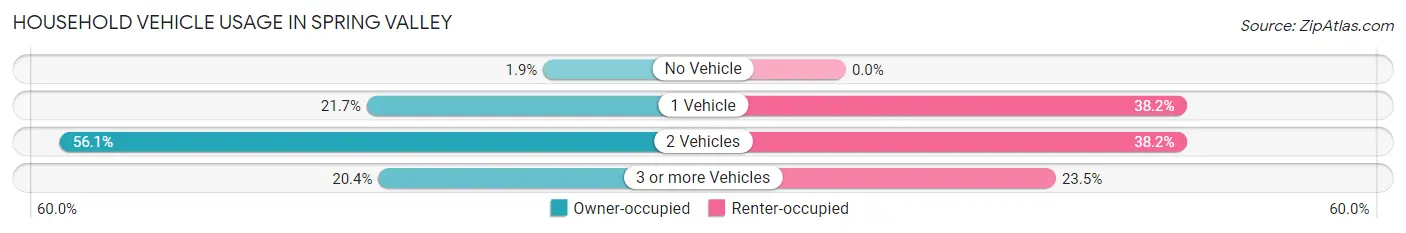
| Vehicles per Household | Owner-occupied | Renter-occupied |
| No Vehicle | 3 (1.9%) | 0 (0.0%) |
| 1 Vehicle | 34 (21.7%) | 13 (38.2%) |
| 2 Vehicles | 88 (56.0%) | 13 (38.2%) |
| 3 or more Vehicles | 32 (20.4%) | 8 (23.5%) |
| Total | 157 (100.0%) | 34 (100.0%) |
Real Estate & Mortgages in Spring Valley
Real Estate and Mortgage Overview in Spring Valley
| Characteristic | Without Mortgage | With Mortgage |
| Housing Units | 56 | 101 |
| Median Property Value | $117,900 | $151,300 |
| Median Household Income | $48,750 | $6 |
| Monthly Housing Costs | $474 | $0 |
| Real Estate Taxes | $1,500 | $0 |
Property Value by Mortgage Status in Spring Valley
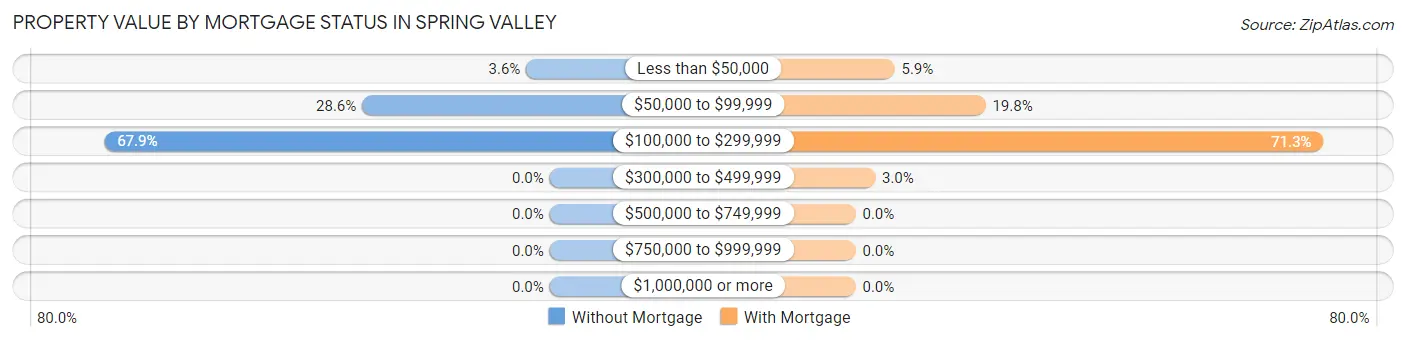
| Property Value | Without Mortgage | With Mortgage |
| Less than $50,000 | 2 (3.6%) | 6 (5.9%) |
| $50,000 to $99,999 | 16 (28.6%) | 20 (19.8%) |
| $100,000 to $299,999 | 38 (67.9%) | 72 (71.3%) |
| $300,000 to $499,999 | 0 (0.0%) | 3 (3.0%) |
| $500,000 to $749,999 | 0 (0.0%) | 0 (0.0%) |
| $750,000 to $999,999 | 0 (0.0%) | 0 (0.0%) |
| $1,000,000 or more | 0 (0.0%) | 0 (0.0%) |
| Total | 56 (100.0%) | 101 (100.0%) |
Household Income by Mortgage Status in Spring Valley
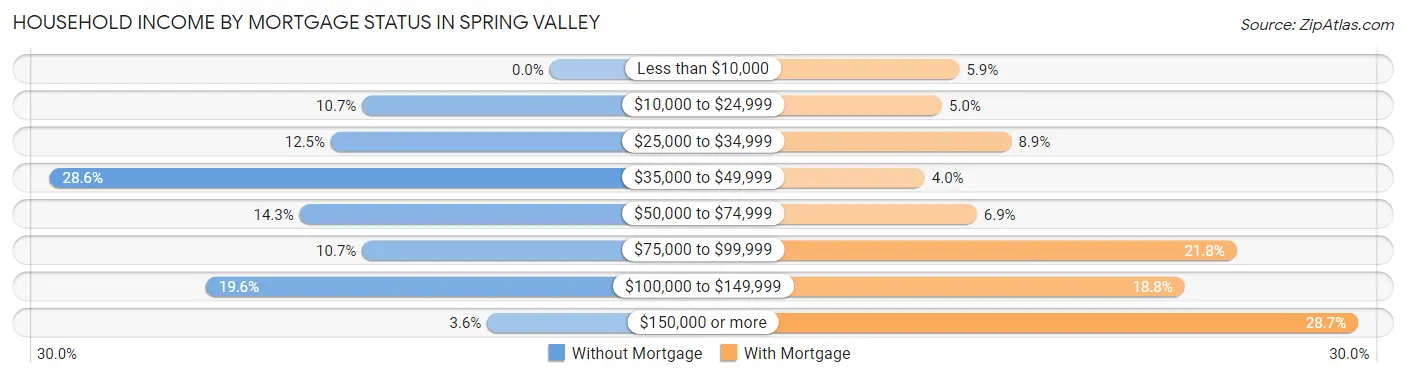
| Household Income | Without Mortgage | With Mortgage |
| Less than $10,000 | 0 (0.0%) | 6 (5.9%) |
| $10,000 to $24,999 | 6 (10.7%) | 5 (5.0%) |
| $25,000 to $34,999 | 7 (12.5%) | 9 (8.9%) |
| $35,000 to $49,999 | 16 (28.6%) | 4 (4.0%) |
| $50,000 to $74,999 | 8 (14.3%) | 7 (6.9%) |
| $75,000 to $99,999 | 6 (10.7%) | 22 (21.8%) |
| $100,000 to $149,999 | 11 (19.6%) | 19 (18.8%) |
| $150,000 or more | 2 (3.6%) | 29 (28.7%) |
| Total | 56 (100.0%) | 101 (100.0%) |
Property Value to Household Income Ratio in Spring Valley
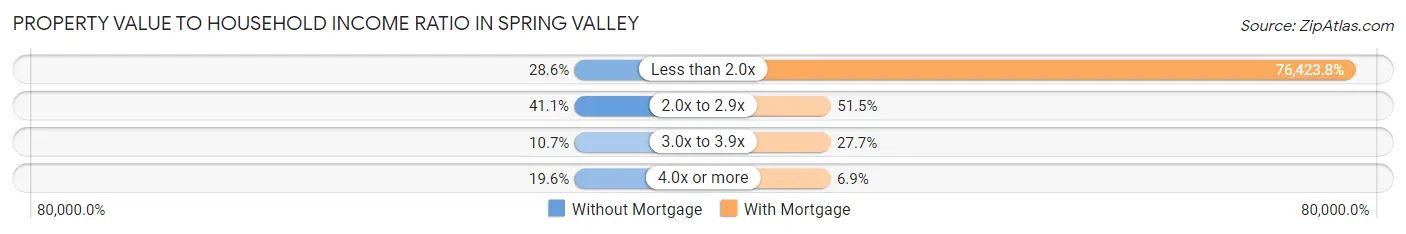
| Value-to-Income Ratio | Without Mortgage | With Mortgage |
| Less than 2.0x | 16 (28.6%) | 77,188 (76,423.8%) |
| 2.0x to 2.9x | 23 (41.1%) | 52 (51.5%) |
| 3.0x to 3.9x | 6 (10.7%) | 28 (27.7%) |
| 4.0x or more | 11 (19.6%) | 7 (6.9%) |
| Total | 56 (100.0%) | 101 (100.0%) |
Real Estate Taxes by Mortgage Status in Spring Valley
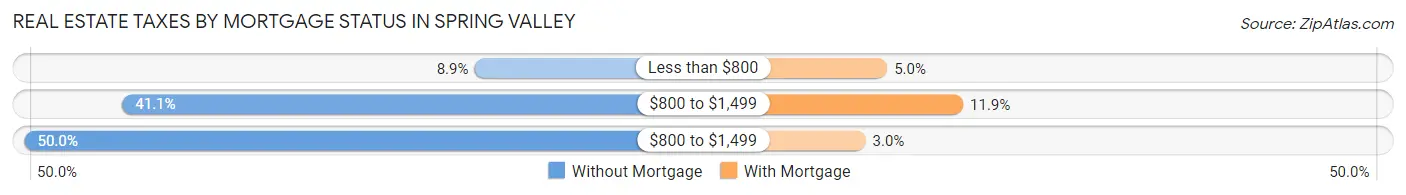
| Property Taxes | Without Mortgage | With Mortgage |
| Less than $800 | 5 (8.9%) | 5 (5.0%) |
| $800 to $1,499 | 23 (41.1%) | 12 (11.9%) |
| $800 to $1,499 | 28 (50.0%) | 3 (3.0%) |
| Total | 56 (100.0%) | 101 (100.0%) |
Health & Disability in Spring Valley
Health Insurance Coverage by Age in Spring Valley
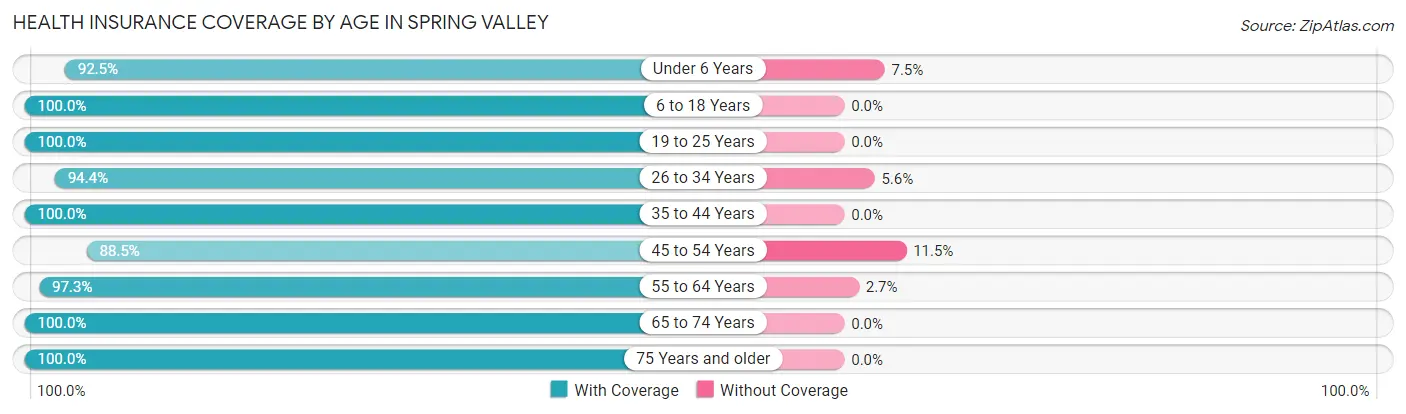
| Age Bracket | With Coverage | Without Coverage |
| Under 6 Years | 37 (92.5%) | 3 (7.5%) |
| 6 to 18 Years | 108 (100.0%) | 0 (0.0%) |
| 19 to 25 Years | 9 (100.0%) | 0 (0.0%) |
| 26 to 34 Years | 67 (94.4%) | 4 (5.6%) |
| 35 to 44 Years | 45 (100.0%) | 0 (0.0%) |
| 45 to 54 Years | 69 (88.5%) | 9 (11.5%) |
| 55 to 64 Years | 72 (97.3%) | 2 (2.7%) |
| 65 to 74 Years | 39 (100.0%) | 0 (0.0%) |
| 75 Years and older | 142 (100.0%) | 0 (0.0%) |
| Total | 588 (97.0%) | 18 (3.0%) |
Health Insurance Coverage by Citizenship Status in Spring Valley
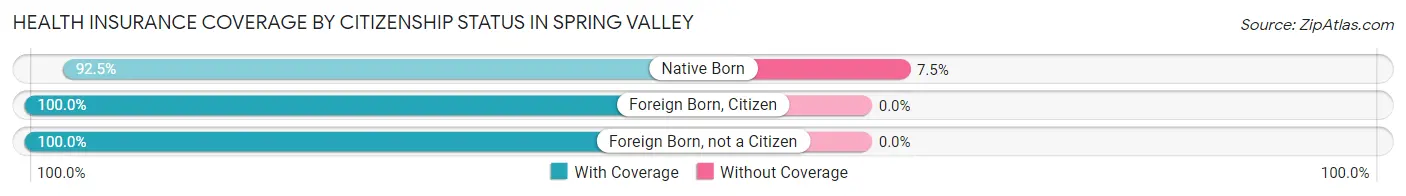
| Citizenship Status | With Coverage | Without Coverage |
| Native Born | 37 (92.5%) | 3 (7.5%) |
| Foreign Born, Citizen | 108 (100.0%) | 0 (0.0%) |
| Foreign Born, not a Citizen | 9 (100.0%) | 0 (0.0%) |
Health Insurance Coverage by Household Income in Spring Valley
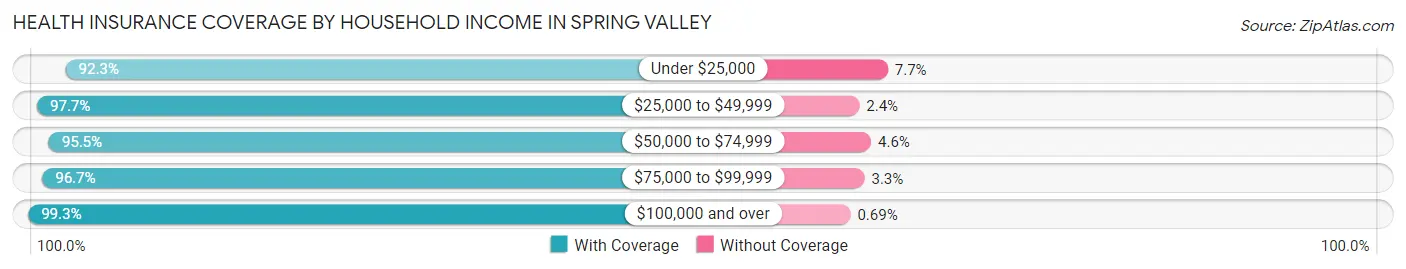
| Household Income | With Coverage | Without Coverage |
| Under $25,000 | 36 (92.3%) | 3 (7.7%) |
| $25,000 to $49,999 | 83 (97.7%) | 2 (2.4%) |
| $50,000 to $74,999 | 63 (95.5%) | 3 (4.5%) |
| $75,000 to $99,999 | 262 (96.7%) | 9 (3.3%) |
| $100,000 and over | 144 (99.3%) | 1 (0.7%) |
Public vs Private Health Insurance Coverage by Age in Spring Valley
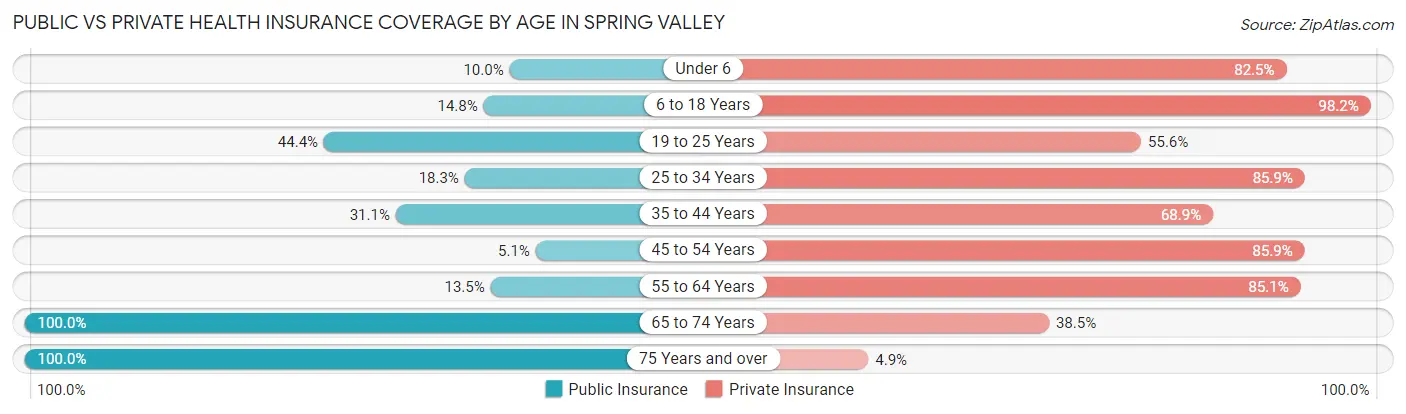
| Age Bracket | Public Insurance | Private Insurance |
| Under 6 | 4 (10.0%) | 33 (82.5%) |
| 6 to 18 Years | 16 (14.8%) | 106 (98.2%) |
| 19 to 25 Years | 4 (44.4%) | 5 (55.6%) |
| 25 to 34 Years | 13 (18.3%) | 61 (85.9%) |
| 35 to 44 Years | 14 (31.1%) | 31 (68.9%) |
| 45 to 54 Years | 4 (5.1%) | 67 (85.9%) |
| 55 to 64 Years | 10 (13.5%) | 63 (85.1%) |
| 65 to 74 Years | 39 (100.0%) | 15 (38.5%) |
| 75 Years and over | 142 (100.0%) | 7 (4.9%) |
| Total | 246 (40.6%) | 388 (64.0%) |
Disability Status by Sex by Age in Spring Valley
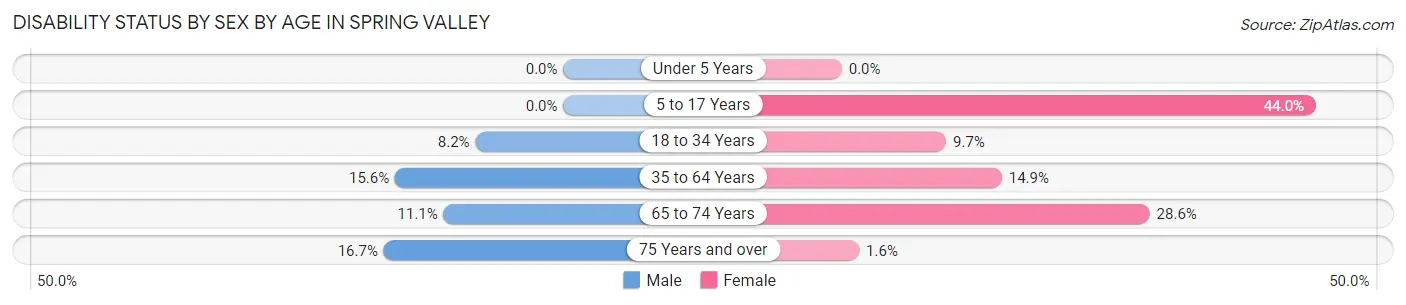
| Age Bracket | Male | Female |
| Under 5 Years | 0 (0.0%) | 0 (0.0%) |
| 5 to 17 Years | 0 (0.0%) | 11 (44.0%) |
| 18 to 34 Years | 4 (8.2%) | 3 (9.7%) |
| 35 to 64 Years | 15 (15.6%) | 15 (14.8%) |
| 65 to 74 Years | 2 (11.1%) | 6 (28.6%) |
| 75 Years and over | 3 (16.7%) | 2 (1.6%) |
Disability Class by Sex by Age in Spring Valley
Disability Class: Hearing Difficulty
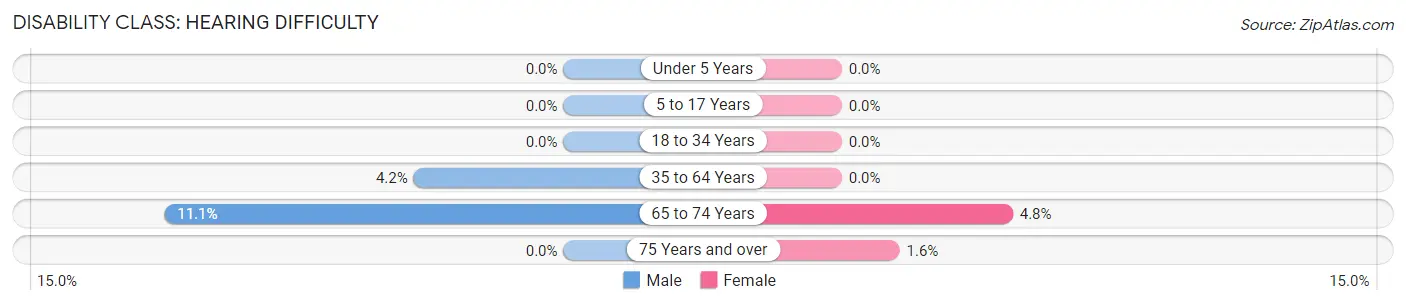
| Age Bracket | Male | Female |
| Under 5 Years | 0 (0.0%) | 0 (0.0%) |
| 5 to 17 Years | 0 (0.0%) | 0 (0.0%) |
| 18 to 34 Years | 0 (0.0%) | 0 (0.0%) |
| 35 to 64 Years | 4 (4.2%) | 0 (0.0%) |
| 65 to 74 Years | 2 (11.1%) | 1 (4.8%) |
| 75 Years and over | 0 (0.0%) | 2 (1.6%) |
Disability Class: Vision Difficulty
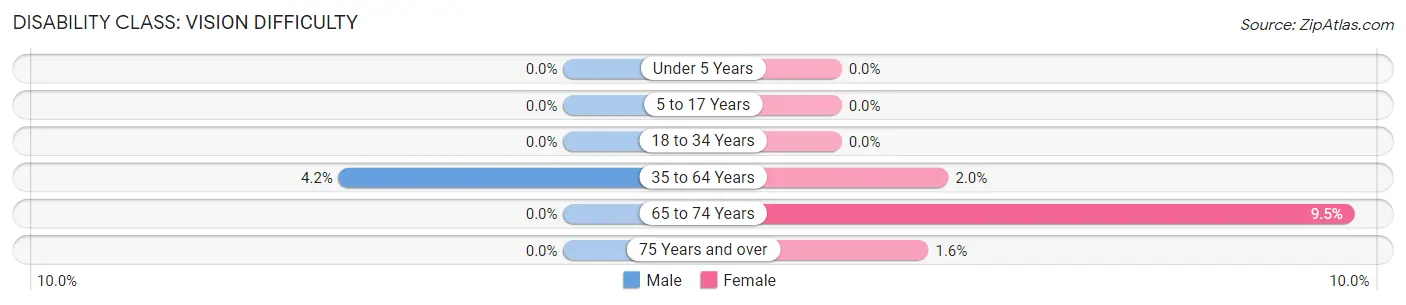
| Age Bracket | Male | Female |
| Under 5 Years | 0 (0.0%) | 0 (0.0%) |
| 5 to 17 Years | 0 (0.0%) | 0 (0.0%) |
| 18 to 34 Years | 0 (0.0%) | 0 (0.0%) |
| 35 to 64 Years | 4 (4.2%) | 2 (2.0%) |
| 65 to 74 Years | 0 (0.0%) | 2 (9.5%) |
| 75 Years and over | 0 (0.0%) | 2 (1.6%) |
Disability Class: Cognitive Difficulty
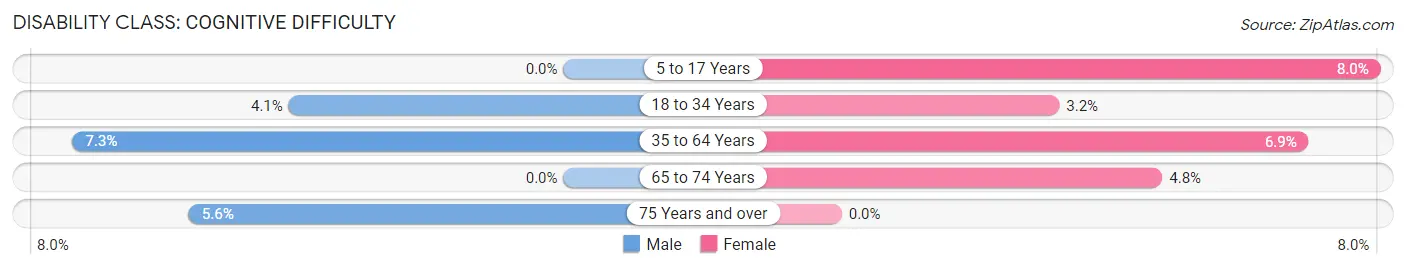
| Age Bracket | Male | Female |
| 5 to 17 Years | 0 (0.0%) | 2 (8.0%) |
| 18 to 34 Years | 2 (4.1%) | 1 (3.2%) |
| 35 to 64 Years | 7 (7.3%) | 7 (6.9%) |
| 65 to 74 Years | 0 (0.0%) | 1 (4.8%) |
| 75 Years and over | 1 (5.6%) | 0 (0.0%) |
Disability Class: Ambulatory Difficulty
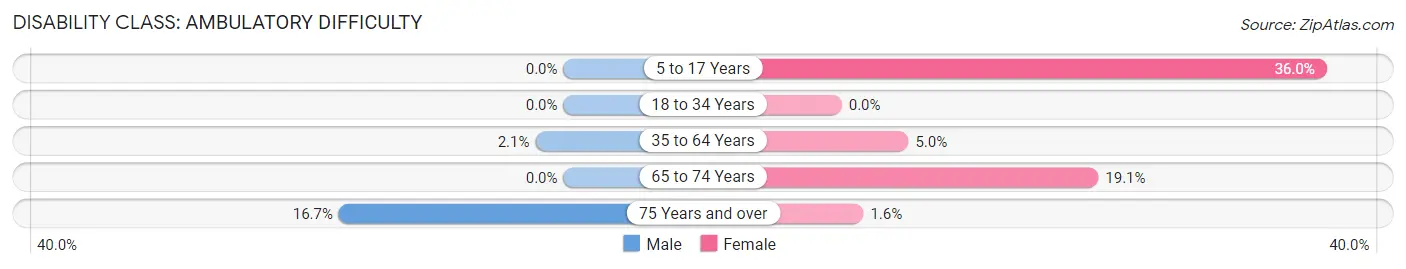
| Age Bracket | Male | Female |
| 5 to 17 Years | 0 (0.0%) | 9 (36.0%) |
| 18 to 34 Years | 0 (0.0%) | 0 (0.0%) |
| 35 to 64 Years | 2 (2.1%) | 5 (5.0%) |
| 65 to 74 Years | 0 (0.0%) | 4 (19.1%) |
| 75 Years and over | 3 (16.7%) | 2 (1.6%) |
Disability Class: Self-Care Difficulty
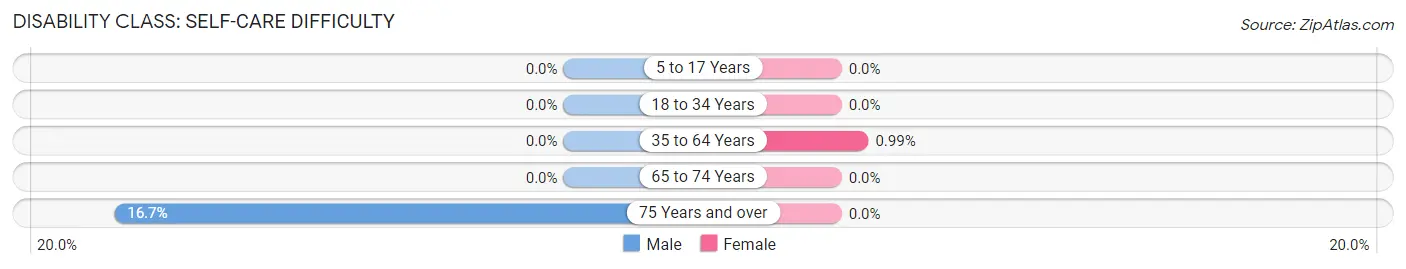
| Age Bracket | Male | Female |
| 5 to 17 Years | 0 (0.0%) | 0 (0.0%) |
| 18 to 34 Years | 0 (0.0%) | 0 (0.0%) |
| 35 to 64 Years | 0 (0.0%) | 1 (1.0%) |
| 65 to 74 Years | 0 (0.0%) | 0 (0.0%) |
| 75 Years and over | 3 (16.7%) | 0 (0.0%) |
Technology Access in Spring Valley
Computing Device Access in Spring Valley
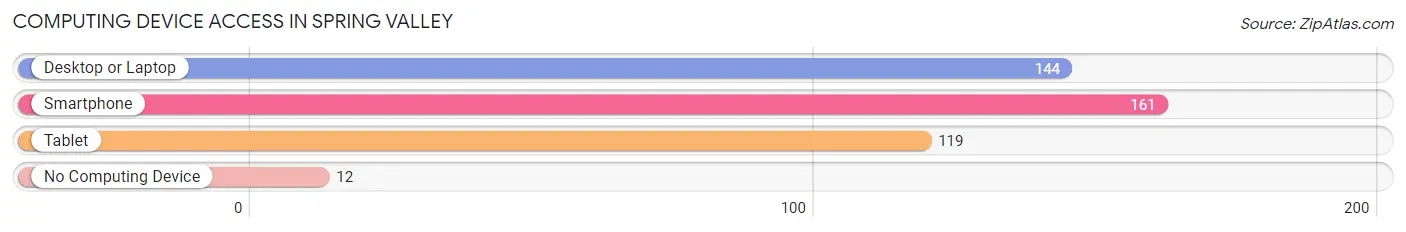
| Device Type | # Households | % Households |
| Desktop or Laptop | 144 | 75.4% |
| Smartphone | 161 | 84.3% |
| Tablet | 119 | 62.3% |
| No Computing Device | 12 | 6.3% |
| Total | 191 | 100.0% |
Internet Access in Spring Valley
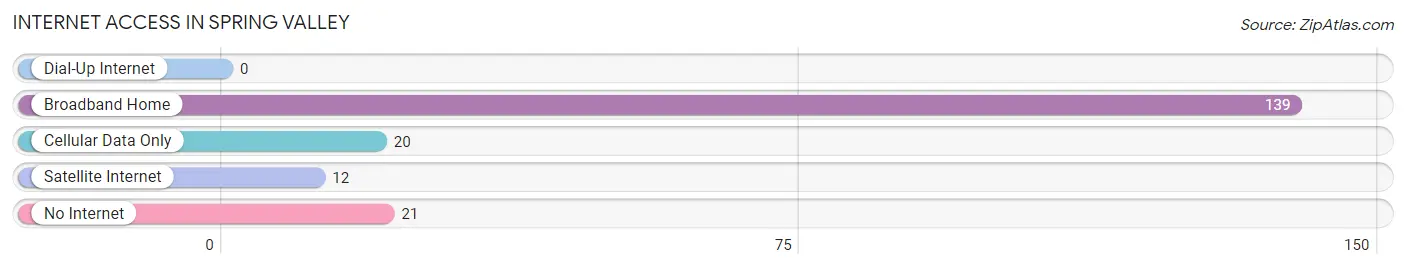
| Internet Type | # Households | % Households |
| Dial-Up Internet | 0 | 0.0% |
| Broadband Home | 139 | 72.8% |
| Cellular Data Only | 20 | 10.5% |
| Satellite Internet | 12 | 6.3% |
| No Internet | 21 | 11.0% |
| Total | 191 | 100.0% |
Spring Valley Summary
History
The history of Spring Valley, Ohio dates back to the early 1800s when the area was first settled by pioneers. The first settlers were mostly of German descent and they established a small farming community. The area was known as Spring Valley because of the numerous springs that were located in the area. The first post office was established in 1837 and the village was officially incorporated in 1845.
The early settlers of Spring Valley were mostly farmers and the area was known for its fertile soil and abundant water supply. The village was also home to several mills, including a grist mill, saw mill, and a woolen mill. The woolen mill was the largest employer in the area and provided jobs for many of the local residents.
In the late 1800s, the village began to grow and the population increased. The village was home to several churches, a school, and a variety of businesses. The village also had a railroad station which allowed for easy transportation of goods and people.
In the early 1900s, the village began to decline as the population moved away to larger cities. The village was also affected by the Great Depression and World War II. After the war, the village began to slowly recover and the population began to increase again.
Geography
Spring Valley is located in Greene County, Ohio, approximately 25 miles east of Dayton. The village is situated in the Miami Valley region of Ohio and is surrounded by rolling hills and farmland. The village is located on the banks of the Little Miami River and is home to several parks and recreational areas.
The village covers an area of 1.3 square miles and has a population of approximately 1,500 people. The village is served by the Spring Valley-Clifton Local School District and is home to several churches, businesses, and organizations.
Economy
The economy of Spring Valley is largely based on agriculture and manufacturing. The village is home to several farms and agricultural businesses, including a dairy farm, a poultry farm, and a vegetable farm. The village is also home to several manufacturing businesses, including a plastics factory and a metal fabrication plant.
The village is also home to several small businesses, including restaurants, retail stores, and service providers. The village is served by the Spring Valley-Clifton Local School District and is home to several churches, businesses, and organizations.
Demographics
As of the 2010 census, the population of Spring Valley was 1,521 people. The racial makeup of the village was 97.3% White, 0.7% African American, 0.2% Native American, 0.2% Asian, 0.2% from other races, and 1.4% from two or more races. Hispanic or Latino of any race were 0.7% of the population.
The median income for a household in the village was $41,250 and the median income for a family was $50,000. The per capita income for the village was $20,845. About 8.3% of families and 10.2% of the population were below the poverty line, including 14.3% of those under age 18 and 6.2% of those age 65 or over.
Common Questions
What is Per Capita Income in Spring Valley?
Per Capita income in Spring Valley is $25,673.
What is the Median Family Income in Spring Valley?
Median Family Income in Spring Valley is $75,714.
What is the Median Household income in Spring Valley?
Median Household Income in Spring Valley is $67,813.
What is Income or Wage Gap in Spring Valley?
Income or Wage Gap in Spring Valley is 51.5%.
Women in Spring Valley earn 48.5 cents for every dollar earned by a man.
What is Inequality or Gini Index in Spring Valley?
Inequality or Gini Index in Spring Valley is 0.35.
What is the Total Population of Spring Valley?
Total Population of Spring Valley is 606.
What is the Total Male Population of Spring Valley?
Total Male Population of Spring Valley is 291.
What is the Total Female Population of Spring Valley?
Total Female Population of Spring Valley is 315.
What is the Ratio of Males per 100 Females in Spring Valley?
There are 92.38 Males per 100 Females in Spring Valley.
What is the Ratio of Females per 100 Males in Spring Valley?
There are 108.25 Females per 100 Males in Spring Valley.
What is the Median Population Age in Spring Valley?
Median Population Age in Spring Valley is 48.2 Years.
What is the Average Family Size in Spring Valley
Average Family Size in Spring Valley is 3.8 People.
What is the Average Household Size in Spring Valley
Average Household Size in Spring Valley is 3.2 People.
How Large is the Labor Force in Spring Valley?
There are 256 People in the Labor Forcein in Spring Valley.
What is the Percentage of People in the Labor Force in Spring Valley?
54.5% of People are in the Labor Force in Spring Valley.
What is the Unemployment Rate in Spring Valley?
Unemployment Rate in Spring Valley is 2.0%.