Zip Codes with the Highest Percentage of Population Employed in Real Estate, Rental & Leasing in Westerville, OH
RELATED REPORTS & OPTIONS
Real Estate, Rental & Leasing
Westerville
Compare Zip Codes
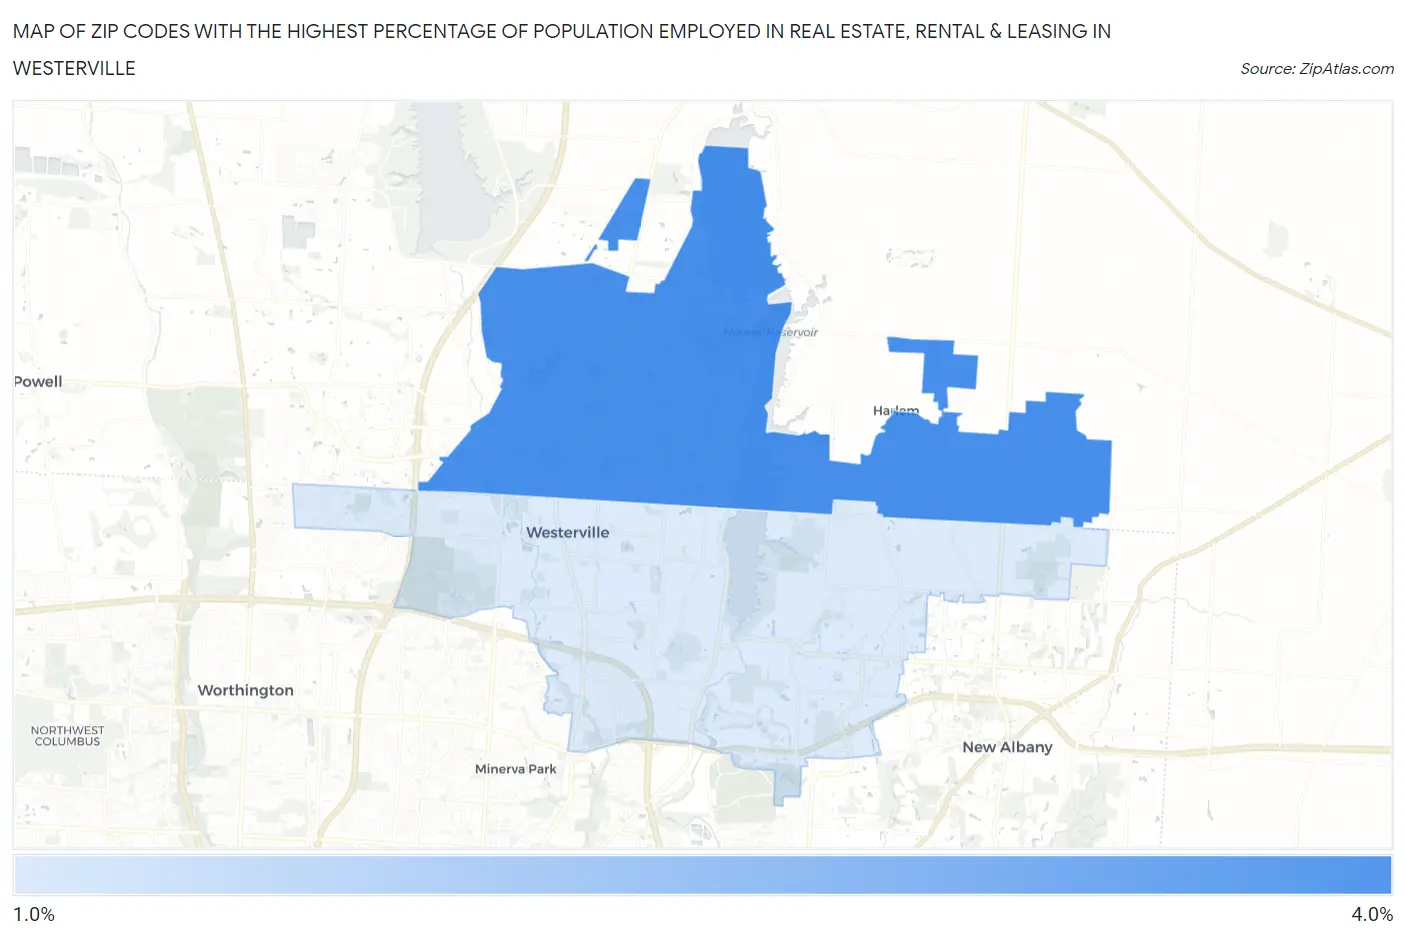
Map of Zip Codes with the Highest Percentage of Population Employed in Real Estate, Rental & Leasing in Westerville
1.4%
3.5%
Zip Codes with the Highest Percentage of Population Employed in Real Estate, Rental & Leasing in Westerville, OH
| Zip Code | % Employed | vs State | vs National | |
| 1. | 43082 | 3.5% | 1.5%(+2.01)#72 | 1.9%(+1.57)#2,903 |
| 2. | 43081 | 1.4% | 1.5%(-0.018)#369 | 1.9%(-0.455)#11,689 |
1
Common Questions
What are the Top Zip Codes with the Highest Percentage of Population Employed in Real Estate, Rental & Leasing in Westerville, OH?
Top Zip Codes with the Highest Percentage of Population Employed in Real Estate, Rental & Leasing in Westerville, OH are:
What zip code has the Highest Percentage of Population Employed in Real Estate, Rental & Leasing in Westerville, OH?
43082 has the Highest Percentage of Population Employed in Real Estate, Rental & Leasing in Westerville, OH with 3.5%.
What is the Percentage of Population Employed in Real Estate, Rental & Leasing in Westerville, OH?
Percentage of Population Employed in Real Estate, Rental & Leasing in Westerville is 1.4%.
What is the Percentage of Population Employed in Real Estate, Rental & Leasing in Ohio?
Percentage of Population Employed in Real Estate, Rental & Leasing in Ohio is 1.5%.
What is the Percentage of Population Employed in Real Estate, Rental & Leasing in the United States?
Percentage of Population Employed in Real Estate, Rental & Leasing in the United States is 1.9%.