Aquilla, OH Map & Demographics
Aquilla Map
Aquilla Overview
$26,371
PER CAPITA INCOME
$72,500
AVG FAMILY INCOME
$55,000
AVG HOUSEHOLD INCOME
27.5%
WAGE / INCOME GAP [ % ]
72.5¢/ $1
WAGE / INCOME GAP [ $ ]
0.33
INEQUALITY / GINI INDEX
266
TOTAL POPULATION
157
MALE POPULATION
109
FEMALE POPULATION
144.04
MALES / 100 FEMALES
69.43
FEMALES / 100 MALES
38.1
MEDIAN AGE
2.9
AVG FAMILY SIZE
2.5
AVG HOUSEHOLD SIZE
130
LABOR FORCE [ PEOPLE ]
64.7%
PERCENT IN LABOR FORCE
7.7%
UNEMPLOYMENT RATE
Income in Aquilla
Income Overview in Aquilla
Per Capita Income in Aquilla is $26,371, while median incomes of families and households are $72,500 and $55,000 respectively.
| Characteristic | Number | Measure |
| Per Capita Income | 266 | $26,371 |
| Median Family Income | 78 | $72,500 |
| Mean Family Income | 78 | $75,763 |
| Median Household Income | 108 | $55,000 |
| Mean Household Income | 108 | $66,056 |
| Income Deficit | 78 | $0 |
| Wage / Income Gap (%) | 266 | 27.49% |
| Wage / Income Gap ($) | 266 | 72.51¢ per $1 |
| Gini / Inequality Index | 266 | 0.33 |
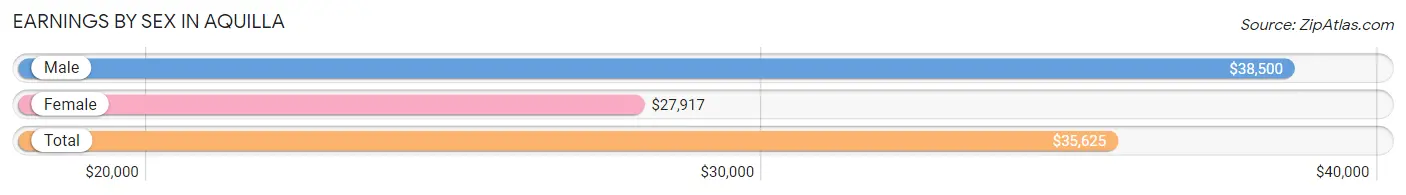
Earnings by Sex in Aquilla
Average Earnings in Aquilla are $35,625, $38,500 for men and $27,917 for women, a difference of 27.5%.
| Sex | Number | Average Earnings |
| Male | 84 (60.4%) | $38,500 |
| Female | 55 (39.6%) | $27,917 |
| Total | 139 (100.0%) | $35,625 |
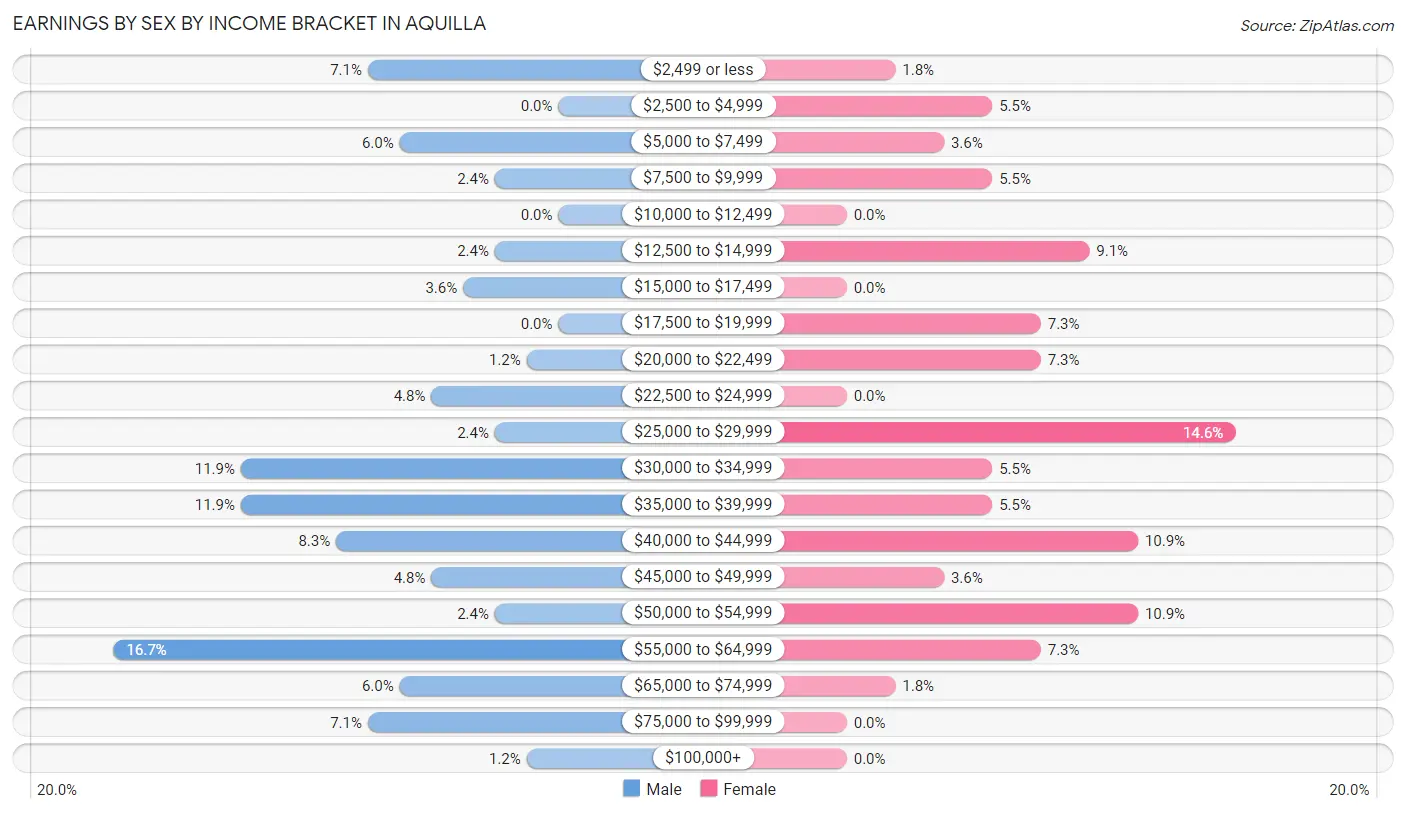
Earnings by Sex by Income Bracket in Aquilla
The most common earnings brackets in Aquilla are $55,000 to $64,999 for men (14 | 16.7%) and $25,000 to $29,999 for women (8 | 14.5%).
| Income | Male | Female |
| $2,499 or less | 6 (7.1%) | 1 (1.8%) |
| $2,500 to $4,999 | 0 (0.0%) | 3 (5.4%) |
| $5,000 to $7,499 | 5 (5.9%) | 2 (3.6%) |
| $7,500 to $9,999 | 2 (2.4%) | 3 (5.4%) |
| $10,000 to $12,499 | 0 (0.0%) | 0 (0.0%) |
| $12,500 to $14,999 | 2 (2.4%) | 5 (9.1%) |
| $15,000 to $17,499 | 3 (3.6%) | 0 (0.0%) |
| $17,500 to $19,999 | 0 (0.0%) | 4 (7.3%) |
| $20,000 to $22,499 | 1 (1.2%) | 4 (7.3%) |
| $22,500 to $24,999 | 4 (4.8%) | 0 (0.0%) |
| $25,000 to $29,999 | 2 (2.4%) | 8 (14.5%) |
| $30,000 to $34,999 | 10 (11.9%) | 3 (5.4%) |
| $35,000 to $39,999 | 10 (11.9%) | 3 (5.4%) |
| $40,000 to $44,999 | 7 (8.3%) | 6 (10.9%) |
| $45,000 to $49,999 | 4 (4.8%) | 2 (3.6%) |
| $50,000 to $54,999 | 2 (2.4%) | 6 (10.9%) |
| $55,000 to $64,999 | 14 (16.7%) | 4 (7.3%) |
| $65,000 to $74,999 | 5 (5.9%) | 1 (1.8%) |
| $75,000 to $99,999 | 6 (7.1%) | 0 (0.0%) |
| $100,000+ | 1 (1.2%) | 0 (0.0%) |
| Total | 84 (100.0%) | 55 (100.0%) |
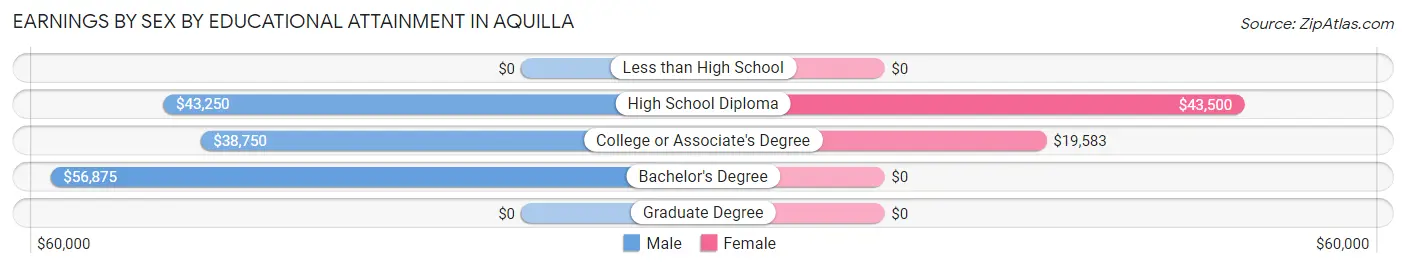
Earnings by Sex by Educational Attainment in Aquilla
Average earnings in Aquilla are $44,000 for men and $28,125 for women, a difference of 36.1%. Men with an educational attainment of bachelor's degree enjoy the highest average annual earnings of $56,875, while those with college or associate's degree education earn the least with $38,750. Women with an educational attainment of high school diploma earn the most with the average annual earnings of $43,500, while those with college or associate's degree education have the smallest earnings of $19,583.
| Educational Attainment | Male Income | Female Income |
| Less than High School | - | - |
| High School Diploma | $43,250 | $43,500 |
| College or Associate's Degree | $38,750 | $19,583 |
| Bachelor's Degree | $56,875 | $0 |
| Graduate Degree | - | - |
| Total | $44,000 | $28,125 |
Family Income in Aquilla
Family Income Brackets in Aquilla
According to the Aquilla family income data, there are 18 families falling into the $100,000 to $149,999 income range, which is the most common income bracket and makes up 23.1% of all families.
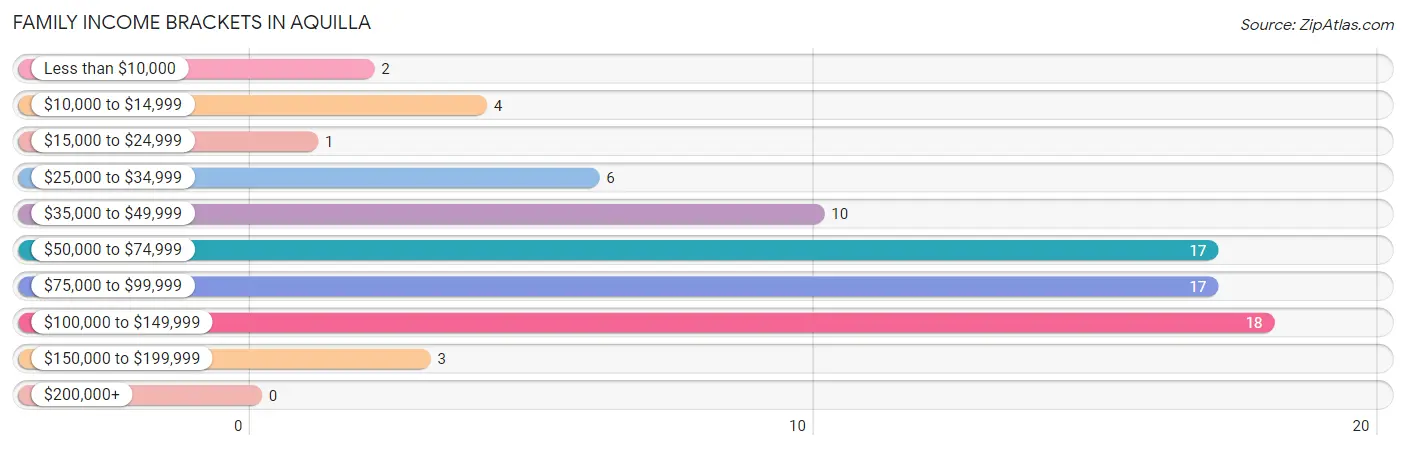
| Income Bracket | # Families | % Families |
| Less than $10,000 | 2 | 2.6% |
| $10,000 to $14,999 | 4 | 5.1% |
| $15,000 to $24,999 | 1 | 1.3% |
| $25,000 to $34,999 | 6 | 7.7% |
| $35,000 to $49,999 | 10 | 12.8% |
| $50,000 to $74,999 | 17 | 21.8% |
| $75,000 to $99,999 | 17 | 21.8% |
| $100,000 to $149,999 | 18 | 23.1% |
| $150,000 to $199,999 | 3 | 3.8% |
| $200,000+ | 0 | 0.0% |
Family Income by Famaliy Size in Aquilla
4-person families (14 | 17.9%) account for the highest median family income in Aquilla with $113,750 per family, while 2-person families (37 | 47.4%) have the highest median income of $32,812 per family member.
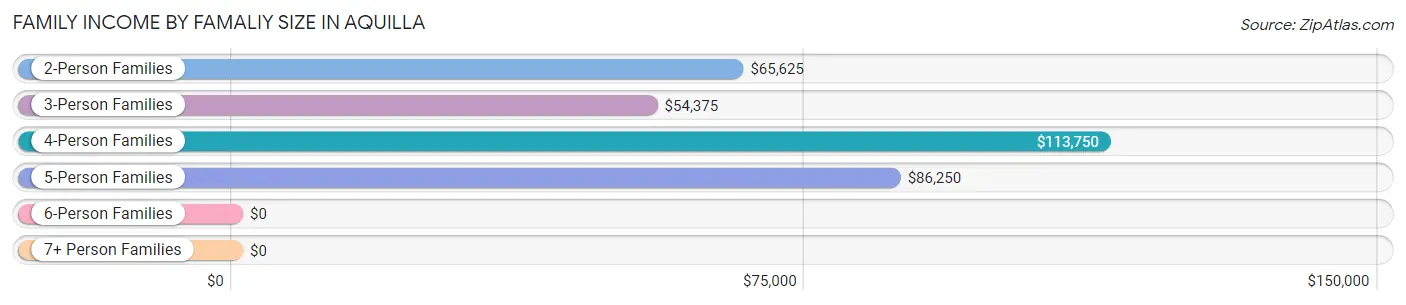
| Income Bracket | # Families | Median Income |
| 2-Person Families | 37 (47.4%) | $65,625 |
| 3-Person Families | 17 (21.8%) | $54,375 |
| 4-Person Families | 14 (17.9%) | $113,750 |
| 5-Person Families | 10 (12.8%) | $86,250 |
| 6-Person Families | 0 (0.0%) | $0 |
| 7+ Person Families | 0 (0.0%) | $0 |
| Total | 78 (100.0%) | $72,500 |
Family Income by Number of Earners in Aquilla
The median family income in Aquilla is $72,500, with families comprising 3+ earners (8) having the highest median family income of $123,500, while families with no earners (14) have the lowest median family income of $48,750, accounting for 10.3% and 17.9% of families, respectively.
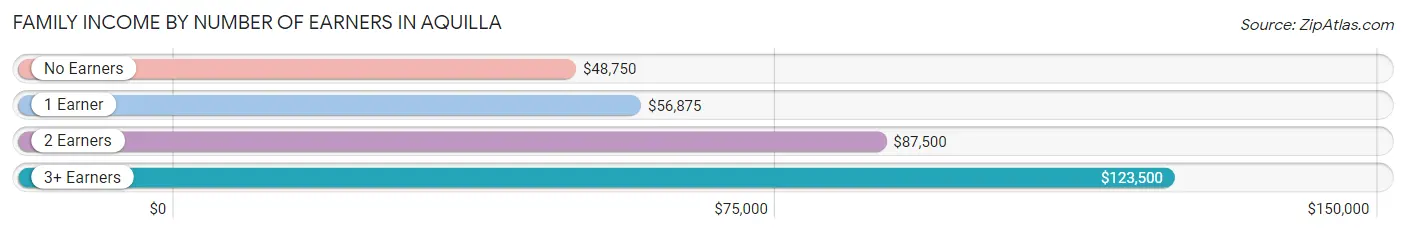
| Number of Earners | # Families | Median Income |
| No Earners | 14 (17.9%) | $48,750 |
| 1 Earner | 20 (25.6%) | $56,875 |
| 2 Earners | 36 (46.2%) | $87,500 |
| 3+ Earners | 8 (10.3%) | $123,500 |
| Total | 78 (100.0%) | $72,500 |
Household Income in Aquilla
Household Income Brackets in Aquilla
With 28 households falling in the category, the $35,000 to $49,999 income range is the most frequent in Aquilla, accounting for 25.9% of all households.
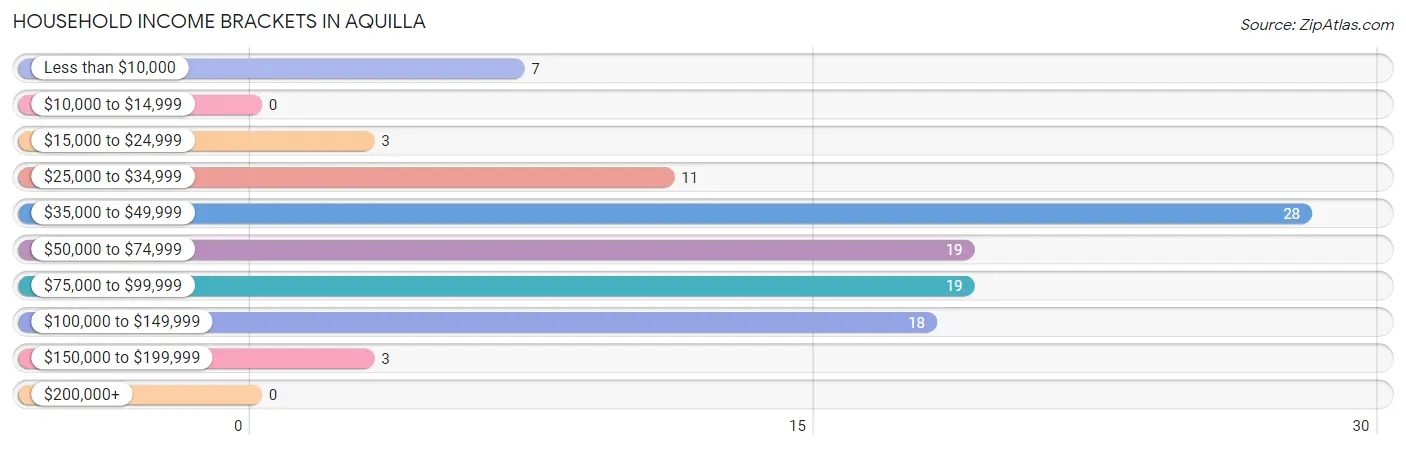
| Income Bracket | # Households | % Households |
| Less than $10,000 | 7 | 6.5% |
| $10,000 to $14,999 | 0 | 0.0% |
| $15,000 to $24,999 | 3 | 2.8% |
| $25,000 to $34,999 | 11 | 10.2% |
| $35,000 to $49,999 | 28 | 25.9% |
| $50,000 to $74,999 | 19 | 17.6% |
| $75,000 to $99,999 | 19 | 17.6% |
| $100,000 to $149,999 | 18 | 16.7% |
| $150,000 to $199,999 | 3 | 2.8% |
| $200,000+ | 0 | 0.0% |
Household Income by Householder Age in Aquilla
The median household income in Aquilla is $55,000, with the highest median household income of $75,000 found in the 25 to 44 years age bracket for the primary householder. A total of 36 households (33.3%) fall into this category. Meanwhile, the 15 to 24 years age bracket for the primary householder has the lowest median household income of $0, with 4 households (3.7%) in this group.
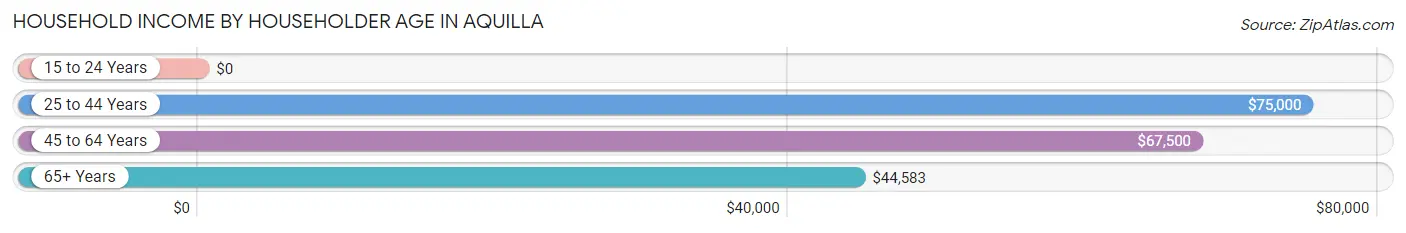
| Income Bracket | # Households | Median Income |
| 15 to 24 Years | 4 (3.7%) | $0 |
| 25 to 44 Years | 36 (33.3%) | $75,000 |
| 45 to 64 Years | 40 (37.0%) | $67,500 |
| 65+ Years | 28 (25.9%) | $44,583 |
| Total | 108 (100.0%) | $55,000 |
Poverty in Aquilla
Income Below Poverty by Sex and Age in Aquilla
With 13.4% poverty level for males and 13.8% for females among the residents of Aquilla, 6 to 11 year old males and under 5 year old females are the most vulnerable to poverty, with 5 males (45.5%) and 4 females (33.3%) in their respective age groups living below the poverty level.
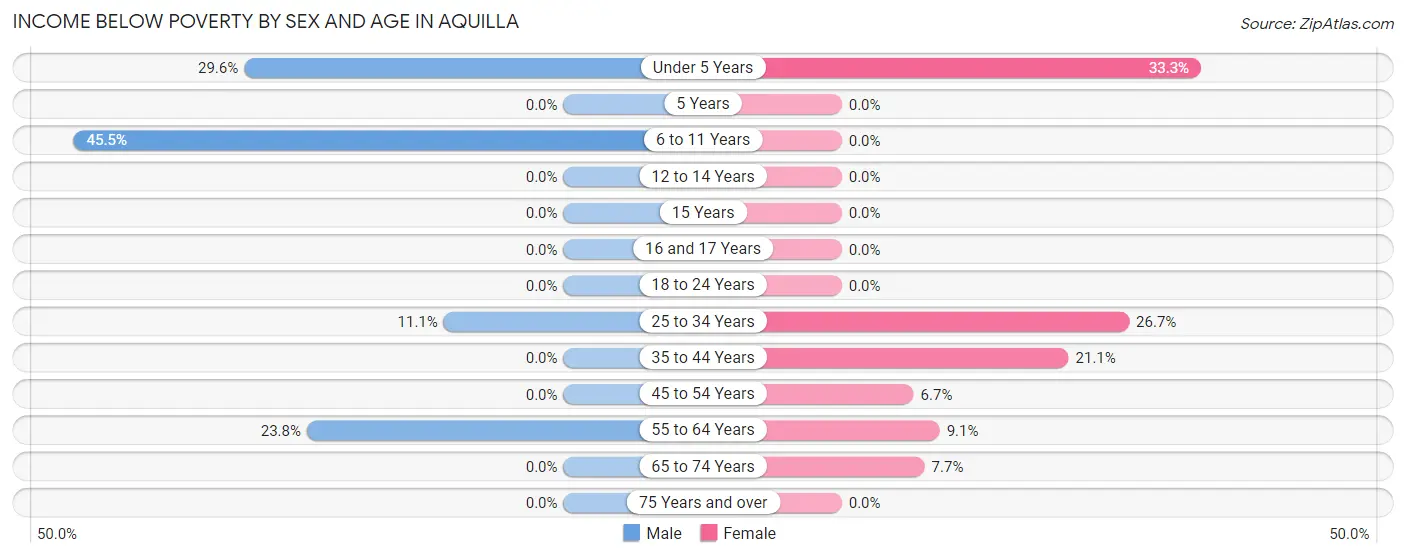
| Age Bracket | Male | Female |
| Under 5 Years | 8 (29.6%) | 4 (33.3%) |
| 5 Years | 0 (0.0%) | 0 (0.0%) |
| 6 to 11 Years | 5 (45.5%) | 0 (0.0%) |
| 12 to 14 Years | 0 (0.0%) | 0 (0.0%) |
| 15 Years | 0 (0.0%) | 0 (0.0%) |
| 16 and 17 Years | 0 (0.0%) | 0 (0.0%) |
| 18 to 24 Years | 0 (0.0%) | 0 (0.0%) |
| 25 to 34 Years | 3 (11.1%) | 4 (26.7%) |
| 35 to 44 Years | 0 (0.0%) | 4 (21.0%) |
| 45 to 54 Years | 0 (0.0%) | 1 (6.7%) |
| 55 to 64 Years | 5 (23.8%) | 1 (9.1%) |
| 65 to 74 Years | 0 (0.0%) | 1 (7.7%) |
| 75 Years and over | 0 (0.0%) | 0 (0.0%) |
| Total | 21 (13.4%) | 15 (13.8%) |
Income Above Poverty by Sex and Age in Aquilla
According to the poverty statistics in Aquilla, males aged 5 years and females aged 5 years are the age groups that are most secure financially, with 100.0% of males and 100.0% of females in these age groups living above the poverty line.
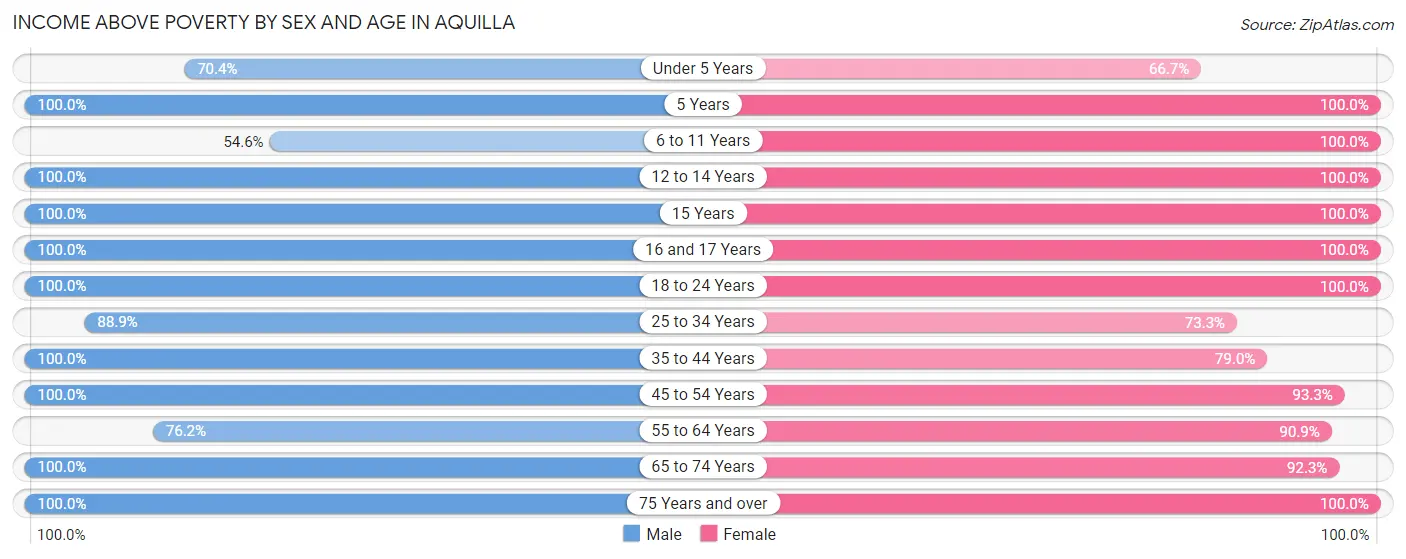
| Age Bracket | Male | Female |
| Under 5 Years | 19 (70.4%) | 8 (66.7%) |
| 5 Years | 2 (100.0%) | 2 (100.0%) |
| 6 to 11 Years | 6 (54.5%) | 4 (100.0%) |
| 12 to 14 Years | 3 (100.0%) | 1 (100.0%) |
| 15 Years | 1 (100.0%) | 2 (100.0%) |
| 16 and 17 Years | 5 (100.0%) | 1 (100.0%) |
| 18 to 24 Years | 11 (100.0%) | 5 (100.0%) |
| 25 to 34 Years | 24 (88.9%) | 11 (73.3%) |
| 35 to 44 Years | 15 (100.0%) | 15 (78.9%) |
| 45 to 54 Years | 13 (100.0%) | 14 (93.3%) |
| 55 to 64 Years | 16 (76.2%) | 10 (90.9%) |
| 65 to 74 Years | 19 (100.0%) | 12 (92.3%) |
| 75 Years and over | 2 (100.0%) | 9 (100.0%) |
| Total | 136 (86.6%) | 94 (86.2%) |
Income Below Poverty Among Married-Couple Families in Aquilla
The poverty statistics for married-couple families in Aquilla show that 6.9% or 4 of the total 58 families live below the poverty line. Families with 3 or 4 children have the highest poverty rate of 33.3%, comprising of 3 families. On the other hand, families with 1 or 2 children have the lowest poverty rate of 0.0%, which includes 0 families.
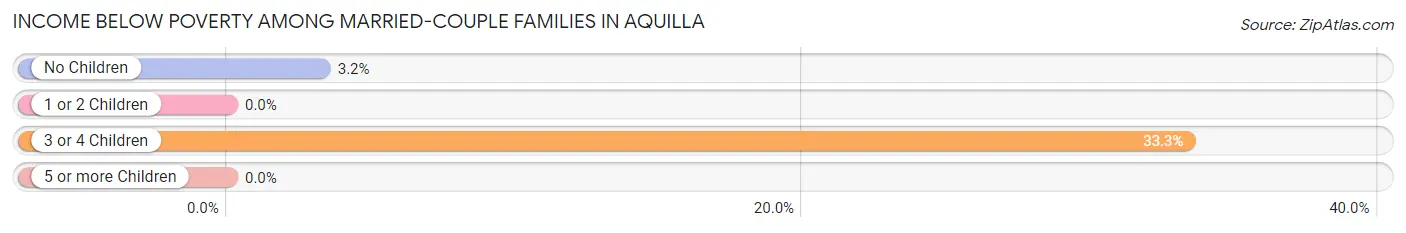
| Children | Above Poverty | Below Poverty |
| No Children | 30 (96.8%) | 1 (3.2%) |
| 1 or 2 Children | 18 (100.0%) | 0 (0.0%) |
| 3 or 4 Children | 6 (66.7%) | 3 (33.3%) |
| 5 or more Children | 0 (0.0%) | 0 (0.0%) |
| Total | 54 (93.1%) | 4 (6.9%) |
Income Below Poverty Among Single-Parent Households in Aquilla
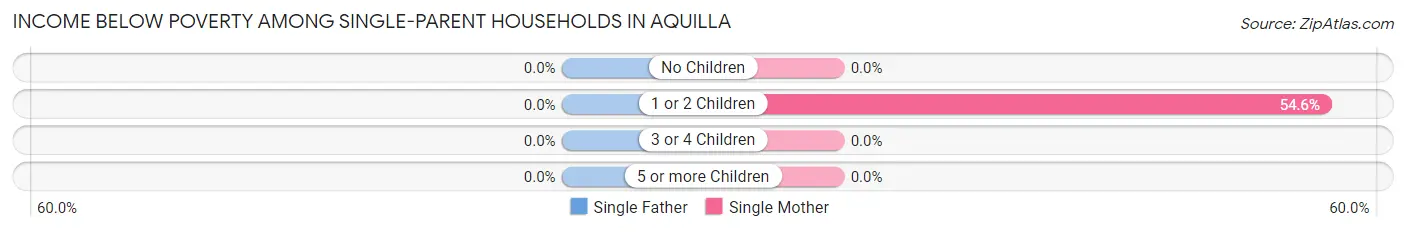
| Children | Single Father | Single Mother |
| No Children | 0 (0.0%) | 0 (0.0%) |
| 1 or 2 Children | 0 (0.0%) | 6 (54.5%) |
| 3 or 4 Children | 0 (0.0%) | 0 (0.0%) |
| 5 or more Children | 0 (0.0%) | 0 (0.0%) |
| Total | 0 (0.0%) | 6 (40.0%) |
Income Below Poverty Among Married-Couple vs Single-Parent Households in Aquilla
The poverty data for Aquilla shows that 4 of the married-couple family households (6.9%) and 6 of the single-parent households (30.0%) are living below the poverty level. Within the married-couple family households, those with 3 or 4 children have the highest poverty rate, with 3 households (33.3%) falling below the poverty line. Among the single-parent households, those with 1 or 2 children have the highest poverty rate, with 6 household (50.0%) living below poverty.
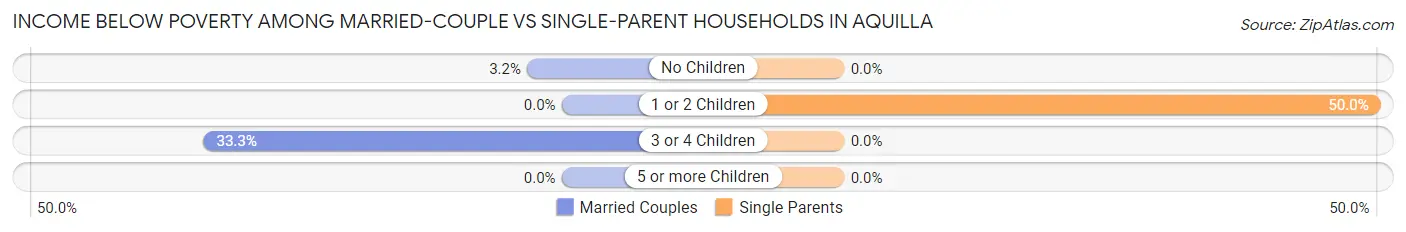
| Children | Married-Couple Families | Single-Parent Households |
| No Children | 1 (3.2%) | 0 (0.0%) |
| 1 or 2 Children | 0 (0.0%) | 6 (50.0%) |
| 3 or 4 Children | 3 (33.3%) | 0 (0.0%) |
| 5 or more Children | 0 (0.0%) | 0 (0.0%) |
| Total | 4 (6.9%) | 6 (30.0%) |
Race in Aquilla
The most populous races in Aquilla are White / Caucasian (261 | 98.1%), Two or more Races (4 | 1.5%), and Hispanic or Latino (1 | 0.4%).
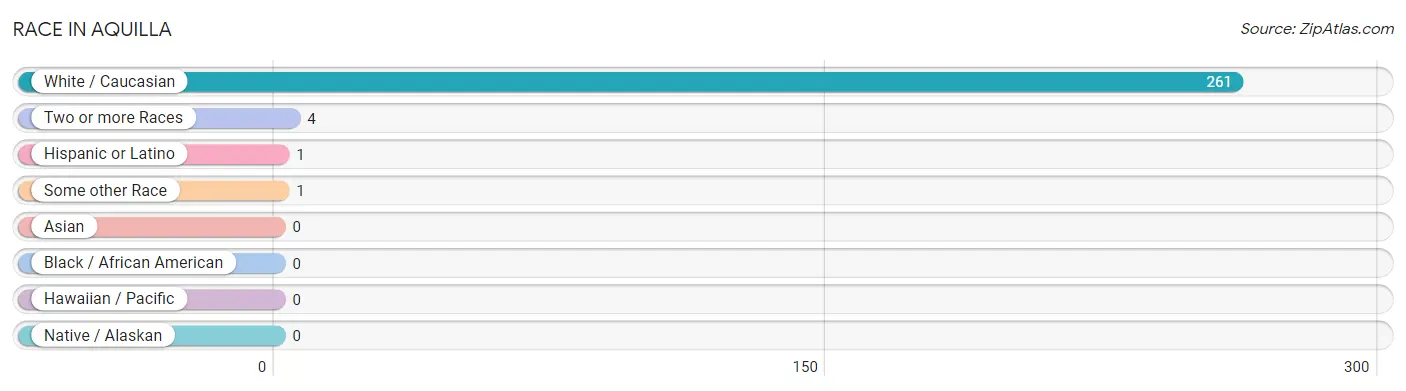
| Race | # Population | % Population |
| Asian | 0 | 0.0% |
| Black / African American | 0 | 0.0% |
| Hawaiian / Pacific | 0 | 0.0% |
| Hispanic or Latino | 1 | 0.4% |
| Native / Alaskan | 0 | 0.0% |
| White / Caucasian | 261 | 98.1% |
| Two or more Races | 4 | 1.5% |
| Some other Race | 1 | 0.4% |
| Total | 266 | 100.0% |
Ancestry in Aquilla
The most populous ancestries reported in Aquilla are German (65 | 24.4%), Italian (50 | 18.8%), English (45 | 16.9%), Irish (26 | 9.8%), and American (24 | 9.0%), together accounting for 79.0% of all Aquilla residents.
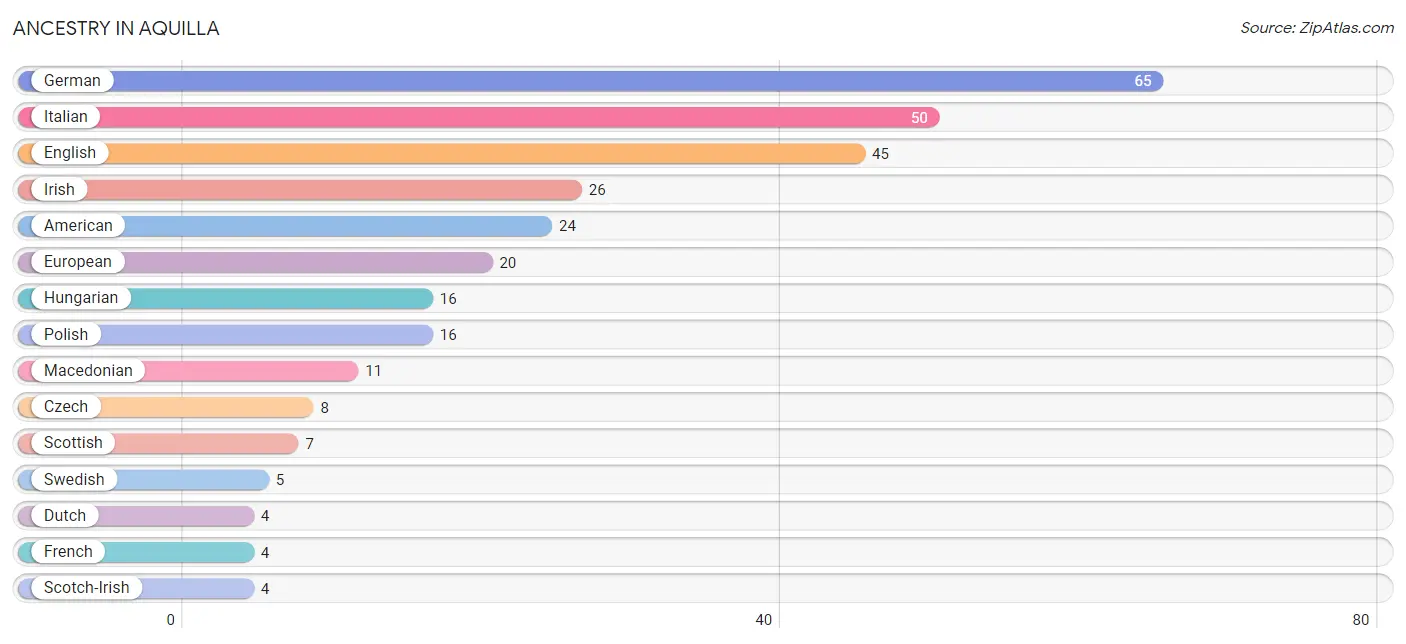
| Ancestry | # Population | % Population |
| American | 24 | 9.0% |
| Croatian | 3 | 1.1% |
| Czech | 8 | 3.0% |
| Czechoslovakian | 1 | 0.4% |
| Danish | 3 | 1.1% |
| Dutch | 4 | 1.5% |
| English | 45 | 16.9% |
| European | 20 | 7.5% |
| Finnish | 1 | 0.4% |
| French | 4 | 1.5% |
| German | 65 | 24.4% |
| Greek | 1 | 0.4% |
| Hungarian | 16 | 6.0% |
| Irish | 26 | 9.8% |
| Italian | 50 | 18.8% |
| Korean | 3 | 1.1% |
| Macedonian | 11 | 4.1% |
| Mexican | 1 | 0.4% |
| Polish | 16 | 6.0% |
| Scotch-Irish | 4 | 1.5% |
| Scottish | 7 | 2.6% |
| Swedish | 5 | 1.9% |
| Welsh | 3 | 1.1% | View All 23 Rows |
Immigrants in Aquilla
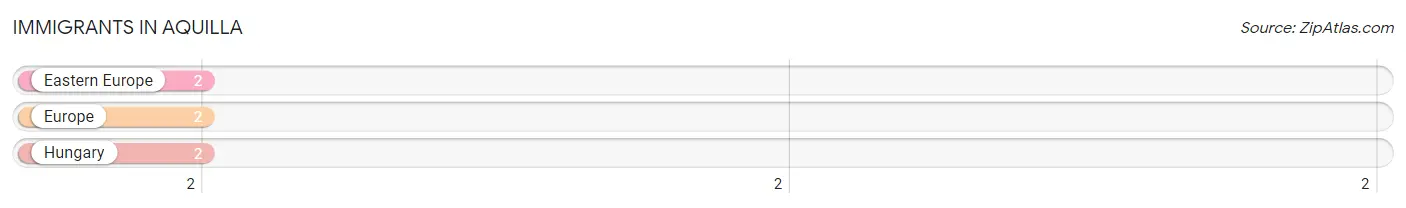
The most numerous immigrant groups reported in Aquilla came from Eastern Europe (2 | 0.7%), Europe (2 | 0.7%), and Hungary (2 | 0.7%), together accounting for 2.2% of all Aquilla residents.
| Immigration Origin | # Population | % Population |
| Eastern Europe | 2 | 0.7% |
| Europe | 2 | 0.7% |
| Hungary | 2 | 0.7% | View All 3 Rows |
Sex and Age in Aquilla
Sex and Age in Aquilla
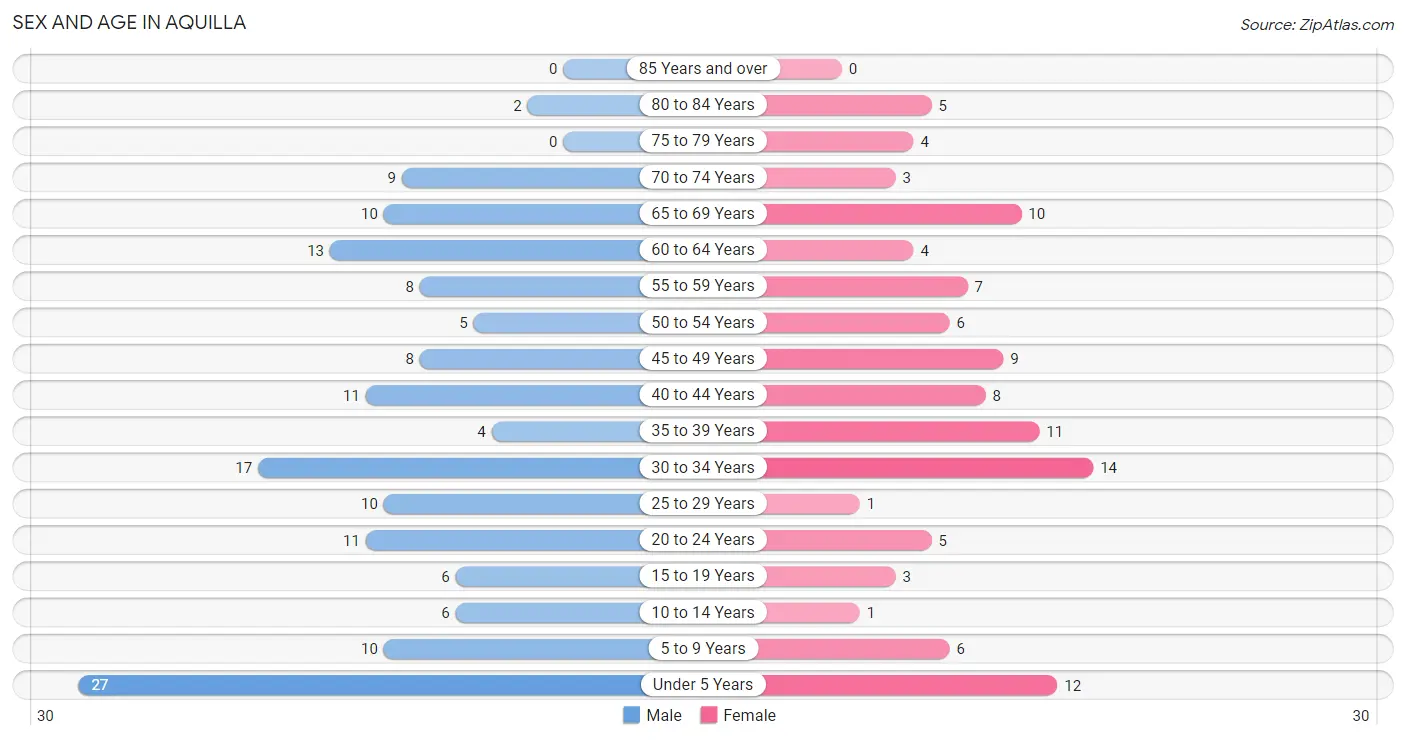
The most populous age groups in Aquilla are Under 5 Years (27 | 17.2%) for men and 30 to 34 Years (14 | 12.8%) for women.
| Age Bracket | Male | Female |
| Under 5 Years | 27 (17.2%) | 12 (11.0%) |
| 5 to 9 Years | 10 (6.4%) | 6 (5.5%) |
| 10 to 14 Years | 6 (3.8%) | 1 (0.9%) |
| 15 to 19 Years | 6 (3.8%) | 3 (2.8%) |
| 20 to 24 Years | 11 (7.0%) | 5 (4.6%) |
| 25 to 29 Years | 10 (6.4%) | 1 (0.9%) |
| 30 to 34 Years | 17 (10.8%) | 14 (12.8%) |
| 35 to 39 Years | 4 (2.5%) | 11 (10.1%) |
| 40 to 44 Years | 11 (7.0%) | 8 (7.3%) |
| 45 to 49 Years | 8 (5.1%) | 9 (8.3%) |
| 50 to 54 Years | 5 (3.2%) | 6 (5.5%) |
| 55 to 59 Years | 8 (5.1%) | 7 (6.4%) |
| 60 to 64 Years | 13 (8.3%) | 4 (3.7%) |
| 65 to 69 Years | 10 (6.4%) | 10 (9.2%) |
| 70 to 74 Years | 9 (5.7%) | 3 (2.8%) |
| 75 to 79 Years | 0 (0.0%) | 4 (3.7%) |
| 80 to 84 Years | 2 (1.3%) | 5 (4.6%) |
| 85 Years and over | 0 (0.0%) | 0 (0.0%) |
| Total | 157 (100.0%) | 109 (100.0%) |
Families and Households in Aquilla
Median Family Size in Aquilla
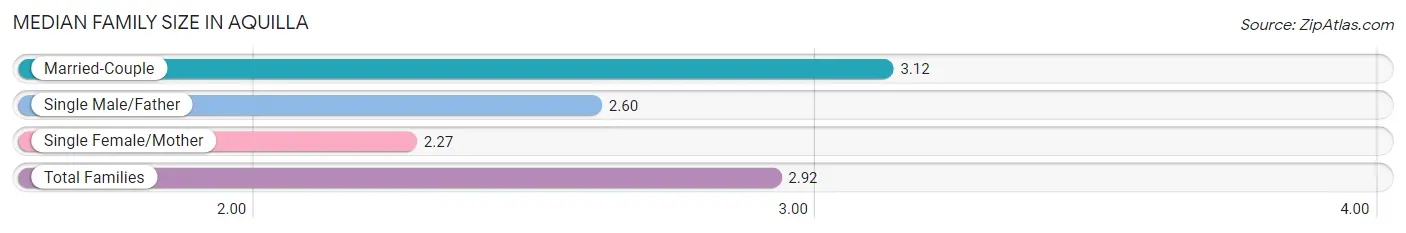
The median family size in Aquilla is 2.92 persons per family, with married-couple families (58 | 74.4%) accounting for the largest median family size of 3.12 persons per family. On the other hand, single female/mother families (15 | 19.2%) represent the smallest median family size with 2.27 persons per family.
| Family Type | # Families | Family Size |
| Married-Couple | 58 (74.4%) | 3.12 |
| Single Male/Father | 5 (6.4%) | 2.60 |
| Single Female/Mother | 15 (19.2%) | 2.27 |
| Total Families | 78 (100.0%) | 2.92 |
Median Household Size in Aquilla
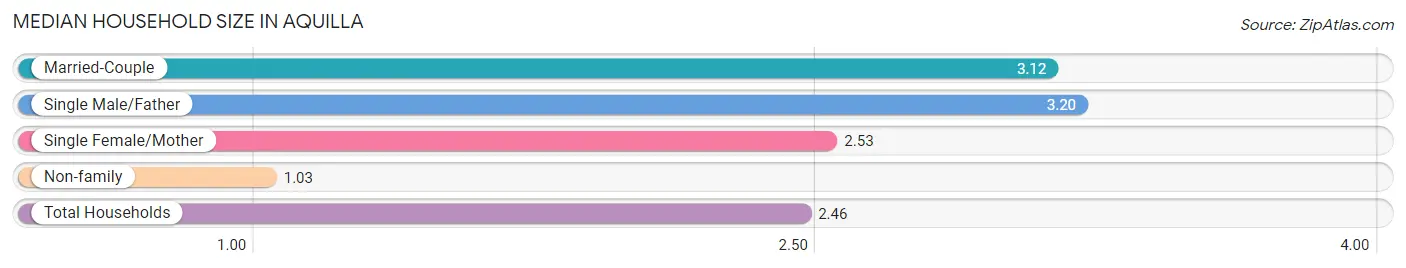
The median household size in Aquilla is 2.46 persons per household, with single male/father households (5 | 4.6%) accounting for the largest median household size of 3.2 persons per household. non-family households (30 | 27.8%) represent the smallest median household size with 1.03 persons per household.
| Household Type | # Households | Household Size |
| Married-Couple | 58 (53.7%) | 3.12 |
| Single Male/Father | 5 (4.6%) | 3.20 |
| Single Female/Mother | 15 (13.9%) | 2.53 |
| Non-family | 30 (27.8%) | 1.03 |
| Total Households | 108 (100.0%) | 2.46 |
Household Size by Marriage Status in Aquilla
Out of a total of 108 households in Aquilla, 78 (72.2%) are family households, while 30 (27.8%) are nonfamily households. The most numerous type of family households are 2-person households, comprising 31, and the most common type of nonfamily households are 1-person households, comprising 29.
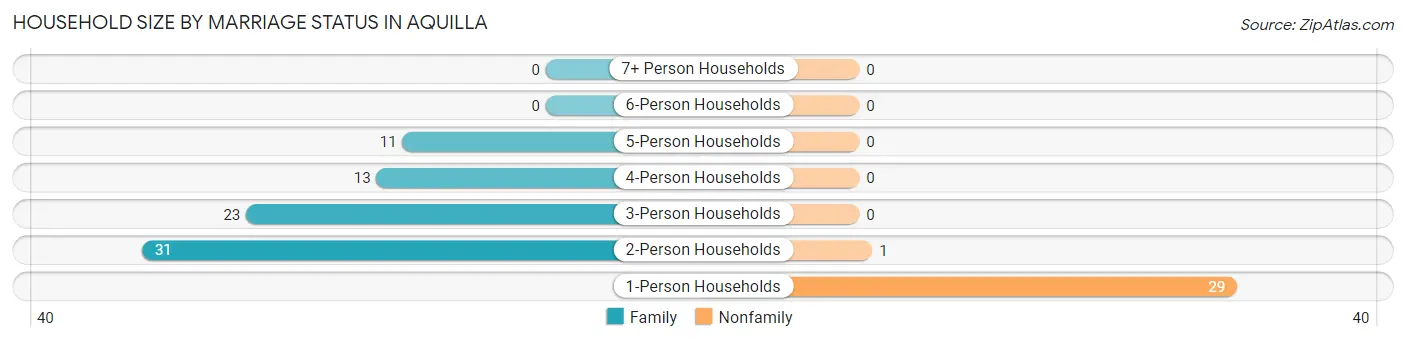
| Household Size | Family Households | Nonfamily Households |
| 1-Person Households | - | 29 (26.9%) |
| 2-Person Households | 31 (28.7%) | 1 (0.9%) |
| 3-Person Households | 23 (21.3%) | 0 (0.0%) |
| 4-Person Households | 13 (12.0%) | 0 (0.0%) |
| 5-Person Households | 11 (10.2%) | 0 (0.0%) |
| 6-Person Households | 0 (0.0%) | 0 (0.0%) |
| 7+ Person Households | 0 (0.0%) | 0 (0.0%) |
| Total | 78 (72.2%) | 30 (27.8%) |
Female Fertility in Aquilla
Fertility by Age in Aquilla
Average fertility rate in Aquilla is 173.0 births per 1,000 women. Women in the age bracket of 35 to 50 years have the highest fertility rate with 207.0 births per 1,000 women. Women in the age bracket of 35 to 50 years acount for 66.7% of all women with births.
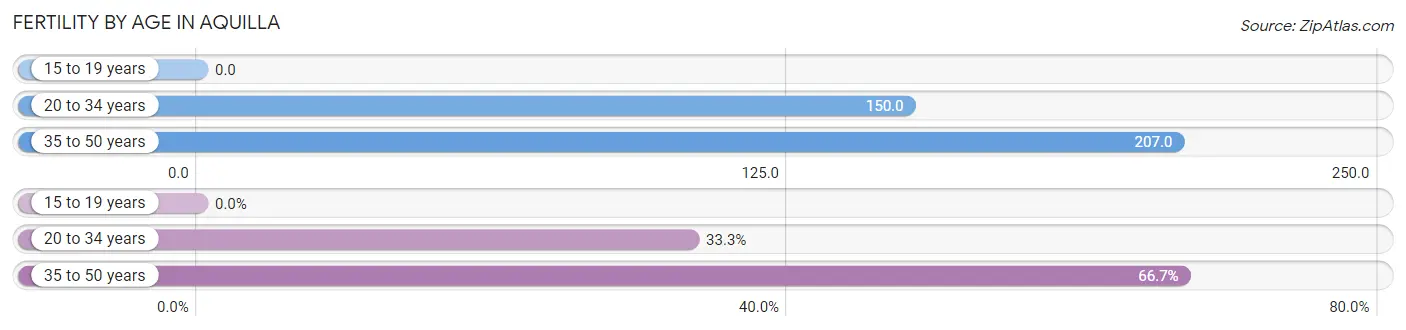
| Age Bracket | Women with Births | Births / 1,000 Women |
| 15 to 19 years | 0 (0.0%) | 0.0 |
| 20 to 34 years | 3 (33.3%) | 150.0 |
| 35 to 50 years | 6 (66.7%) | 207.0 |
| Total | 9 (100.0%) | 173.0 |
Fertility by Age by Marriage Status in Aquilla
55.6% of women with births (9) in Aquilla are married. The highest percentage of unmarried women with births falls into 35 to 50 years age bracket with 66.7% of them unmarried at the time of birth, while the lowest percentage of unmarried women with births belong to 20 to 34 years age bracket with 0.0% of them unmarried.
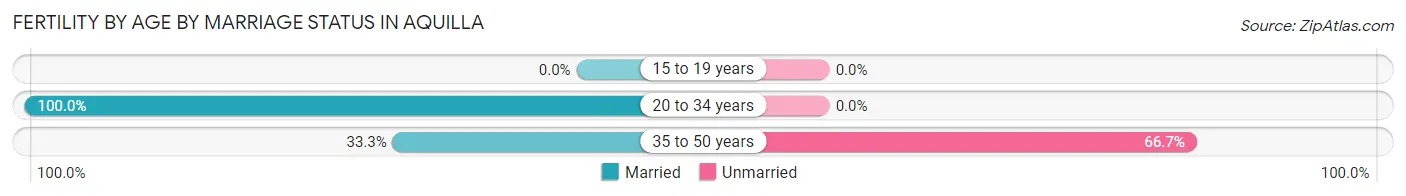
| Age Bracket | Married | Unmarried |
| 15 to 19 years | 0 (0.0%) | 0 (0.0%) |
| 20 to 34 years | 3 (100.0%) | 0 (0.0%) |
| 35 to 50 years | 2 (33.3%) | 4 (66.7%) |
| Total | 5 (55.6%) | 4 (44.4%) |
Fertility by Education in Aquilla
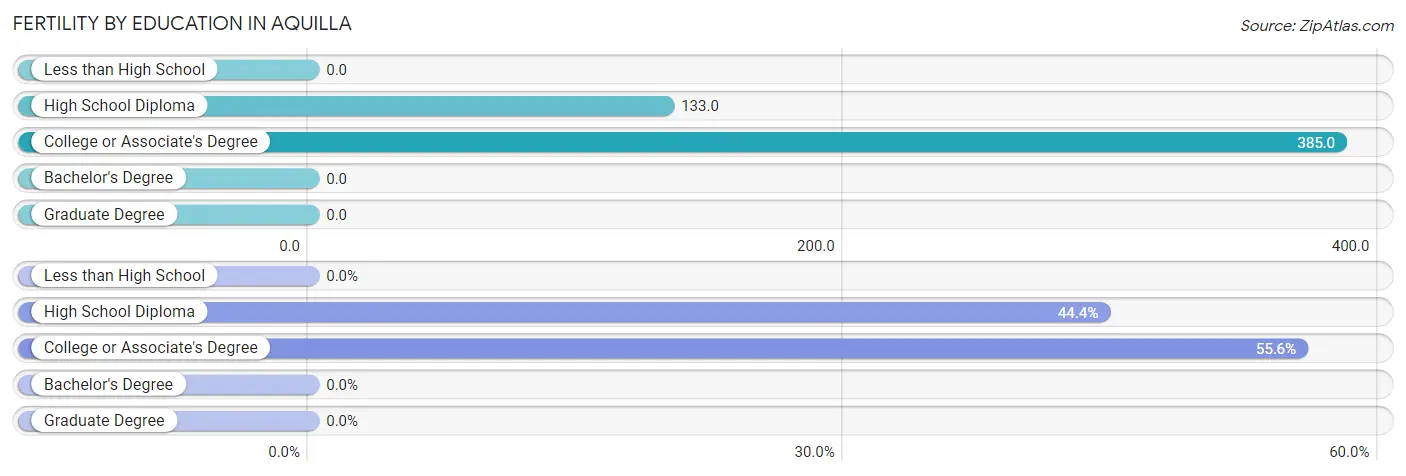
| Educational Attainment | Women with Births | Births / 1,000 Women |
| Less than High School | 0 (0.0%) | 0.0 |
| High School Diploma | 4 (44.4%) | 133.0 |
| College or Associate's Degree | 5 (55.6%) | 385.0 |
| Bachelor's Degree | 0 (0.0%) | 0.0 |
| Graduate Degree | 0 (0.0%) | 0.0 |
| Total | 9 (100.0%) | 173.0 |
Fertility by Education by Marriage Status in Aquilla
44.4% of women with births in Aquilla are unmarried. Women with the educational attainment of college or associate's degree are most likely to be married with 60.0% of them married at childbirth, while women with the educational attainment of high school diploma are least likely to be married with 50.0% of them unmarried at childbirth.
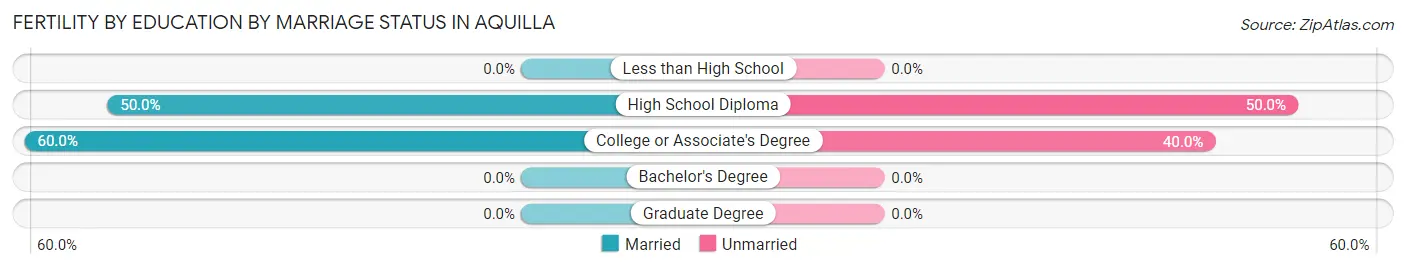
| Educational Attainment | Married | Unmarried |
| Less than High School | 0 (0.0%) | 0 (0.0%) |
| High School Diploma | 2 (50.0%) | 2 (50.0%) |
| College or Associate's Degree | 3 (60.0%) | 2 (40.0%) |
| Bachelor's Degree | 0 (0.0%) | 0 (0.0%) |
| Graduate Degree | 0 (0.0%) | 0 (0.0%) |
| Total | 5 (55.6%) | 4 (44.4%) |
Employment Characteristics in Aquilla
Employment by Class of Employer in Aquilla
Among the 115 employed individuals in Aquilla, private company employees (94 | 81.7%), not-for-profit organizations (6 | 5.2%), and self-employed (not incorporated) (5 | 4.3%) make up the most common classes of employment.
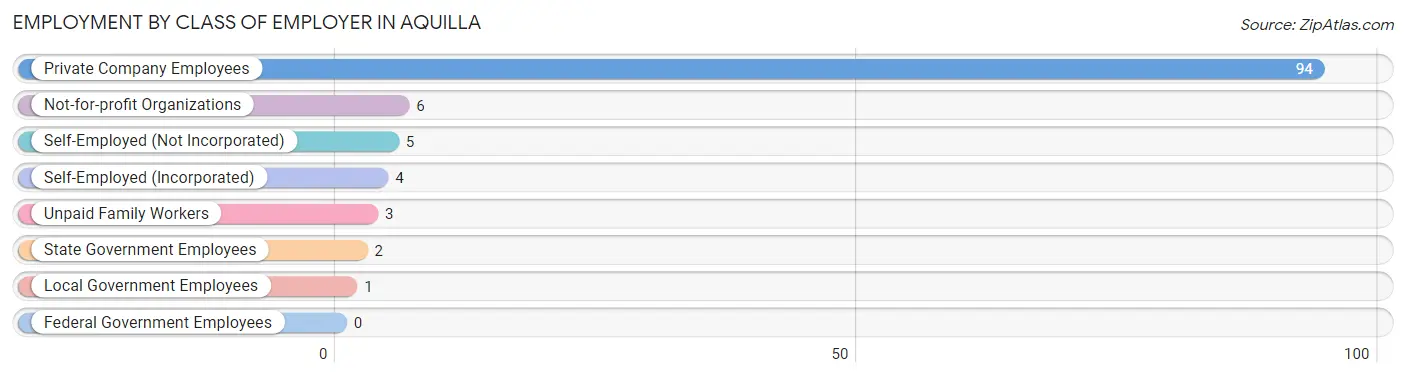
| Employer Class | # Employees | % Employees |
| Private Company Employees | 94 | 81.7% |
| Self-Employed (Incorporated) | 4 | 3.5% |
| Self-Employed (Not Incorporated) | 5 | 4.3% |
| Not-for-profit Organizations | 6 | 5.2% |
| Local Government Employees | 1 | 0.9% |
| State Government Employees | 2 | 1.7% |
| Federal Government Employees | 0 | 0.0% |
| Unpaid Family Workers | 3 | 2.6% |
| Total | 115 | 100.0% |
Employment Status by Age in Aquilla
According to the labor force statistics for Aquilla, out of the total population over 16 years of age (201), 64.7% or 130 individuals are in the labor force, with 7.7% or 10 of them unemployed. The age group with the highest labor force participation rate is 20 to 24 years, with 100.0% or 16 individuals in the labor force. Within the labor force, the 25 to 29 years age range has the highest percentage of unemployed individuals, with 62.5% or 5 of them being unemployed.
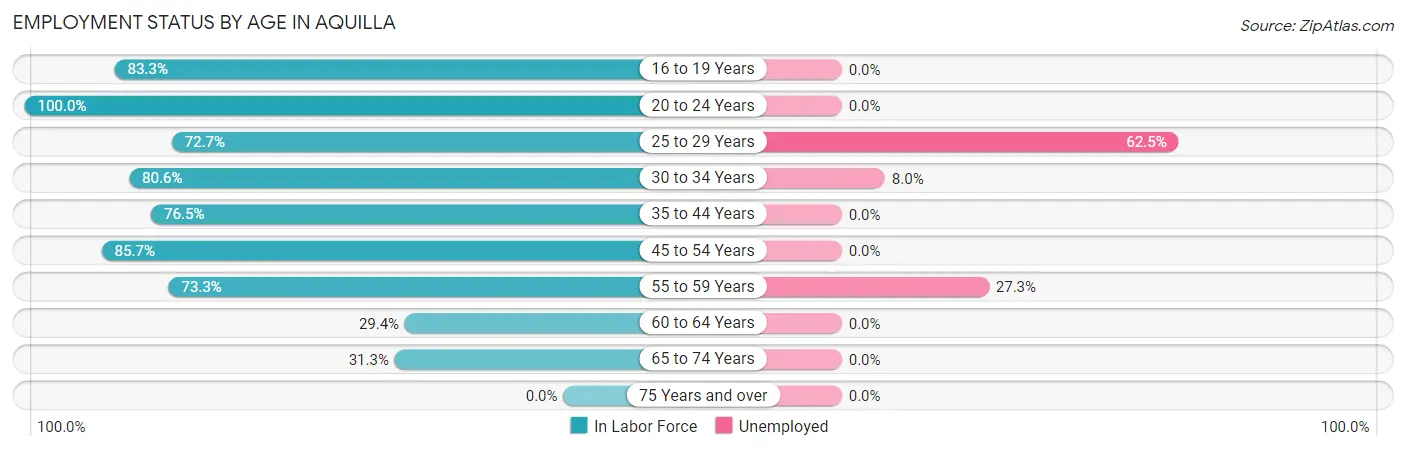
| Age Bracket | In Labor Force | Unemployed |
| 16 to 19 Years | 5 (83.3%) | 0 (0.0%) |
| 20 to 24 Years | 16 (100.0%) | 0 (0.0%) |
| 25 to 29 Years | 8 (72.7%) | 5 (62.5%) |
| 30 to 34 Years | 25 (80.6%) | 2 (8.0%) |
| 35 to 44 Years | 26 (76.5%) | 0 (0.0%) |
| 45 to 54 Years | 24 (85.7%) | 0 (0.0%) |
| 55 to 59 Years | 11 (73.3%) | 3 (27.3%) |
| 60 to 64 Years | 5 (29.4%) | 0 (0.0%) |
| 65 to 74 Years | 10 (31.3%) | 0 (0.0%) |
| 75 Years and over | 0 (0.0%) | 0 (0.0%) |
| Total | 130 (64.7%) | 10 (7.7%) |
Employment Status by Educational Attainment in Aquilla
According to labor force statistics for Aquilla, 72.8% of individuals (99) out of the total population between 25 and 64 years of age (136) are in the labor force, with 10.1% or 10 of them being unemployed. The group with the highest labor force participation rate are those with the educational attainment of bachelor's degree or higher, with 100.0% or 16 individuals in the labor force. Within the labor force, individuals with bachelor's degree or higher education have the highest percentage of unemployment, with 18.8% or 3 of them being unemployed.
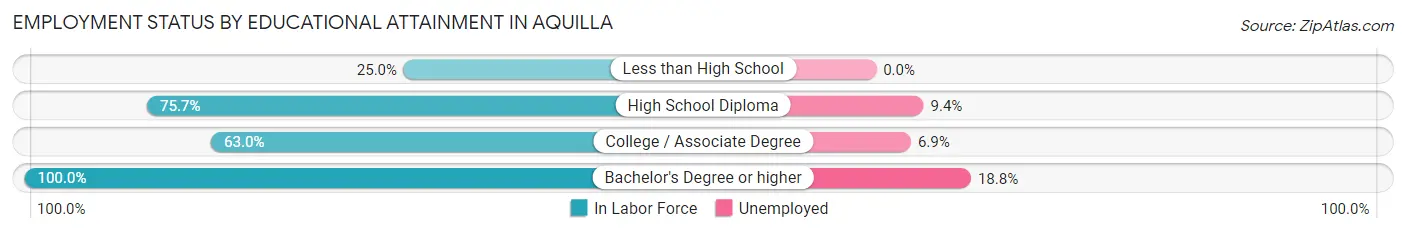
| Educational Attainment | In Labor Force | Unemployed |
| Less than High School | 1 (25.0%) | 0 (0.0%) |
| High School Diploma | 53 (75.7%) | 7 (9.4%) |
| College / Associate Degree | 29 (63.0%) | 3 (6.9%) |
| Bachelor's Degree or higher | 16 (100.0%) | 3 (18.8%) |
| Total | 99 (72.8%) | 14 (10.1%) |
Employment Occupations by Sex in Aquilla
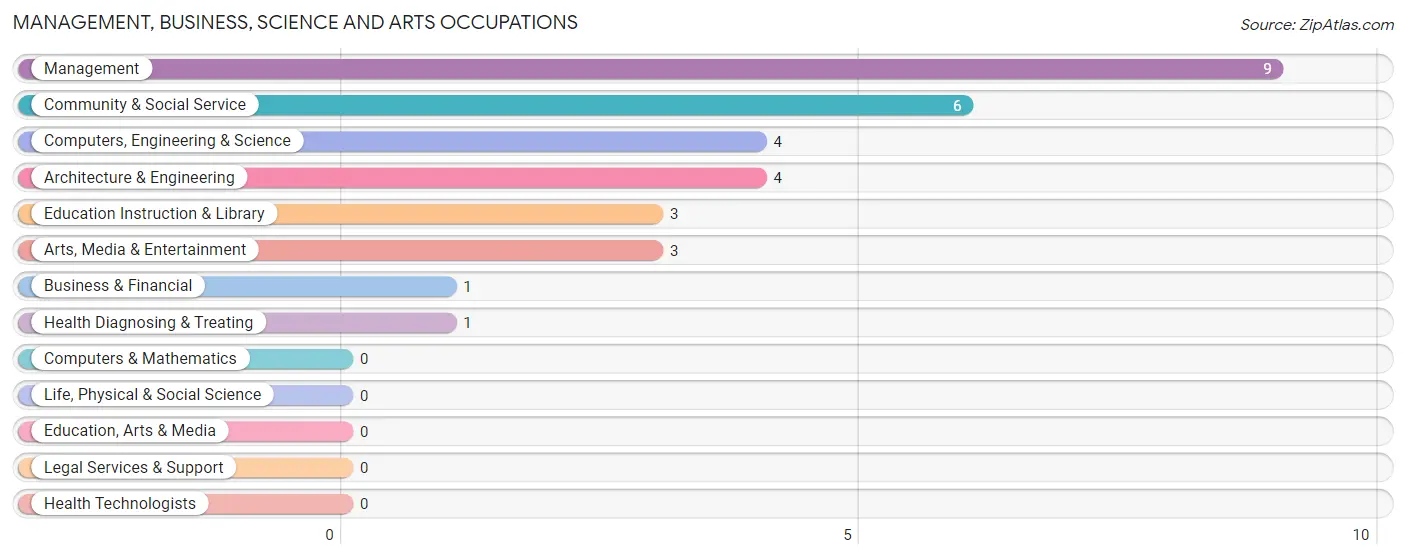
Management, Business, Science and Arts Occupations
The most common Management, Business, Science and Arts occupations in Aquilla are Management (9 | 7.5%), Community & Social Service (6 | 5.0%), Computers, Engineering & Science (4 | 3.3%), Architecture & Engineering (4 | 3.3%), and Education Instruction & Library (3 | 2.5%).
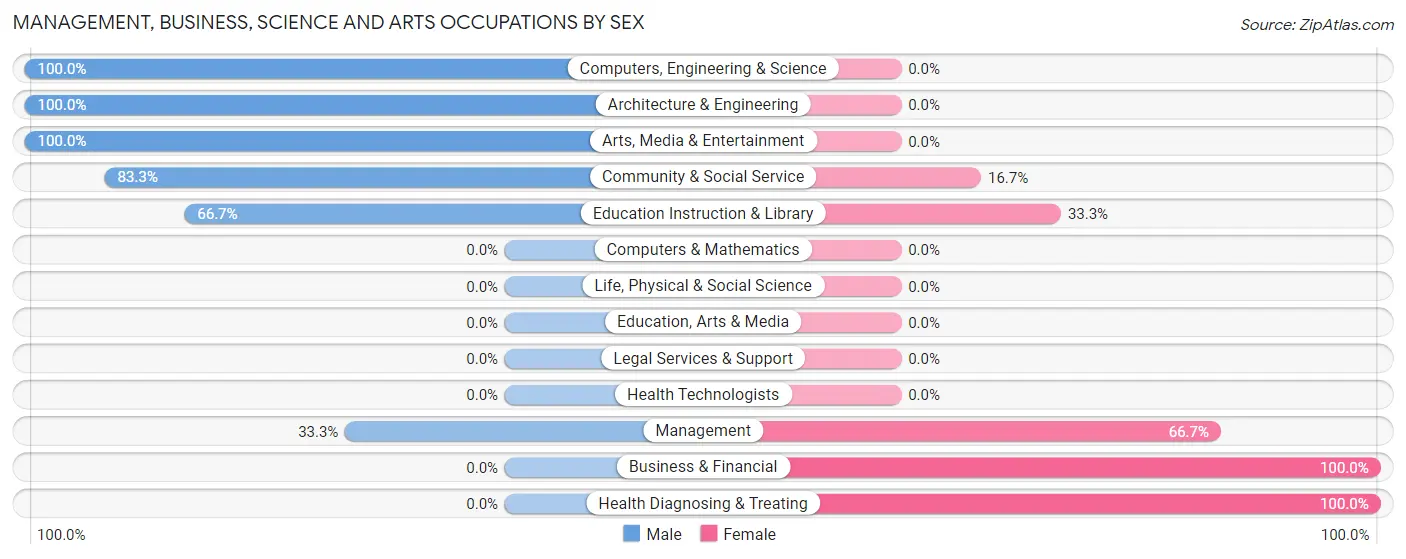
Management, Business, Science and Arts Occupations by Sex
Within the Management, Business, Science and Arts occupations in Aquilla, the most male-oriented occupations are Computers, Engineering & Science (100.0%), Architecture & Engineering (100.0%), and Arts, Media & Entertainment (100.0%), while the most female-oriented occupations are Business & Financial (100.0%), Health Diagnosing & Treating (100.0%), and Management (66.7%).
| Occupation | Male | Female |
| Management | 3 (33.3%) | 6 (66.7%) |
| Business & Financial | 0 (0.0%) | 1 (100.0%) |
| Computers, Engineering & Science | 4 (100.0%) | 0 (0.0%) |
| Computers & Mathematics | 0 (0.0%) | 0 (0.0%) |
| Architecture & Engineering | 4 (100.0%) | 0 (0.0%) |
| Life, Physical & Social Science | 0 (0.0%) | 0 (0.0%) |
| Community & Social Service | 5 (83.3%) | 1 (16.7%) |
| Education, Arts & Media | 0 (0.0%) | 0 (0.0%) |
| Legal Services & Support | 0 (0.0%) | 0 (0.0%) |
| Education Instruction & Library | 2 (66.7%) | 1 (33.3%) |
| Arts, Media & Entertainment | 3 (100.0%) | 0 (0.0%) |
| Health Diagnosing & Treating | 0 (0.0%) | 1 (100.0%) |
| Health Technologists | 0 (0.0%) | 0 (0.0%) |
| Total (Category) | 12 (57.1%) | 9 (42.9%) |
| Total (Overall) | 76 (63.3%) | 44 (36.7%) |
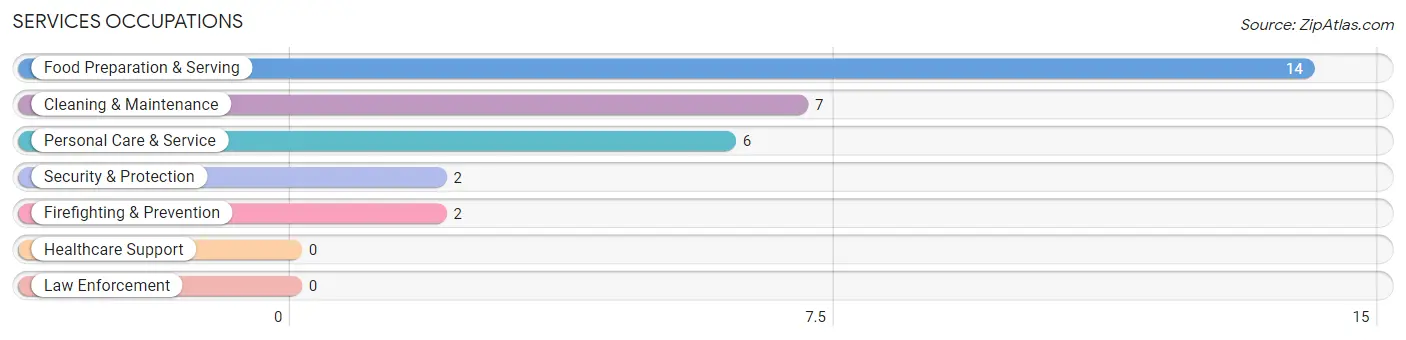
Services Occupations
The most common Services occupations in Aquilla are Food Preparation & Serving (14 | 11.7%), Cleaning & Maintenance (7 | 5.8%), Personal Care & Service (6 | 5.0%), Security & Protection (2 | 1.7%), and Firefighting & Prevention (2 | 1.7%).
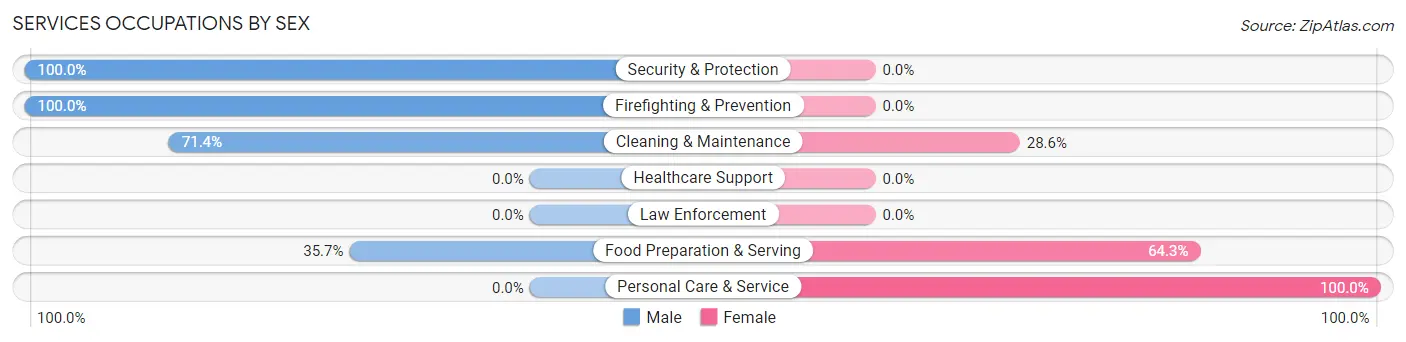
Services Occupations by Sex
Within the Services occupations in Aquilla, the most male-oriented occupations are Security & Protection (100.0%), Firefighting & Prevention (100.0%), and Cleaning & Maintenance (71.4%), while the most female-oriented occupations are Personal Care & Service (100.0%), Food Preparation & Serving (64.3%), and Cleaning & Maintenance (28.6%).
| Occupation | Male | Female |
| Healthcare Support | 0 (0.0%) | 0 (0.0%) |
| Security & Protection | 2 (100.0%) | 0 (0.0%) |
| Firefighting & Prevention | 2 (100.0%) | 0 (0.0%) |
| Law Enforcement | 0 (0.0%) | 0 (0.0%) |
| Food Preparation & Serving | 5 (35.7%) | 9 (64.3%) |
| Cleaning & Maintenance | 5 (71.4%) | 2 (28.6%) |
| Personal Care & Service | 0 (0.0%) | 6 (100.0%) |
| Total (Category) | 12 (41.4%) | 17 (58.6%) |
| Total (Overall) | 76 (63.3%) | 44 (36.7%) |
Sales and Office Occupations
The most common Sales and Office occupations in Aquilla are Office & Administration (14 | 11.7%), and Sales & Related (11 | 9.2%).

Sales and Office Occupations by Sex

| Occupation | Male | Female |
| Sales & Related | 7 (63.6%) | 4 (36.4%) |
| Office & Administration | 5 (35.7%) | 9 (64.3%) |
| Total (Category) | 12 (48.0%) | 13 (52.0%) |
| Total (Overall) | 76 (63.3%) | 44 (36.7%) |
Natural Resources, Construction and Maintenance Occupations
The most common Natural Resources, Construction and Maintenance occupations in Aquilla are Construction & Extraction (9 | 7.5%), and Installation, Maintenance & Repair (1 | 0.8%).
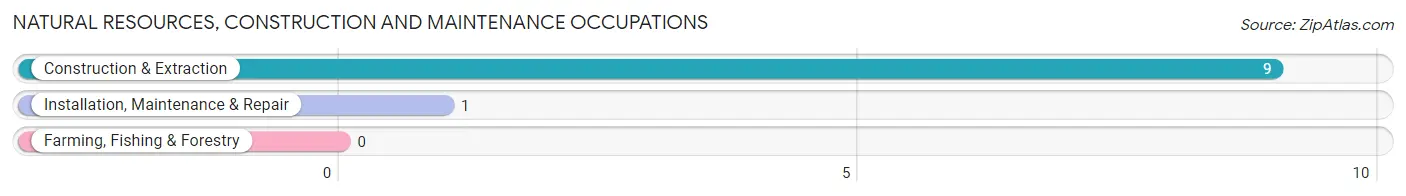
Natural Resources, Construction and Maintenance Occupations by Sex
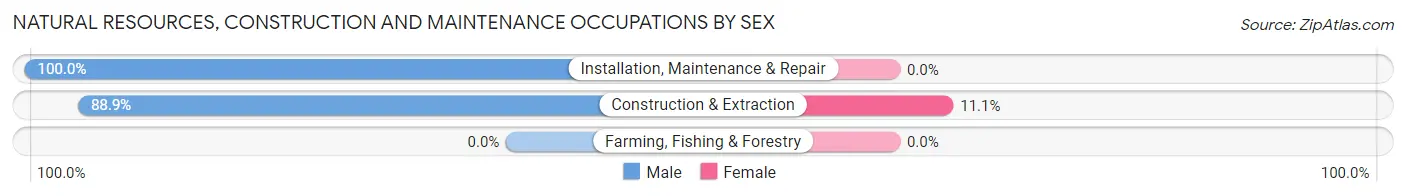
| Occupation | Male | Female |
| Farming, Fishing & Forestry | 0 (0.0%) | 0 (0.0%) |
| Construction & Extraction | 8 (88.9%) | 1 (11.1%) |
| Installation, Maintenance & Repair | 1 (100.0%) | 0 (0.0%) |
| Total (Category) | 9 (90.0%) | 1 (10.0%) |
| Total (Overall) | 76 (63.3%) | 44 (36.7%) |
Production, Transportation and Moving Occupations
The most common Production, Transportation and Moving occupations in Aquilla are Production (25 | 20.8%), Transportation (7 | 5.8%), and Material Moving (3 | 2.5%).
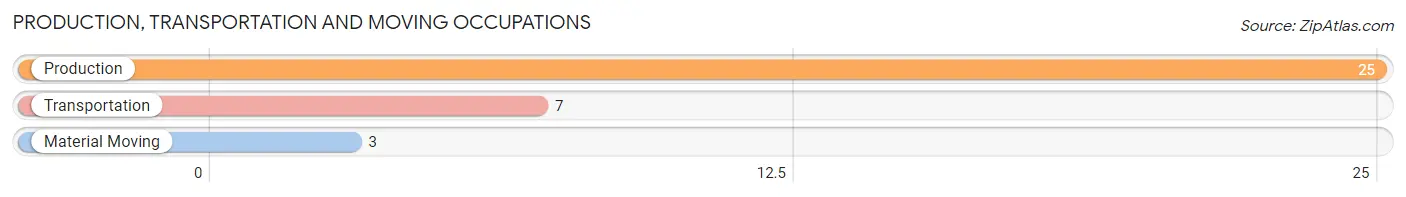
Production, Transportation and Moving Occupations by Sex
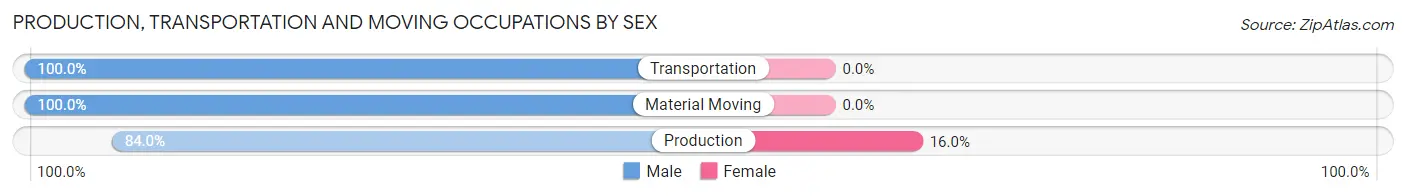
| Occupation | Male | Female |
| Production | 21 (84.0%) | 4 (16.0%) |
| Transportation | 7 (100.0%) | 0 (0.0%) |
| Material Moving | 3 (100.0%) | 0 (0.0%) |
| Total (Category) | 31 (88.6%) | 4 (11.4%) |
| Total (Overall) | 76 (63.3%) | 44 (36.7%) |
Employment Industries by Sex in Aquilla
Employment Industries in Aquilla
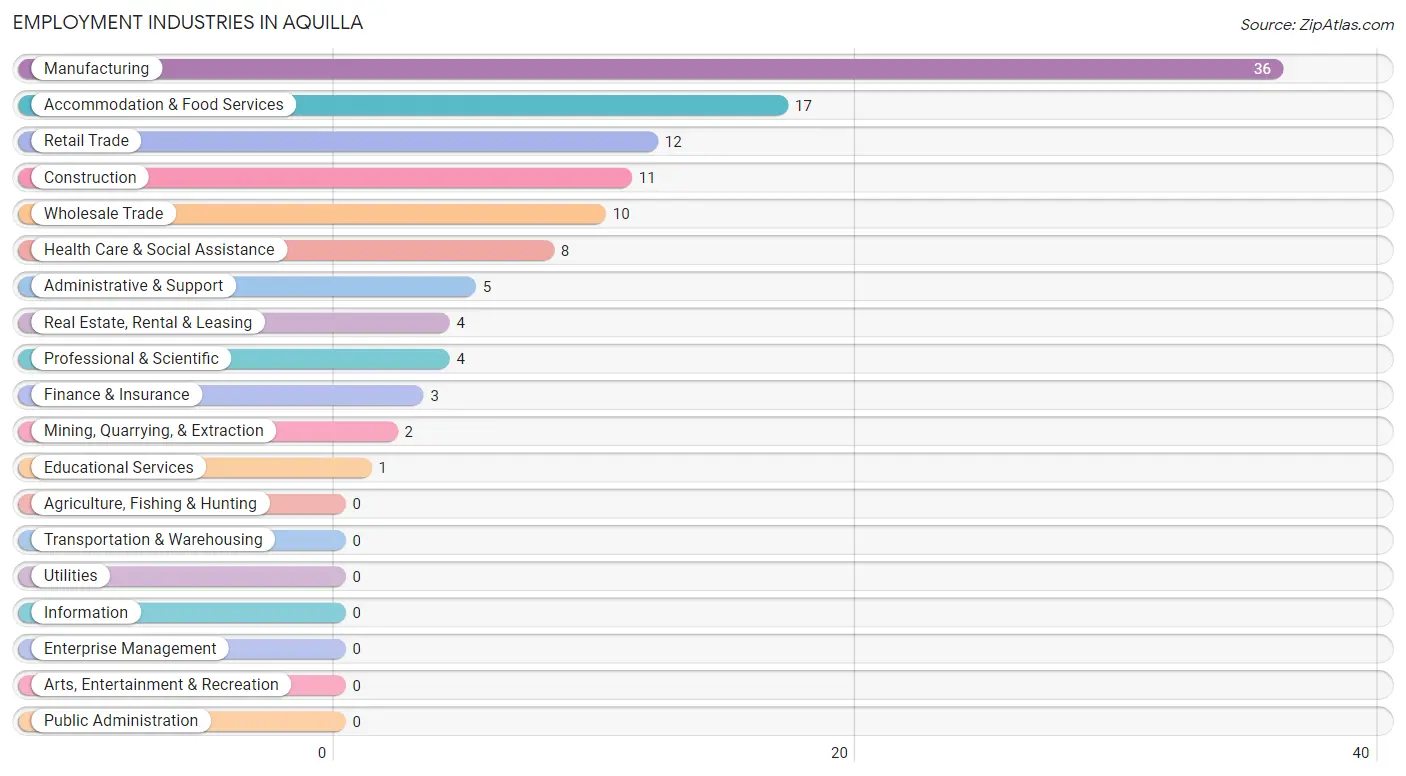
The major employment industries in Aquilla include Manufacturing (36 | 30.0%), Accommodation & Food Services (17 | 14.2%), Retail Trade (12 | 10.0%), Construction (11 | 9.2%), and Wholesale Trade (10 | 8.3%).
Employment Industries by Sex in Aquilla
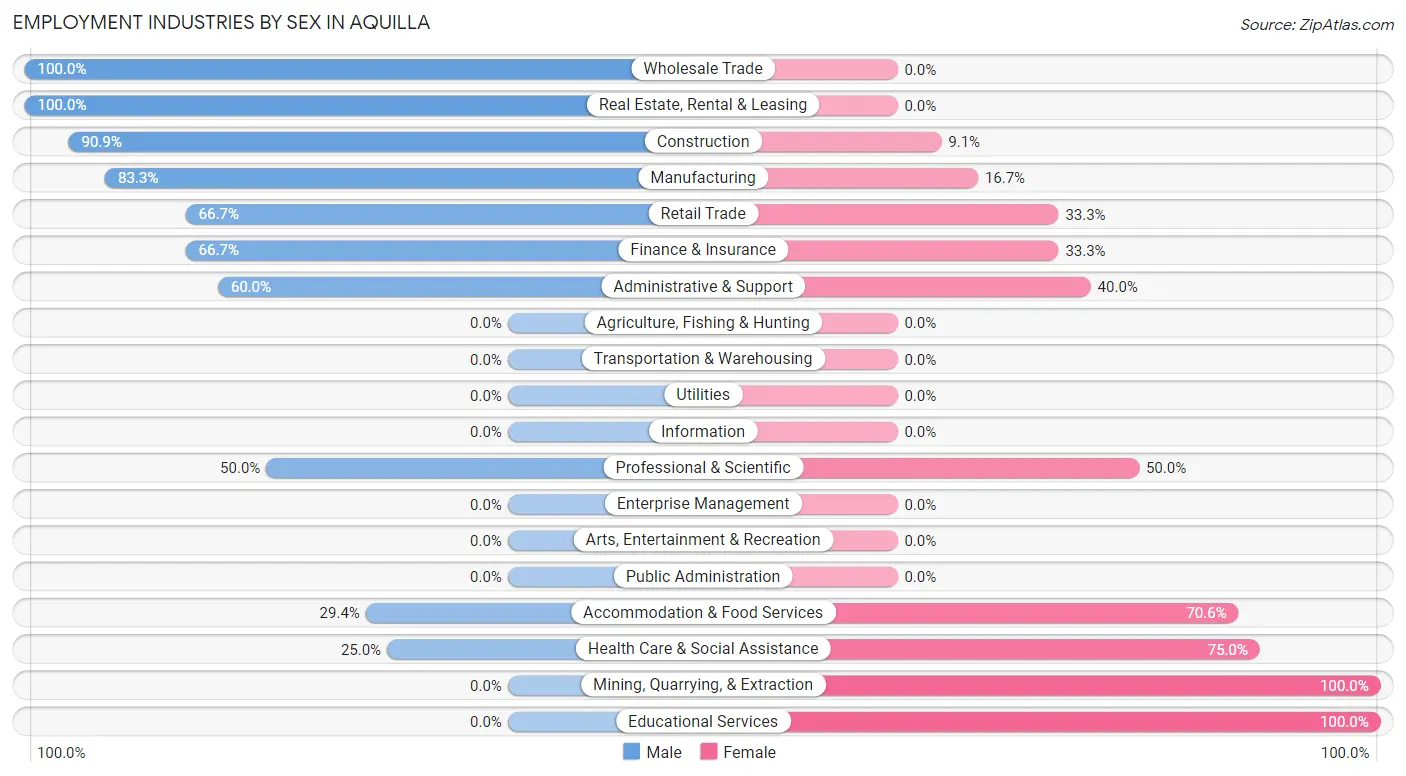
The Aquilla industries that see more men than women are Wholesale Trade (100.0%), Real Estate, Rental & Leasing (100.0%), and Construction (90.9%), whereas the industries that tend to have a higher number of women are Mining, Quarrying, & Extraction (100.0%), Educational Services (100.0%), and Health Care & Social Assistance (75.0%).
| Industry | Male | Female |
| Agriculture, Fishing & Hunting | 0 (0.0%) | 0 (0.0%) |
| Mining, Quarrying, & Extraction | 0 (0.0%) | 2 (100.0%) |
| Construction | 10 (90.9%) | 1 (9.1%) |
| Manufacturing | 30 (83.3%) | 6 (16.7%) |
| Wholesale Trade | 10 (100.0%) | 0 (0.0%) |
| Retail Trade | 8 (66.7%) | 4 (33.3%) |
| Transportation & Warehousing | 0 (0.0%) | 0 (0.0%) |
| Utilities | 0 (0.0%) | 0 (0.0%) |
| Information | 0 (0.0%) | 0 (0.0%) |
| Finance & Insurance | 2 (66.7%) | 1 (33.3%) |
| Real Estate, Rental & Leasing | 4 (100.0%) | 0 (0.0%) |
| Professional & Scientific | 2 (50.0%) | 2 (50.0%) |
| Enterprise Management | 0 (0.0%) | 0 (0.0%) |
| Administrative & Support | 3 (60.0%) | 2 (40.0%) |
| Educational Services | 0 (0.0%) | 1 (100.0%) |
| Health Care & Social Assistance | 2 (25.0%) | 6 (75.0%) |
| Arts, Entertainment & Recreation | 0 (0.0%) | 0 (0.0%) |
| Accommodation & Food Services | 5 (29.4%) | 12 (70.6%) |
| Public Administration | 0 (0.0%) | 0 (0.0%) |
| Total | 76 (63.3%) | 44 (36.7%) |
Education in Aquilla
School Enrollment in Aquilla
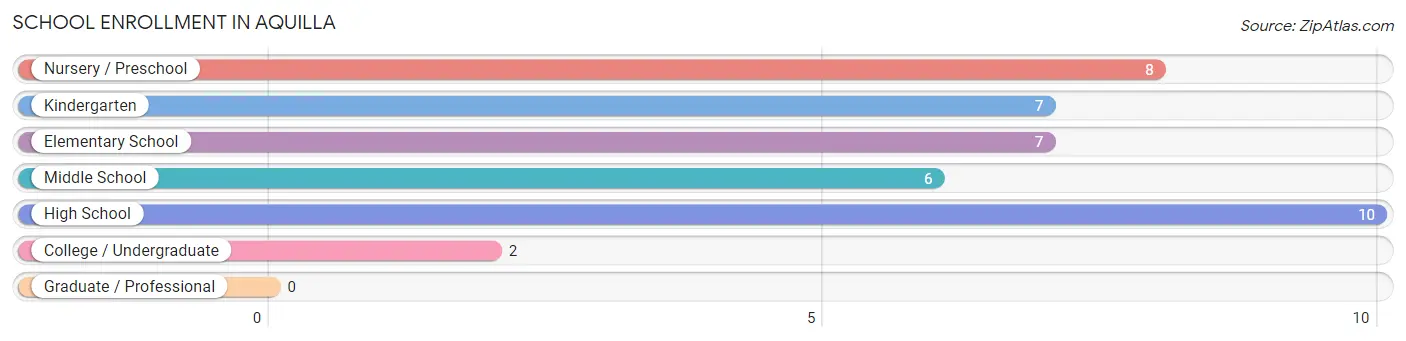
The most common levels of schooling among the 40 students in Aquilla are high school (10 | 25.0%), nursery / preschool (8 | 20.0%), and kindergarten (7 | 17.5%).
| School Level | # Students | % Students |
| Nursery / Preschool | 8 | 20.0% |
| Kindergarten | 7 | 17.5% |
| Elementary School | 7 | 17.5% |
| Middle School | 6 | 15.0% |
| High School | 10 | 25.0% |
| College / Undergraduate | 2 | 5.0% |
| Graduate / Professional | 0 | 0.0% |
| Total | 40 | 100.0% |
School Enrollment by Age by Funding Source in Aquilla
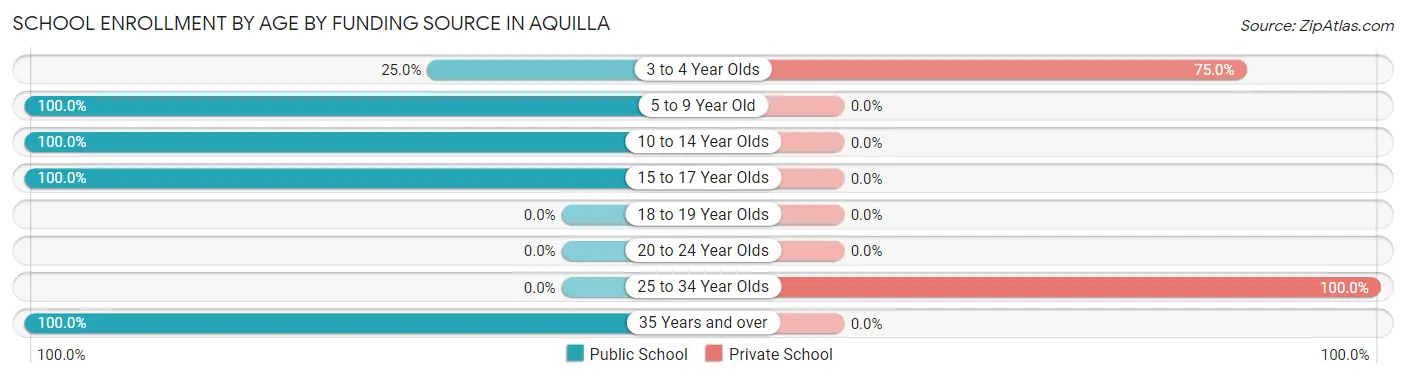
Out of a total of 40 students who are enrolled in schools in Aquilla, 7 (17.5%) attend a private institution, while the remaining 33 (82.5%) are enrolled in public schools. The age group of 25 to 34 year olds has the highest likelihood of being enrolled in private schools, with 1 (100.0% in the age bracket) enrolled. Conversely, the age group of 5 to 9 year old has the lowest likelihood of being enrolled in a private school, with 14 (100.0% in the age bracket) attending a public institution.
| Age Bracket | Public School | Private School |
| 3 to 4 Year Olds | 2 (25.0%) | 6 (75.0%) |
| 5 to 9 Year Old | 14 (100.0%) | 0 (0.0%) |
| 10 to 14 Year Olds | 6 (100.0%) | 0 (0.0%) |
| 15 to 17 Year Olds | 9 (100.0%) | 0 (0.0%) |
| 18 to 19 Year Olds | 0 (0.0%) | 0 (0.0%) |
| 20 to 24 Year Olds | 0 (0.0%) | 0 (0.0%) |
| 25 to 34 Year Olds | 0 (0.0%) | 1 (100.0%) |
| 35 Years and over | 2 (100.0%) | 0 (0.0%) |
| Total | 33 (82.5%) | 7 (17.5%) |
Educational Attainment by Field of Study in Aquilla
Education (10 | 33.3%), physical & health sciences (5 | 16.7%), business (4 | 13.3%), social sciences (3 | 10.0%), and engineering (3 | 10.0%) are the most common fields of study among 30 individuals in Aquilla who have obtained a bachelor's degree or higher.

| Field of Study | # Graduates | % Graduates |
| Computers & Mathematics | 2 | 6.7% |
| Bio, Nature & Agricultural | 0 | 0.0% |
| Physical & Health Sciences | 5 | 16.7% |
| Psychology | 0 | 0.0% |
| Social Sciences | 3 | 10.0% |
| Engineering | 3 | 10.0% |
| Multidisciplinary Studies | 0 | 0.0% |
| Science & Technology | 0 | 0.0% |
| Business | 4 | 13.3% |
| Education | 10 | 33.3% |
| Literature & Languages | 1 | 3.3% |
| Liberal Arts & History | 1 | 3.3% |
| Visual & Performing Arts | 1 | 3.3% |
| Communications | 0 | 0.0% |
| Arts & Humanities | 0 | 0.0% |
| Total | 30 | 100.0% |
Transportation & Commute in Aquilla
Vehicle Availability by Sex in Aquilla
The most prevalent vehicle ownership categories in Aquilla are males with 2 vehicles (26, accounting for 35.6%) and females with 2 vehicles (10, making up 61.9%).
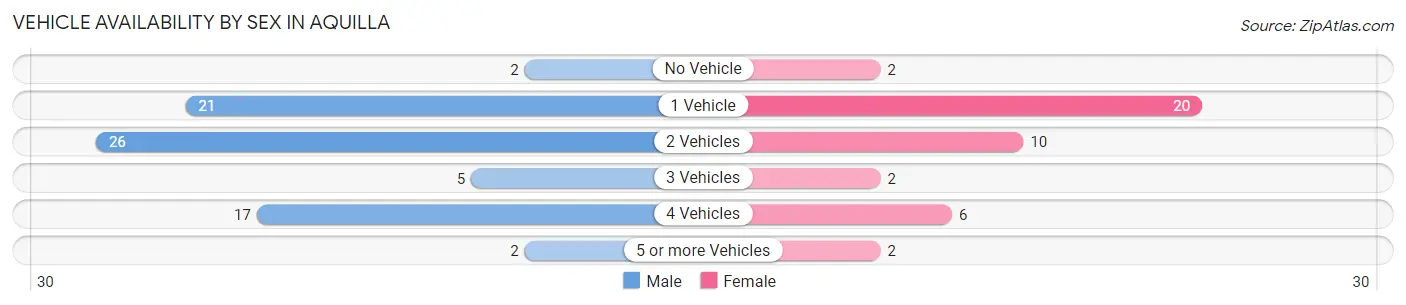
| Vehicles Available | Male | Female |
| No Vehicle | 2 (2.7%) | 2 (4.8%) |
| 1 Vehicle | 21 (28.8%) | 20 (47.6%) |
| 2 Vehicles | 26 (35.6%) | 10 (23.8%) |
| 3 Vehicles | 5 (6.9%) | 2 (4.8%) |
| 4 Vehicles | 17 (23.3%) | 6 (14.3%) |
| 5 or more Vehicles | 2 (2.7%) | 2 (4.8%) |
| Total | 73 (100.0%) | 42 (100.0%) |
Commute Time in Aquilla
The most frequently occuring commute durations in Aquilla are 20 to 24 minutes (17 commuters, 15.3%), 15 to 19 minutes (16 commuters, 14.4%), and 10 to 14 minutes (14 commuters, 12.6%).
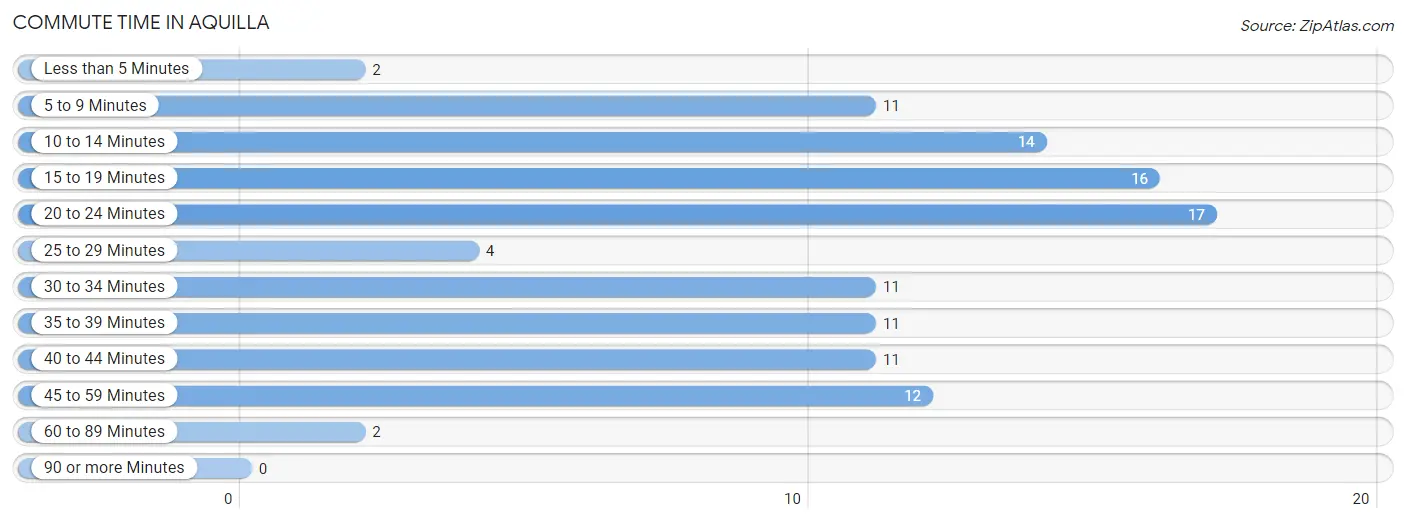
| Commute Time | # Commuters | % Commuters |
| Less than 5 Minutes | 2 | 1.8% |
| 5 to 9 Minutes | 11 | 9.9% |
| 10 to 14 Minutes | 14 | 12.6% |
| 15 to 19 Minutes | 16 | 14.4% |
| 20 to 24 Minutes | 17 | 15.3% |
| 25 to 29 Minutes | 4 | 3.6% |
| 30 to 34 Minutes | 11 | 9.9% |
| 35 to 39 Minutes | 11 | 9.9% |
| 40 to 44 Minutes | 11 | 9.9% |
| 45 to 59 Minutes | 12 | 10.8% |
| 60 to 89 Minutes | 2 | 1.8% |
| 90 or more Minutes | 0 | 0.0% |
Commute Time by Sex in Aquilla
The most common commute times in Aquilla are 10 to 14 minutes (11 commuters, 15.5%) for males and 20 to 24 minutes (11 commuters, 27.5%) for females.
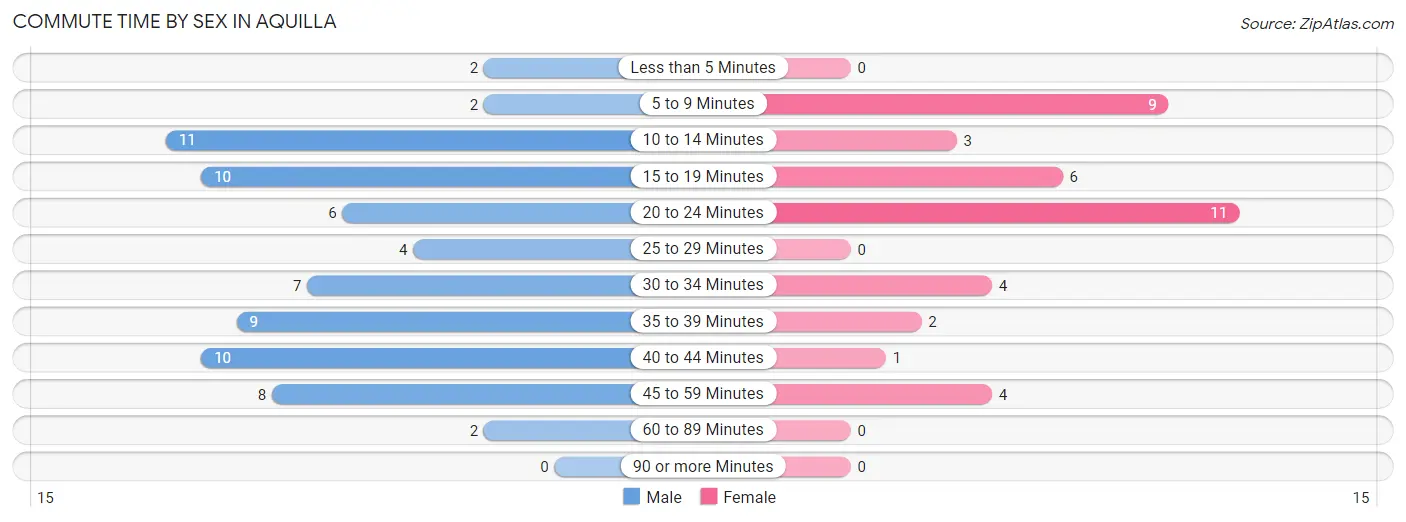
| Commute Time | Male | Female |
| Less than 5 Minutes | 2 (2.8%) | 0 (0.0%) |
| 5 to 9 Minutes | 2 (2.8%) | 9 (22.5%) |
| 10 to 14 Minutes | 11 (15.5%) | 3 (7.5%) |
| 15 to 19 Minutes | 10 (14.1%) | 6 (15.0%) |
| 20 to 24 Minutes | 6 (8.5%) | 11 (27.5%) |
| 25 to 29 Minutes | 4 (5.6%) | 0 (0.0%) |
| 30 to 34 Minutes | 7 (9.9%) | 4 (10.0%) |
| 35 to 39 Minutes | 9 (12.7%) | 2 (5.0%) |
| 40 to 44 Minutes | 10 (14.1%) | 1 (2.5%) |
| 45 to 59 Minutes | 8 (11.3%) | 4 (10.0%) |
| 60 to 89 Minutes | 2 (2.8%) | 0 (0.0%) |
| 90 or more Minutes | 0 (0.0%) | 0 (0.0%) |
Time of Departure to Work by Sex in Aquilla
The most frequent times of departure to work in Aquilla are 7:00 AM to 7:29 AM (13, 18.3%) for males and 8:30 AM to 8:59 AM (10, 25.0%) for females.
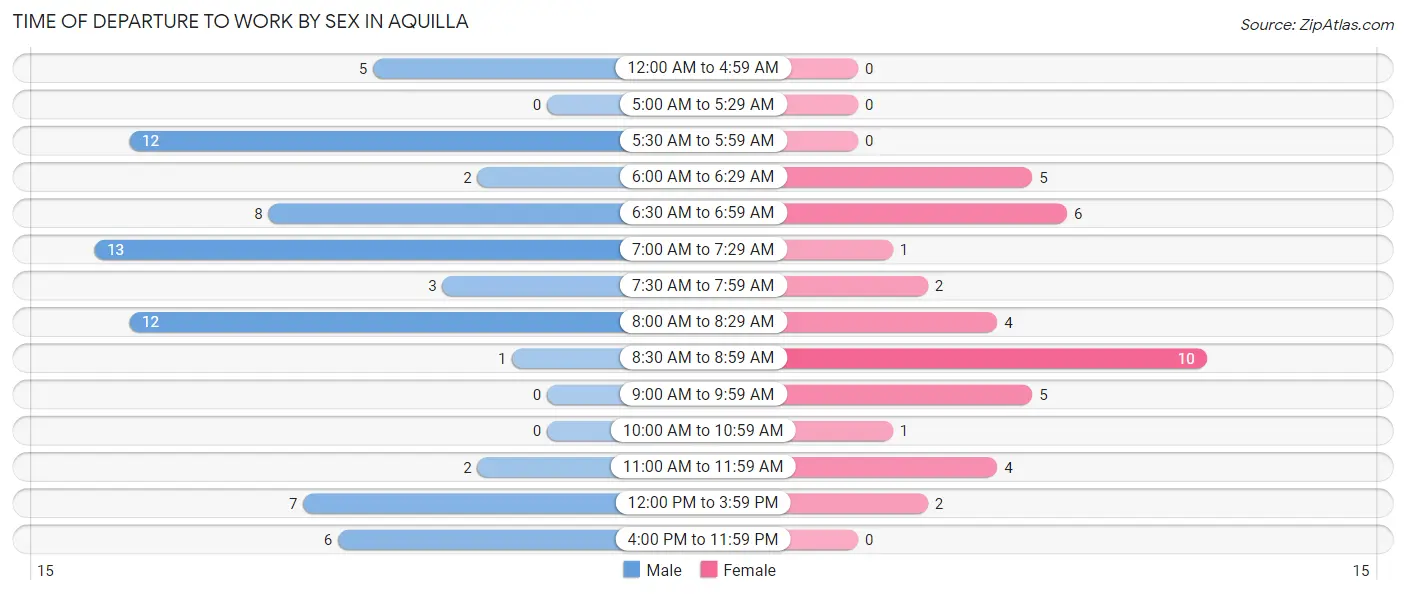
| Time of Departure | Male | Female |
| 12:00 AM to 4:59 AM | 5 (7.0%) | 0 (0.0%) |
| 5:00 AM to 5:29 AM | 0 (0.0%) | 0 (0.0%) |
| 5:30 AM to 5:59 AM | 12 (16.9%) | 0 (0.0%) |
| 6:00 AM to 6:29 AM | 2 (2.8%) | 5 (12.5%) |
| 6:30 AM to 6:59 AM | 8 (11.3%) | 6 (15.0%) |
| 7:00 AM to 7:29 AM | 13 (18.3%) | 1 (2.5%) |
| 7:30 AM to 7:59 AM | 3 (4.2%) | 2 (5.0%) |
| 8:00 AM to 8:29 AM | 12 (16.9%) | 4 (10.0%) |
| 8:30 AM to 8:59 AM | 1 (1.4%) | 10 (25.0%) |
| 9:00 AM to 9:59 AM | 0 (0.0%) | 5 (12.5%) |
| 10:00 AM to 10:59 AM | 0 (0.0%) | 1 (2.5%) |
| 11:00 AM to 11:59 AM | 2 (2.8%) | 4 (10.0%) |
| 12:00 PM to 3:59 PM | 7 (9.9%) | 2 (5.0%) |
| 4:00 PM to 11:59 PM | 6 (8.5%) | 0 (0.0%) |
| Total | 71 (100.0%) | 40 (100.0%) |
Housing Occupancy in Aquilla
Occupancy by Ownership in Aquilla
Of the total 108 dwellings in Aquilla, owner-occupied units account for 86 (79.6%), while renter-occupied units make up 22 (20.4%).
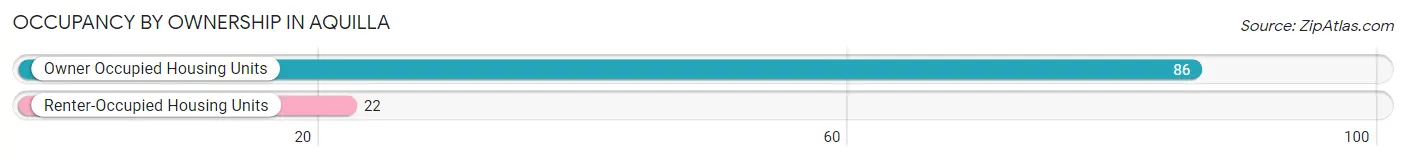
| Occupancy | # Housing Units | % Housing Units |
| Owner Occupied Housing Units | 86 | 79.6% |
| Renter-Occupied Housing Units | 22 | 20.4% |
| Total Occupied Housing Units | 108 | 100.0% |
Occupancy by Household Size in Aquilla
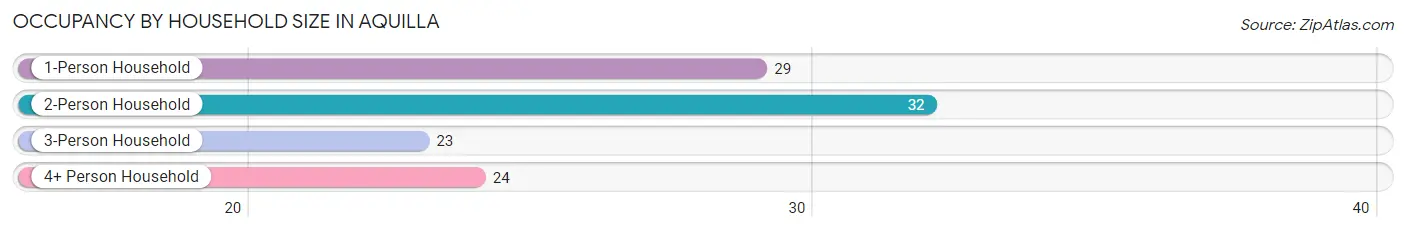
| Household Size | # Housing Units | % Housing Units |
| 1-Person Household | 29 | 26.9% |
| 2-Person Household | 32 | 29.6% |
| 3-Person Household | 23 | 21.3% |
| 4+ Person Household | 24 | 22.2% |
| Total Housing Units | 108 | 100.0% |
Occupancy by Ownership by Household Size in Aquilla
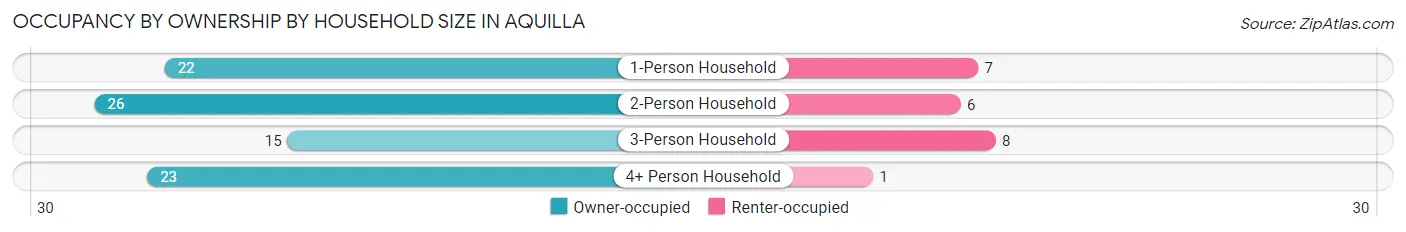
| Household Size | Owner-occupied | Renter-occupied |
| 1-Person Household | 22 (75.9%) | 7 (24.1%) |
| 2-Person Household | 26 (81.2%) | 6 (18.8%) |
| 3-Person Household | 15 (65.2%) | 8 (34.8%) |
| 4+ Person Household | 23 (95.8%) | 1 (4.2%) |
| Total Housing Units | 86 (79.6%) | 22 (20.4%) |
Occupancy by Educational Attainment in Aquilla
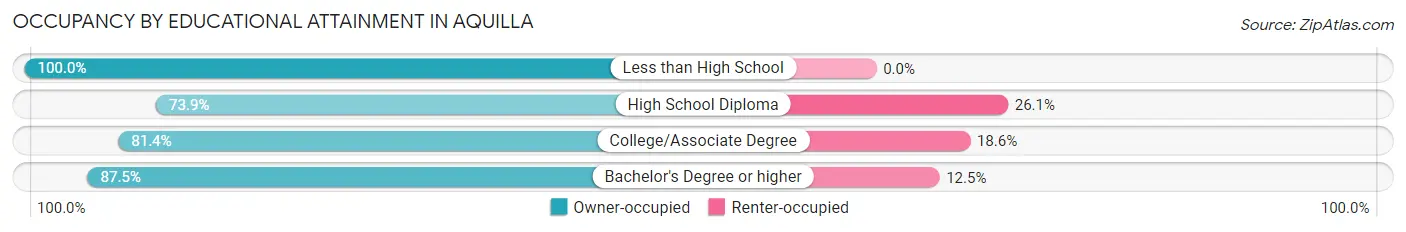
| Household Size | Owner-occupied | Renter-occupied |
| Less than High School | 3 (100.0%) | 0 (0.0%) |
| High School Diploma | 34 (73.9%) | 12 (26.1%) |
| College/Associate Degree | 35 (81.4%) | 8 (18.6%) |
| Bachelor's Degree or higher | 14 (87.5%) | 2 (12.5%) |
Occupancy by Age of Householder in Aquilla
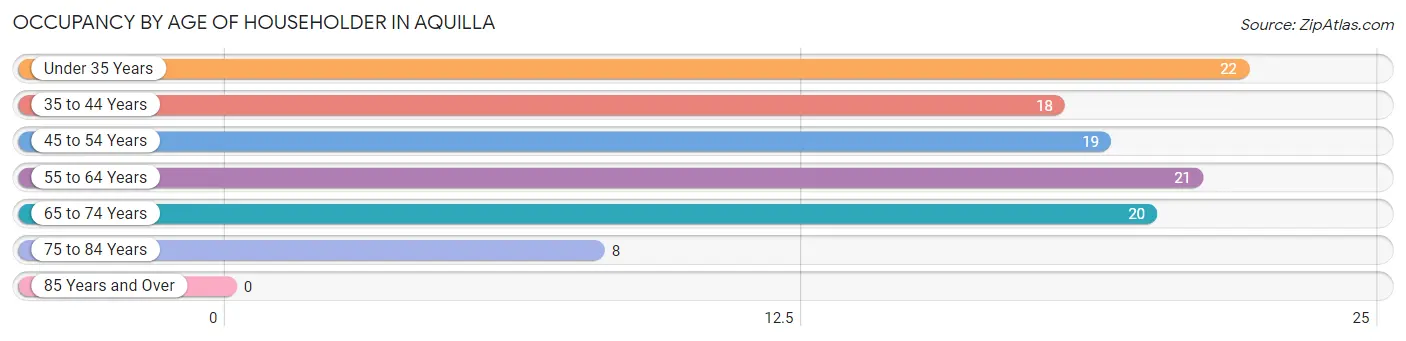
| Age Bracket | # Households | % Households |
| Under 35 Years | 22 | 20.4% |
| 35 to 44 Years | 18 | 16.7% |
| 45 to 54 Years | 19 | 17.6% |
| 55 to 64 Years | 21 | 19.4% |
| 65 to 74 Years | 20 | 18.5% |
| 75 to 84 Years | 8 | 7.4% |
| 85 Years and Over | 0 | 0.0% |
| Total | 108 | 100.0% |
Housing Finances in Aquilla
Median Income by Occupancy in Aquilla
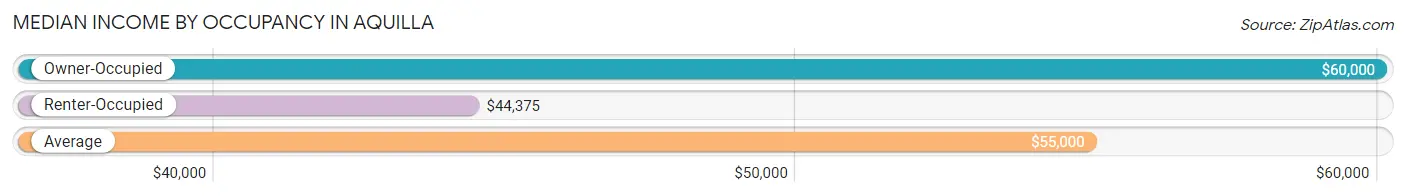
| Occupancy Type | # Households | Median Income |
| Owner-Occupied | 86 (79.6%) | $60,000 |
| Renter-Occupied | 22 (20.4%) | $44,375 |
| Average | 108 (100.0%) | $55,000 |
Occupancy by Householder Income Bracket in Aquilla
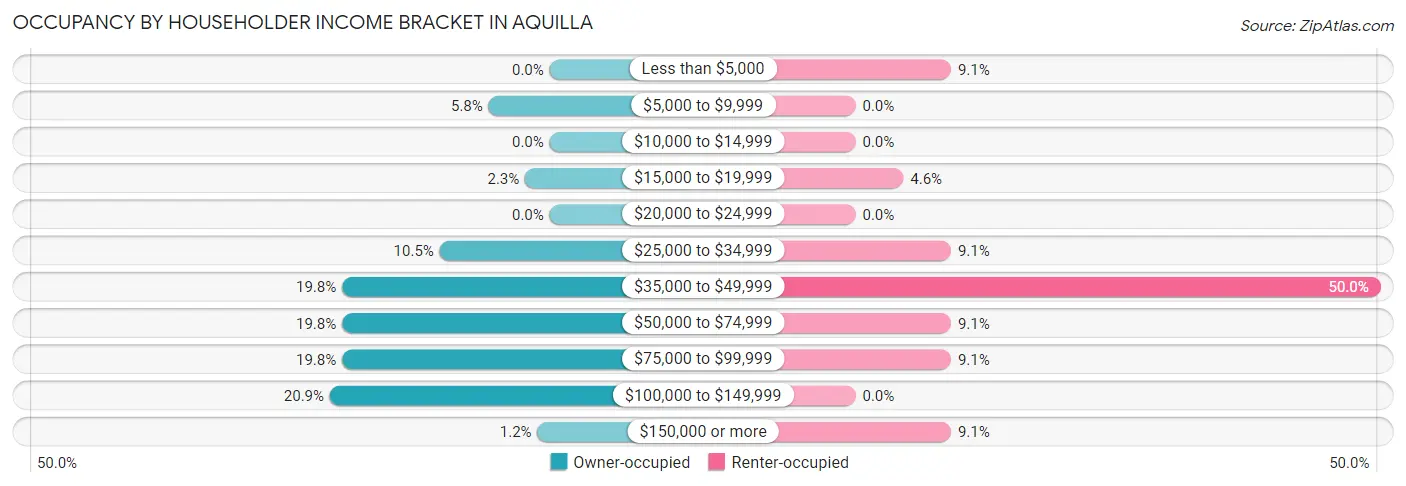
| Income Bracket | Owner-occupied | Renter-occupied |
| Less than $5,000 | 0 (0.0%) | 2 (9.1%) |
| $5,000 to $9,999 | 5 (5.8%) | 0 (0.0%) |
| $10,000 to $14,999 | 0 (0.0%) | 0 (0.0%) |
| $15,000 to $19,999 | 2 (2.3%) | 1 (4.5%) |
| $20,000 to $24,999 | 0 (0.0%) | 0 (0.0%) |
| $25,000 to $34,999 | 9 (10.5%) | 2 (9.1%) |
| $35,000 to $49,999 | 17 (19.8%) | 11 (50.0%) |
| $50,000 to $74,999 | 17 (19.8%) | 2 (9.1%) |
| $75,000 to $99,999 | 17 (19.8%) | 2 (9.1%) |
| $100,000 to $149,999 | 18 (20.9%) | 0 (0.0%) |
| $150,000 or more | 1 (1.2%) | 2 (9.1%) |
| Total | 86 (100.0%) | 22 (100.0%) |
Monthly Housing Cost Tiers in Aquilla
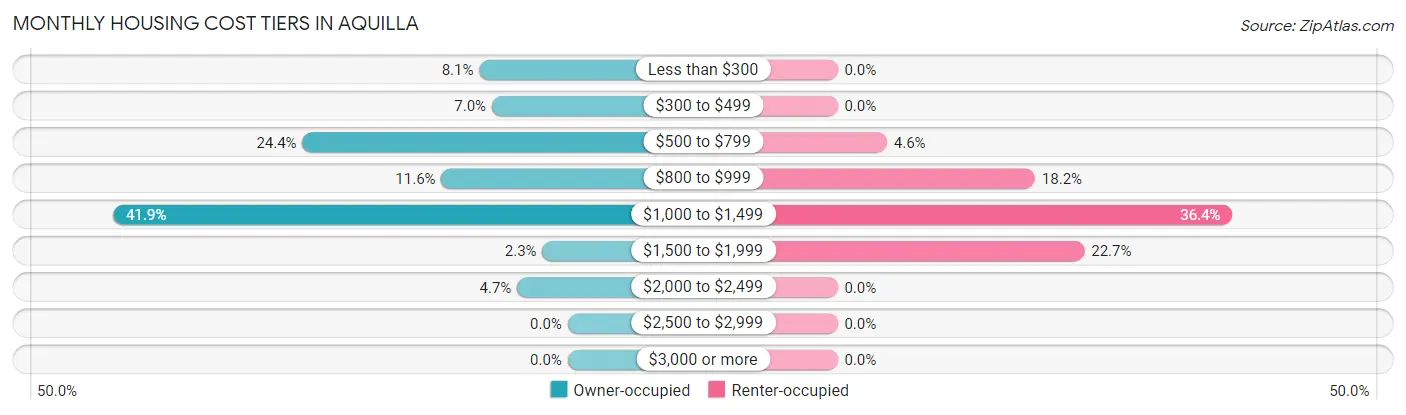
| Monthly Cost | Owner-occupied | Renter-occupied |
| Less than $300 | 7 (8.1%) | 0 (0.0%) |
| $300 to $499 | 6 (7.0%) | 0 (0.0%) |
| $500 to $799 | 21 (24.4%) | 1 (4.5%) |
| $800 to $999 | 10 (11.6%) | 4 (18.2%) |
| $1,000 to $1,499 | 36 (41.9%) | 8 (36.4%) |
| $1,500 to $1,999 | 2 (2.3%) | 5 (22.7%) |
| $2,000 to $2,499 | 4 (4.6%) | 0 (0.0%) |
| $2,500 to $2,999 | 0 (0.0%) | 0 (0.0%) |
| $3,000 or more | 0 (0.0%) | 0 (0.0%) |
| Total | 86 (100.0%) | 22 (100.0%) |
Physical Housing Characteristics in Aquilla
Housing Structures in Aquilla
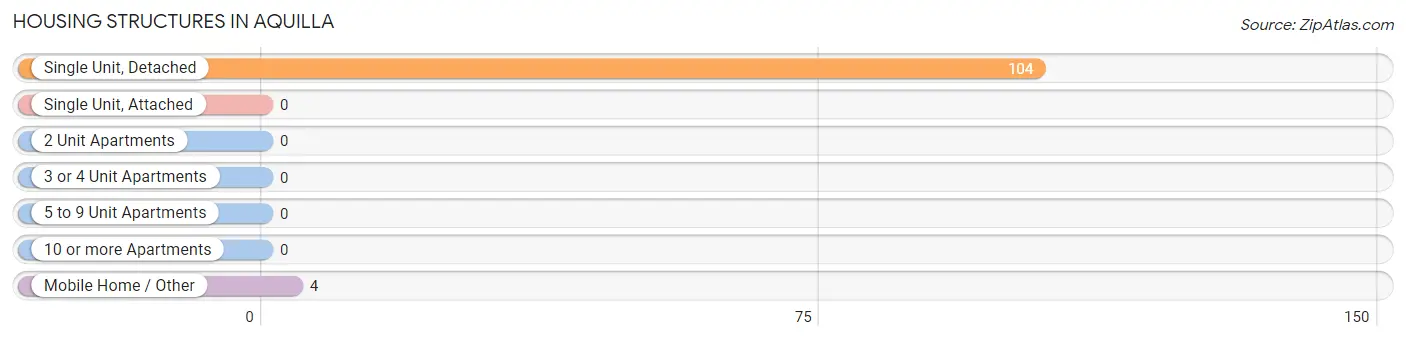
| Structure Type | # Housing Units | % Housing Units |
| Single Unit, Detached | 104 | 96.3% |
| Single Unit, Attached | 0 | 0.0% |
| 2 Unit Apartments | 0 | 0.0% |
| 3 or 4 Unit Apartments | 0 | 0.0% |
| 5 to 9 Unit Apartments | 0 | 0.0% |
| 10 or more Apartments | 0 | 0.0% |
| Mobile Home / Other | 4 | 3.7% |
| Total | 108 | 100.0% |
Housing Structures by Occupancy in Aquilla
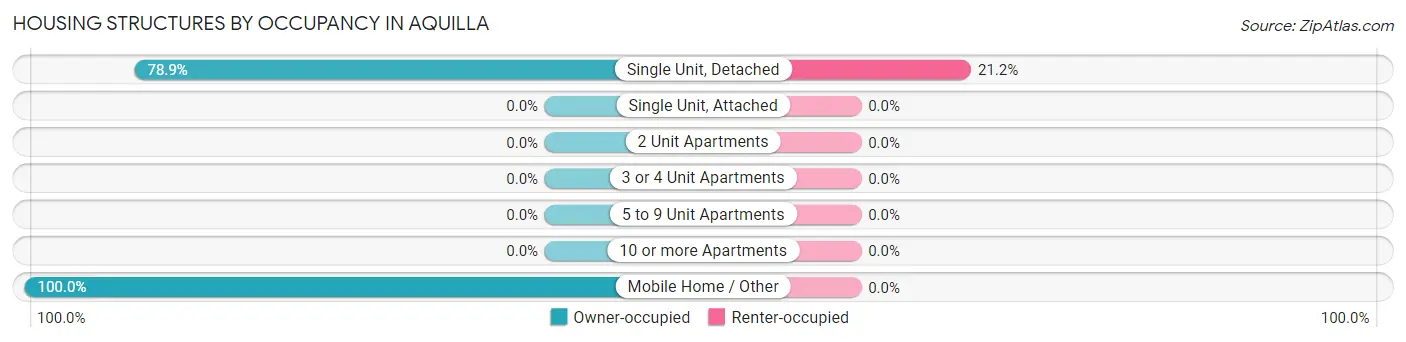
| Structure Type | Owner-occupied | Renter-occupied |
| Single Unit, Detached | 82 (78.8%) | 22 (21.1%) |
| Single Unit, Attached | 0 (0.0%) | 0 (0.0%) |
| 2 Unit Apartments | 0 (0.0%) | 0 (0.0%) |
| 3 or 4 Unit Apartments | 0 (0.0%) | 0 (0.0%) |
| 5 to 9 Unit Apartments | 0 (0.0%) | 0 (0.0%) |
| 10 or more Apartments | 0 (0.0%) | 0 (0.0%) |
| Mobile Home / Other | 4 (100.0%) | 0 (0.0%) |
| Total | 86 (79.6%) | 22 (20.4%) |
Housing Structures by Number of Rooms in Aquilla
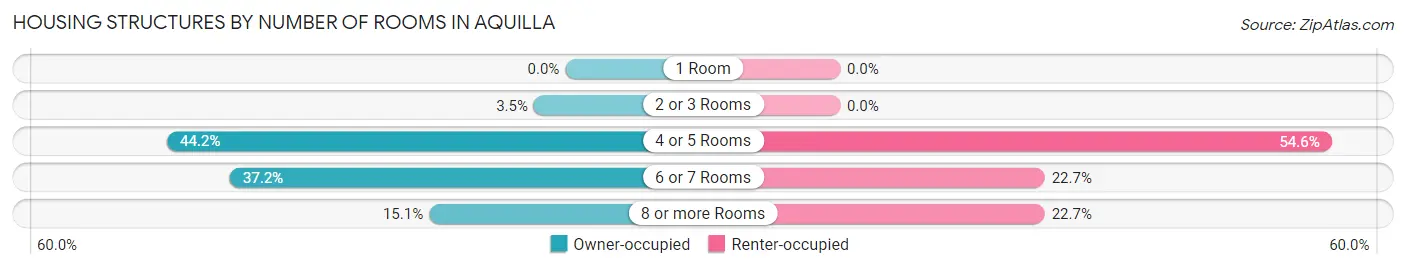
| Number of Rooms | Owner-occupied | Renter-occupied |
| 1 Room | 0 (0.0%) | 0 (0.0%) |
| 2 or 3 Rooms | 3 (3.5%) | 0 (0.0%) |
| 4 or 5 Rooms | 38 (44.2%) | 12 (54.5%) |
| 6 or 7 Rooms | 32 (37.2%) | 5 (22.7%) |
| 8 or more Rooms | 13 (15.1%) | 5 (22.7%) |
| Total | 86 (100.0%) | 22 (100.0%) |
Housing Structure by Heating Type in Aquilla
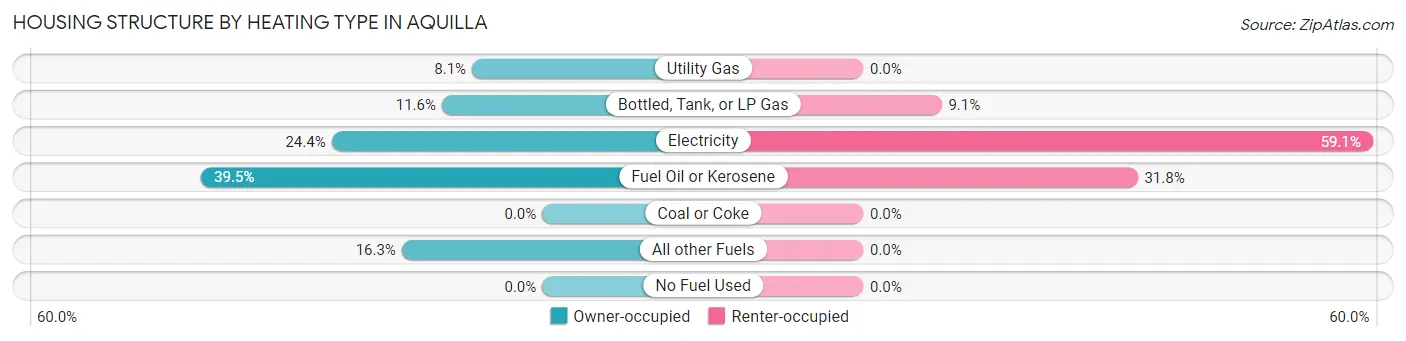
| Heating Type | Owner-occupied | Renter-occupied |
| Utility Gas | 7 (8.1%) | 0 (0.0%) |
| Bottled, Tank, or LP Gas | 10 (11.6%) | 2 (9.1%) |
| Electricity | 21 (24.4%) | 13 (59.1%) |
| Fuel Oil or Kerosene | 34 (39.5%) | 7 (31.8%) |
| Coal or Coke | 0 (0.0%) | 0 (0.0%) |
| All other Fuels | 14 (16.3%) | 0 (0.0%) |
| No Fuel Used | 0 (0.0%) | 0 (0.0%) |
| Total | 86 (100.0%) | 22 (100.0%) |
Household Vehicle Usage in Aquilla
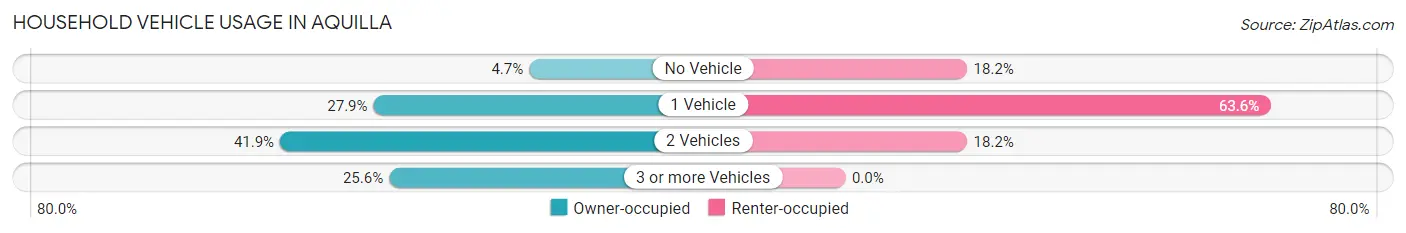
| Vehicles per Household | Owner-occupied | Renter-occupied |
| No Vehicle | 4 (4.6%) | 4 (18.2%) |
| 1 Vehicle | 24 (27.9%) | 14 (63.6%) |
| 2 Vehicles | 36 (41.9%) | 4 (18.2%) |
| 3 or more Vehicles | 22 (25.6%) | 0 (0.0%) |
| Total | 86 (100.0%) | 22 (100.0%) |
Real Estate & Mortgages in Aquilla
Real Estate and Mortgage Overview in Aquilla
| Characteristic | Without Mortgage | With Mortgage |
| Housing Units | 28 | 58 |
| Median Property Value | $130,000 | $121,400 |
| Median Household Income | $51,250 | $0 |
| Monthly Housing Costs | $510 | $0 |
| Real Estate Taxes | $2,000 | $0 |
Property Value by Mortgage Status in Aquilla
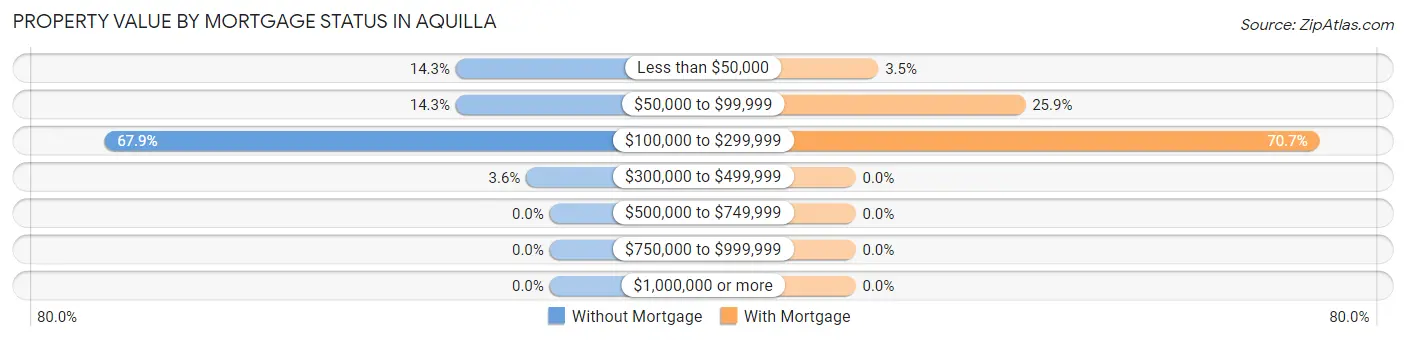
| Property Value | Without Mortgage | With Mortgage |
| Less than $50,000 | 4 (14.3%) | 2 (3.5%) |
| $50,000 to $99,999 | 4 (14.3%) | 15 (25.9%) |
| $100,000 to $299,999 | 19 (67.9%) | 41 (70.7%) |
| $300,000 to $499,999 | 1 (3.6%) | 0 (0.0%) |
| $500,000 to $749,999 | 0 (0.0%) | 0 (0.0%) |
| $750,000 to $999,999 | 0 (0.0%) | 0 (0.0%) |
| $1,000,000 or more | 0 (0.0%) | 0 (0.0%) |
| Total | 28 (100.0%) | 58 (100.0%) |
Household Income by Mortgage Status in Aquilla
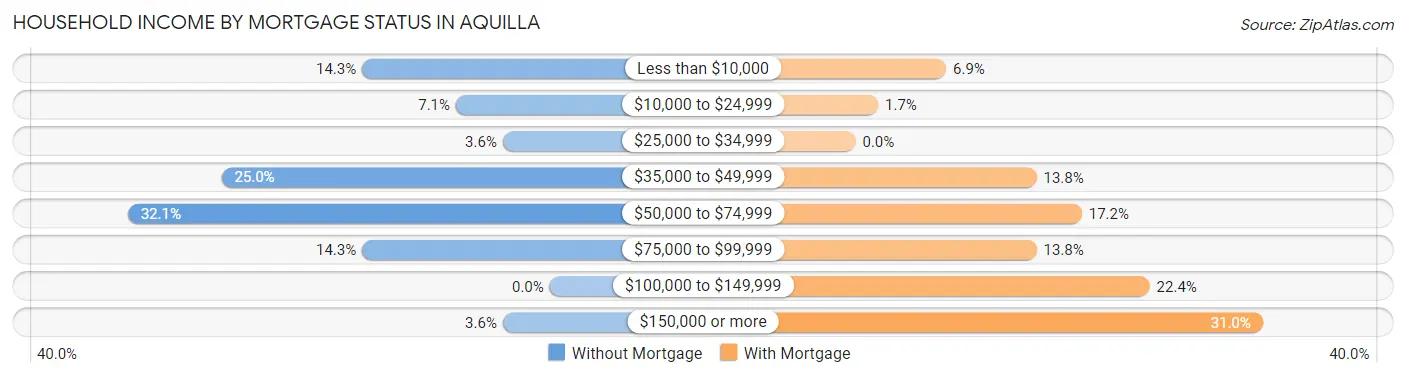
| Household Income | Without Mortgage | With Mortgage |
| Less than $10,000 | 4 (14.3%) | 4 (6.9%) |
| $10,000 to $24,999 | 2 (7.1%) | 1 (1.7%) |
| $25,000 to $34,999 | 1 (3.6%) | 0 (0.0%) |
| $35,000 to $49,999 | 7 (25.0%) | 8 (13.8%) |
| $50,000 to $74,999 | 9 (32.1%) | 10 (17.2%) |
| $75,000 to $99,999 | 4 (14.3%) | 8 (13.8%) |
| $100,000 to $149,999 | 0 (0.0%) | 13 (22.4%) |
| $150,000 or more | 1 (3.6%) | 18 (31.0%) |
| Total | 28 (100.0%) | 58 (100.0%) |
Property Value to Household Income Ratio in Aquilla
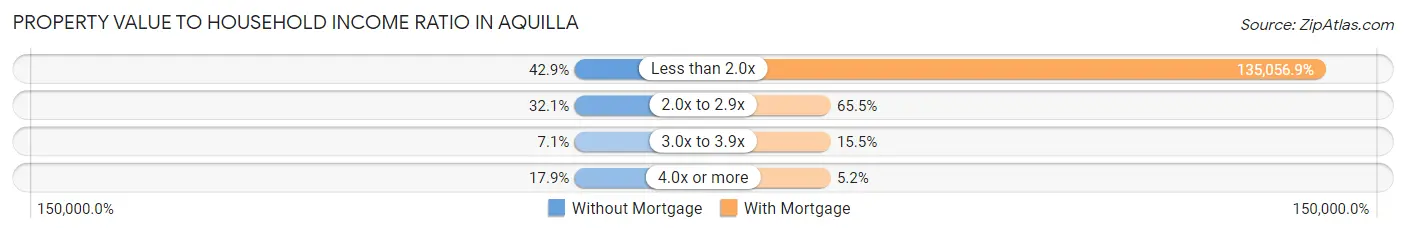
| Value-to-Income Ratio | Without Mortgage | With Mortgage |
| Less than 2.0x | 12 (42.9%) | 78,333 (135,056.9%) |
| 2.0x to 2.9x | 9 (32.1%) | 38 (65.5%) |
| 3.0x to 3.9x | 2 (7.1%) | 9 (15.5%) |
| 4.0x or more | 5 (17.9%) | 3 (5.2%) |
| Total | 28 (100.0%) | 58 (100.0%) |
Real Estate Taxes by Mortgage Status in Aquilla
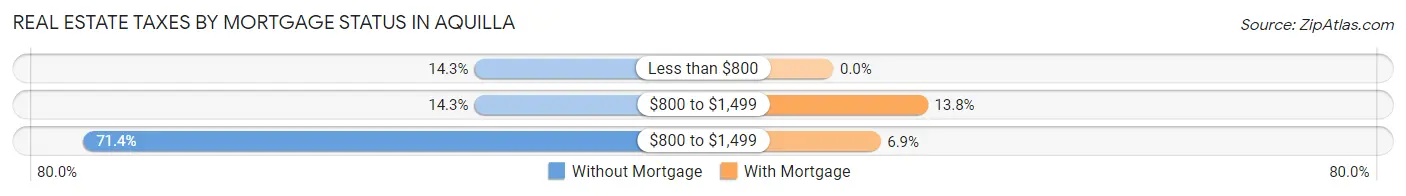
| Property Taxes | Without Mortgage | With Mortgage |
| Less than $800 | 4 (14.3%) | 0 (0.0%) |
| $800 to $1,499 | 4 (14.3%) | 8 (13.8%) |
| $800 to $1,499 | 20 (71.4%) | 4 (6.9%) |
| Total | 28 (100.0%) | 58 (100.0%) |
Health & Disability in Aquilla
Health Insurance Coverage by Age in Aquilla
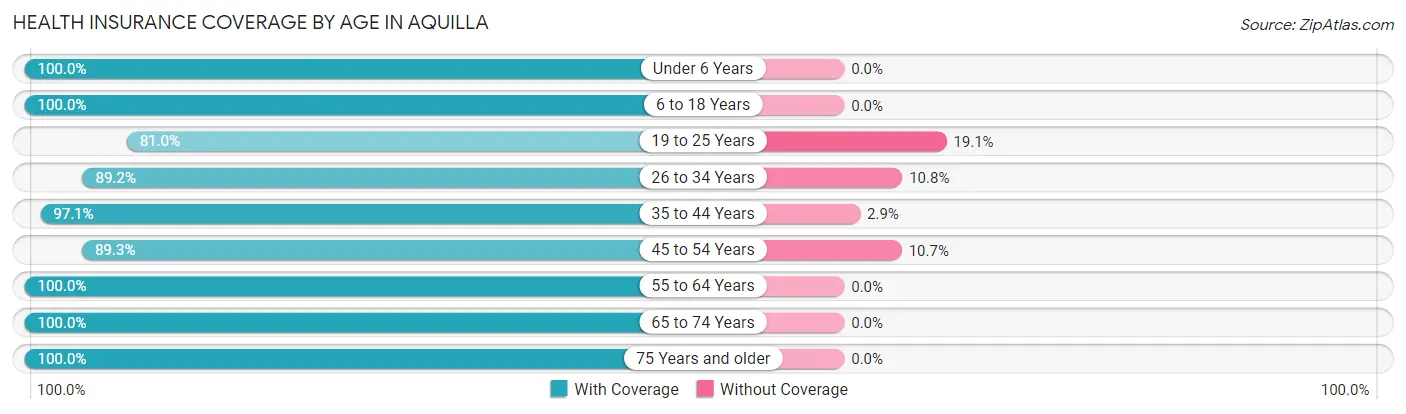
| Age Bracket | With Coverage | Without Coverage |
| Under 6 Years | 43 (100.0%) | 0 (0.0%) |
| 6 to 18 Years | 28 (100.0%) | 0 (0.0%) |
| 19 to 25 Years | 17 (80.9%) | 4 (19.1%) |
| 26 to 34 Years | 33 (89.2%) | 4 (10.8%) |
| 35 to 44 Years | 33 (97.1%) | 1 (2.9%) |
| 45 to 54 Years | 25 (89.3%) | 3 (10.7%) |
| 55 to 64 Years | 32 (100.0%) | 0 (0.0%) |
| 65 to 74 Years | 32 (100.0%) | 0 (0.0%) |
| 75 Years and older | 11 (100.0%) | 0 (0.0%) |
| Total | 254 (95.5%) | 12 (4.5%) |
Health Insurance Coverage by Citizenship Status in Aquilla
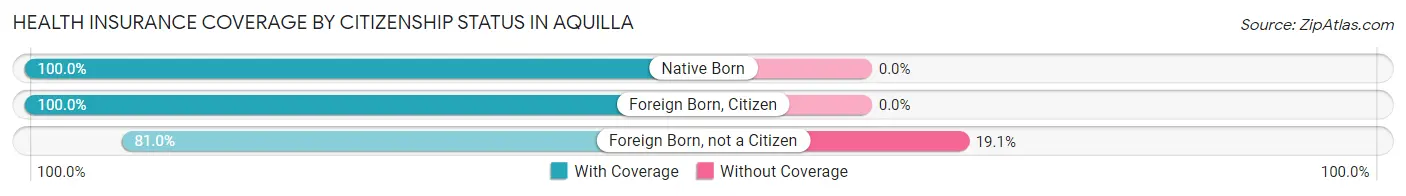
| Citizenship Status | With Coverage | Without Coverage |
| Native Born | 43 (100.0%) | 0 (0.0%) |
| Foreign Born, Citizen | 28 (100.0%) | 0 (0.0%) |
| Foreign Born, not a Citizen | 17 (80.9%) | 4 (19.1%) |
Health Insurance Coverage by Household Income in Aquilla
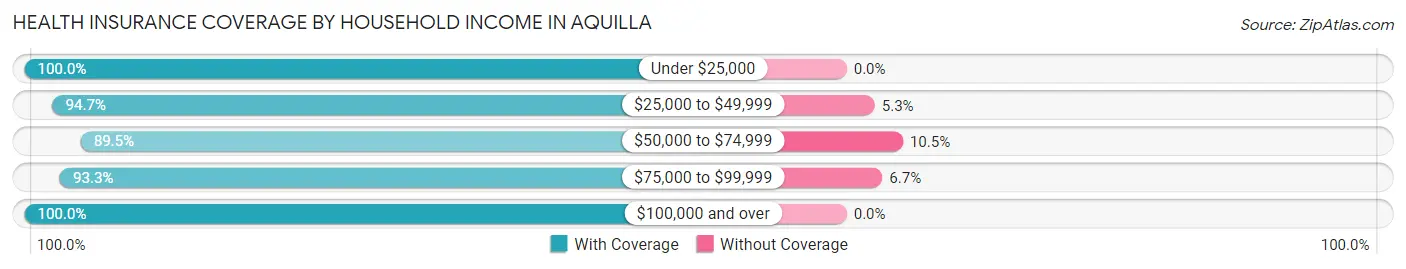
| Household Income | With Coverage | Without Coverage |
| Under $25,000 | 15 (100.0%) | 0 (0.0%) |
| $25,000 to $49,999 | 72 (94.7%) | 4 (5.3%) |
| $50,000 to $74,999 | 34 (89.5%) | 4 (10.5%) |
| $75,000 to $99,999 | 56 (93.3%) | 4 (6.7%) |
| $100,000 and over | 77 (100.0%) | 0 (0.0%) |
Public vs Private Health Insurance Coverage by Age in Aquilla
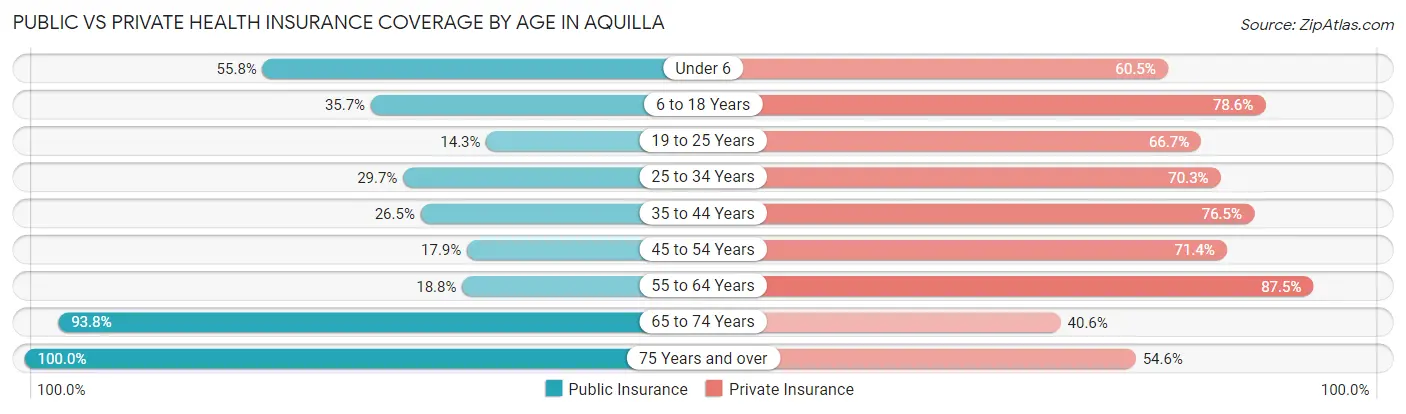
| Age Bracket | Public Insurance | Private Insurance |
| Under 6 | 24 (55.8%) | 26 (60.5%) |
| 6 to 18 Years | 10 (35.7%) | 22 (78.6%) |
| 19 to 25 Years | 3 (14.3%) | 14 (66.7%) |
| 25 to 34 Years | 11 (29.7%) | 26 (70.3%) |
| 35 to 44 Years | 9 (26.5%) | 26 (76.5%) |
| 45 to 54 Years | 5 (17.9%) | 20 (71.4%) |
| 55 to 64 Years | 6 (18.8%) | 28 (87.5%) |
| 65 to 74 Years | 30 (93.8%) | 13 (40.6%) |
| 75 Years and over | 11 (100.0%) | 6 (54.5%) |
| Total | 109 (41.0%) | 181 (68.0%) |
Disability Status by Sex by Age in Aquilla
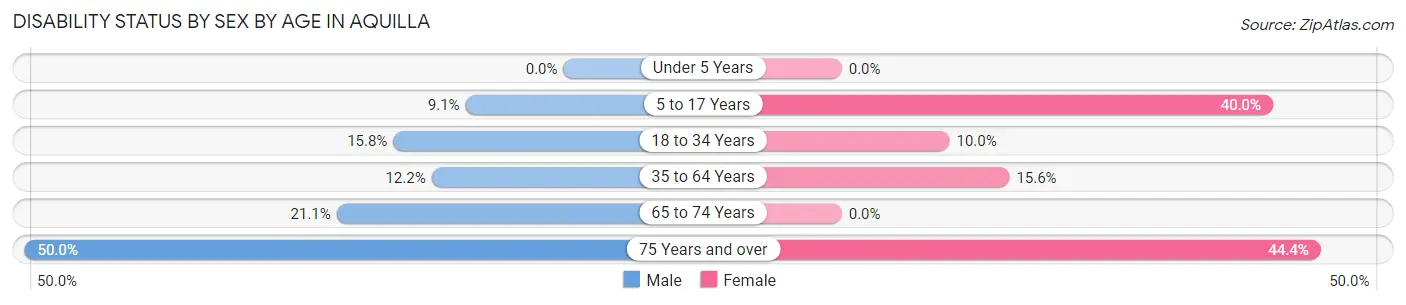
| Age Bracket | Male | Female |
| Under 5 Years | 0 (0.0%) | 0 (0.0%) |
| 5 to 17 Years | 2 (9.1%) | 4 (40.0%) |
| 18 to 34 Years | 6 (15.8%) | 2 (10.0%) |
| 35 to 64 Years | 6 (12.2%) | 7 (15.6%) |
| 65 to 74 Years | 4 (21.0%) | 0 (0.0%) |
| 75 Years and over | 1 (50.0%) | 4 (44.4%) |
Disability Class by Sex by Age in Aquilla
Disability Class: Hearing Difficulty
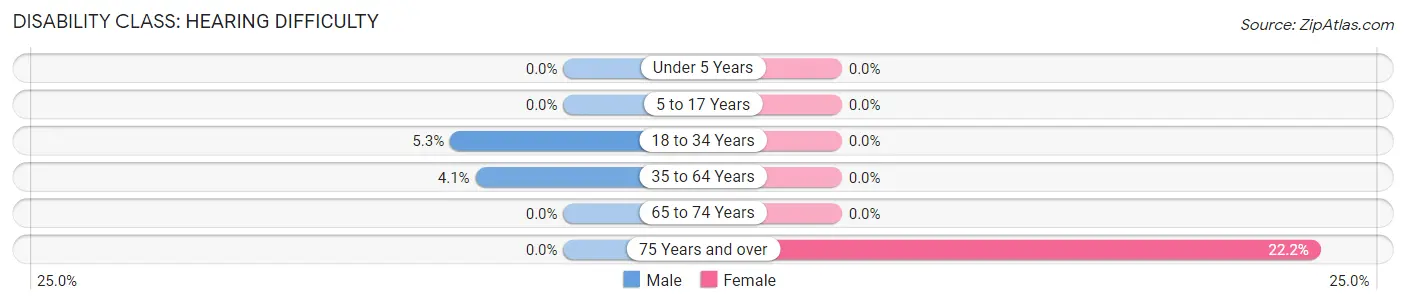
| Age Bracket | Male | Female |
| Under 5 Years | 0 (0.0%) | 0 (0.0%) |
| 5 to 17 Years | 0 (0.0%) | 0 (0.0%) |
| 18 to 34 Years | 2 (5.3%) | 0 (0.0%) |
| 35 to 64 Years | 2 (4.1%) | 0 (0.0%) |
| 65 to 74 Years | 0 (0.0%) | 0 (0.0%) |
| 75 Years and over | 0 (0.0%) | 2 (22.2%) |
Disability Class: Vision Difficulty
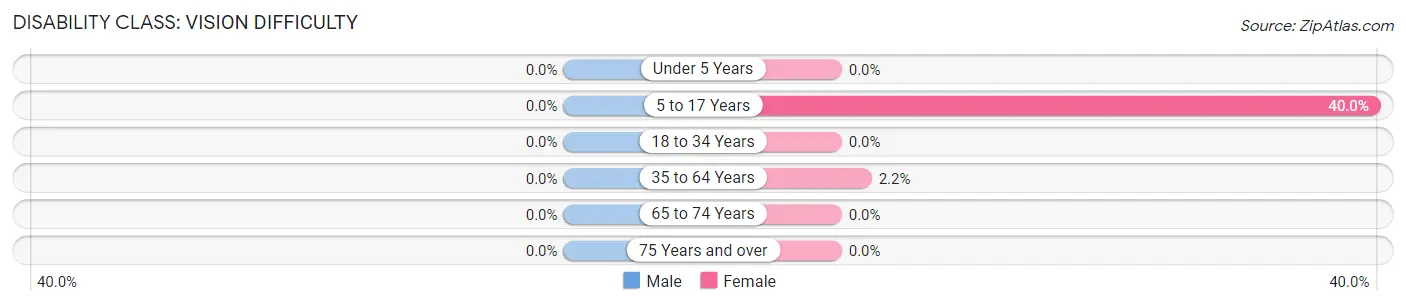
| Age Bracket | Male | Female |
| Under 5 Years | 0 (0.0%) | 0 (0.0%) |
| 5 to 17 Years | 0 (0.0%) | 4 (40.0%) |
| 18 to 34 Years | 0 (0.0%) | 0 (0.0%) |
| 35 to 64 Years | 0 (0.0%) | 1 (2.2%) |
| 65 to 74 Years | 0 (0.0%) | 0 (0.0%) |
| 75 Years and over | 0 (0.0%) | 0 (0.0%) |
Disability Class: Cognitive Difficulty
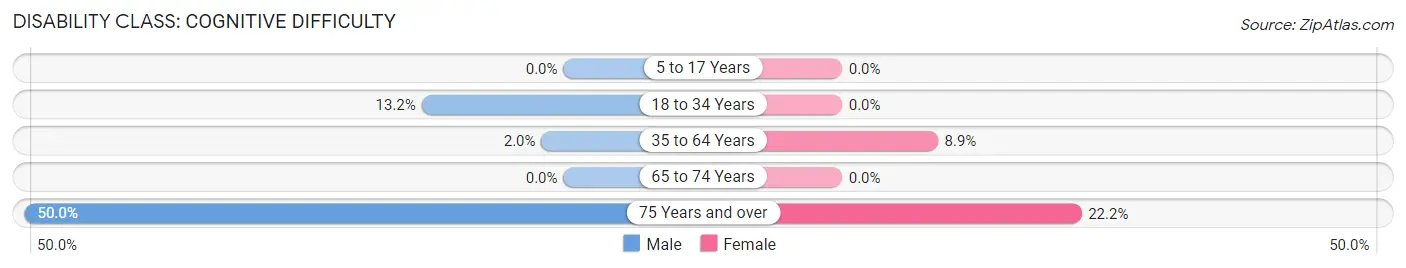
| Age Bracket | Male | Female |
| 5 to 17 Years | 0 (0.0%) | 0 (0.0%) |
| 18 to 34 Years | 5 (13.2%) | 0 (0.0%) |
| 35 to 64 Years | 1 (2.0%) | 4 (8.9%) |
| 65 to 74 Years | 0 (0.0%) | 0 (0.0%) |
| 75 Years and over | 1 (50.0%) | 2 (22.2%) |
Disability Class: Ambulatory Difficulty
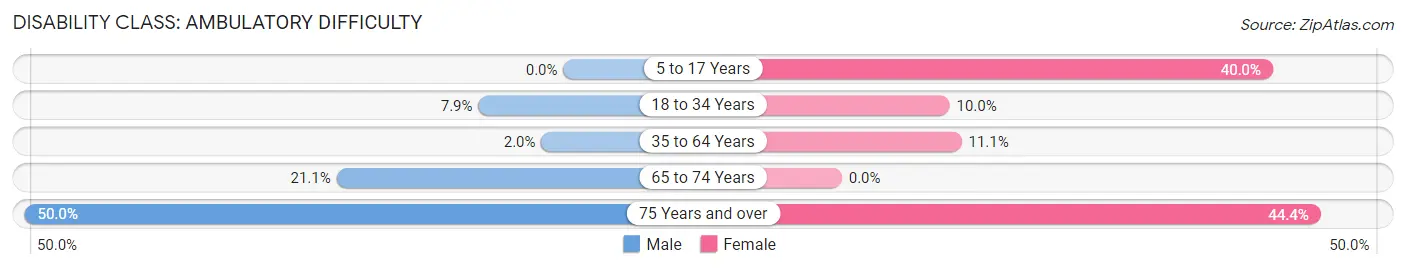
| Age Bracket | Male | Female |
| 5 to 17 Years | 0 (0.0%) | 4 (40.0%) |
| 18 to 34 Years | 3 (7.9%) | 2 (10.0%) |
| 35 to 64 Years | 1 (2.0%) | 5 (11.1%) |
| 65 to 74 Years | 4 (21.0%) | 0 (0.0%) |
| 75 Years and over | 1 (50.0%) | 4 (44.4%) |
Disability Class: Self-Care Difficulty
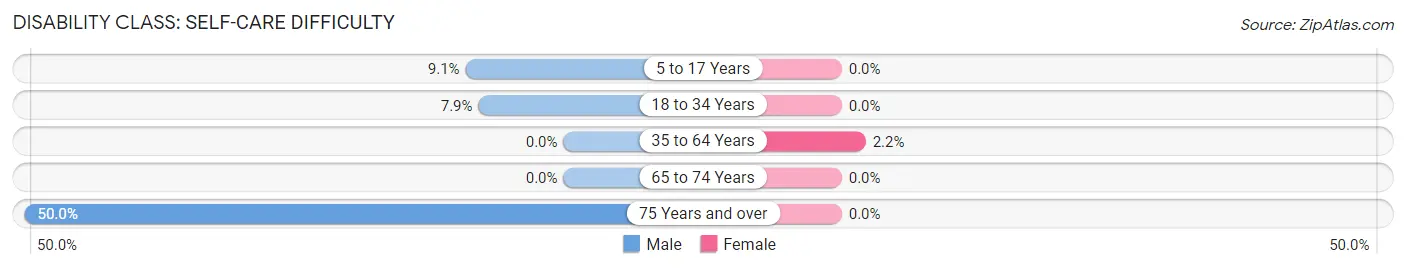
| Age Bracket | Male | Female |
| 5 to 17 Years | 2 (9.1%) | 0 (0.0%) |
| 18 to 34 Years | 3 (7.9%) | 0 (0.0%) |
| 35 to 64 Years | 0 (0.0%) | 1 (2.2%) |
| 65 to 74 Years | 0 (0.0%) | 0 (0.0%) |
| 75 Years and over | 1 (50.0%) | 0 (0.0%) |
Technology Access in Aquilla
Computing Device Access in Aquilla
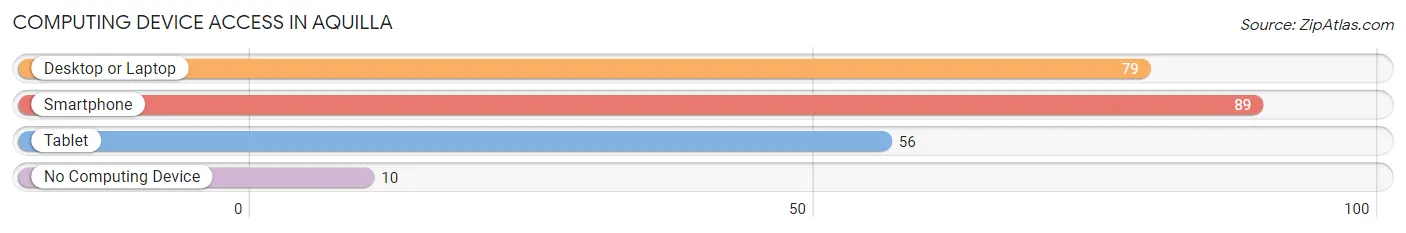
| Device Type | # Households | % Households |
| Desktop or Laptop | 79 | 73.2% |
| Smartphone | 89 | 82.4% |
| Tablet | 56 | 51.8% |
| No Computing Device | 10 | 9.3% |
| Total | 108 | 100.0% |
Internet Access in Aquilla
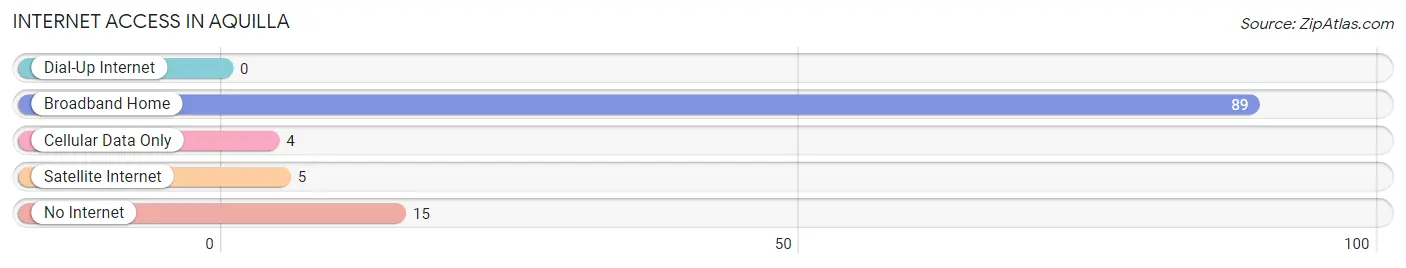
| Internet Type | # Households | % Households |
| Dial-Up Internet | 0 | 0.0% |
| Broadband Home | 89 | 82.4% |
| Cellular Data Only | 4 | 3.7% |
| Satellite Internet | 5 | 4.6% |
| No Internet | 15 | 13.9% |
| Total | 108 | 100.0% |
Aquilla Summary
Aquilla, Ohio is a small village located in Geauga County, Ohio. It is situated on the western edge of the county, just south of the city of Chardon. The village has a population of approximately 1,000 people and is part of the Chardon Local School District.
History
Aquilla was founded in 1818 by a group of settlers from Connecticut. The village was named after Aquilla, a Native American chief who lived in the area. The settlers were attracted to the area due to its abundance of natural resources, including timber, water, and fertile soil.
The village grew slowly over the years, and by the mid-1800s, it had become a thriving agricultural community. The village was home to several mills, including a sawmill, gristmill, and a woolen mill. The village also had a blacksmith shop, a general store, and a post office.
In the late 1800s, the village began to experience a decline in population due to the introduction of the railroad. The railroad bypassed Aquilla, and many of the businesses and residents moved away. By the early 1900s, the village had become a quiet, rural community.
Geography
Aquilla is located in Geauga County, Ohio, on the western edge of the county. The village is situated on the banks of the Grand River, which flows through the area. The village is surrounded by rolling hills and farmland.
The village is located approximately 30 miles east of Cleveland and 40 miles west of Akron. The nearest major city is Chardon, which is located just south of Aquilla.
Economy
Aquilla is a small, rural village with a limited economy. The village is home to several small businesses, including a general store, a gas station, and a few restaurants. The village also has a post office and a library.
The village is home to several farms, which produce a variety of crops, including corn, soybeans, and wheat. The village also has a few small manufacturing businesses, which produce a variety of products, including furniture and clothing.
Demographics
As of the 2010 census, the population of Aquilla was 1,000 people. The village is predominantly white, with approximately 95% of the population being Caucasian. The median household income is $45,000, and the median home value is $150,000.
The village is home to a variety of religious denominations, including Catholic, Methodist, and Baptist. The village also has a small Amish community.
Conclusion
Aquilla, Ohio is a small village located in Geauga County, Ohio. It is situated on the western edge of the county, just south of the city of Chardon. The village has a population of approximately 1,000 people and is part of the Chardon Local School District. The village is home to several small businesses, farms, and manufacturing businesses. The village is predominantly white, with a median household income of $45,000 and a median home value of $150,000. The village is home to a variety of religious denominations, including Catholic, Methodist, and Baptist. The village also has a small Amish community.
Common Questions
What is Per Capita Income in Aquilla?
Per Capita income in Aquilla is $26,371.
What is the Median Family Income in Aquilla?
Median Family Income in Aquilla is $72,500.
What is the Median Household income in Aquilla?
Median Household Income in Aquilla is $55,000.
What is Income or Wage Gap in Aquilla?
Income or Wage Gap in Aquilla is 27.5%.
Women in Aquilla earn 72.5 cents for every dollar earned by a man.
What is Inequality or Gini Index in Aquilla?
Inequality or Gini Index in Aquilla is 0.33.
What is the Total Population of Aquilla?
Total Population of Aquilla is 266.
What is the Total Male Population of Aquilla?
Total Male Population of Aquilla is 157.
What is the Total Female Population of Aquilla?
Total Female Population of Aquilla is 109.
What is the Ratio of Males per 100 Females in Aquilla?
There are 144.04 Males per 100 Females in Aquilla.
What is the Ratio of Females per 100 Males in Aquilla?
There are 69.43 Females per 100 Males in Aquilla.
What is the Median Population Age in Aquilla?
Median Population Age in Aquilla is 38.1 Years.
What is the Average Family Size in Aquilla
Average Family Size in Aquilla is 2.9 People.
What is the Average Household Size in Aquilla
Average Household Size in Aquilla is 2.5 People.
How Large is the Labor Force in Aquilla?
There are 130 People in the Labor Forcein in Aquilla.
What is the Percentage of People in the Labor Force in Aquilla?
64.7% of People are in the Labor Force in Aquilla.
What is the Unemployment Rate in Aquilla?
Unemployment Rate in Aquilla is 7.7%.