Wilmington, OH Map & Demographics
Wilmington Map
Wilmington Overview
$26,520
PER CAPITA INCOME
$60,240
AVG FAMILY INCOME
$48,407
AVG HOUSEHOLD INCOME
10.7%
WAGE / INCOME GAP [ % ]
89.3¢/ $1
WAGE / INCOME GAP [ $ ]
0.44
INEQUALITY / GINI INDEX
12,669
TOTAL POPULATION
5,697
MALE POPULATION
6,972
FEMALE POPULATION
81.71
MALES / 100 FEMALES
122.38
FEMALES / 100 MALES
36.5
MEDIAN AGE
3.2
AVG FAMILY SIZE
2.2
AVG HOUSEHOLD SIZE
6,010
LABOR FORCE [ PEOPLE ]
59.5%
PERCENT IN LABOR FORCE
5.0%
UNEMPLOYMENT RATE
Wilmington Zip Codes
Wilmington Area Codes
Income in Wilmington
Income Overview in Wilmington
Per Capita Income in Wilmington is $26,520, while median incomes of families and households are $60,240 and $48,407 respectively.
| Characteristic | Number | Measure |
| Per Capita Income | 12,669 | $26,520 |
| Median Family Income | 2,729 | $60,240 |
| Mean Family Income | 2,729 | $77,835 |
| Median Household Income | 5,207 | $48,407 |
| Mean Household Income | 5,207 | $61,526 |
| Income Deficit | 2,729 | $0 |
| Wage / Income Gap (%) | 12,669 | 10.71% |
| Wage / Income Gap ($) | 12,669 | 89.29¢ per $1 |
| Gini / Inequality Index | 12,669 | 0.44 |
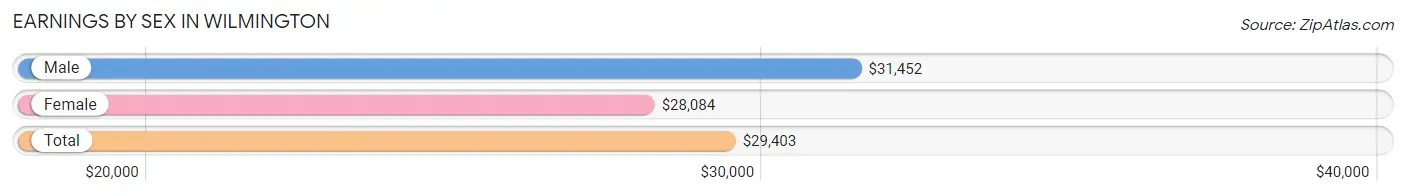
Earnings by Sex in Wilmington
Average Earnings in Wilmington are $29,403, $31,452 for men and $28,084 for women, a difference of 10.7%.
| Sex | Number | Average Earnings |
| Male | 3,058 (47.8%) | $31,452 |
| Female | 3,344 (52.2%) | $28,084 |
| Total | 6,402 (100.0%) | $29,403 |
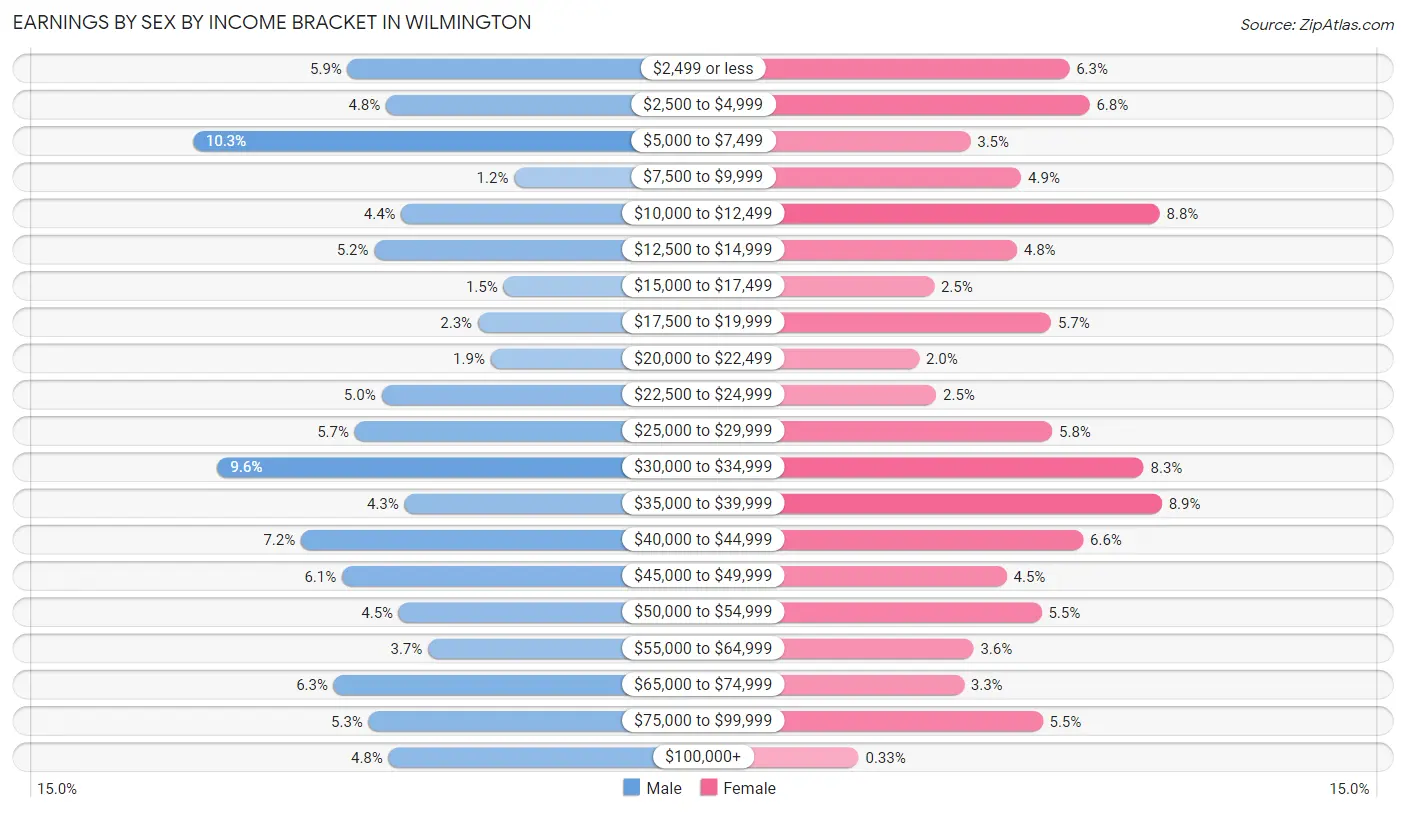
Earnings by Sex by Income Bracket in Wilmington
The most common earnings brackets in Wilmington are $5,000 to $7,499 for men (314 | 10.3%) and $35,000 to $39,999 for women (296 | 8.8%).
| Income | Male | Female |
| $2,499 or less | 181 (5.9%) | 209 (6.2%) |
| $2,500 to $4,999 | 148 (4.8%) | 228 (6.8%) |
| $5,000 to $7,499 | 314 (10.3%) | 116 (3.5%) |
| $7,500 to $9,999 | 38 (1.2%) | 164 (4.9%) |
| $10,000 to $12,499 | 135 (4.4%) | 294 (8.8%) |
| $12,500 to $14,999 | 158 (5.2%) | 160 (4.8%) |
| $15,000 to $17,499 | 47 (1.5%) | 82 (2.5%) |
| $17,500 to $19,999 | 69 (2.3%) | 192 (5.7%) |
| $20,000 to $22,499 | 58 (1.9%) | 68 (2.0%) |
| $22,500 to $24,999 | 152 (5.0%) | 84 (2.5%) |
| $25,000 to $29,999 | 175 (5.7%) | 193 (5.8%) |
| $30,000 to $34,999 | 293 (9.6%) | 279 (8.3%) |
| $35,000 to $39,999 | 132 (4.3%) | 296 (8.8%) |
| $40,000 to $44,999 | 221 (7.2%) | 222 (6.6%) |
| $45,000 to $49,999 | 186 (6.1%) | 150 (4.5%) |
| $50,000 to $54,999 | 137 (4.5%) | 183 (5.5%) |
| $55,000 to $64,999 | 112 (3.7%) | 119 (3.6%) |
| $65,000 to $74,999 | 193 (6.3%) | 110 (3.3%) |
| $75,000 to $99,999 | 163 (5.3%) | 184 (5.5%) |
| $100,000+ | 146 (4.8%) | 11 (0.3%) |
| Total | 3,058 (100.0%) | 3,344 (100.0%) |
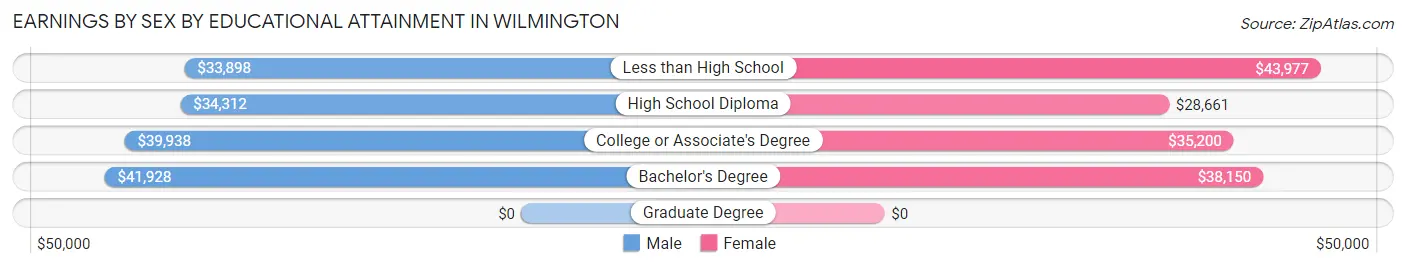
Earnings by Sex by Educational Attainment in Wilmington
Average earnings in Wilmington are $39,688 for men and $33,495 for women, a difference of 15.6%. Men with an educational attainment of bachelor's degree enjoy the highest average annual earnings of $41,928, while those with less than high school education earn the least with $33,898. Women with an educational attainment of less than high school earn the most with the average annual earnings of $43,977, while those with high school diploma education have the smallest earnings of $28,661.
| Educational Attainment | Male Income | Female Income |
| Less than High School | $33,898 | $43,977 |
| High School Diploma | $34,312 | $28,661 |
| College or Associate's Degree | $39,938 | $35,200 |
| Bachelor's Degree | $41,928 | $38,150 |
| Graduate Degree | - | - |
| Total | $39,688 | $33,495 |
Family Income in Wilmington
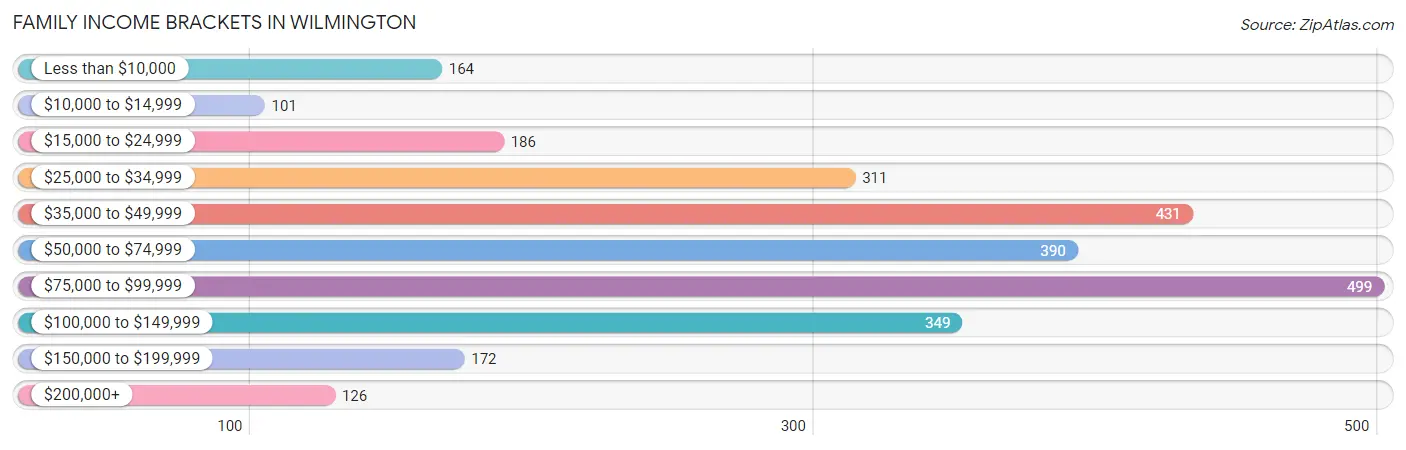
Family Income Brackets in Wilmington
According to the Wilmington family income data, there are 499 families falling into the $75,000 to $99,999 income range, which is the most common income bracket and makes up 18.3% of all families. Conversely, the $10,000 to $14,999 income bracket is the least frequent group with only 101 families (3.7%) belonging to this category.
| Income Bracket | # Families | % Families |
| Less than $10,000 | 164 | 6.0% |
| $10,000 to $14,999 | 101 | 3.7% |
| $15,000 to $24,999 | 186 | 6.8% |
| $25,000 to $34,999 | 311 | 11.4% |
| $35,000 to $49,999 | 431 | 15.8% |
| $50,000 to $74,999 | 390 | 14.3% |
| $75,000 to $99,999 | 499 | 18.3% |
| $100,000 to $149,999 | 349 | 12.8% |
| $150,000 to $199,999 | 172 | 6.3% |
| $200,000+ | 126 | 4.6% |
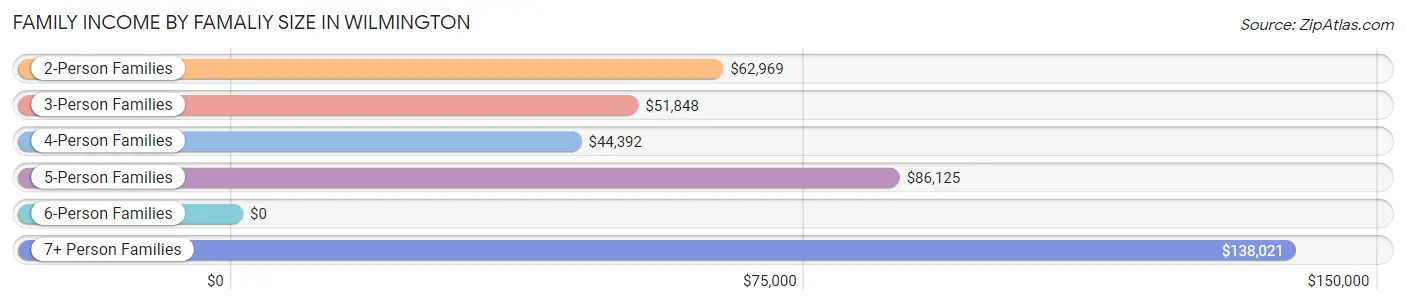
Family Income by Famaliy Size in Wilmington
7+ person families (38 | 1.4%) account for the highest median family income in Wilmington with $138,021 per family, while 2-person families (1,277 | 46.8%) have the highest median income of $31,484 per family member.
| Income Bracket | # Families | Median Income |
| 2-Person Families | 1,277 (46.8%) | $62,969 |
| 3-Person Families | 596 (21.8%) | $51,848 |
| 4-Person Families | 482 (17.7%) | $44,392 |
| 5-Person Families | 269 (9.9%) | $86,125 |
| 6-Person Families | 67 (2.5%) | $0 |
| 7+ Person Families | 38 (1.4%) | $138,021 |
| Total | 2,729 (100.0%) | $60,240 |
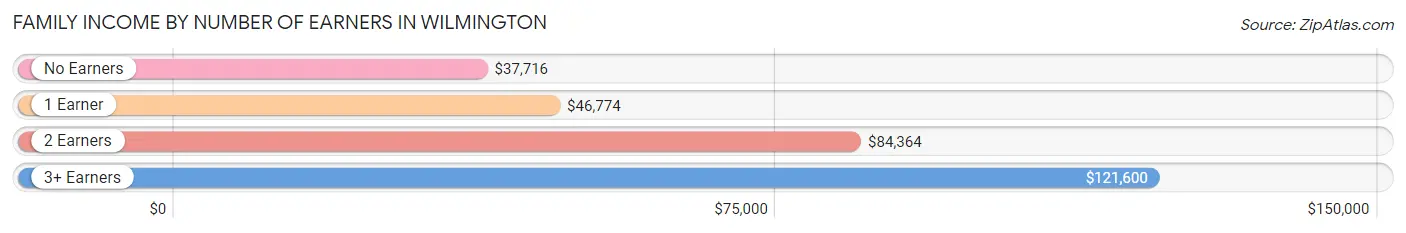
Family Income by Number of Earners in Wilmington
The median family income in Wilmington is $60,240, with families comprising 3+ earners (310) having the highest median family income of $121,600, while families with no earners (511) have the lowest median family income of $37,716, accounting for 11.4% and 18.7% of families, respectively.
| Number of Earners | # Families | Median Income |
| No Earners | 511 (18.7%) | $37,716 |
| 1 Earner | 1,056 (38.7%) | $46,774 |
| 2 Earners | 852 (31.2%) | $84,364 |
| 3+ Earners | 310 (11.4%) | $121,600 |
| Total | 2,729 (100.0%) | $60,240 |
Household Income in Wilmington
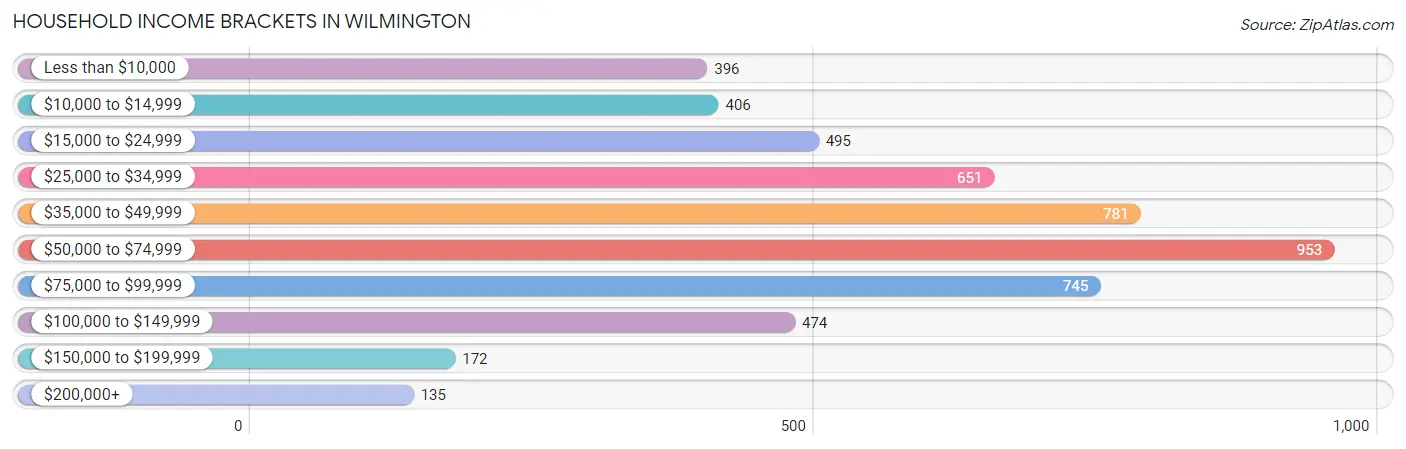
Household Income Brackets in Wilmington
With 953 households falling in the category, the $50,000 to $74,999 income range is the most frequent in Wilmington, accounting for 18.3% of all households. In contrast, only 135 households (2.6%) fall into the $200,000+ income bracket, making it the least populous group.
| Income Bracket | # Households | % Households |
| Less than $10,000 | 396 | 7.6% |
| $10,000 to $14,999 | 406 | 7.8% |
| $15,000 to $24,999 | 495 | 9.5% |
| $25,000 to $34,999 | 651 | 12.5% |
| $35,000 to $49,999 | 781 | 15.0% |
| $50,000 to $74,999 | 953 | 18.3% |
| $75,000 to $99,999 | 745 | 14.3% |
| $100,000 to $149,999 | 474 | 9.1% |
| $150,000 to $199,999 | 172 | 3.3% |
| $200,000+ | 135 | 2.6% |
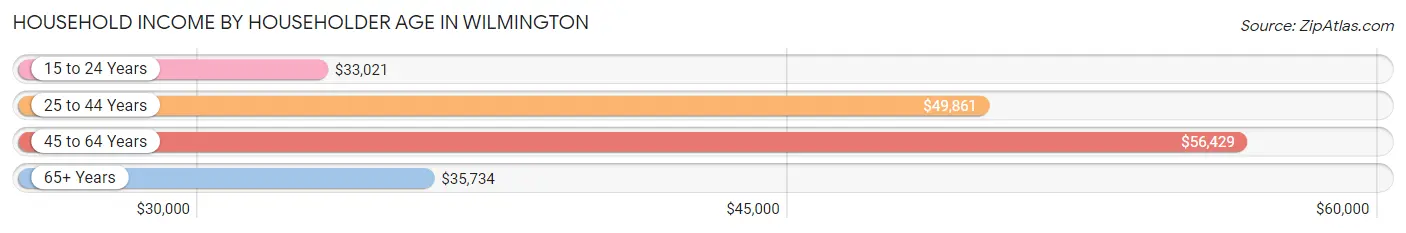
Household Income by Householder Age in Wilmington
The median household income in Wilmington is $48,407, with the highest median household income of $56,429 found in the 45 to 64 years age bracket for the primary householder. A total of 1,788 households (34.3%) fall into this category. Meanwhile, the 15 to 24 years age bracket for the primary householder has the lowest median household income of $33,021, with 269 households (5.2%) in this group.
| Income Bracket | # Households | Median Income |
| 15 to 24 Years | 269 (5.2%) | $33,021 |
| 25 to 44 Years | 1,505 (28.9%) | $49,861 |
| 45 to 64 Years | 1,788 (34.3%) | $56,429 |
| 65+ Years | 1,645 (31.6%) | $35,734 |
| Total | 5,207 (100.0%) | $48,407 |
Poverty in Wilmington
Income Below Poverty by Sex and Age in Wilmington
With 17.3% poverty level for males and 24.2% for females among the residents of Wilmington, 12 to 14 year old males and under 5 year old females are the most vulnerable to poverty, with 60 males (43.2%) and 151 females (47.2%) in their respective age groups living below the poverty level.
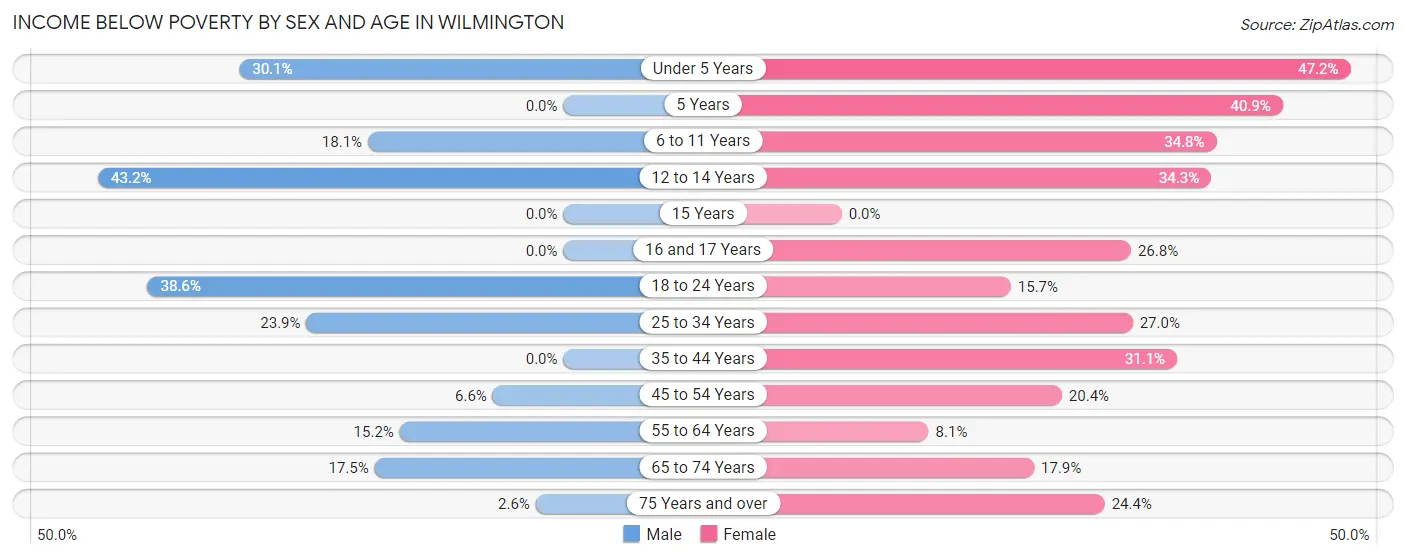
| Age Bracket | Male | Female |
| Under 5 Years | 123 (30.1%) | 151 (47.2%) |
| 5 Years | 0 (0.0%) | 54 (40.9%) |
| 6 to 11 Years | 82 (18.1%) | 211 (34.8%) |
| 12 to 14 Years | 60 (43.2%) | 98 (34.3%) |
| 15 Years | 0 (0.0%) | 0 (0.0%) |
| 16 and 17 Years | 0 (0.0%) | 51 (26.8%) |
| 18 to 24 Years | 218 (38.6%) | 86 (15.7%) |
| 25 to 34 Years | 166 (23.8%) | 186 (27.0%) |
| 35 to 44 Years | 0 (0.0%) | 214 (31.1%) |
| 45 to 54 Years | 38 (6.6%) | 151 (20.4%) |
| 55 to 64 Years | 106 (15.2%) | 69 (8.1%) |
| 65 to 74 Years | 92 (17.5%) | 116 (17.8%) |
| 75 Years and over | 10 (2.6%) | 184 (24.4%) |
| Total | 895 (17.3%) | 1,571 (24.2%) |
Income Above Poverty by Sex and Age in Wilmington
According to the poverty statistics in Wilmington, males aged 5 years and females aged 15 years are the age groups that are most secure financially, with 100.0% of males and 100.0% of females in these age groups living above the poverty line.
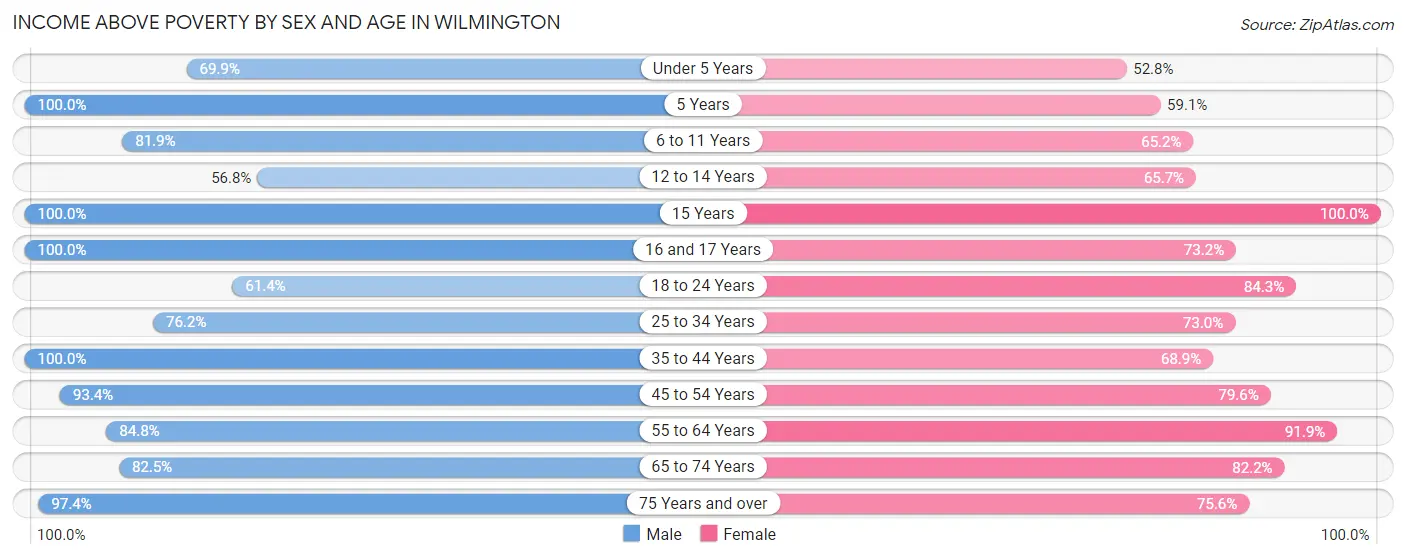
| Age Bracket | Male | Female |
| Under 5 Years | 286 (69.9%) | 169 (52.8%) |
| 5 Years | 87 (100.0%) | 78 (59.1%) |
| 6 to 11 Years | 370 (81.9%) | 396 (65.2%) |
| 12 to 14 Years | 79 (56.8%) | 188 (65.7%) |
| 15 Years | 80 (100.0%) | 25 (100.0%) |
| 16 and 17 Years | 75 (100.0%) | 139 (73.2%) |
| 18 to 24 Years | 347 (61.4%) | 462 (84.3%) |
| 25 to 34 Years | 530 (76.1%) | 503 (73.0%) |
| 35 to 44 Years | 488 (100.0%) | 474 (68.9%) |
| 45 to 54 Years | 541 (93.4%) | 588 (79.6%) |
| 55 to 64 Years | 592 (84.8%) | 787 (91.9%) |
| 65 to 74 Years | 433 (82.5%) | 534 (82.2%) |
| 75 Years and over | 379 (97.4%) | 570 (75.6%) |
| Total | 4,287 (82.7%) | 4,913 (75.8%) |
Income Below Poverty Among Married-Couple Families in Wilmington
The poverty statistics for married-couple families in Wilmington show that 11.1% or 204 of the total 1,834 families live below the poverty line. Families with 3 or 4 children have the highest poverty rate of 16.1%, comprising of 42 families. On the other hand, families with 5 or more children have the lowest poverty rate of 0.0%, which includes 0 families.
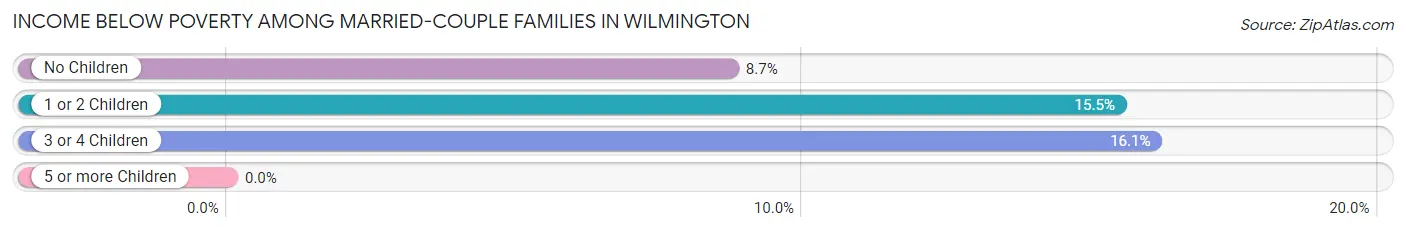
| Children | Above Poverty | Below Poverty |
| No Children | 1,088 (91.3%) | 104 (8.7%) |
| 1 or 2 Children | 317 (84.5%) | 58 (15.5%) |
| 3 or 4 Children | 219 (83.9%) | 42 (16.1%) |
| 5 or more Children | 6 (100.0%) | 0 (0.0%) |
| Total | 1,630 (88.9%) | 204 (11.1%) |
Income Below Poverty Among Single-Parent Households in Wilmington
According to the poverty data in Wilmington, 11.6% or 25 single-father households and 39.6% or 269 single-mother households are living below the poverty line. Among single-father households, those with 1 or 2 children have the highest poverty rate, with 25 households (65.8%) experiencing poverty. Likewise, among single-mother households, those with 1 or 2 children have the highest poverty rate, with 205 households (55.7%) falling below the poverty line.
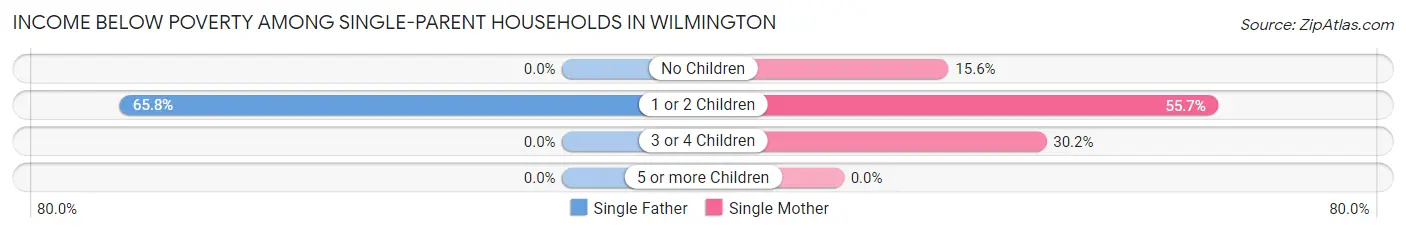
| Children | Single Father | Single Mother |
| No Children | 0 (0.0%) | 32 (15.6%) |
| 1 or 2 Children | 25 (65.8%) | 205 (55.7%) |
| 3 or 4 Children | 0 (0.0%) | 32 (30.2%) |
| 5 or more Children | 0 (0.0%) | 0 (0.0%) |
| Total | 25 (11.6%) | 269 (39.6%) |
Income Below Poverty Among Married-Couple vs Single-Parent Households in Wilmington
The poverty data for Wilmington shows that 204 of the married-couple family households (11.1%) and 294 of the single-parent households (32.9%) are living below the poverty level. Within the married-couple family households, those with 3 or 4 children have the highest poverty rate, with 42 households (16.1%) falling below the poverty line. Among the single-parent households, those with 1 or 2 children have the highest poverty rate, with 230 household (56.7%) living below poverty.
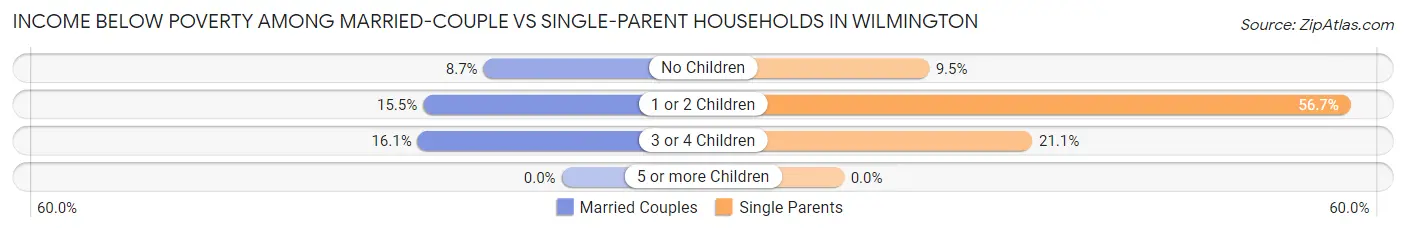
| Children | Married-Couple Families | Single-Parent Households |
| No Children | 104 (8.7%) | 32 (9.5%) |
| 1 or 2 Children | 58 (15.5%) | 230 (56.7%) |
| 3 or 4 Children | 42 (16.1%) | 32 (21.0%) |
| 5 or more Children | 0 (0.0%) | 0 (0.0%) |
| Total | 204 (11.1%) | 294 (32.9%) |
Race in Wilmington
The most populous races in Wilmington are White / Caucasian (10,965 | 86.6%), Black / African American (649 | 5.1%), and Two or more Races (572 | 4.5%).
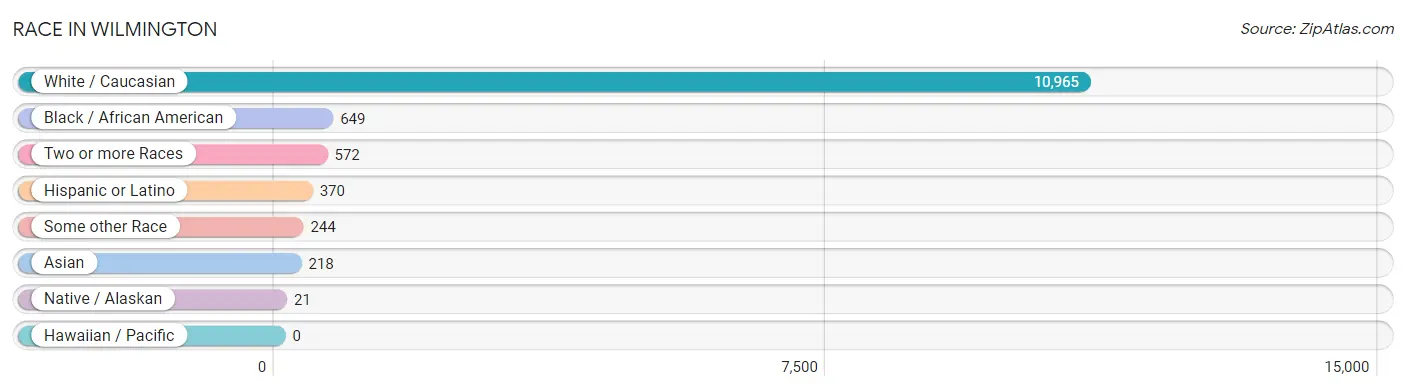
| Race | # Population | % Population |
| Asian | 218 | 1.7% |
| Black / African American | 649 | 5.1% |
| Hawaiian / Pacific | 0 | 0.0% |
| Hispanic or Latino | 370 | 2.9% |
| Native / Alaskan | 21 | 0.2% |
| White / Caucasian | 10,965 | 86.6% |
| Two or more Races | 572 | 4.5% |
| Some other Race | 244 | 1.9% |
| Total | 12,669 | 100.0% |
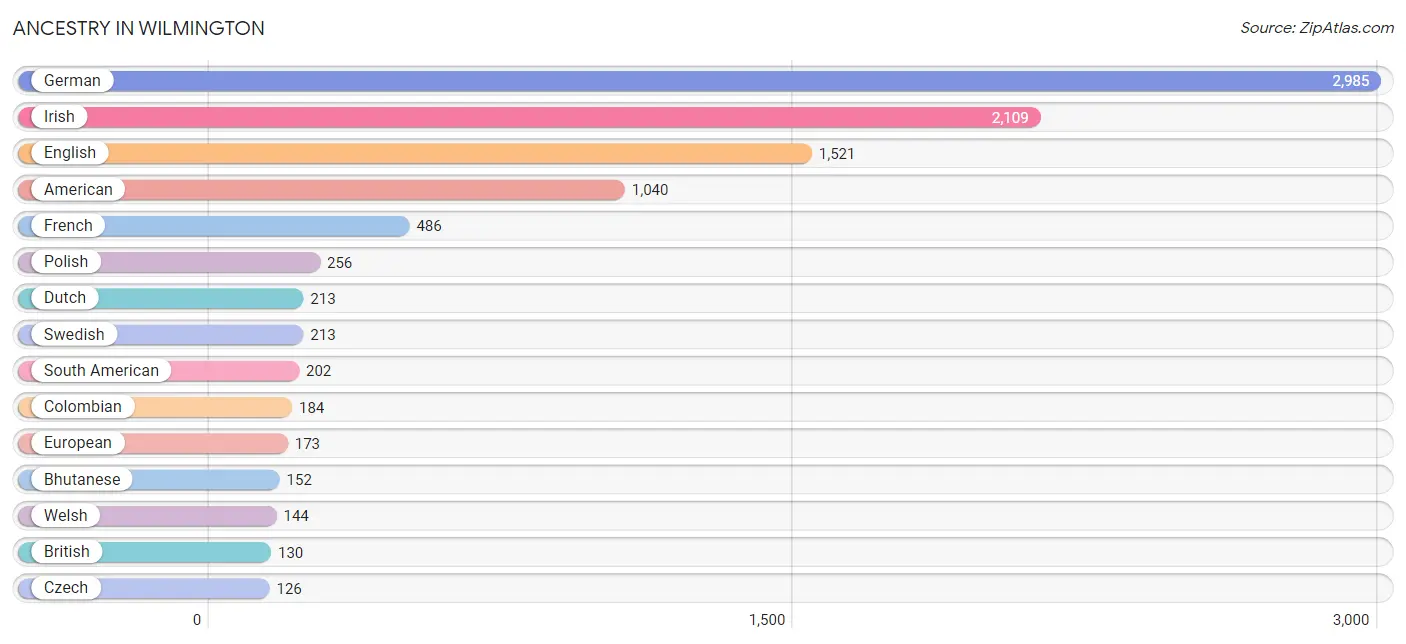
Ancestry in Wilmington
The most populous ancestries reported in Wilmington are German (2,985 | 23.6%), Irish (2,109 | 16.7%), English (1,521 | 12.0%), American (1,040 | 8.2%), and French (486 | 3.8%), together accounting for 64.3% of all Wilmington residents.
| Ancestry | # Population | % Population |
| African | 40 | 0.3% |
| American | 1,040 | 8.2% |
| Arab | 12 | 0.1% |
| Bhutanese | 152 | 1.2% |
| British | 130 | 1.0% |
| Burmese | 14 | 0.1% |
| Canadian | 69 | 0.5% |
| Central American | 8 | 0.1% |
| Cherokee | 24 | 0.2% |
| Colombian | 184 | 1.5% |
| Czech | 126 | 1.0% |
| Danish | 32 | 0.3% |
| Dutch | 213 | 1.7% |
| Dutch West Indian | 21 | 0.2% |
| Ecuadorian | 18 | 0.1% |
| English | 1,521 | 12.0% |
| European | 173 | 1.4% |
| Finnish | 11 | 0.1% |
| French | 486 | 3.8% |
| French Canadian | 13 | 0.1% |
| German | 2,985 | 23.6% |
| Ghanaian | 18 | 0.1% |
| Hungarian | 46 | 0.4% |
| Irish | 2,109 | 16.7% |
| Italian | 67 | 0.5% |
| Korean | 60 | 0.5% |
| Lithuanian | 18 | 0.1% |
| Mexican | 68 | 0.5% |
| Norwegian | 83 | 0.7% |
| Panamanian | 8 | 0.1% |
| Polish | 256 | 2.0% |
| Puerto Rican | 53 | 0.4% |
| Romanian | 10 | 0.1% |
| Russian | 24 | 0.2% |
| Scandinavian | 4 | 0.0% |
| Scotch-Irish | 114 | 0.9% |
| Scottish | 92 | 0.7% |
| Slavic | 1 | 0.0% |
| Slovene | 12 | 0.1% |
| South American | 202 | 1.6% |
| Sri Lankan | 19 | 0.2% |
| Subsaharan African | 58 | 0.5% |
| Swedish | 213 | 1.7% |
| Swiss | 36 | 0.3% |
| Trinidadian and Tobagonian | 53 | 0.4% |
| Turkish | 4 | 0.0% |
| Ukrainian | 29 | 0.2% |
| Welsh | 144 | 1.1% | View All 48 Rows |
Immigrants in Wilmington
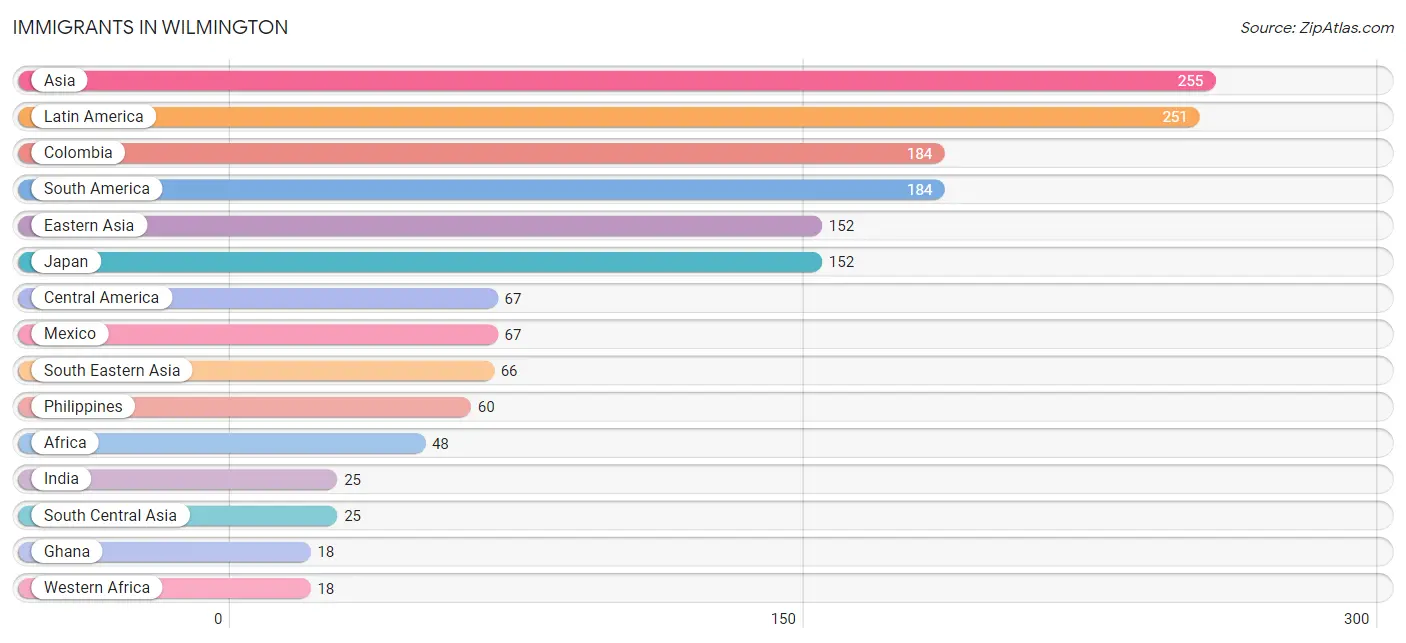
The most numerous immigrant groups reported in Wilmington came from Asia (255 | 2.0%), Latin America (251 | 2.0%), Colombia (184 | 1.5%), South America (184 | 1.5%), and Eastern Asia (152 | 1.2%), together accounting for 8.1% of all Wilmington residents.
| Immigration Origin | # Population | % Population |
| Africa | 48 | 0.4% |
| Asia | 255 | 2.0% |
| Central America | 67 | 0.5% |
| Colombia | 184 | 1.5% |
| Eastern Africa | 11 | 0.1% |
| Eastern Asia | 152 | 1.2% |
| Europe | 6 | 0.1% |
| Germany | 6 | 0.1% |
| Ghana | 18 | 0.1% |
| India | 25 | 0.2% |
| Japan | 152 | 1.2% |
| Jordan | 6 | 0.1% |
| Kenya | 11 | 0.1% |
| Kuwait | 6 | 0.1% |
| Latin America | 251 | 2.0% |
| Mexico | 67 | 0.5% |
| Philippines | 60 | 0.5% |
| South America | 184 | 1.5% |
| South Central Asia | 25 | 0.2% |
| South Eastern Asia | 66 | 0.5% |
| Vietnam | 6 | 0.1% |
| Western Africa | 18 | 0.1% |
| Western Asia | 12 | 0.1% |
| Western Europe | 6 | 0.1% | View All 24 Rows |
Sex and Age in Wilmington
Sex and Age in Wilmington
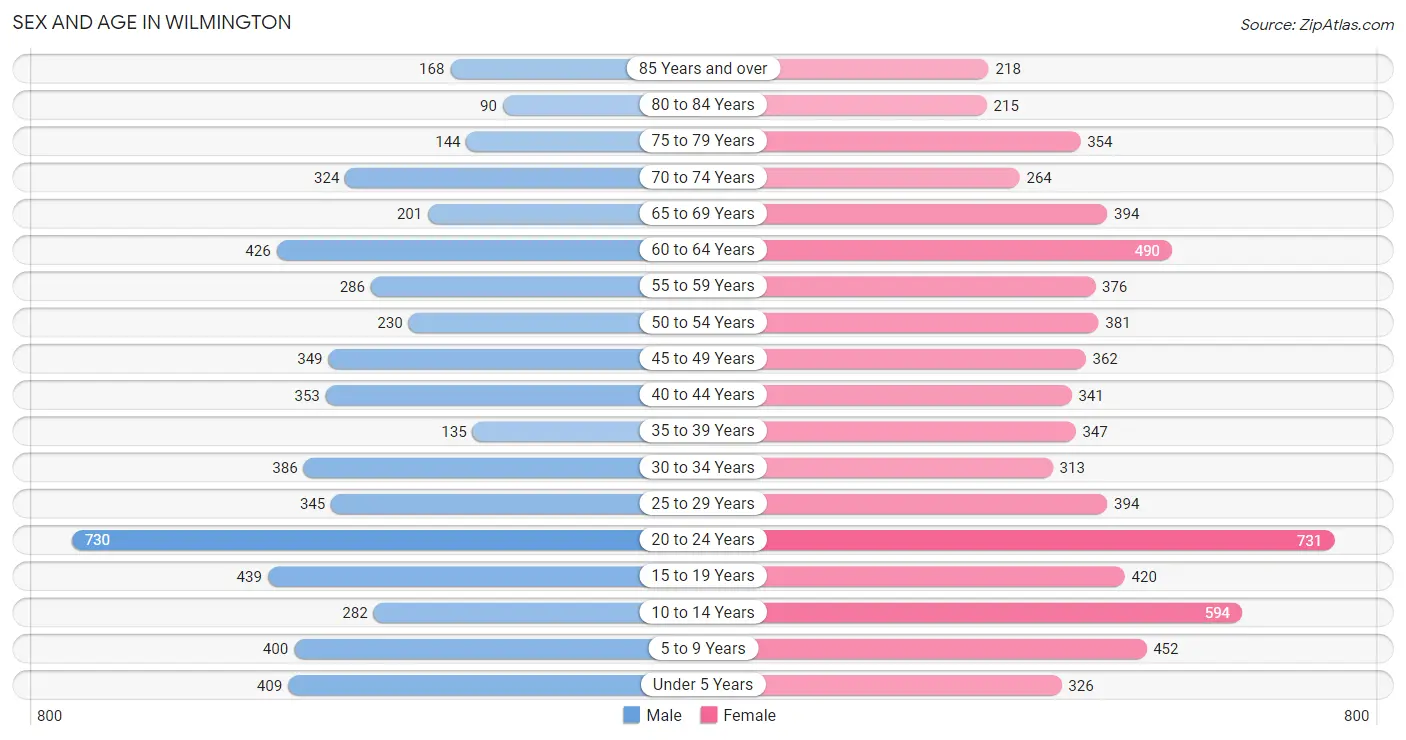
The most populous age groups in Wilmington are 20 to 24 Years (730 | 12.8%) for men and 20 to 24 Years (731 | 10.5%) for women.
| Age Bracket | Male | Female |
| Under 5 Years | 409 (7.2%) | 326 (4.7%) |
| 5 to 9 Years | 400 (7.0%) | 452 (6.5%) |
| 10 to 14 Years | 282 (5.0%) | 594 (8.5%) |
| 15 to 19 Years | 439 (7.7%) | 420 (6.0%) |
| 20 to 24 Years | 730 (12.8%) | 731 (10.5%) |
| 25 to 29 Years | 345 (6.1%) | 394 (5.7%) |
| 30 to 34 Years | 386 (6.8%) | 313 (4.5%) |
| 35 to 39 Years | 135 (2.4%) | 347 (5.0%) |
| 40 to 44 Years | 353 (6.2%) | 341 (4.9%) |
| 45 to 49 Years | 349 (6.1%) | 362 (5.2%) |
| 50 to 54 Years | 230 (4.0%) | 381 (5.5%) |
| 55 to 59 Years | 286 (5.0%) | 376 (5.4%) |
| 60 to 64 Years | 426 (7.5%) | 490 (7.0%) |
| 65 to 69 Years | 201 (3.5%) | 394 (5.7%) |
| 70 to 74 Years | 324 (5.7%) | 264 (3.8%) |
| 75 to 79 Years | 144 (2.5%) | 354 (5.1%) |
| 80 to 84 Years | 90 (1.6%) | 215 (3.1%) |
| 85 Years and over | 168 (2.9%) | 218 (3.1%) |
| Total | 5,697 (100.0%) | 6,972 (100.0%) |
Families and Households in Wilmington
Median Family Size in Wilmington
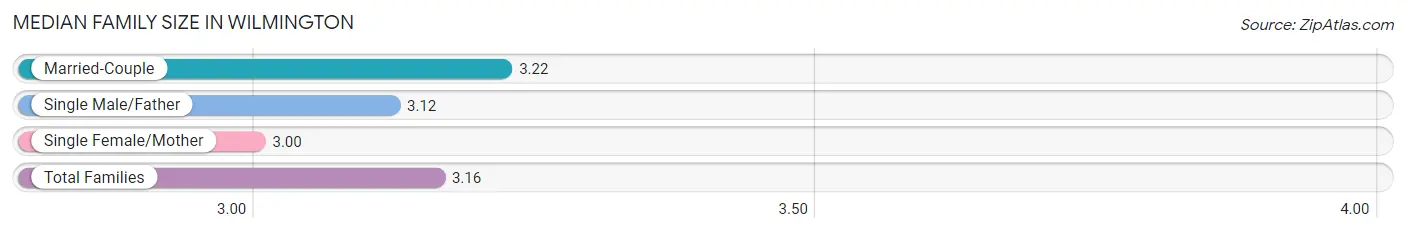
The median family size in Wilmington is 3.16 persons per family, with married-couple families (1,834 | 67.2%) accounting for the largest median family size of 3.22 persons per family. On the other hand, single female/mother families (679 | 24.9%) represent the smallest median family size with 3.00 persons per family.
| Family Type | # Families | Family Size |
| Married-Couple | 1,834 (67.2%) | 3.22 |
| Single Male/Father | 216 (7.9%) | 3.12 |
| Single Female/Mother | 679 (24.9%) | 3.00 |
| Total Families | 2,729 (100.0%) | 3.16 |
Median Household Size in Wilmington
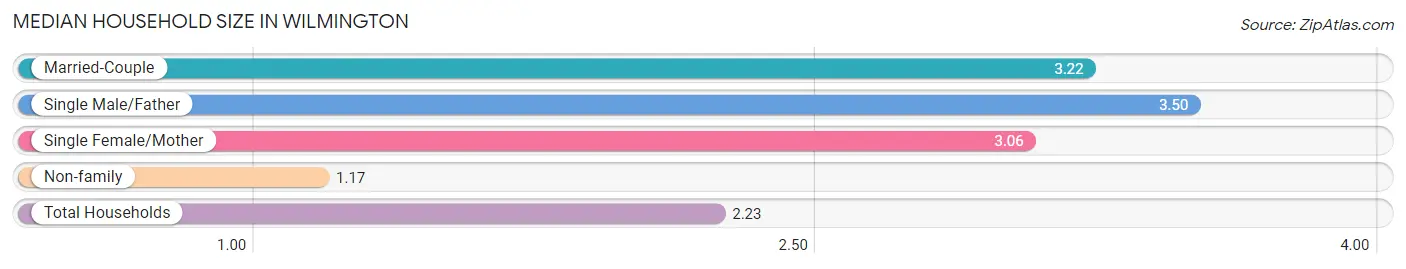
The median household size in Wilmington is 2.23 persons per household, with single male/father households (216 | 4.2%) accounting for the largest median household size of 3.5 persons per household. non-family households (2,478 | 47.6%) represent the smallest median household size with 1.17 persons per household.
| Household Type | # Households | Household Size |
| Married-Couple | 1,834 (35.2%) | 3.22 |
| Single Male/Father | 216 (4.2%) | 3.50 |
| Single Female/Mother | 679 (13.0%) | 3.06 |
| Non-family | 2,478 (47.6%) | 1.17 |
| Total Households | 5,207 (100.0%) | 2.23 |
Household Size by Marriage Status in Wilmington
Out of a total of 5,207 households in Wilmington, 2,729 (52.4%) are family households, while 2,478 (47.6%) are nonfamily households. The most numerous type of family households are 2-person households, comprising 1,260, and the most common type of nonfamily households are 1-person households, comprising 2,227.
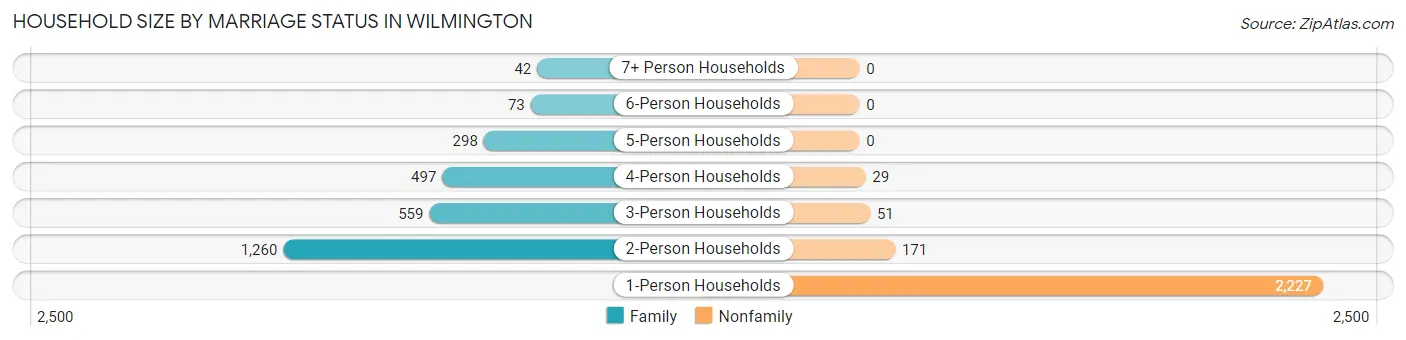
| Household Size | Family Households | Nonfamily Households |
| 1-Person Households | - | 2,227 (42.8%) |
| 2-Person Households | 1,260 (24.2%) | 171 (3.3%) |
| 3-Person Households | 559 (10.7%) | 51 (1.0%) |
| 4-Person Households | 497 (9.5%) | 29 (0.6%) |
| 5-Person Households | 298 (5.7%) | 0 (0.0%) |
| 6-Person Households | 73 (1.4%) | 0 (0.0%) |
| 7+ Person Households | 42 (0.8%) | 0 (0.0%) |
| Total | 2,729 (52.4%) | 2,478 (47.6%) |
Female Fertility in Wilmington
Fertility by Age in Wilmington
Average fertility rate in Wilmington is 26.0 births per 1,000 women. Women in the age bracket of 20 to 34 years have the highest fertility rate with 56.0 births per 1,000 women. Women in the age bracket of 20 to 34 years acount for 100.0% of all women with births.
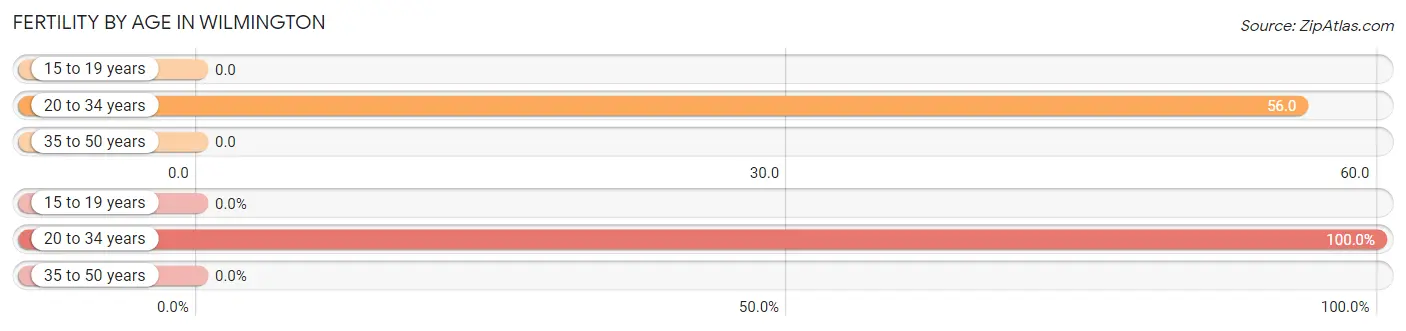
| Age Bracket | Women with Births | Births / 1,000 Women |
| 15 to 19 years | 0 (0.0%) | 0.0 |
| 20 to 34 years | 80 (100.0%) | 56.0 |
| 35 to 50 years | 0 (0.0%) | 0.0 |
| Total | 80 (100.0%) | 26.0 |
Fertility by Age by Marriage Status in Wilmington
65.0% of women with births (80) in Wilmington are married. The highest percentage of unmarried women with births falls into 20 to 34 years age bracket with 35.0% of them unmarried at the time of birth, while the lowest percentage of unmarried women with births belong to 20 to 34 years age bracket with 35.0% of them unmarried.
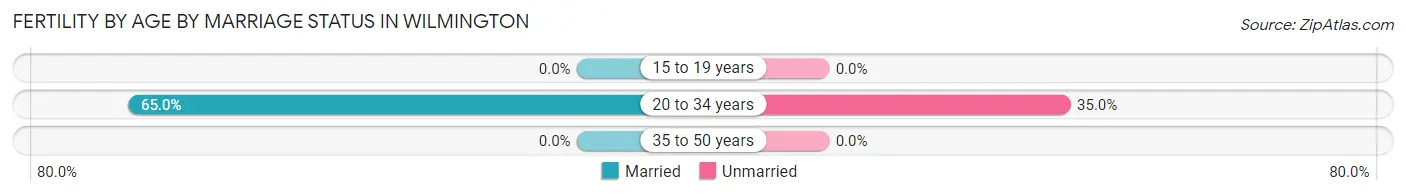
| Age Bracket | Married | Unmarried |
| 15 to 19 years | 0 (0.0%) | 0 (0.0%) |
| 20 to 34 years | 52 (65.0%) | 28 (35.0%) |
| 35 to 50 years | 0 (0.0%) | 0 (0.0%) |
| Total | 52 (65.0%) | 28 (35.0%) |
Fertility by Education in Wilmington
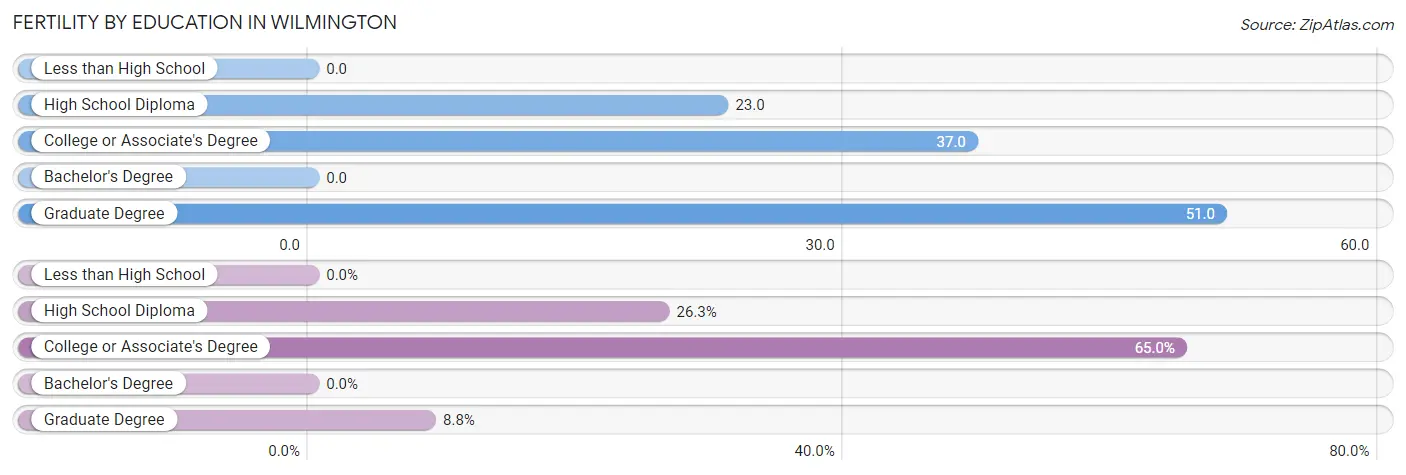
| Educational Attainment | Women with Births | Births / 1,000 Women |
| Less than High School | 0 (0.0%) | 0.0 |
| High School Diploma | 21 (26.3%) | 23.0 |
| College or Associate's Degree | 52 (65.0%) | 37.0 |
| Bachelor's Degree | 0 (0.0%) | 0.0 |
| Graduate Degree | 7 (8.7%) | 51.0 |
| Total | 80 (100.0%) | 26.0 |
Fertility by Education by Marriage Status in Wilmington
35.0% of women with births in Wilmington are unmarried. Women with the educational attainment of college or associate's degree are most likely to be married with 100.0% of them married at childbirth, while women with the educational attainment of high school diploma are least likely to be married with 100.0% of them unmarried at childbirth.
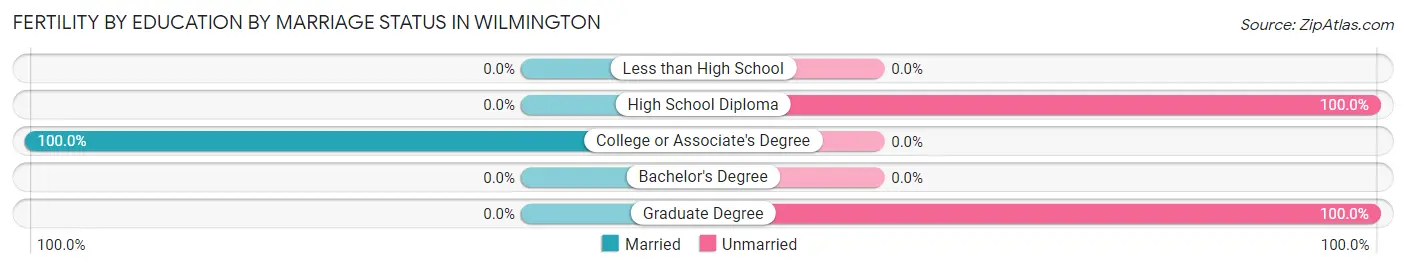
| Educational Attainment | Married | Unmarried |
| Less than High School | 0 (0.0%) | 0 (0.0%) |
| High School Diploma | 0 (0.0%) | 21 (100.0%) |
| College or Associate's Degree | 52 (100.0%) | 0 (0.0%) |
| Bachelor's Degree | 0 (0.0%) | 0 (0.0%) |
| Graduate Degree | 0 (0.0%) | 7 (100.0%) |
| Total | 52 (65.0%) | 28 (35.0%) |
Employment Characteristics in Wilmington
Employment by Class of Employer in Wilmington
Among the 5,591 employed individuals in Wilmington, private company employees (3,980 | 71.2%), not-for-profit organizations (536 | 9.6%), and local government employees (385 | 6.9%) make up the most common classes of employment.
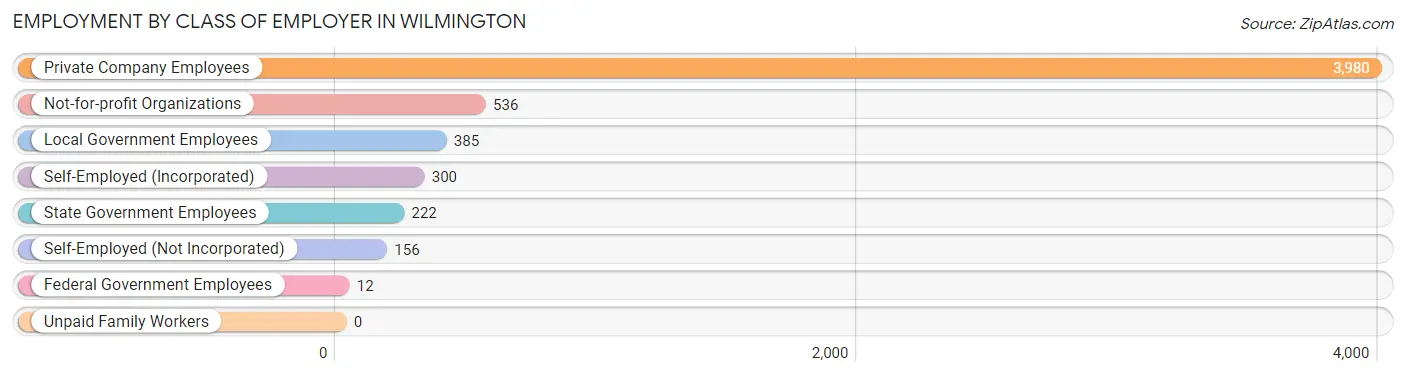
| Employer Class | # Employees | % Employees |
| Private Company Employees | 3,980 | 71.2% |
| Self-Employed (Incorporated) | 300 | 5.4% |
| Self-Employed (Not Incorporated) | 156 | 2.8% |
| Not-for-profit Organizations | 536 | 9.6% |
| Local Government Employees | 385 | 6.9% |
| State Government Employees | 222 | 4.0% |
| Federal Government Employees | 12 | 0.2% |
| Unpaid Family Workers | 0 | 0.0% |
| Total | 5,591 | 100.0% |
Employment Status by Age in Wilmington
According to the labor force statistics for Wilmington, out of the total population over 16 years of age (10,101), 59.5% or 6,010 individuals are in the labor force, with 5.0% or 300 of them unemployed. The age group with the highest labor force participation rate is 25 to 29 years, with 93.9% or 694 individuals in the labor force. Within the labor force, the 16 to 19 years age range has the highest percentage of unemployed individuals, with 17.1% or 81 of them being unemployed.
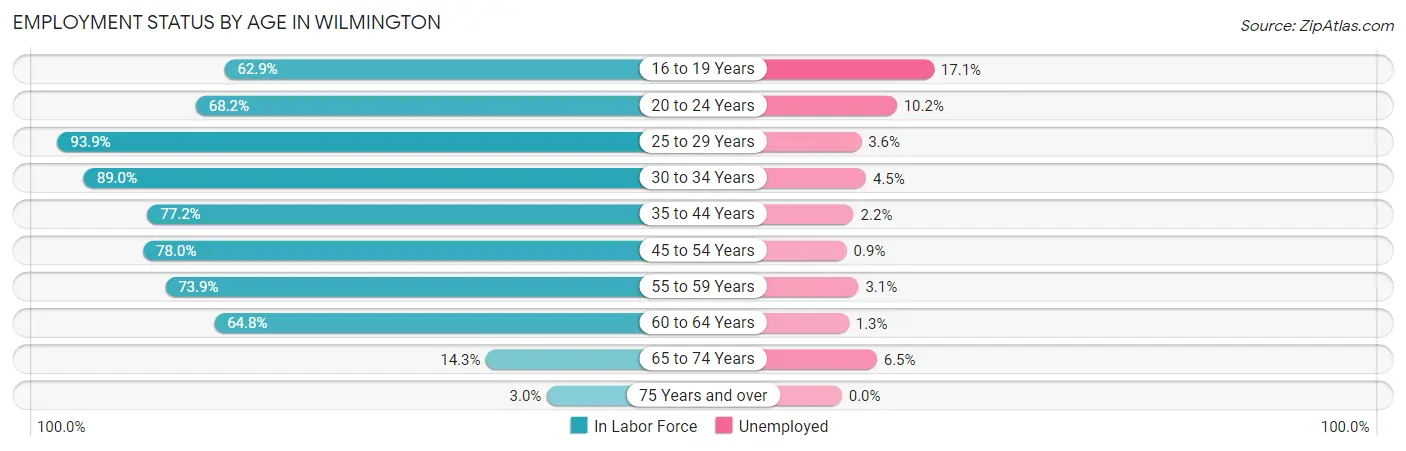
| Age Bracket | In Labor Force | Unemployed |
| 16 to 19 Years | 474 (62.9%) | 81 (17.1%) |
| 20 to 24 Years | 996 (68.2%) | 102 (10.2%) |
| 25 to 29 Years | 694 (93.9%) | 25 (3.6%) |
| 30 to 34 Years | 622 (89.0%) | 28 (4.5%) |
| 35 to 44 Years | 908 (77.2%) | 20 (2.2%) |
| 45 to 54 Years | 1,031 (78.0%) | 9 (0.9%) |
| 55 to 59 Years | 489 (73.9%) | 15 (3.1%) |
| 60 to 64 Years | 594 (64.8%) | 8 (1.3%) |
| 65 to 74 Years | 169 (14.3%) | 11 (6.5%) |
| 75 Years and over | 36 (3.0%) | 0 (0.0%) |
| Total | 6,010 (59.5%) | 300 (5.0%) |
Employment Status by Educational Attainment in Wilmington
According to labor force statistics for Wilmington, 78.7% of individuals (4,340) out of the total population between 25 and 64 years of age (5,514) are in the labor force, with 2.4% or 104 of them being unemployed. The group with the highest labor force participation rate are those with the educational attainment of bachelor's degree or higher, with 96.6% or 1,235 individuals in the labor force. Within the labor force, individuals with less than high school education have the highest percentage of unemployment, with 5.0% or 13 of them being unemployed.
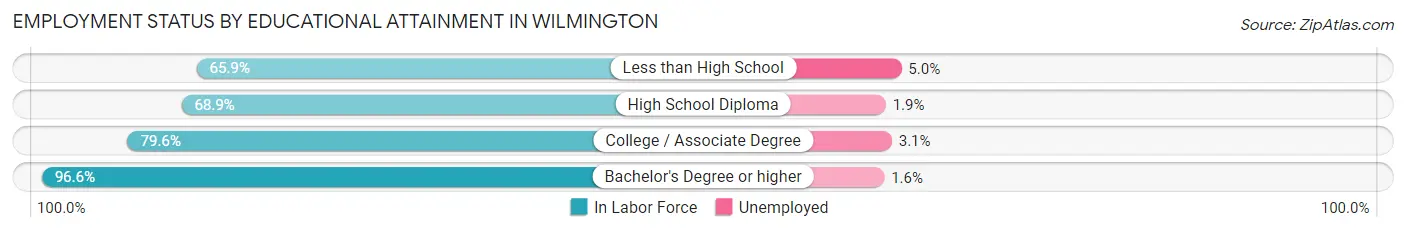
| Educational Attainment | In Labor Force | Unemployed |
| Less than High School | 259 (65.9%) | 20 (5.0%) |
| High School Diploma | 1,377 (68.9%) | 38 (1.9%) |
| College / Associate Degree | 1,469 (79.6%) | 57 (3.1%) |
| Bachelor's Degree or higher | 1,235 (96.6%) | 20 (1.6%) |
| Total | 4,340 (78.7%) | 132 (2.4%) |
Employment Occupations by Sex in Wilmington
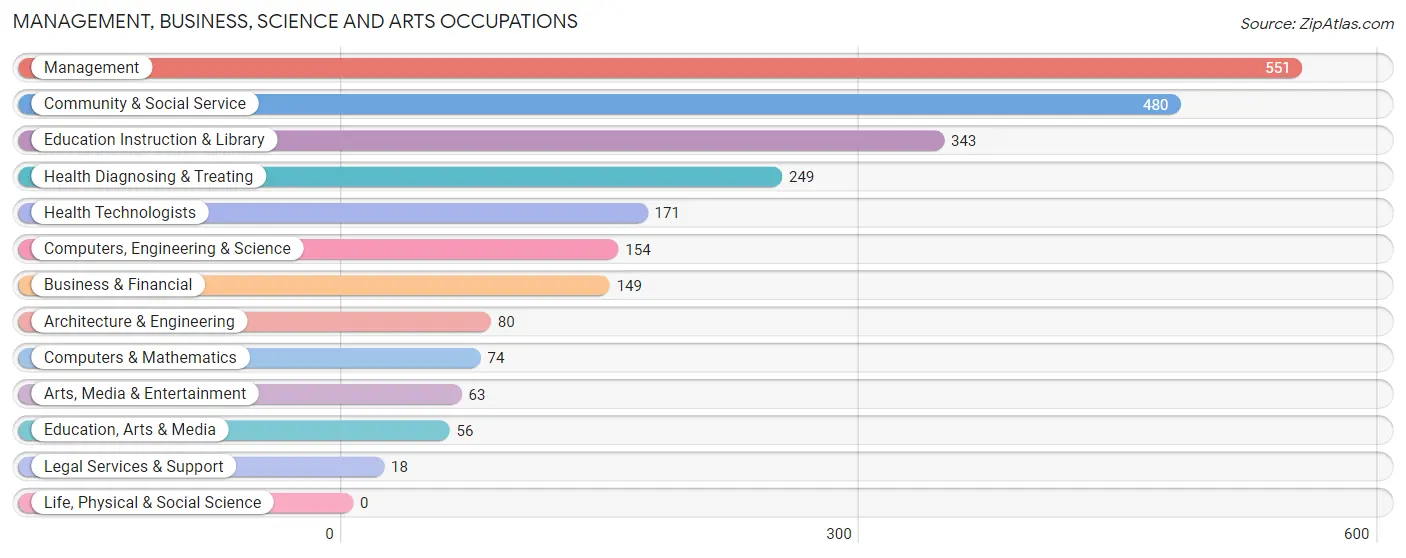
Management, Business, Science and Arts Occupations
The most common Management, Business, Science and Arts occupations in Wilmington are Management (551 | 9.6%), Community & Social Service (480 | 8.4%), Education Instruction & Library (343 | 6.0%), Health Diagnosing & Treating (249 | 4.4%), and Health Technologists (171 | 3.0%).
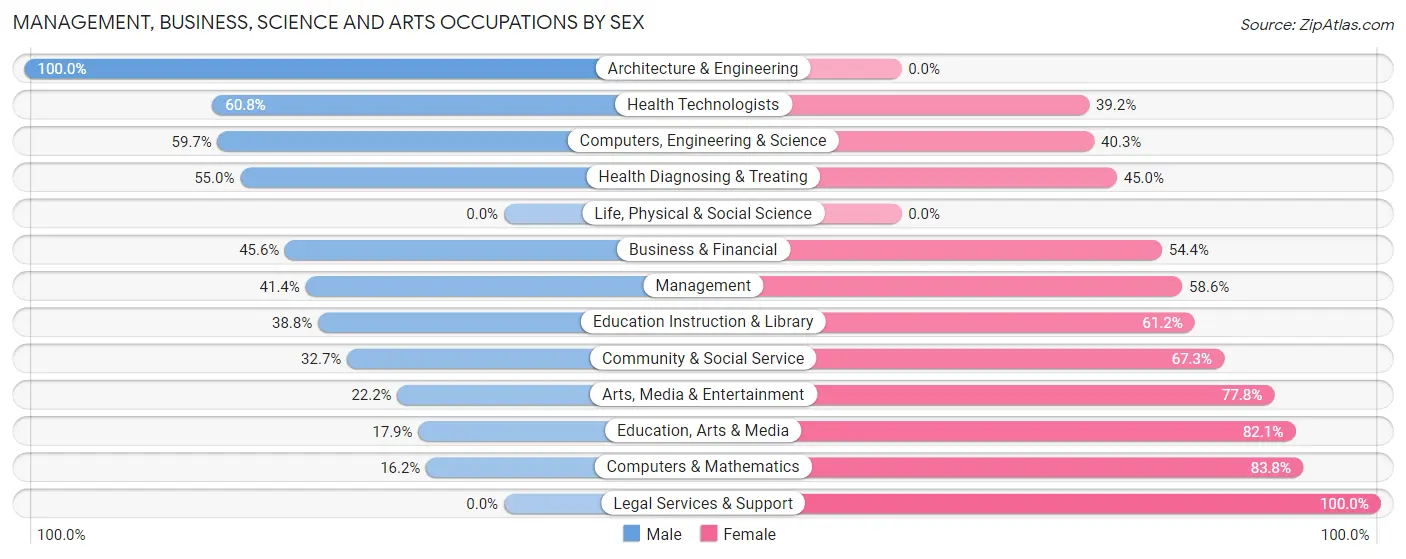
Management, Business, Science and Arts Occupations by Sex
Within the Management, Business, Science and Arts occupations in Wilmington, the most male-oriented occupations are Architecture & Engineering (100.0%), Health Technologists (60.8%), and Computers, Engineering & Science (59.7%), while the most female-oriented occupations are Legal Services & Support (100.0%), Computers & Mathematics (83.8%), and Education, Arts & Media (82.1%).
| Occupation | Male | Female |
| Management | 228 (41.4%) | 323 (58.6%) |
| Business & Financial | 68 (45.6%) | 81 (54.4%) |
| Computers, Engineering & Science | 92 (59.7%) | 62 (40.3%) |
| Computers & Mathematics | 12 (16.2%) | 62 (83.8%) |
| Architecture & Engineering | 80 (100.0%) | 0 (0.0%) |
| Life, Physical & Social Science | 0 (0.0%) | 0 (0.0%) |
| Community & Social Service | 157 (32.7%) | 323 (67.3%) |
| Education, Arts & Media | 10 (17.9%) | 46 (82.1%) |
| Legal Services & Support | 0 (0.0%) | 18 (100.0%) |
| Education Instruction & Library | 133 (38.8%) | 210 (61.2%) |
| Arts, Media & Entertainment | 14 (22.2%) | 49 (77.8%) |
| Health Diagnosing & Treating | 137 (55.0%) | 112 (45.0%) |
| Health Technologists | 104 (60.8%) | 67 (39.2%) |
| Total (Category) | 682 (43.1%) | 901 (56.9%) |
| Total (Overall) | 2,685 (47.0%) | 3,029 (53.0%) |
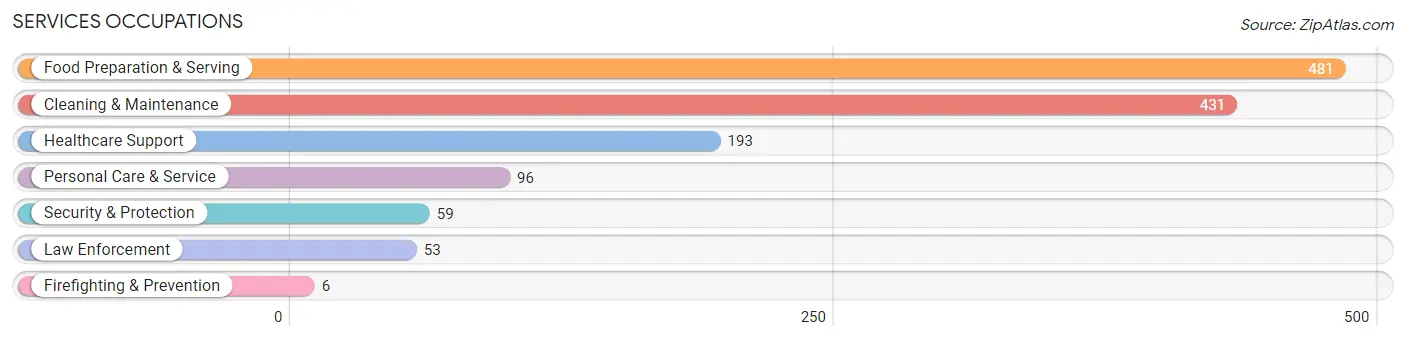
Services Occupations
The most common Services occupations in Wilmington are Food Preparation & Serving (481 | 8.4%), Cleaning & Maintenance (431 | 7.5%), Healthcare Support (193 | 3.4%), Personal Care & Service (96 | 1.7%), and Security & Protection (59 | 1.0%).
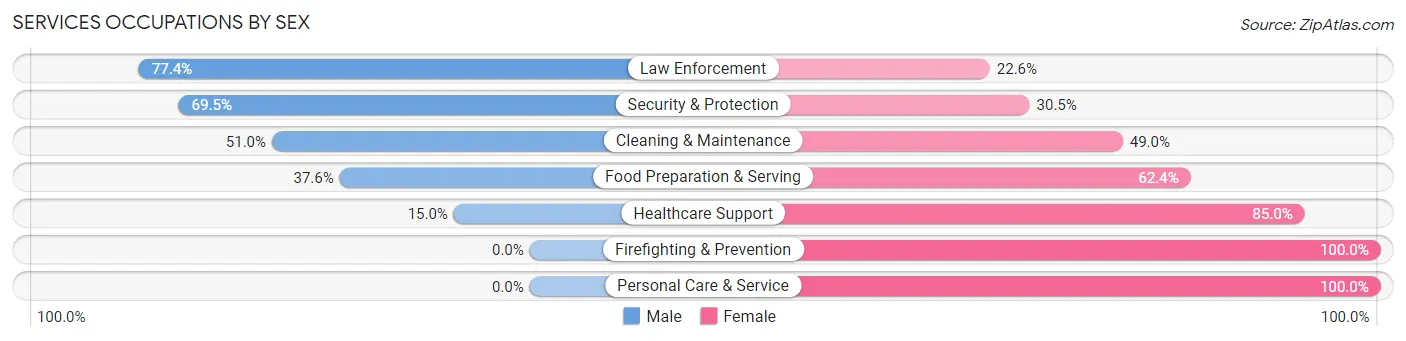
Services Occupations by Sex
Within the Services occupations in Wilmington, the most male-oriented occupations are Law Enforcement (77.4%), Security & Protection (69.5%), and Cleaning & Maintenance (51.0%), while the most female-oriented occupations are Firefighting & Prevention (100.0%), Personal Care & Service (100.0%), and Healthcare Support (85.0%).
| Occupation | Male | Female |
| Healthcare Support | 29 (15.0%) | 164 (85.0%) |
| Security & Protection | 41 (69.5%) | 18 (30.5%) |
| Firefighting & Prevention | 0 (0.0%) | 6 (100.0%) |
| Law Enforcement | 41 (77.4%) | 12 (22.6%) |
| Food Preparation & Serving | 181 (37.6%) | 300 (62.4%) |
| Cleaning & Maintenance | 220 (51.0%) | 211 (49.0%) |
| Personal Care & Service | 0 (0.0%) | 96 (100.0%) |
| Total (Category) | 471 (37.4%) | 789 (62.6%) |
| Total (Overall) | 2,685 (47.0%) | 3,029 (53.0%) |
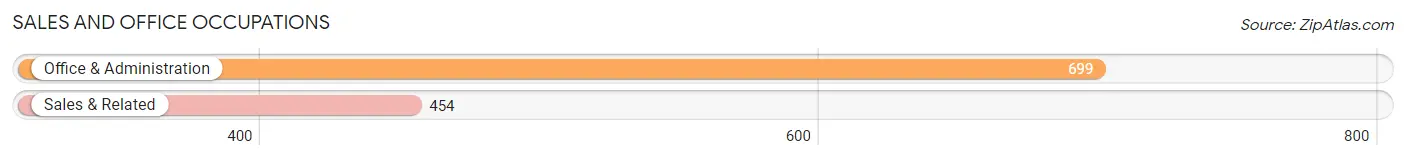
Sales and Office Occupations
The most common Sales and Office occupations in Wilmington are Office & Administration (699 | 12.2%), and Sales & Related (454 | 8.0%).
Sales and Office Occupations by Sex
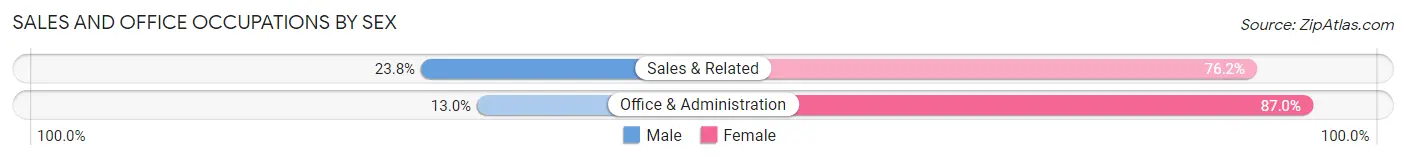
| Occupation | Male | Female |
| Sales & Related | 108 (23.8%) | 346 (76.2%) |
| Office & Administration | 91 (13.0%) | 608 (87.0%) |
| Total (Category) | 199 (17.3%) | 954 (82.7%) |
| Total (Overall) | 2,685 (47.0%) | 3,029 (53.0%) |
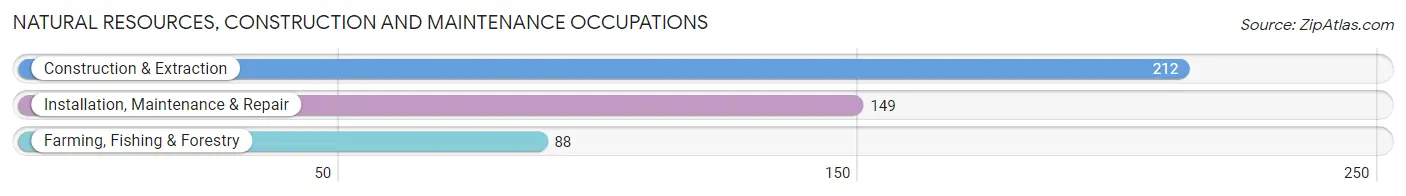
Natural Resources, Construction and Maintenance Occupations
The most common Natural Resources, Construction and Maintenance occupations in Wilmington are Construction & Extraction (212 | 3.7%), Installation, Maintenance & Repair (149 | 2.6%), and Farming, Fishing & Forestry (88 | 1.5%).
Natural Resources, Construction and Maintenance Occupations by Sex
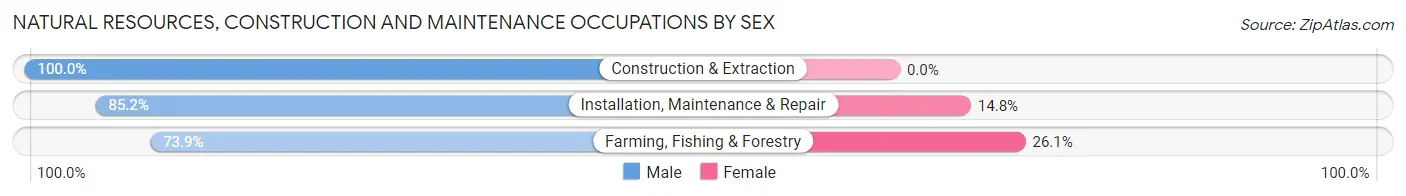
| Occupation | Male | Female |
| Farming, Fishing & Forestry | 65 (73.9%) | 23 (26.1%) |
| Construction & Extraction | 212 (100.0%) | 0 (0.0%) |
| Installation, Maintenance & Repair | 127 (85.2%) | 22 (14.8%) |
| Total (Category) | 404 (90.0%) | 45 (10.0%) |
| Total (Overall) | 2,685 (47.0%) | 3,029 (53.0%) |
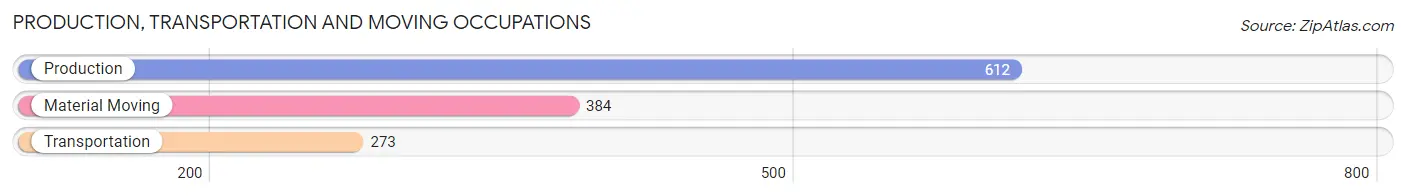
Production, Transportation and Moving Occupations
The most common Production, Transportation and Moving occupations in Wilmington are Production (612 | 10.7%), Material Moving (384 | 6.7%), and Transportation (273 | 4.8%).
Production, Transportation and Moving Occupations by Sex
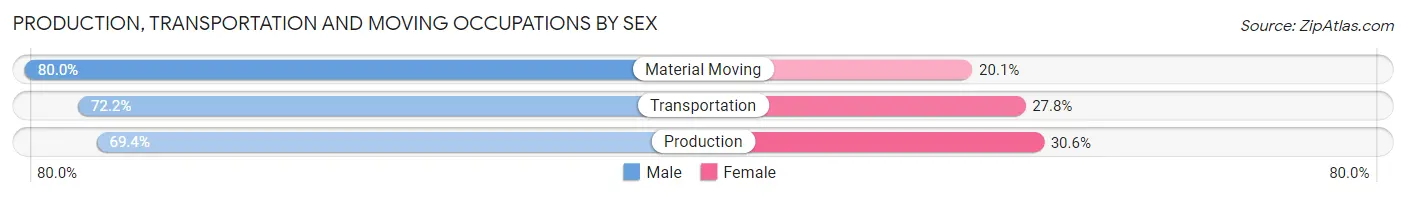
| Occupation | Male | Female |
| Production | 425 (69.4%) | 187 (30.6%) |
| Transportation | 197 (72.2%) | 76 (27.8%) |
| Material Moving | 307 (79.9%) | 77 (20.1%) |
| Total (Category) | 929 (73.2%) | 340 (26.8%) |
| Total (Overall) | 2,685 (47.0%) | 3,029 (53.0%) |
Employment Industries by Sex in Wilmington
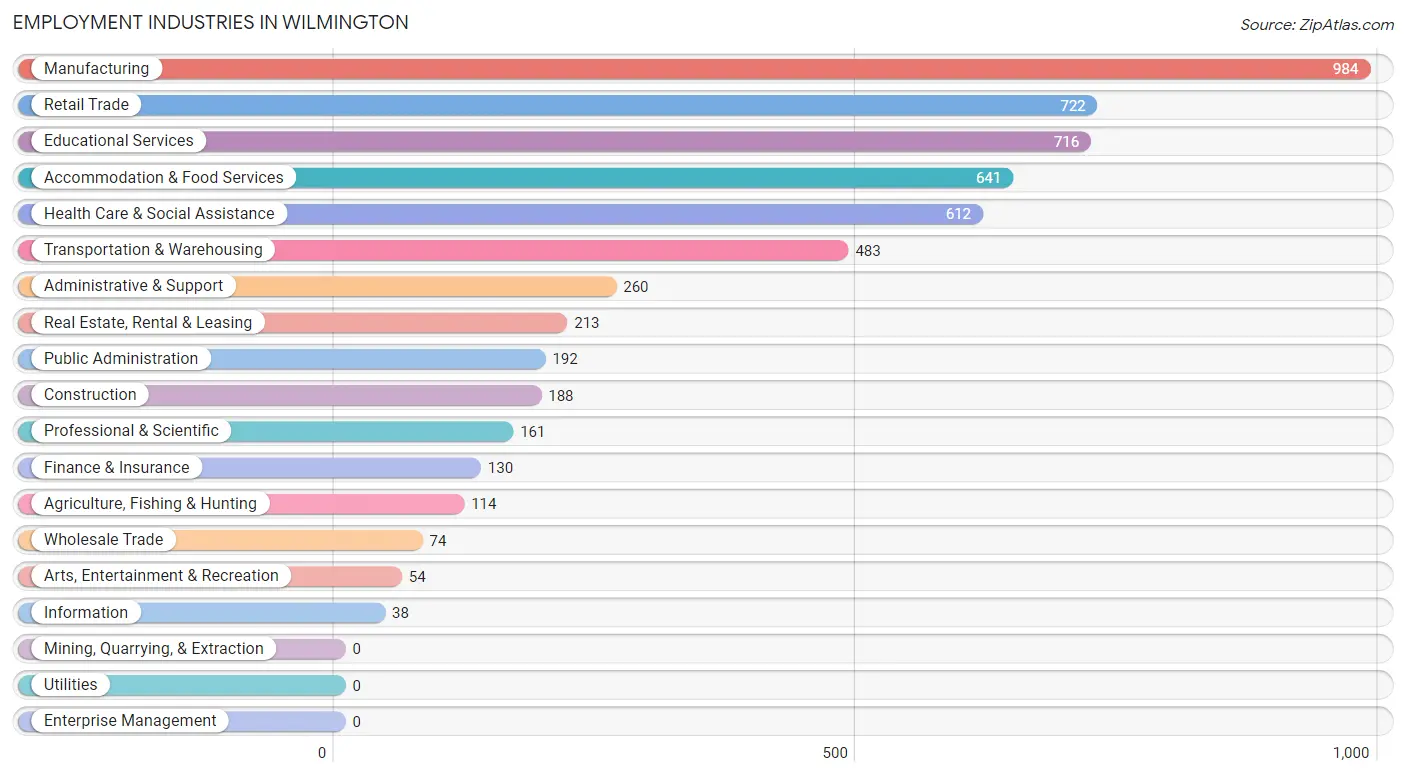
Employment Industries in Wilmington
The major employment industries in Wilmington include Manufacturing (984 | 17.2%), Retail Trade (722 | 12.6%), Educational Services (716 | 12.5%), Accommodation & Food Services (641 | 11.2%), and Health Care & Social Assistance (612 | 10.7%).
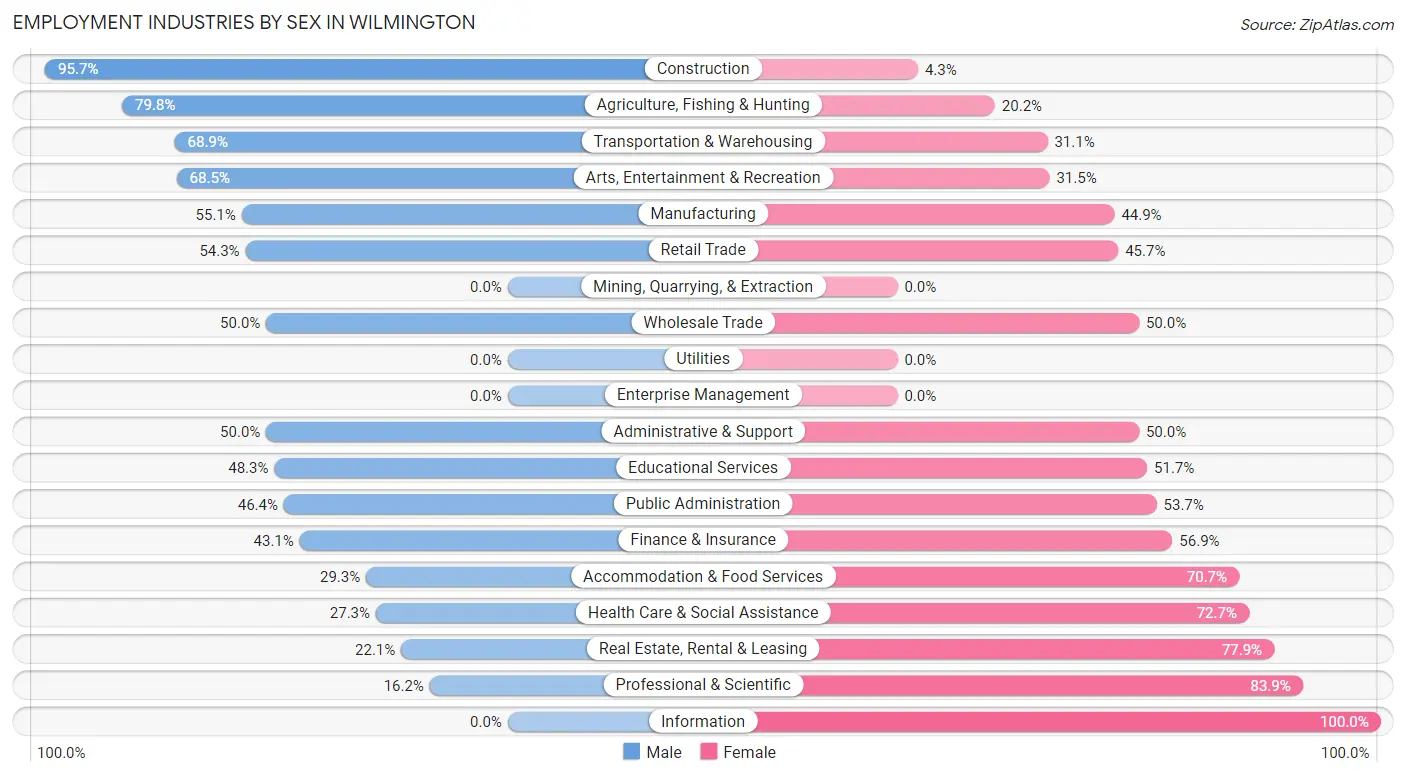
Employment Industries by Sex in Wilmington
The Wilmington industries that see more men than women are Construction (95.7%), Agriculture, Fishing & Hunting (79.8%), and Transportation & Warehousing (68.9%), whereas the industries that tend to have a higher number of women are Information (100.0%), Professional & Scientific (83.9%), and Real Estate, Rental & Leasing (77.9%).
| Industry | Male | Female |
| Agriculture, Fishing & Hunting | 91 (79.8%) | 23 (20.2%) |
| Mining, Quarrying, & Extraction | 0 (0.0%) | 0 (0.0%) |
| Construction | 180 (95.7%) | 8 (4.3%) |
| Manufacturing | 542 (55.1%) | 442 (44.9%) |
| Wholesale Trade | 37 (50.0%) | 37 (50.0%) |
| Retail Trade | 392 (54.3%) | 330 (45.7%) |
| Transportation & Warehousing | 333 (68.9%) | 150 (31.1%) |
| Utilities | 0 (0.0%) | 0 (0.0%) |
| Information | 0 (0.0%) | 38 (100.0%) |
| Finance & Insurance | 56 (43.1%) | 74 (56.9%) |
| Real Estate, Rental & Leasing | 47 (22.1%) | 166 (77.9%) |
| Professional & Scientific | 26 (16.2%) | 135 (83.9%) |
| Enterprise Management | 0 (0.0%) | 0 (0.0%) |
| Administrative & Support | 130 (50.0%) | 130 (50.0%) |
| Educational Services | 346 (48.3%) | 370 (51.7%) |
| Health Care & Social Assistance | 167 (27.3%) | 445 (72.7%) |
| Arts, Entertainment & Recreation | 37 (68.5%) | 17 (31.5%) |
| Accommodation & Food Services | 188 (29.3%) | 453 (70.7%) |
| Public Administration | 89 (46.4%) | 103 (53.6%) |
| Total | 2,685 (47.0%) | 3,029 (53.0%) |
Education in Wilmington
School Enrollment in Wilmington
The most common levels of schooling among the 3,582 students in Wilmington are college / undergraduate (1,339 | 37.4%), middle school (730 | 20.4%), and elementary school (700 | 19.5%).
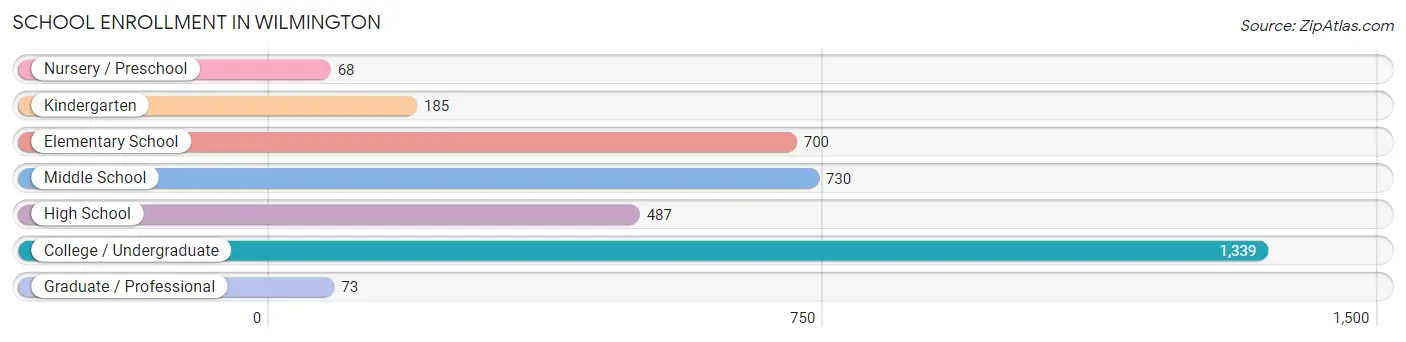
| School Level | # Students | % Students |
| Nursery / Preschool | 68 | 1.9% |
| Kindergarten | 185 | 5.2% |
| Elementary School | 700 | 19.5% |
| Middle School | 730 | 20.4% |
| High School | 487 | 13.6% |
| College / Undergraduate | 1,339 | 37.4% |
| Graduate / Professional | 73 | 2.0% |
| Total | 3,582 | 100.0% |
School Enrollment by Age by Funding Source in Wilmington
Out of a total of 3,582 students who are enrolled in schools in Wilmington, 1,300 (36.3%) attend a private institution, while the remaining 2,282 (63.7%) are enrolled in public schools. The age group of 35 years and over has the highest likelihood of being enrolled in private schools, with 33 (89.2% in the age bracket) enrolled. Conversely, the age group of 3 to 4 year olds has the lowest likelihood of being enrolled in a private school, with 38 (100.0% in the age bracket) attending a public institution.
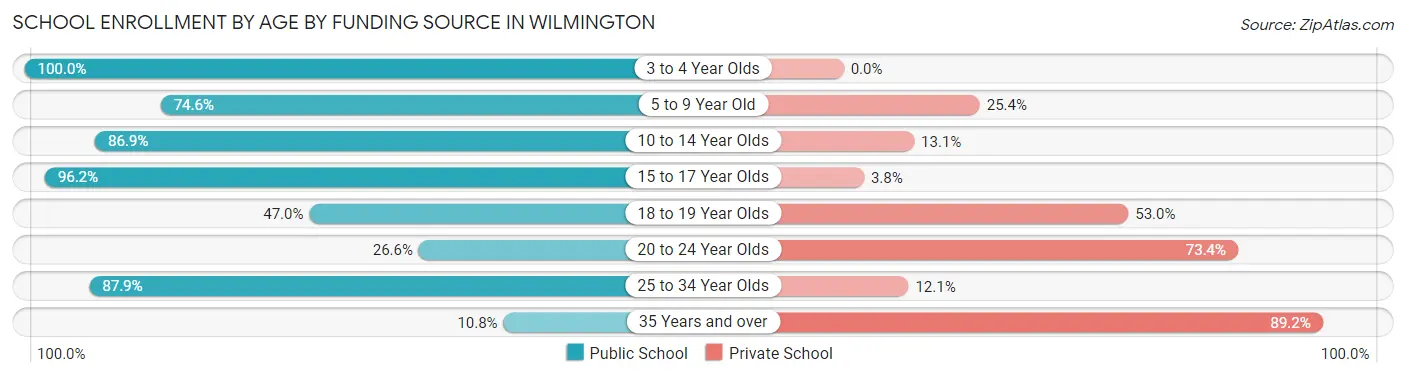
| Age Bracket | Public School | Private School |
| 3 to 4 Year Olds | 38 (100.0%) | 0 (0.0%) |
| 5 to 9 Year Old | 574 (74.6%) | 195 (25.4%) |
| 10 to 14 Year Olds | 761 (86.9%) | 115 (13.1%) |
| 15 to 17 Year Olds | 356 (96.2%) | 14 (3.8%) |
| 18 to 19 Year Olds | 187 (47.0%) | 211 (53.0%) |
| 20 to 24 Year Olds | 260 (26.6%) | 718 (73.4%) |
| 25 to 34 Year Olds | 102 (87.9%) | 14 (12.1%) |
| 35 Years and over | 4 (10.8%) | 33 (89.2%) |
| Total | 2,282 (63.7%) | 1,300 (36.3%) |
Educational Attainment by Field of Study in Wilmington
Education (412 | 21.2%), business (278 | 14.3%), bio, nature & agricultural (234 | 12.0%), science & technology (187 | 9.6%), and engineering (137 | 7.0%) are the most common fields of study among 1,946 individuals in Wilmington who have obtained a bachelor's degree or higher.
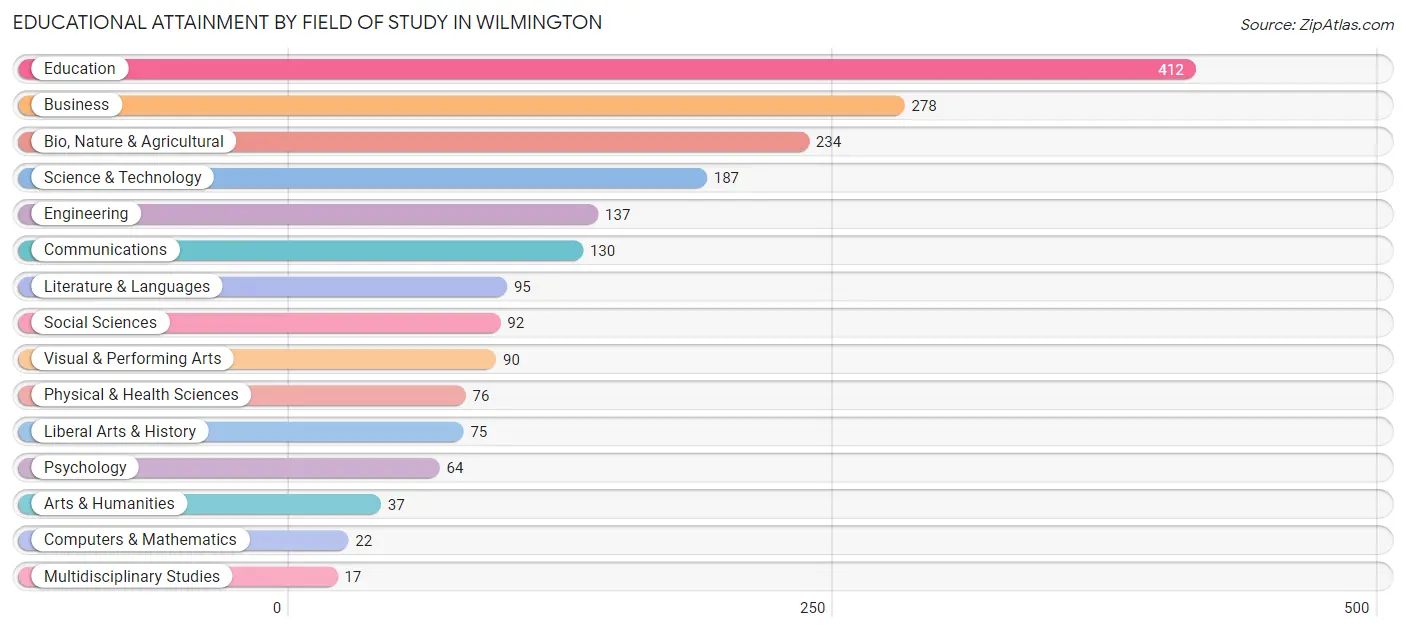
| Field of Study | # Graduates | % Graduates |
| Computers & Mathematics | 22 | 1.1% |
| Bio, Nature & Agricultural | 234 | 12.0% |
| Physical & Health Sciences | 76 | 3.9% |
| Psychology | 64 | 3.3% |
| Social Sciences | 92 | 4.7% |
| Engineering | 137 | 7.0% |
| Multidisciplinary Studies | 17 | 0.9% |
| Science & Technology | 187 | 9.6% |
| Business | 278 | 14.3% |
| Education | 412 | 21.2% |
| Literature & Languages | 95 | 4.9% |
| Liberal Arts & History | 75 | 3.8% |
| Visual & Performing Arts | 90 | 4.6% |
| Communications | 130 | 6.7% |
| Arts & Humanities | 37 | 1.9% |
| Total | 1,946 | 100.0% |
Transportation & Commute in Wilmington
Vehicle Availability by Sex in Wilmington
The most prevalent vehicle ownership categories in Wilmington are males with 2 vehicles (852, accounting for 35.5%) and females with 2 vehicles (957, making up 32.2%).
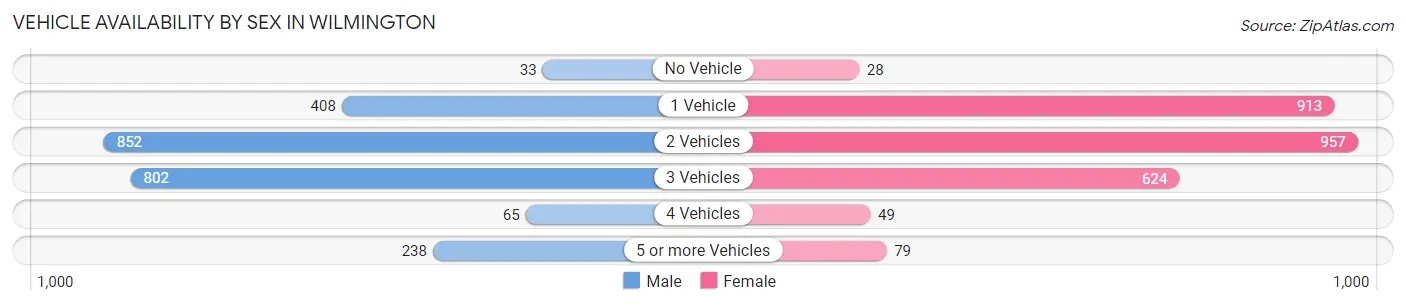
| Vehicles Available | Male | Female |
| No Vehicle | 33 (1.4%) | 28 (1.1%) |
| 1 Vehicle | 408 (17.0%) | 913 (34.4%) |
| 2 Vehicles | 852 (35.5%) | 957 (36.1%) |
| 3 Vehicles | 802 (33.4%) | 624 (23.5%) |
| 4 Vehicles | 65 (2.7%) | 49 (1.8%) |
| 5 or more Vehicles | 238 (9.9%) | 79 (3.0%) |
| Total | 2,398 (100.0%) | 2,650 (100.0%) |
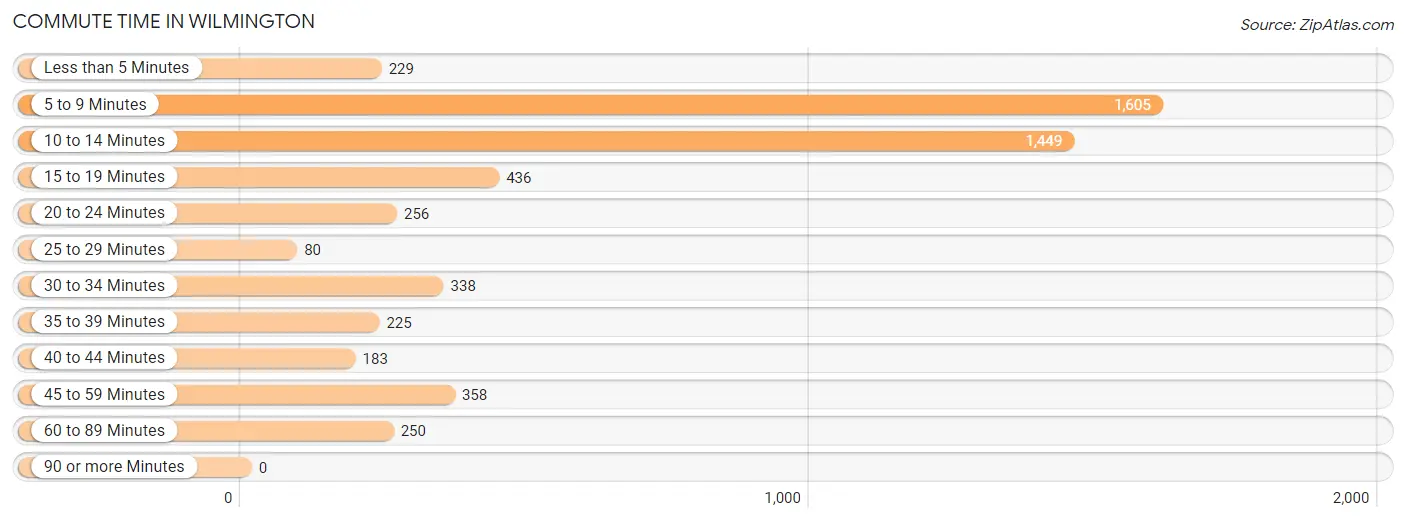
Commute Time in Wilmington
The most frequently occuring commute durations in Wilmington are 5 to 9 minutes (1,605 commuters, 29.7%), 10 to 14 minutes (1,449 commuters, 26.8%), and 15 to 19 minutes (436 commuters, 8.1%).
| Commute Time | # Commuters | % Commuters |
| Less than 5 Minutes | 229 | 4.2% |
| 5 to 9 Minutes | 1,605 | 29.7% |
| 10 to 14 Minutes | 1,449 | 26.8% |
| 15 to 19 Minutes | 436 | 8.1% |
| 20 to 24 Minutes | 256 | 4.7% |
| 25 to 29 Minutes | 80 | 1.5% |
| 30 to 34 Minutes | 338 | 6.2% |
| 35 to 39 Minutes | 225 | 4.2% |
| 40 to 44 Minutes | 183 | 3.4% |
| 45 to 59 Minutes | 358 | 6.6% |
| 60 to 89 Minutes | 250 | 4.6% |
| 90 or more Minutes | 0 | 0.0% |
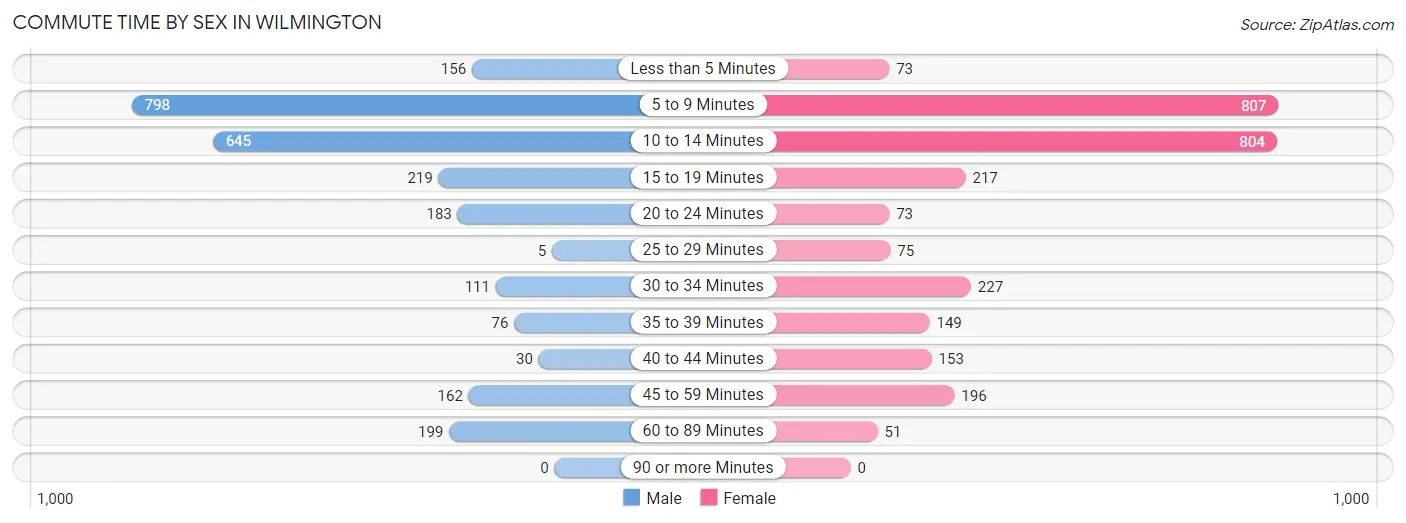
Commute Time by Sex in Wilmington
The most common commute times in Wilmington are 5 to 9 minutes (798 commuters, 30.9%) for males and 5 to 9 minutes (807 commuters, 28.6%) for females.
| Commute Time | Male | Female |
| Less than 5 Minutes | 156 (6.0%) | 73 (2.6%) |
| 5 to 9 Minutes | 798 (30.9%) | 807 (28.6%) |
| 10 to 14 Minutes | 645 (25.0%) | 804 (28.5%) |
| 15 to 19 Minutes | 219 (8.5%) | 217 (7.7%) |
| 20 to 24 Minutes | 183 (7.1%) | 73 (2.6%) |
| 25 to 29 Minutes | 5 (0.2%) | 75 (2.6%) |
| 30 to 34 Minutes | 111 (4.3%) | 227 (8.0%) |
| 35 to 39 Minutes | 76 (2.9%) | 149 (5.3%) |
| 40 to 44 Minutes | 30 (1.2%) | 153 (5.4%) |
| 45 to 59 Minutes | 162 (6.3%) | 196 (6.9%) |
| 60 to 89 Minutes | 199 (7.7%) | 51 (1.8%) |
| 90 or more Minutes | 0 (0.0%) | 0 (0.0%) |
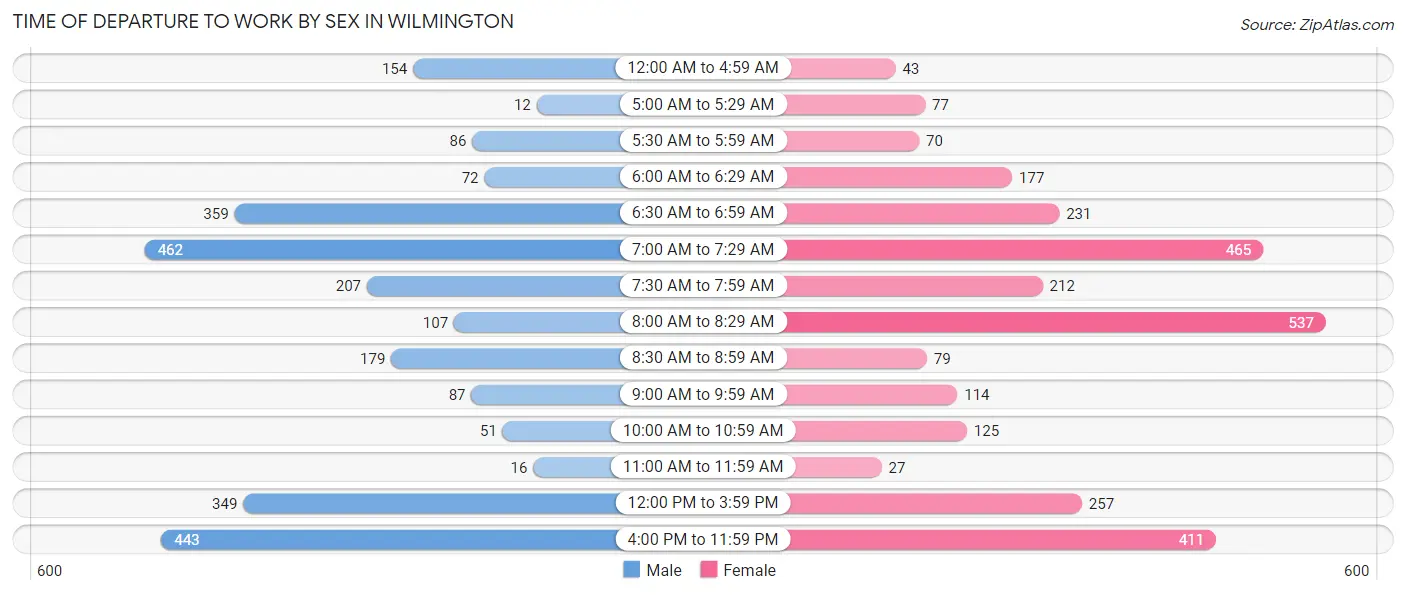
Time of Departure to Work by Sex in Wilmington
The most frequent times of departure to work in Wilmington are 7:00 AM to 7:29 AM (462, 17.9%) for males and 8:00 AM to 8:29 AM (537, 19.0%) for females.
| Time of Departure | Male | Female |
| 12:00 AM to 4:59 AM | 154 (6.0%) | 43 (1.5%) |
| 5:00 AM to 5:29 AM | 12 (0.5%) | 77 (2.7%) |
| 5:30 AM to 5:59 AM | 86 (3.3%) | 70 (2.5%) |
| 6:00 AM to 6:29 AM | 72 (2.8%) | 177 (6.3%) |
| 6:30 AM to 6:59 AM | 359 (13.9%) | 231 (8.2%) |
| 7:00 AM to 7:29 AM | 462 (17.9%) | 465 (16.5%) |
| 7:30 AM to 7:59 AM | 207 (8.0%) | 212 (7.5%) |
| 8:00 AM to 8:29 AM | 107 (4.1%) | 537 (19.0%) |
| 8:30 AM to 8:59 AM | 179 (6.9%) | 79 (2.8%) |
| 9:00 AM to 9:59 AM | 87 (3.4%) | 114 (4.0%) |
| 10:00 AM to 10:59 AM | 51 (2.0%) | 125 (4.4%) |
| 11:00 AM to 11:59 AM | 16 (0.6%) | 27 (1.0%) |
| 12:00 PM to 3:59 PM | 349 (13.5%) | 257 (9.1%) |
| 4:00 PM to 11:59 PM | 443 (17.1%) | 411 (14.5%) |
| Total | 2,584 (100.0%) | 2,825 (100.0%) |
Housing Occupancy in Wilmington
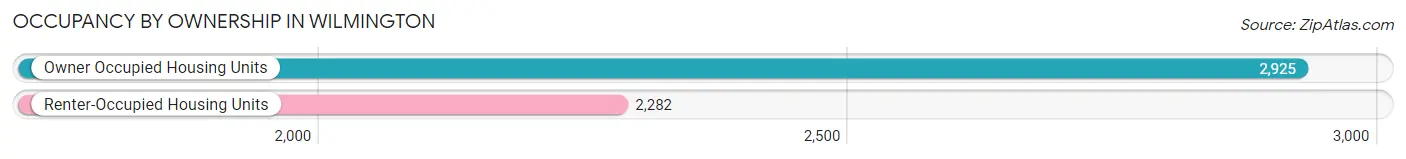
Occupancy by Ownership in Wilmington
Of the total 5,207 dwellings in Wilmington, owner-occupied units account for 2,925 (56.2%), while renter-occupied units make up 2,282 (43.8%).
| Occupancy | # Housing Units | % Housing Units |
| Owner Occupied Housing Units | 2,925 | 56.2% |
| Renter-Occupied Housing Units | 2,282 | 43.8% |
| Total Occupied Housing Units | 5,207 | 100.0% |
Occupancy by Household Size in Wilmington
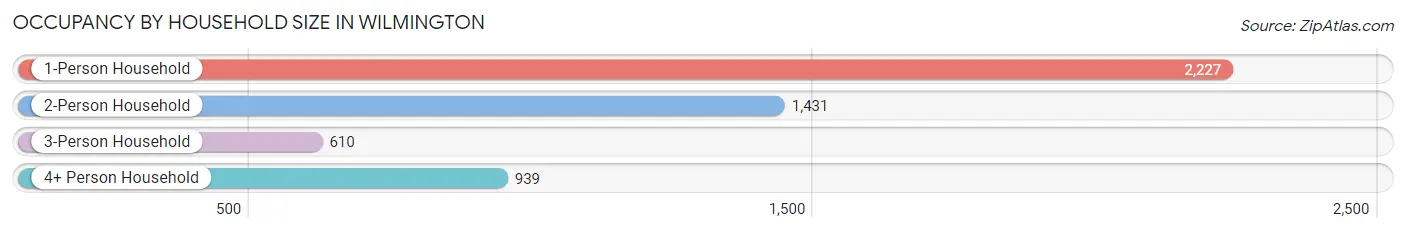
| Household Size | # Housing Units | % Housing Units |
| 1-Person Household | 2,227 | 42.8% |
| 2-Person Household | 1,431 | 27.5% |
| 3-Person Household | 610 | 11.7% |
| 4+ Person Household | 939 | 18.0% |
| Total Housing Units | 5,207 | 100.0% |
Occupancy by Ownership by Household Size in Wilmington
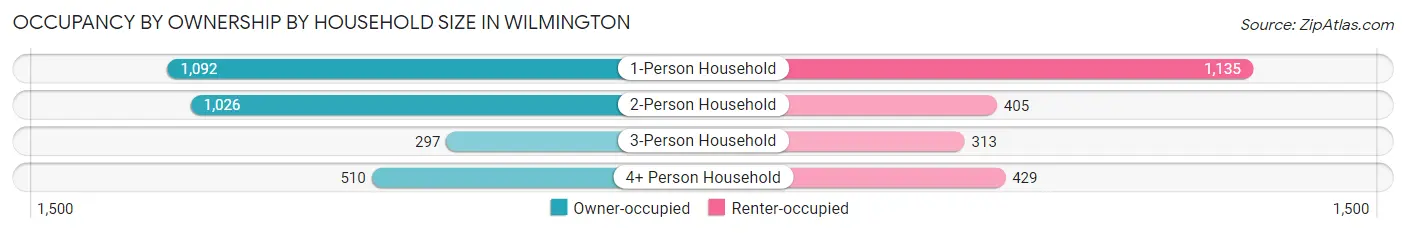
| Household Size | Owner-occupied | Renter-occupied |
| 1-Person Household | 1,092 (49.0%) | 1,135 (51.0%) |
| 2-Person Household | 1,026 (71.7%) | 405 (28.3%) |
| 3-Person Household | 297 (48.7%) | 313 (51.3%) |
| 4+ Person Household | 510 (54.3%) | 429 (45.7%) |
| Total Housing Units | 2,925 (56.2%) | 2,282 (43.8%) |
Occupancy by Educational Attainment in Wilmington
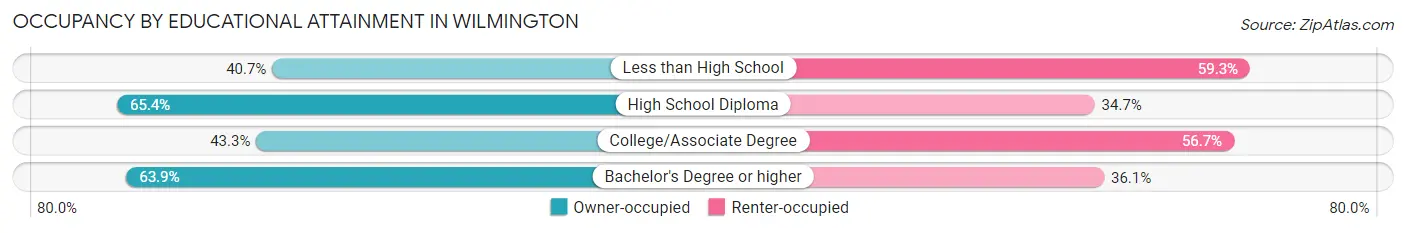
| Household Size | Owner-occupied | Renter-occupied |
| Less than High School | 156 (40.7%) | 227 (59.3%) |
| High School Diploma | 1,209 (65.3%) | 641 (34.6%) |
| College/Associate Degree | 712 (43.3%) | 934 (56.7%) |
| Bachelor's Degree or higher | 848 (63.9%) | 480 (36.1%) |
Occupancy by Age of Householder in Wilmington
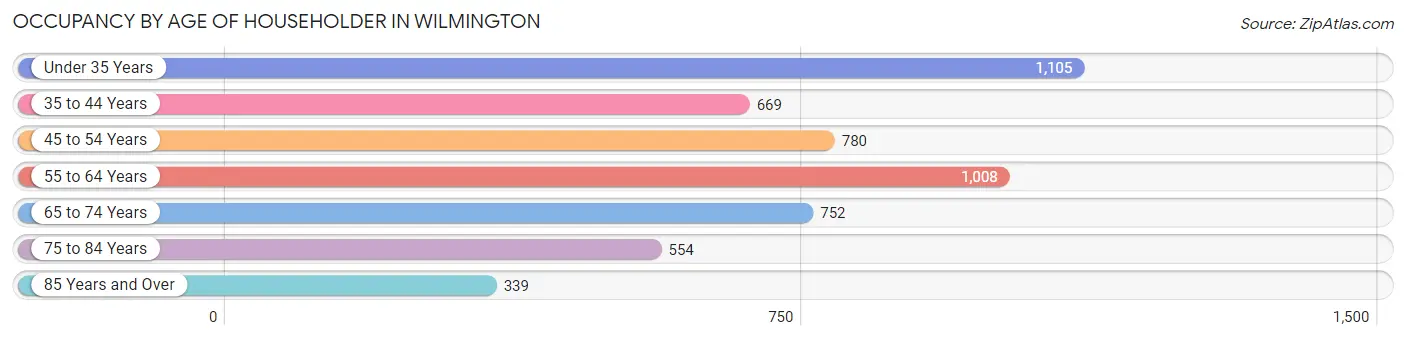
| Age Bracket | # Households | % Households |
| Under 35 Years | 1,105 | 21.2% |
| 35 to 44 Years | 669 | 12.9% |
| 45 to 54 Years | 780 | 15.0% |
| 55 to 64 Years | 1,008 | 19.4% |
| 65 to 74 Years | 752 | 14.4% |
| 75 to 84 Years | 554 | 10.6% |
| 85 Years and Over | 339 | 6.5% |
| Total | 5,207 | 100.0% |
Housing Finances in Wilmington
Median Income by Occupancy in Wilmington
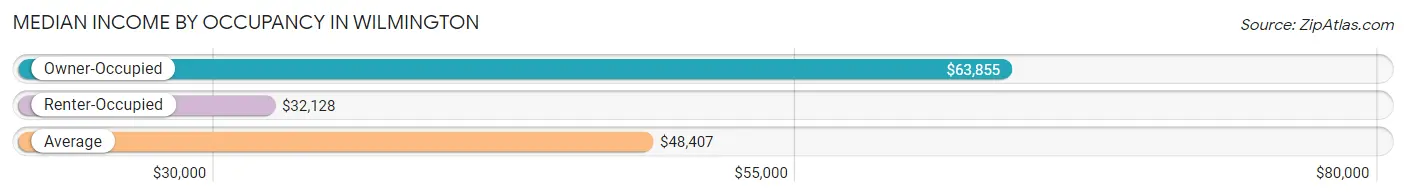
| Occupancy Type | # Households | Median Income |
| Owner-Occupied | 2,925 (56.2%) | $63,855 |
| Renter-Occupied | 2,282 (43.8%) | $32,128 |
| Average | 5,207 (100.0%) | $48,407 |
Occupancy by Householder Income Bracket in Wilmington
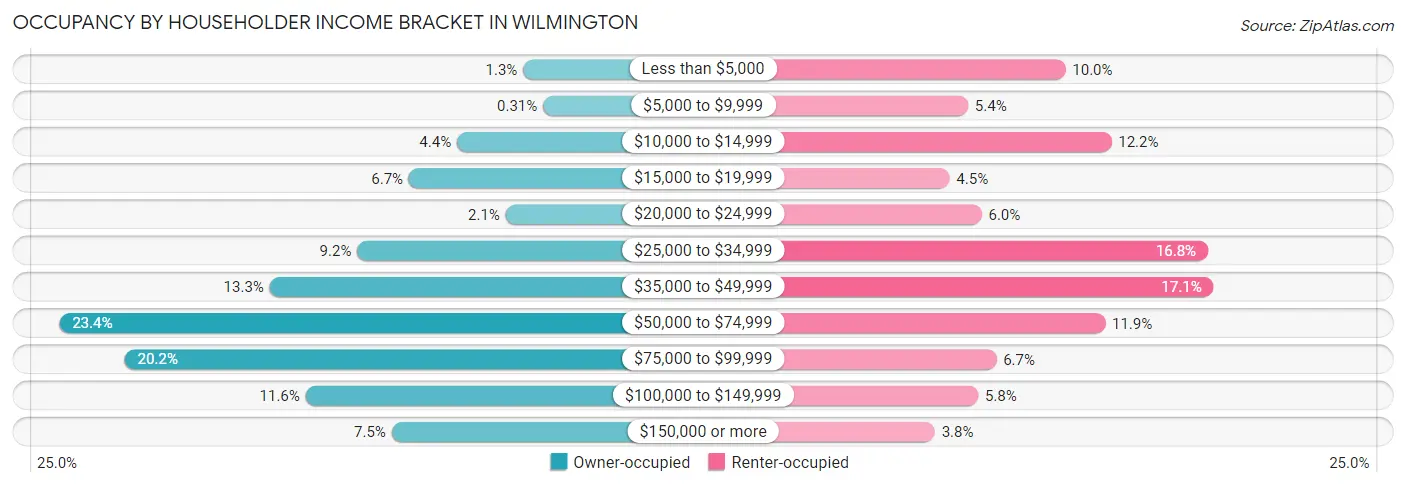
| Income Bracket | Owner-occupied | Renter-occupied |
| Less than $5,000 | 37 (1.3%) | 228 (10.0%) |
| $5,000 to $9,999 | 9 (0.3%) | 122 (5.3%) |
| $10,000 to $14,999 | 129 (4.4%) | 278 (12.2%) |
| $15,000 to $19,999 | 196 (6.7%) | 102 (4.5%) |
| $20,000 to $24,999 | 61 (2.1%) | 137 (6.0%) |
| $25,000 to $34,999 | 268 (9.2%) | 383 (16.8%) |
| $35,000 to $49,999 | 390 (13.3%) | 389 (17.1%) |
| $50,000 to $74,999 | 683 (23.4%) | 271 (11.9%) |
| $75,000 to $99,999 | 592 (20.2%) | 153 (6.7%) |
| $100,000 to $149,999 | 340 (11.6%) | 133 (5.8%) |
| $150,000 or more | 220 (7.5%) | 86 (3.8%) |
| Total | 2,925 (100.0%) | 2,282 (100.0%) |
Monthly Housing Cost Tiers in Wilmington
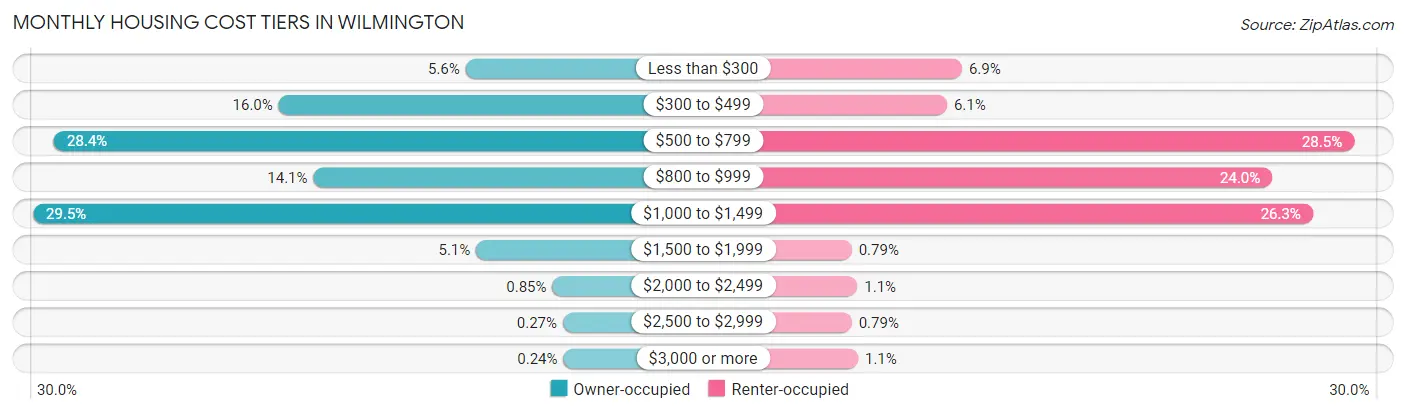
| Monthly Cost | Owner-occupied | Renter-occupied |
| Less than $300 | 165 (5.6%) | 157 (6.9%) |
| $300 to $499 | 467 (16.0%) | 138 (6.0%) |
| $500 to $799 | 830 (28.4%) | 651 (28.5%) |
| $800 to $999 | 411 (14.1%) | 548 (24.0%) |
| $1,000 to $1,499 | 864 (29.5%) | 599 (26.3%) |
| $1,500 to $1,999 | 148 (5.1%) | 18 (0.8%) |
| $2,000 to $2,499 | 25 (0.9%) | 25 (1.1%) |
| $2,500 to $2,999 | 8 (0.3%) | 18 (0.8%) |
| $3,000 or more | 7 (0.2%) | 26 (1.1%) |
| Total | 2,925 (100.0%) | 2,282 (100.0%) |
Physical Housing Characteristics in Wilmington
Housing Structures in Wilmington
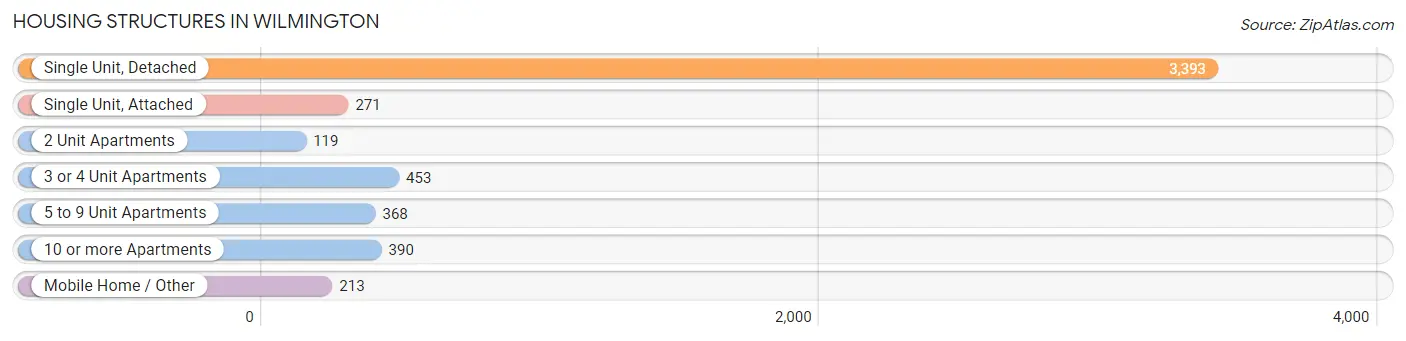
| Structure Type | # Housing Units | % Housing Units |
| Single Unit, Detached | 3,393 | 65.2% |
| Single Unit, Attached | 271 | 5.2% |
| 2 Unit Apartments | 119 | 2.3% |
| 3 or 4 Unit Apartments | 453 | 8.7% |
| 5 to 9 Unit Apartments | 368 | 7.1% |
| 10 or more Apartments | 390 | 7.5% |
| Mobile Home / Other | 213 | 4.1% |
| Total | 5,207 | 100.0% |
Housing Structures by Occupancy in Wilmington
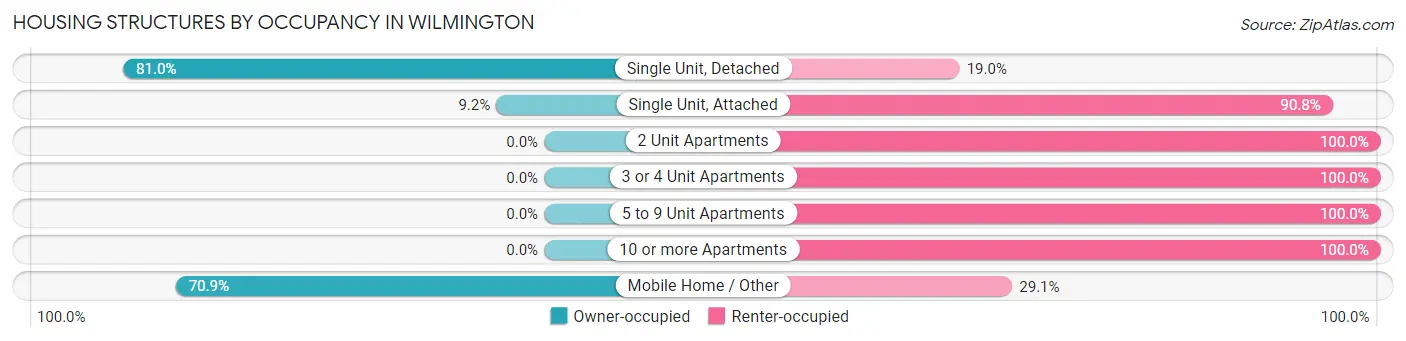
| Structure Type | Owner-occupied | Renter-occupied |
| Single Unit, Detached | 2,749 (81.0%) | 644 (19.0%) |
| Single Unit, Attached | 25 (9.2%) | 246 (90.8%) |
| 2 Unit Apartments | 0 (0.0%) | 119 (100.0%) |
| 3 or 4 Unit Apartments | 0 (0.0%) | 453 (100.0%) |
| 5 to 9 Unit Apartments | 0 (0.0%) | 368 (100.0%) |
| 10 or more Apartments | 0 (0.0%) | 390 (100.0%) |
| Mobile Home / Other | 151 (70.9%) | 62 (29.1%) |
| Total | 2,925 (56.2%) | 2,282 (43.8%) |
Housing Structures by Number of Rooms in Wilmington
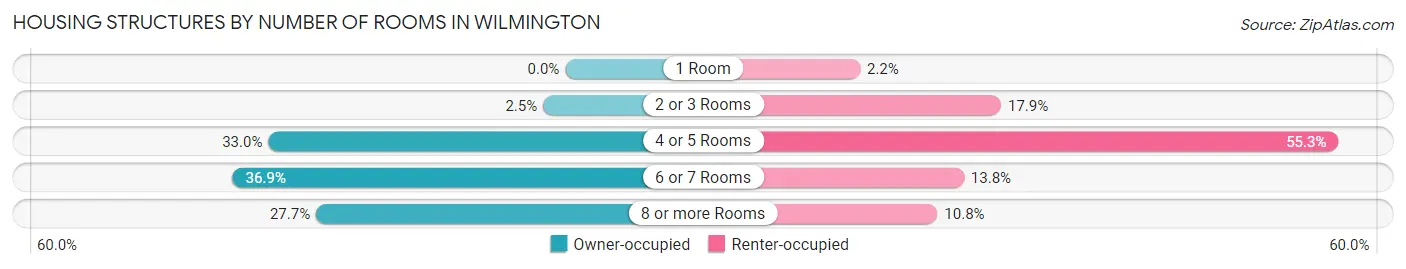
| Number of Rooms | Owner-occupied | Renter-occupied |
| 1 Room | 0 (0.0%) | 51 (2.2%) |
| 2 or 3 Rooms | 72 (2.5%) | 408 (17.9%) |
| 4 or 5 Rooms | 964 (33.0%) | 1,262 (55.3%) |
| 6 or 7 Rooms | 1,080 (36.9%) | 314 (13.8%) |
| 8 or more Rooms | 809 (27.7%) | 247 (10.8%) |
| Total | 2,925 (100.0%) | 2,282 (100.0%) |
Housing Structure by Heating Type in Wilmington
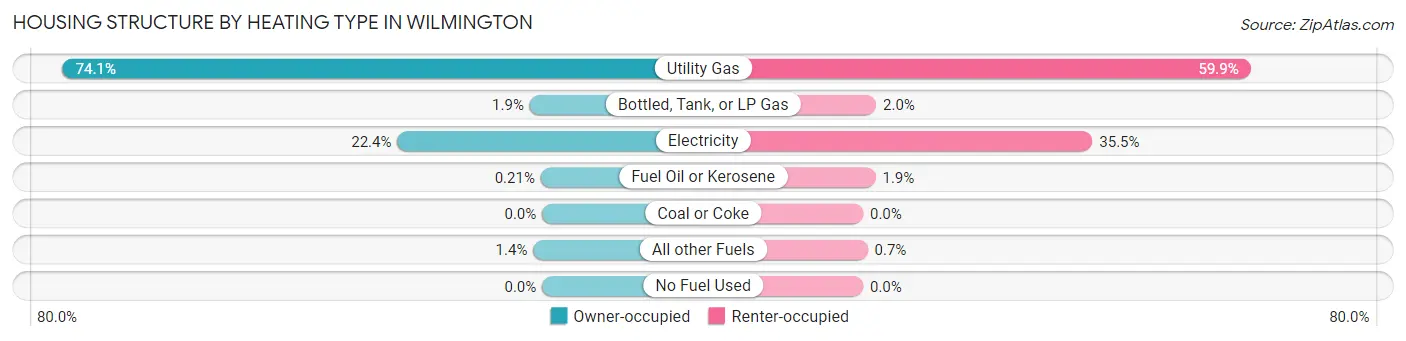
| Heating Type | Owner-occupied | Renter-occupied |
| Utility Gas | 2,168 (74.1%) | 1,367 (59.9%) |
| Bottled, Tank, or LP Gas | 56 (1.9%) | 46 (2.0%) |
| Electricity | 655 (22.4%) | 809 (35.4%) |
| Fuel Oil or Kerosene | 6 (0.2%) | 44 (1.9%) |
| Coal or Coke | 0 (0.0%) | 0 (0.0%) |
| All other Fuels | 40 (1.4%) | 16 (0.7%) |
| No Fuel Used | 0 (0.0%) | 0 (0.0%) |
| Total | 2,925 (100.0%) | 2,282 (100.0%) |
Household Vehicle Usage in Wilmington
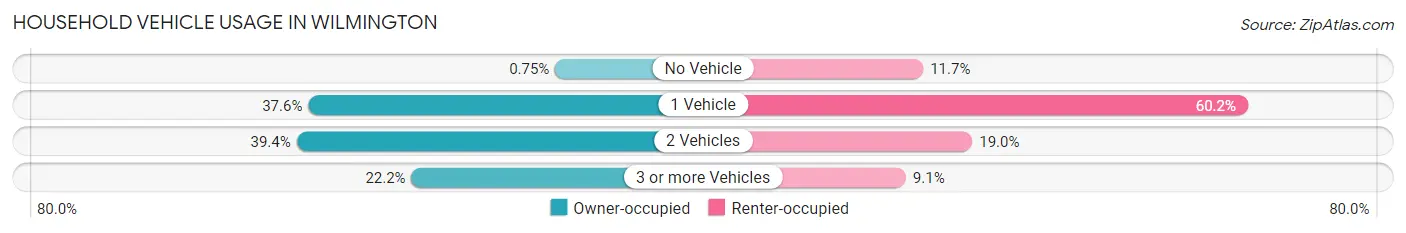
| Vehicles per Household | Owner-occupied | Renter-occupied |
| No Vehicle | 22 (0.7%) | 267 (11.7%) |
| 1 Vehicle | 1,101 (37.6%) | 1,373 (60.2%) |
| 2 Vehicles | 1,152 (39.4%) | 434 (19.0%) |
| 3 or more Vehicles | 650 (22.2%) | 208 (9.1%) |
| Total | 2,925 (100.0%) | 2,282 (100.0%) |
Real Estate & Mortgages in Wilmington
Real Estate and Mortgage Overview in Wilmington
| Characteristic | Without Mortgage | With Mortgage |
| Housing Units | 1,148 | 1,777 |
| Median Property Value | $145,400 | $149,100 |
| Median Household Income | $49,754 | $94 |
| Monthly Housing Costs | $487 | $0 |
| Real Estate Taxes | $1,356 | $60 |
Property Value by Mortgage Status in Wilmington
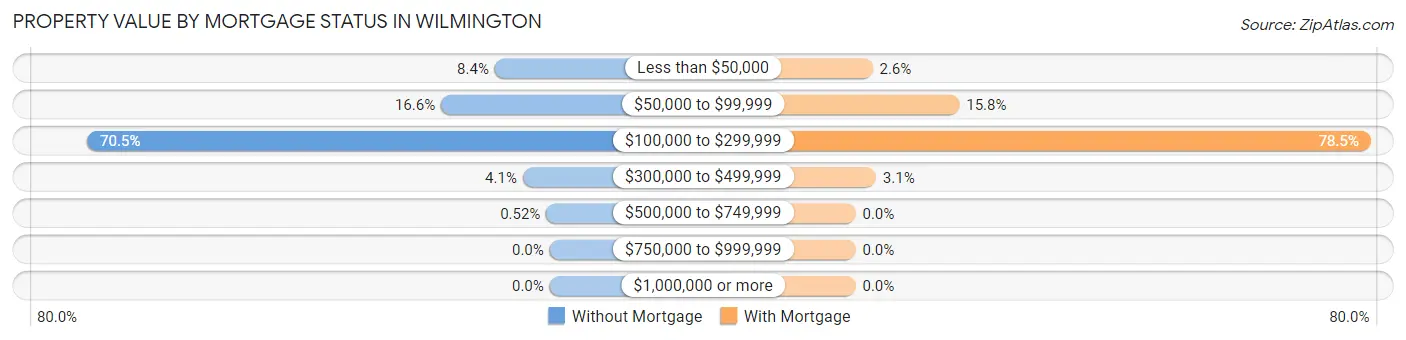
| Property Value | Without Mortgage | With Mortgage |
| Less than $50,000 | 96 (8.4%) | 46 (2.6%) |
| $50,000 to $99,999 | 190 (16.6%) | 281 (15.8%) |
| $100,000 to $299,999 | 809 (70.5%) | 1,395 (78.5%) |
| $300,000 to $499,999 | 47 (4.1%) | 55 (3.1%) |
| $500,000 to $749,999 | 6 (0.5%) | 0 (0.0%) |
| $750,000 to $999,999 | 0 (0.0%) | 0 (0.0%) |
| $1,000,000 or more | 0 (0.0%) | 0 (0.0%) |
| Total | 1,148 (100.0%) | 1,777 (100.0%) |
Household Income by Mortgage Status in Wilmington
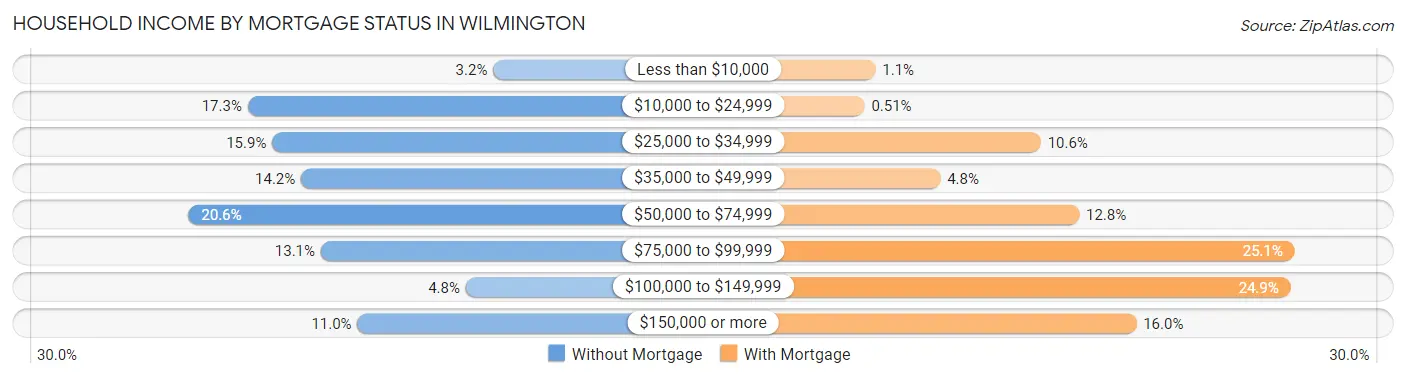
| Household Income | Without Mortgage | With Mortgage |
| Less than $10,000 | 37 (3.2%) | 20 (1.1%) |
| $10,000 to $24,999 | 198 (17.2%) | 9 (0.5%) |
| $25,000 to $34,999 | 182 (15.9%) | 188 (10.6%) |
| $35,000 to $49,999 | 163 (14.2%) | 86 (4.8%) |
| $50,000 to $74,999 | 237 (20.6%) | 227 (12.8%) |
| $75,000 to $99,999 | 150 (13.1%) | 446 (25.1%) |
| $100,000 to $149,999 | 55 (4.8%) | 442 (24.9%) |
| $150,000 or more | 126 (11.0%) | 285 (16.0%) |
| Total | 1,148 (100.0%) | 1,777 (100.0%) |
Property Value to Household Income Ratio in Wilmington
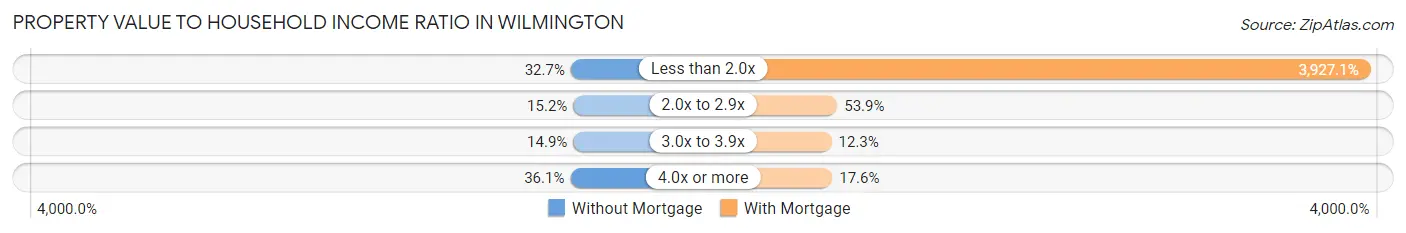
| Value-to-Income Ratio | Without Mortgage | With Mortgage |
| Less than 2.0x | 375 (32.7%) | 69,784 (3,927.1%) |
| 2.0x to 2.9x | 174 (15.2%) | 958 (53.9%) |
| 3.0x to 3.9x | 171 (14.9%) | 219 (12.3%) |
| 4.0x or more | 414 (36.1%) | 312 (17.6%) |
| Total | 1,148 (100.0%) | 1,777 (100.0%) |
Real Estate Taxes by Mortgage Status in Wilmington
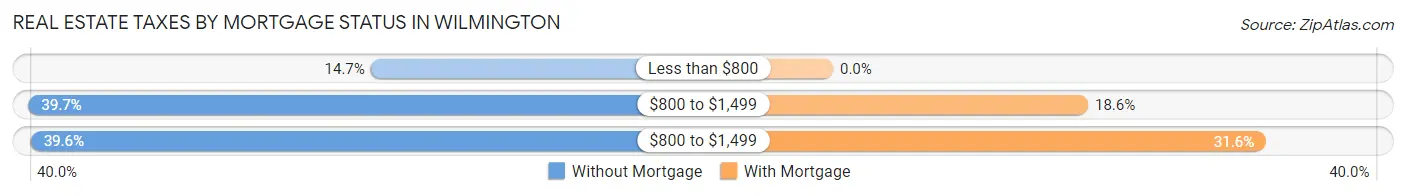
| Property Taxes | Without Mortgage | With Mortgage |
| Less than $800 | 169 (14.7%) | 0 (0.0%) |
| $800 to $1,499 | 456 (39.7%) | 331 (18.6%) |
| $800 to $1,499 | 454 (39.6%) | 562 (31.6%) |
| Total | 1,148 (100.0%) | 1,777 (100.0%) |
Health & Disability in Wilmington
Health Insurance Coverage by Age in Wilmington
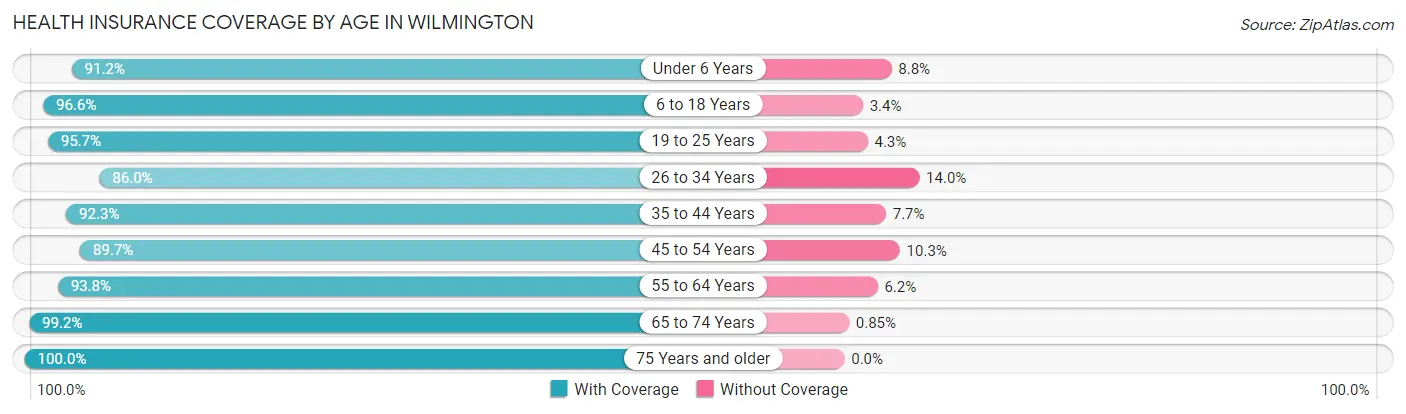
| Age Bracket | With Coverage | Without Coverage |
| Under 6 Years | 874 (91.2%) | 84 (8.8%) |
| 6 to 18 Years | 1,965 (96.6%) | 70 (3.4%) |
| 19 to 25 Years | 1,745 (95.7%) | 79 (4.3%) |
| 26 to 34 Years | 1,159 (86.0%) | 188 (14.0%) |
| 35 to 44 Years | 1,085 (92.3%) | 91 (7.7%) |
| 45 to 54 Years | 1,182 (89.7%) | 136 (10.3%) |
| 55 to 64 Years | 1,458 (93.8%) | 96 (6.2%) |
| 65 to 74 Years | 1,165 (99.2%) | 10 (0.9%) |
| 75 Years and older | 1,143 (100.0%) | 0 (0.0%) |
| Total | 11,776 (94.0%) | 754 (6.0%) |
Health Insurance Coverage by Citizenship Status in Wilmington
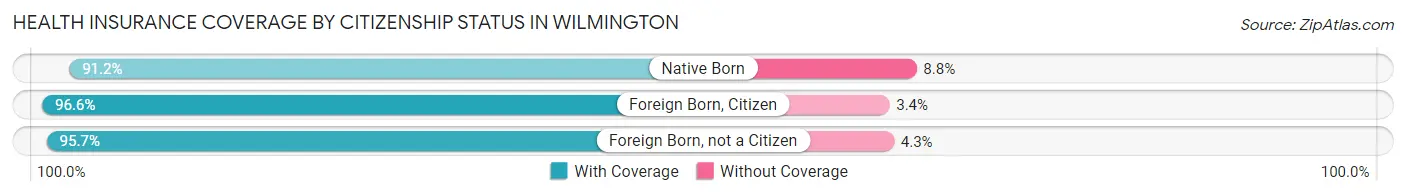
| Citizenship Status | With Coverage | Without Coverage |
| Native Born | 874 (91.2%) | 84 (8.8%) |
| Foreign Born, Citizen | 1,965 (96.6%) | 70 (3.4%) |
| Foreign Born, not a Citizen | 1,745 (95.7%) | 79 (4.3%) |
Health Insurance Coverage by Household Income in Wilmington
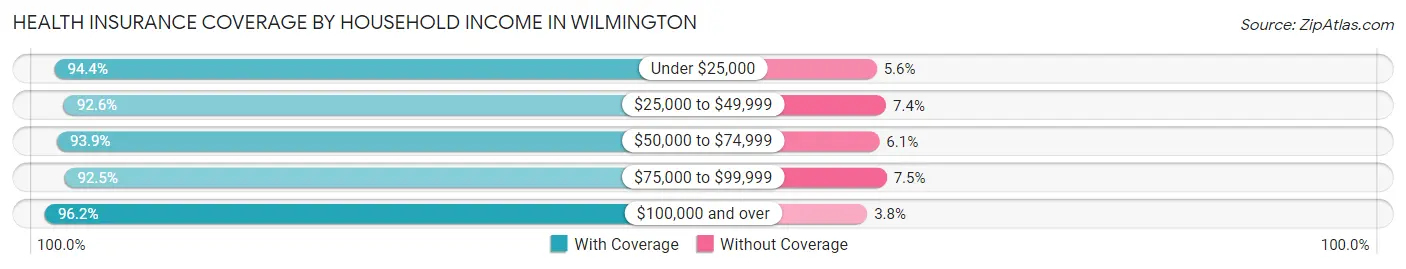
| Household Income | With Coverage | Without Coverage |
| Under $25,000 | 1,985 (94.4%) | 118 (5.6%) |
| $25,000 to $49,999 | 2,991 (92.6%) | 238 (7.4%) |
| $50,000 to $74,999 | 1,720 (93.9%) | 112 (6.1%) |
| $75,000 to $99,999 | 1,744 (92.5%) | 141 (7.5%) |
| $100,000 and over | 2,484 (96.2%) | 99 (3.8%) |
Public vs Private Health Insurance Coverage by Age in Wilmington
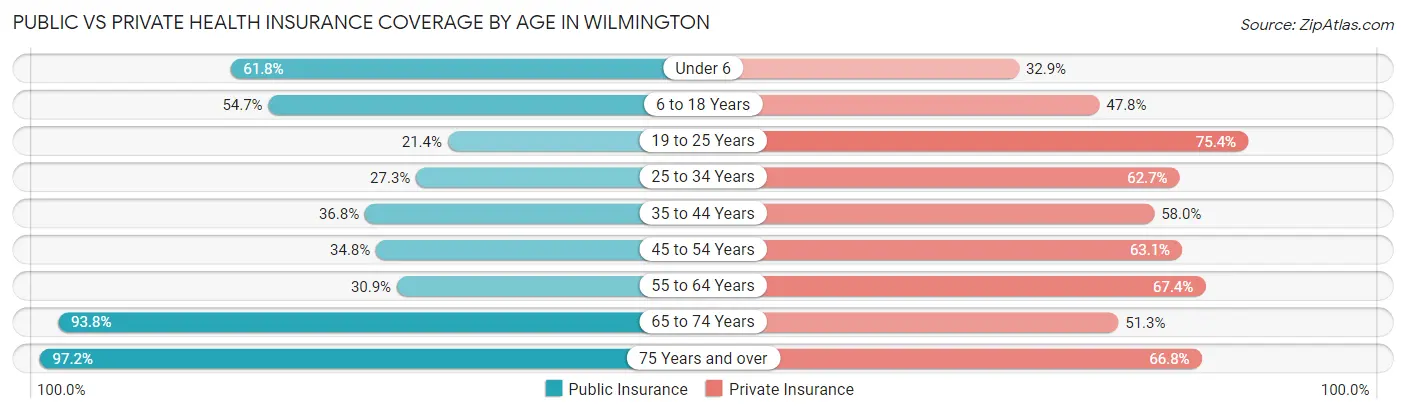
| Age Bracket | Public Insurance | Private Insurance |
| Under 6 | 592 (61.8%) | 315 (32.9%) |
| 6 to 18 Years | 1,114 (54.7%) | 973 (47.8%) |
| 19 to 25 Years | 391 (21.4%) | 1,375 (75.4%) |
| 25 to 34 Years | 368 (27.3%) | 844 (62.7%) |
| 35 to 44 Years | 433 (36.8%) | 682 (58.0%) |
| 45 to 54 Years | 458 (34.7%) | 832 (63.1%) |
| 55 to 64 Years | 480 (30.9%) | 1,048 (67.4%) |
| 65 to 74 Years | 1,102 (93.8%) | 603 (51.3%) |
| 75 Years and over | 1,111 (97.2%) | 763 (66.7%) |
| Total | 6,049 (48.3%) | 7,435 (59.3%) |
Disability Status by Sex by Age in Wilmington
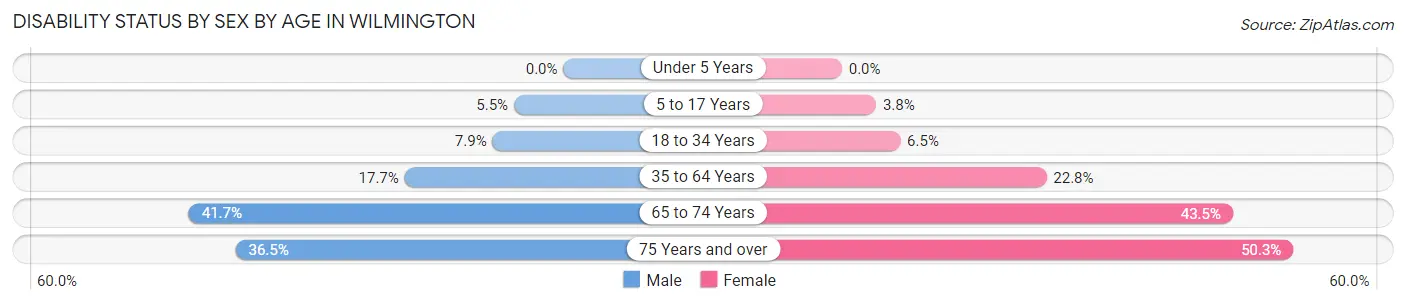
| Age Bracket | Male | Female |
| Under 5 Years | 0 (0.0%) | 0 (0.0%) |
| 5 to 17 Years | 46 (5.5%) | 48 (3.8%) |
| 18 to 34 Years | 134 (7.9%) | 106 (6.5%) |
| 35 to 64 Years | 312 (17.7%) | 520 (22.8%) |
| 65 to 74 Years | 219 (41.7%) | 283 (43.5%) |
| 75 Years and over | 142 (36.5%) | 379 (50.3%) |
Disability Class by Sex by Age in Wilmington
Disability Class: Hearing Difficulty
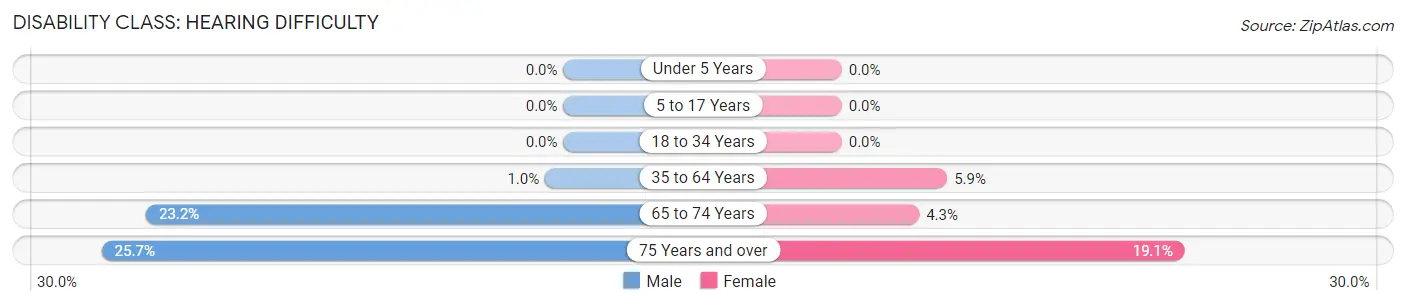
| Age Bracket | Male | Female |
| Under 5 Years | 0 (0.0%) | 0 (0.0%) |
| 5 to 17 Years | 0 (0.0%) | 0 (0.0%) |
| 18 to 34 Years | 0 (0.0%) | 0 (0.0%) |
| 35 to 64 Years | 18 (1.0%) | 134 (5.9%) |
| 65 to 74 Years | 122 (23.2%) | 28 (4.3%) |
| 75 Years and over | 100 (25.7%) | 144 (19.1%) |
Disability Class: Vision Difficulty
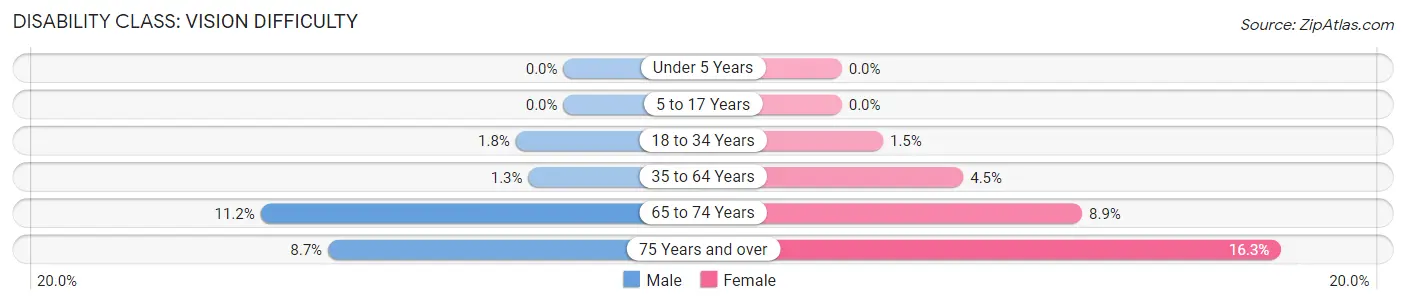
| Age Bracket | Male | Female |
| Under 5 Years | 0 (0.0%) | 0 (0.0%) |
| 5 to 17 Years | 0 (0.0%) | 0 (0.0%) |
| 18 to 34 Years | 30 (1.8%) | 25 (1.5%) |
| 35 to 64 Years | 23 (1.3%) | 103 (4.5%) |
| 65 to 74 Years | 59 (11.2%) | 58 (8.9%) |
| 75 Years and over | 34 (8.7%) | 123 (16.3%) |
Disability Class: Cognitive Difficulty
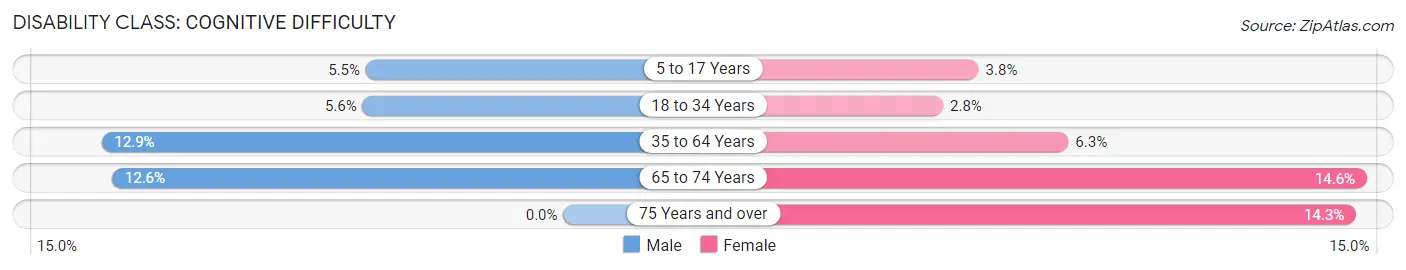
| Age Bracket | Male | Female |
| 5 to 17 Years | 46 (5.5%) | 48 (3.8%) |
| 18 to 34 Years | 95 (5.6%) | 46 (2.8%) |
| 35 to 64 Years | 227 (12.9%) | 144 (6.3%) |
| 65 to 74 Years | 66 (12.6%) | 95 (14.6%) |
| 75 Years and over | 0 (0.0%) | 108 (14.3%) |
Disability Class: Ambulatory Difficulty
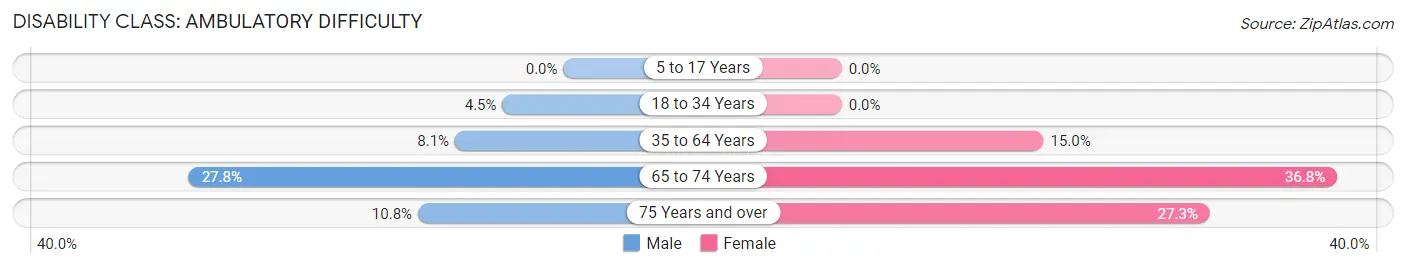
| Age Bracket | Male | Female |
| 5 to 17 Years | 0 (0.0%) | 0 (0.0%) |
| 18 to 34 Years | 77 (4.5%) | 0 (0.0%) |
| 35 to 64 Years | 142 (8.1%) | 342 (15.0%) |
| 65 to 74 Years | 146 (27.8%) | 239 (36.8%) |
| 75 Years and over | 42 (10.8%) | 206 (27.3%) |
Disability Class: Self-Care Difficulty
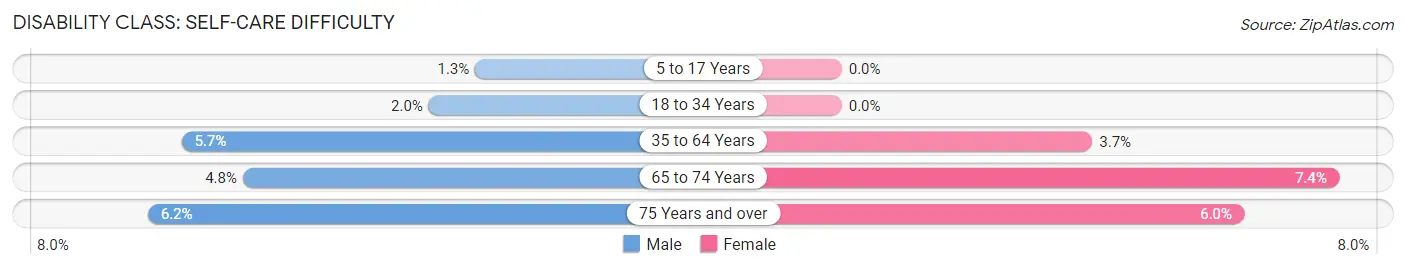
| Age Bracket | Male | Female |
| 5 to 17 Years | 11 (1.3%) | 0 (0.0%) |
| 18 to 34 Years | 34 (2.0%) | 0 (0.0%) |
| 35 to 64 Years | 100 (5.7%) | 85 (3.7%) |
| 65 to 74 Years | 25 (4.8%) | 48 (7.4%) |
| 75 Years and over | 24 (6.2%) | 45 (6.0%) |
Technology Access in Wilmington
Computing Device Access in Wilmington
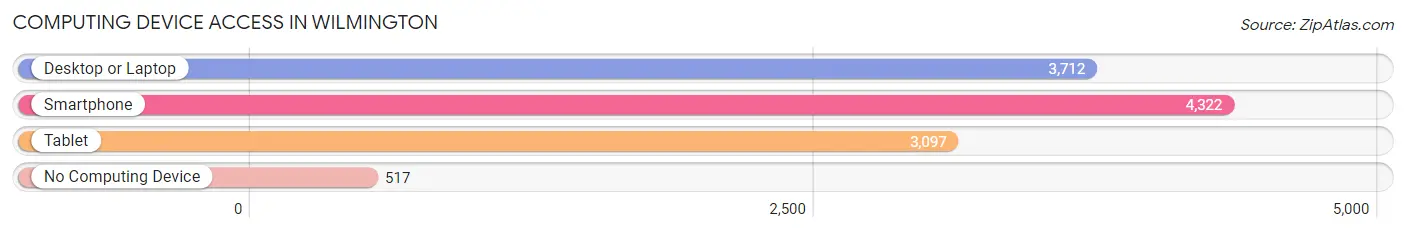
| Device Type | # Households | % Households |
| Desktop or Laptop | 3,712 | 71.3% |
| Smartphone | 4,322 | 83.0% |
| Tablet | 3,097 | 59.5% |
| No Computing Device | 517 | 9.9% |
| Total | 5,207 | 100.0% |
Internet Access in Wilmington
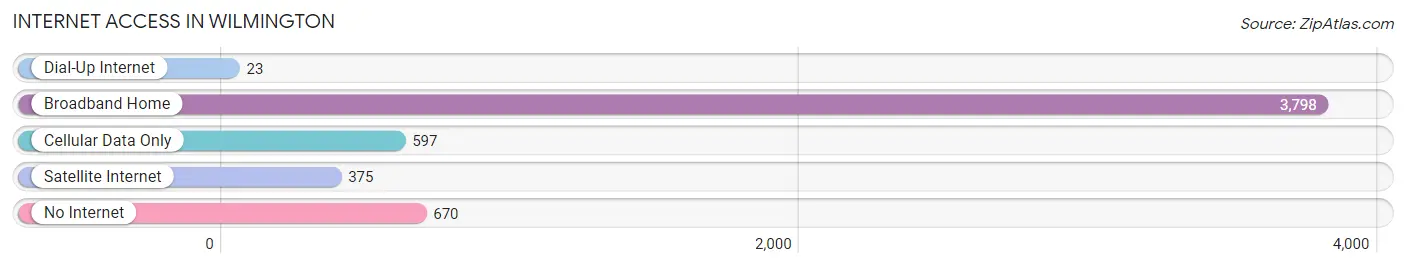
| Internet Type | # Households | % Households |
| Dial-Up Internet | 23 | 0.4% |
| Broadband Home | 3,798 | 72.9% |
| Cellular Data Only | 597 | 11.5% |
| Satellite Internet | 375 | 7.2% |
| No Internet | 670 | 12.9% |
| Total | 5,207 | 100.0% |
Wilmington Summary
Wilmington, Ohio is a small city located in Clinton County, Ohio, United States. It is situated along the banks of the Little Miami River, approximately 40 miles northeast of Cincinnati. The city has a population of 12,520, according to the 2010 census.
History
Wilmington was founded in 1810 by a group of settlers from Wilmington, Delaware. The city was named after the original settlement in Delaware, and was incorporated in 1828. The city was an important stop on the Little Miami Railroad, which connected Cincinnati to Springfield. The railroad was instrumental in the growth of the city, and it was the first city in Ohio to have a railroad station.
The city was also an important stop on the Underground Railroad, and was home to several prominent abolitionists. In 1842, the city was the site of the first Ohio Anti-Slavery Convention.
Geography
Wilmington is located in southwestern Ohio, approximately 40 miles northeast of Cincinnati. The city is situated along the banks of the Little Miami River, and is surrounded by rolling hills and farmland. The city has a total area of 5.3 square miles, all of which is land.
The climate in Wilmington is humid continental, with hot summers and cold winters. The average annual temperature is 52 degrees Fahrenheit, and the average annual precipitation is 40 inches.
Economy
Wilmington is home to several major employers, including Airborne Express, DHL, and the Clinton County Courthouse. The city is also home to several small businesses, including restaurants, retail stores, and professional services.
Wilmington is also home to several educational institutions, including Wilmington College, Wilmington High School, and the Clinton County Career Center.
Demographics
According to the 2010 census, the population of Wilmington was 12,520. The racial makeup of the city was 95.2% White, 1.3% African American, 0.3% Native American, 0.7% Asian, 0.1% Pacific Islander, 0.7% from other races, and 1.7% from two or more races. Hispanic or Latino of any race were 2.2% of the population.
The median income for a household in Wilmington was $37,945, and the median income for a family was $45,945. The per capita income for the city was $19,945. About 11.2% of families and 14.2% of the population were below the poverty line, including 19.2% of those under age 18 and 8.2% of those age 65 or over.
Common Questions
What is Per Capita Income in Wilmington?
Per Capita income in Wilmington is $26,520.
What is the Median Family Income in Wilmington?
Median Family Income in Wilmington is $60,240.
What is the Median Household income in Wilmington?
Median Household Income in Wilmington is $48,407.
What is Income or Wage Gap in Wilmington?
Income or Wage Gap in Wilmington is 10.7%.
Women in Wilmington earn 89.3 cents for every dollar earned by a man.
What is Inequality or Gini Index in Wilmington?
Inequality or Gini Index in Wilmington is 0.44.
What is the Total Population of Wilmington?
Total Population of Wilmington is 12,669.
What is the Total Male Population of Wilmington?
Total Male Population of Wilmington is 5,697.
What is the Total Female Population of Wilmington?
Total Female Population of Wilmington is 6,972.
What is the Ratio of Males per 100 Females in Wilmington?
There are 81.71 Males per 100 Females in Wilmington.
What is the Ratio of Females per 100 Males in Wilmington?
There are 122.38 Females per 100 Males in Wilmington.
What is the Median Population Age in Wilmington?
Median Population Age in Wilmington is 36.5 Years.
What is the Average Family Size in Wilmington
Average Family Size in Wilmington is 3.2 People.
What is the Average Household Size in Wilmington
Average Household Size in Wilmington is 2.2 People.
How Large is the Labor Force in Wilmington?
There are 6,010 People in the Labor Forcein in Wilmington.
What is the Percentage of People in the Labor Force in Wilmington?
59.5% of People are in the Labor Force in Wilmington.
What is the Unemployment Rate in Wilmington?
Unemployment Rate in Wilmington is 5.0%.