South Bloomfield, OH Map & Demographics
South Bloomfield Map
South Bloomfield Overview
$31,608
PER CAPITA INCOME
$88,125
AVG FAMILY INCOME
$84,808
AVG HOUSEHOLD INCOME
28.2%
WAGE / INCOME GAP [ % ]
71.8¢/ $1
WAGE / INCOME GAP [ $ ]
$4,563
FAMILY INCOME DEFICIT
0.38
INEQUALITY / GINI INDEX
2,677
TOTAL POPULATION
1,341
MALE POPULATION
1,336
FEMALE POPULATION
100.37
MALES / 100 FEMALES
99.63
FEMALES / 100 MALES
32.7
MEDIAN AGE
3.9
AVG FAMILY SIZE
3.2
AVG HOUSEHOLD SIZE
1,399
LABOR FORCE [ PEOPLE ]
72.4%
PERCENT IN LABOR FORCE
6.3%
UNEMPLOYMENT RATE
South Bloomfield Area Codes
Income in South Bloomfield
Income Overview in South Bloomfield
Per Capita Income in South Bloomfield is $31,608, while median incomes of families and households are $88,125 and $84,808 respectively.
| Characteristic | Number | Measure |
| Per Capita Income | 2,677 | $31,608 |
| Median Family Income | 575 | $88,125 |
| Mean Family Income | 575 | $88,648 |
| Median Household Income | 834 | $84,808 |
| Mean Household Income | 834 | $92,836 |
| Income Deficit | 575 | $4,563 |
| Wage / Income Gap (%) | 2,677 | 28.24% |
| Wage / Income Gap ($) | 2,677 | 71.76¢ per $1 |
| Gini / Inequality Index | 2,677 | 0.38 |
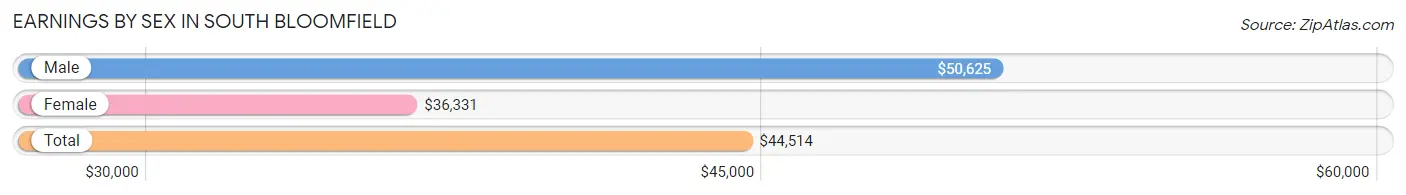
Earnings by Sex in South Bloomfield
Average Earnings in South Bloomfield are $44,514, $50,625 for men and $36,331 for women, a difference of 28.2%.
| Sex | Number | Average Earnings |
| Male | 818 (57.3%) | $50,625 |
| Female | 609 (42.7%) | $36,331 |
| Total | 1,427 (100.0%) | $44,514 |
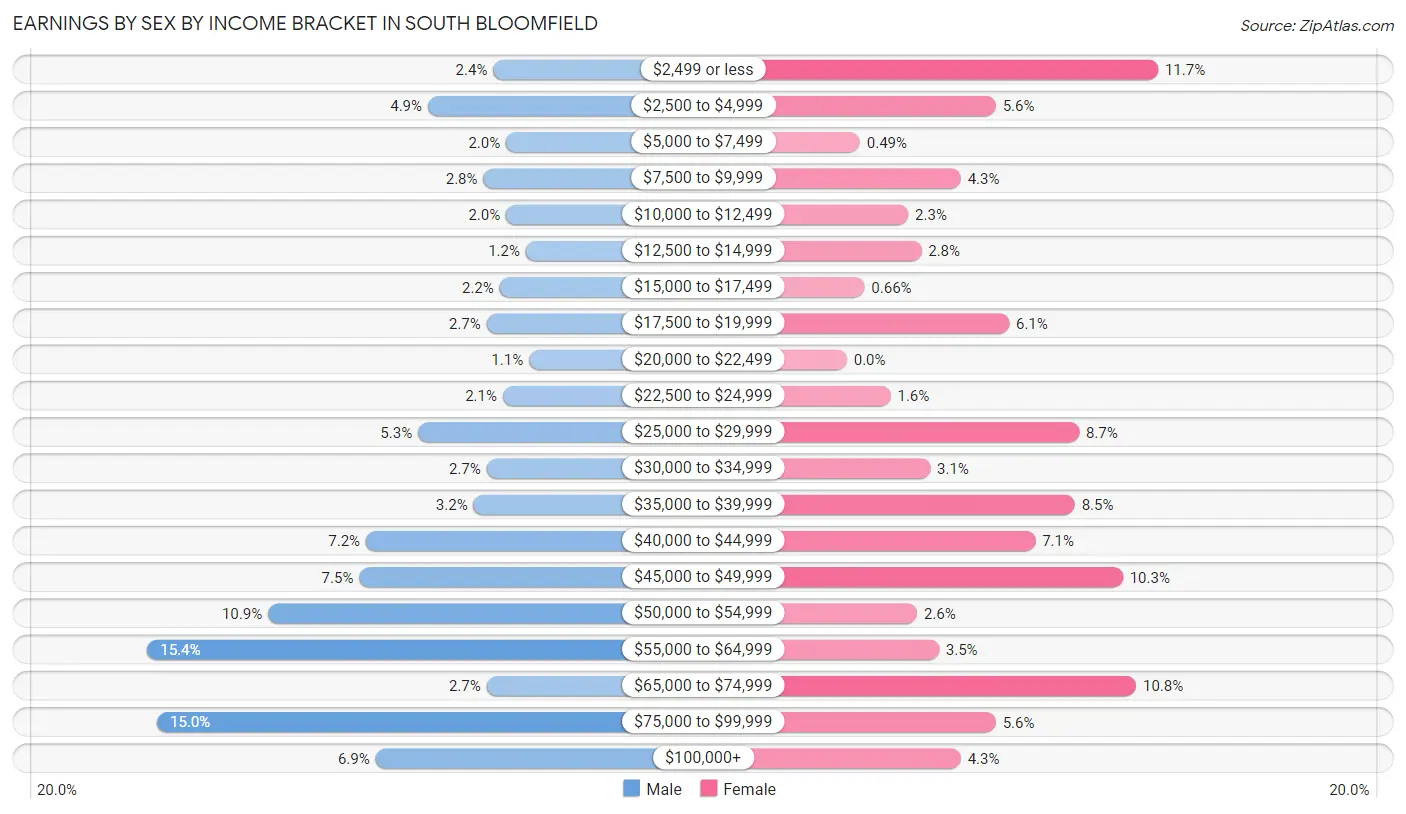
Earnings by Sex by Income Bracket in South Bloomfield
The most common earnings brackets in South Bloomfield are $55,000 to $64,999 for men (126 | 15.4%) and $2,499 or less for women (71 | 11.7%).
| Income | Male | Female |
| $2,499 or less | 20 (2.4%) | 71 (11.7%) |
| $2,500 to $4,999 | 40 (4.9%) | 34 (5.6%) |
| $5,000 to $7,499 | 16 (2.0%) | 3 (0.5%) |
| $7,500 to $9,999 | 23 (2.8%) | 26 (4.3%) |
| $10,000 to $12,499 | 16 (2.0%) | 14 (2.3%) |
| $12,500 to $14,999 | 10 (1.2%) | 17 (2.8%) |
| $15,000 to $17,499 | 18 (2.2%) | 4 (0.7%) |
| $17,500 to $19,999 | 22 (2.7%) | 37 (6.1%) |
| $20,000 to $22,499 | 9 (1.1%) | 0 (0.0%) |
| $22,500 to $24,999 | 17 (2.1%) | 10 (1.6%) |
| $25,000 to $29,999 | 43 (5.3%) | 53 (8.7%) |
| $30,000 to $34,999 | 22 (2.7%) | 19 (3.1%) |
| $35,000 to $39,999 | 26 (3.2%) | 52 (8.5%) |
| $40,000 to $44,999 | 59 (7.2%) | 43 (7.1%) |
| $45,000 to $49,999 | 61 (7.5%) | 63 (10.3%) |
| $50,000 to $54,999 | 89 (10.9%) | 16 (2.6%) |
| $55,000 to $64,999 | 126 (15.4%) | 21 (3.5%) |
| $65,000 to $74,999 | 22 (2.7%) | 66 (10.8%) |
| $75,000 to $99,999 | 123 (15.0%) | 34 (5.6%) |
| $100,000+ | 56 (6.9%) | 26 (4.3%) |
| Total | 818 (100.0%) | 609 (100.0%) |
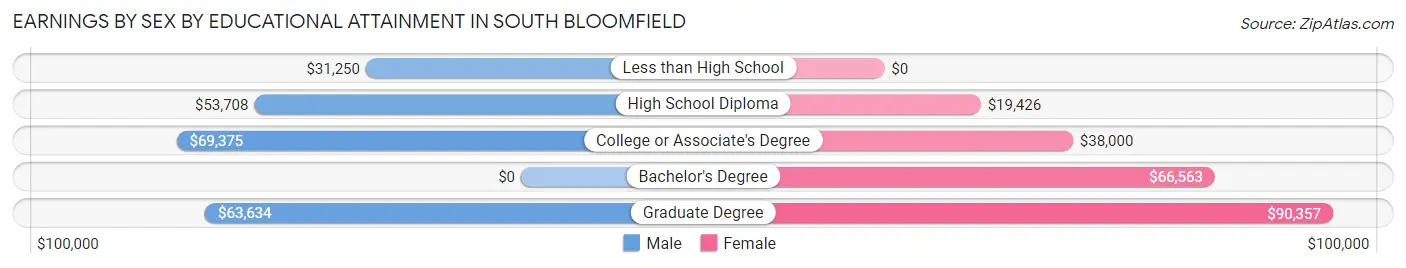
Earnings by Sex by Educational Attainment in South Bloomfield
Average earnings in South Bloomfield are $54,611 for men and $40,795 for women, a difference of 25.3%. Men with an educational attainment of college or associate's degree enjoy the highest average annual earnings of $69,375, while those with less than high school education earn the least with $31,250. Women with an educational attainment of graduate degree earn the most with the average annual earnings of $90,357, while those with high school diploma education have the smallest earnings of $19,426.
| Educational Attainment | Male Income | Female Income |
| Less than High School | $31,250 | $0 |
| High School Diploma | $53,708 | $19,426 |
| College or Associate's Degree | $69,375 | $38,000 |
| Bachelor's Degree | - | - |
| Graduate Degree | $63,634 | $90,357 |
| Total | $54,611 | $40,795 |
Family Income in South Bloomfield
Family Income Brackets in South Bloomfield
According to the South Bloomfield family income data, there are 181 families falling into the $100,000 to $149,999 income range, which is the most common income bracket and makes up 31.5% of all families. Conversely, the $25,000 to $34,999 income bracket is the least frequent group with only 5 families (0.9%) belonging to this category.
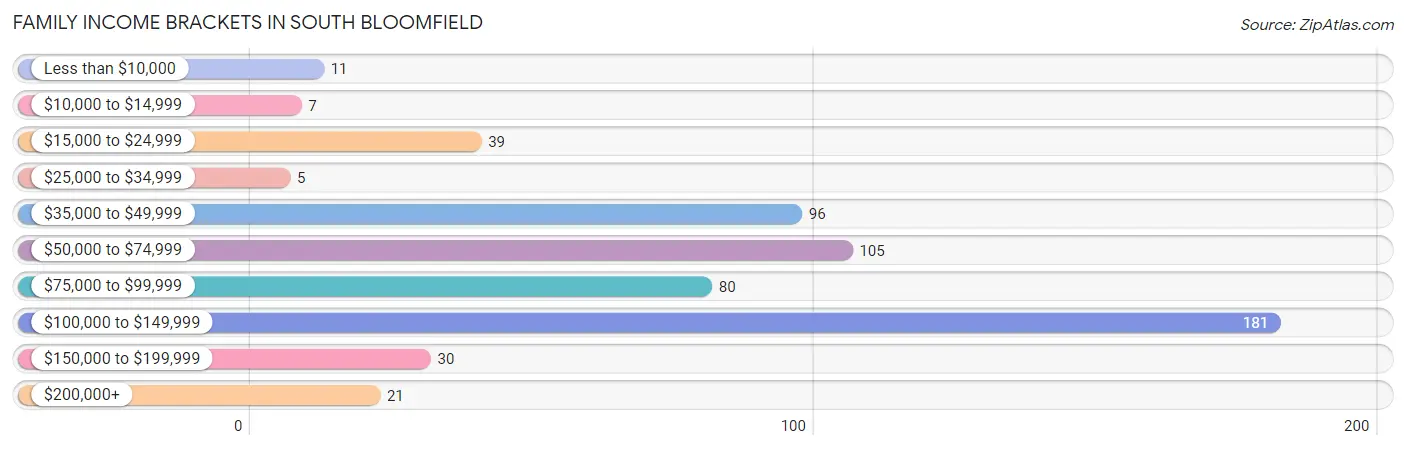
| Income Bracket | # Families | % Families |
| Less than $10,000 | 11 | 1.9% |
| $10,000 to $14,999 | 7 | 1.2% |
| $15,000 to $24,999 | 39 | 6.8% |
| $25,000 to $34,999 | 5 | 0.9% |
| $35,000 to $49,999 | 96 | 16.7% |
| $50,000 to $74,999 | 105 | 18.3% |
| $75,000 to $99,999 | 80 | 13.9% |
| $100,000 to $149,999 | 181 | 31.5% |
| $150,000 to $199,999 | 30 | 5.2% |
| $200,000+ | 21 | 3.7% |
Family Income by Famaliy Size in South Bloomfield
4-person families (120 | 20.9%) account for the highest median family income in South Bloomfield with $111,429 per family, while 2-person families (186 | 32.4%) have the highest median income of $34,000 per family member.
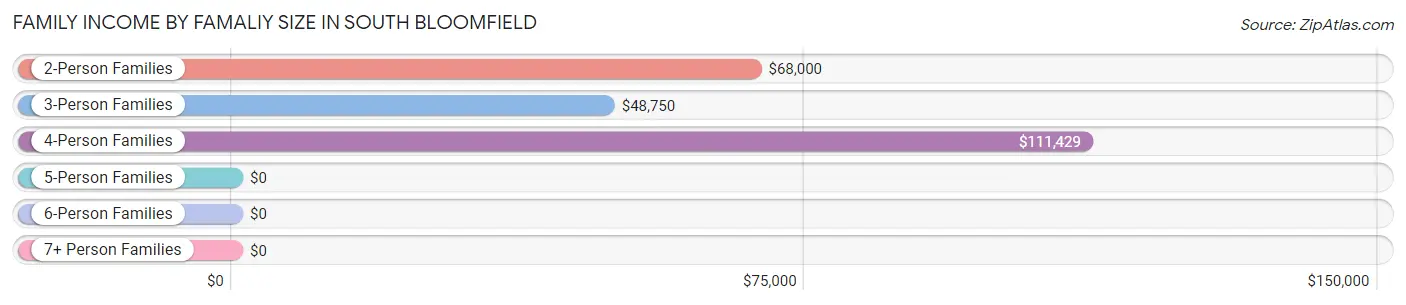
| Income Bracket | # Families | Median Income |
| 2-Person Families | 186 (32.4%) | $68,000 |
| 3-Person Families | 113 (19.7%) | $48,750 |
| 4-Person Families | 120 (20.9%) | $111,429 |
| 5-Person Families | 131 (22.8%) | $0 |
| 6-Person Families | 9 (1.6%) | $0 |
| 7+ Person Families | 16 (2.8%) | $0 |
| Total | 575 (100.0%) | $88,125 |
Family Income by Number of Earners in South Bloomfield
The median family income in South Bloomfield is $88,125, with families comprising 3+ earners (61) having the highest median family income of $130,375, while families with no earners (47) have the lowest median family income of $35,956, accounting for 10.6% and 8.2% of families, respectively.
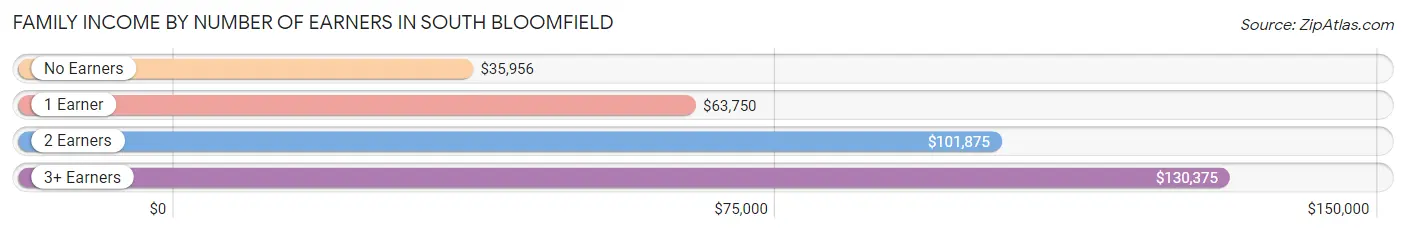
| Number of Earners | # Families | Median Income |
| No Earners | 47 (8.2%) | $35,956 |
| 1 Earner | 216 (37.6%) | $63,750 |
| 2 Earners | 251 (43.6%) | $101,875 |
| 3+ Earners | 61 (10.6%) | $130,375 |
| Total | 575 (100.0%) | $88,125 |
Household Income in South Bloomfield
Household Income Brackets in South Bloomfield
With 219 households falling in the category, the $100,000 to $149,999 income range is the most frequent in South Bloomfield, accounting for 26.3% of all households. In contrast, only 1 households (0.1%) fall into the $10,000 to $14,999 income bracket, making it the least populous group.
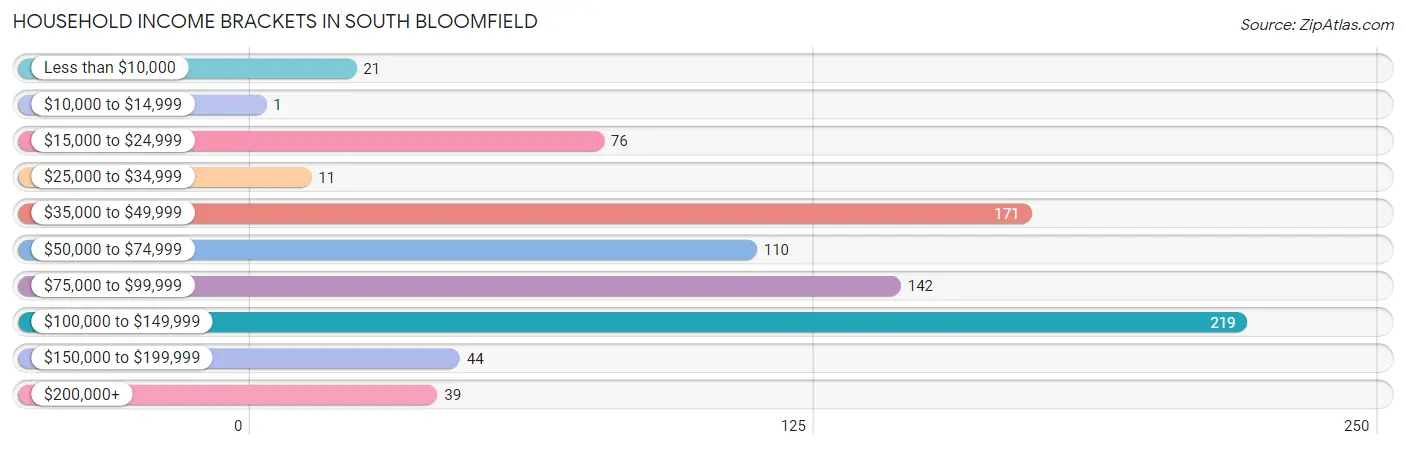
| Income Bracket | # Households | % Households |
| Less than $10,000 | 21 | 2.5% |
| $10,000 to $14,999 | 1 | 0.1% |
| $15,000 to $24,999 | 76 | 9.1% |
| $25,000 to $34,999 | 11 | 1.3% |
| $35,000 to $49,999 | 171 | 20.5% |
| $50,000 to $74,999 | 110 | 13.2% |
| $75,000 to $99,999 | 142 | 17.0% |
| $100,000 to $149,999 | 219 | 26.3% |
| $150,000 to $199,999 | 44 | 5.3% |
| $200,000+ | 39 | 4.7% |
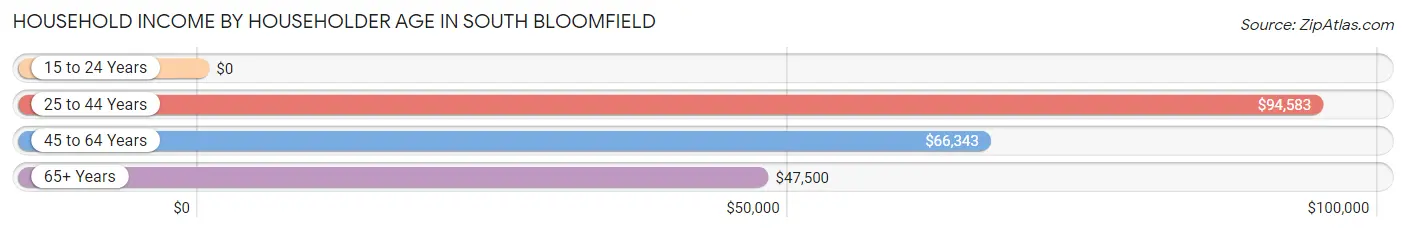
Household Income by Householder Age in South Bloomfield
The median household income in South Bloomfield is $84,808, with the highest median household income of $94,583 found in the 25 to 44 years age bracket for the primary householder. A total of 357 households (42.8%) fall into this category. Meanwhile, the 15 to 24 years age bracket for the primary householder has the lowest median household income of $0, with 8 households (1.0%) in this group.
| Income Bracket | # Households | Median Income |
| 15 to 24 Years | 8 (1.0%) | $0 |
| 25 to 44 Years | 357 (42.8%) | $94,583 |
| 45 to 64 Years | 285 (34.2%) | $66,343 |
| 65+ Years | 184 (22.1%) | $47,500 |
| Total | 834 (100.0%) | $84,808 |
Poverty in South Bloomfield
Income Below Poverty by Sex and Age in South Bloomfield
With 6.3% poverty level for males and 10.2% for females among the residents of South Bloomfield, 6 to 11 year old males and 35 to 44 year old females are the most vulnerable to poverty, with 25 males (24.7%) and 52 females (25.1%) in their respective age groups living below the poverty level.
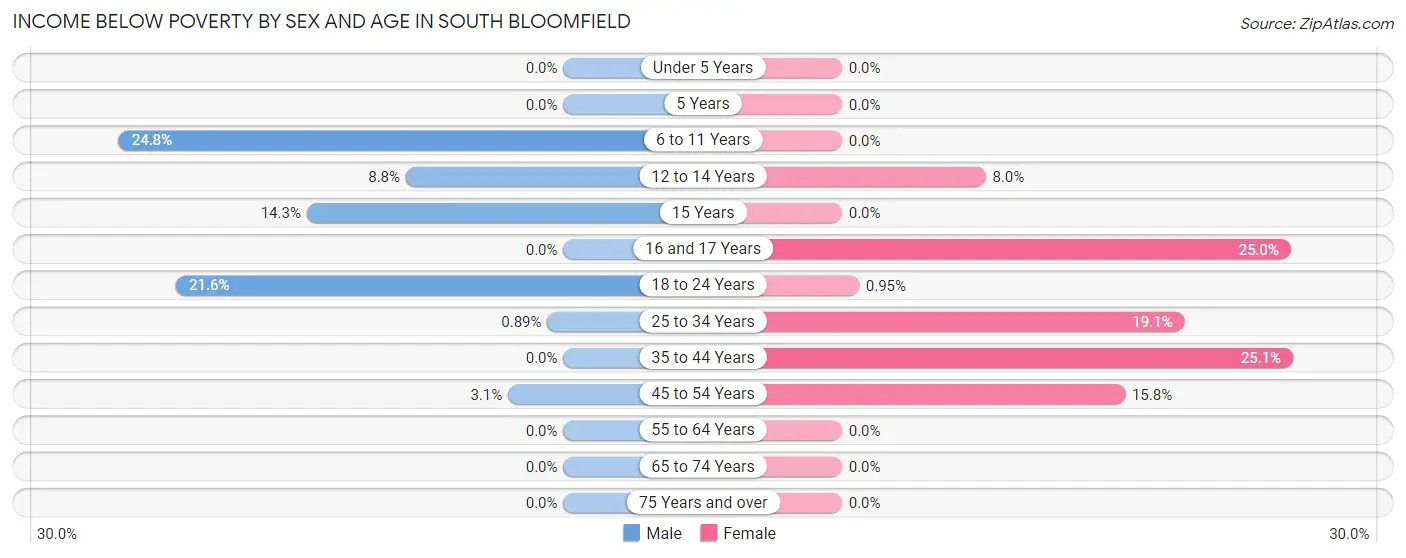
| Age Bracket | Male | Female |
| Under 5 Years | 0 (0.0%) | 0 (0.0%) |
| 5 Years | 0 (0.0%) | 0 (0.0%) |
| 6 to 11 Years | 25 (24.7%) | 0 (0.0%) |
| 12 to 14 Years | 10 (8.8%) | 12 (8.0%) |
| 15 Years | 6 (14.3%) | 0 (0.0%) |
| 16 and 17 Years | 0 (0.0%) | 3 (25.0%) |
| 18 to 24 Years | 36 (21.6%) | 1 (0.9%) |
| 25 to 34 Years | 2 (0.9%) | 33 (19.1%) |
| 35 to 44 Years | 0 (0.0%) | 52 (25.1%) |
| 45 to 54 Years | 6 (3.1%) | 35 (15.8%) |
| 55 to 64 Years | 0 (0.0%) | 0 (0.0%) |
| 65 to 74 Years | 0 (0.0%) | 0 (0.0%) |
| 75 Years and over | 0 (0.0%) | 0 (0.0%) |
| Total | 85 (6.3%) | 136 (10.2%) |
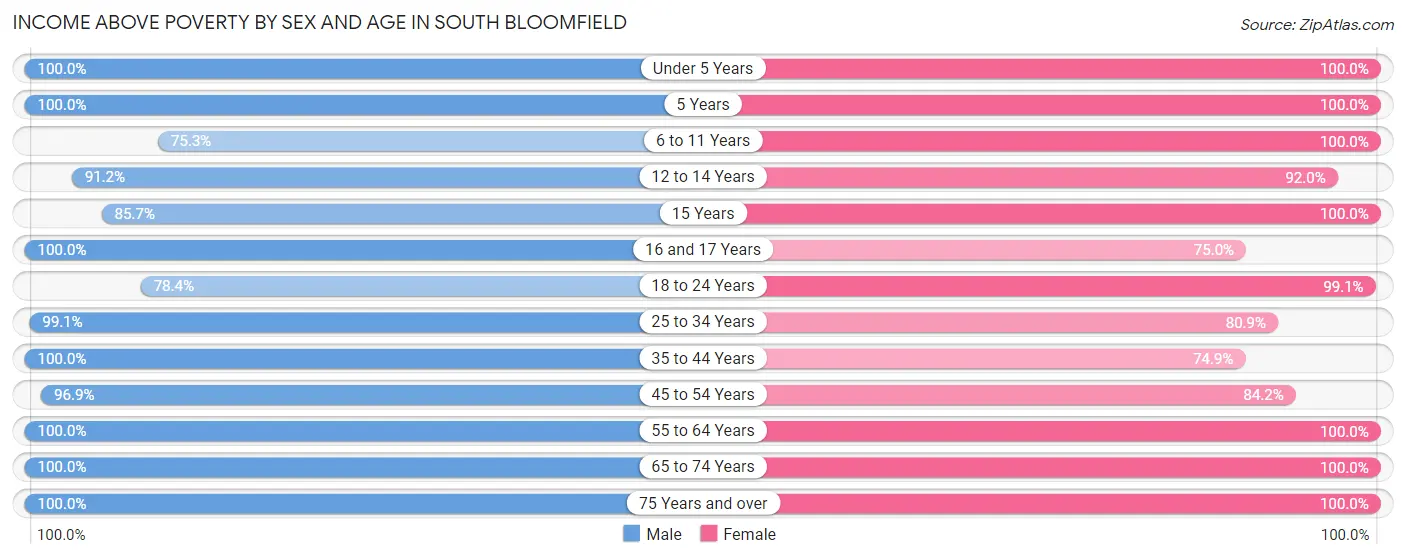
Income Above Poverty by Sex and Age in South Bloomfield
According to the poverty statistics in South Bloomfield, males aged under 5 years and females aged under 5 years are the age groups that are most secure financially, with 100.0% of males and 100.0% of females in these age groups living above the poverty line.
| Age Bracket | Male | Female |
| Under 5 Years | 66 (100.0%) | 39 (100.0%) |
| 5 Years | 25 (100.0%) | 10 (100.0%) |
| 6 to 11 Years | 76 (75.2%) | 186 (100.0%) |
| 12 to 14 Years | 104 (91.2%) | 138 (92.0%) |
| 15 Years | 36 (85.7%) | 11 (100.0%) |
| 16 and 17 Years | 11 (100.0%) | 9 (75.0%) |
| 18 to 24 Years | 131 (78.4%) | 104 (99.1%) |
| 25 to 34 Years | 223 (99.1%) | 140 (80.9%) |
| 35 to 44 Years | 192 (100.0%) | 155 (74.9%) |
| 45 to 54 Years | 189 (96.9%) | 187 (84.2%) |
| 55 to 64 Years | 79 (100.0%) | 73 (100.0%) |
| 65 to 74 Years | 90 (100.0%) | 93 (100.0%) |
| 75 Years and over | 34 (100.0%) | 55 (100.0%) |
| Total | 1,256 (93.7%) | 1,200 (89.8%) |
Income Below Poverty Among Married-Couple Families in South Bloomfield
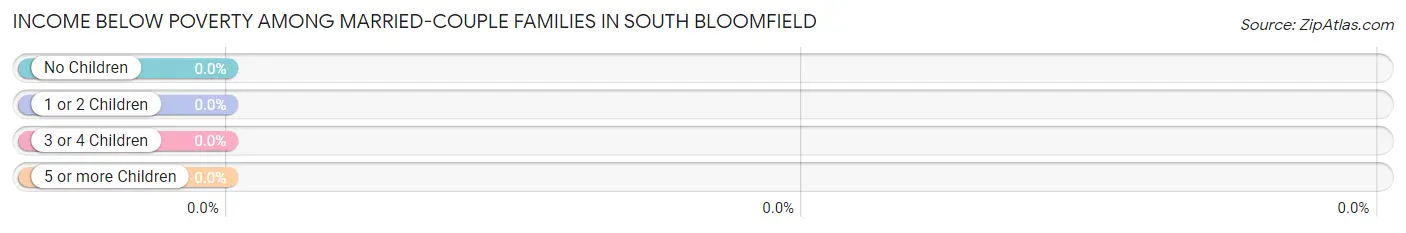
| Children | Above Poverty | Below Poverty |
| No Children | 173 (100.0%) | 0 (0.0%) |
| 1 or 2 Children | 163 (100.0%) | 0 (0.0%) |
| 3 or 4 Children | 68 (100.0%) | 0 (0.0%) |
| 5 or more Children | 0 (0.0%) | 0 (0.0%) |
| Total | 404 (100.0%) | 0 (0.0%) |
Income Below Poverty Among Single-Parent Households in South Bloomfield
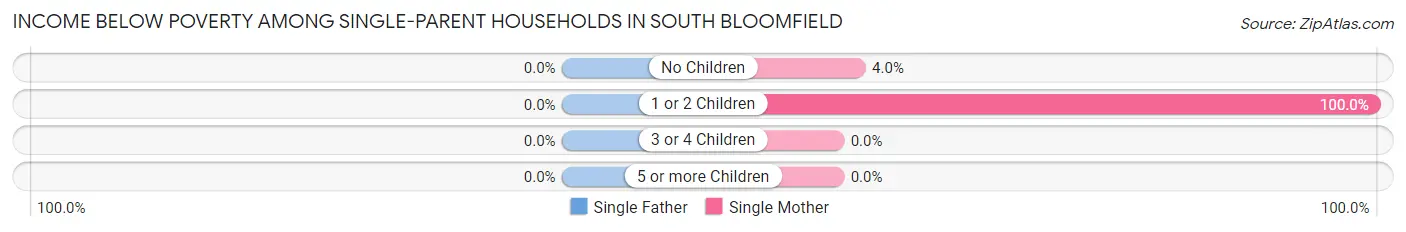
| Children | Single Father | Single Mother |
| No Children | 0 (0.0%) | 1 (4.0%) |
| 1 or 2 Children | 0 (0.0%) | 47 (100.0%) |
| 3 or 4 Children | 0 (0.0%) | 0 (0.0%) |
| 5 or more Children | 0 (0.0%) | 0 (0.0%) |
| Total | 0 (0.0%) | 48 (46.2%) |
Income Below Poverty Among Married-Couple vs Single-Parent Households in South Bloomfield
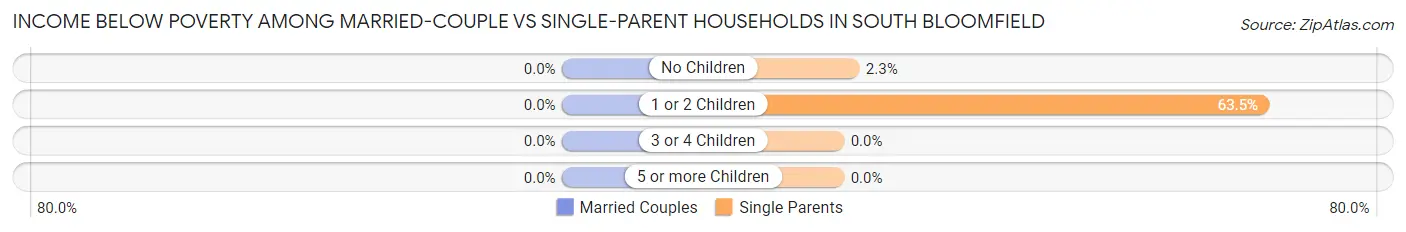
| Children | Married-Couple Families | Single-Parent Households |
| No Children | 0 (0.0%) | 1 (2.3%) |
| 1 or 2 Children | 0 (0.0%) | 47 (63.5%) |
| 3 or 4 Children | 0 (0.0%) | 0 (0.0%) |
| 5 or more Children | 0 (0.0%) | 0 (0.0%) |
| Total | 0 (0.0%) | 48 (28.1%) |
Race in South Bloomfield
The most populous races in South Bloomfield are White / Caucasian (2,422 | 90.5%), Two or more Races (178 | 6.7%), and Hispanic or Latino (63 | 2.4%).
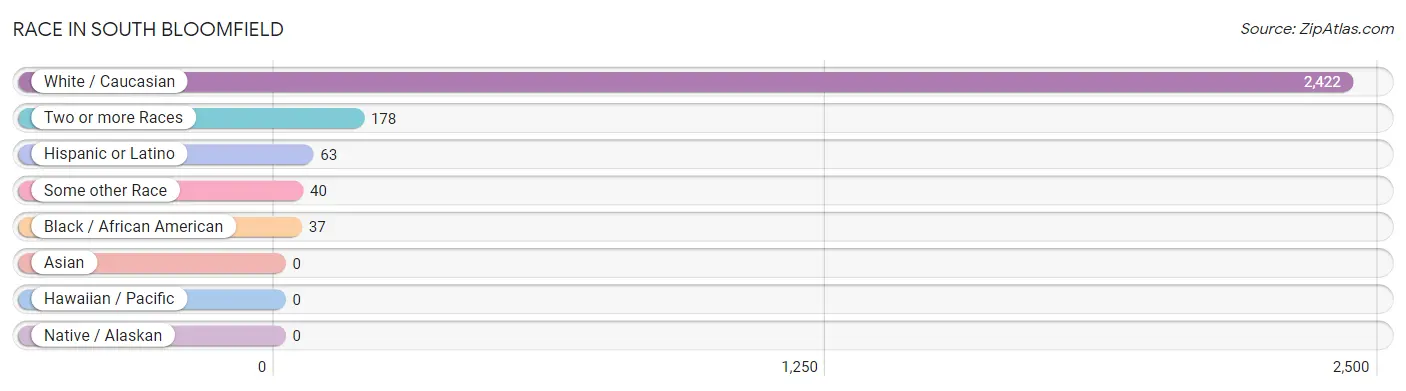
| Race | # Population | % Population |
| Asian | 0 | 0.0% |
| Black / African American | 37 | 1.4% |
| Hawaiian / Pacific | 0 | 0.0% |
| Hispanic or Latino | 63 | 2.4% |
| Native / Alaskan | 0 | 0.0% |
| White / Caucasian | 2,422 | 90.5% |
| Two or more Races | 178 | 6.7% |
| Some other Race | 40 | 1.5% |
| Total | 2,677 | 100.0% |
Ancestry in South Bloomfield
The most populous ancestries reported in South Bloomfield are German (728 | 27.2%), Irish (453 | 16.9%), English (417 | 15.6%), American (80 | 3.0%), and Mexican (63 | 2.4%), together accounting for 65.0% of all South Bloomfield residents.
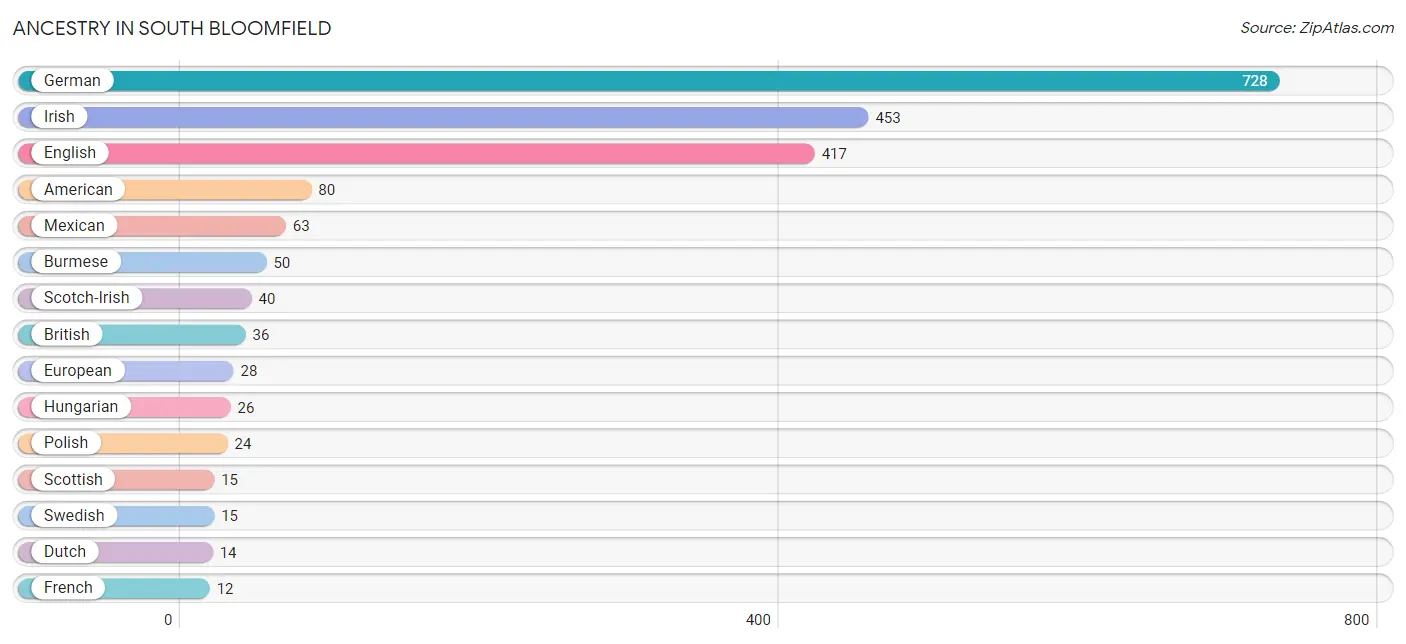
| Ancestry | # Population | % Population |
| American | 80 | 3.0% |
| British | 36 | 1.3% |
| Burmese | 50 | 1.9% |
| Cherokee | 4 | 0.2% |
| Dutch | 14 | 0.5% |
| English | 417 | 15.6% |
| European | 28 | 1.1% |
| French | 12 | 0.4% |
| French Canadian | 1 | 0.0% |
| German | 728 | 27.2% |
| Hungarian | 26 | 1.0% |
| Irish | 453 | 16.9% |
| Italian | 12 | 0.4% |
| Mexican | 63 | 2.4% |
| Polish | 24 | 0.9% |
| Romanian | 12 | 0.4% |
| Scandinavian | 3 | 0.1% |
| Scotch-Irish | 40 | 1.5% |
| Scottish | 15 | 0.6% |
| Swedish | 15 | 0.6% |
| Welsh | 9 | 0.3% | View All 21 Rows |
Immigrants in South Bloomfield
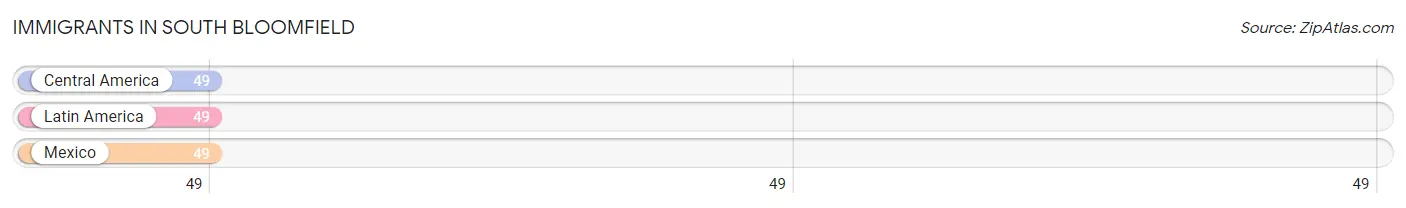
The most numerous immigrant groups reported in South Bloomfield came from Central America (49 | 1.8%), Latin America (49 | 1.8%), and Mexico (49 | 1.8%), together accounting for 5.5% of all South Bloomfield residents.
| Immigration Origin | # Population | % Population |
| Central America | 49 | 1.8% |
| Latin America | 49 | 1.8% |
| Mexico | 49 | 1.8% | View All 3 Rows |
Sex and Age in South Bloomfield
Sex and Age in South Bloomfield
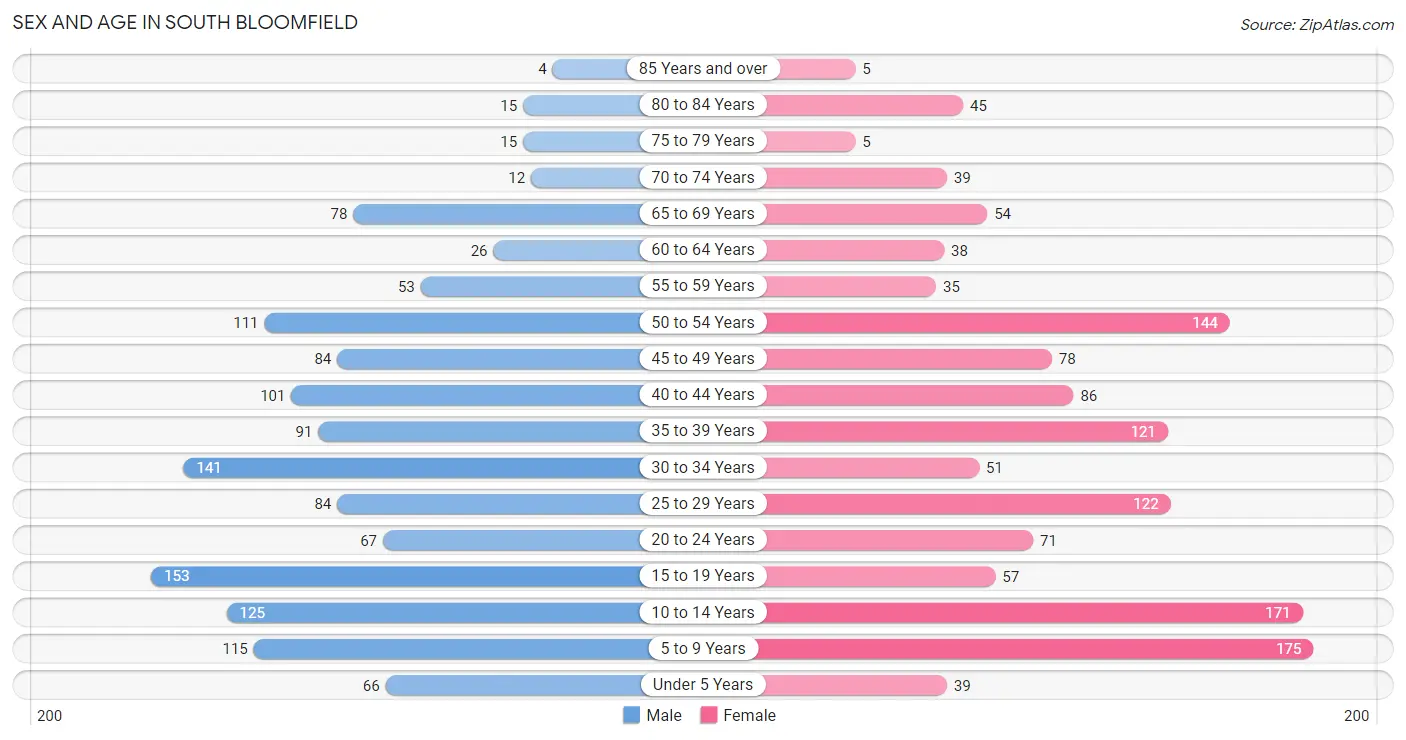
The most populous age groups in South Bloomfield are 15 to 19 Years (153 | 11.4%) for men and 5 to 9 Years (175 | 13.1%) for women.
| Age Bracket | Male | Female |
| Under 5 Years | 66 (4.9%) | 39 (2.9%) |
| 5 to 9 Years | 115 (8.6%) | 175 (13.1%) |
| 10 to 14 Years | 125 (9.3%) | 171 (12.8%) |
| 15 to 19 Years | 153 (11.4%) | 57 (4.3%) |
| 20 to 24 Years | 67 (5.0%) | 71 (5.3%) |
| 25 to 29 Years | 84 (6.3%) | 122 (9.1%) |
| 30 to 34 Years | 141 (10.5%) | 51 (3.8%) |
| 35 to 39 Years | 91 (6.8%) | 121 (9.1%) |
| 40 to 44 Years | 101 (7.5%) | 86 (6.4%) |
| 45 to 49 Years | 84 (6.3%) | 78 (5.8%) |
| 50 to 54 Years | 111 (8.3%) | 144 (10.8%) |
| 55 to 59 Years | 53 (4.0%) | 35 (2.6%) |
| 60 to 64 Years | 26 (1.9%) | 38 (2.8%) |
| 65 to 69 Years | 78 (5.8%) | 54 (4.0%) |
| 70 to 74 Years | 12 (0.9%) | 39 (2.9%) |
| 75 to 79 Years | 15 (1.1%) | 5 (0.4%) |
| 80 to 84 Years | 15 (1.1%) | 45 (3.4%) |
| 85 Years and over | 4 (0.3%) | 5 (0.4%) |
| Total | 1,341 (100.0%) | 1,336 (100.0%) |
Families and Households in South Bloomfield
Median Family Size in South Bloomfield
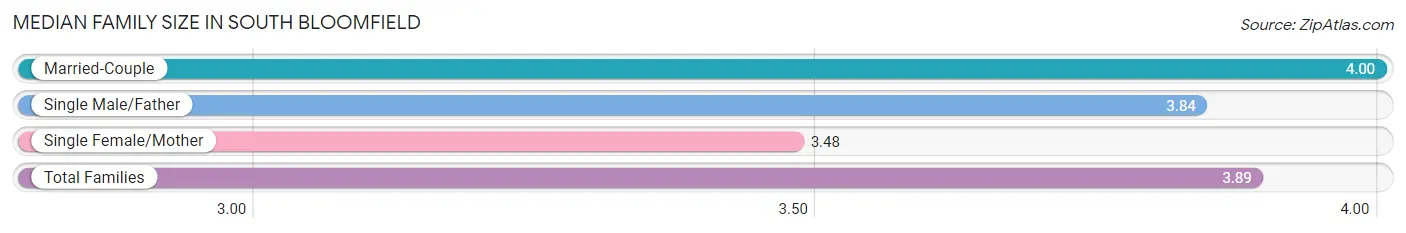
The median family size in South Bloomfield is 3.89 persons per family, with married-couple families (404 | 70.3%) accounting for the largest median family size of 4 persons per family. On the other hand, single female/mother families (104 | 18.1%) represent the smallest median family size with 3.48 persons per family.
| Family Type | # Families | Family Size |
| Married-Couple | 404 (70.3%) | 4.00 |
| Single Male/Father | 67 (11.7%) | 3.84 |
| Single Female/Mother | 104 (18.1%) | 3.48 |
| Total Families | 575 (100.0%) | 3.89 |
Median Household Size in South Bloomfield
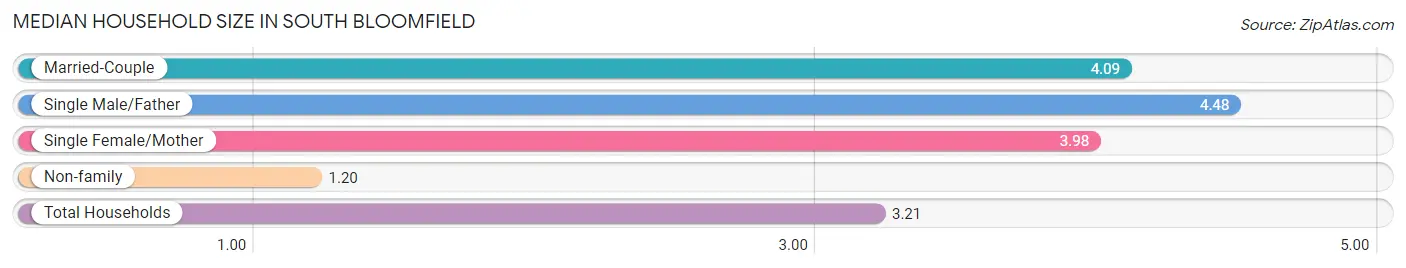
The median household size in South Bloomfield is 3.21 persons per household, with single male/father households (67 | 8.0%) accounting for the largest median household size of 4.48 persons per household. non-family households (259 | 31.1%) represent the smallest median household size with 1.20 persons per household.
| Household Type | # Households | Household Size |
| Married-Couple | 404 (48.4%) | 4.09 |
| Single Male/Father | 67 (8.0%) | 4.48 |
| Single Female/Mother | 104 (12.5%) | 3.98 |
| Non-family | 259 (31.1%) | 1.20 |
| Total Households | 834 (100.0%) | 3.21 |
Household Size by Marriage Status in South Bloomfield
Out of a total of 834 households in South Bloomfield, 575 (68.9%) are family households, while 259 (31.1%) are nonfamily households. The most numerous type of family households are 2-person households, comprising 175, and the most common type of nonfamily households are 1-person households, comprising 212.
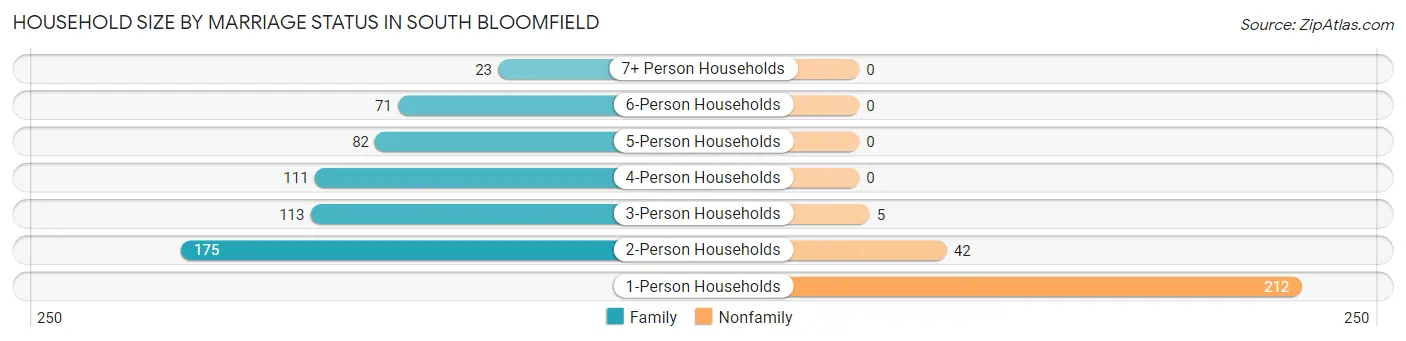
| Household Size | Family Households | Nonfamily Households |
| 1-Person Households | - | 212 (25.4%) |
| 2-Person Households | 175 (21.0%) | 42 (5.0%) |
| 3-Person Households | 113 (13.6%) | 5 (0.6%) |
| 4-Person Households | 111 (13.3%) | 0 (0.0%) |
| 5-Person Households | 82 (9.8%) | 0 (0.0%) |
| 6-Person Households | 71 (8.5%) | 0 (0.0%) |
| 7+ Person Households | 23 (2.8%) | 0 (0.0%) |
| Total | 575 (68.9%) | 259 (31.1%) |
Female Fertility in South Bloomfield
Fertility by Age in South Bloomfield
Average fertility rate in South Bloomfield is 38.0 births per 1,000 women. Women in the age bracket of 20 to 34 years have the highest fertility rate with 102.0 births per 1,000 women. Women in the age bracket of 20 to 34 years acount for 100.0% of all women with births.
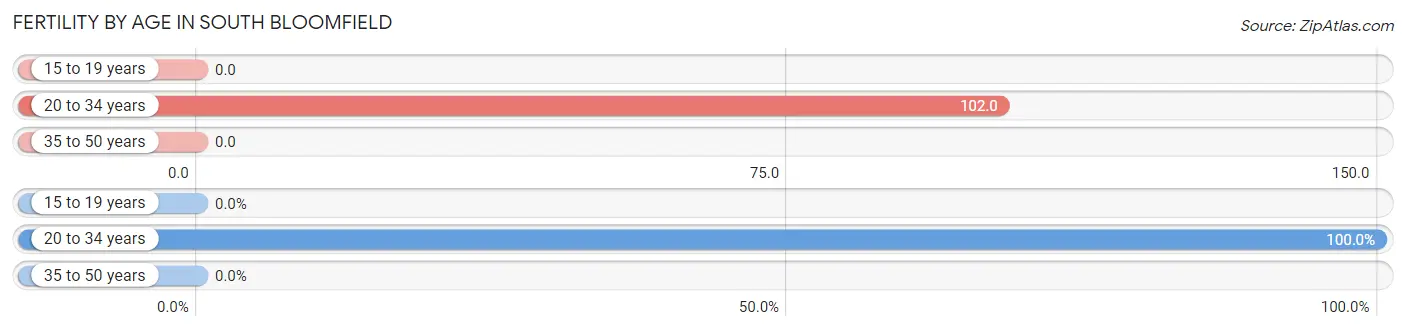
| Age Bracket | Women with Births | Births / 1,000 Women |
| 15 to 19 years | 0 (0.0%) | 0.0 |
| 20 to 34 years | 25 (100.0%) | 102.0 |
| 35 to 50 years | 0 (0.0%) | 0.0 |
| Total | 25 (100.0%) | 38.0 |
Fertility by Age by Marriage Status in South Bloomfield
60.0% of women with births (25) in South Bloomfield are married. The highest percentage of unmarried women with births falls into 20 to 34 years age bracket with 40.0% of them unmarried at the time of birth, while the lowest percentage of unmarried women with births belong to 20 to 34 years age bracket with 40.0% of them unmarried.
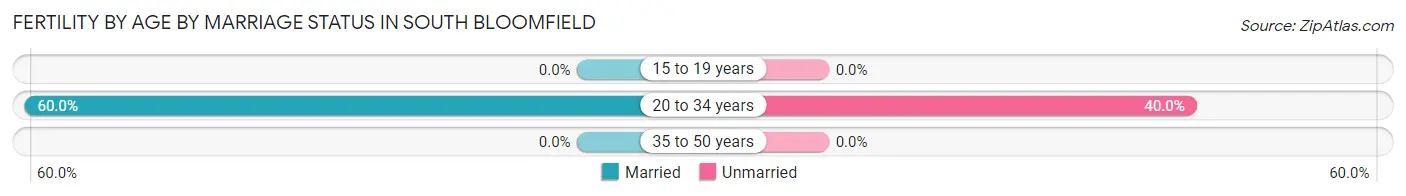
| Age Bracket | Married | Unmarried |
| 15 to 19 years | 0 (0.0%) | 0 (0.0%) |
| 20 to 34 years | 15 (60.0%) | 10 (40.0%) |
| 35 to 50 years | 0 (0.0%) | 0 (0.0%) |
| Total | 15 (60.0%) | 10 (40.0%) |
Fertility by Education in South Bloomfield
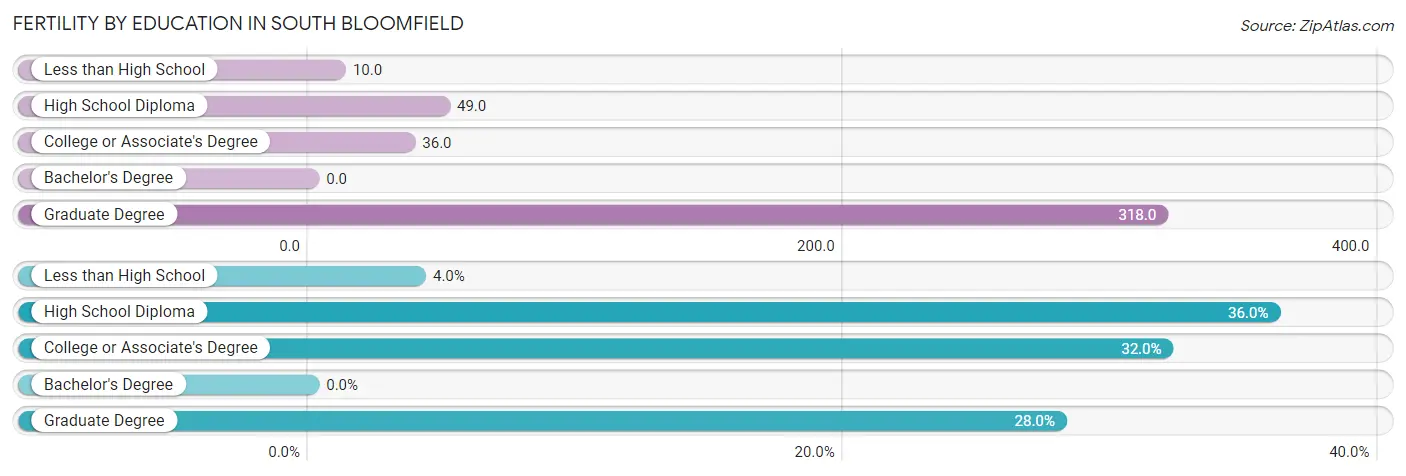
| Educational Attainment | Women with Births | Births / 1,000 Women |
| Less than High School | 1 (4.0%) | 10.0 |
| High School Diploma | 9 (36.0%) | 49.0 |
| College or Associate's Degree | 8 (32.0%) | 36.0 |
| Bachelor's Degree | 0 (0.0%) | 0.0 |
| Graduate Degree | 7 (28.0%) | 318.0 |
| Total | 25 (100.0%) | 38.0 |
Fertility by Education by Marriage Status in South Bloomfield
40.0% of women with births in South Bloomfield are unmarried. Women with the educational attainment of college or associate's degree are most likely to be married with 100.0% of them married at childbirth, while women with the educational attainment of less than high school are least likely to be married with 100.0% of them unmarried at childbirth.
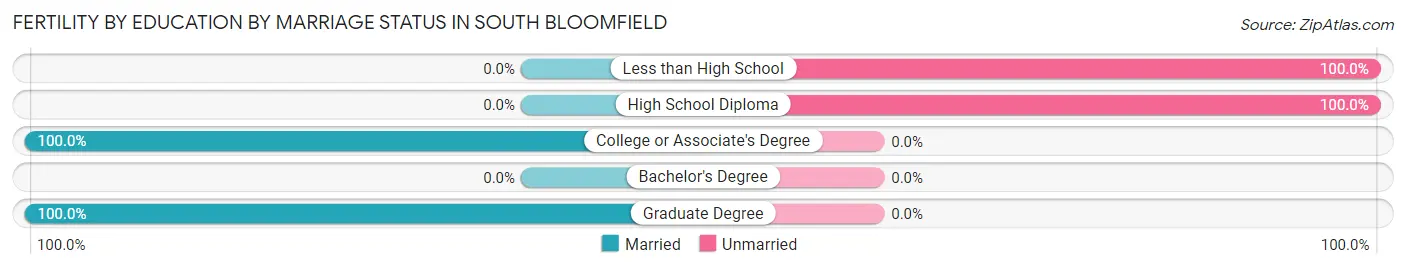
| Educational Attainment | Married | Unmarried |
| Less than High School | 0 (0.0%) | 1 (100.0%) |
| High School Diploma | 0 (0.0%) | 9 (100.0%) |
| College or Associate's Degree | 8 (100.0%) | 0 (0.0%) |
| Bachelor's Degree | 0 (0.0%) | 0 (0.0%) |
| Graduate Degree | 7 (100.0%) | 0 (0.0%) |
| Total | 15 (60.0%) | 10 (40.0%) |
Employment Characteristics in South Bloomfield
Employment by Class of Employer in South Bloomfield
Among the 1,307 employed individuals in South Bloomfield, private company employees (1,038 | 79.4%), not-for-profit organizations (82 | 6.3%), and self-employed (not incorporated) (74 | 5.7%) make up the most common classes of employment.
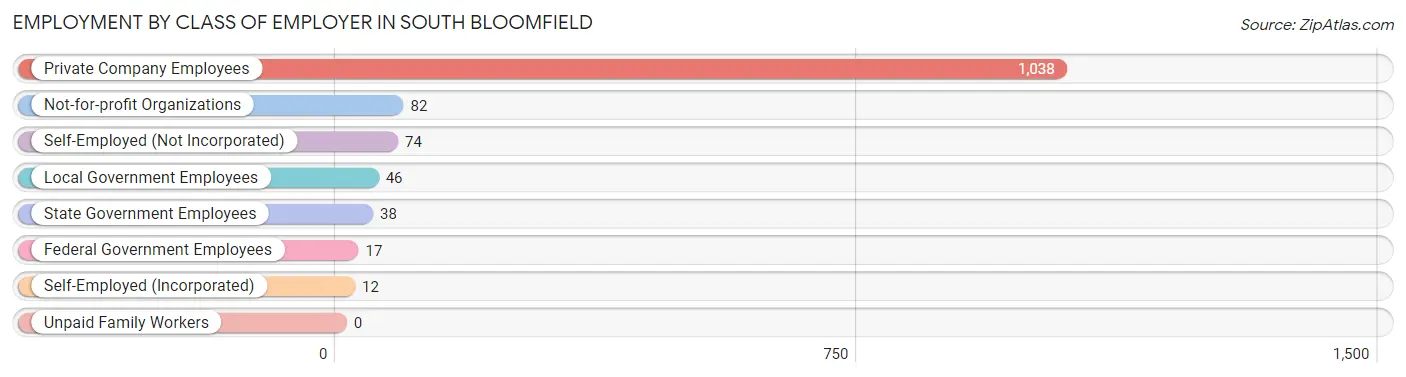
| Employer Class | # Employees | % Employees |
| Private Company Employees | 1,038 | 79.4% |
| Self-Employed (Incorporated) | 12 | 0.9% |
| Self-Employed (Not Incorporated) | 74 | 5.7% |
| Not-for-profit Organizations | 82 | 6.3% |
| Local Government Employees | 46 | 3.5% |
| State Government Employees | 38 | 2.9% |
| Federal Government Employees | 17 | 1.3% |
| Unpaid Family Workers | 0 | 0.0% |
| Total | 1,307 | 100.0% |
Employment Status by Age in South Bloomfield
According to the labor force statistics for South Bloomfield, out of the total population over 16 years of age (1,933), 72.4% or 1,399 individuals are in the labor force, with 6.3% or 88 of them unemployed. The age group with the highest labor force participation rate is 25 to 29 years, with 94.7% or 195 individuals in the labor force. Within the labor force, the 45 to 54 years age range has the highest percentage of unemployed individuals, with 13.3% or 48 of them being unemployed.
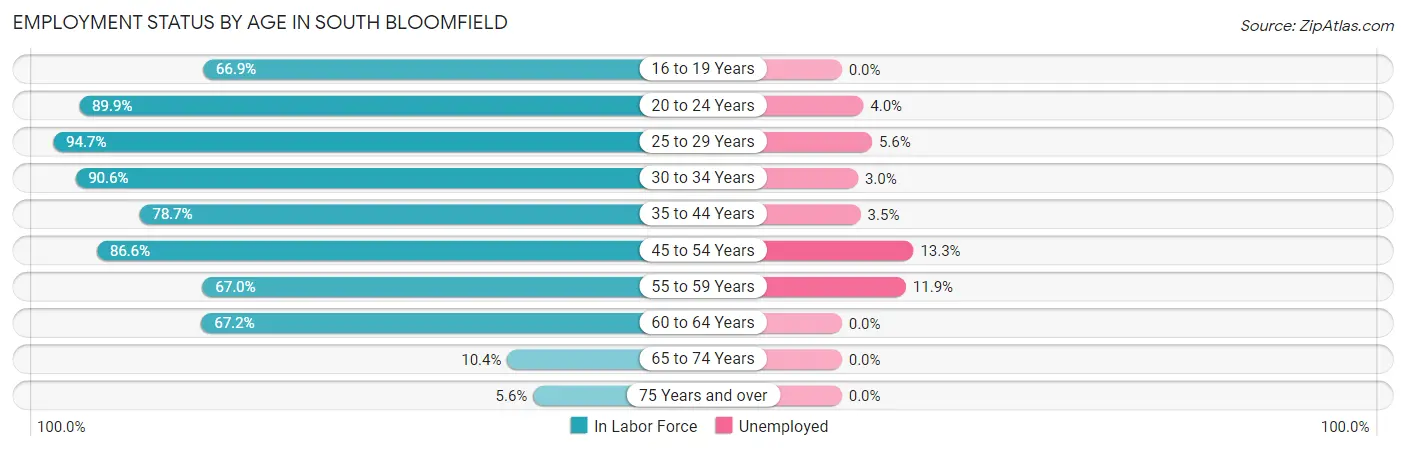
| Age Bracket | In Labor Force | Unemployed |
| 16 to 19 Years | 105 (66.9%) | 0 (0.0%) |
| 20 to 24 Years | 124 (89.9%) | 5 (4.0%) |
| 25 to 29 Years | 195 (94.7%) | 11 (5.6%) |
| 30 to 34 Years | 174 (90.6%) | 5 (3.0%) |
| 35 to 44 Years | 314 (78.7%) | 11 (3.5%) |
| 45 to 54 Years | 361 (86.6%) | 48 (13.3%) |
| 55 to 59 Years | 59 (67.0%) | 7 (11.9%) |
| 60 to 64 Years | 43 (67.2%) | 0 (0.0%) |
| 65 to 74 Years | 19 (10.4%) | 0 (0.0%) |
| 75 Years and over | 5 (5.6%) | 0 (0.0%) |
| Total | 1,399 (72.4%) | 88 (6.3%) |
Employment Status by Educational Attainment in South Bloomfield
According to labor force statistics for South Bloomfield, 83.9% of individuals (1,146) out of the total population between 25 and 64 years of age (1,366) are in the labor force, with 7.2% or 83 of them being unemployed. The group with the highest labor force participation rate are those with the educational attainment of bachelor's degree or higher, with 98.4% or 315 individuals in the labor force. Within the labor force, individuals with high school diploma education have the highest percentage of unemployment, with 15.5% or 66 of them being unemployed.
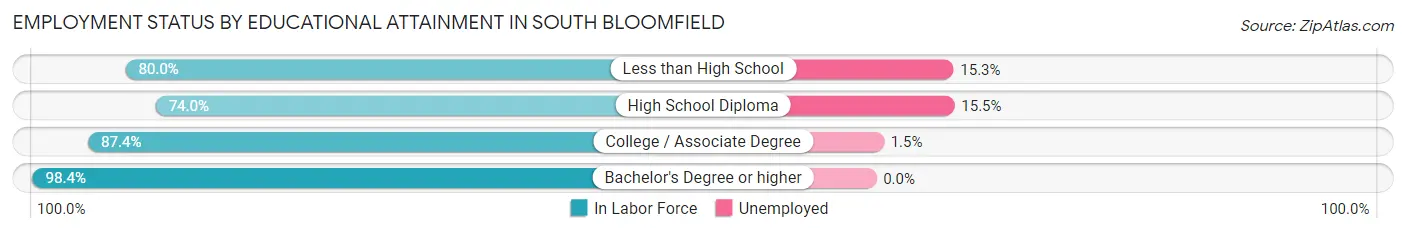
| Educational Attainment | In Labor Force | Unemployed |
| Less than High School | 72 (80.0%) | 14 (15.3%) |
| High School Diploma | 425 (74.0%) | 89 (15.5%) |
| College / Associate Degree | 334 (87.4%) | 6 (1.5%) |
| Bachelor's Degree or higher | 315 (98.4%) | 0 (0.0%) |
| Total | 1,146 (83.9%) | 98 (7.2%) |
Employment Occupations by Sex in South Bloomfield
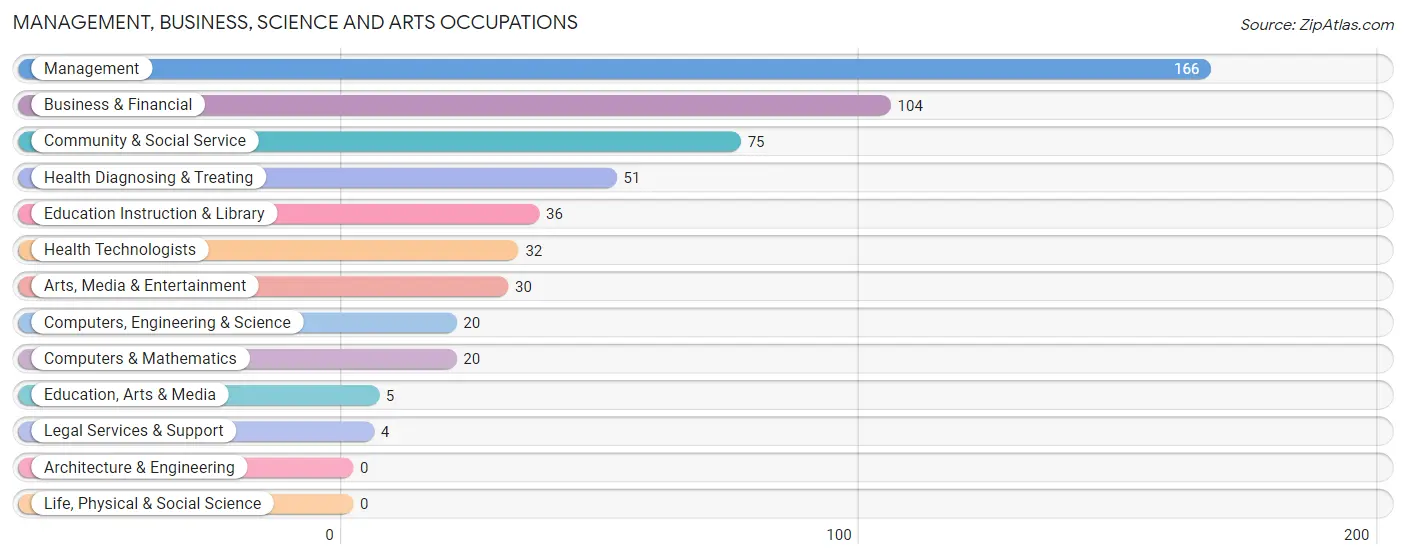
Management, Business, Science and Arts Occupations
The most common Management, Business, Science and Arts occupations in South Bloomfield are Management (166 | 12.7%), Business & Financial (104 | 8.0%), Community & Social Service (75 | 5.8%), Health Diagnosing & Treating (51 | 3.9%), and Education Instruction & Library (36 | 2.8%).
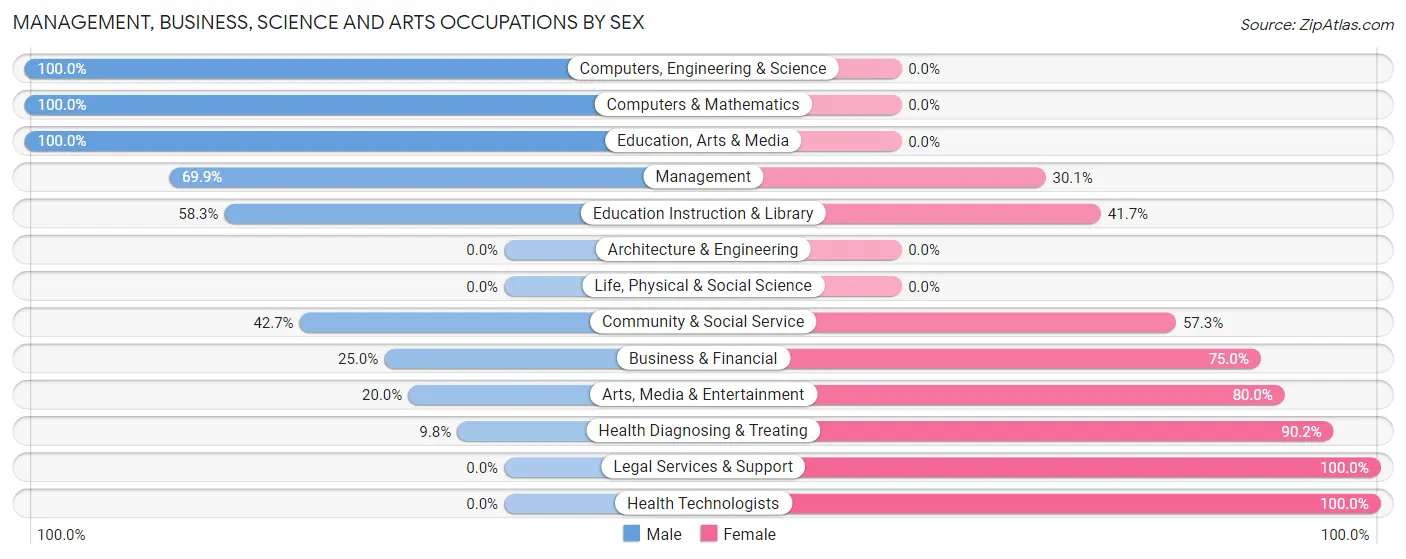
Management, Business, Science and Arts Occupations by Sex
Within the Management, Business, Science and Arts occupations in South Bloomfield, the most male-oriented occupations are Computers, Engineering & Science (100.0%), Computers & Mathematics (100.0%), and Education, Arts & Media (100.0%), while the most female-oriented occupations are Legal Services & Support (100.0%), Health Technologists (100.0%), and Health Diagnosing & Treating (90.2%).
| Occupation | Male | Female |
| Management | 116 (69.9%) | 50 (30.1%) |
| Business & Financial | 26 (25.0%) | 78 (75.0%) |
| Computers, Engineering & Science | 20 (100.0%) | 0 (0.0%) |
| Computers & Mathematics | 20 (100.0%) | 0 (0.0%) |
| Architecture & Engineering | 0 (0.0%) | 0 (0.0%) |
| Life, Physical & Social Science | 0 (0.0%) | 0 (0.0%) |
| Community & Social Service | 32 (42.7%) | 43 (57.3%) |
| Education, Arts & Media | 5 (100.0%) | 0 (0.0%) |
| Legal Services & Support | 0 (0.0%) | 4 (100.0%) |
| Education Instruction & Library | 21 (58.3%) | 15 (41.7%) |
| Arts, Media & Entertainment | 6 (20.0%) | 24 (80.0%) |
| Health Diagnosing & Treating | 5 (9.8%) | 46 (90.2%) |
| Health Technologists | 0 (0.0%) | 32 (100.0%) |
| Total (Category) | 199 (47.8%) | 217 (52.2%) |
| Total (Overall) | 779 (59.7%) | 526 (40.3%) |
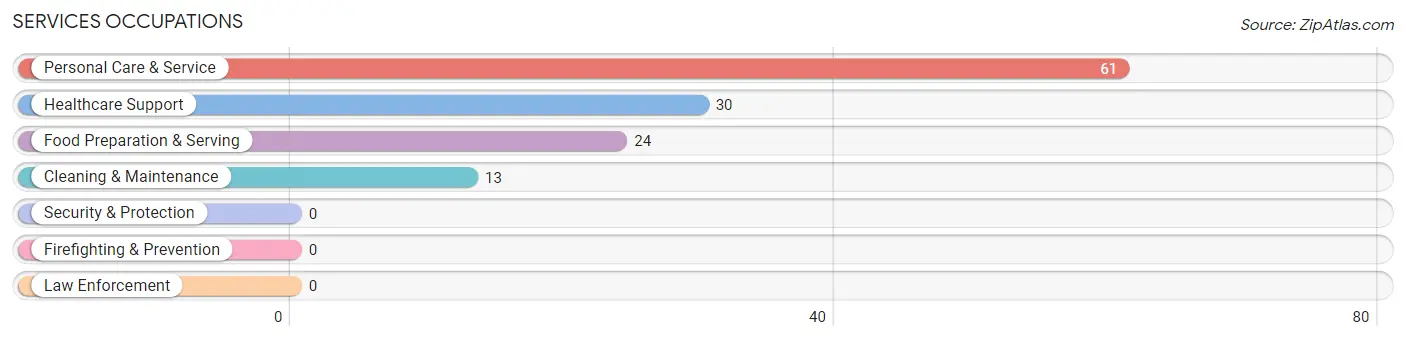
Services Occupations
The most common Services occupations in South Bloomfield are Personal Care & Service (61 | 4.7%), Healthcare Support (30 | 2.3%), Food Preparation & Serving (24 | 1.8%), and Cleaning & Maintenance (13 | 1.0%).
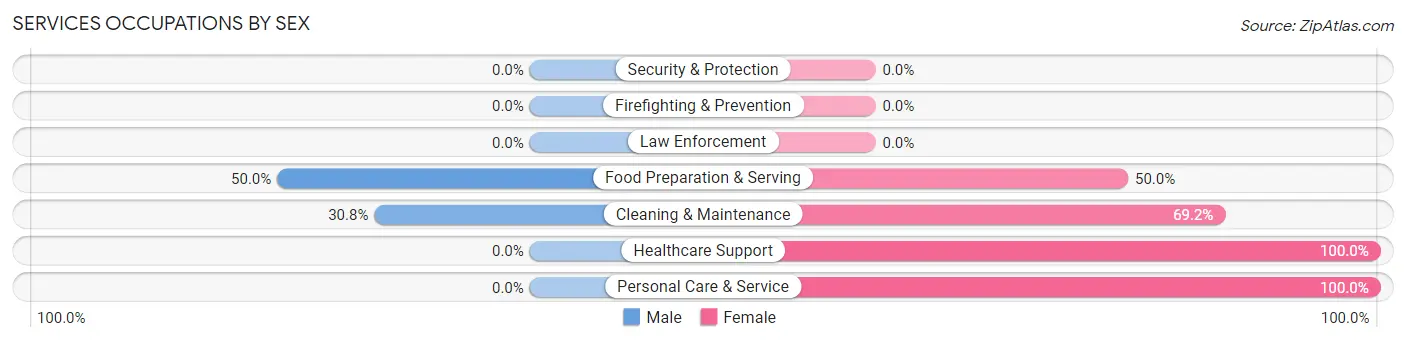
Services Occupations by Sex
Within the Services occupations in South Bloomfield, the most male-oriented occupations are Food Preparation & Serving (50.0%), and Cleaning & Maintenance (30.8%), while the most female-oriented occupations are Healthcare Support (100.0%), Personal Care & Service (100.0%), and Cleaning & Maintenance (69.2%).
| Occupation | Male | Female |
| Healthcare Support | 0 (0.0%) | 30 (100.0%) |
| Security & Protection | 0 (0.0%) | 0 (0.0%) |
| Firefighting & Prevention | 0 (0.0%) | 0 (0.0%) |
| Law Enforcement | 0 (0.0%) | 0 (0.0%) |
| Food Preparation & Serving | 12 (50.0%) | 12 (50.0%) |
| Cleaning & Maintenance | 4 (30.8%) | 9 (69.2%) |
| Personal Care & Service | 0 (0.0%) | 61 (100.0%) |
| Total (Category) | 16 (12.5%) | 112 (87.5%) |
| Total (Overall) | 779 (59.7%) | 526 (40.3%) |
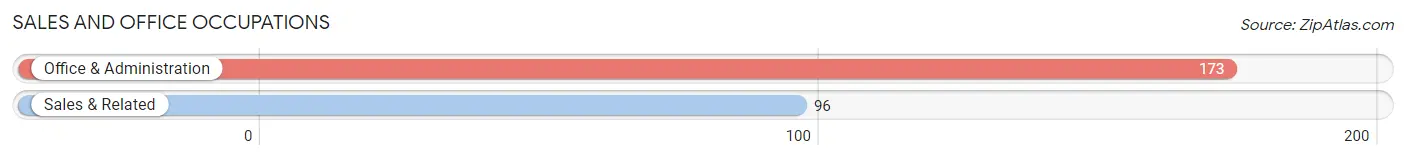
Sales and Office Occupations
The most common Sales and Office occupations in South Bloomfield are Office & Administration (173 | 13.3%), and Sales & Related (96 | 7.4%).
Sales and Office Occupations by Sex
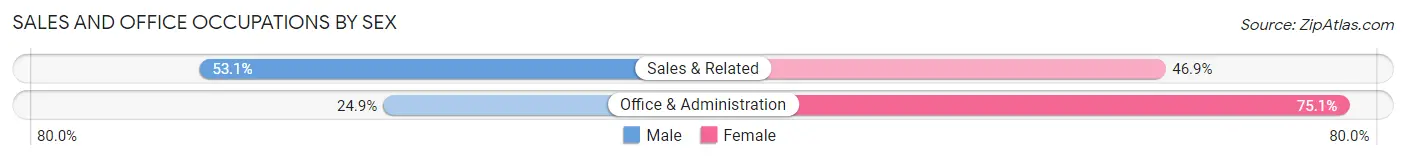
| Occupation | Male | Female |
| Sales & Related | 51 (53.1%) | 45 (46.9%) |
| Office & Administration | 43 (24.9%) | 130 (75.1%) |
| Total (Category) | 94 (34.9%) | 175 (65.1%) |
| Total (Overall) | 779 (59.7%) | 526 (40.3%) |
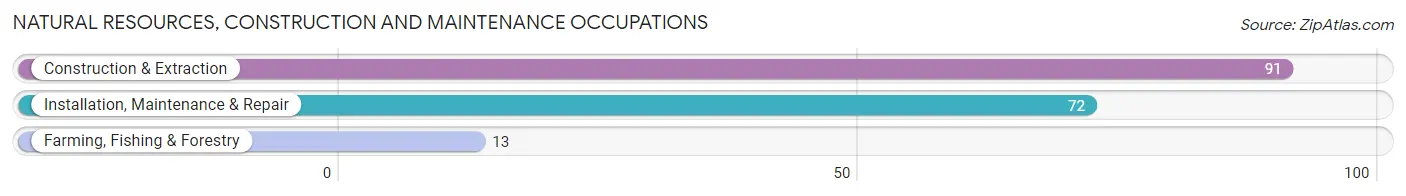
Natural Resources, Construction and Maintenance Occupations
The most common Natural Resources, Construction and Maintenance occupations in South Bloomfield are Construction & Extraction (91 | 7.0%), Installation, Maintenance & Repair (72 | 5.5%), and Farming, Fishing & Forestry (13 | 1.0%).
Natural Resources, Construction and Maintenance Occupations by Sex
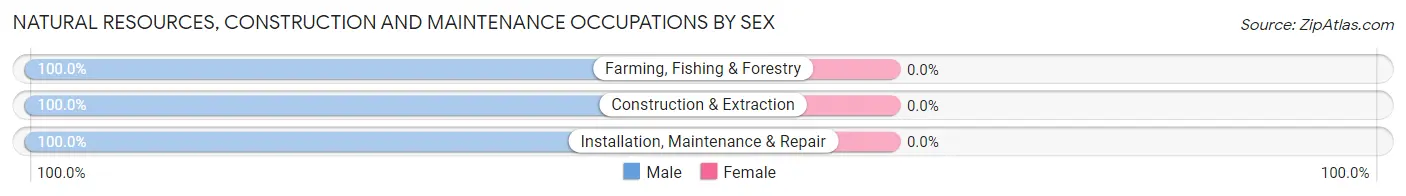
| Occupation | Male | Female |
| Farming, Fishing & Forestry | 13 (100.0%) | 0 (0.0%) |
| Construction & Extraction | 91 (100.0%) | 0 (0.0%) |
| Installation, Maintenance & Repair | 72 (100.0%) | 0 (0.0%) |
| Total (Category) | 176 (100.0%) | 0 (0.0%) |
| Total (Overall) | 779 (59.7%) | 526 (40.3%) |
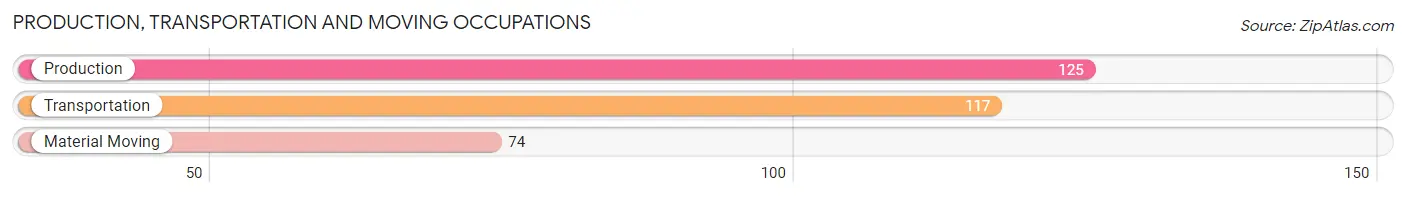
Production, Transportation and Moving Occupations
The most common Production, Transportation and Moving occupations in South Bloomfield are Production (125 | 9.6%), Transportation (117 | 9.0%), and Material Moving (74 | 5.7%).
Production, Transportation and Moving Occupations by Sex
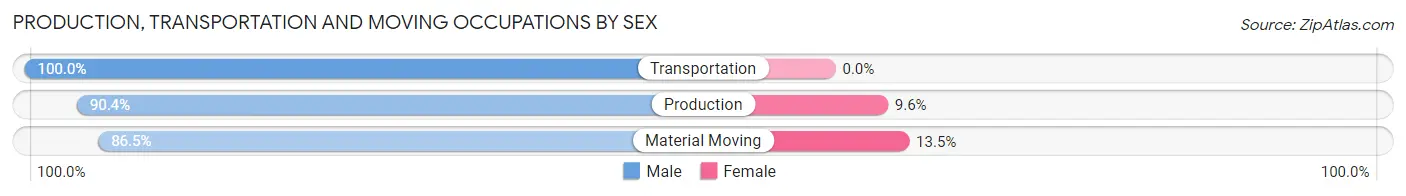
| Occupation | Male | Female |
| Production | 113 (90.4%) | 12 (9.6%) |
| Transportation | 117 (100.0%) | 0 (0.0%) |
| Material Moving | 64 (86.5%) | 10 (13.5%) |
| Total (Category) | 294 (93.0%) | 22 (7.0%) |
| Total (Overall) | 779 (59.7%) | 526 (40.3%) |
Employment Industries by Sex in South Bloomfield
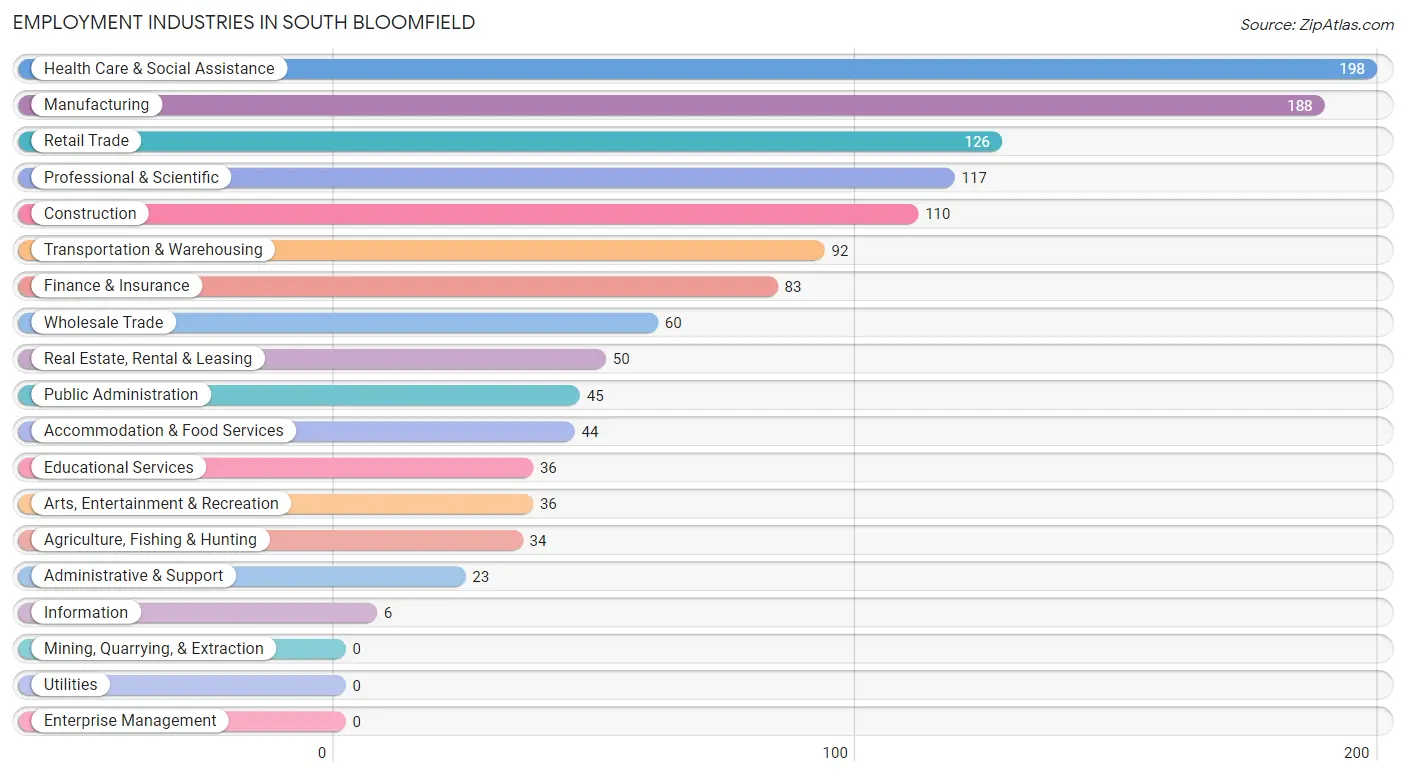
Employment Industries in South Bloomfield
The major employment industries in South Bloomfield include Health Care & Social Assistance (198 | 15.2%), Manufacturing (188 | 14.4%), Retail Trade (126 | 9.7%), Professional & Scientific (117 | 9.0%), and Construction (110 | 8.4%).
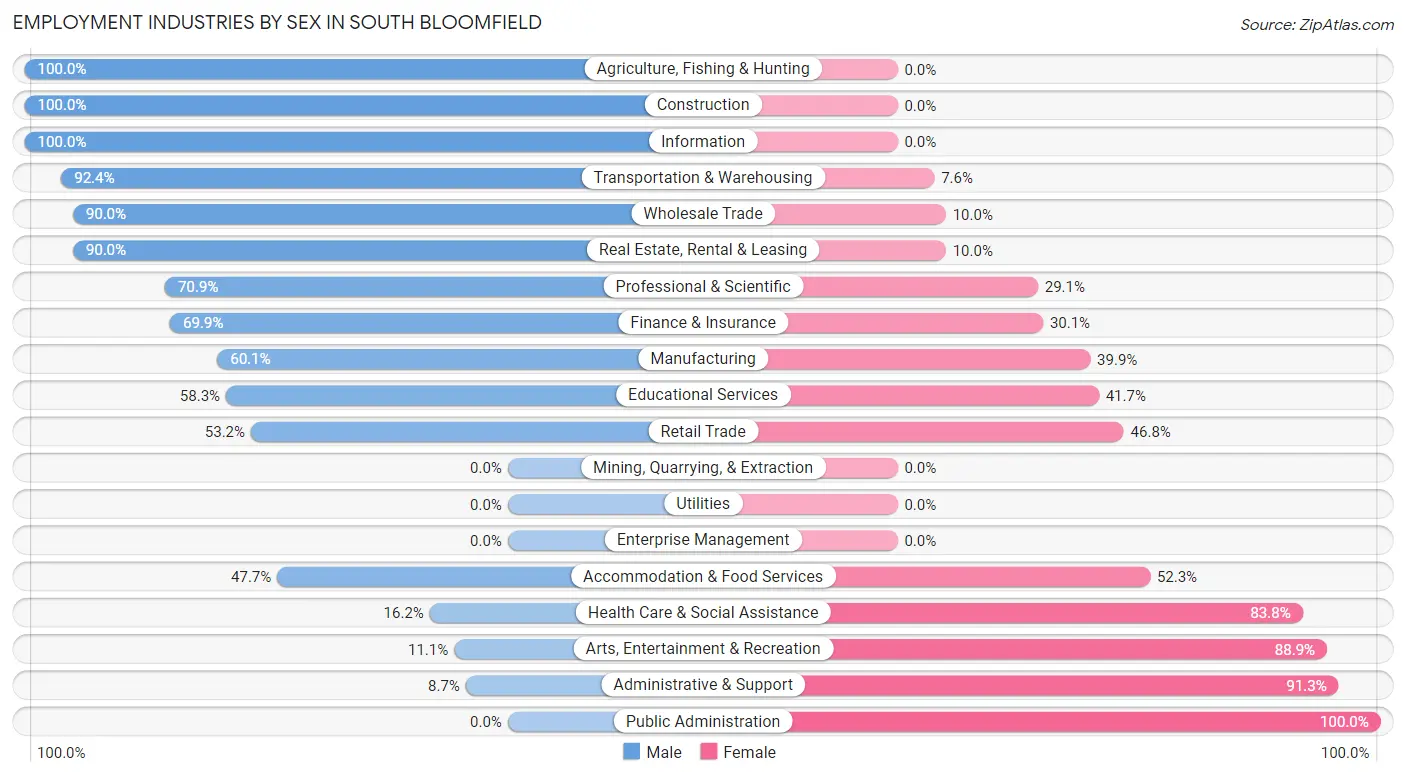
Employment Industries by Sex in South Bloomfield
The South Bloomfield industries that see more men than women are Agriculture, Fishing & Hunting (100.0%), Construction (100.0%), and Information (100.0%), whereas the industries that tend to have a higher number of women are Public Administration (100.0%), Administrative & Support (91.3%), and Arts, Entertainment & Recreation (88.9%).
| Industry | Male | Female |
| Agriculture, Fishing & Hunting | 34 (100.0%) | 0 (0.0%) |
| Mining, Quarrying, & Extraction | 0 (0.0%) | 0 (0.0%) |
| Construction | 110 (100.0%) | 0 (0.0%) |
| Manufacturing | 113 (60.1%) | 75 (39.9%) |
| Wholesale Trade | 54 (90.0%) | 6 (10.0%) |
| Retail Trade | 67 (53.2%) | 59 (46.8%) |
| Transportation & Warehousing | 85 (92.4%) | 7 (7.6%) |
| Utilities | 0 (0.0%) | 0 (0.0%) |
| Information | 6 (100.0%) | 0 (0.0%) |
| Finance & Insurance | 58 (69.9%) | 25 (30.1%) |
| Real Estate, Rental & Leasing | 45 (90.0%) | 5 (10.0%) |
| Professional & Scientific | 83 (70.9%) | 34 (29.1%) |
| Enterprise Management | 0 (0.0%) | 0 (0.0%) |
| Administrative & Support | 2 (8.7%) | 21 (91.3%) |
| Educational Services | 21 (58.3%) | 15 (41.7%) |
| Health Care & Social Assistance | 32 (16.2%) | 166 (83.8%) |
| Arts, Entertainment & Recreation | 4 (11.1%) | 32 (88.9%) |
| Accommodation & Food Services | 21 (47.7%) | 23 (52.3%) |
| Public Administration | 0 (0.0%) | 45 (100.0%) |
| Total | 779 (59.7%) | 526 (40.3%) |
Education in South Bloomfield
School Enrollment in South Bloomfield
The most common levels of schooling among the 859 students in South Bloomfield are middle school (281 | 32.7%), elementary school (236 | 27.5%), and high school (150 | 17.5%).
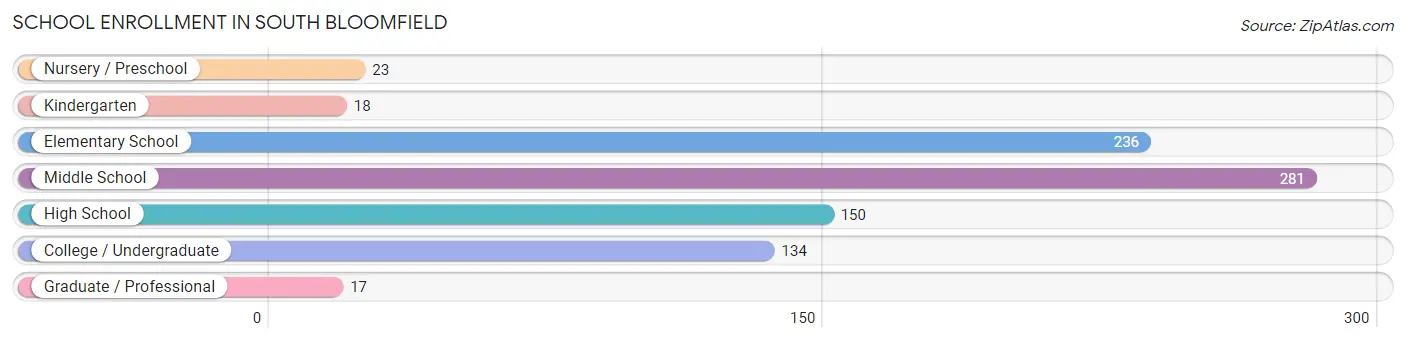
| School Level | # Students | % Students |
| Nursery / Preschool | 23 | 2.7% |
| Kindergarten | 18 | 2.1% |
| Elementary School | 236 | 27.5% |
| Middle School | 281 | 32.7% |
| High School | 150 | 17.5% |
| College / Undergraduate | 134 | 15.6% |
| Graduate / Professional | 17 | 2.0% |
| Total | 859 | 100.0% |
School Enrollment by Age by Funding Source in South Bloomfield
Out of a total of 859 students who are enrolled in schools in South Bloomfield, 51 (5.9%) attend a private institution, while the remaining 808 (94.1%) are enrolled in public schools. The age group of 25 to 34 year olds has the highest likelihood of being enrolled in private schools, with 6 (37.5% in the age bracket) enrolled. Conversely, the age group of 15 to 17 year olds has the lowest likelihood of being enrolled in a private school, with 76 (100.0% in the age bracket) attending a public institution.
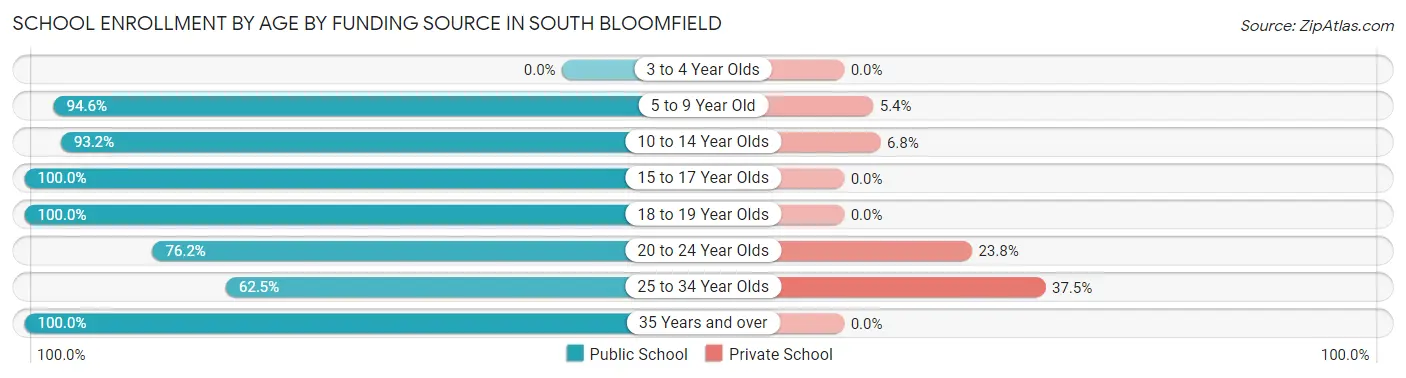
| Age Bracket | Public School | Private School |
| 3 to 4 Year Olds | 0 (0.0%) | 0 (0.0%) |
| 5 to 9 Year Old | 262 (94.6%) | 15 (5.4%) |
| 10 to 14 Year Olds | 276 (93.2%) | 20 (6.8%) |
| 15 to 17 Year Olds | 76 (100.0%) | 0 (0.0%) |
| 18 to 19 Year Olds | 118 (100.0%) | 0 (0.0%) |
| 20 to 24 Year Olds | 32 (76.2%) | 10 (23.8%) |
| 25 to 34 Year Olds | 10 (62.5%) | 6 (37.5%) |
| 35 Years and over | 34 (100.0%) | 0 (0.0%) |
| Total | 808 (94.1%) | 51 (5.9%) |
Educational Attainment by Field of Study in South Bloomfield
Business (84 | 25.0%), literature & languages (69 | 20.5%), science & technology (59 | 17.6%), education (40 | 11.9%), and engineering (21 | 6.2%) are the most common fields of study among 336 individuals in South Bloomfield who have obtained a bachelor's degree or higher.
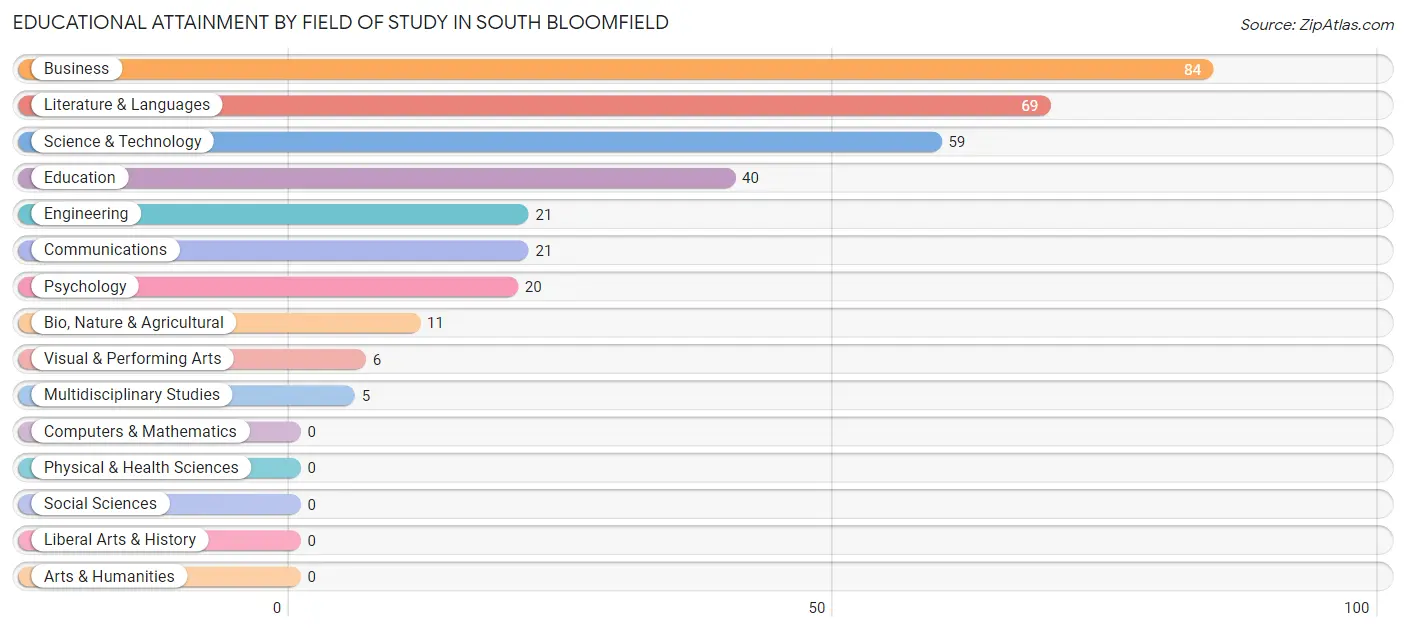
| Field of Study | # Graduates | % Graduates |
| Computers & Mathematics | 0 | 0.0% |
| Bio, Nature & Agricultural | 11 | 3.3% |
| Physical & Health Sciences | 0 | 0.0% |
| Psychology | 20 | 5.9% |
| Social Sciences | 0 | 0.0% |
| Engineering | 21 | 6.2% |
| Multidisciplinary Studies | 5 | 1.5% |
| Science & Technology | 59 | 17.6% |
| Business | 84 | 25.0% |
| Education | 40 | 11.9% |
| Literature & Languages | 69 | 20.5% |
| Liberal Arts & History | 0 | 0.0% |
| Visual & Performing Arts | 6 | 1.8% |
| Communications | 21 | 6.2% |
| Arts & Humanities | 0 | 0.0% |
| Total | 336 | 100.0% |
Transportation & Commute in South Bloomfield
Vehicle Availability by Sex in South Bloomfield
The most prevalent vehicle ownership categories in South Bloomfield are males with 2 vehicles (279, accounting for 36.0%) and females with 2 vehicles (192, making up 52.3%).
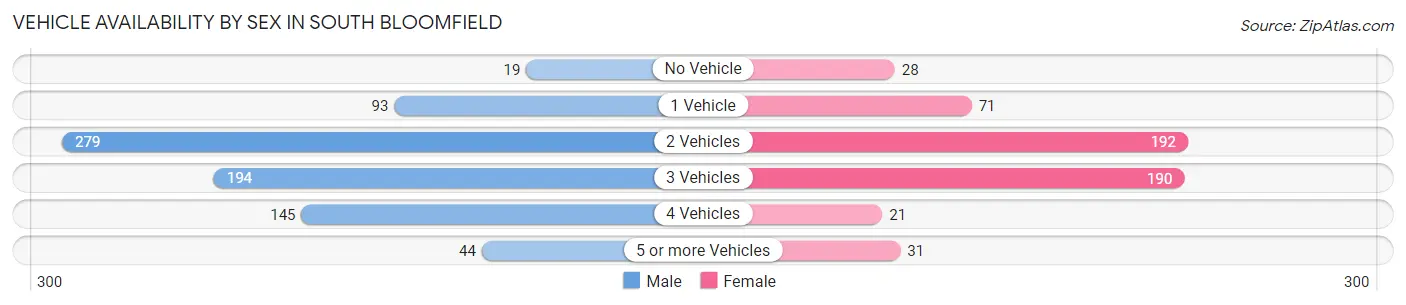
| Vehicles Available | Male | Female |
| No Vehicle | 19 (2.5%) | 28 (5.2%) |
| 1 Vehicle | 93 (12.0%) | 71 (13.3%) |
| 2 Vehicles | 279 (36.0%) | 192 (36.0%) |
| 3 Vehicles | 194 (25.1%) | 190 (35.6%) |
| 4 Vehicles | 145 (18.7%) | 21 (3.9%) |
| 5 or more Vehicles | 44 (5.7%) | 31 (5.8%) |
| Total | 774 (100.0%) | 533 (100.0%) |
Commute Time in South Bloomfield
The most frequently occuring commute durations in South Bloomfield are 30 to 34 minutes (309 commuters, 26.2%), 45 to 59 minutes (198 commuters, 16.8%), and 25 to 29 minutes (142 commuters, 12.0%).
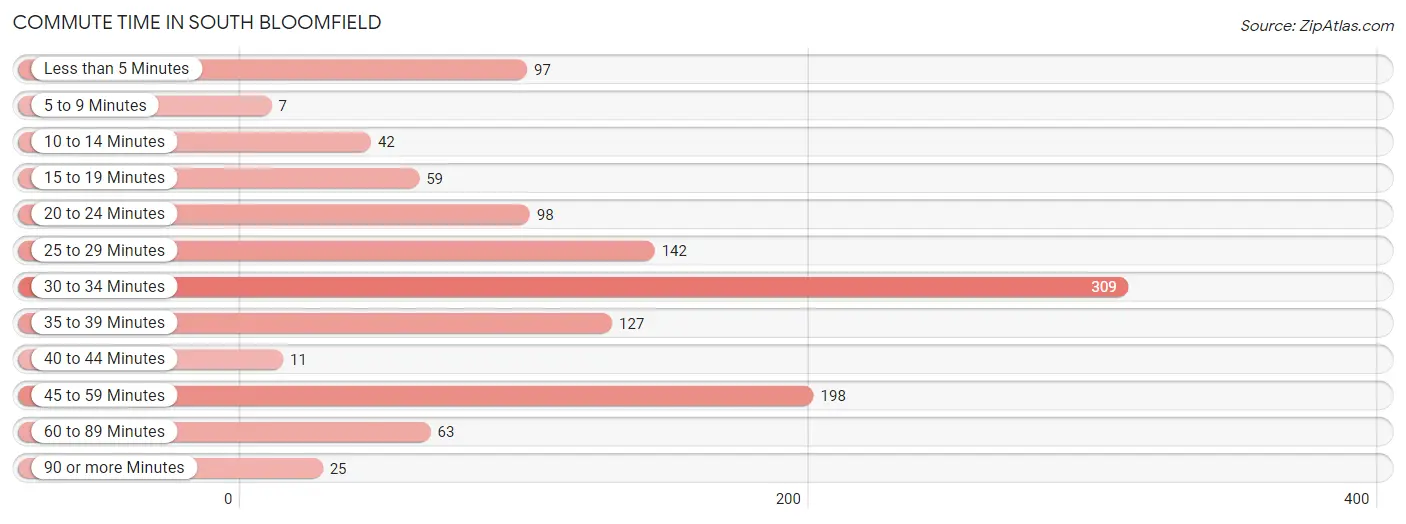
| Commute Time | # Commuters | % Commuters |
| Less than 5 Minutes | 97 | 8.2% |
| 5 to 9 Minutes | 7 | 0.6% |
| 10 to 14 Minutes | 42 | 3.6% |
| 15 to 19 Minutes | 59 | 5.0% |
| 20 to 24 Minutes | 98 | 8.3% |
| 25 to 29 Minutes | 142 | 12.0% |
| 30 to 34 Minutes | 309 | 26.2% |
| 35 to 39 Minutes | 127 | 10.8% |
| 40 to 44 Minutes | 11 | 0.9% |
| 45 to 59 Minutes | 198 | 16.8% |
| 60 to 89 Minutes | 63 | 5.3% |
| 90 or more Minutes | 25 | 2.1% |
Commute Time by Sex in South Bloomfield
The most common commute times in South Bloomfield are 30 to 34 minutes (230 commuters, 31.6%) for males and 30 to 34 minutes (79 commuters, 17.6%) for females.
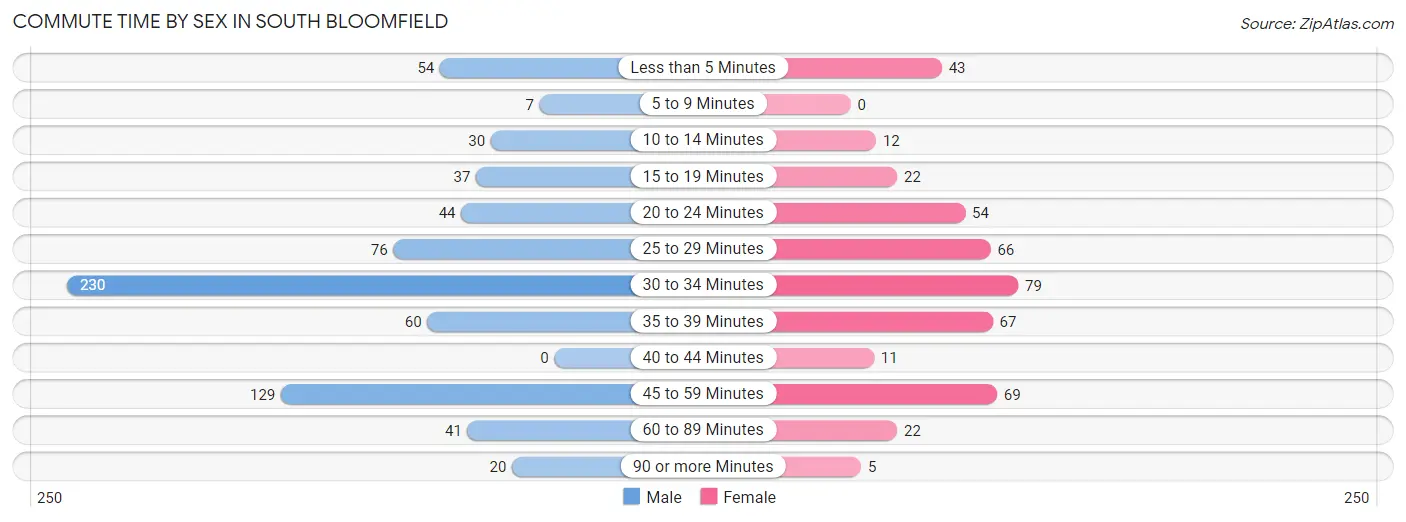
| Commute Time | Male | Female |
| Less than 5 Minutes | 54 (7.4%) | 43 (9.6%) |
| 5 to 9 Minutes | 7 (1.0%) | 0 (0.0%) |
| 10 to 14 Minutes | 30 (4.1%) | 12 (2.7%) |
| 15 to 19 Minutes | 37 (5.1%) | 22 (4.9%) |
| 20 to 24 Minutes | 44 (6.0%) | 54 (12.0%) |
| 25 to 29 Minutes | 76 (10.4%) | 66 (14.7%) |
| 30 to 34 Minutes | 230 (31.6%) | 79 (17.6%) |
| 35 to 39 Minutes | 60 (8.2%) | 67 (14.9%) |
| 40 to 44 Minutes | 0 (0.0%) | 11 (2.4%) |
| 45 to 59 Minutes | 129 (17.7%) | 69 (15.3%) |
| 60 to 89 Minutes | 41 (5.6%) | 22 (4.9%) |
| 90 or more Minutes | 20 (2.8%) | 5 (1.1%) |
Time of Departure to Work by Sex in South Bloomfield
The most frequent times of departure to work in South Bloomfield are 6:00 AM to 6:29 AM (216, 29.7%) for males and 8:00 AM to 8:29 AM (101, 22.4%) for females.
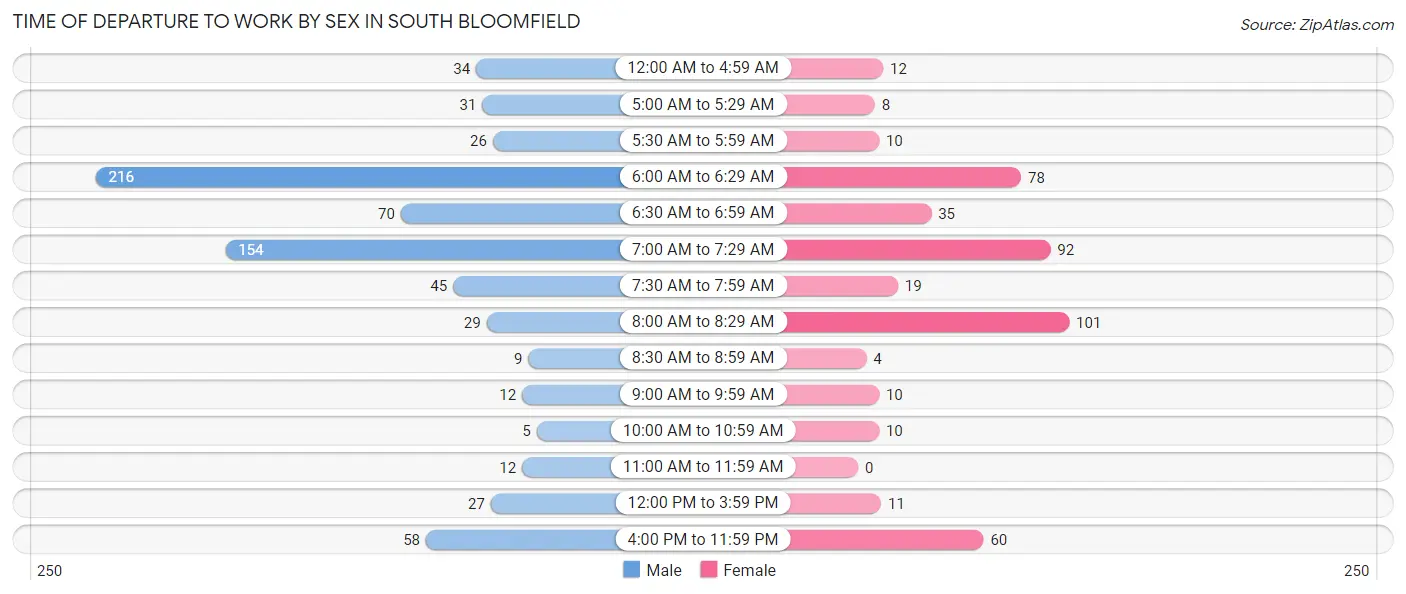
| Time of Departure | Male | Female |
| 12:00 AM to 4:59 AM | 34 (4.7%) | 12 (2.7%) |
| 5:00 AM to 5:29 AM | 31 (4.3%) | 8 (1.8%) |
| 5:30 AM to 5:59 AM | 26 (3.6%) | 10 (2.2%) |
| 6:00 AM to 6:29 AM | 216 (29.7%) | 78 (17.3%) |
| 6:30 AM to 6:59 AM | 70 (9.6%) | 35 (7.8%) |
| 7:00 AM to 7:29 AM | 154 (21.1%) | 92 (20.4%) |
| 7:30 AM to 7:59 AM | 45 (6.2%) | 19 (4.2%) |
| 8:00 AM to 8:29 AM | 29 (4.0%) | 101 (22.4%) |
| 8:30 AM to 8:59 AM | 9 (1.2%) | 4 (0.9%) |
| 9:00 AM to 9:59 AM | 12 (1.7%) | 10 (2.2%) |
| 10:00 AM to 10:59 AM | 5 (0.7%) | 10 (2.2%) |
| 11:00 AM to 11:59 AM | 12 (1.7%) | 0 (0.0%) |
| 12:00 PM to 3:59 PM | 27 (3.7%) | 11 (2.4%) |
| 4:00 PM to 11:59 PM | 58 (8.0%) | 60 (13.3%) |
| Total | 728 (100.0%) | 450 (100.0%) |
Housing Occupancy in South Bloomfield
Occupancy by Ownership in South Bloomfield
Of the total 834 dwellings in South Bloomfield, owner-occupied units account for 647 (77.6%), while renter-occupied units make up 187 (22.4%).
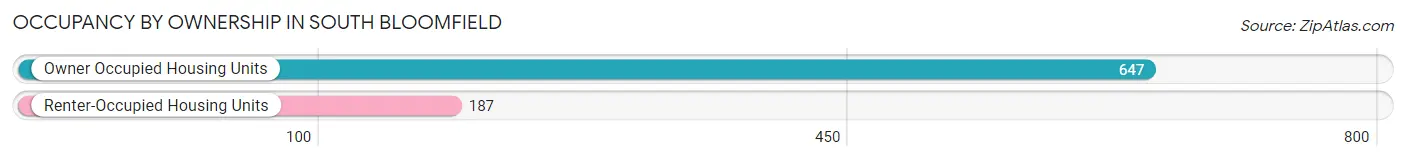
| Occupancy | # Housing Units | % Housing Units |
| Owner Occupied Housing Units | 647 | 77.6% |
| Renter-Occupied Housing Units | 187 | 22.4% |
| Total Occupied Housing Units | 834 | 100.0% |
Occupancy by Household Size in South Bloomfield
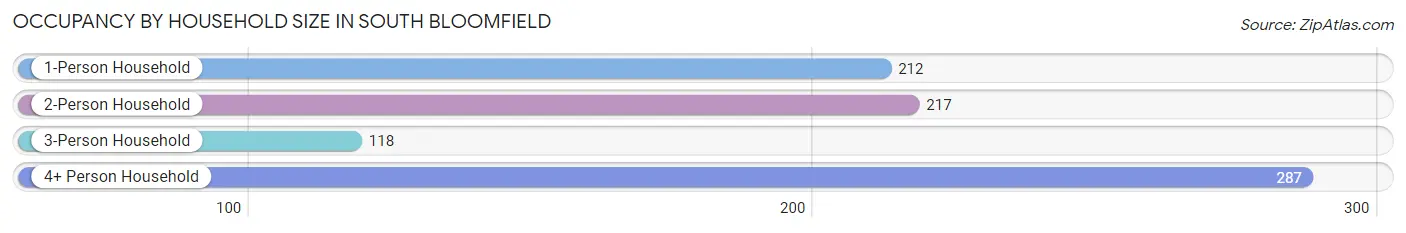
| Household Size | # Housing Units | % Housing Units |
| 1-Person Household | 212 | 25.4% |
| 2-Person Household | 217 | 26.0% |
| 3-Person Household | 118 | 14.1% |
| 4+ Person Household | 287 | 34.4% |
| Total Housing Units | 834 | 100.0% |
Occupancy by Ownership by Household Size in South Bloomfield
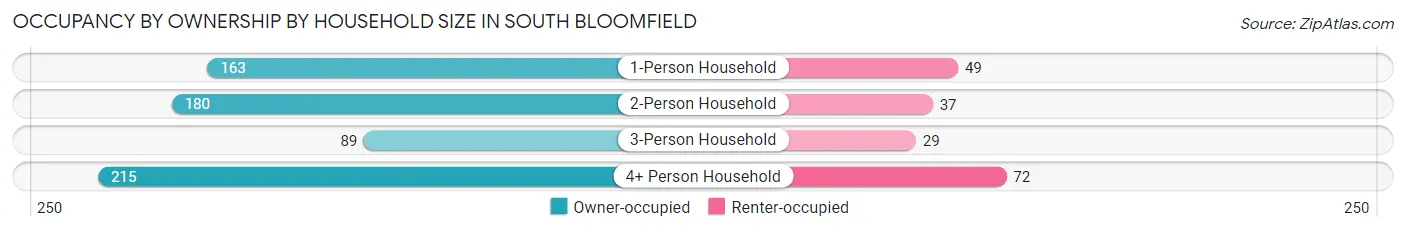
| Household Size | Owner-occupied | Renter-occupied |
| 1-Person Household | 163 (76.9%) | 49 (23.1%) |
| 2-Person Household | 180 (83.0%) | 37 (17.1%) |
| 3-Person Household | 89 (75.4%) | 29 (24.6%) |
| 4+ Person Household | 215 (74.9%) | 72 (25.1%) |
| Total Housing Units | 647 (77.6%) | 187 (22.4%) |
Occupancy by Educational Attainment in South Bloomfield
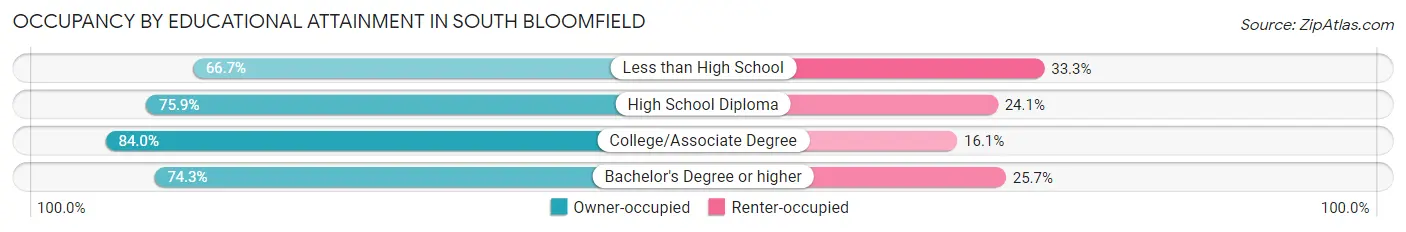
| Household Size | Owner-occupied | Renter-occupied |
| Less than High School | 52 (66.7%) | 26 (33.3%) |
| High School Diploma | 211 (75.9%) | 67 (24.1%) |
| College/Associate Degree | 251 (84.0%) | 48 (16.1%) |
| Bachelor's Degree or higher | 133 (74.3%) | 46 (25.7%) |
Occupancy by Age of Householder in South Bloomfield
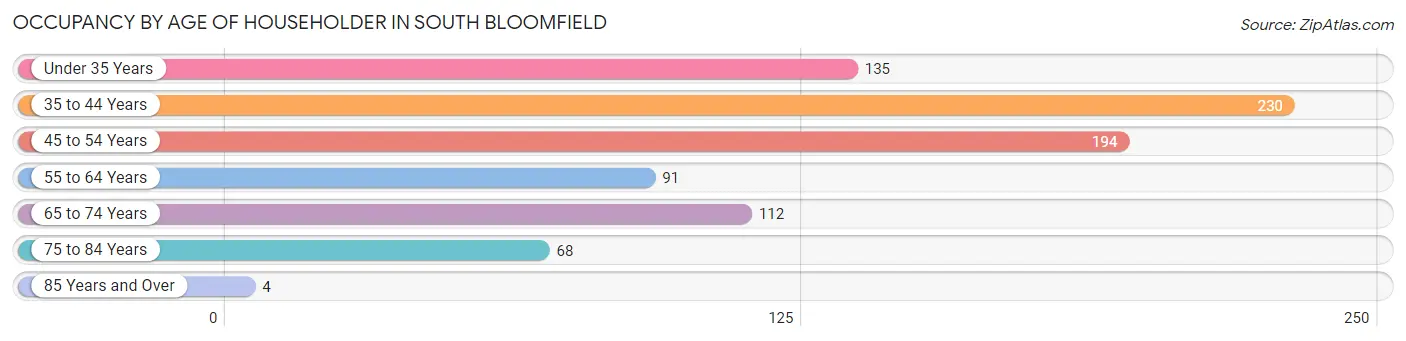
| Age Bracket | # Households | % Households |
| Under 35 Years | 135 | 16.2% |
| 35 to 44 Years | 230 | 27.6% |
| 45 to 54 Years | 194 | 23.3% |
| 55 to 64 Years | 91 | 10.9% |
| 65 to 74 Years | 112 | 13.4% |
| 75 to 84 Years | 68 | 8.2% |
| 85 Years and Over | 4 | 0.5% |
| Total | 834 | 100.0% |
Housing Finances in South Bloomfield
Median Income by Occupancy in South Bloomfield
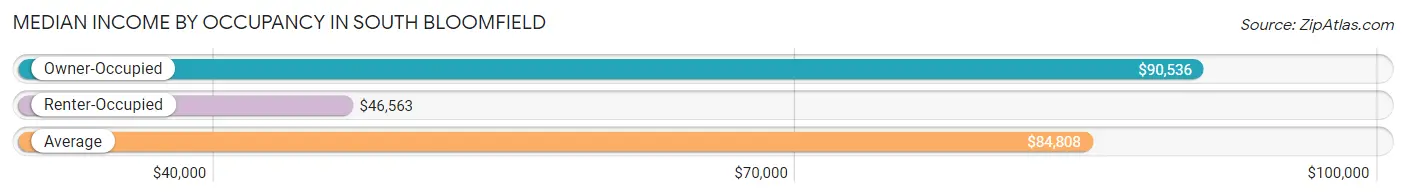
| Occupancy Type | # Households | Median Income |
| Owner-Occupied | 647 (77.6%) | $90,536 |
| Renter-Occupied | 187 (22.4%) | $46,563 |
| Average | 834 (100.0%) | $84,808 |
Occupancy by Householder Income Bracket in South Bloomfield
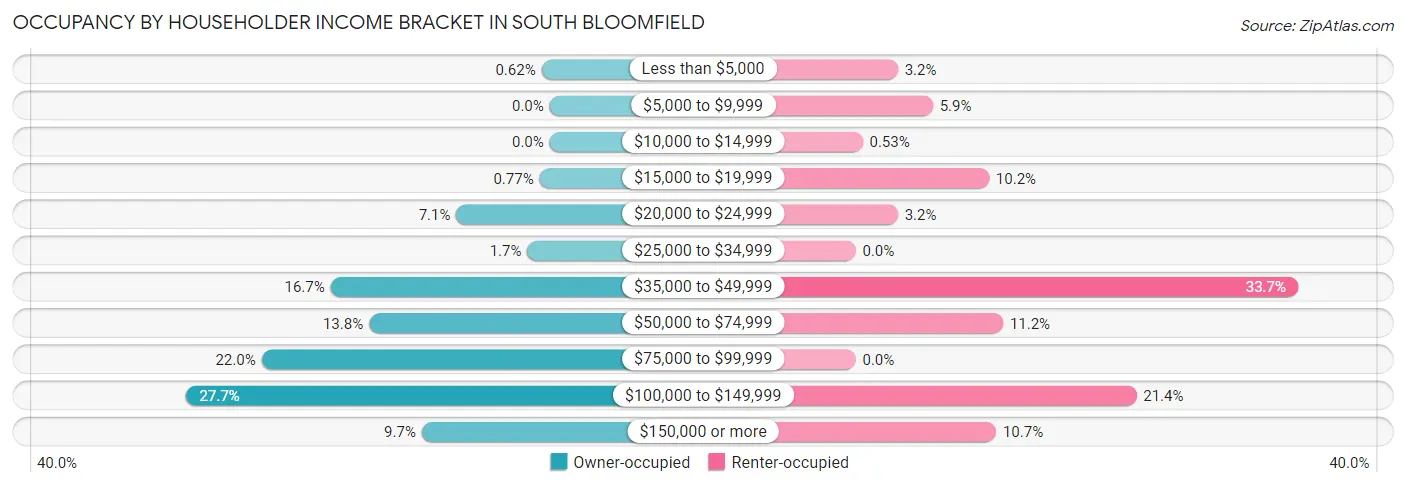
| Income Bracket | Owner-occupied | Renter-occupied |
| Less than $5,000 | 4 (0.6%) | 6 (3.2%) |
| $5,000 to $9,999 | 0 (0.0%) | 11 (5.9%) |
| $10,000 to $14,999 | 0 (0.0%) | 1 (0.5%) |
| $15,000 to $19,999 | 5 (0.8%) | 19 (10.2%) |
| $20,000 to $24,999 | 46 (7.1%) | 6 (3.2%) |
| $25,000 to $34,999 | 11 (1.7%) | 0 (0.0%) |
| $35,000 to $49,999 | 108 (16.7%) | 63 (33.7%) |
| $50,000 to $74,999 | 89 (13.8%) | 21 (11.2%) |
| $75,000 to $99,999 | 142 (22.0%) | 0 (0.0%) |
| $100,000 to $149,999 | 179 (27.7%) | 40 (21.4%) |
| $150,000 or more | 63 (9.7%) | 20 (10.7%) |
| Total | 647 (100.0%) | 187 (100.0%) |
Monthly Housing Cost Tiers in South Bloomfield
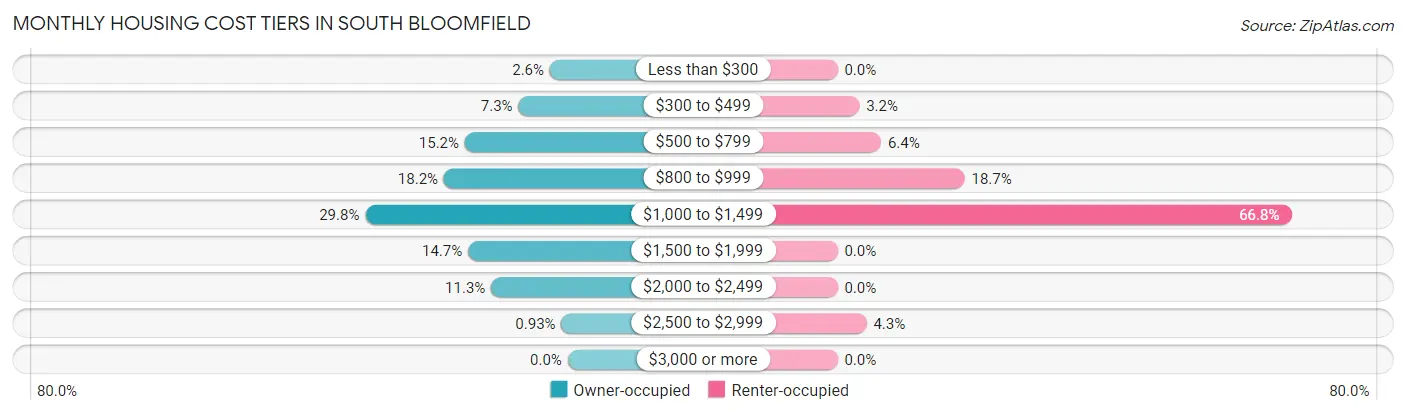
| Monthly Cost | Owner-occupied | Renter-occupied |
| Less than $300 | 17 (2.6%) | 0 (0.0%) |
| $300 to $499 | 47 (7.3%) | 6 (3.2%) |
| $500 to $799 | 98 (15.1%) | 12 (6.4%) |
| $800 to $999 | 118 (18.2%) | 35 (18.7%) |
| $1,000 to $1,499 | 193 (29.8%) | 125 (66.8%) |
| $1,500 to $1,999 | 95 (14.7%) | 0 (0.0%) |
| $2,000 to $2,499 | 73 (11.3%) | 0 (0.0%) |
| $2,500 to $2,999 | 6 (0.9%) | 8 (4.3%) |
| $3,000 or more | 0 (0.0%) | 0 (0.0%) |
| Total | 647 (100.0%) | 187 (100.0%) |
Physical Housing Characteristics in South Bloomfield
Housing Structures in South Bloomfield
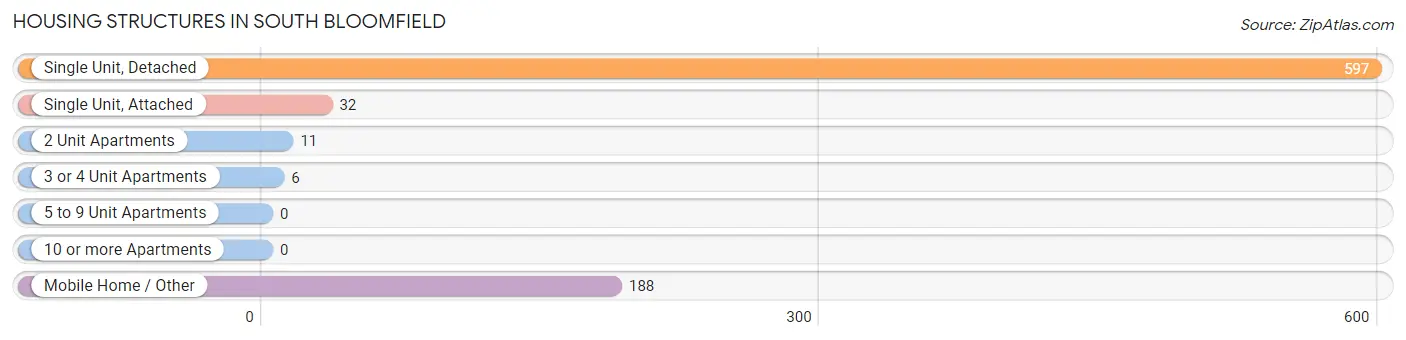
| Structure Type | # Housing Units | % Housing Units |
| Single Unit, Detached | 597 | 71.6% |
| Single Unit, Attached | 32 | 3.8% |
| 2 Unit Apartments | 11 | 1.3% |
| 3 or 4 Unit Apartments | 6 | 0.7% |
| 5 to 9 Unit Apartments | 0 | 0.0% |
| 10 or more Apartments | 0 | 0.0% |
| Mobile Home / Other | 188 | 22.5% |
| Total | 834 | 100.0% |
Housing Structures by Occupancy in South Bloomfield
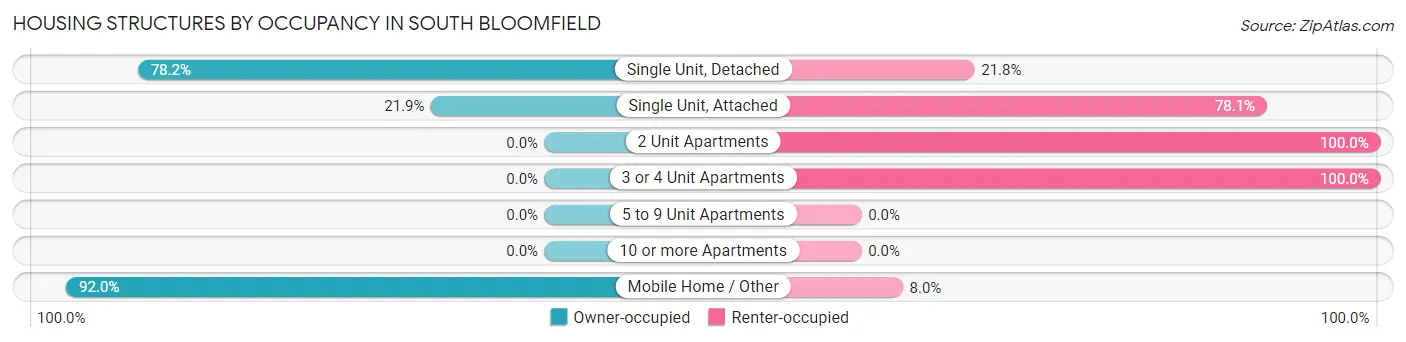
| Structure Type | Owner-occupied | Renter-occupied |
| Single Unit, Detached | 467 (78.2%) | 130 (21.8%) |
| Single Unit, Attached | 7 (21.9%) | 25 (78.1%) |
| 2 Unit Apartments | 0 (0.0%) | 11 (100.0%) |
| 3 or 4 Unit Apartments | 0 (0.0%) | 6 (100.0%) |
| 5 to 9 Unit Apartments | 0 (0.0%) | 0 (0.0%) |
| 10 or more Apartments | 0 (0.0%) | 0 (0.0%) |
| Mobile Home / Other | 173 (92.0%) | 15 (8.0%) |
| Total | 647 (77.6%) | 187 (22.4%) |
Housing Structures by Number of Rooms in South Bloomfield
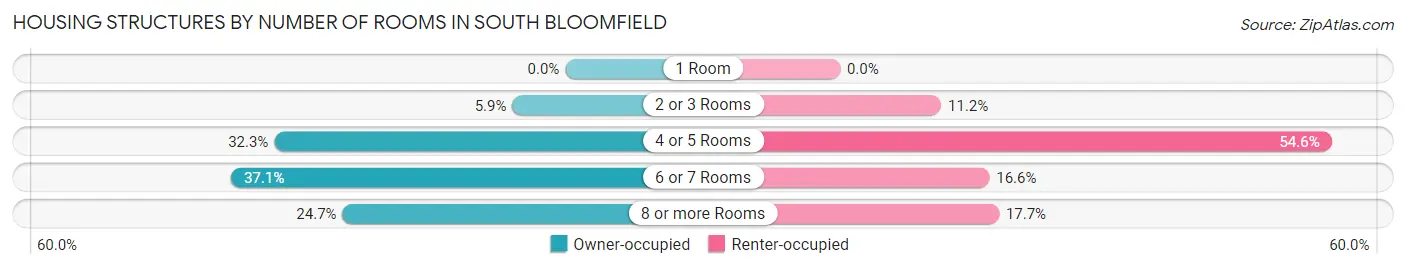
| Number of Rooms | Owner-occupied | Renter-occupied |
| 1 Room | 0 (0.0%) | 0 (0.0%) |
| 2 or 3 Rooms | 38 (5.9%) | 21 (11.2%) |
| 4 or 5 Rooms | 209 (32.3%) | 102 (54.5%) |
| 6 or 7 Rooms | 240 (37.1%) | 31 (16.6%) |
| 8 or more Rooms | 160 (24.7%) | 33 (17.6%) |
| Total | 647 (100.0%) | 187 (100.0%) |
Housing Structure by Heating Type in South Bloomfield
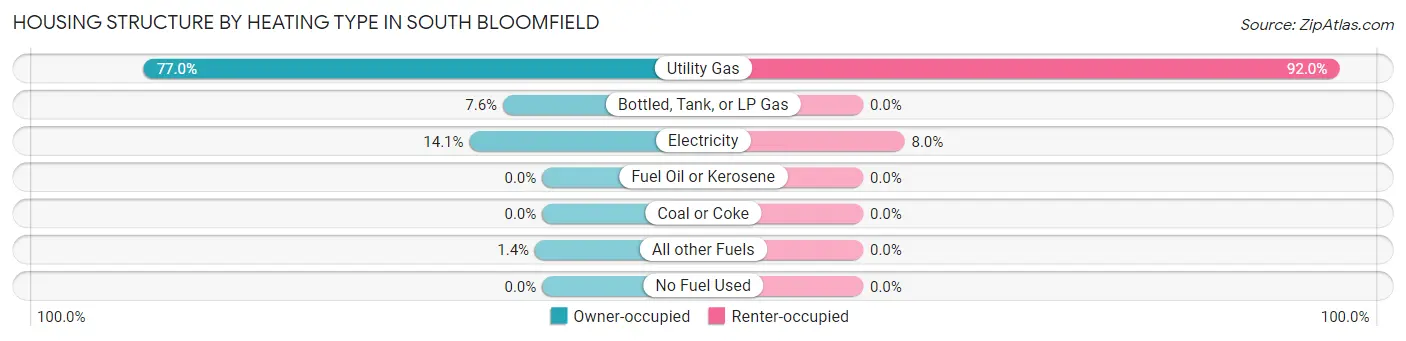
| Heating Type | Owner-occupied | Renter-occupied |
| Utility Gas | 498 (77.0%) | 172 (92.0%) |
| Bottled, Tank, or LP Gas | 49 (7.6%) | 0 (0.0%) |
| Electricity | 91 (14.1%) | 15 (8.0%) |
| Fuel Oil or Kerosene | 0 (0.0%) | 0 (0.0%) |
| Coal or Coke | 0 (0.0%) | 0 (0.0%) |
| All other Fuels | 9 (1.4%) | 0 (0.0%) |
| No Fuel Used | 0 (0.0%) | 0 (0.0%) |
| Total | 647 (100.0%) | 187 (100.0%) |
Household Vehicle Usage in South Bloomfield
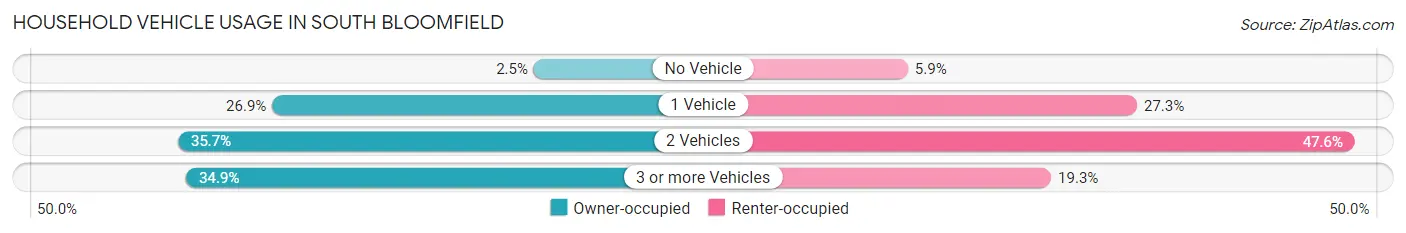
| Vehicles per Household | Owner-occupied | Renter-occupied |
| No Vehicle | 16 (2.5%) | 11 (5.9%) |
| 1 Vehicle | 174 (26.9%) | 51 (27.3%) |
| 2 Vehicles | 231 (35.7%) | 89 (47.6%) |
| 3 or more Vehicles | 226 (34.9%) | 36 (19.3%) |
| Total | 647 (100.0%) | 187 (100.0%) |
Real Estate & Mortgages in South Bloomfield
Real Estate and Mortgage Overview in South Bloomfield
| Characteristic | Without Mortgage | With Mortgage |
| Housing Units | 206 | 441 |
| Median Property Value | - | - |
| Median Household Income | $53,750 | $45 |
| Monthly Housing Costs | $580 | $0 |
| Real Estate Taxes | $1,052 | $58 |
Property Value by Mortgage Status in South Bloomfield
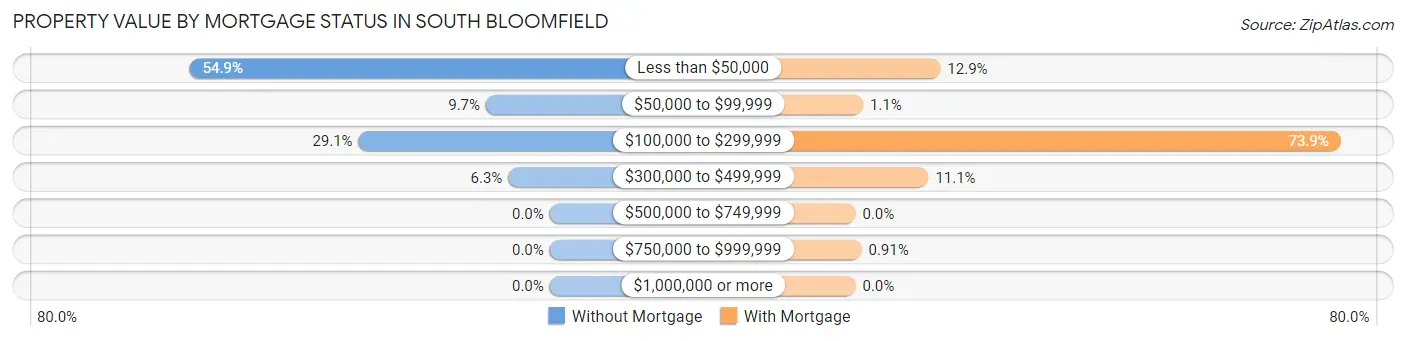
| Property Value | Without Mortgage | With Mortgage |
| Less than $50,000 | 113 (54.8%) | 57 (12.9%) |
| $50,000 to $99,999 | 20 (9.7%) | 5 (1.1%) |
| $100,000 to $299,999 | 60 (29.1%) | 326 (73.9%) |
| $300,000 to $499,999 | 13 (6.3%) | 49 (11.1%) |
| $500,000 to $749,999 | 0 (0.0%) | 0 (0.0%) |
| $750,000 to $999,999 | 0 (0.0%) | 4 (0.9%) |
| $1,000,000 or more | 0 (0.0%) | 0 (0.0%) |
| Total | 206 (100.0%) | 441 (100.0%) |
Household Income by Mortgage Status in South Bloomfield
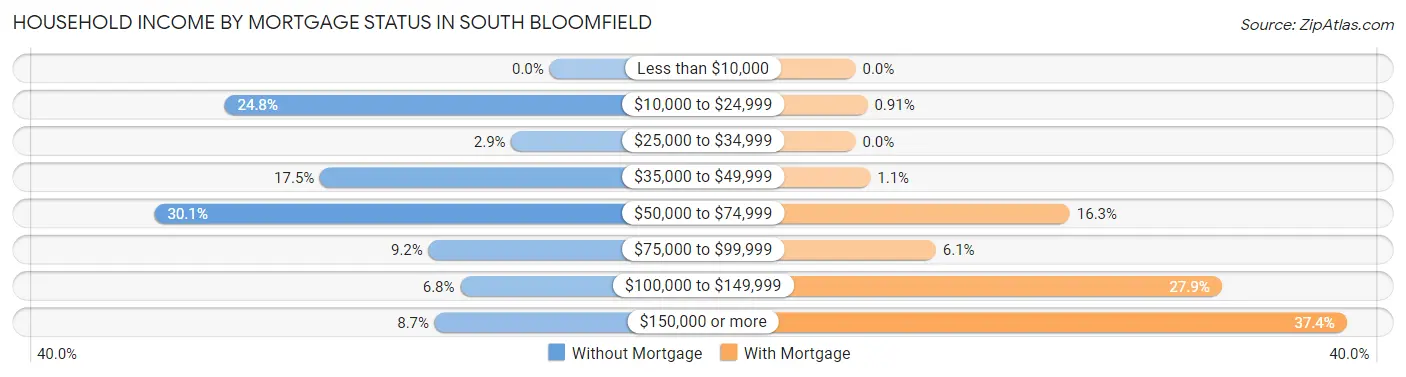
| Household Income | Without Mortgage | With Mortgage |
| Less than $10,000 | 0 (0.0%) | 0 (0.0%) |
| $10,000 to $24,999 | 51 (24.8%) | 4 (0.9%) |
| $25,000 to $34,999 | 6 (2.9%) | 0 (0.0%) |
| $35,000 to $49,999 | 36 (17.5%) | 5 (1.1%) |
| $50,000 to $74,999 | 62 (30.1%) | 72 (16.3%) |
| $75,000 to $99,999 | 19 (9.2%) | 27 (6.1%) |
| $100,000 to $149,999 | 14 (6.8%) | 123 (27.9%) |
| $150,000 or more | 18 (8.7%) | 165 (37.4%) |
| Total | 206 (100.0%) | 441 (100.0%) |
Property Value to Household Income Ratio in South Bloomfield
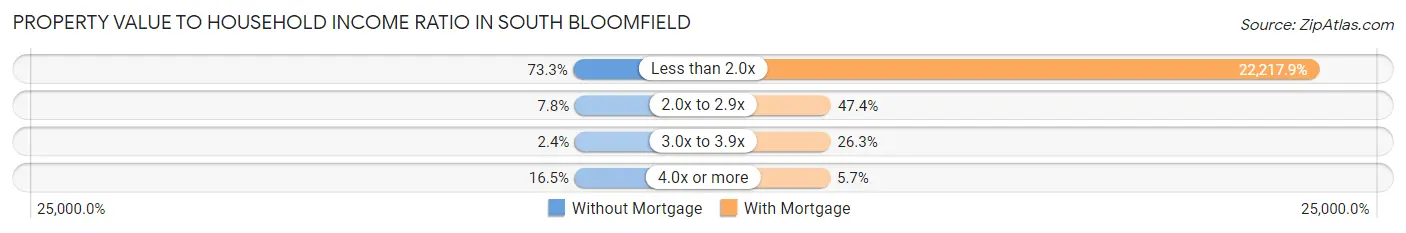
| Value-to-Income Ratio | Without Mortgage | With Mortgage |
| Less than 2.0x | 151 (73.3%) | 97,981 (22,217.9%) |
| 2.0x to 2.9x | 16 (7.8%) | 209 (47.4%) |
| 3.0x to 3.9x | 5 (2.4%) | 116 (26.3%) |
| 4.0x or more | 34 (16.5%) | 25 (5.7%) |
| Total | 206 (100.0%) | 441 (100.0%) |
Real Estate Taxes by Mortgage Status in South Bloomfield
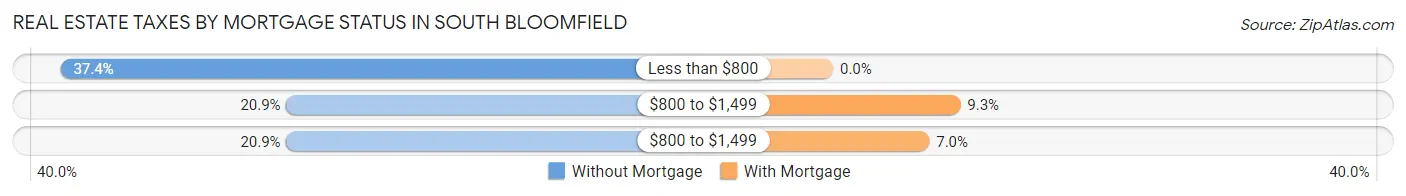
| Property Taxes | Without Mortgage | With Mortgage |
| Less than $800 | 77 (37.4%) | 0 (0.0%) |
| $800 to $1,499 | 43 (20.9%) | 41 (9.3%) |
| $800 to $1,499 | 43 (20.9%) | 31 (7.0%) |
| Total | 206 (100.0%) | 441 (100.0%) |
Health & Disability in South Bloomfield
Health Insurance Coverage by Age in South Bloomfield
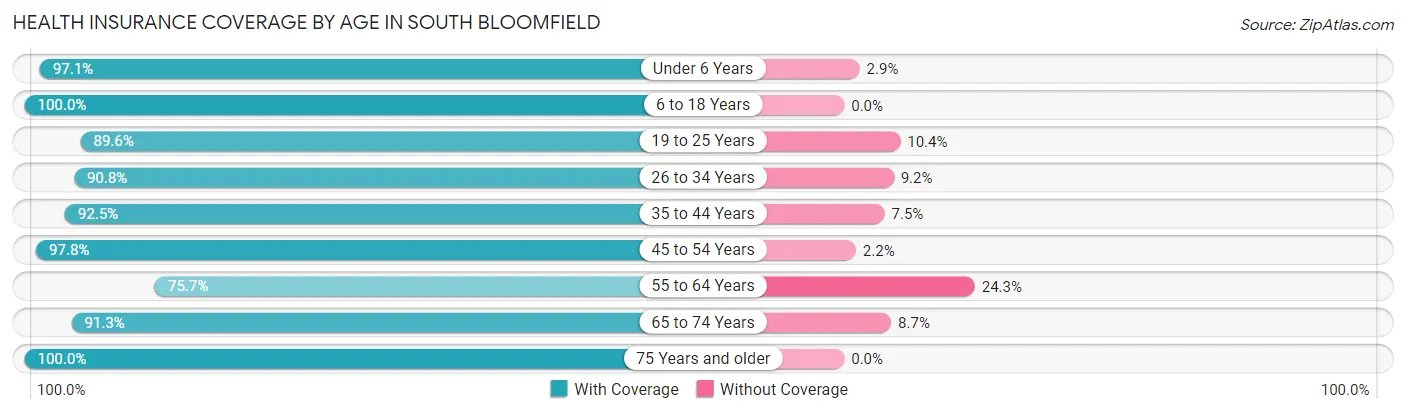
| Age Bracket | With Coverage | Without Coverage |
| Under 6 Years | 136 (97.1%) | 4 (2.9%) |
| 6 to 18 Years | 717 (100.0%) | 0 (0.0%) |
| 19 to 25 Years | 163 (89.6%) | 19 (10.4%) |
| 26 to 34 Years | 355 (90.8%) | 36 (9.2%) |
| 35 to 44 Years | 369 (92.5%) | 30 (7.5%) |
| 45 to 54 Years | 408 (97.8%) | 9 (2.2%) |
| 55 to 64 Years | 115 (75.7%) | 37 (24.3%) |
| 65 to 74 Years | 167 (91.3%) | 16 (8.7%) |
| 75 Years and older | 89 (100.0%) | 0 (0.0%) |
| Total | 2,519 (94.3%) | 151 (5.7%) |
Health Insurance Coverage by Citizenship Status in South Bloomfield
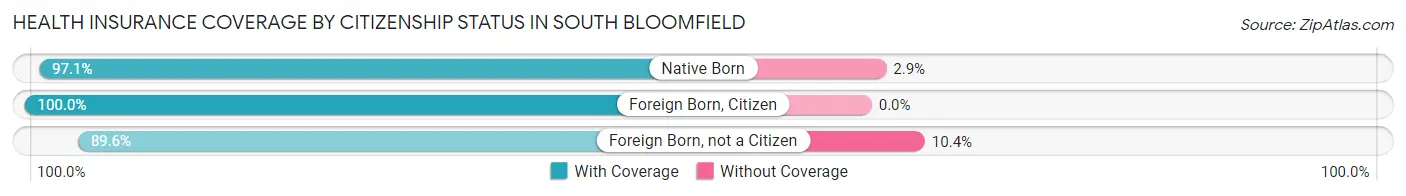
| Citizenship Status | With Coverage | Without Coverage |
| Native Born | 136 (97.1%) | 4 (2.9%) |
| Foreign Born, Citizen | 717 (100.0%) | 0 (0.0%) |
| Foreign Born, not a Citizen | 163 (89.6%) | 19 (10.4%) |
Health Insurance Coverage by Household Income in South Bloomfield
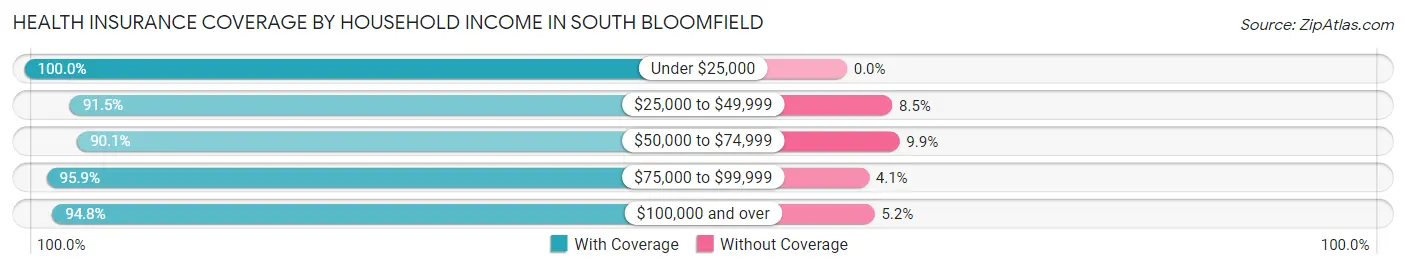
| Household Income | With Coverage | Without Coverage |
| Under $25,000 | 215 (100.0%) | 0 (0.0%) |
| $25,000 to $49,999 | 399 (91.5%) | 37 (8.5%) |
| $50,000 to $74,999 | 256 (90.1%) | 28 (9.9%) |
| $75,000 to $99,999 | 371 (95.9%) | 16 (4.1%) |
| $100,000 and over | 1,278 (94.8%) | 70 (5.2%) |
Public vs Private Health Insurance Coverage by Age in South Bloomfield
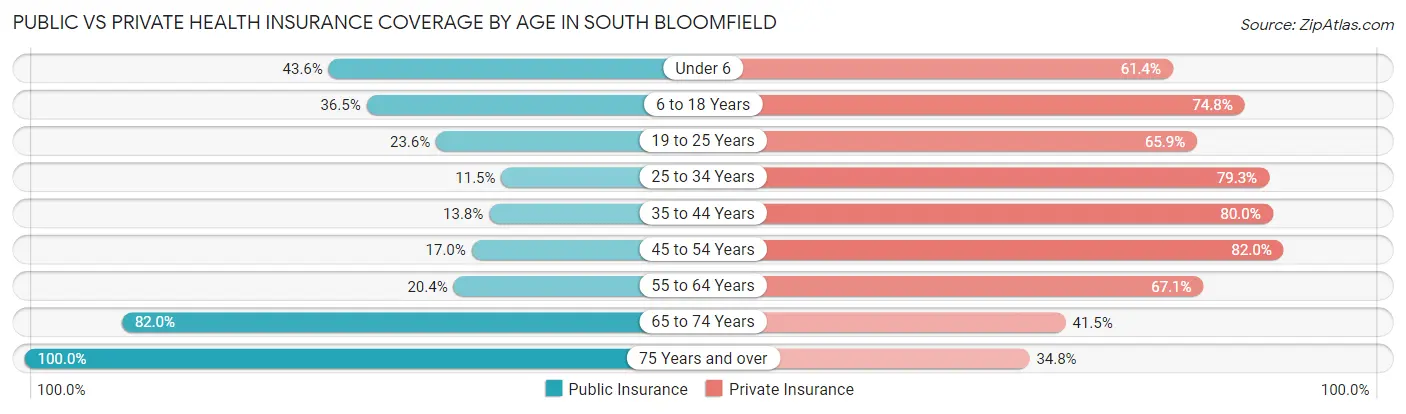
| Age Bracket | Public Insurance | Private Insurance |
| Under 6 | 61 (43.6%) | 86 (61.4%) |
| 6 to 18 Years | 262 (36.5%) | 536 (74.8%) |
| 19 to 25 Years | 43 (23.6%) | 120 (65.9%) |
| 25 to 34 Years | 45 (11.5%) | 310 (79.3%) |
| 35 to 44 Years | 55 (13.8%) | 319 (79.9%) |
| 45 to 54 Years | 71 (17.0%) | 342 (82.0%) |
| 55 to 64 Years | 31 (20.4%) | 102 (67.1%) |
| 65 to 74 Years | 150 (82.0%) | 76 (41.5%) |
| 75 Years and over | 89 (100.0%) | 31 (34.8%) |
| Total | 807 (30.2%) | 1,922 (72.0%) |
Disability Status by Sex by Age in South Bloomfield
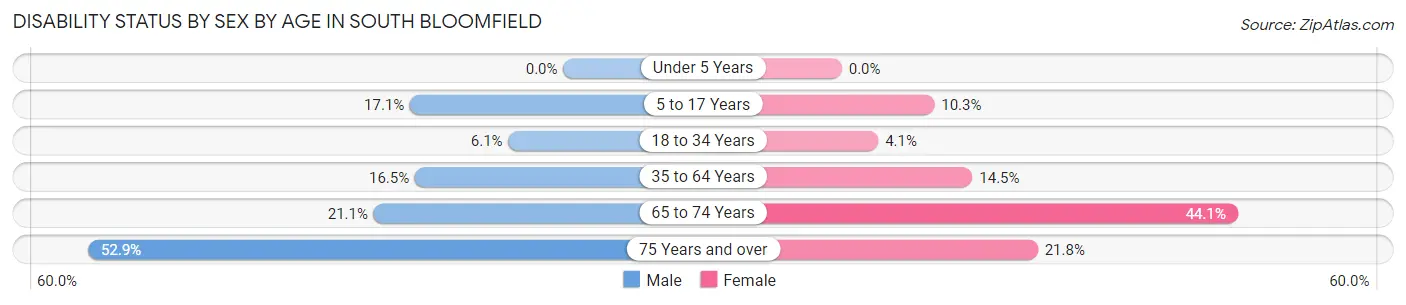
| Age Bracket | Male | Female |
| Under 5 Years | 0 (0.0%) | 0 (0.0%) |
| 5 to 17 Years | 50 (17.1%) | 38 (10.3%) |
| 18 to 34 Years | 24 (6.1%) | 11 (4.1%) |
| 35 to 64 Years | 77 (16.5%) | 73 (14.5%) |
| 65 to 74 Years | 19 (21.1%) | 41 (44.1%) |
| 75 Years and over | 18 (52.9%) | 12 (21.8%) |
Disability Class by Sex by Age in South Bloomfield
Disability Class: Hearing Difficulty
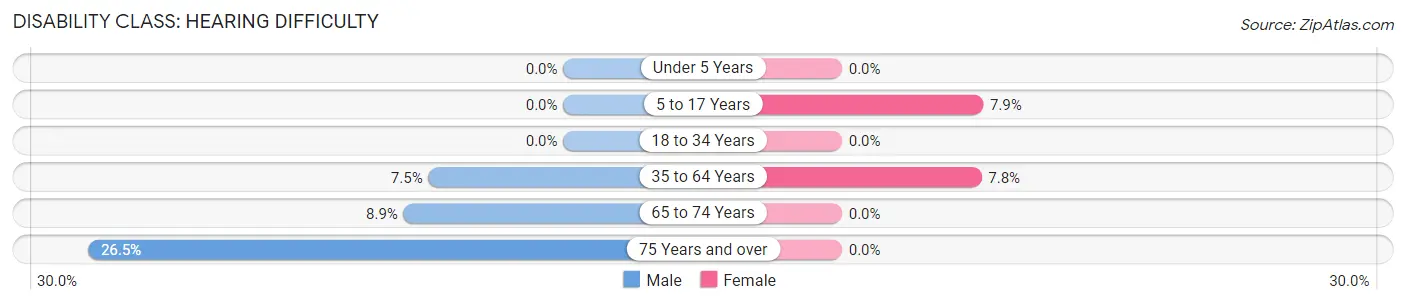
| Age Bracket | Male | Female |
| Under 5 Years | 0 (0.0%) | 0 (0.0%) |
| 5 to 17 Years | 0 (0.0%) | 29 (7.9%) |
| 18 to 34 Years | 0 (0.0%) | 0 (0.0%) |
| 35 to 64 Years | 35 (7.5%) | 39 (7.8%) |
| 65 to 74 Years | 8 (8.9%) | 0 (0.0%) |
| 75 Years and over | 9 (26.5%) | 0 (0.0%) |
Disability Class: Vision Difficulty
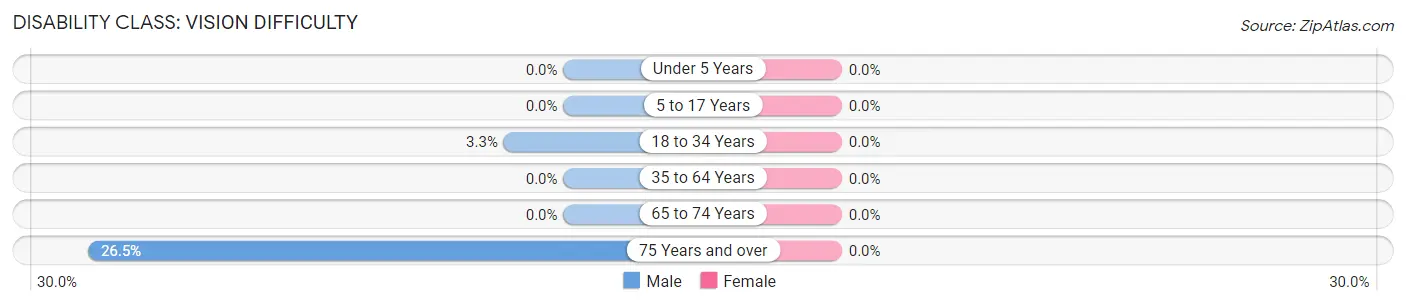
| Age Bracket | Male | Female |
| Under 5 Years | 0 (0.0%) | 0 (0.0%) |
| 5 to 17 Years | 0 (0.0%) | 0 (0.0%) |
| 18 to 34 Years | 13 (3.3%) | 0 (0.0%) |
| 35 to 64 Years | 0 (0.0%) | 0 (0.0%) |
| 65 to 74 Years | 0 (0.0%) | 0 (0.0%) |
| 75 Years and over | 9 (26.5%) | 0 (0.0%) |
Disability Class: Cognitive Difficulty
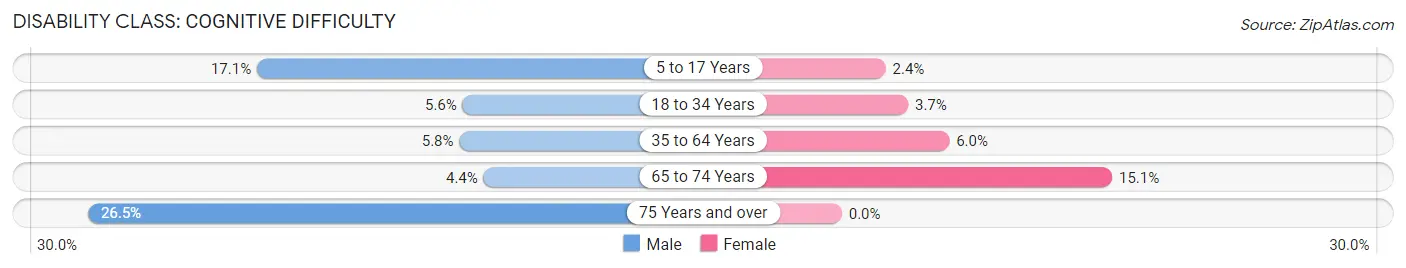
| Age Bracket | Male | Female |
| 5 to 17 Years | 50 (17.1%) | 9 (2.4%) |
| 18 to 34 Years | 22 (5.6%) | 10 (3.7%) |
| 35 to 64 Years | 27 (5.8%) | 30 (6.0%) |
| 65 to 74 Years | 4 (4.4%) | 14 (15.0%) |
| 75 Years and over | 9 (26.5%) | 0 (0.0%) |
Disability Class: Ambulatory Difficulty
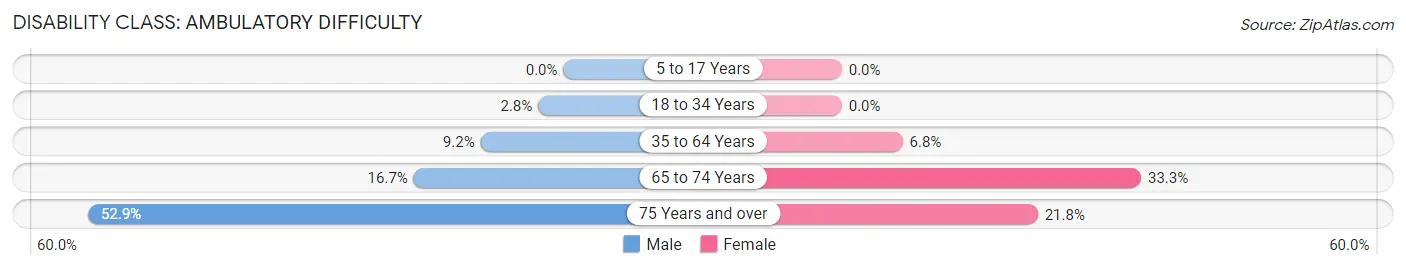
| Age Bracket | Male | Female |
| 5 to 17 Years | 0 (0.0%) | 0 (0.0%) |
| 18 to 34 Years | 11 (2.8%) | 0 (0.0%) |
| 35 to 64 Years | 43 (9.2%) | 34 (6.8%) |
| 65 to 74 Years | 15 (16.7%) | 31 (33.3%) |
| 75 Years and over | 18 (52.9%) | 12 (21.8%) |
Disability Class: Self-Care Difficulty
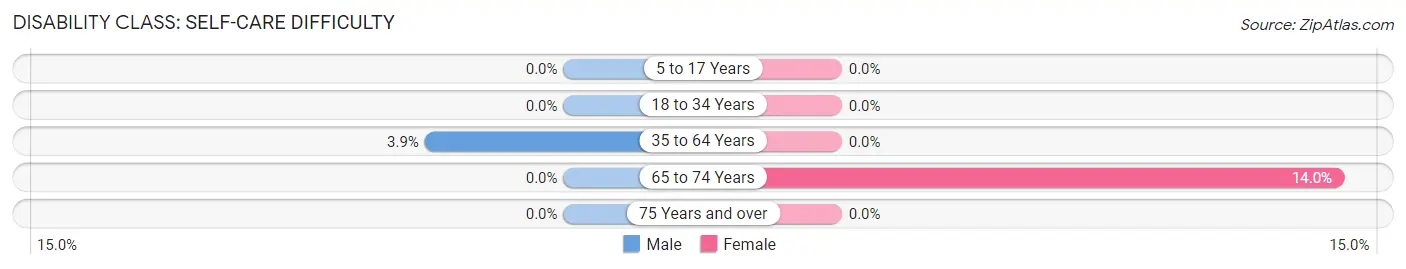
| Age Bracket | Male | Female |
| 5 to 17 Years | 0 (0.0%) | 0 (0.0%) |
| 18 to 34 Years | 0 (0.0%) | 0 (0.0%) |
| 35 to 64 Years | 18 (3.9%) | 0 (0.0%) |
| 65 to 74 Years | 0 (0.0%) | 13 (14.0%) |
| 75 Years and over | 0 (0.0%) | 0 (0.0%) |
Technology Access in South Bloomfield
Computing Device Access in South Bloomfield
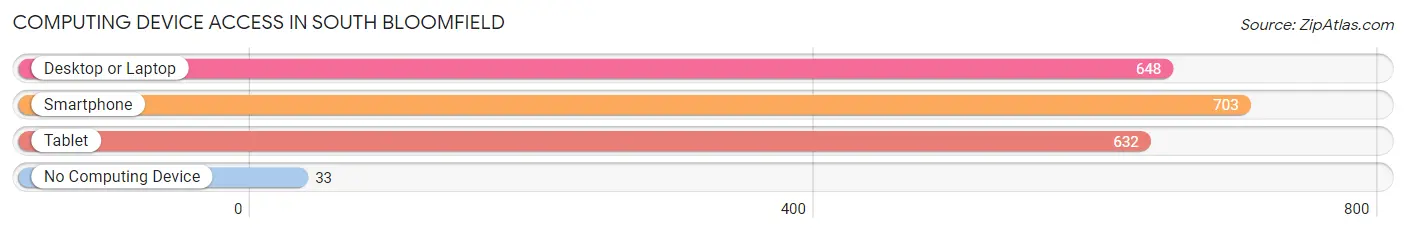
| Device Type | # Households | % Households |
| Desktop or Laptop | 648 | 77.7% |
| Smartphone | 703 | 84.3% |
| Tablet | 632 | 75.8% |
| No Computing Device | 33 | 4.0% |
| Total | 834 | 100.0% |
Internet Access in South Bloomfield
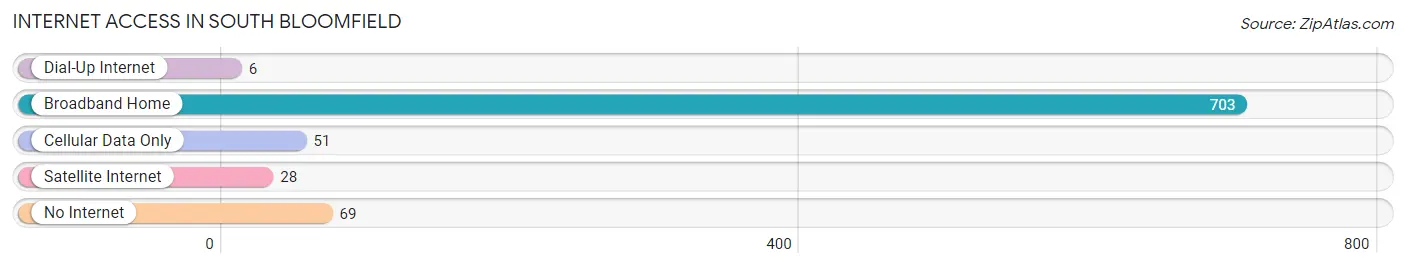
| Internet Type | # Households | % Households |
| Dial-Up Internet | 6 | 0.7% |
| Broadband Home | 703 | 84.3% |
| Cellular Data Only | 51 | 6.1% |
| Satellite Internet | 28 | 3.4% |
| No Internet | 69 | 8.3% |
| Total | 834 | 100.0% |
South Bloomfield Summary
History
The small village of South Bloomfield, Ohio is located in Pickaway County, approximately 25 miles south of Columbus. The area was first settled in 1810 by a group of Quakers from North Carolina. The village was originally known as Bloomfield, but the name was changed to South Bloomfield in 1837 to distinguish it from the nearby village of North Bloomfield.
The village was incorporated in 1845 and the first mayor was elected in 1846. The village was a small agricultural community for many years, but in the late 19th century, the railroad came to town and the village began to grow. The railroad brought new businesses and industries to the area, including a brickyard, a flour mill, and a furniture factory.
The village continued to grow throughout the 20th century, and by the year 2000, the population had grown to 1,845. The village is now home to a variety of businesses, including a grocery store, a hardware store, a bank, and several restaurants.
Geography
South Bloomfield is located in Pickaway County, Ohio, approximately 25 miles south of Columbus. The village is situated on the Scioto River, which flows through the center of town. The village is surrounded by rolling hills and farmland, and is located in the Appalachian foothills.
The village has a total area of 1.2 square miles, all of which is land. The village is located at an elevation of 845 feet above sea level. The climate in South Bloomfield is humid continental, with hot summers and cold winters.
Economy
The economy of South Bloomfield is largely based on agriculture and manufacturing. The village is home to several small businesses, including a grocery store, a hardware store, a bank, and several restaurants. The village is also home to a furniture factory, a brickyard, and a flour mill.
The village is also home to a number of small farms, which produce a variety of crops, including corn, soybeans, wheat, and hay. The village is also home to a number of horse farms, which raise and train horses for racing and show jumping.
Demographics
As of the 2010 census, the population of South Bloomfield was 1,845. The population is largely white (94.3%), with small percentages of African American (2.2%), Hispanic (1.7%), and Asian (1.2%) residents. The median household income in the village is $45,000, and the median home value is $125,000.
The village is served by the South Bloomfield-Pickaway County Public Library, which offers a variety of services, including books, magazines, newspapers, and internet access. The village is also home to a number of churches, including the First United Methodist Church, the South Bloomfield Church of Christ, and the South Bloomfield Church of the Nazarene.
Conclusion
South Bloomfield, Ohio is a small village located in Pickaway County, approximately 25 miles south of Columbus. The village was first settled in 1810 by a group of Quakers from North Carolina, and was incorporated in 1845. The village is now home to a variety of businesses, including a grocery store, a hardware store, a bank, and several restaurants. The economy of South Bloomfield is largely based on agriculture and manufacturing, and the population is largely white. The village is served by the South Bloomfield-Pickaway County Public Library, and is home to a number of churches.
Common Questions
What is Per Capita Income in South Bloomfield?
Per Capita income in South Bloomfield is $31,608.
What is the Median Family Income in South Bloomfield?
Median Family Income in South Bloomfield is $88,125.
What is the Median Household income in South Bloomfield?
Median Household Income in South Bloomfield is $84,808.
What is Income or Wage Gap in South Bloomfield?
Income or Wage Gap in South Bloomfield is 28.2%.
Women in South Bloomfield earn 71.8 cents for every dollar earned by a man.
What is Family Income Deficit in South Bloomfield?
Family Income Deficit in South Bloomfield is $4,563.
Families that are below poverty line in South Bloomfield earn $4,563 less on average than the poverty threshold level.
What is Inequality or Gini Index in South Bloomfield?
Inequality or Gini Index in South Bloomfield is 0.38.
What is the Total Population of South Bloomfield?
Total Population of South Bloomfield is 2,677.
What is the Total Male Population of South Bloomfield?
Total Male Population of South Bloomfield is 1,341.
What is the Total Female Population of South Bloomfield?
Total Female Population of South Bloomfield is 1,336.
What is the Ratio of Males per 100 Females in South Bloomfield?
There are 100.37 Males per 100 Females in South Bloomfield.
What is the Ratio of Females per 100 Males in South Bloomfield?
There are 99.63 Females per 100 Males in South Bloomfield.
What is the Median Population Age in South Bloomfield?
Median Population Age in South Bloomfield is 32.7 Years.
What is the Average Family Size in South Bloomfield
Average Family Size in South Bloomfield is 3.9 People.
What is the Average Household Size in South Bloomfield
Average Household Size in South Bloomfield is 3.2 People.
How Large is the Labor Force in South Bloomfield?
There are 1,399 People in the Labor Forcein in South Bloomfield.
What is the Percentage of People in the Labor Force in South Bloomfield?
72.4% of People are in the Labor Force in South Bloomfield.
What is the Unemployment Rate in South Bloomfield?
Unemployment Rate in South Bloomfield is 6.3%.