Marlboro, OH Map & Demographics
Marlboro Map
Marlboro Overview
$36,458
PER CAPITA INCOME
$88,750
AVG FAMILY INCOME
$72,031
AVG HOUSEHOLD INCOME
48.0%
WAGE / INCOME GAP [ % ]
52.0¢/ $1
WAGE / INCOME GAP [ $ ]
0.39
INEQUALITY / GINI INDEX
243
TOTAL POPULATION
117
MALE POPULATION
126
FEMALE POPULATION
92.86
MALES / 100 FEMALES
107.69
FEMALES / 100 MALES
62.1
MEDIAN AGE
2.5
AVG FAMILY SIZE
2.4
AVG HOUSEHOLD SIZE
129
LABOR FORCE [ PEOPLE ]
57.6%
PERCENT IN LABOR FORCE
Income in Marlboro
Income Overview in Marlboro
Per Capita Income in Marlboro is $36,458, while median incomes of families and households are $88,750 and $72,031 respectively.
| Characteristic | Number | Measure |
| Per Capita Income | 243 | $36,458 |
| Median Family Income | 84 | $88,750 |
| Mean Family Income | 84 | $96,360 |
| Median Household Income | 103 | $72,031 |
| Mean Household Income | 103 | $86,669 |
| Income Deficit | 84 | $0 |
| Wage / Income Gap (%) | 243 | 47.96% |
| Wage / Income Gap ($) | 243 | 52.04¢ per $1 |
| Gini / Inequality Index | 243 | 0.39 |
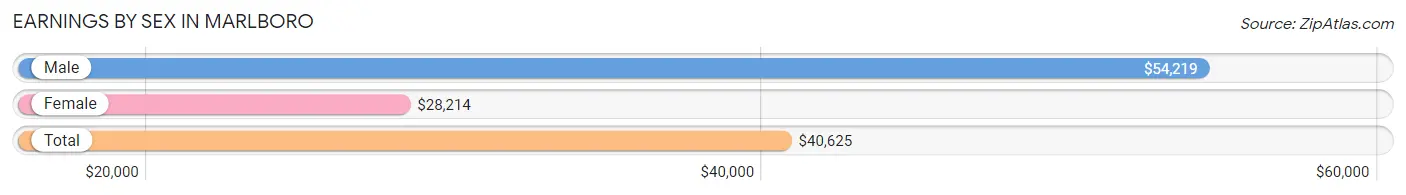
Earnings by Sex in Marlboro
Average Earnings in Marlboro are $40,625, $54,219 for men and $28,214 for women, a difference of 48.0%.
| Sex | Number | Average Earnings |
| Male | 71 (55.0%) | $54,219 |
| Female | 58 (45.0%) | $28,214 |
| Total | 129 (100.0%) | $40,625 |
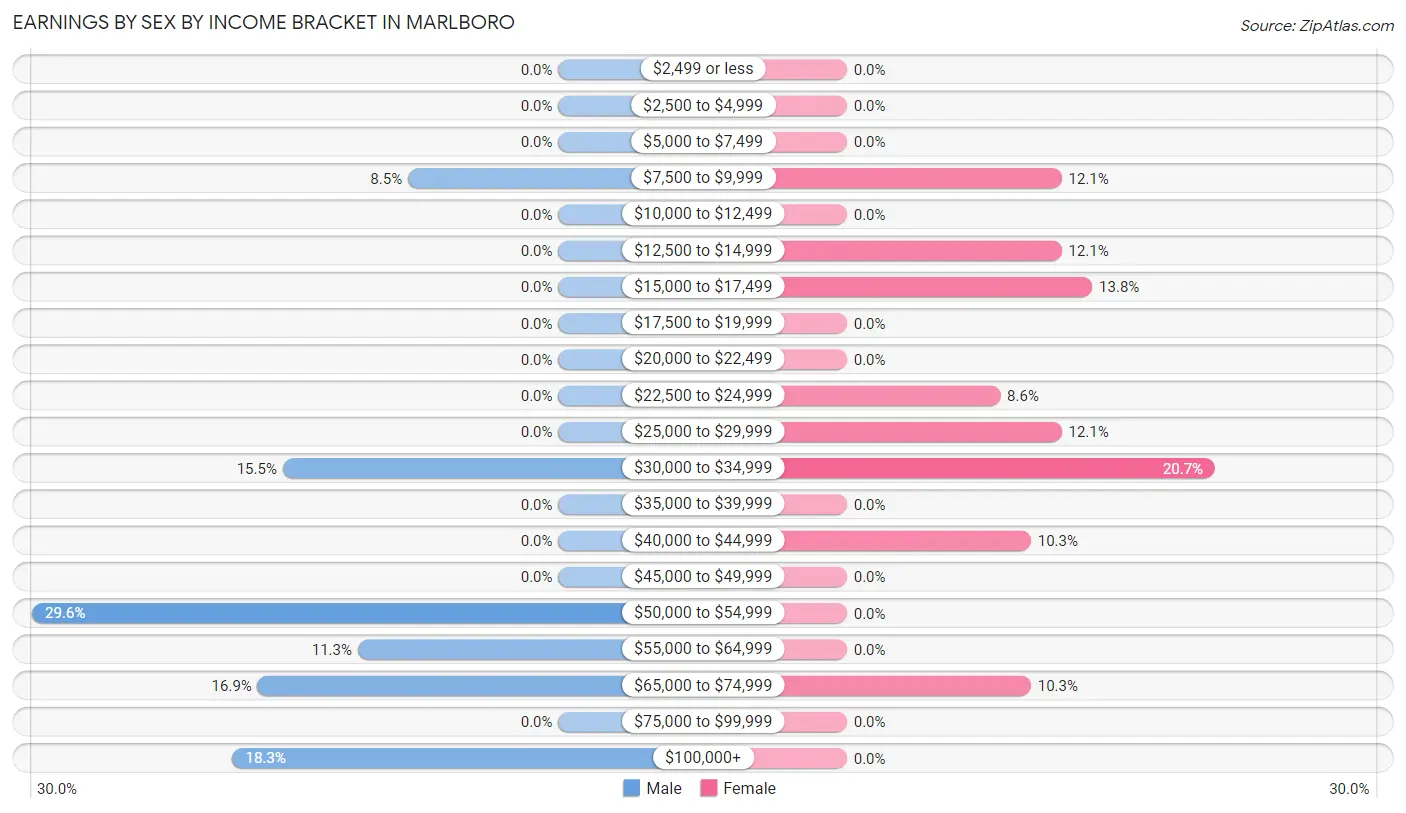
Earnings by Sex by Income Bracket in Marlboro
The most common earnings brackets in Marlboro are $50,000 to $54,999 for men (21 | 29.6%) and $30,000 to $34,999 for women (12 | 20.7%).
| Income | Male | Female |
| $2,499 or less | 0 (0.0%) | 0 (0.0%) |
| $2,500 to $4,999 | 0 (0.0%) | 0 (0.0%) |
| $5,000 to $7,499 | 0 (0.0%) | 0 (0.0%) |
| $7,500 to $9,999 | 6 (8.5%) | 7 (12.1%) |
| $10,000 to $12,499 | 0 (0.0%) | 0 (0.0%) |
| $12,500 to $14,999 | 0 (0.0%) | 7 (12.1%) |
| $15,000 to $17,499 | 0 (0.0%) | 8 (13.8%) |
| $17,500 to $19,999 | 0 (0.0%) | 0 (0.0%) |
| $20,000 to $22,499 | 0 (0.0%) | 0 (0.0%) |
| $22,500 to $24,999 | 0 (0.0%) | 5 (8.6%) |
| $25,000 to $29,999 | 0 (0.0%) | 7 (12.1%) |
| $30,000 to $34,999 | 11 (15.5%) | 12 (20.7%) |
| $35,000 to $39,999 | 0 (0.0%) | 0 (0.0%) |
| $40,000 to $44,999 | 0 (0.0%) | 6 (10.3%) |
| $45,000 to $49,999 | 0 (0.0%) | 0 (0.0%) |
| $50,000 to $54,999 | 21 (29.6%) | 0 (0.0%) |
| $55,000 to $64,999 | 8 (11.3%) | 0 (0.0%) |
| $65,000 to $74,999 | 12 (16.9%) | 6 (10.3%) |
| $75,000 to $99,999 | 0 (0.0%) | 0 (0.0%) |
| $100,000+ | 13 (18.3%) | 0 (0.0%) |
| Total | 71 (100.0%) | 58 (100.0%) |
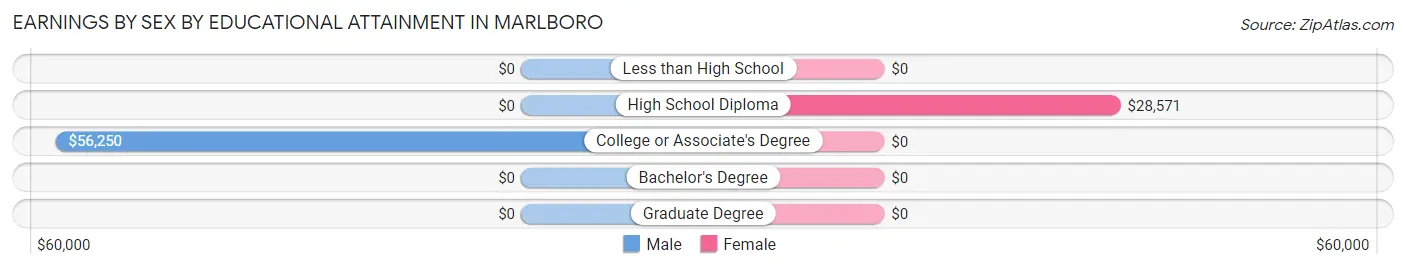
Earnings by Sex by Educational Attainment in Marlboro
Average earnings in Marlboro are $53,281 for men and $28,393 for women, a difference of 46.7%. Men with an educational attainment of college or associate's degree enjoy the highest average annual earnings of $56,250, while those with college or associate's degree education earn the least with $56,250. Women with an educational attainment of high school diploma earn the most with the average annual earnings of $28,571, while those with high school diploma education have the smallest earnings of $28,571.
| Educational Attainment | Male Income | Female Income |
| Less than High School | - | - |
| High School Diploma | - | - |
| College or Associate's Degree | $56,250 | $0 |
| Bachelor's Degree | - | - |
| Graduate Degree | - | - |
| Total | $53,281 | $28,393 |
Family Income in Marlboro
Family Income Brackets in Marlboro
According to the Marlboro family income data, there are 25 families falling into the $75,000 to $99,999 income range, which is the most common income bracket and makes up 29.8% of all families.
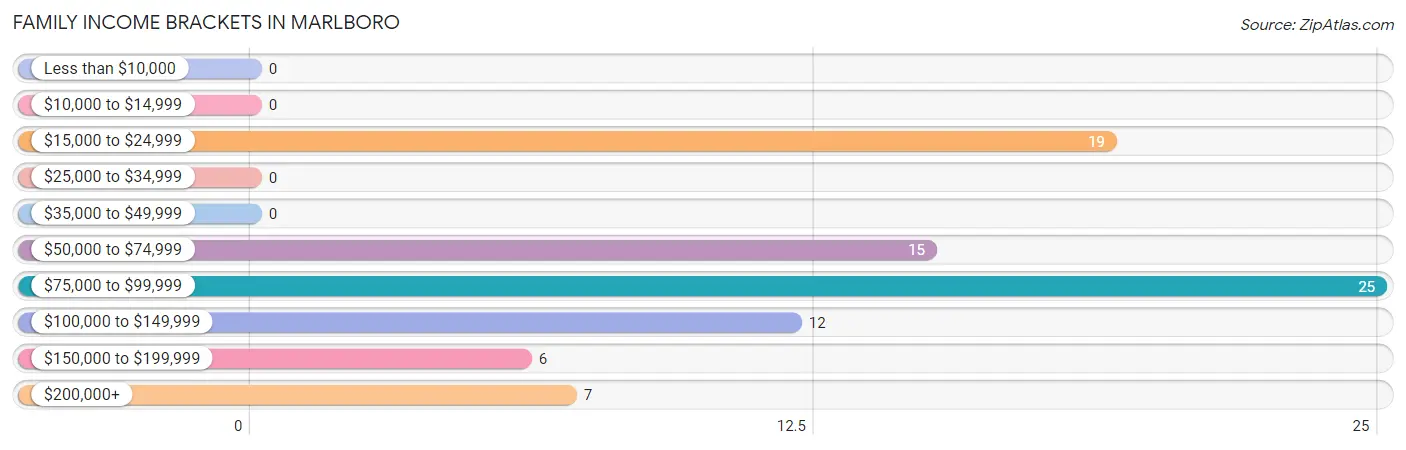
| Income Bracket | # Families | % Families |
| Less than $10,000 | 0 | 0.0% |
| $10,000 to $14,999 | 0 | 0.0% |
| $15,000 to $24,999 | 19 | 22.6% |
| $25,000 to $34,999 | 0 | 0.0% |
| $35,000 to $49,999 | 0 | 0.0% |
| $50,000 to $74,999 | 15 | 17.9% |
| $75,000 to $99,999 | 25 | 29.8% |
| $100,000 to $149,999 | 12 | 14.3% |
| $150,000 to $199,999 | 6 | 7.1% |
| $200,000+ | 7 | 8.3% |
Family Income by Famaliy Size in Marlboro
2-person families (52 | 61.9%) account for the highest median family income in Marlboro with $82,188 per family, while 2-person families (52 | 61.9%) have the highest median income of $41,094 per family member.
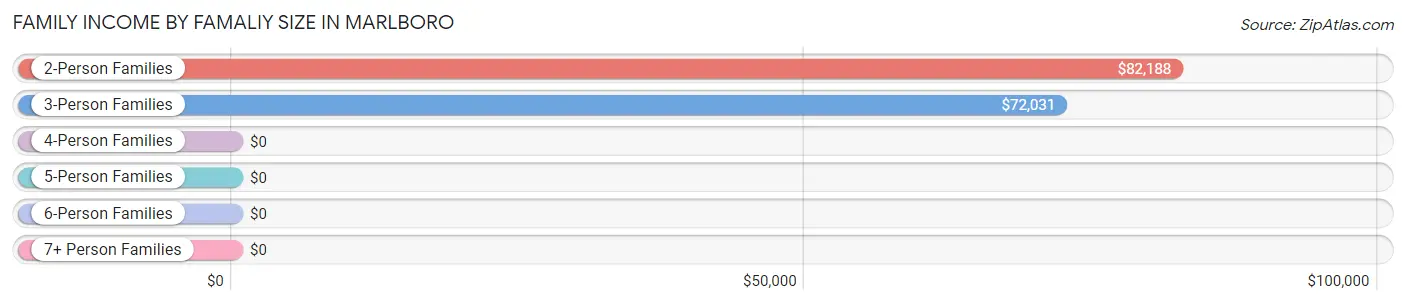
| Income Bracket | # Families | Median Income |
| 2-Person Families | 52 (61.9%) | $82,188 |
| 3-Person Families | 27 (32.1%) | $72,031 |
| 4-Person Families | 5 (5.9%) | $0 |
| 5-Person Families | 0 (0.0%) | $0 |
| 6-Person Families | 0 (0.0%) | $0 |
| 7+ Person Families | 0 (0.0%) | $0 |
| Total | 84 (100.0%) | $88,750 |
Family Income by Number of Earners in Marlboro
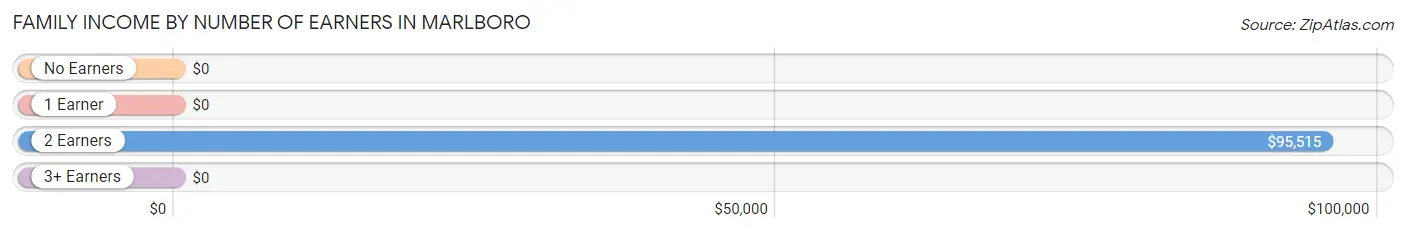
| Number of Earners | # Families | Median Income |
| No Earners | 26 (30.9%) | $0 |
| 1 Earner | 13 (15.5%) | $0 |
| 2 Earners | 39 (46.4%) | $95,515 |
| 3+ Earners | 6 (7.1%) | $0 |
| Total | 84 (100.0%) | $88,750 |
Household Income in Marlboro
Household Income Brackets in Marlboro
With 25 households falling in the category, the $75,000 to $99,999 income range is the most frequent in Marlboro, accounting for 24.3% of all households.
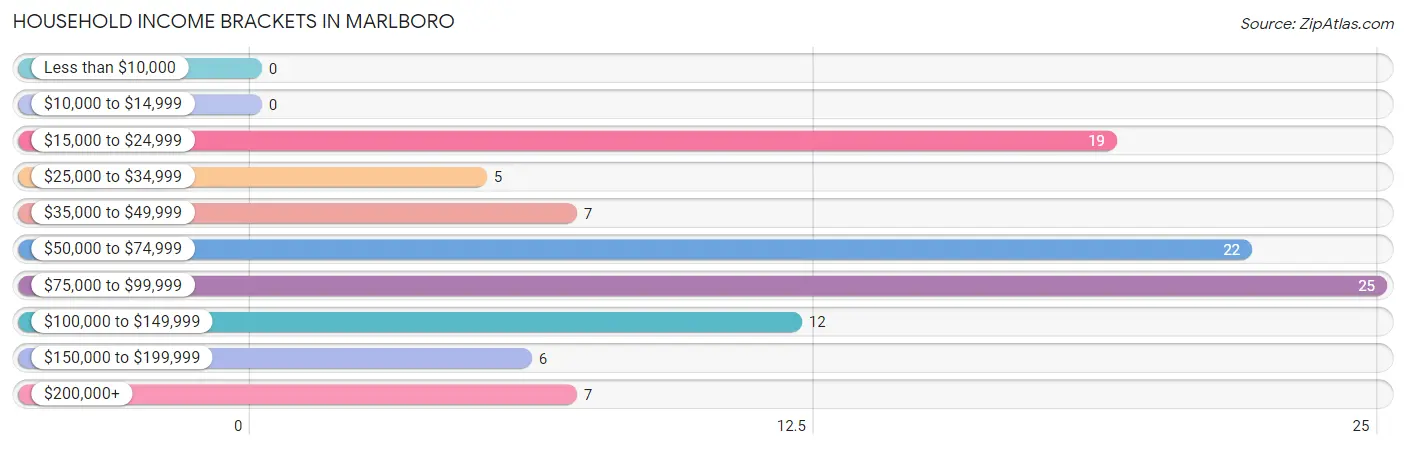
| Income Bracket | # Households | % Households |
| Less than $10,000 | 0 | 0.0% |
| $10,000 to $14,999 | 0 | 0.0% |
| $15,000 to $24,999 | 19 | 18.4% |
| $25,000 to $34,999 | 5 | 4.9% |
| $35,000 to $49,999 | 7 | 6.8% |
| $50,000 to $74,999 | 22 | 21.4% |
| $75,000 to $99,999 | 25 | 24.3% |
| $100,000 to $149,999 | 12 | 11.7% |
| $150,000 to $199,999 | 6 | 5.8% |
| $200,000+ | 7 | 6.8% |
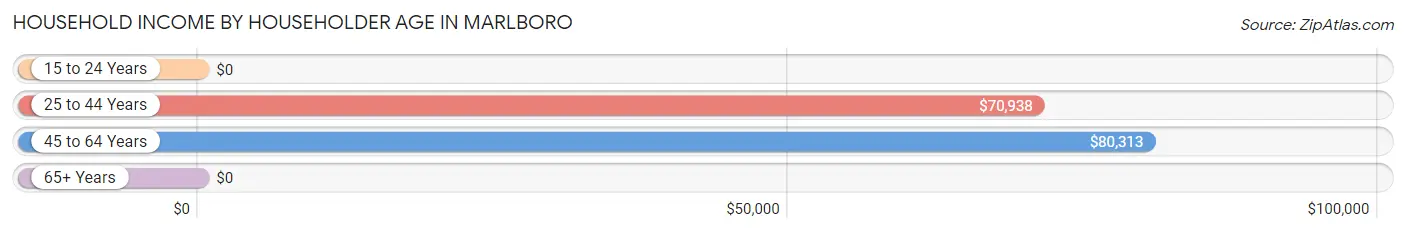
Household Income by Householder Age in Marlboro
The median household income in Marlboro is $72,031, with the highest median household income of $80,313 found in the 45 to 64 years age bracket for the primary householder. A total of 26 households (25.2%) fall into this category. Meanwhile, the 15 to 24 years age bracket for the primary householder has the lowest median household income of $0, with 6 households (5.8%) in this group.
| Income Bracket | # Households | Median Income |
| 15 to 24 Years | 6 (5.8%) | $0 |
| 25 to 44 Years | 20 (19.4%) | $70,938 |
| 45 to 64 Years | 26 (25.2%) | $80,313 |
| 65+ Years | 51 (49.5%) | $0 |
| Total | 103 (100.0%) | $72,031 |
Poverty in Marlboro
Income Below Poverty by Sex and Age in Marlboro
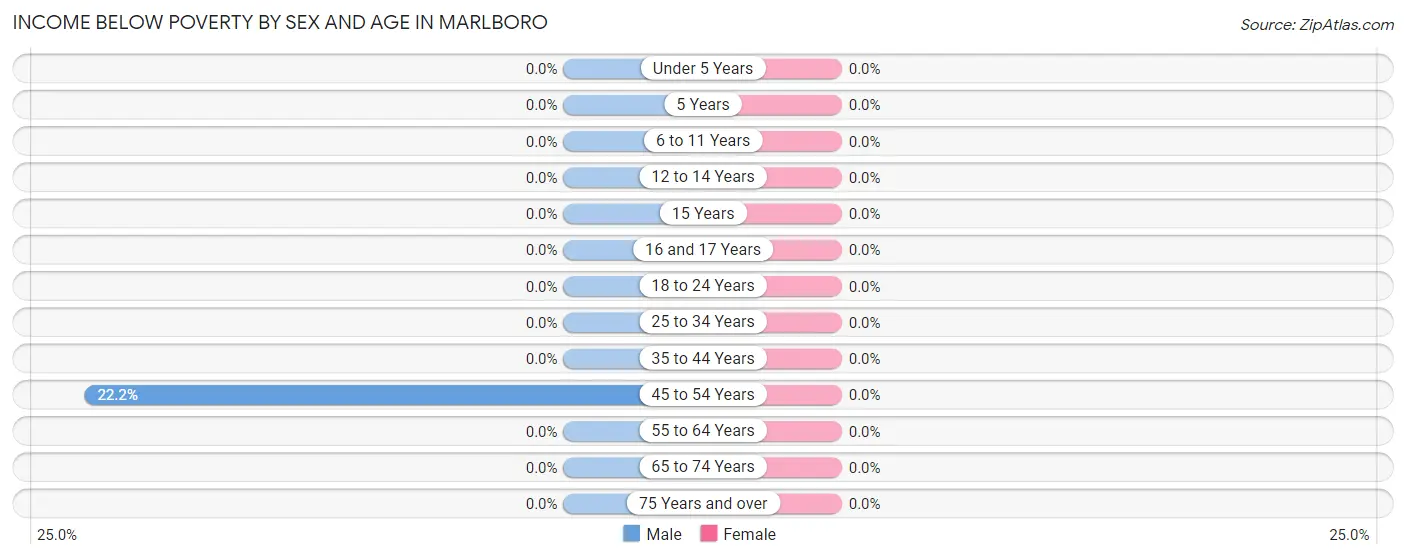
| Age Bracket | Male | Female |
| Under 5 Years | 0 (0.0%) | 0 (0.0%) |
| 5 Years | 0 (0.0%) | 0 (0.0%) |
| 6 to 11 Years | 0 (0.0%) | 0 (0.0%) |
| 12 to 14 Years | 0 (0.0%) | 0 (0.0%) |
| 15 Years | 0 (0.0%) | 0 (0.0%) |
| 16 and 17 Years | 0 (0.0%) | 0 (0.0%) |
| 18 to 24 Years | 0 (0.0%) | 0 (0.0%) |
| 25 to 34 Years | 0 (0.0%) | 0 (0.0%) |
| 35 to 44 Years | 0 (0.0%) | 0 (0.0%) |
| 45 to 54 Years | 6 (22.2%) | 0 (0.0%) |
| 55 to 64 Years | 0 (0.0%) | 0 (0.0%) |
| 65 to 74 Years | 0 (0.0%) | 0 (0.0%) |
| 75 Years and over | 0 (0.0%) | 0 (0.0%) |
| Total | 6 (5.1%) | 0 (0.0%) |
Income Above Poverty by Sex and Age in Marlboro
According to the poverty statistics in Marlboro, males aged under 5 years and females aged 6 to 11 years are the age groups that are most secure financially, with 100.0% of males and 100.0% of females in these age groups living above the poverty line.
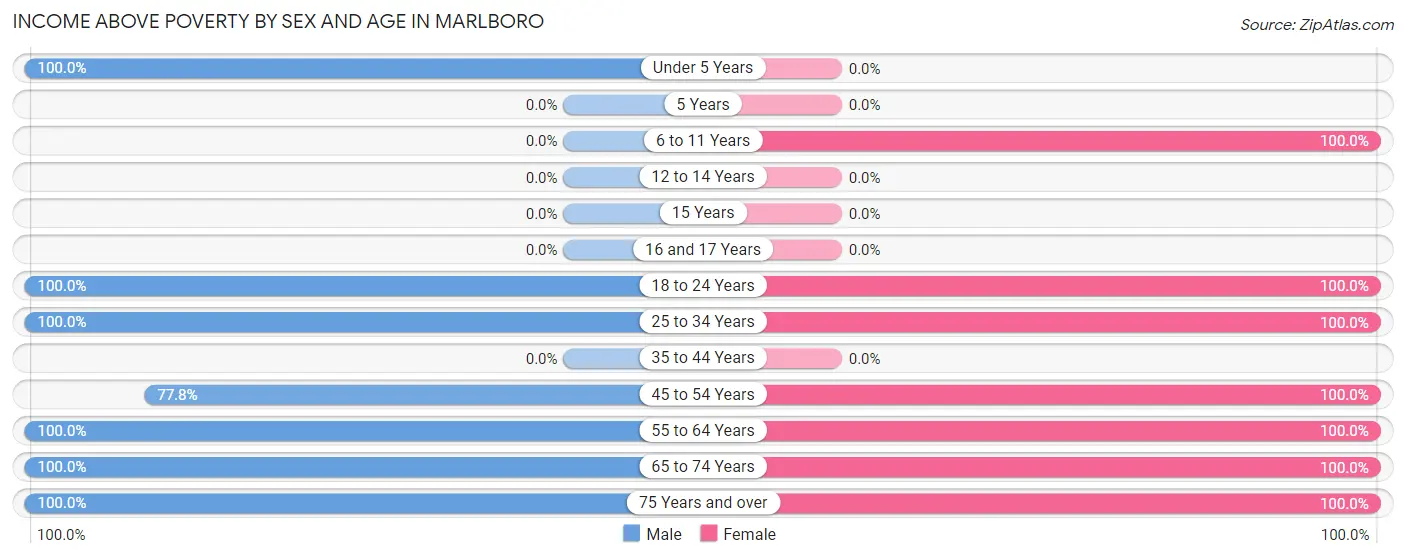
| Age Bracket | Male | Female |
| Under 5 Years | 5 (100.0%) | 0 (0.0%) |
| 5 Years | 0 (0.0%) | 0 (0.0%) |
| 6 to 11 Years | 0 (0.0%) | 14 (100.0%) |
| 12 to 14 Years | 0 (0.0%) | 0 (0.0%) |
| 15 Years | 0 (0.0%) | 0 (0.0%) |
| 16 and 17 Years | 0 (0.0%) | 0 (0.0%) |
| 18 to 24 Years | 6 (100.0%) | 13 (100.0%) |
| 25 to 34 Years | 30 (100.0%) | 13 (100.0%) |
| 35 to 44 Years | 0 (0.0%) | 0 (0.0%) |
| 45 to 54 Years | 21 (77.8%) | 6 (100.0%) |
| 55 to 64 Years | 7 (100.0%) | 19 (100.0%) |
| 65 to 74 Years | 30 (100.0%) | 37 (100.0%) |
| 75 Years and over | 12 (100.0%) | 24 (100.0%) |
| Total | 111 (94.9%) | 126 (100.0%) |
Income Below Poverty Among Married-Couple Families in Marlboro
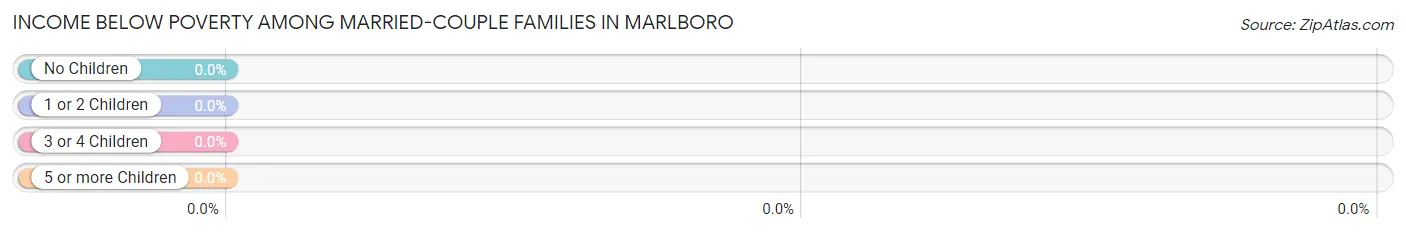
| Children | Above Poverty | Below Poverty |
| No Children | 71 (100.0%) | 0 (0.0%) |
| 1 or 2 Children | 13 (100.0%) | 0 (0.0%) |
| 3 or 4 Children | 0 (0.0%) | 0 (0.0%) |
| 5 or more Children | 0 (0.0%) | 0 (0.0%) |
| Total | 84 (100.0%) | 0 (0.0%) |
Income Below Poverty Among Single-Parent Households in Marlboro
| Children | Single Father | Single Mother |
| No Children | 0 (0.0%) | 0 (0.0%) |
| 1 or 2 Children | 0 (0.0%) | 0 (0.0%) |
| 3 or 4 Children | 0 (0.0%) | 0 (0.0%) |
| 5 or more Children | 0 (0.0%) | 0 (0.0%) |
| Total | 0 (0.0%) | 0 (0.0%) |
Income Below Poverty Among Married-Couple vs Single-Parent Households in Marlboro
| Children | Married-Couple Families | Single-Parent Households |
| No Children | 0 (0.0%) | 0 (0.0%) |
| 1 or 2 Children | 0 (0.0%) | 0 (0.0%) |
| 3 or 4 Children | 0 (0.0%) | 0 (0.0%) |
| 5 or more Children | 0 (0.0%) | 0 (0.0%) |
| Total | 0 (0.0%) | 0 (0.0%) |
Race in Marlboro
The most populous races in Marlboro are White / Caucasian (238 | 97.9%), and Two or more Races (5 | 2.1%).
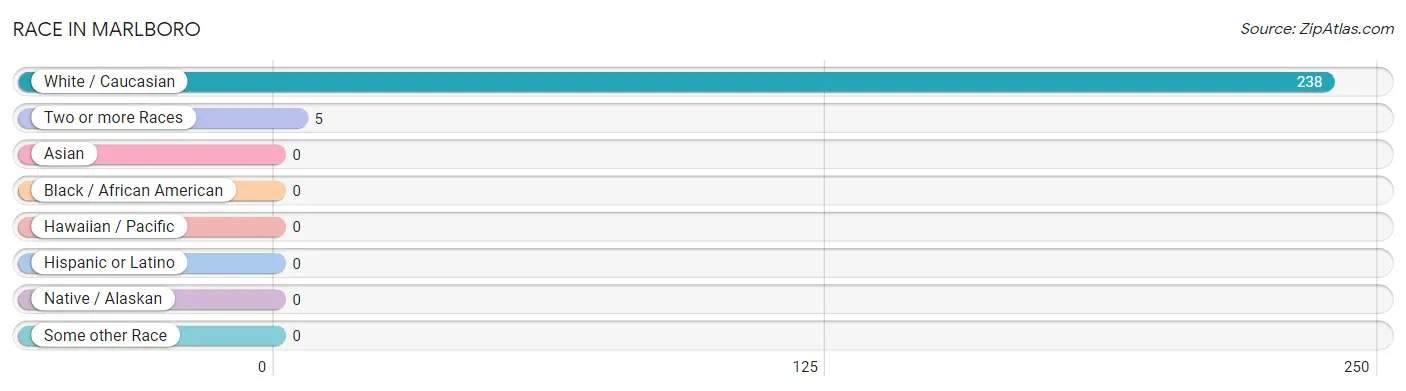
| Race | # Population | % Population |
| Asian | 0 | 0.0% |
| Black / African American | 0 | 0.0% |
| Hawaiian / Pacific | 0 | 0.0% |
| Hispanic or Latino | 0 | 0.0% |
| Native / Alaskan | 0 | 0.0% |
| White / Caucasian | 238 | 97.9% |
| Two or more Races | 5 | 2.1% |
| Some other Race | 0 | 0.0% |
| Total | 243 | 100.0% |
Ancestry in Marlboro
The most populous ancestries reported in Marlboro are German (91 | 37.4%), Irish (67 | 27.6%), European (19 | 7.8%), English (18 | 7.4%), and Italian (18 | 7.4%), together accounting for 87.7% of all Marlboro residents.
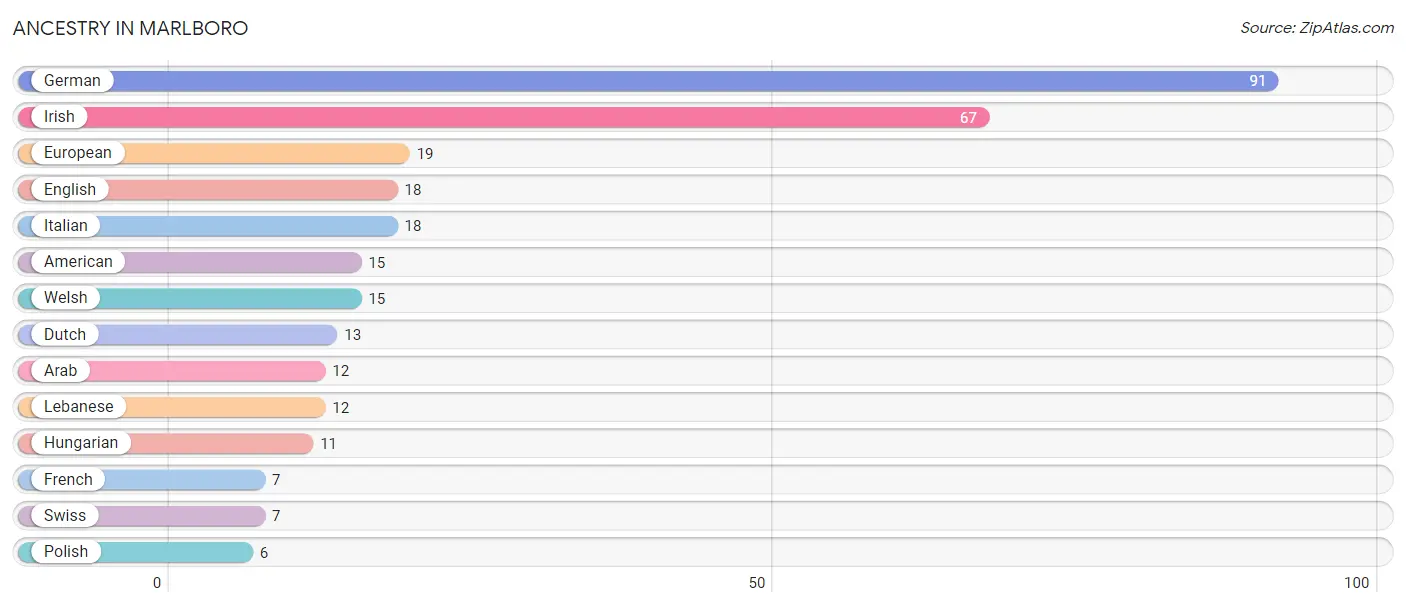
| Ancestry | # Population | % Population |
| American | 15 | 6.2% |
| Arab | 12 | 4.9% |
| Dutch | 13 | 5.3% |
| English | 18 | 7.4% |
| European | 19 | 7.8% |
| French | 7 | 2.9% |
| German | 91 | 37.4% |
| Hungarian | 11 | 4.5% |
| Irish | 67 | 27.6% |
| Italian | 18 | 7.4% |
| Lebanese | 12 | 4.9% |
| Polish | 6 | 2.5% |
| Swiss | 7 | 2.9% |
| Welsh | 15 | 6.2% | View All 14 Rows |
Immigrants in Marlboro
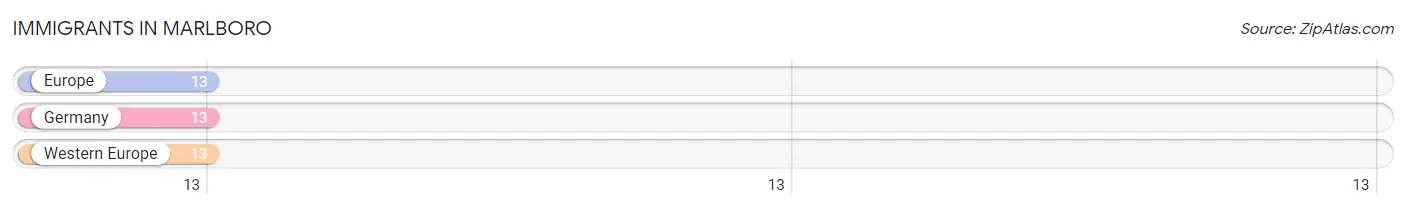
The most numerous immigrant groups reported in Marlboro came from Europe (13 | 5.3%), Germany (13 | 5.3%), and Western Europe (13 | 5.3%), together accounting for 16.1% of all Marlboro residents.
| Immigration Origin | # Population | % Population |
| Europe | 13 | 5.3% |
| Germany | 13 | 5.3% |
| Western Europe | 13 | 5.3% | View All 3 Rows |
Sex and Age in Marlboro
Sex and Age in Marlboro
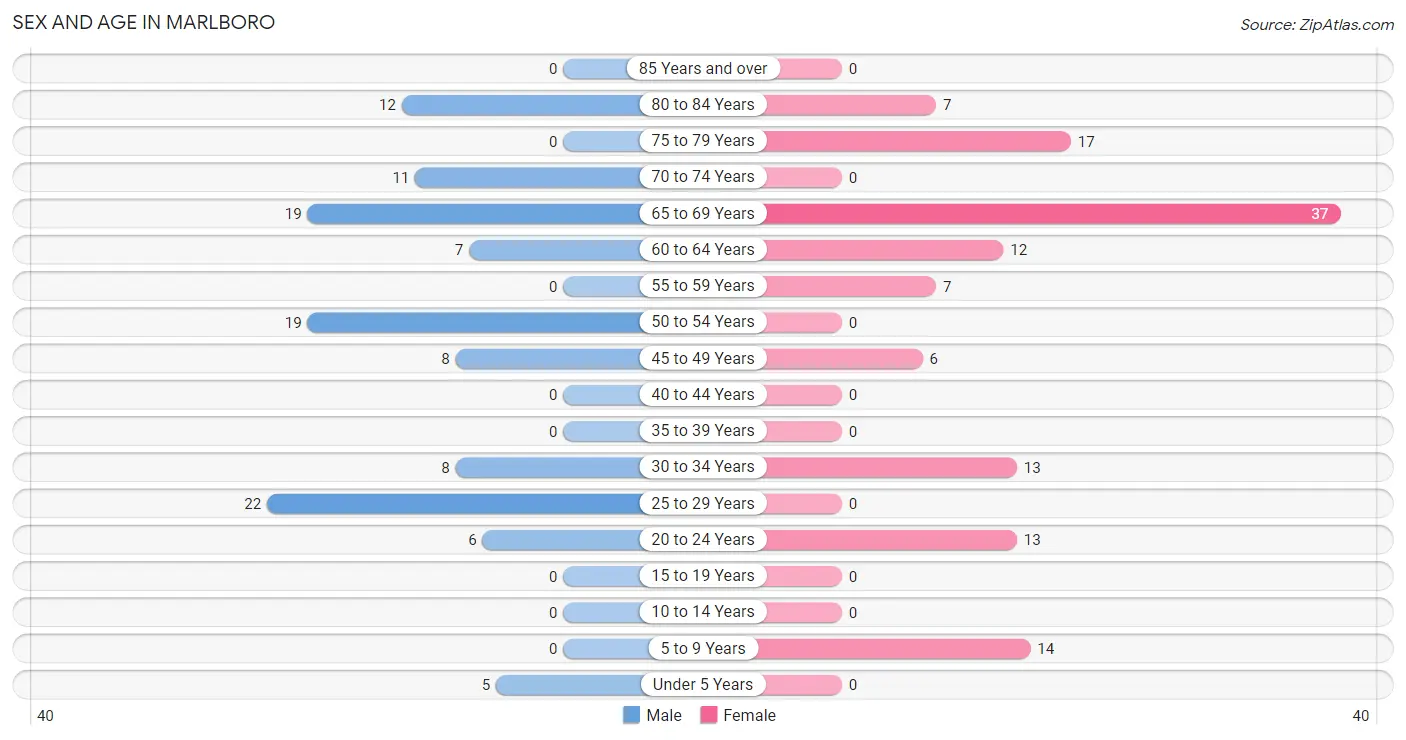
The most populous age groups in Marlboro are 25 to 29 Years (22 | 18.8%) for men and 65 to 69 Years (37 | 29.4%) for women.
| Age Bracket | Male | Female |
| Under 5 Years | 5 (4.3%) | 0 (0.0%) |
| 5 to 9 Years | 0 (0.0%) | 14 (11.1%) |
| 10 to 14 Years | 0 (0.0%) | 0 (0.0%) |
| 15 to 19 Years | 0 (0.0%) | 0 (0.0%) |
| 20 to 24 Years | 6 (5.1%) | 13 (10.3%) |
| 25 to 29 Years | 22 (18.8%) | 0 (0.0%) |
| 30 to 34 Years | 8 (6.8%) | 13 (10.3%) |
| 35 to 39 Years | 0 (0.0%) | 0 (0.0%) |
| 40 to 44 Years | 0 (0.0%) | 0 (0.0%) |
| 45 to 49 Years | 8 (6.8%) | 6 (4.8%) |
| 50 to 54 Years | 19 (16.2%) | 0 (0.0%) |
| 55 to 59 Years | 0 (0.0%) | 7 (5.6%) |
| 60 to 64 Years | 7 (6.0%) | 12 (9.5%) |
| 65 to 69 Years | 19 (16.2%) | 37 (29.4%) |
| 70 to 74 Years | 11 (9.4%) | 0 (0.0%) |
| 75 to 79 Years | 0 (0.0%) | 17 (13.5%) |
| 80 to 84 Years | 12 (10.3%) | 7 (5.6%) |
| 85 Years and over | 0 (0.0%) | 0 (0.0%) |
| Total | 117 (100.0%) | 126 (100.0%) |
Families and Households in Marlboro
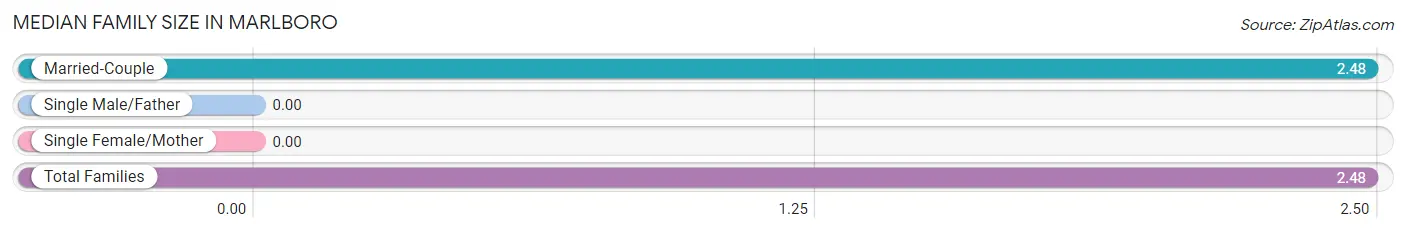
Median Family Size in Marlboro
| Family Type | # Families | Family Size |
| Married-Couple | 84 (100.0%) | 2.48 |
| Single Male/Father | 0 (0.0%) | - |
| Single Female/Mother | 0 (0.0%) | - |
| Total Families | 84 (100.0%) | 2.48 |
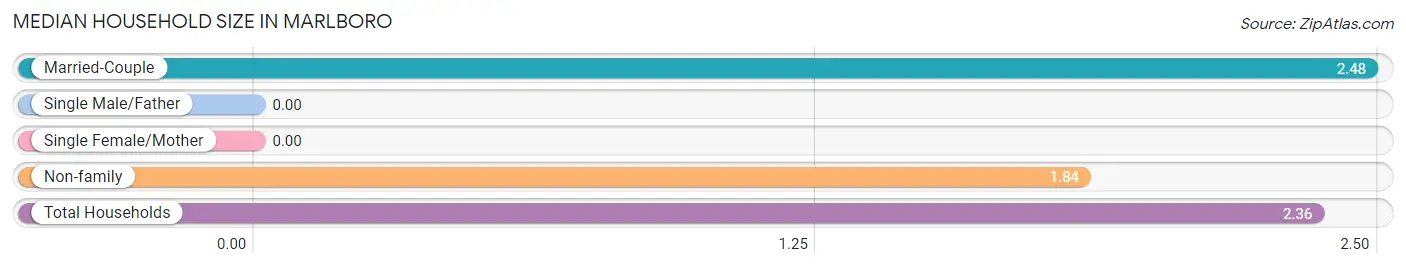
Median Household Size in Marlboro
| Household Type | # Households | Household Size |
| Married-Couple | 84 (81.6%) | 2.48 |
| Single Male/Father | 0 (0.0%) | - |
| Single Female/Mother | 0 (0.0%) | - |
| Non-family | 19 (18.4%) | 1.84 |
| Total Households | 103 (100.0%) | 2.36 |
Household Size by Marriage Status in Marlboro
Out of a total of 103 households in Marlboro, 84 (81.6%) are family households, while 19 (18.4%) are nonfamily households. The most numerous type of family households are 2-person households, comprising 52, and the most common type of nonfamily households are 2-person households, comprising 12.
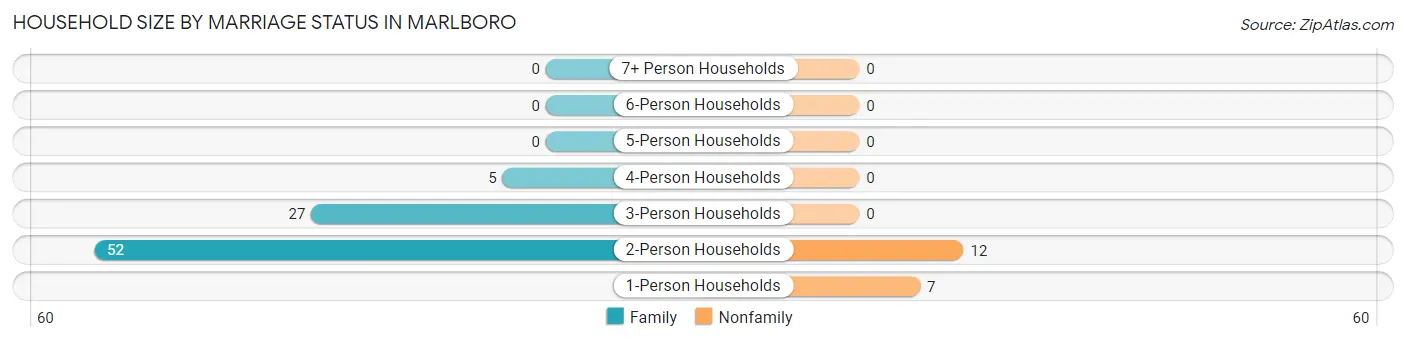
| Household Size | Family Households | Nonfamily Households |
| 1-Person Households | - | 7 (6.8%) |
| 2-Person Households | 52 (50.5%) | 12 (11.7%) |
| 3-Person Households | 27 (26.2%) | 0 (0.0%) |
| 4-Person Households | 5 (4.9%) | 0 (0.0%) |
| 5-Person Households | 0 (0.0%) | 0 (0.0%) |
| 6-Person Households | 0 (0.0%) | 0 (0.0%) |
| 7+ Person Households | 0 (0.0%) | 0 (0.0%) |
| Total | 84 (81.6%) | 19 (18.4%) |
Female Fertility in Marlboro
Fertility by Age in Marlboro
| Age Bracket | Women with Births | Births / 1,000 Women |
| 15 to 19 years | 0 (0.0%) | 0.0 |
| 20 to 34 years | 0 (0.0%) | 0.0 |
| 35 to 50 years | 0 (0.0%) | 0.0 |
| Total | 0 (0.0%) | 0.0 |
Fertility by Age by Marriage Status in Marlboro
| Age Bracket | Married | Unmarried |
| 15 to 19 years | 0 (0.0%) | 0 (0.0%) |
| 20 to 34 years | 0 (0.0%) | 0 (0.0%) |
| 35 to 50 years | 0 (0.0%) | 0 (0.0%) |
| Total | 0 (0.0%) | 0 (0.0%) |
Fertility by Education in Marlboro
| Educational Attainment | Women with Births | Births / 1,000 Women |
| Less than High School | 0 (0.0%) | 0.0 |
| High School Diploma | 0 (0.0%) | 0.0 |
| College or Associate's Degree | 0 (0.0%) | 0.0 |
| Bachelor's Degree | 0 (0.0%) | 0.0 |
| Graduate Degree | 0 (0.0%) | 0.0 |
| Total | 0 (0.0%) | 0.0 |
Fertility by Education by Marriage Status in Marlboro
| Educational Attainment | Married | Unmarried |
| Less than High School | 0 (0.0%) | 0 (0.0%) |
| High School Diploma | 0 (0.0%) | 0 (0.0%) |
| College or Associate's Degree | 0 (0.0%) | 0 (0.0%) |
| Bachelor's Degree | 0 (0.0%) | 0 (0.0%) |
| Graduate Degree | 0 (0.0%) | 0 (0.0%) |
| Total | 0 (0.0%) | 0 (0.0%) |
Employment Characteristics in Marlboro
Employment by Class of Employer in Marlboro
Among the 129 employed individuals in Marlboro, private company employees (105 | 81.4%), not-for-profit organizations (18 | 14.0%), and self-employed (not incorporated) (6 | 4.6%) make up the most common classes of employment.
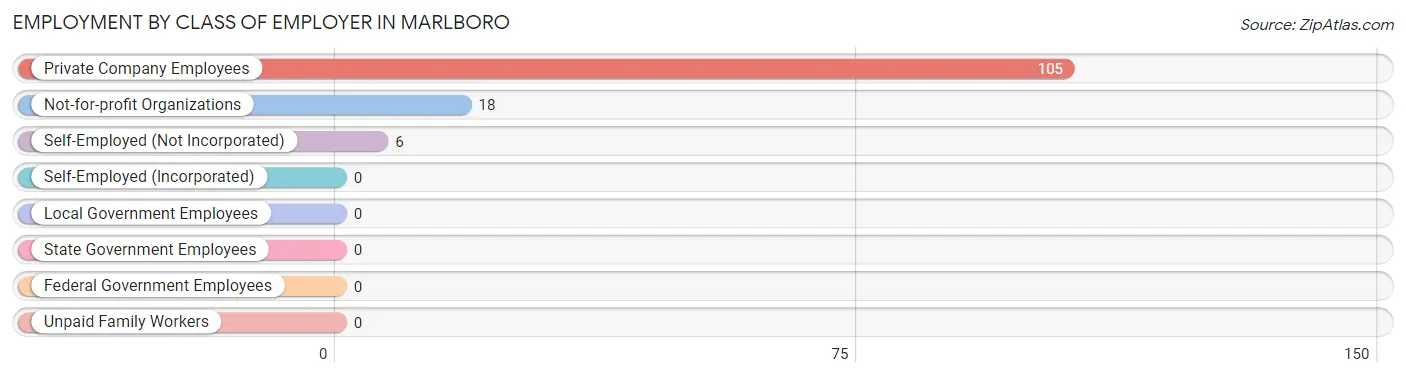
| Employer Class | # Employees | % Employees |
| Private Company Employees | 105 | 81.4% |
| Self-Employed (Incorporated) | 0 | 0.0% |
| Self-Employed (Not Incorporated) | 6 | 4.6% |
| Not-for-profit Organizations | 18 | 14.0% |
| Local Government Employees | 0 | 0.0% |
| State Government Employees | 0 | 0.0% |
| Federal Government Employees | 0 | 0.0% |
| Unpaid Family Workers | 0 | 0.0% |
| Total | 129 | 100.0% |
Employment Status by Age in Marlboro
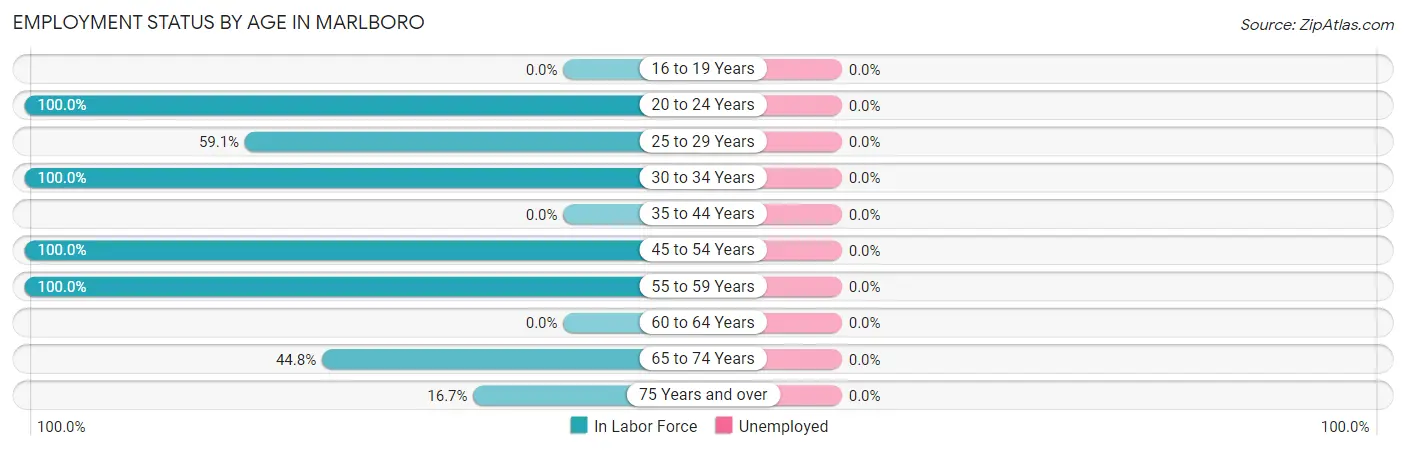
| Age Bracket | In Labor Force | Unemployed |
| 16 to 19 Years | 0 (0.0%) | 0 (0.0%) |
| 20 to 24 Years | 19 (100.0%) | 0 (0.0%) |
| 25 to 29 Years | 13 (59.1%) | 0 (0.0%) |
| 30 to 34 Years | 21 (100.0%) | 0 (0.0%) |
| 35 to 44 Years | 0 (0.0%) | 0 (0.0%) |
| 45 to 54 Years | 33 (100.0%) | 0 (0.0%) |
| 55 to 59 Years | 7 (100.0%) | 0 (0.0%) |
| 60 to 64 Years | 0 (0.0%) | 0 (0.0%) |
| 65 to 74 Years | 30 (44.8%) | 0 (0.0%) |
| 75 Years and over | 6 (16.7%) | 0 (0.0%) |
| Total | 129 (57.6%) | 0 (0.0%) |
Employment Status by Educational Attainment in Marlboro
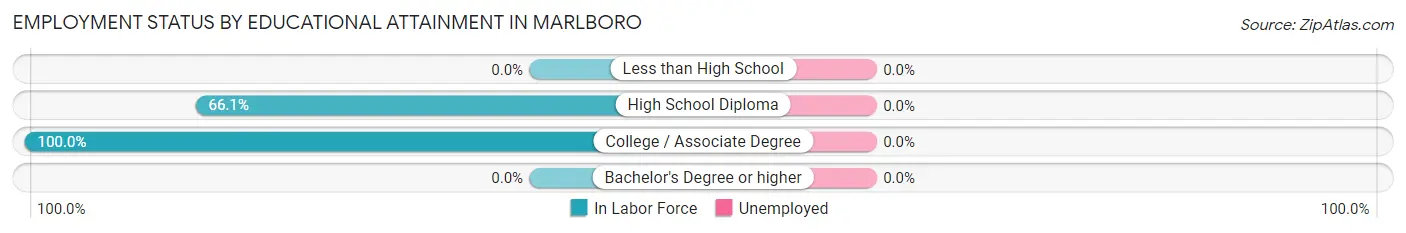
| Educational Attainment | In Labor Force | Unemployed |
| Less than High School | 0 (0.0%) | 0 (0.0%) |
| High School Diploma | 41 (66.1%) | 0 (0.0%) |
| College / Associate Degree | 33 (100.0%) | 0 (0.0%) |
| Bachelor's Degree or higher | 0 (0.0%) | 0 (0.0%) |
| Total | 74 (72.5%) | 0 (0.0%) |
Employment Occupations by Sex in Marlboro
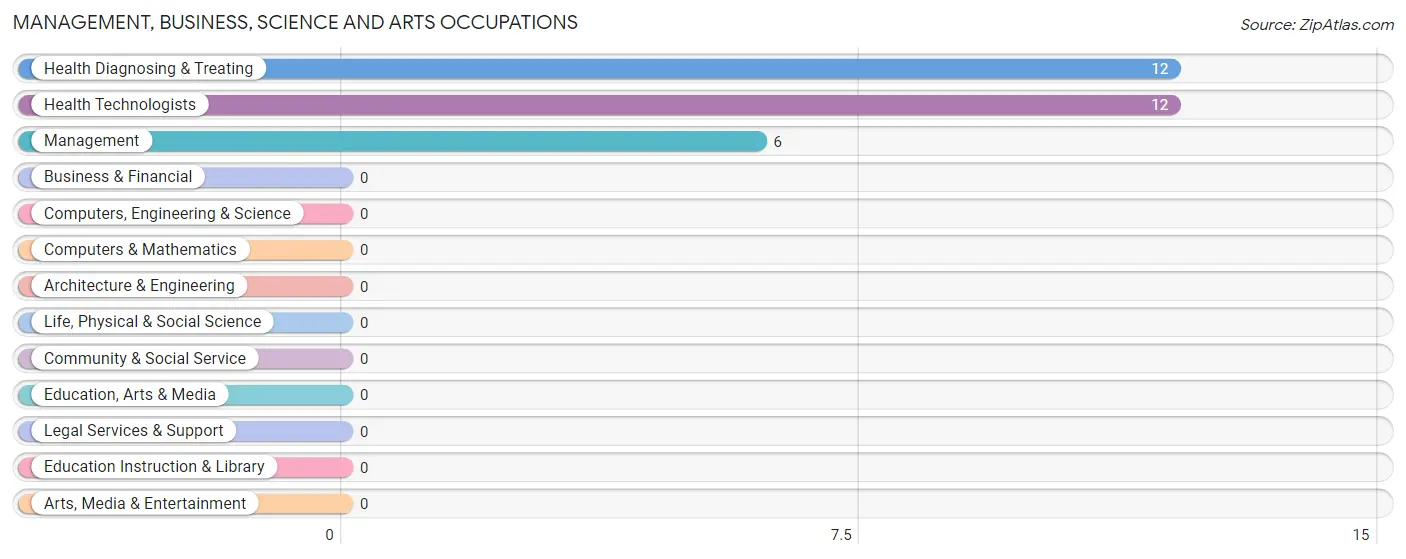
Management, Business, Science and Arts Occupations
The most common Management, Business, Science and Arts occupations in Marlboro are Health Diagnosing & Treating (12 | 9.3%), Health Technologists (12 | 9.3%), and Management (6 | 4.6%).
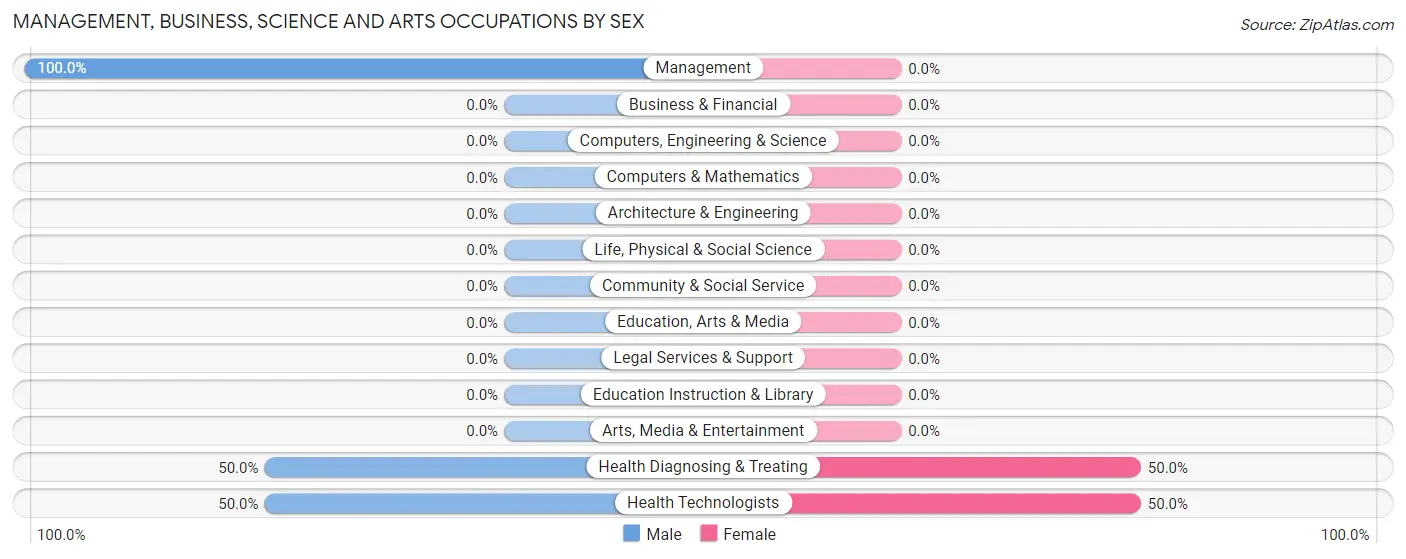
Management, Business, Science and Arts Occupations by Sex
Within the Management, Business, Science and Arts occupations in Marlboro, the most male-oriented occupations are Management (100.0%), Health Diagnosing & Treating (50.0%), and Health Technologists (50.0%), while the most female-oriented occupations are Health Diagnosing & Treating (50.0%), and Health Technologists (50.0%).
| Occupation | Male | Female |
| Management | 6 (100.0%) | 0 (0.0%) |
| Business & Financial | 0 (0.0%) | 0 (0.0%) |
| Computers, Engineering & Science | 0 (0.0%) | 0 (0.0%) |
| Computers & Mathematics | 0 (0.0%) | 0 (0.0%) |
| Architecture & Engineering | 0 (0.0%) | 0 (0.0%) |
| Life, Physical & Social Science | 0 (0.0%) | 0 (0.0%) |
| Community & Social Service | 0 (0.0%) | 0 (0.0%) |
| Education, Arts & Media | 0 (0.0%) | 0 (0.0%) |
| Legal Services & Support | 0 (0.0%) | 0 (0.0%) |
| Education Instruction & Library | 0 (0.0%) | 0 (0.0%) |
| Arts, Media & Entertainment | 0 (0.0%) | 0 (0.0%) |
| Health Diagnosing & Treating | 6 (50.0%) | 6 (50.0%) |
| Health Technologists | 6 (50.0%) | 6 (50.0%) |
| Total (Category) | 12 (66.7%) | 6 (33.3%) |
| Total (Overall) | 71 (55.0%) | 58 (45.0%) |
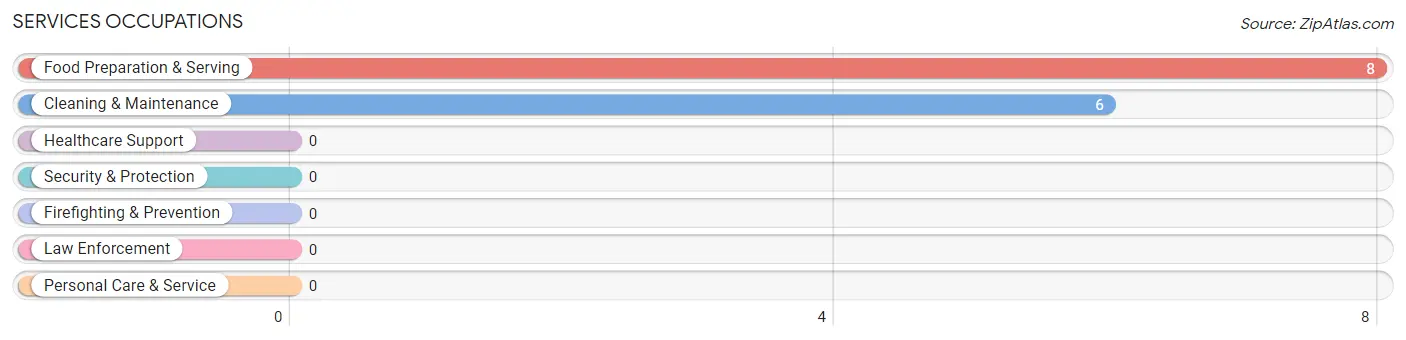
Services Occupations
The most common Services occupations in Marlboro are Food Preparation & Serving (8 | 6.2%), and Cleaning & Maintenance (6 | 4.6%).
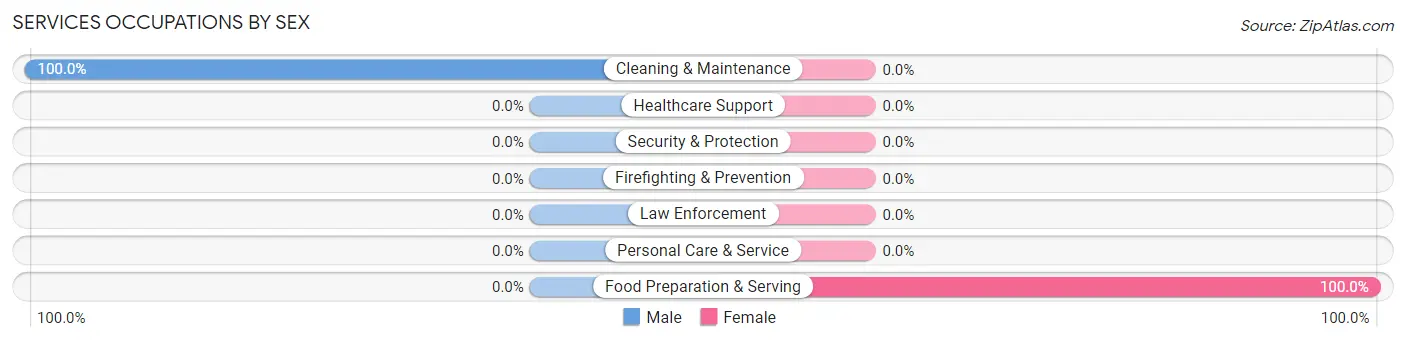
Services Occupations by Sex
| Occupation | Male | Female |
| Healthcare Support | 0 (0.0%) | 0 (0.0%) |
| Security & Protection | 0 (0.0%) | 0 (0.0%) |
| Firefighting & Prevention | 0 (0.0%) | 0 (0.0%) |
| Law Enforcement | 0 (0.0%) | 0 (0.0%) |
| Food Preparation & Serving | 0 (0.0%) | 8 (100.0%) |
| Cleaning & Maintenance | 6 (100.0%) | 0 (0.0%) |
| Personal Care & Service | 0 (0.0%) | 0 (0.0%) |
| Total (Category) | 6 (42.9%) | 8 (57.1%) |
| Total (Overall) | 71 (55.0%) | 58 (45.0%) |
Sales and Office Occupations
The most common Sales and Office occupations in Marlboro are Sales & Related (13 | 10.1%), and Office & Administration (12 | 9.3%).
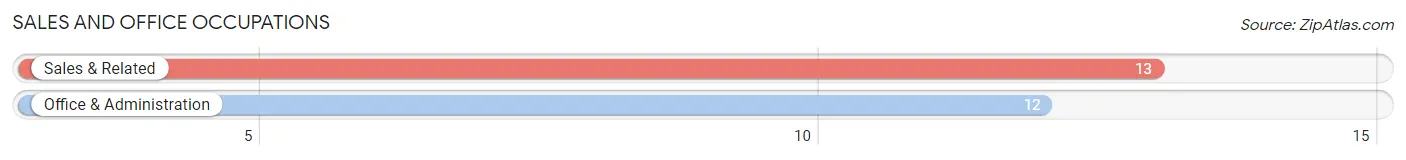
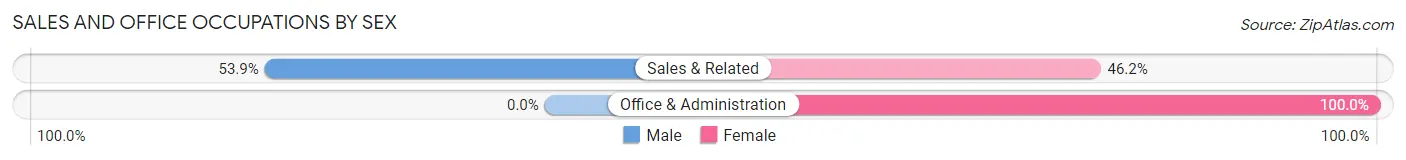
Sales and Office Occupations by Sex
| Occupation | Male | Female |
| Sales & Related | 7 (53.8%) | 6 (46.2%) |
| Office & Administration | 0 (0.0%) | 12 (100.0%) |
| Total (Category) | 7 (28.0%) | 18 (72.0%) |
| Total (Overall) | 71 (55.0%) | 58 (45.0%) |
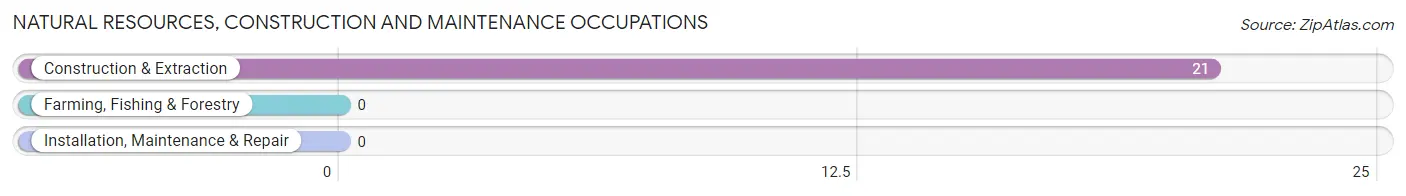
Natural Resources, Construction and Maintenance Occupations
The most common Natural Resources, Construction and Maintenance occupations in Marlboro are , and Construction & Extraction (21 | 16.3%).
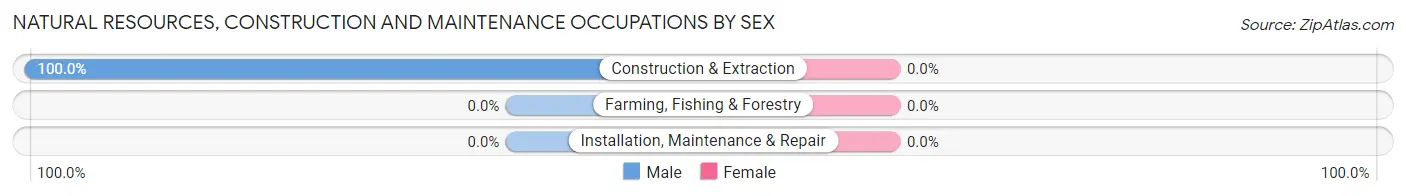
Natural Resources, Construction and Maintenance Occupations by Sex
| Occupation | Male | Female |
| Farming, Fishing & Forestry | 0 (0.0%) | 0 (0.0%) |
| Construction & Extraction | 21 (100.0%) | 0 (0.0%) |
| Installation, Maintenance & Repair | 0 (0.0%) | 0 (0.0%) |
| Total (Category) | 21 (100.0%) | 0 (0.0%) |
| Total (Overall) | 71 (55.0%) | 58 (45.0%) |
Production, Transportation and Moving Occupations
The most common Production, Transportation and Moving occupations in Marlboro are Material Moving (26 | 20.2%), Production (14 | 10.8%), and Transportation (11 | 8.5%).
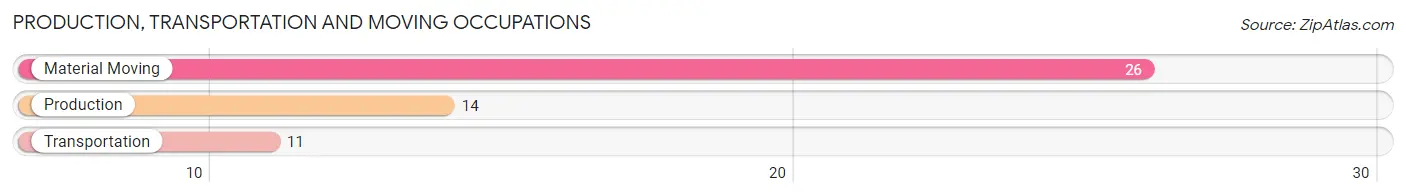
Production, Transportation and Moving Occupations by Sex
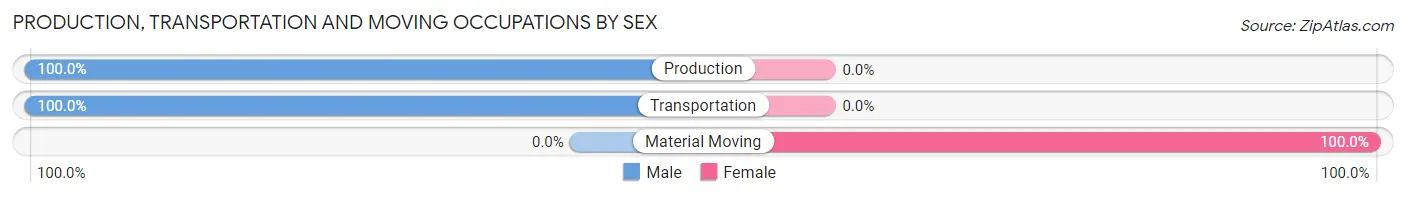
| Occupation | Male | Female |
| Production | 14 (100.0%) | 0 (0.0%) |
| Transportation | 11 (100.0%) | 0 (0.0%) |
| Material Moving | 0 (0.0%) | 26 (100.0%) |
| Total (Category) | 25 (49.0%) | 26 (51.0%) |
| Total (Overall) | 71 (55.0%) | 58 (45.0%) |
Employment Industries by Sex in Marlboro
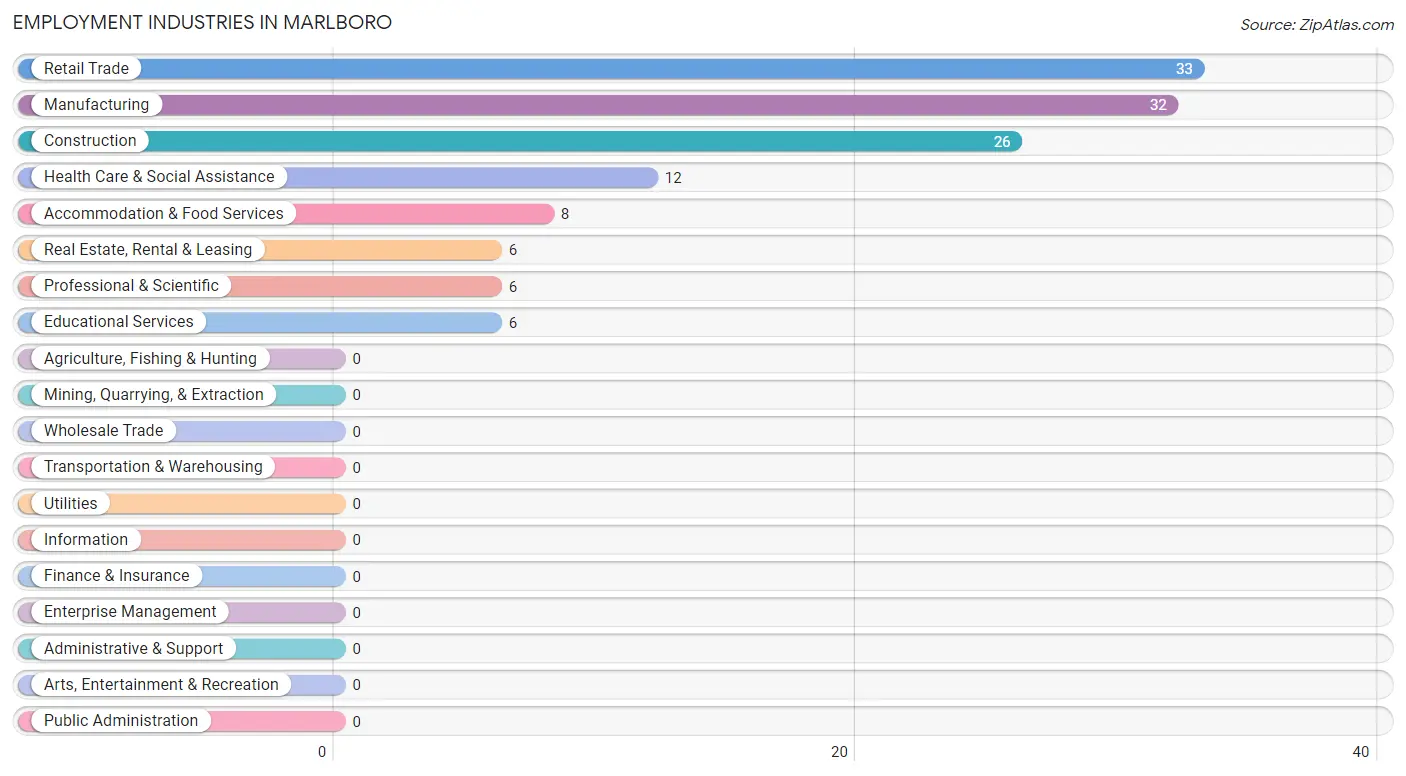
Employment Industries in Marlboro
The major employment industries in Marlboro include Retail Trade (33 | 25.6%), Manufacturing (32 | 24.8%), Construction (26 | 20.2%), Health Care & Social Assistance (12 | 9.3%), and Accommodation & Food Services (8 | 6.2%).
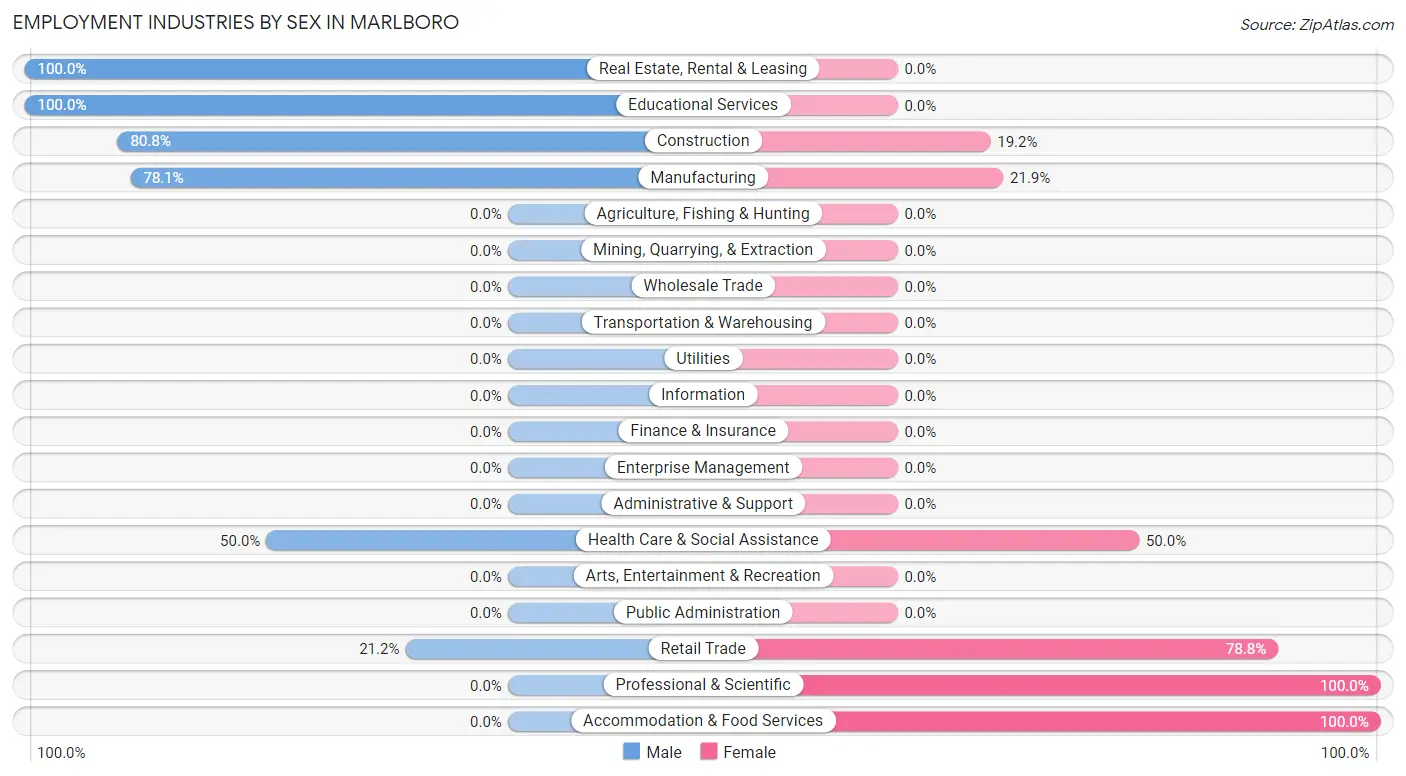
Employment Industries by Sex in Marlboro
The Marlboro industries that see more men than women are Real Estate, Rental & Leasing (100.0%), Educational Services (100.0%), and Construction (80.8%), whereas the industries that tend to have a higher number of women are Professional & Scientific (100.0%), Accommodation & Food Services (100.0%), and Retail Trade (78.8%).
| Industry | Male | Female |
| Agriculture, Fishing & Hunting | 0 (0.0%) | 0 (0.0%) |
| Mining, Quarrying, & Extraction | 0 (0.0%) | 0 (0.0%) |
| Construction | 21 (80.8%) | 5 (19.2%) |
| Manufacturing | 25 (78.1%) | 7 (21.9%) |
| Wholesale Trade | 0 (0.0%) | 0 (0.0%) |
| Retail Trade | 7 (21.2%) | 26 (78.8%) |
| Transportation & Warehousing | 0 (0.0%) | 0 (0.0%) |
| Utilities | 0 (0.0%) | 0 (0.0%) |
| Information | 0 (0.0%) | 0 (0.0%) |
| Finance & Insurance | 0 (0.0%) | 0 (0.0%) |
| Real Estate, Rental & Leasing | 6 (100.0%) | 0 (0.0%) |
| Professional & Scientific | 0 (0.0%) | 6 (100.0%) |
| Enterprise Management | 0 (0.0%) | 0 (0.0%) |
| Administrative & Support | 0 (0.0%) | 0 (0.0%) |
| Educational Services | 6 (100.0%) | 0 (0.0%) |
| Health Care & Social Assistance | 6 (50.0%) | 6 (50.0%) |
| Arts, Entertainment & Recreation | 0 (0.0%) | 0 (0.0%) |
| Accommodation & Food Services | 0 (0.0%) | 8 (100.0%) |
| Public Administration | 0 (0.0%) | 0 (0.0%) |
| Total | 71 (55.0%) | 58 (45.0%) |
Education in Marlboro
School Enrollment in Marlboro
The most common levels of schooling among the 27 students in Marlboro are elementary school (9 | 33.3%), college / undergraduate (7 | 25.9%), and graduate / professional (6 | 22.2%).
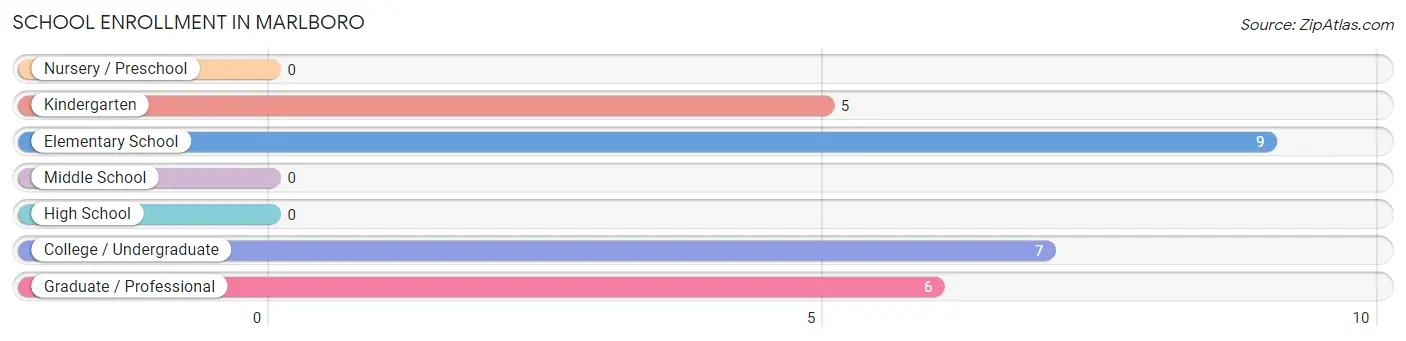
| School Level | # Students | % Students |
| Nursery / Preschool | 0 | 0.0% |
| Kindergarten | 5 | 18.5% |
| Elementary School | 9 | 33.3% |
| Middle School | 0 | 0.0% |
| High School | 0 | 0.0% |
| College / Undergraduate | 7 | 25.9% |
| Graduate / Professional | 6 | 22.2% |
| Total | 27 | 100.0% |
School Enrollment by Age by Funding Source in Marlboro
Out of a total of 27 students who are enrolled in schools in Marlboro, 13 (48.1%) attend a private institution, while the remaining 14 (51.9%) are enrolled in public schools. The age group of 20 to 24 year olds has the highest likelihood of being enrolled in private schools, with 13 (100.0% in the age bracket) enrolled. Conversely, the age group of 5 to 9 year old has the lowest likelihood of being enrolled in a private school, with 14 (100.0% in the age bracket) attending a public institution.
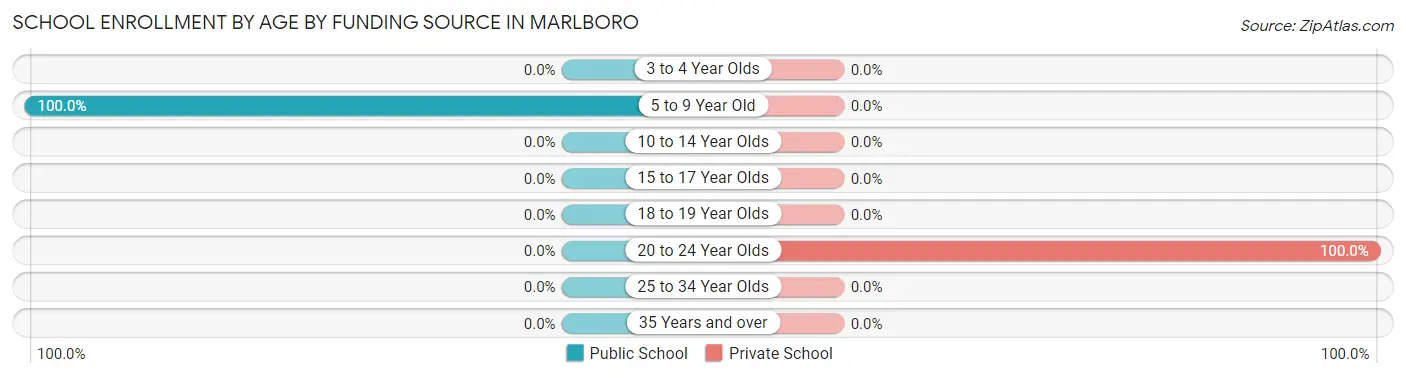
| Age Bracket | Public School | Private School |
| 3 to 4 Year Olds | 0 (0.0%) | 0 (0.0%) |
| 5 to 9 Year Old | 14 (100.0%) | 0 (0.0%) |
| 10 to 14 Year Olds | 0 (0.0%) | 0 (0.0%) |
| 15 to 17 Year Olds | 0 (0.0%) | 0 (0.0%) |
| 18 to 19 Year Olds | 0 (0.0%) | 0 (0.0%) |
| 20 to 24 Year Olds | 0 (0.0%) | 13 (100.0%) |
| 25 to 34 Year Olds | 0 (0.0%) | 0 (0.0%) |
| 35 Years and over | 0 (0.0%) | 0 (0.0%) |
| Total | 14 (51.9%) | 13 (48.1%) |
Educational Attainment by Field of Study in Marlboro
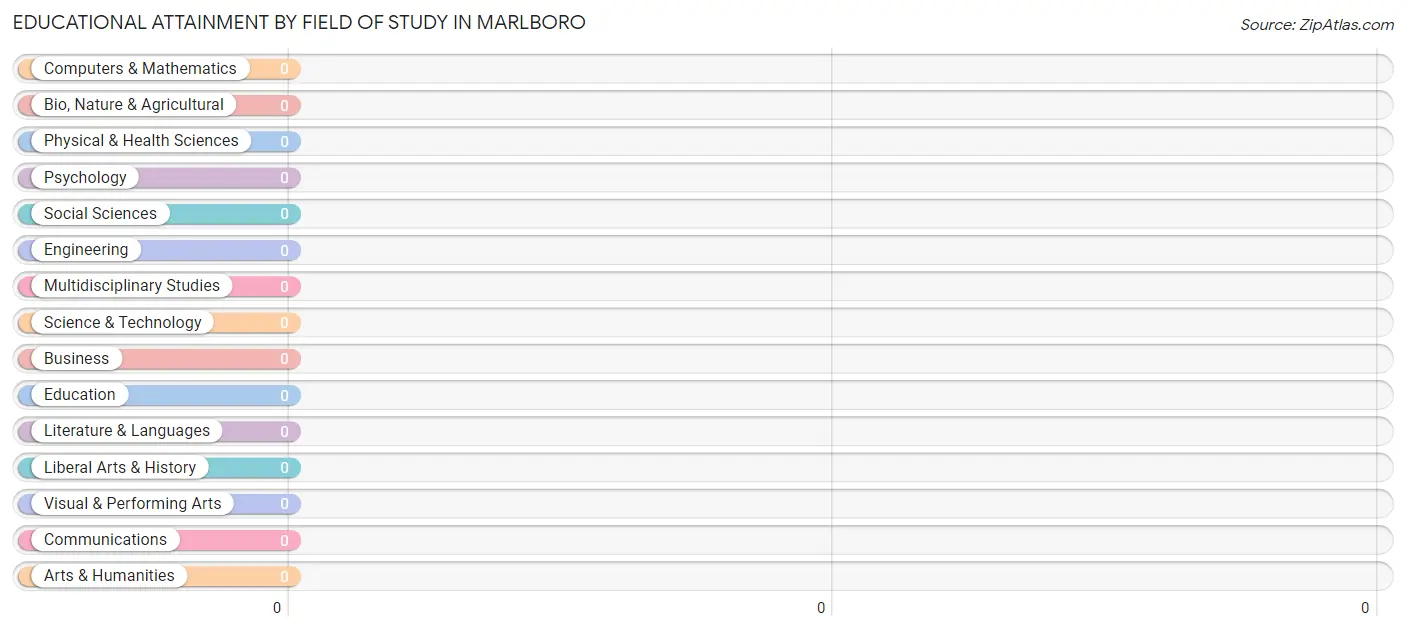
| Field of Study | # Graduates | % Graduates |
| Computers & Mathematics | 0 | 0.0% |
| Bio, Nature & Agricultural | 0 | 0.0% |
| Physical & Health Sciences | 0 | 0.0% |
| Psychology | 0 | 0.0% |
| Social Sciences | 0 | 0.0% |
| Engineering | 0 | 0.0% |
| Multidisciplinary Studies | 0 | 0.0% |
| Science & Technology | 0 | 0.0% |
| Business | 0 | 0.0% |
| Education | 0 | 0.0% |
| Literature & Languages | 0 | 0.0% |
| Liberal Arts & History | 0 | 0.0% |
| Visual & Performing Arts | 0 | 0.0% |
| Communications | 0 | 0.0% |
| Arts & Humanities | 0 | 0.0% |
| Total | 0 | 0.0% |
Transportation & Commute in Marlboro
Vehicle Availability by Sex in Marlboro
The most prevalent vehicle ownership categories in Marlboro are males with 2 vehicles (28, accounting for 39.4%) and females with 2 vehicles (33, making up 48.3%).
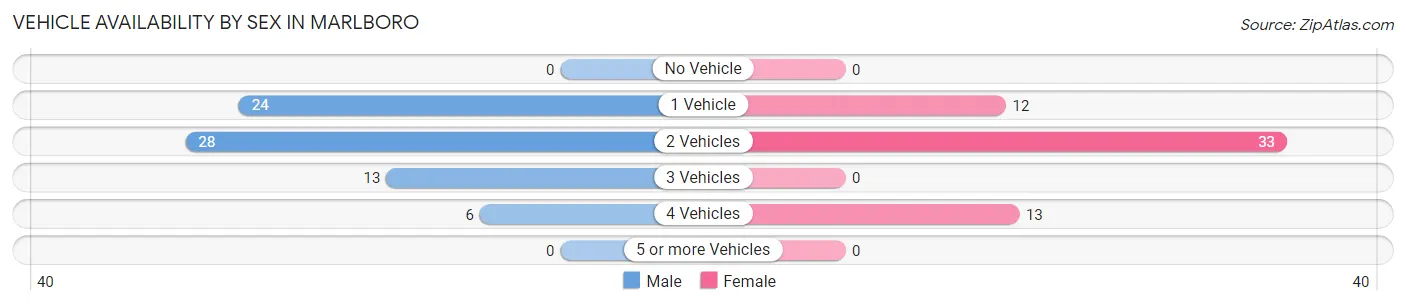
| Vehicles Available | Male | Female |
| No Vehicle | 0 (0.0%) | 0 (0.0%) |
| 1 Vehicle | 24 (33.8%) | 12 (20.7%) |
| 2 Vehicles | 28 (39.4%) | 33 (56.9%) |
| 3 Vehicles | 13 (18.3%) | 0 (0.0%) |
| 4 Vehicles | 6 (8.5%) | 13 (22.4%) |
| 5 or more Vehicles | 0 (0.0%) | 0 (0.0%) |
| Total | 71 (100.0%) | 58 (100.0%) |
Commute Time in Marlboro
The most frequently occuring commute durations in Marlboro are 30 to 34 minutes (35 commuters, 27.1%), 15 to 19 minutes (20 commuters, 15.5%), and less than 5 minutes (18 commuters, 14.0%).
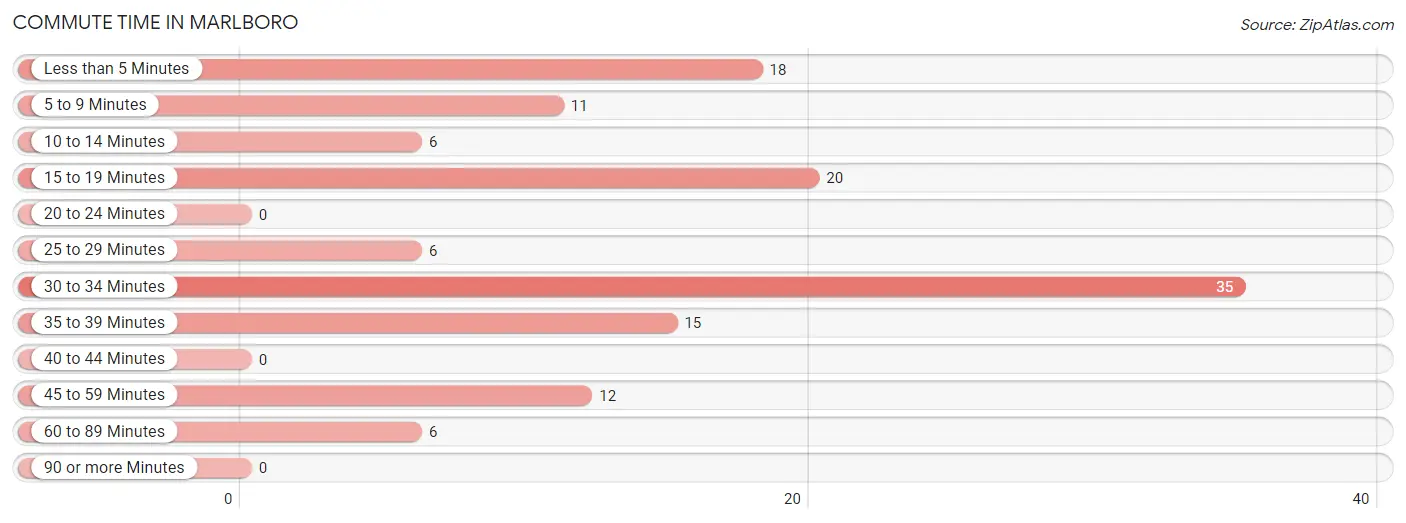
| Commute Time | # Commuters | % Commuters |
| Less than 5 Minutes | 18 | 14.0% |
| 5 to 9 Minutes | 11 | 8.5% |
| 10 to 14 Minutes | 6 | 4.6% |
| 15 to 19 Minutes | 20 | 15.5% |
| 20 to 24 Minutes | 0 | 0.0% |
| 25 to 29 Minutes | 6 | 4.6% |
| 30 to 34 Minutes | 35 | 27.1% |
| 35 to 39 Minutes | 15 | 11.6% |
| 40 to 44 Minutes | 0 | 0.0% |
| 45 to 59 Minutes | 12 | 9.3% |
| 60 to 89 Minutes | 6 | 4.6% |
| 90 or more Minutes | 0 | 0.0% |
Commute Time by Sex in Marlboro
The most common commute times in Marlboro are 30 to 34 minutes (22 commuters, 31.0%) for males and 15 to 19 minutes (14 commuters, 24.1%) for females.
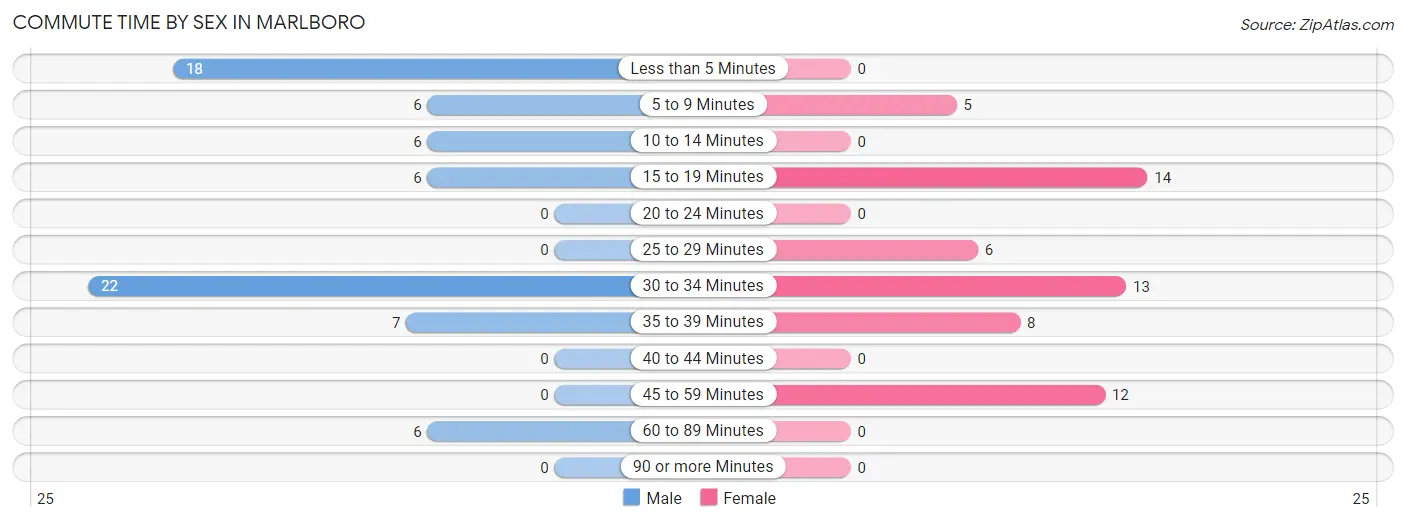
| Commute Time | Male | Female |
| Less than 5 Minutes | 18 (25.4%) | 0 (0.0%) |
| 5 to 9 Minutes | 6 (8.5%) | 5 (8.6%) |
| 10 to 14 Minutes | 6 (8.5%) | 0 (0.0%) |
| 15 to 19 Minutes | 6 (8.5%) | 14 (24.1%) |
| 20 to 24 Minutes | 0 (0.0%) | 0 (0.0%) |
| 25 to 29 Minutes | 0 (0.0%) | 6 (10.3%) |
| 30 to 34 Minutes | 22 (31.0%) | 13 (22.4%) |
| 35 to 39 Minutes | 7 (9.9%) | 8 (13.8%) |
| 40 to 44 Minutes | 0 (0.0%) | 0 (0.0%) |
| 45 to 59 Minutes | 0 (0.0%) | 12 (20.7%) |
| 60 to 89 Minutes | 6 (8.5%) | 0 (0.0%) |
| 90 or more Minutes | 0 (0.0%) | 0 (0.0%) |
Time of Departure to Work by Sex in Marlboro
The most frequent times of departure to work in Marlboro are 7:00 AM to 7:29 AM (14, 19.7%) for males and 4:00 PM to 11:59 PM (13, 22.4%) for females.
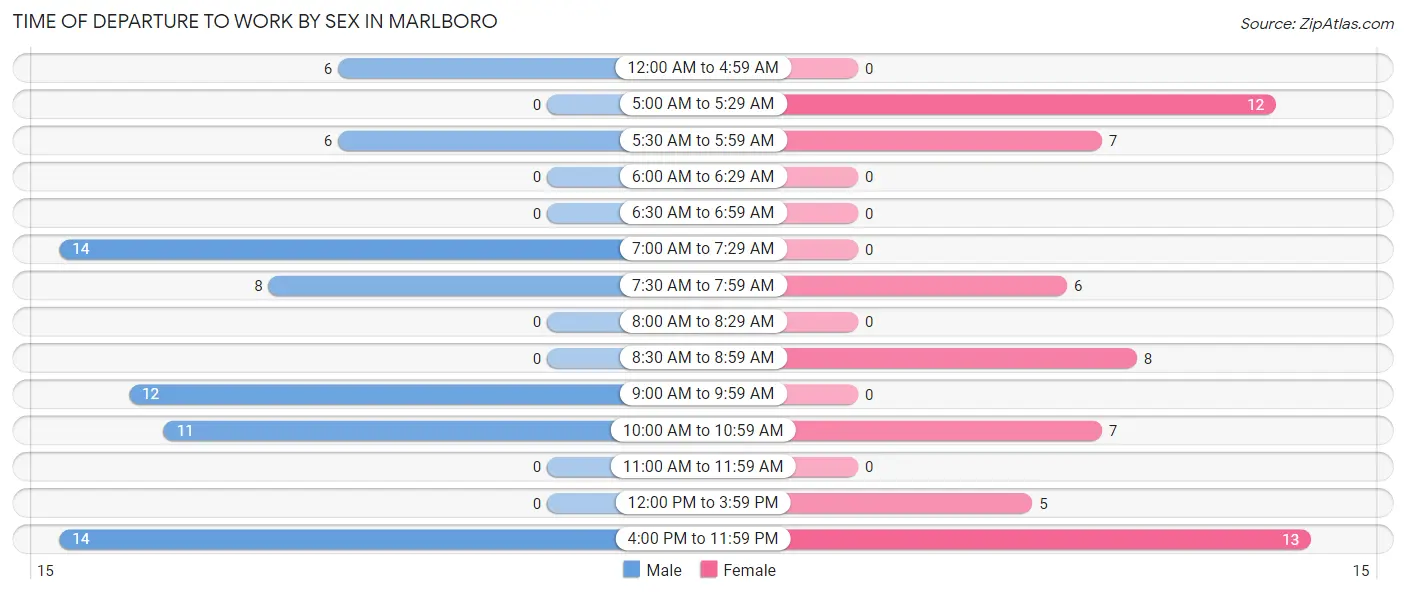
| Time of Departure | Male | Female |
| 12:00 AM to 4:59 AM | 6 (8.5%) | 0 (0.0%) |
| 5:00 AM to 5:29 AM | 0 (0.0%) | 12 (20.7%) |
| 5:30 AM to 5:59 AM | 6 (8.5%) | 7 (12.1%) |
| 6:00 AM to 6:29 AM | 0 (0.0%) | 0 (0.0%) |
| 6:30 AM to 6:59 AM | 0 (0.0%) | 0 (0.0%) |
| 7:00 AM to 7:29 AM | 14 (19.7%) | 0 (0.0%) |
| 7:30 AM to 7:59 AM | 8 (11.3%) | 6 (10.3%) |
| 8:00 AM to 8:29 AM | 0 (0.0%) | 0 (0.0%) |
| 8:30 AM to 8:59 AM | 0 (0.0%) | 8 (13.8%) |
| 9:00 AM to 9:59 AM | 12 (16.9%) | 0 (0.0%) |
| 10:00 AM to 10:59 AM | 11 (15.5%) | 7 (12.1%) |
| 11:00 AM to 11:59 AM | 0 (0.0%) | 0 (0.0%) |
| 12:00 PM to 3:59 PM | 0 (0.0%) | 5 (8.6%) |
| 4:00 PM to 11:59 PM | 14 (19.7%) | 13 (22.4%) |
| Total | 71 (100.0%) | 58 (100.0%) |
Housing Occupancy in Marlboro
Occupancy by Ownership in Marlboro
Of the total 103 dwellings in Marlboro, owner-occupied units account for 60 (58.3%), while renter-occupied units make up 43 (41.7%).
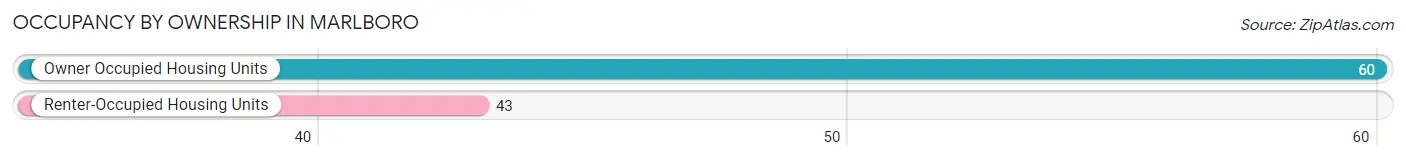
| Occupancy | # Housing Units | % Housing Units |
| Owner Occupied Housing Units | 60 | 58.3% |
| Renter-Occupied Housing Units | 43 | 41.7% |
| Total Occupied Housing Units | 103 | 100.0% |
Occupancy by Household Size in Marlboro
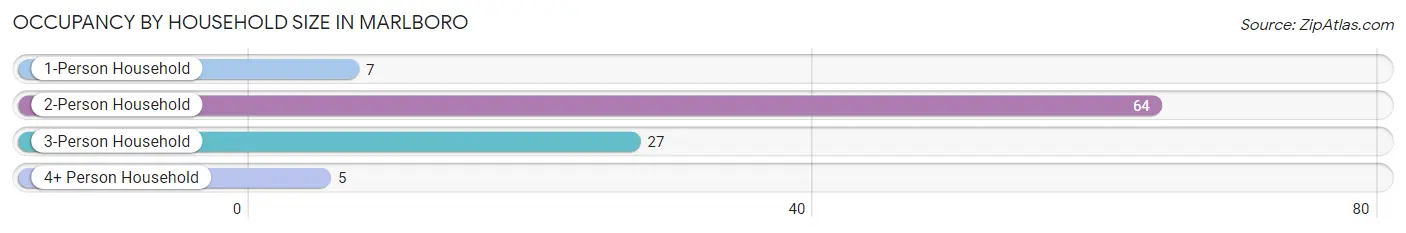
| Household Size | # Housing Units | % Housing Units |
| 1-Person Household | 7 | 6.8% |
| 2-Person Household | 64 | 62.1% |
| 3-Person Household | 27 | 26.2% |
| 4+ Person Household | 5 | 4.9% |
| Total Housing Units | 103 | 100.0% |
Occupancy by Ownership by Household Size in Marlboro
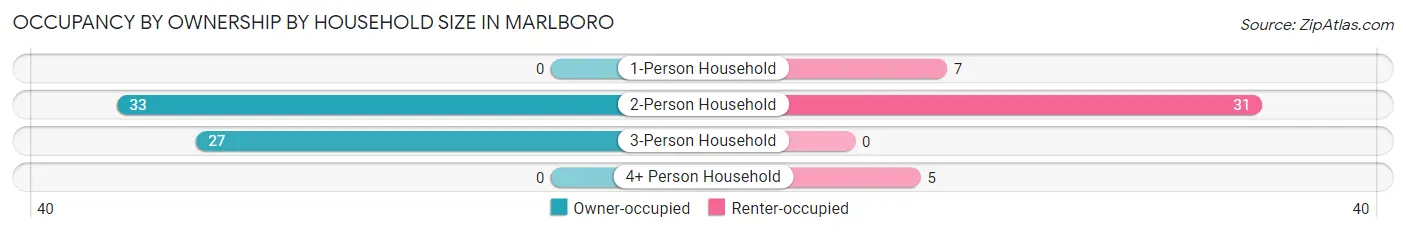
| Household Size | Owner-occupied | Renter-occupied |
| 1-Person Household | 0 (0.0%) | 7 (100.0%) |
| 2-Person Household | 33 (51.6%) | 31 (48.4%) |
| 3-Person Household | 27 (100.0%) | 0 (0.0%) |
| 4+ Person Household | 0 (0.0%) | 5 (100.0%) |
| Total Housing Units | 60 (58.3%) | 43 (41.7%) |
Occupancy by Educational Attainment in Marlboro
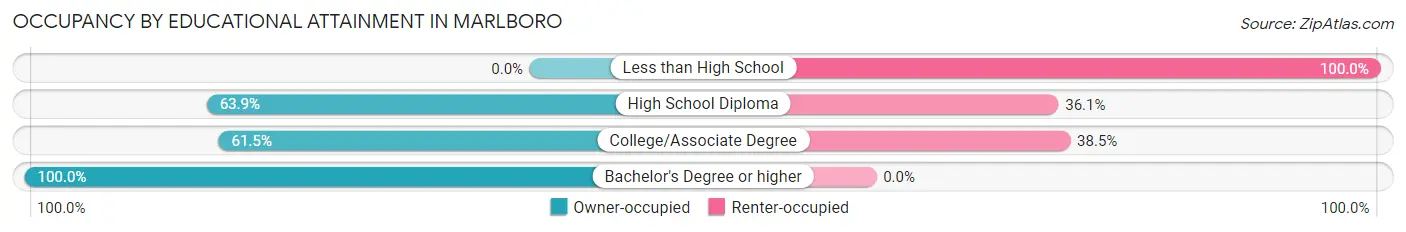
| Household Size | Owner-occupied | Renter-occupied |
| Less than High School | 0 (0.0%) | 12 (100.0%) |
| High School Diploma | 46 (63.9%) | 26 (36.1%) |
| College/Associate Degree | 8 (61.5%) | 5 (38.5%) |
| Bachelor's Degree or higher | 6 (100.0%) | 0 (0.0%) |
Occupancy by Age of Householder in Marlboro
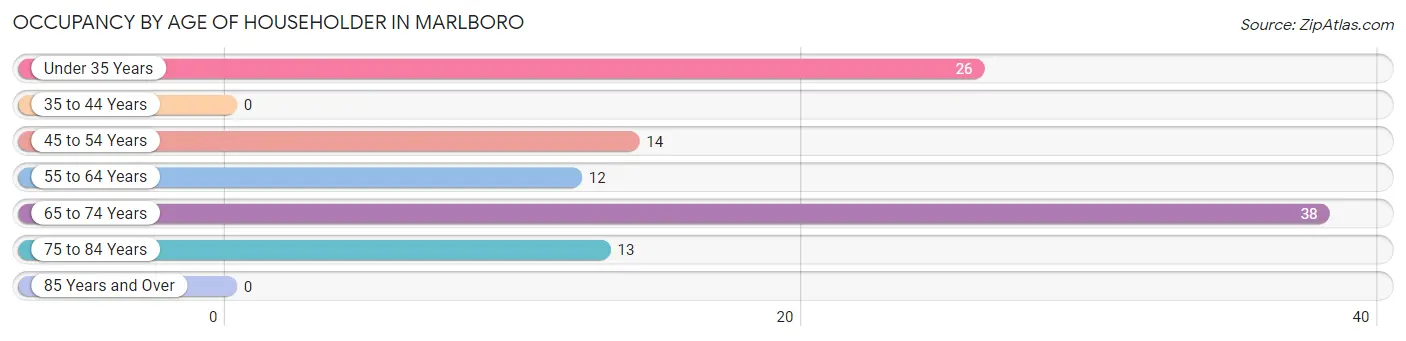
| Age Bracket | # Households | % Households |
| Under 35 Years | 26 | 25.2% |
| 35 to 44 Years | 0 | 0.0% |
| 45 to 54 Years | 14 | 13.6% |
| 55 to 64 Years | 12 | 11.7% |
| 65 to 74 Years | 38 | 36.9% |
| 75 to 84 Years | 13 | 12.6% |
| 85 Years and Over | 0 | 0.0% |
| Total | 103 | 100.0% |
Housing Finances in Marlboro
Median Income by Occupancy in Marlboro
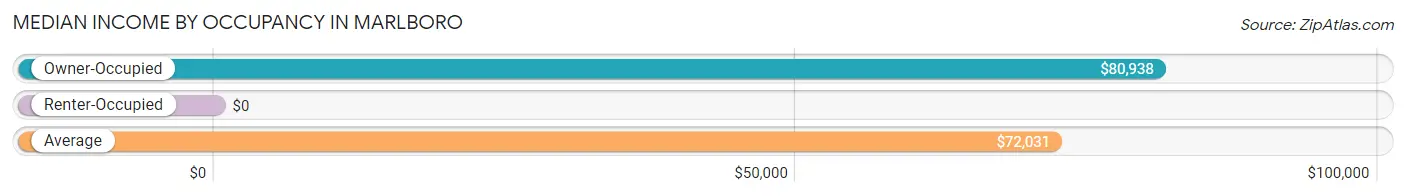
| Occupancy Type | # Households | Median Income |
| Owner-Occupied | 60 (58.3%) | $80,938 |
| Renter-Occupied | 43 (41.7%) | $0 |
| Average | 103 (100.0%) | $72,031 |
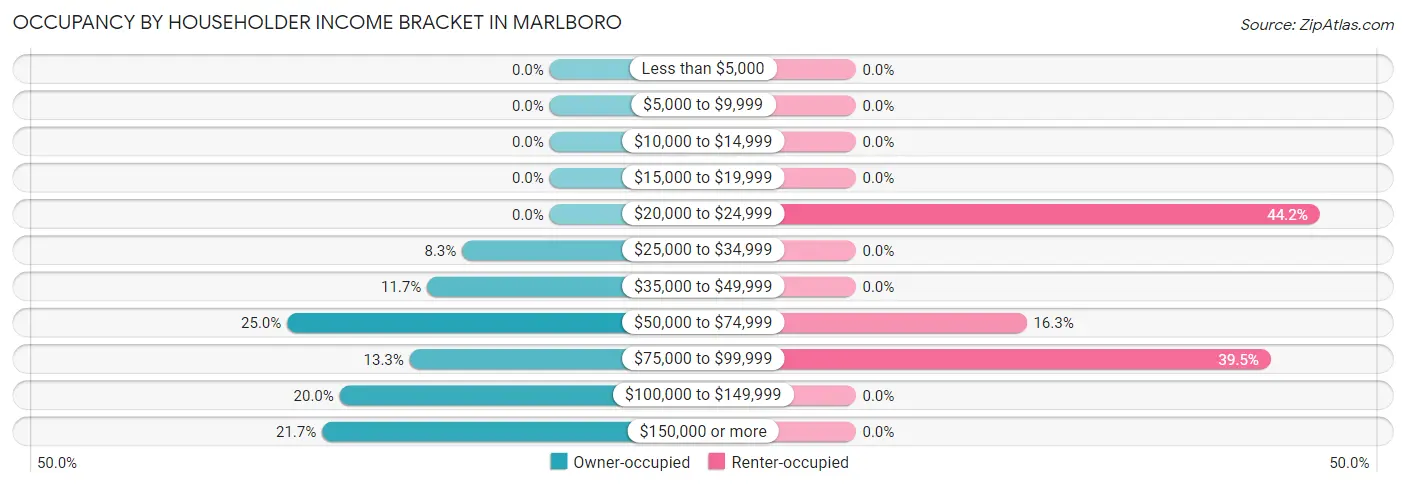
Occupancy by Householder Income Bracket in Marlboro
| Income Bracket | Owner-occupied | Renter-occupied |
| Less than $5,000 | 0 (0.0%) | 0 (0.0%) |
| $5,000 to $9,999 | 0 (0.0%) | 0 (0.0%) |
| $10,000 to $14,999 | 0 (0.0%) | 0 (0.0%) |
| $15,000 to $19,999 | 0 (0.0%) | 0 (0.0%) |
| $20,000 to $24,999 | 0 (0.0%) | 19 (44.2%) |
| $25,000 to $34,999 | 5 (8.3%) | 0 (0.0%) |
| $35,000 to $49,999 | 7 (11.7%) | 0 (0.0%) |
| $50,000 to $74,999 | 15 (25.0%) | 7 (16.3%) |
| $75,000 to $99,999 | 8 (13.3%) | 17 (39.5%) |
| $100,000 to $149,999 | 12 (20.0%) | 0 (0.0%) |
| $150,000 or more | 13 (21.7%) | 0 (0.0%) |
| Total | 60 (100.0%) | 43 (100.0%) |
Monthly Housing Cost Tiers in Marlboro
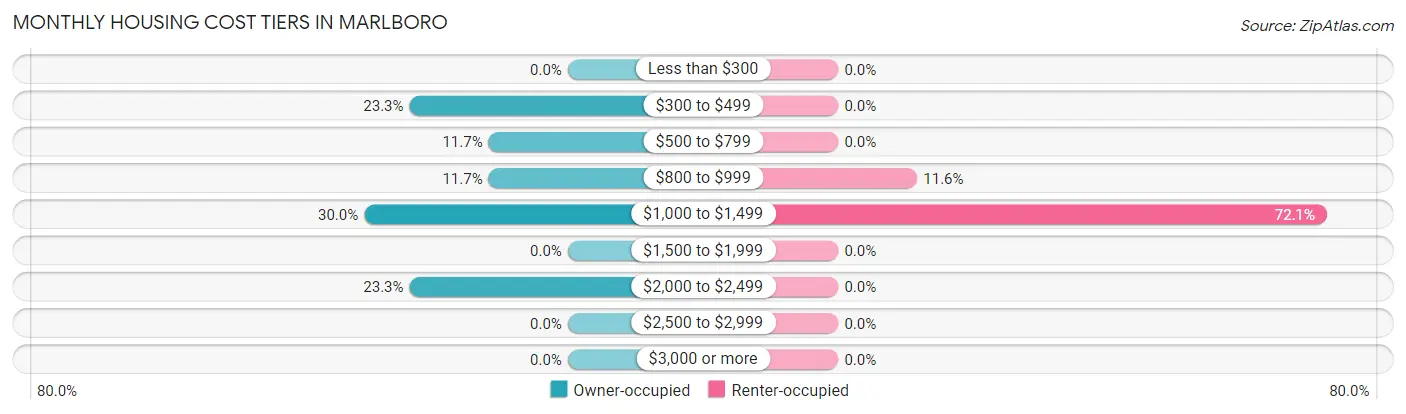
| Monthly Cost | Owner-occupied | Renter-occupied |
| Less than $300 | 0 (0.0%) | 0 (0.0%) |
| $300 to $499 | 14 (23.3%) | 0 (0.0%) |
| $500 to $799 | 7 (11.7%) | 0 (0.0%) |
| $800 to $999 | 7 (11.7%) | 5 (11.6%) |
| $1,000 to $1,499 | 18 (30.0%) | 31 (72.1%) |
| $1,500 to $1,999 | 0 (0.0%) | 0 (0.0%) |
| $2,000 to $2,499 | 14 (23.3%) | 0 (0.0%) |
| $2,500 to $2,999 | 0 (0.0%) | 0 (0.0%) |
| $3,000 or more | 0 (0.0%) | 0 (0.0%) |
| Total | 60 (100.0%) | 43 (100.0%) |
Physical Housing Characteristics in Marlboro
Housing Structures in Marlboro
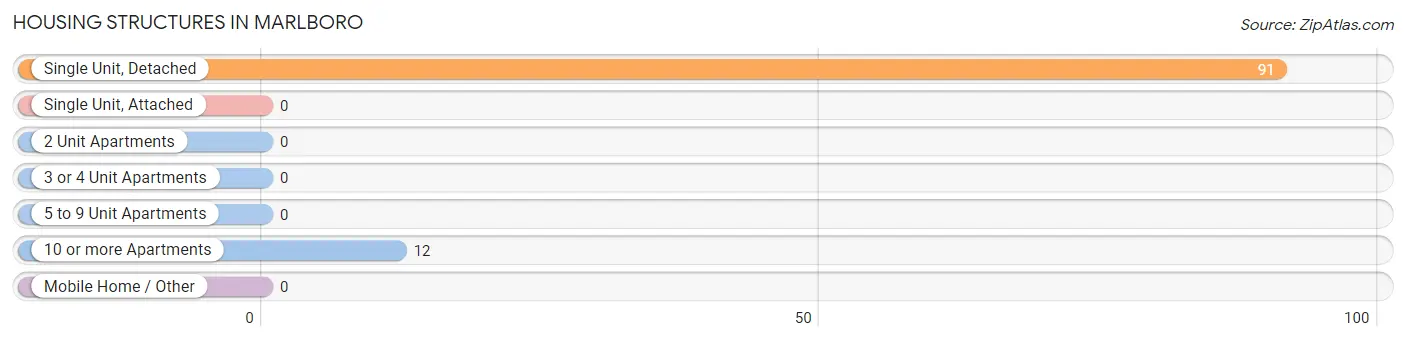
| Structure Type | # Housing Units | % Housing Units |
| Single Unit, Detached | 91 | 88.3% |
| Single Unit, Attached | 0 | 0.0% |
| 2 Unit Apartments | 0 | 0.0% |
| 3 or 4 Unit Apartments | 0 | 0.0% |
| 5 to 9 Unit Apartments | 0 | 0.0% |
| 10 or more Apartments | 12 | 11.7% |
| Mobile Home / Other | 0 | 0.0% |
| Total | 103 | 100.0% |
Housing Structures by Occupancy in Marlboro
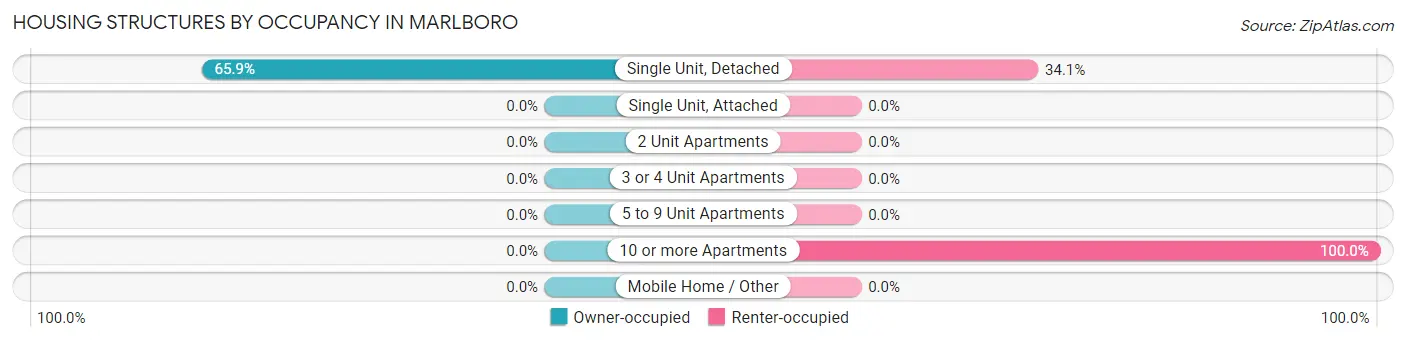
| Structure Type | Owner-occupied | Renter-occupied |
| Single Unit, Detached | 60 (65.9%) | 31 (34.1%) |
| Single Unit, Attached | 0 (0.0%) | 0 (0.0%) |
| 2 Unit Apartments | 0 (0.0%) | 0 (0.0%) |
| 3 or 4 Unit Apartments | 0 (0.0%) | 0 (0.0%) |
| 5 to 9 Unit Apartments | 0 (0.0%) | 0 (0.0%) |
| 10 or more Apartments | 0 (0.0%) | 12 (100.0%) |
| Mobile Home / Other | 0 (0.0%) | 0 (0.0%) |
| Total | 60 (58.3%) | 43 (41.7%) |
Housing Structures by Number of Rooms in Marlboro
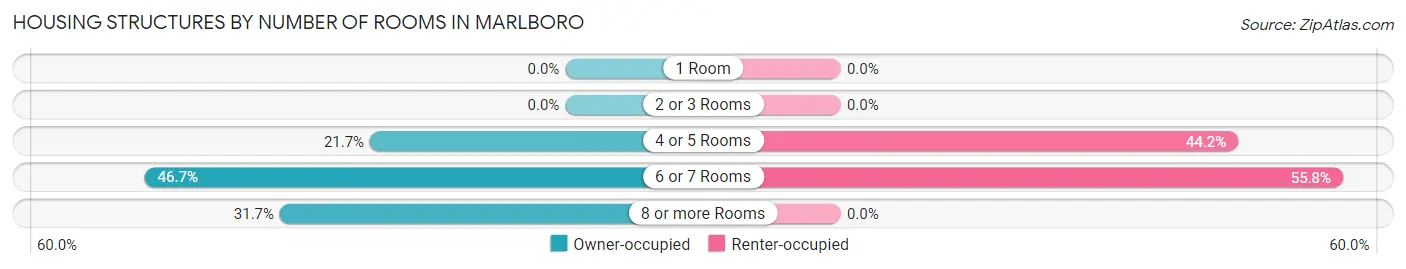
| Number of Rooms | Owner-occupied | Renter-occupied |
| 1 Room | 0 (0.0%) | 0 (0.0%) |
| 2 or 3 Rooms | 0 (0.0%) | 0 (0.0%) |
| 4 or 5 Rooms | 13 (21.7%) | 19 (44.2%) |
| 6 or 7 Rooms | 28 (46.7%) | 24 (55.8%) |
| 8 or more Rooms | 19 (31.7%) | 0 (0.0%) |
| Total | 60 (100.0%) | 43 (100.0%) |
Housing Structure by Heating Type in Marlboro
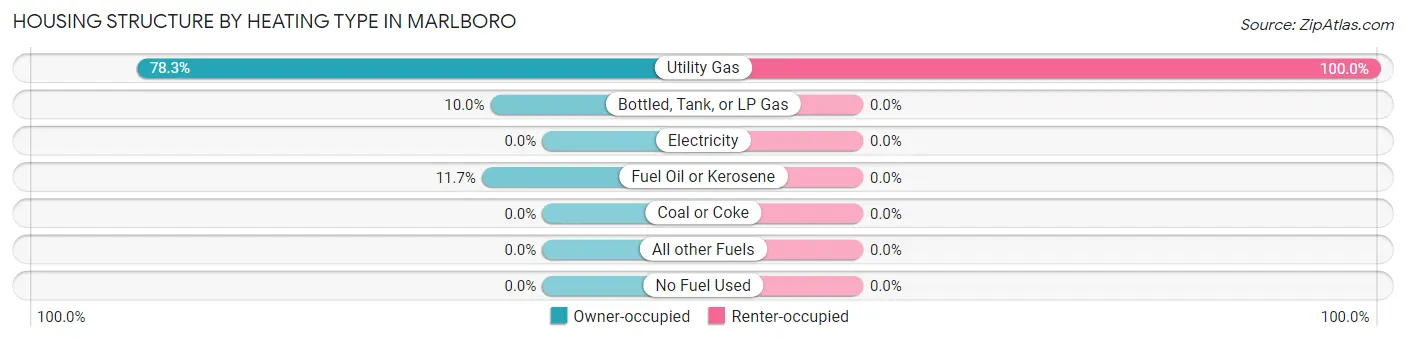
| Heating Type | Owner-occupied | Renter-occupied |
| Utility Gas | 47 (78.3%) | 43 (100.0%) |
| Bottled, Tank, or LP Gas | 6 (10.0%) | 0 (0.0%) |
| Electricity | 0 (0.0%) | 0 (0.0%) |
| Fuel Oil or Kerosene | 7 (11.7%) | 0 (0.0%) |
| Coal or Coke | 0 (0.0%) | 0 (0.0%) |
| All other Fuels | 0 (0.0%) | 0 (0.0%) |
| No Fuel Used | 0 (0.0%) | 0 (0.0%) |
| Total | 60 (100.0%) | 43 (100.0%) |
Household Vehicle Usage in Marlboro
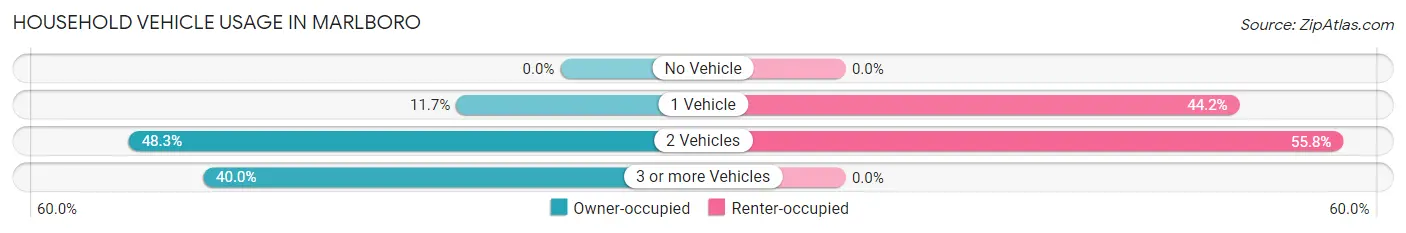
| Vehicles per Household | Owner-occupied | Renter-occupied |
| No Vehicle | 0 (0.0%) | 0 (0.0%) |
| 1 Vehicle | 7 (11.7%) | 19 (44.2%) |
| 2 Vehicles | 29 (48.3%) | 24 (55.8%) |
| 3 or more Vehicles | 24 (40.0%) | 0 (0.0%) |
| Total | 60 (100.0%) | 43 (100.0%) |
Real Estate & Mortgages in Marlboro
Real Estate and Mortgage Overview in Marlboro
| Characteristic | Without Mortgage | With Mortgage |
| Housing Units | 35 | 25 |
| Median Property Value | $110,400 | $251,900 |
| Median Household Income | - | - |
| Monthly Housing Costs | - | - |
| Real Estate Taxes | $883 | $0 |
Property Value by Mortgage Status in Marlboro
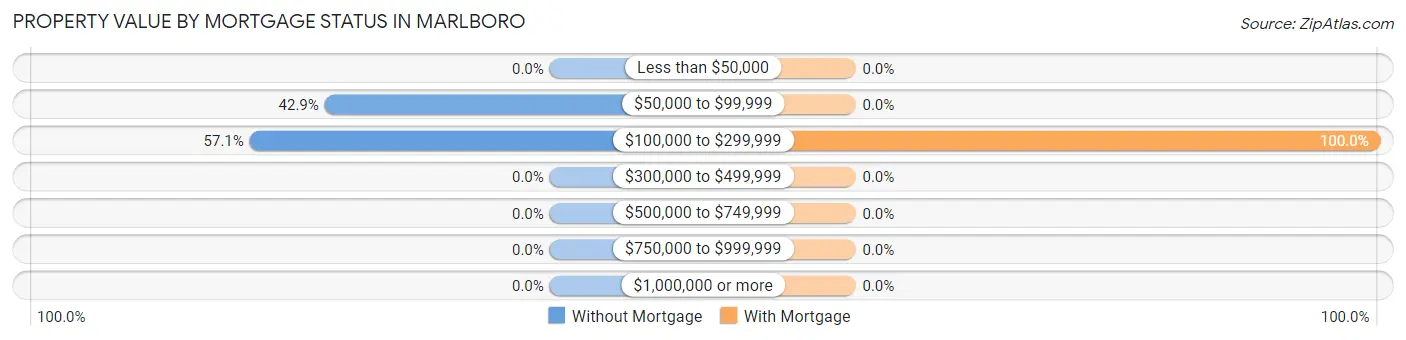
| Property Value | Without Mortgage | With Mortgage |
| Less than $50,000 | 0 (0.0%) | 0 (0.0%) |
| $50,000 to $99,999 | 15 (42.9%) | 0 (0.0%) |
| $100,000 to $299,999 | 20 (57.1%) | 25 (100.0%) |
| $300,000 to $499,999 | 0 (0.0%) | 0 (0.0%) |
| $500,000 to $749,999 | 0 (0.0%) | 0 (0.0%) |
| $750,000 to $999,999 | 0 (0.0%) | 0 (0.0%) |
| $1,000,000 or more | 0 (0.0%) | 0 (0.0%) |
| Total | 35 (100.0%) | 25 (100.0%) |
Household Income by Mortgage Status in Marlboro
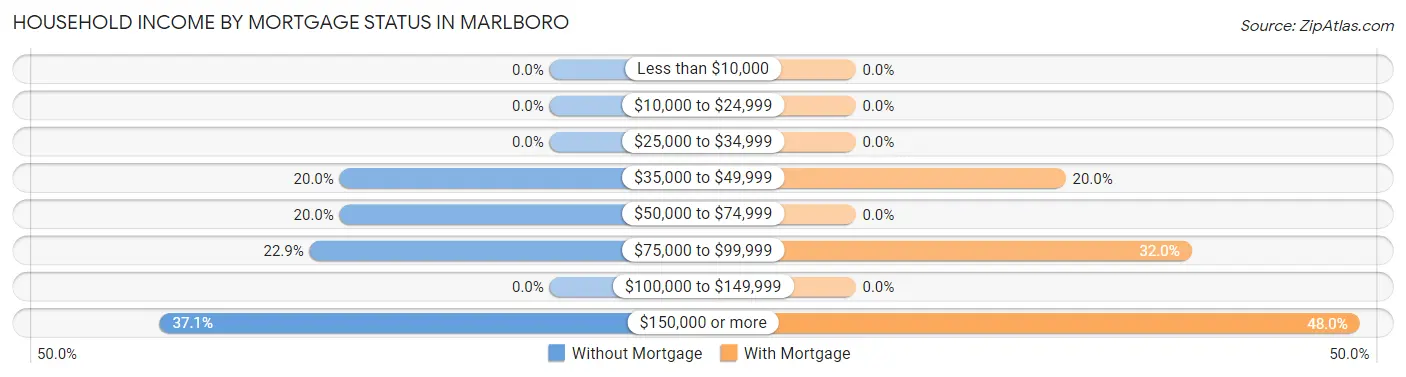
| Household Income | Without Mortgage | With Mortgage |
| Less than $10,000 | 0 (0.0%) | 0 (0.0%) |
| $10,000 to $24,999 | 0 (0.0%) | 0 (0.0%) |
| $25,000 to $34,999 | 0 (0.0%) | 0 (0.0%) |
| $35,000 to $49,999 | 7 (20.0%) | 5 (20.0%) |
| $50,000 to $74,999 | 7 (20.0%) | 0 (0.0%) |
| $75,000 to $99,999 | 8 (22.9%) | 8 (32.0%) |
| $100,000 to $149,999 | 0 (0.0%) | 0 (0.0%) |
| $150,000 or more | 13 (37.1%) | 12 (48.0%) |
| Total | 35 (100.0%) | 25 (100.0%) |
Property Value to Household Income Ratio in Marlboro
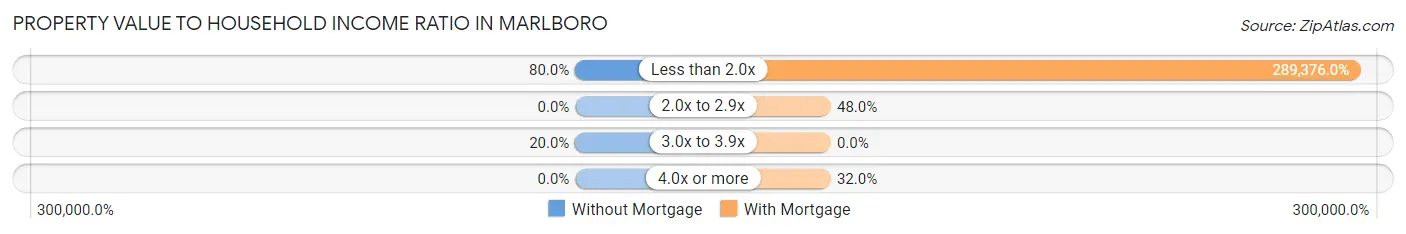
| Value-to-Income Ratio | Without Mortgage | With Mortgage |
| Less than 2.0x | 28 (80.0%) | 72,344 (289,376.0%) |
| 2.0x to 2.9x | 0 (0.0%) | 12 (48.0%) |
| 3.0x to 3.9x | 7 (20.0%) | 0 (0.0%) |
| 4.0x or more | 0 (0.0%) | 8 (32.0%) |
| Total | 35 (100.0%) | 25 (100.0%) |
Real Estate Taxes by Mortgage Status in Marlboro
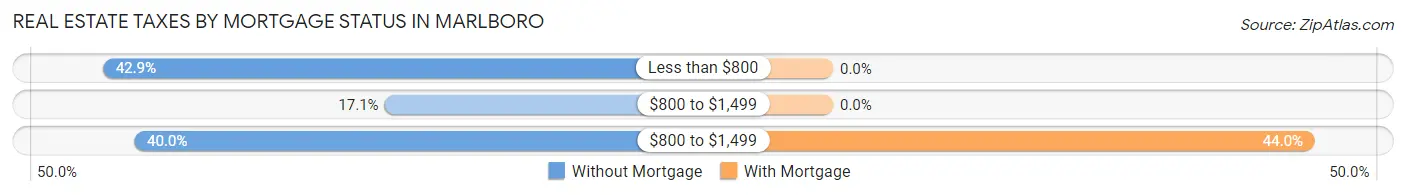
| Property Taxes | Without Mortgage | With Mortgage |
| Less than $800 | 15 (42.9%) | 0 (0.0%) |
| $800 to $1,499 | 6 (17.1%) | 0 (0.0%) |
| $800 to $1,499 | 14 (40.0%) | 11 (44.0%) |
| Total | 35 (100.0%) | 25 (100.0%) |
Health & Disability in Marlboro
Health Insurance Coverage by Age in Marlboro
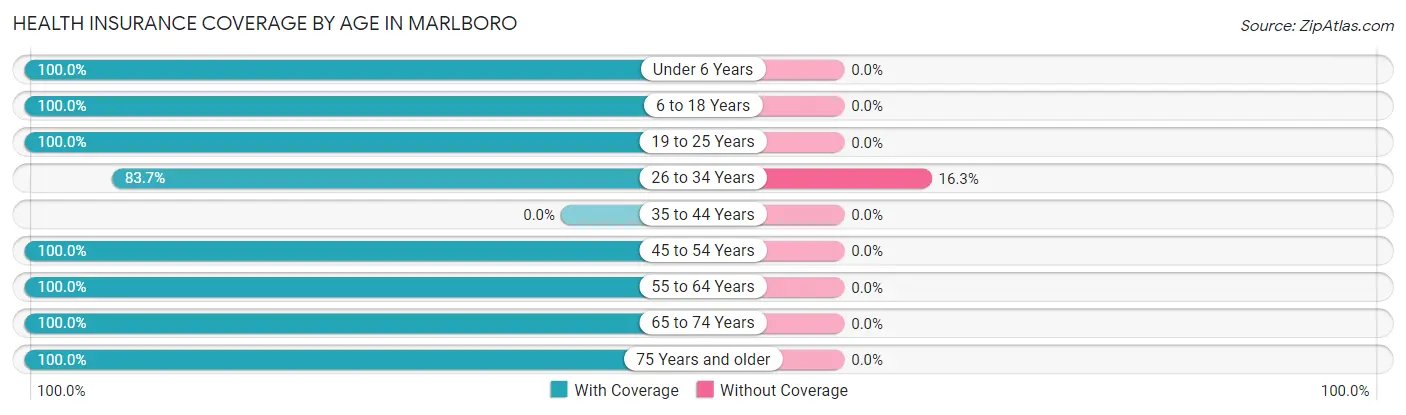
| Age Bracket | With Coverage | Without Coverage |
| Under 6 Years | 5 (100.0%) | 0 (0.0%) |
| 6 to 18 Years | 14 (100.0%) | 0 (0.0%) |
| 19 to 25 Years | 19 (100.0%) | 0 (0.0%) |
| 26 to 34 Years | 36 (83.7%) | 7 (16.3%) |
| 35 to 44 Years | 0 (0.0%) | 0 (0.0%) |
| 45 to 54 Years | 33 (100.0%) | 0 (0.0%) |
| 55 to 64 Years | 26 (100.0%) | 0 (0.0%) |
| 65 to 74 Years | 67 (100.0%) | 0 (0.0%) |
| 75 Years and older | 36 (100.0%) | 0 (0.0%) |
| Total | 236 (97.1%) | 7 (2.9%) |
Health Insurance Coverage by Citizenship Status in Marlboro
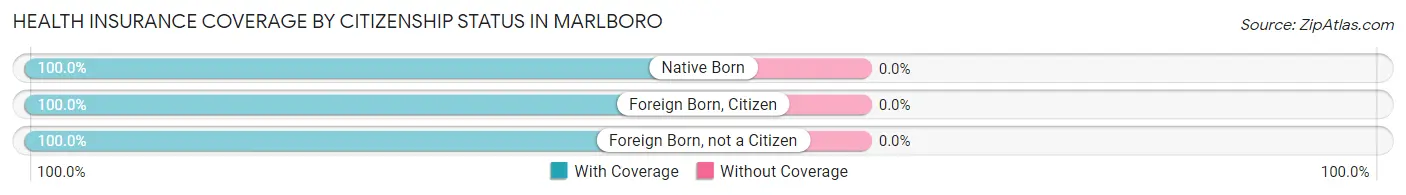
| Citizenship Status | With Coverage | Without Coverage |
| Native Born | 5 (100.0%) | 0 (0.0%) |
| Foreign Born, Citizen | 14 (100.0%) | 0 (0.0%) |
| Foreign Born, not a Citizen | 19 (100.0%) | 0 (0.0%) |
Health Insurance Coverage by Household Income in Marlboro
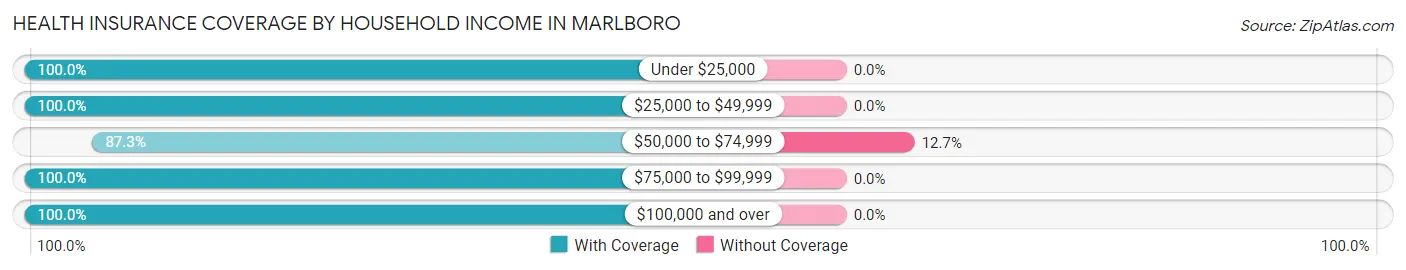
| Household Income | With Coverage | Without Coverage |
| Under $25,000 | 37 (100.0%) | 0 (0.0%) |
| $25,000 to $49,999 | 28 (100.0%) | 0 (0.0%) |
| $50,000 to $74,999 | 48 (87.3%) | 7 (12.7%) |
| $75,000 to $99,999 | 59 (100.0%) | 0 (0.0%) |
| $100,000 and over | 64 (100.0%) | 0 (0.0%) |
Public vs Private Health Insurance Coverage by Age in Marlboro
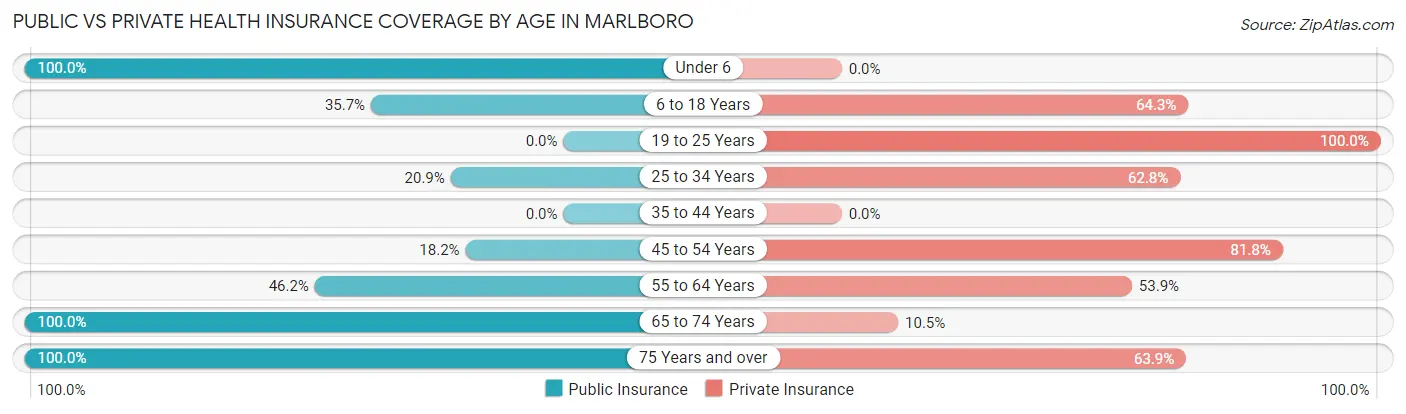
| Age Bracket | Public Insurance | Private Insurance |
| Under 6 | 5 (100.0%) | 0 (0.0%) |
| 6 to 18 Years | 5 (35.7%) | 9 (64.3%) |
| 19 to 25 Years | 0 (0.0%) | 19 (100.0%) |
| 25 to 34 Years | 9 (20.9%) | 27 (62.8%) |
| 35 to 44 Years | 0 (0.0%) | 0 (0.0%) |
| 45 to 54 Years | 6 (18.2%) | 27 (81.8%) |
| 55 to 64 Years | 12 (46.2%) | 14 (53.8%) |
| 65 to 74 Years | 67 (100.0%) | 7 (10.4%) |
| 75 Years and over | 36 (100.0%) | 23 (63.9%) |
| Total | 140 (57.6%) | 126 (51.8%) |
Disability Status by Sex by Age in Marlboro
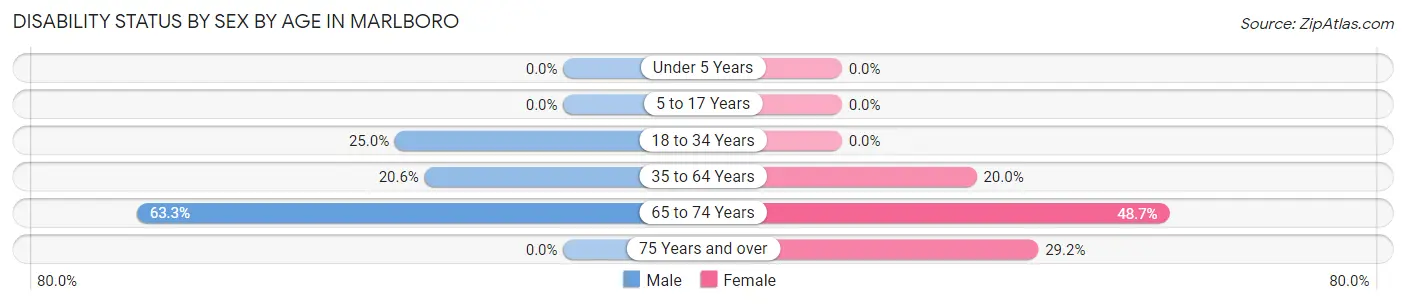
| Age Bracket | Male | Female |
| Under 5 Years | 0 (0.0%) | 0 (0.0%) |
| 5 to 17 Years | 0 (0.0%) | 0 (0.0%) |
| 18 to 34 Years | 9 (25.0%) | 0 (0.0%) |
| 35 to 64 Years | 7 (20.6%) | 5 (20.0%) |
| 65 to 74 Years | 19 (63.3%) | 18 (48.6%) |
| 75 Years and over | 0 (0.0%) | 7 (29.2%) |
Disability Class by Sex by Age in Marlboro
Disability Class: Hearing Difficulty
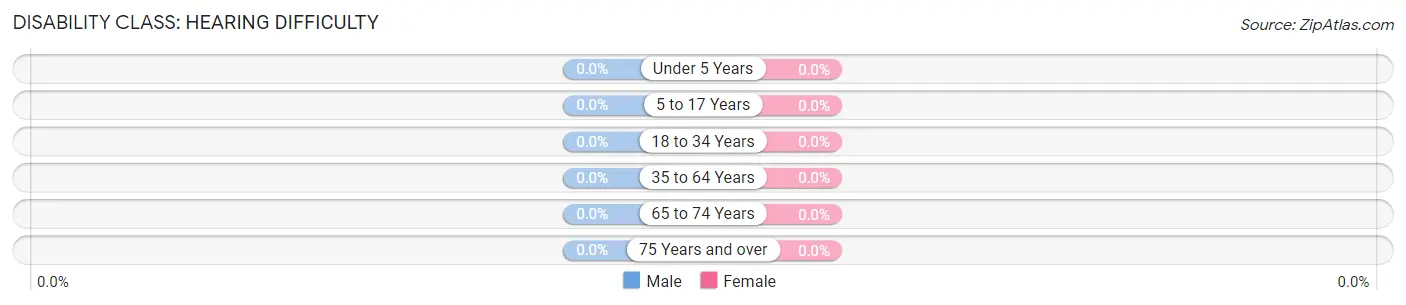
| Age Bracket | Male | Female |
| Under 5 Years | 0 (0.0%) | 0 (0.0%) |
| 5 to 17 Years | 0 (0.0%) | 0 (0.0%) |
| 18 to 34 Years | 0 (0.0%) | 0 (0.0%) |
| 35 to 64 Years | 0 (0.0%) | 0 (0.0%) |
| 65 to 74 Years | 0 (0.0%) | 0 (0.0%) |
| 75 Years and over | 0 (0.0%) | 0 (0.0%) |
Disability Class: Vision Difficulty
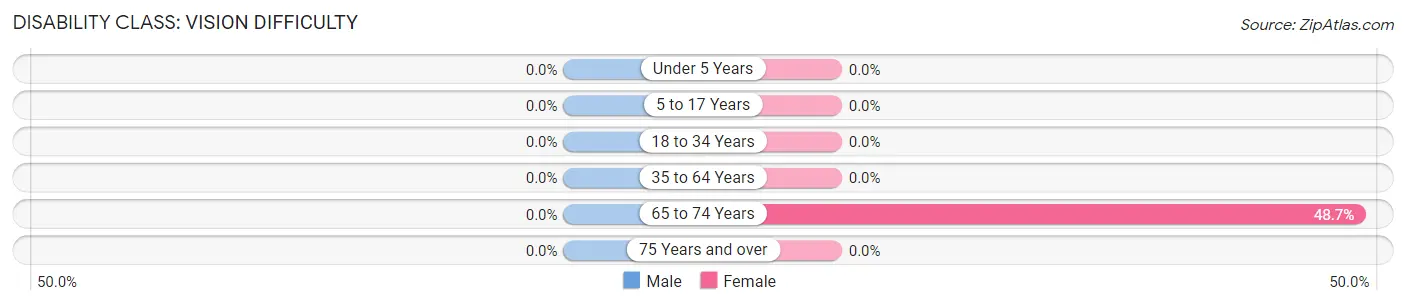
| Age Bracket | Male | Female |
| Under 5 Years | 0 (0.0%) | 0 (0.0%) |
| 5 to 17 Years | 0 (0.0%) | 0 (0.0%) |
| 18 to 34 Years | 0 (0.0%) | 0 (0.0%) |
| 35 to 64 Years | 0 (0.0%) | 0 (0.0%) |
| 65 to 74 Years | 0 (0.0%) | 18 (48.6%) |
| 75 Years and over | 0 (0.0%) | 0 (0.0%) |
Disability Class: Cognitive Difficulty
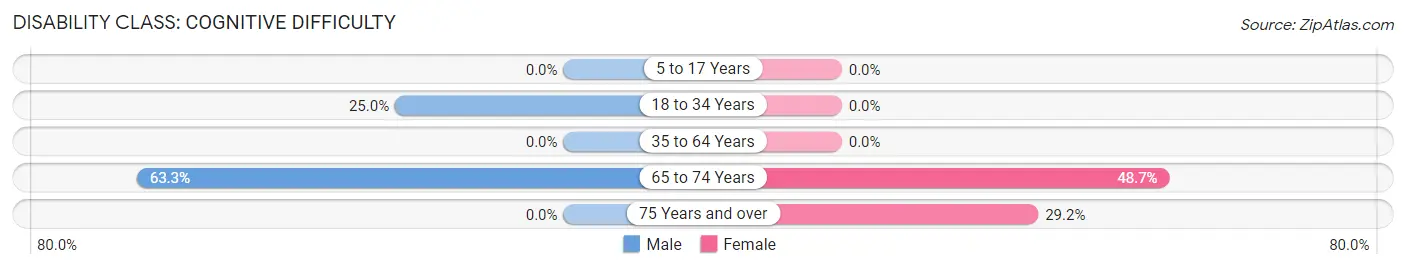
| Age Bracket | Male | Female |
| 5 to 17 Years | 0 (0.0%) | 0 (0.0%) |
| 18 to 34 Years | 9 (25.0%) | 0 (0.0%) |
| 35 to 64 Years | 0 (0.0%) | 0 (0.0%) |
| 65 to 74 Years | 19 (63.3%) | 18 (48.6%) |
| 75 Years and over | 0 (0.0%) | 7 (29.2%) |
Disability Class: Ambulatory Difficulty
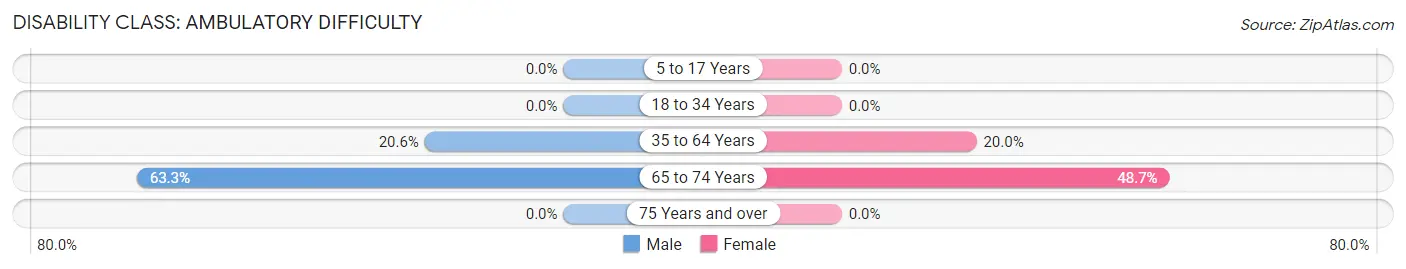
| Age Bracket | Male | Female |
| 5 to 17 Years | 0 (0.0%) | 0 (0.0%) |
| 18 to 34 Years | 0 (0.0%) | 0 (0.0%) |
| 35 to 64 Years | 7 (20.6%) | 5 (20.0%) |
| 65 to 74 Years | 19 (63.3%) | 18 (48.6%) |
| 75 Years and over | 0 (0.0%) | 0 (0.0%) |
Disability Class: Self-Care Difficulty
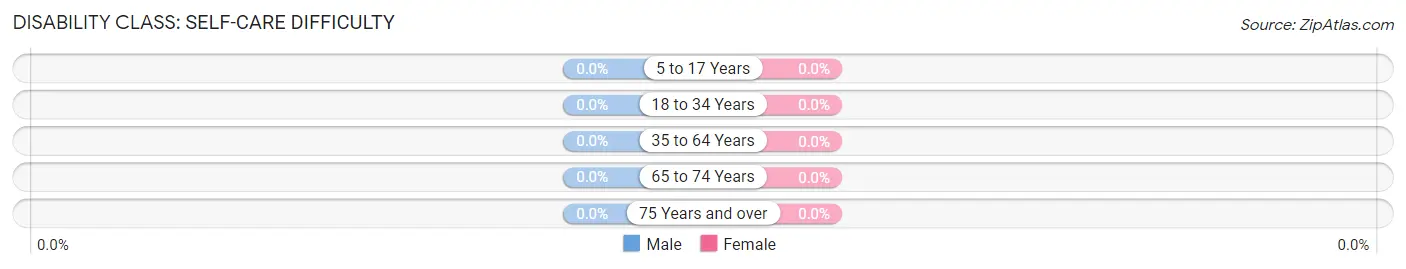
| Age Bracket | Male | Female |
| 5 to 17 Years | 0 (0.0%) | 0 (0.0%) |
| 18 to 34 Years | 0 (0.0%) | 0 (0.0%) |
| 35 to 64 Years | 0 (0.0%) | 0 (0.0%) |
| 65 to 74 Years | 0 (0.0%) | 0 (0.0%) |
| 75 Years and over | 0 (0.0%) | 0 (0.0%) |
Technology Access in Marlboro
Computing Device Access in Marlboro
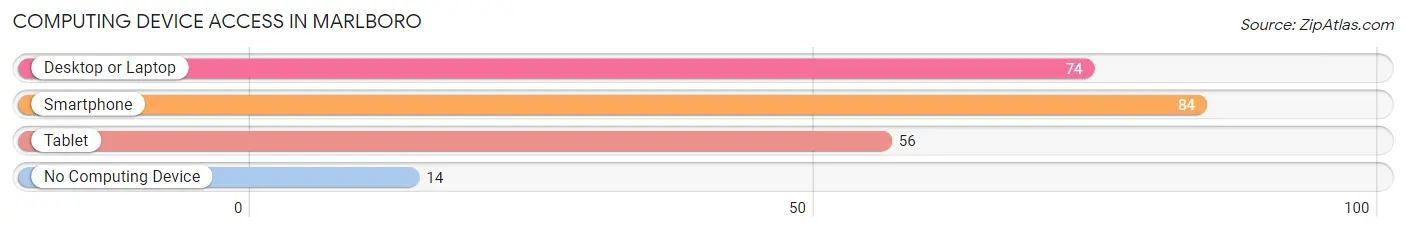
| Device Type | # Households | % Households |
| Desktop or Laptop | 74 | 71.8% |
| Smartphone | 84 | 81.6% |
| Tablet | 56 | 54.4% |
| No Computing Device | 14 | 13.6% |
| Total | 103 | 100.0% |
Internet Access in Marlboro
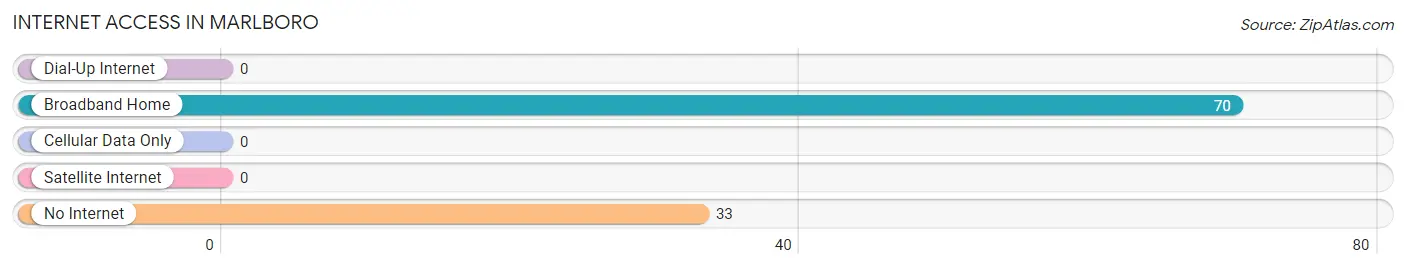
| Internet Type | # Households | % Households |
| Dial-Up Internet | 0 | 0.0% |
| Broadband Home | 70 | 68.0% |
| Cellular Data Only | 0 | 0.0% |
| Satellite Internet | 0 | 0.0% |
| No Internet | 33 | 32.0% |
| Total | 103 | 100.0% |
Marlboro Summary
Marlboro, Ohio is a small village located in Stark County, Ohio. It is situated in the northeastern part of the state, approximately 25 miles south of Akron and 40 miles north of Canton. The village is bordered by the townships of Marlboro, Nimishillen, and Osnaburg. The population of Marlboro was 1,845 in the 2010 census.
Geography
Marlboro is located at 40°48'N 81°20'W (40.8, -81.3). The village is situated in the northeastern part of Stark County, Ohio, approximately 25 miles south of Akron and 40 miles north of Canton. The village is bordered by the townships of Marlboro, Nimishillen, and Osnaburg. The total area of the village is 1.2 square miles, all of which is land.
The village is located in the Appalachian Plateau region of Ohio. The terrain is generally flat with some rolling hills. The village is located in the watershed of the Tuscarawas River. The climate is humid continental, with hot summers and cold winters.
History
Marlboro was founded in 1817 by a group of settlers from Pennsylvania. The village was named after Marlborough Township in Pennsylvania. The first post office was established in 1820. The village was incorporated in 1867.
The village was a farming community until the late 19th century, when the railroad was built through the area. This allowed for the development of industry and commerce in the village. The village was home to several factories, including a brickyard, a sawmill, and a flour mill.
Economy
Marlboro is a small village with a population of 1,845 in the 2010 census. The village is primarily a residential community, with most of the population employed in the service sector. The village is home to several small businesses, including a grocery store, a hardware store, and a few restaurants.
The village is also home to several manufacturing companies, including a plastics manufacturer, a metal fabricator, and a machine shop. The village is also home to a few small farms.
Demographics
Marlboro is a predominantly white village, with a population of 1,845 in the 2010 census. The racial makeup of the village was 97.3% White, 0.7% African American, 0.2% Native American, 0.2% Asian, 0.2% from other races, and 1.4% from two or more races. Hispanic or Latino of any race were 0.7% of the population.
The median household income in Marlboro was $45,938 in the 2010 census. The per capita income was $20,945. The median age of the village was 43.3 years. The village had a poverty rate of 8.3%.
Conclusion
Marlboro, Ohio is a small village located in Stark County, Ohio. It is situated in the northeastern part of the state, approximately 25 miles south of Akron and 40 miles north of Canton. The village is bordered by the townships of Marlboro, Nimishillen, and Osnaburg. The population of Marlboro was 1,845 in the 2010 census. The village is primarily a residential community, with most of the population employed in the service sector. The village is also home to several manufacturing companies, including a plastics manufacturer, a metal fabricator, and a machine shop. The village is predominantly white, with a median household income of $45,938 in the 2010 census. The village had a poverty rate of 8.3%.
Common Questions
What is Per Capita Income in Marlboro?
Per Capita income in Marlboro is $36,458.
What is the Median Family Income in Marlboro?
Median Family Income in Marlboro is $88,750.
What is the Median Household income in Marlboro?
Median Household Income in Marlboro is $72,031.
What is Income or Wage Gap in Marlboro?
Income or Wage Gap in Marlboro is 48.0%.
Women in Marlboro earn 52.0 cents for every dollar earned by a man.
What is Inequality or Gini Index in Marlboro?
Inequality or Gini Index in Marlboro is 0.39.
What is the Total Population of Marlboro?
Total Population of Marlboro is 243.
What is the Total Male Population of Marlboro?
Total Male Population of Marlboro is 117.
What is the Total Female Population of Marlboro?
Total Female Population of Marlboro is 126.
What is the Ratio of Males per 100 Females in Marlboro?
There are 92.86 Males per 100 Females in Marlboro.
What is the Ratio of Females per 100 Males in Marlboro?
There are 107.69 Females per 100 Males in Marlboro.
What is the Median Population Age in Marlboro?
Median Population Age in Marlboro is 62.1 Years.
What is the Average Family Size in Marlboro
Average Family Size in Marlboro is 2.5 People.
What is the Average Household Size in Marlboro
Average Household Size in Marlboro is 2.4 People.
How Large is the Labor Force in Marlboro?
There are 129 People in the Labor Forcein in Marlboro.
What is the Percentage of People in the Labor Force in Marlboro?
57.6% of People are in the Labor Force in Marlboro.