Orwell, OH Map & Demographics
Orwell Map
Orwell Overview
$21,837
PER CAPITA INCOME
$55,109
AVG FAMILY INCOME
$42,063
AVG HOUSEHOLD INCOME
19.3%
WAGE / INCOME GAP [ % ]
80.7¢/ $1
WAGE / INCOME GAP [ $ ]
$6,855
FAMILY INCOME DEFICIT
0.44
INEQUALITY / GINI INDEX
1,804
TOTAL POPULATION
893
MALE POPULATION
911
FEMALE POPULATION
98.02
MALES / 100 FEMALES
102.02
FEMALES / 100 MALES
34.3
MEDIAN AGE
3.3
AVG FAMILY SIZE
2.5
AVG HOUSEHOLD SIZE
874
LABOR FORCE [ PEOPLE ]
62.2%
PERCENT IN LABOR FORCE
7.0%
UNEMPLOYMENT RATE
Orwell Zip Codes
Orwell Area Codes
Income in Orwell
Income Overview in Orwell
Per Capita Income in Orwell is $21,837, while median incomes of families and households are $55,109 and $42,063 respectively.
| Characteristic | Number | Measure |
| Per Capita Income | 1,804 | $21,837 |
| Median Family Income | 398 | $55,109 |
| Mean Family Income | 398 | $62,879 |
| Median Household Income | 689 | $42,063 |
| Mean Household Income | 689 | $53,756 |
| Income Deficit | 398 | $6,855 |
| Wage / Income Gap (%) | 1,804 | 19.28% |
| Wage / Income Gap ($) | 1,804 | 80.72¢ per $1 |
| Gini / Inequality Index | 1,804 | 0.44 |
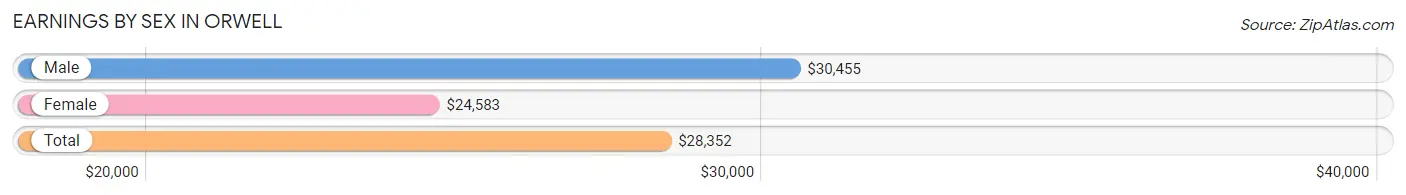
Earnings by Sex in Orwell
Average Earnings in Orwell are $28,352, $30,455 for men and $24,583 for women, a difference of 19.3%.
| Sex | Number | Average Earnings |
| Male | 480 (53.0%) | $30,455 |
| Female | 426 (47.0%) | $24,583 |
| Total | 906 (100.0%) | $28,352 |
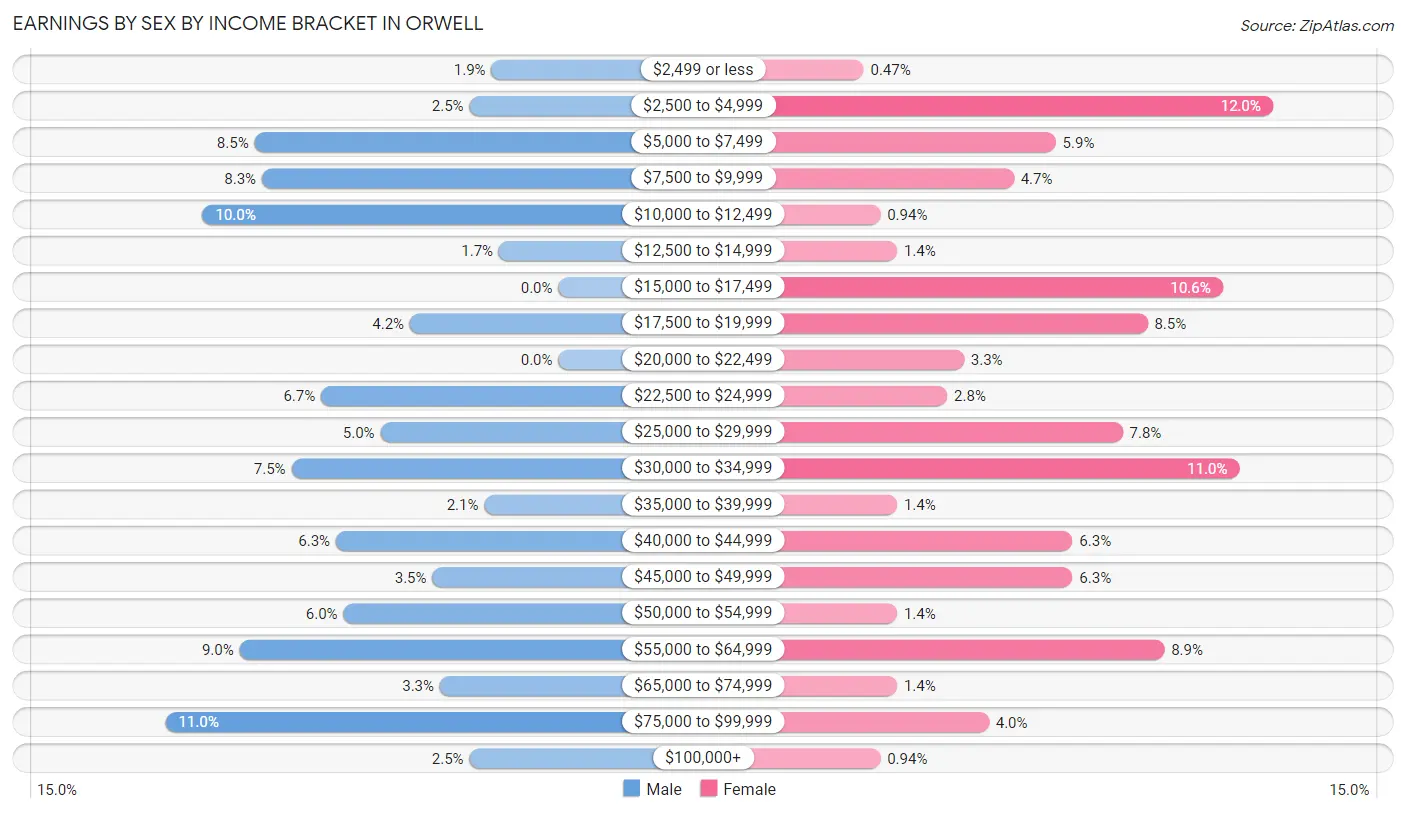
Earnings by Sex by Income Bracket in Orwell
The most common earnings brackets in Orwell are $75,000 to $99,999 for men (53 | 11.0%) and $2,500 to $4,999 for women (51 | 12.0%).
| Income | Male | Female |
| $2,499 or less | 9 (1.9%) | 2 (0.5%) |
| $2,500 to $4,999 | 12 (2.5%) | 51 (12.0%) |
| $5,000 to $7,499 | 41 (8.5%) | 25 (5.9%) |
| $7,500 to $9,999 | 40 (8.3%) | 20 (4.7%) |
| $10,000 to $12,499 | 48 (10.0%) | 4 (0.9%) |
| $12,500 to $14,999 | 8 (1.7%) | 6 (1.4%) |
| $15,000 to $17,499 | 0 (0.0%) | 45 (10.6%) |
| $17,500 to $19,999 | 20 (4.2%) | 36 (8.5%) |
| $20,000 to $22,499 | 0 (0.0%) | 14 (3.3%) |
| $22,500 to $24,999 | 32 (6.7%) | 12 (2.8%) |
| $25,000 to $29,999 | 24 (5.0%) | 33 (7.7%) |
| $30,000 to $34,999 | 36 (7.5%) | 47 (11.0%) |
| $35,000 to $39,999 | 10 (2.1%) | 6 (1.4%) |
| $40,000 to $44,999 | 30 (6.2%) | 27 (6.3%) |
| $45,000 to $49,999 | 17 (3.5%) | 27 (6.3%) |
| $50,000 to $54,999 | 29 (6.0%) | 6 (1.4%) |
| $55,000 to $64,999 | 43 (9.0%) | 38 (8.9%) |
| $65,000 to $74,999 | 16 (3.3%) | 6 (1.4%) |
| $75,000 to $99,999 | 53 (11.0%) | 17 (4.0%) |
| $100,000+ | 12 (2.5%) | 4 (0.9%) |
| Total | 480 (100.0%) | 426 (100.0%) |
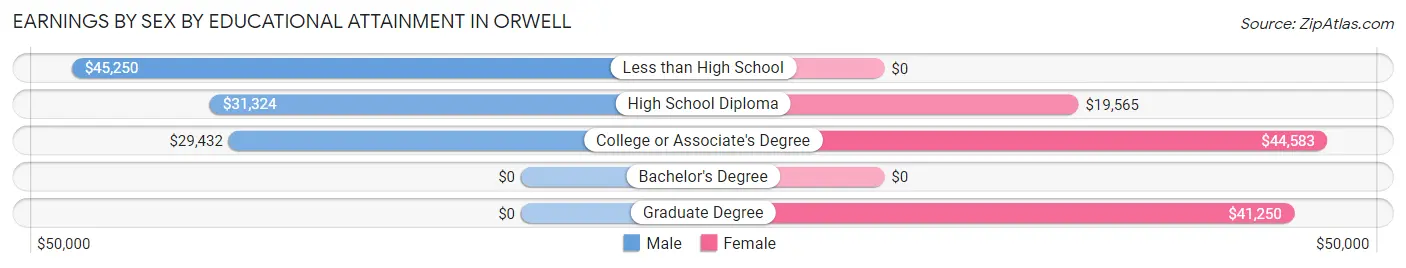
Earnings by Sex by Educational Attainment in Orwell
Average earnings in Orwell are $32,424 for men and $30,230 for women, a difference of 6.8%. Men with an educational attainment of less than high school enjoy the highest average annual earnings of $45,250, while those with college or associate's degree education earn the least with $29,432. Women with an educational attainment of college or associate's degree earn the most with the average annual earnings of $44,583, while those with high school diploma education have the smallest earnings of $19,565.
| Educational Attainment | Male Income | Female Income |
| Less than High School | $45,250 | $0 |
| High School Diploma | $31,324 | $19,565 |
| College or Associate's Degree | $29,432 | $44,583 |
| Bachelor's Degree | - | - |
| Graduate Degree | - | - |
| Total | $32,424 | $30,230 |
Family Income in Orwell
Family Income Brackets in Orwell
According to the Orwell family income data, there are 77 families falling into the $50,000 to $74,999 income range, which is the most common income bracket and makes up 19.4% of all families.
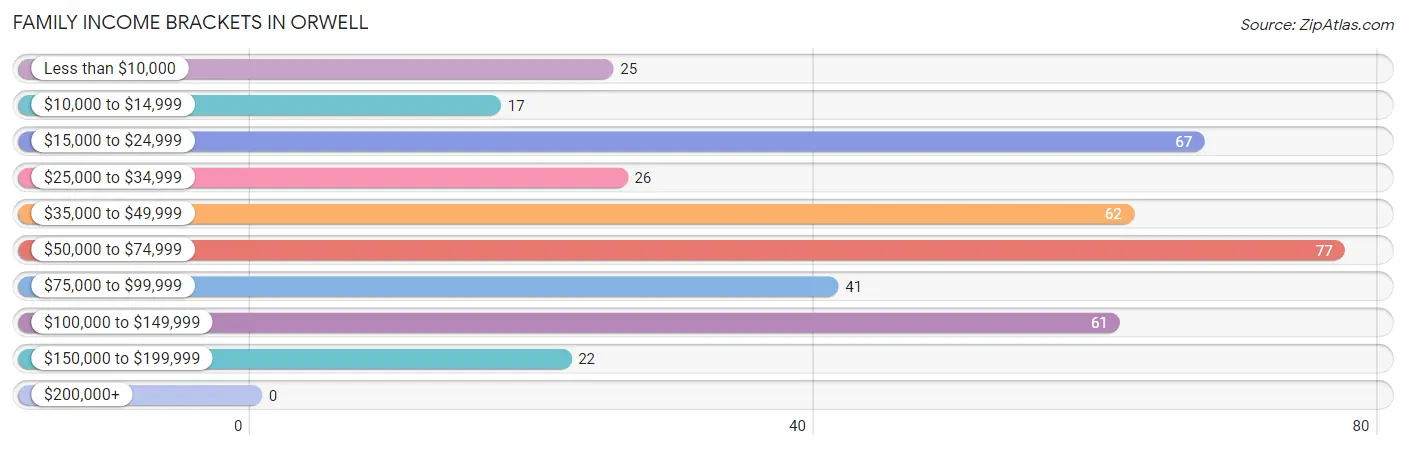
| Income Bracket | # Families | % Families |
| Less than $10,000 | 25 | 6.3% |
| $10,000 to $14,999 | 17 | 4.3% |
| $15,000 to $24,999 | 67 | 16.8% |
| $25,000 to $34,999 | 26 | 6.5% |
| $35,000 to $49,999 | 62 | 15.6% |
| $50,000 to $74,999 | 77 | 19.3% |
| $75,000 to $99,999 | 41 | 10.3% |
| $100,000 to $149,999 | 61 | 15.3% |
| $150,000 to $199,999 | 22 | 5.5% |
| $200,000+ | 0 | 0.0% |
Family Income by Famaliy Size in Orwell
5-person families (37 | 9.3%) account for the highest median family income in Orwell with $93,083 per family, while 4-person families (68 | 17.1%) have the highest median income of $19,688 per family member.
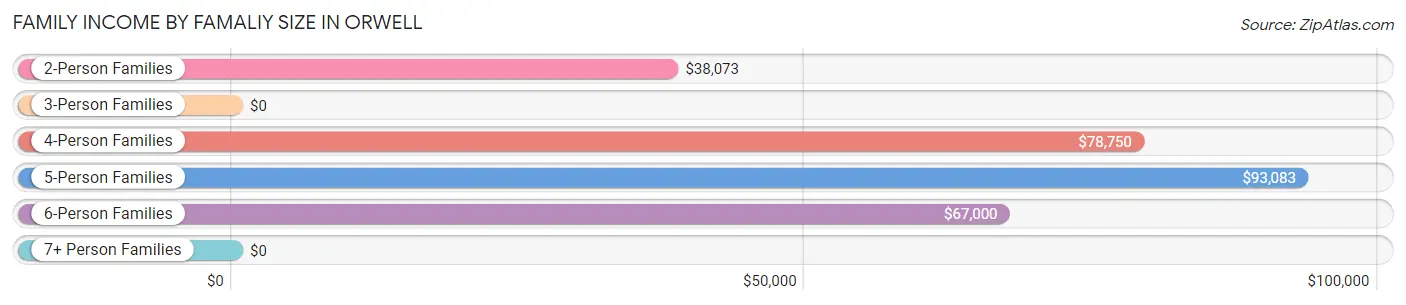
| Income Bracket | # Families | Median Income |
| 2-Person Families | 223 (56.0%) | $38,073 |
| 3-Person Families | 47 (11.8%) | $0 |
| 4-Person Families | 68 (17.1%) | $78,750 |
| 5-Person Families | 37 (9.3%) | $93,083 |
| 6-Person Families | 22 (5.5%) | $67,000 |
| 7+ Person Families | 1 (0.3%) | $0 |
| Total | 398 (100.0%) | $55,109 |
Family Income by Number of Earners in Orwell
The median family income in Orwell is $55,109, with families comprising 3+ earners (63) having the highest median family income of $93,583, while families with no earners (82) have the lowest median family income of $18,750, accounting for 15.8% and 20.6% of families, respectively.
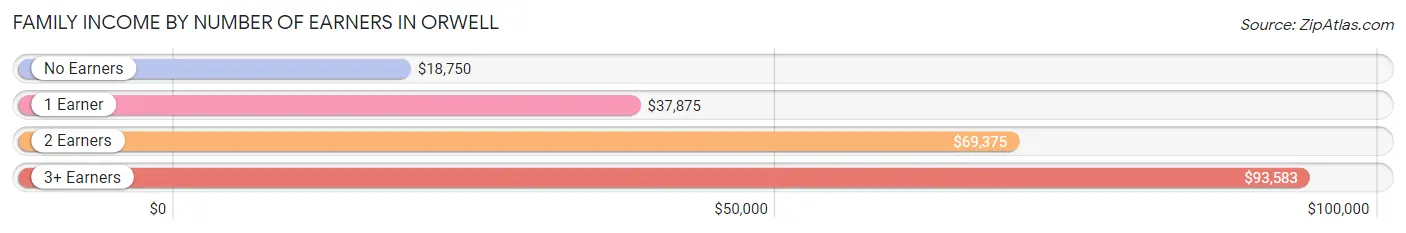
| Number of Earners | # Families | Median Income |
| No Earners | 82 (20.6%) | $18,750 |
| 1 Earner | 131 (32.9%) | $37,875 |
| 2 Earners | 122 (30.6%) | $69,375 |
| 3+ Earners | 63 (15.8%) | $93,583 |
| Total | 398 (100.0%) | $55,109 |
Household Income in Orwell
Household Income Brackets in Orwell
With 137 households falling in the category, the $50,000 to $74,999 income range is the most frequent in Orwell, accounting for 19.9% of all households. In contrast, only 3 households (0.4%) fall into the $200,000+ income bracket, making it the least populous group.
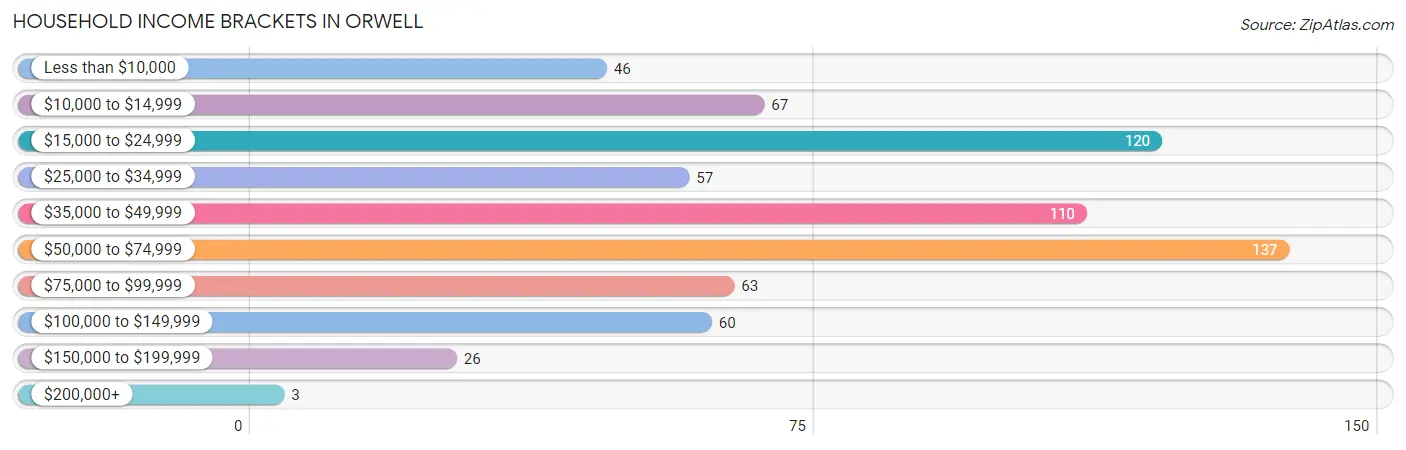
| Income Bracket | # Households | % Households |
| Less than $10,000 | 46 | 6.7% |
| $10,000 to $14,999 | 67 | 9.7% |
| $15,000 to $24,999 | 120 | 17.4% |
| $25,000 to $34,999 | 57 | 8.3% |
| $35,000 to $49,999 | 110 | 16.0% |
| $50,000 to $74,999 | 137 | 19.9% |
| $75,000 to $99,999 | 63 | 9.1% |
| $100,000 to $149,999 | 60 | 8.7% |
| $150,000 to $199,999 | 26 | 3.8% |
| $200,000+ | 3 | 0.4% |
Household Income by Householder Age in Orwell
The median household income in Orwell is $42,063, with the highest median household income of $50,455 found in the 45 to 64 years age bracket for the primary householder. A total of 248 households (36.0%) fall into this category. Meanwhile, the 15 to 24 years age bracket for the primary householder has the lowest median household income of $0, with 29 households (4.2%) in this group.
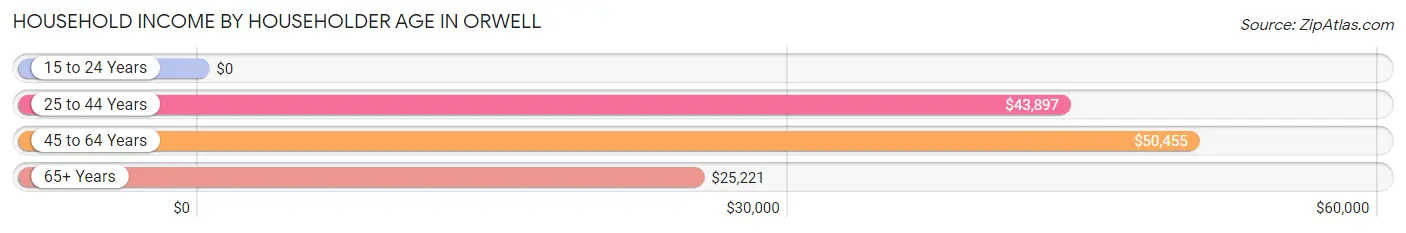
| Income Bracket | # Households | Median Income |
| 15 to 24 Years | 29 (4.2%) | $0 |
| 25 to 44 Years | 253 (36.7%) | $43,897 |
| 45 to 64 Years | 248 (36.0%) | $50,455 |
| 65+ Years | 159 (23.1%) | $25,221 |
| Total | 689 (100.0%) | $42,063 |
Poverty in Orwell
Income Below Poverty by Sex and Age in Orwell
With 25.8% poverty level for males and 24.7% for females among the residents of Orwell, 5 year old males and 35 to 44 year old females are the most vulnerable to poverty, with 4 males (100.0%) and 70 females (52.2%) in their respective age groups living below the poverty level.
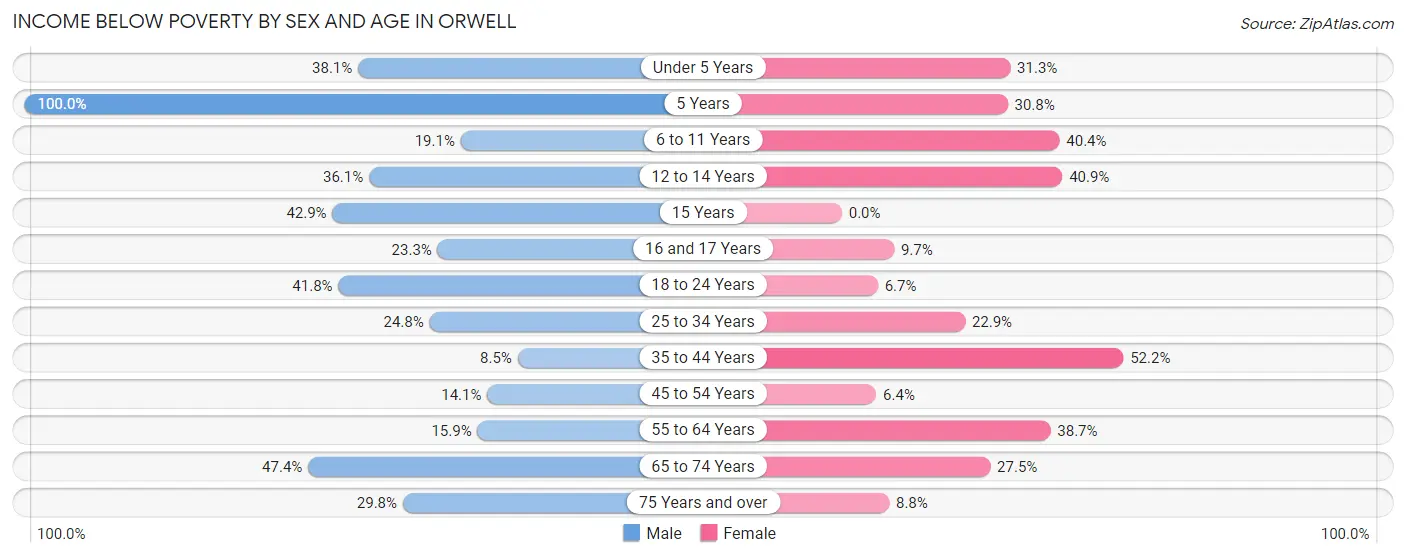
| Age Bracket | Male | Female |
| Under 5 Years | 24 (38.1%) | 10 (31.2%) |
| 5 Years | 4 (100.0%) | 4 (30.8%) |
| 6 to 11 Years | 16 (19.1%) | 21 (40.4%) |
| 12 to 14 Years | 22 (36.1%) | 9 (40.9%) |
| 15 Years | 3 (42.9%) | 0 (0.0%) |
| 16 and 17 Years | 7 (23.3%) | 3 (9.7%) |
| 18 to 24 Years | 43 (41.7%) | 5 (6.7%) |
| 25 to 34 Years | 39 (24.8%) | 32 (22.9%) |
| 35 to 44 Years | 10 (8.5%) | 70 (52.2%) |
| 45 to 54 Years | 12 (14.1%) | 9 (6.4%) |
| 55 to 64 Years | 11 (15.9%) | 24 (38.7%) |
| 65 to 74 Years | 18 (47.4%) | 19 (27.5%) |
| 75 Years and over | 14 (29.8%) | 5 (8.8%) |
| Total | 223 (25.8%) | 211 (24.7%) |
Income Above Poverty by Sex and Age in Orwell
According to the poverty statistics in Orwell, males aged 35 to 44 years and females aged 15 years are the age groups that are most secure financially, with 91.5% of males and 100.0% of females in these age groups living above the poverty line.
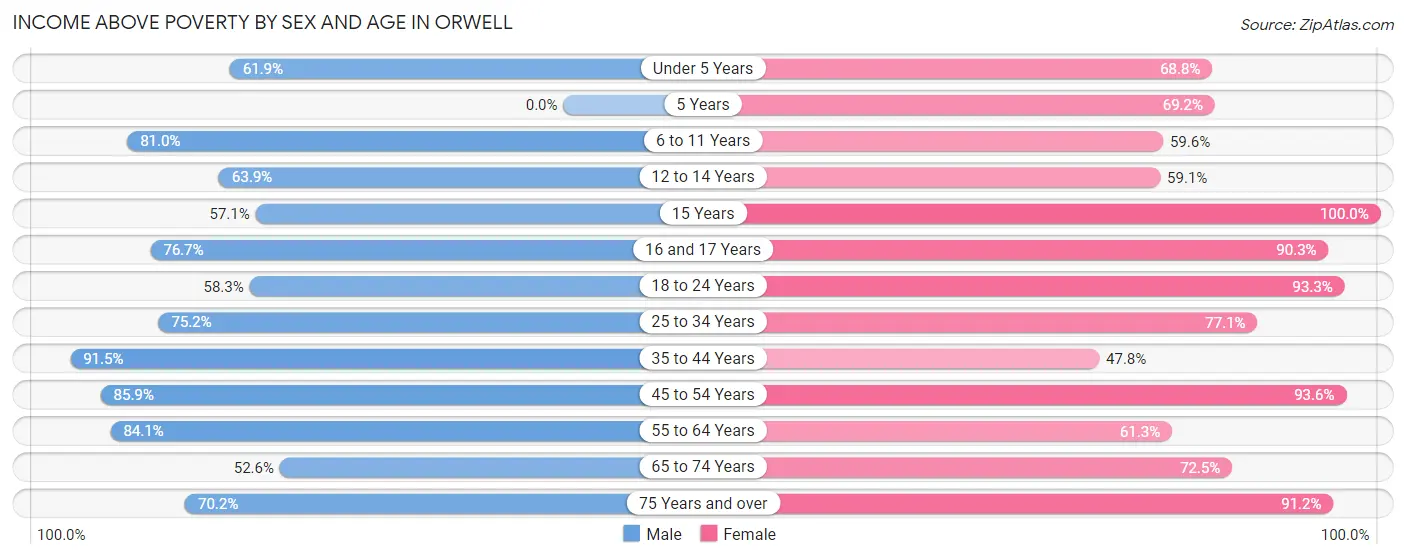
| Age Bracket | Male | Female |
| Under 5 Years | 39 (61.9%) | 22 (68.8%) |
| 5 Years | 0 (0.0%) | 9 (69.2%) |
| 6 to 11 Years | 68 (80.9%) | 31 (59.6%) |
| 12 to 14 Years | 39 (63.9%) | 13 (59.1%) |
| 15 Years | 4 (57.1%) | 26 (100.0%) |
| 16 and 17 Years | 23 (76.7%) | 28 (90.3%) |
| 18 to 24 Years | 60 (58.3%) | 70 (93.3%) |
| 25 to 34 Years | 118 (75.2%) | 108 (77.1%) |
| 35 to 44 Years | 108 (91.5%) | 64 (47.8%) |
| 45 to 54 Years | 73 (85.9%) | 132 (93.6%) |
| 55 to 64 Years | 58 (84.1%) | 38 (61.3%) |
| 65 to 74 Years | 20 (52.6%) | 50 (72.5%) |
| 75 Years and over | 33 (70.2%) | 52 (91.2%) |
| Total | 643 (74.3%) | 643 (75.3%) |
Income Below Poverty Among Married-Couple Families in Orwell
The poverty statistics for married-couple families in Orwell show that 7.0% or 13 of the total 185 families live below the poverty line. Families with 5 or more children have the highest poverty rate of 100.0%, comprising of 1 families. On the other hand, families with 1 or 2 children have the lowest poverty rate of 0.0%, which includes 0 families.
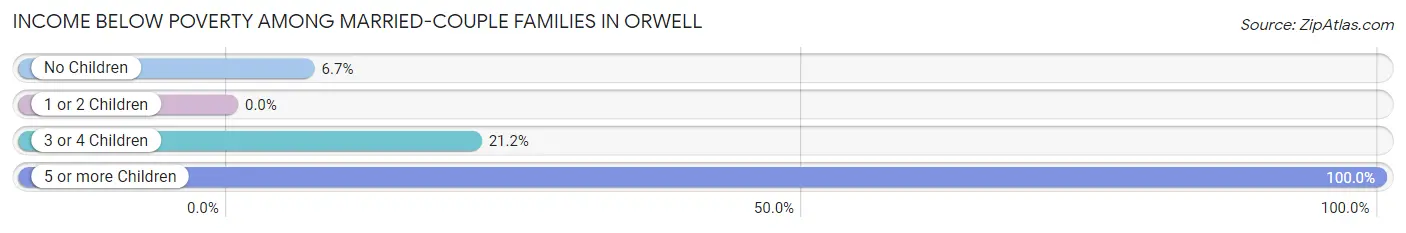
| Children | Above Poverty | Below Poverty |
| No Children | 70 (93.3%) | 5 (6.7%) |
| 1 or 2 Children | 76 (100.0%) | 0 (0.0%) |
| 3 or 4 Children | 26 (78.8%) | 7 (21.2%) |
| 5 or more Children | 0 (0.0%) | 1 (100.0%) |
| Total | 172 (93.0%) | 13 (7.0%) |
Income Below Poverty Among Single-Parent Households in Orwell
According to the poverty data in Orwell, 33.3% or 18 single-father households and 44.7% or 71 single-mother households are living below the poverty line. Among single-father households, those with 1 or 2 children have the highest poverty rate, with 18 households (66.7%) experiencing poverty. Likewise, among single-mother households, those with 3 or 4 children have the highest poverty rate, with 7 households (63.6%) falling below the poverty line.
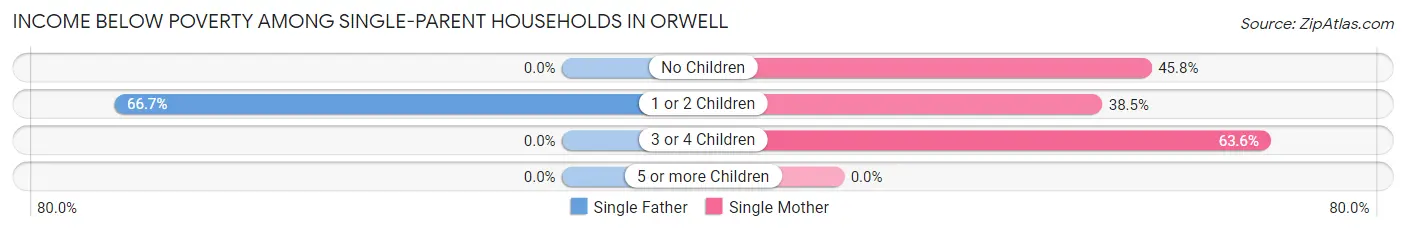
| Children | Single Father | Single Mother |
| No Children | 0 (0.0%) | 44 (45.8%) |
| 1 or 2 Children | 18 (66.7%) | 20 (38.5%) |
| 3 or 4 Children | 0 (0.0%) | 7 (63.6%) |
| 5 or more Children | 0 (0.0%) | 0 (0.0%) |
| Total | 18 (33.3%) | 71 (44.7%) |
Income Below Poverty Among Married-Couple vs Single-Parent Households in Orwell
The poverty data for Orwell shows that 13 of the married-couple family households (7.0%) and 89 of the single-parent households (41.8%) are living below the poverty level. Within the married-couple family households, those with 5 or more children have the highest poverty rate, with 1 households (100.0%) falling below the poverty line. Among the single-parent households, those with 3 or 4 children have the highest poverty rate, with 7 household (63.6%) living below poverty.
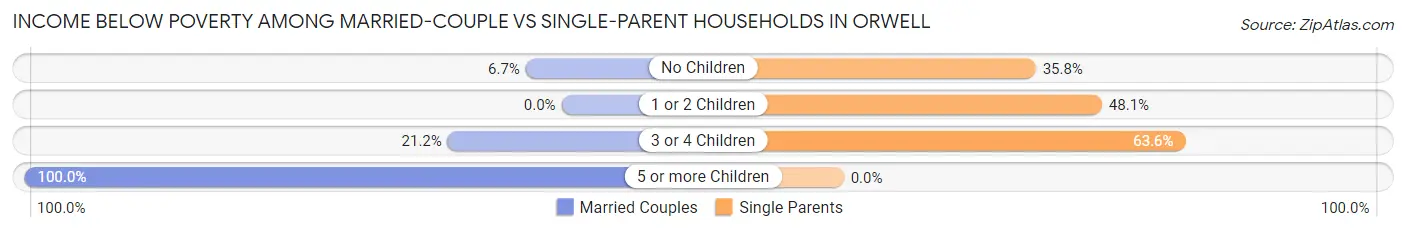
| Children | Married-Couple Families | Single-Parent Households |
| No Children | 5 (6.7%) | 44 (35.8%) |
| 1 or 2 Children | 0 (0.0%) | 38 (48.1%) |
| 3 or 4 Children | 7 (21.2%) | 7 (63.6%) |
| 5 or more Children | 1 (100.0%) | 0 (0.0%) |
| Total | 13 (7.0%) | 89 (41.8%) |
Race in Orwell
The most populous races in Orwell are White / Caucasian (1,699 | 94.2%), Two or more Races (74 | 4.1%), and Black / African American (19 | 1.1%).
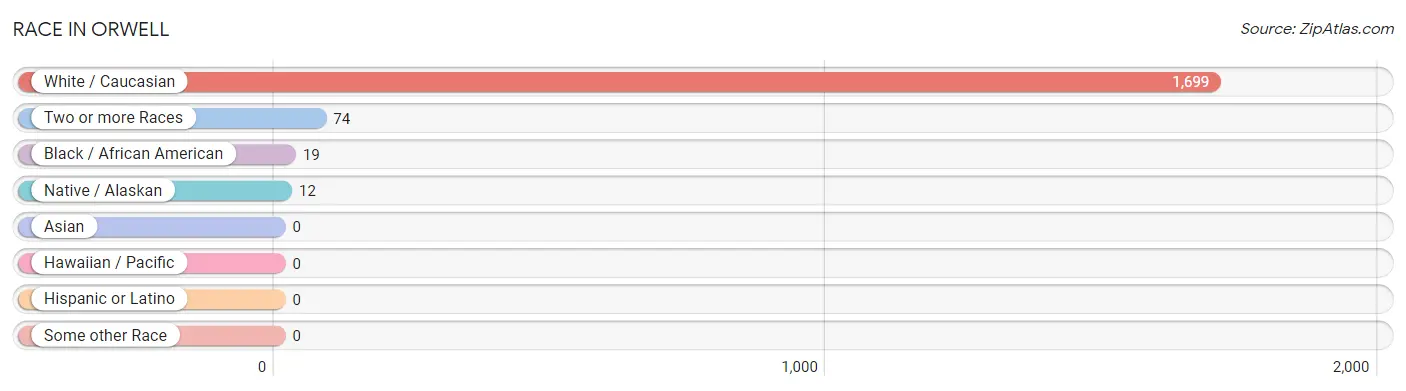
| Race | # Population | % Population |
| Asian | 0 | 0.0% |
| Black / African American | 19 | 1.1% |
| Hawaiian / Pacific | 0 | 0.0% |
| Hispanic or Latino | 0 | 0.0% |
| Native / Alaskan | 12 | 0.7% |
| White / Caucasian | 1,699 | 94.2% |
| Two or more Races | 74 | 4.1% |
| Some other Race | 0 | 0.0% |
| Total | 1,804 | 100.0% |
Ancestry in Orwell
The most populous ancestries reported in Orwell are American (238 | 13.2%), English (211 | 11.7%), German (203 | 11.3%), Irish (135 | 7.5%), and Italian (93 | 5.2%), together accounting for 48.8% of all Orwell residents.
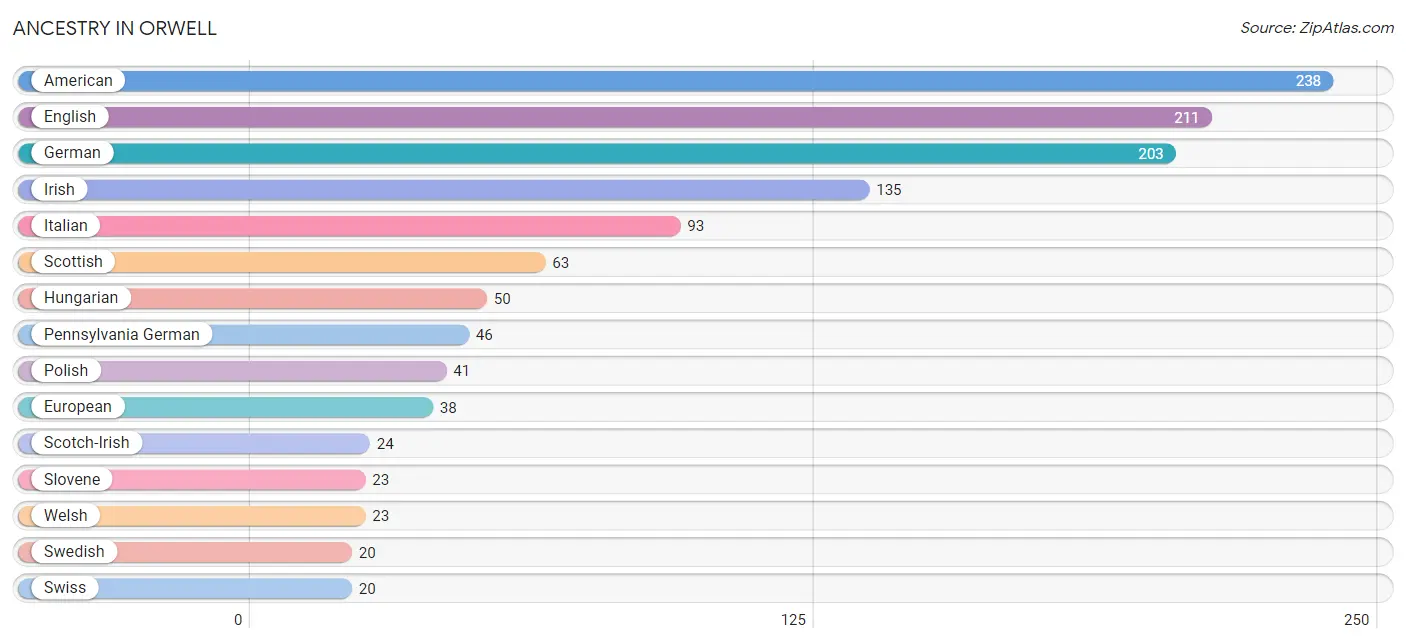
| Ancestry | # Population | % Population |
| American | 238 | 13.2% |
| Austrian | 3 | 0.2% |
| Blackfeet | 8 | 0.4% |
| Canadian | 10 | 0.5% |
| Cherokee | 12 | 0.7% |
| Czech | 3 | 0.2% |
| Czechoslovakian | 2 | 0.1% |
| Dutch | 14 | 0.8% |
| Eastern European | 1 | 0.1% |
| English | 211 | 11.7% |
| European | 38 | 2.1% |
| Finnish | 3 | 0.2% |
| French | 8 | 0.4% |
| German | 203 | 11.3% |
| Greek | 2 | 0.1% |
| Hungarian | 50 | 2.8% |
| Irish | 135 | 7.5% |
| Italian | 93 | 5.2% |
| Navajo | 1 | 0.1% |
| Pennsylvania German | 46 | 2.5% |
| Polish | 41 | 2.3% |
| Scotch-Irish | 24 | 1.3% |
| Scottish | 63 | 3.5% |
| Slovak | 8 | 0.4% |
| Slovene | 23 | 1.3% |
| Swedish | 20 | 1.1% |
| Swiss | 20 | 1.1% |
| Welsh | 23 | 1.3% |
| Yugoslavian | 4 | 0.2% | View All 29 Rows |
Immigrants in Orwell
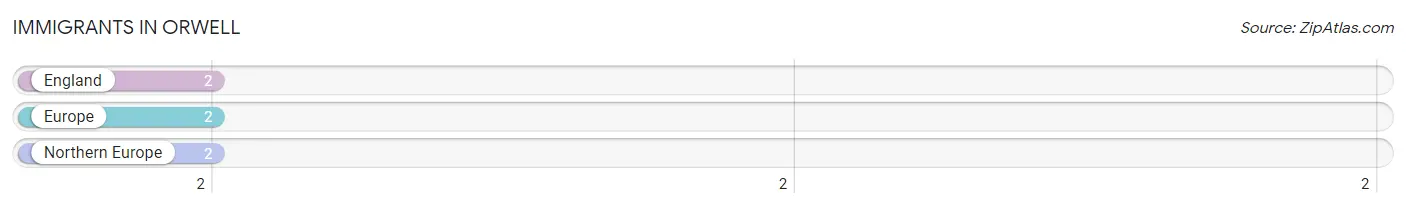
The most numerous immigrant groups reported in Orwell came from England (2 | 0.1%), Europe (2 | 0.1%), and Northern Europe (2 | 0.1%), together accounting for 0.3% of all Orwell residents.
| Immigration Origin | # Population | % Population |
| England | 2 | 0.1% |
| Europe | 2 | 0.1% |
| Northern Europe | 2 | 0.1% | View All 3 Rows |
Sex and Age in Orwell
Sex and Age in Orwell
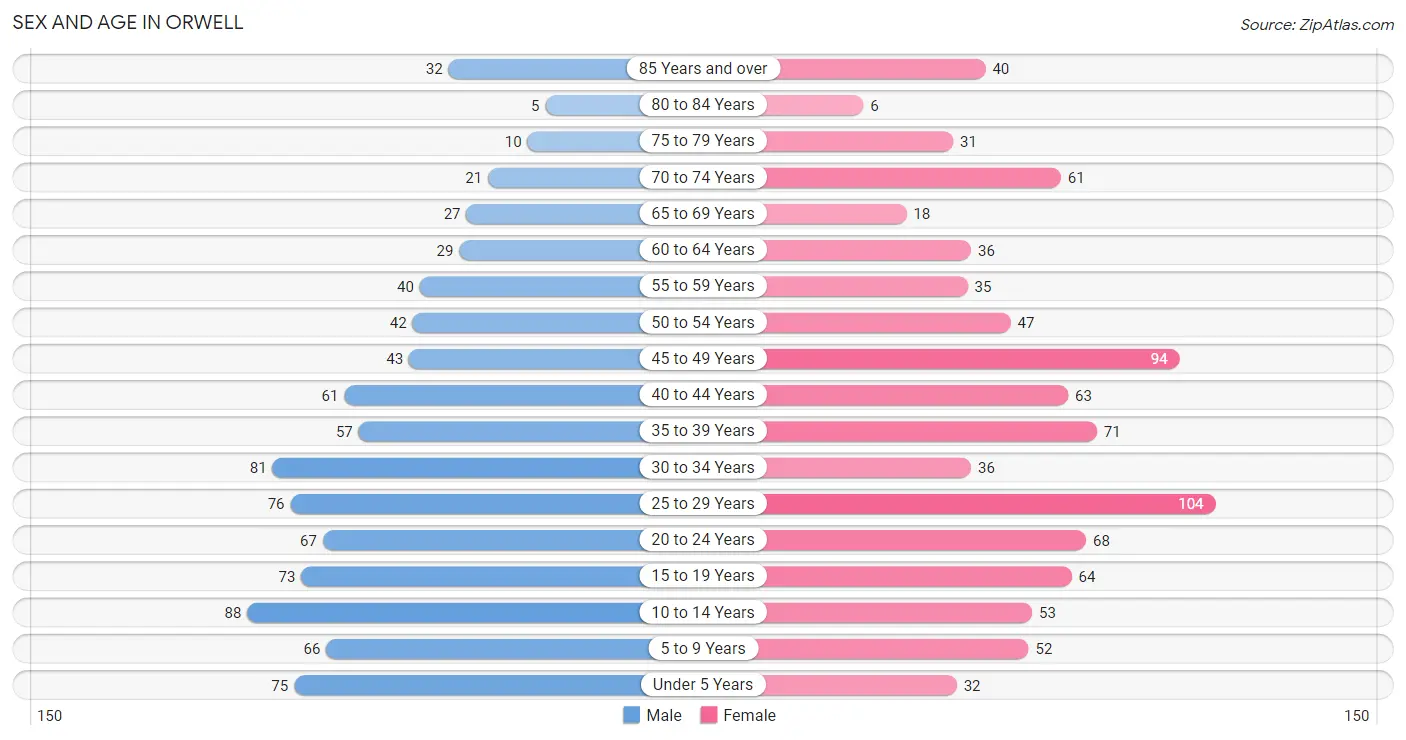
The most populous age groups in Orwell are 10 to 14 Years (88 | 9.9%) for men and 25 to 29 Years (104 | 11.4%) for women.
| Age Bracket | Male | Female |
| Under 5 Years | 75 (8.4%) | 32 (3.5%) |
| 5 to 9 Years | 66 (7.4%) | 52 (5.7%) |
| 10 to 14 Years | 88 (9.9%) | 53 (5.8%) |
| 15 to 19 Years | 73 (8.2%) | 64 (7.0%) |
| 20 to 24 Years | 67 (7.5%) | 68 (7.5%) |
| 25 to 29 Years | 76 (8.5%) | 104 (11.4%) |
| 30 to 34 Years | 81 (9.1%) | 36 (4.0%) |
| 35 to 39 Years | 57 (6.4%) | 71 (7.8%) |
| 40 to 44 Years | 61 (6.8%) | 63 (6.9%) |
| 45 to 49 Years | 43 (4.8%) | 94 (10.3%) |
| 50 to 54 Years | 42 (4.7%) | 47 (5.2%) |
| 55 to 59 Years | 40 (4.5%) | 35 (3.8%) |
| 60 to 64 Years | 29 (3.3%) | 36 (4.0%) |
| 65 to 69 Years | 27 (3.0%) | 18 (2.0%) |
| 70 to 74 Years | 21 (2.4%) | 61 (6.7%) |
| 75 to 79 Years | 10 (1.1%) | 31 (3.4%) |
| 80 to 84 Years | 5 (0.6%) | 6 (0.7%) |
| 85 Years and over | 32 (3.6%) | 40 (4.4%) |
| Total | 893 (100.0%) | 911 (100.0%) |
Families and Households in Orwell
Median Family Size in Orwell
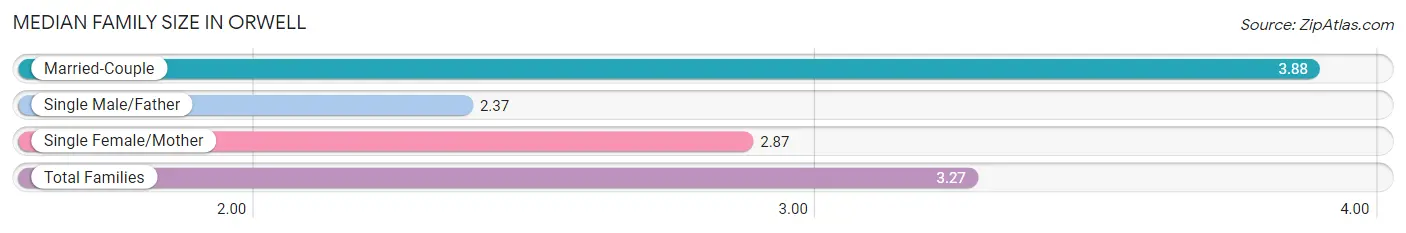
The median family size in Orwell is 3.27 persons per family, with married-couple families (185 | 46.5%) accounting for the largest median family size of 3.88 persons per family. On the other hand, single male/father families (54 | 13.6%) represent the smallest median family size with 2.37 persons per family.
| Family Type | # Families | Family Size |
| Married-Couple | 185 (46.5%) | 3.88 |
| Single Male/Father | 54 (13.6%) | 2.37 |
| Single Female/Mother | 159 (40.0%) | 2.87 |
| Total Families | 398 (100.0%) | 3.27 |
Median Household Size in Orwell
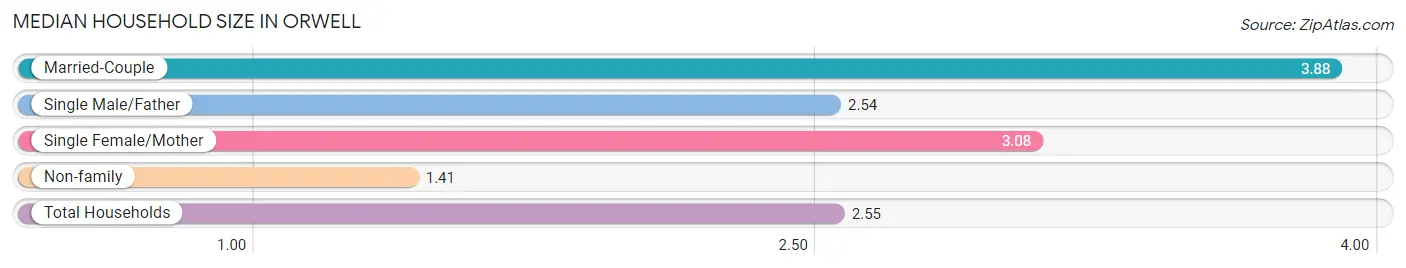
The median household size in Orwell is 2.55 persons per household, with married-couple households (185 | 26.9%) accounting for the largest median household size of 3.88 persons per household. non-family households (291 | 42.2%) represent the smallest median household size with 1.41 persons per household.
| Household Type | # Households | Household Size |
| Married-Couple | 185 (26.9%) | 3.88 |
| Single Male/Father | 54 (7.8%) | 2.54 |
| Single Female/Mother | 159 (23.1%) | 3.08 |
| Non-family | 291 (42.2%) | 1.41 |
| Total Households | 689 (100.0%) | 2.55 |
Household Size by Marriage Status in Orwell
Out of a total of 689 households in Orwell, 398 (57.8%) are family households, while 291 (42.2%) are nonfamily households. The most numerous type of family households are 2-person households, comprising 197, and the most common type of nonfamily households are 1-person households, comprising 223.
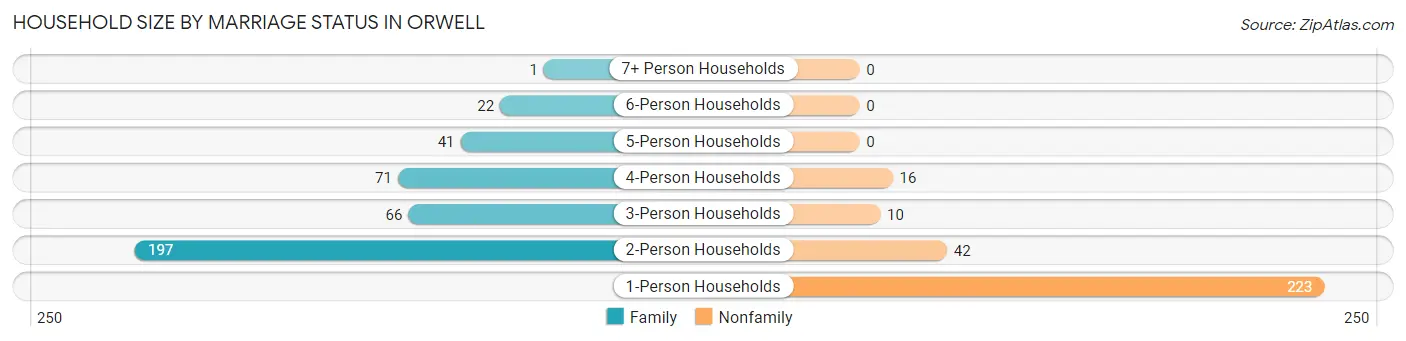
| Household Size | Family Households | Nonfamily Households |
| 1-Person Households | - | 223 (32.4%) |
| 2-Person Households | 197 (28.6%) | 42 (6.1%) |
| 3-Person Households | 66 (9.6%) | 10 (1.5%) |
| 4-Person Households | 71 (10.3%) | 16 (2.3%) |
| 5-Person Households | 41 (5.9%) | 0 (0.0%) |
| 6-Person Households | 22 (3.2%) | 0 (0.0%) |
| 7+ Person Households | 1 (0.2%) | 0 (0.0%) |
| Total | 398 (57.8%) | 291 (42.2%) |
Female Fertility in Orwell
Fertility by Age in Orwell
Average fertility rate in Orwell is 6.0 births per 1,000 women. Women in the age bracket of 20 to 34 years have the highest fertility rate with 14.0 births per 1,000 women. Women in the age bracket of 20 to 34 years acount for 100.0% of all women with births.
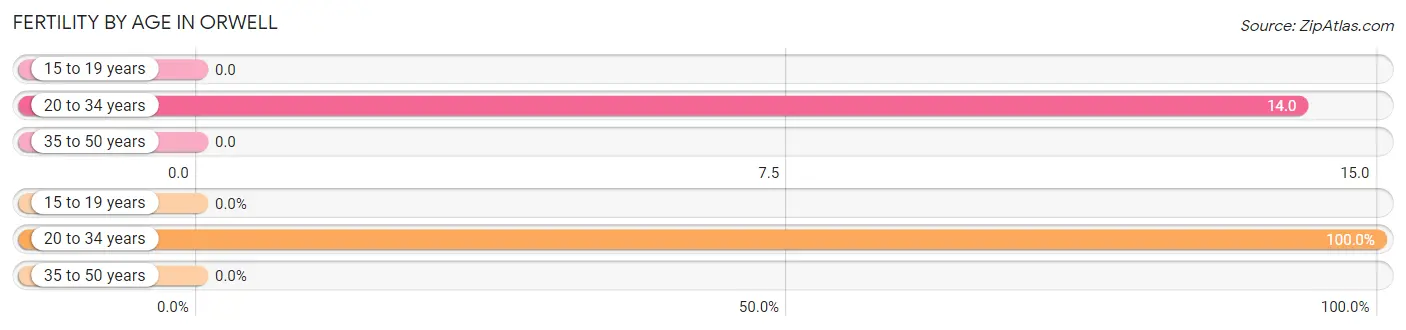
| Age Bracket | Women with Births | Births / 1,000 Women |
| 15 to 19 years | 0 (0.0%) | 0.0 |
| 20 to 34 years | 3 (100.0%) | 14.0 |
| 35 to 50 years | 0 (0.0%) | 0.0 |
| Total | 3 (100.0%) | 6.0 |
Fertility by Age by Marriage Status in Orwell
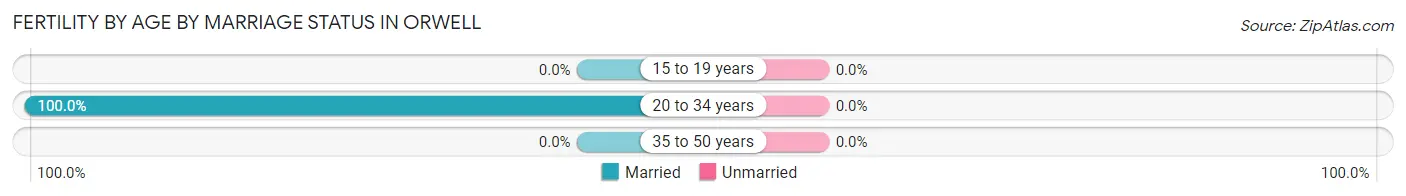
| Age Bracket | Married | Unmarried |
| 15 to 19 years | 0 (0.0%) | 0 (0.0%) |
| 20 to 34 years | 3 (100.0%) | 0 (0.0%) |
| 35 to 50 years | 0 (0.0%) | 0 (0.0%) |
| Total | 3 (100.0%) | 0 (0.0%) |
Fertility by Education in Orwell
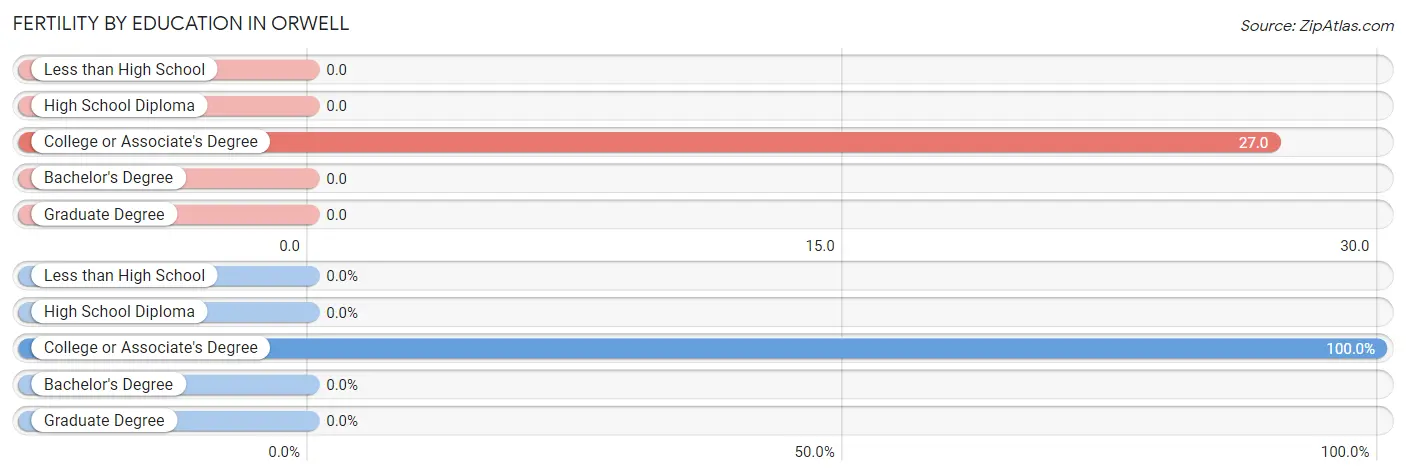
| Educational Attainment | Women with Births | Births / 1,000 Women |
| Less than High School | 0 (0.0%) | 0.0 |
| High School Diploma | 0 (0.0%) | 0.0 |
| College or Associate's Degree | 3 (100.0%) | 27.0 |
| Bachelor's Degree | 0 (0.0%) | 0.0 |
| Graduate Degree | 0 (0.0%) | 0.0 |
| Total | 3 (100.0%) | 6.0 |
Fertility by Education by Marriage Status in Orwell
| Educational Attainment | Married | Unmarried |
| Less than High School | 0 (0.0%) | 0 (0.0%) |
| High School Diploma | 0 (0.0%) | 0 (0.0%) |
| College or Associate's Degree | 3 (100.0%) | 0 (0.0%) |
| Bachelor's Degree | 0 (0.0%) | 0 (0.0%) |
| Graduate Degree | 0 (0.0%) | 0 (0.0%) |
| Total | 3 (100.0%) | 0 (0.0%) |
Employment Characteristics in Orwell
Employment by Class of Employer in Orwell
Among the 778 employed individuals in Orwell, private company employees (660 | 84.8%), not-for-profit organizations (37 | 4.8%), and self-employed (not incorporated) (35 | 4.5%) make up the most common classes of employment.
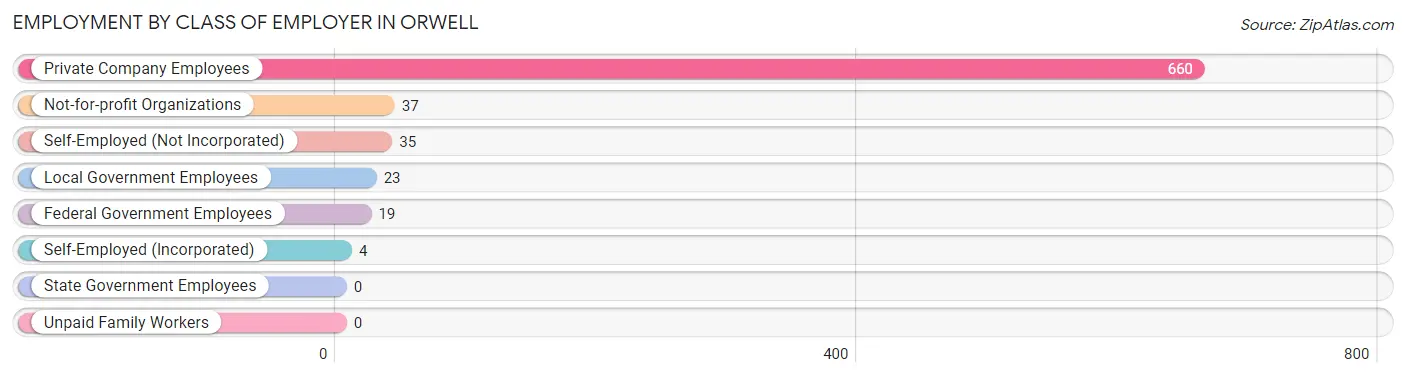
| Employer Class | # Employees | % Employees |
| Private Company Employees | 660 | 84.8% |
| Self-Employed (Incorporated) | 4 | 0.5% |
| Self-Employed (Not Incorporated) | 35 | 4.5% |
| Not-for-profit Organizations | 37 | 4.8% |
| Local Government Employees | 23 | 3.0% |
| State Government Employees | 0 | 0.0% |
| Federal Government Employees | 19 | 2.4% |
| Unpaid Family Workers | 0 | 0.0% |
| Total | 778 | 100.0% |
Employment Status by Age in Orwell
According to the labor force statistics for Orwell, out of the total population over 16 years of age (1,405), 62.2% or 874 individuals are in the labor force, with 7.0% or 61 of them unemployed. The age group with the highest labor force participation rate is 45 to 54 years, with 95.1% or 215 individuals in the labor force. Within the labor force, the 20 to 24 years age range has the highest percentage of unemployed individuals, with 39.6% or 40 of them being unemployed.
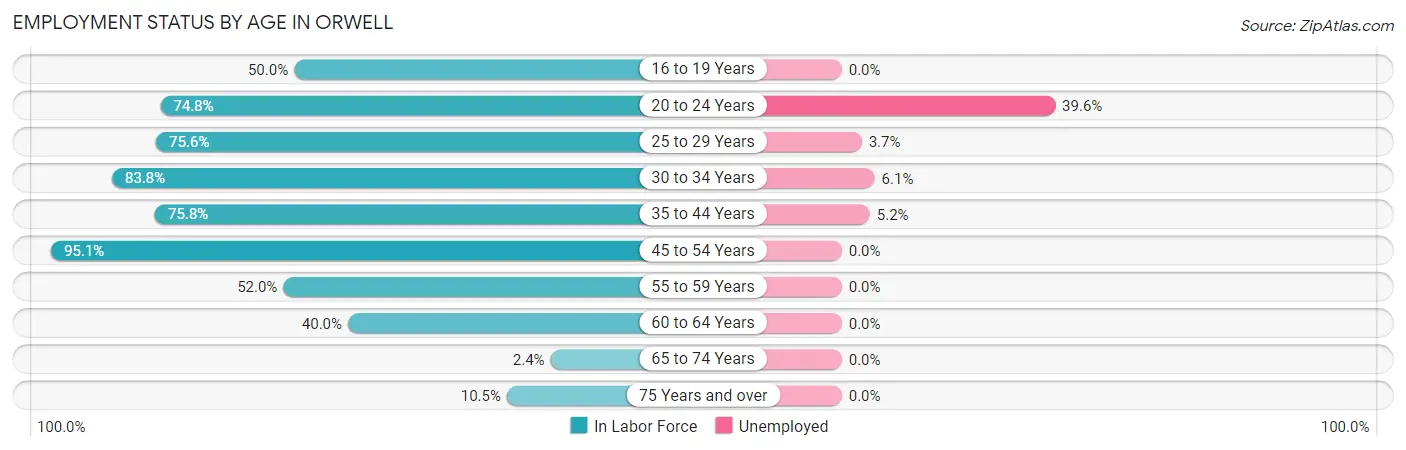
| Age Bracket | In Labor Force | Unemployed |
| 16 to 19 Years | 52 (50.0%) | 0 (0.0%) |
| 20 to 24 Years | 101 (74.8%) | 40 (39.6%) |
| 25 to 29 Years | 136 (75.6%) | 5 (3.7%) |
| 30 to 34 Years | 98 (83.8%) | 6 (6.1%) |
| 35 to 44 Years | 191 (75.8%) | 10 (5.2%) |
| 45 to 54 Years | 215 (95.1%) | 0 (0.0%) |
| 55 to 59 Years | 39 (52.0%) | 0 (0.0%) |
| 60 to 64 Years | 26 (40.0%) | 0 (0.0%) |
| 65 to 74 Years | 3 (2.4%) | 0 (0.0%) |
| 75 Years and over | 13 (10.5%) | 0 (0.0%) |
| Total | 874 (62.2%) | 61 (7.0%) |
Employment Status by Educational Attainment in Orwell
According to labor force statistics for Orwell, 77.0% of individuals (705) out of the total population between 25 and 64 years of age (915) are in the labor force, with 3.0% or 21 of them being unemployed. The group with the highest labor force participation rate are those with the educational attainment of bachelor's degree or higher, with 87.8% or 79 individuals in the labor force. Within the labor force, individuals with high school diploma education have the highest percentage of unemployment, with 6.1% or 21 of them being unemployed.
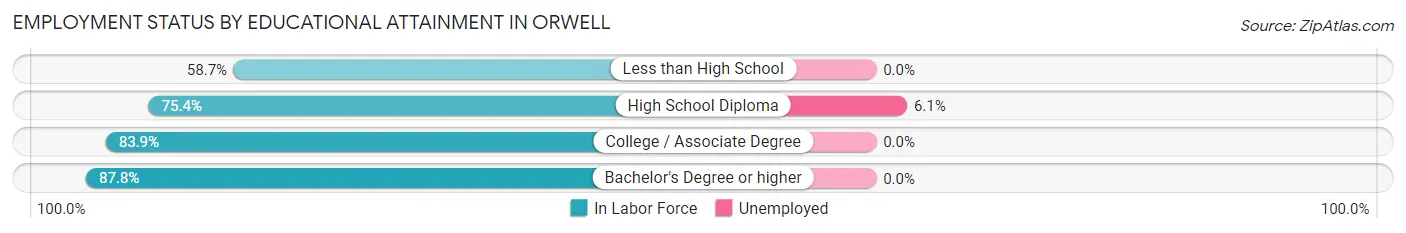
| Educational Attainment | In Labor Force | Unemployed |
| Less than High School | 64 (58.7%) | 0 (0.0%) |
| High School Diploma | 343 (75.4%) | 28 (6.1%) |
| College / Associate Degree | 219 (83.9%) | 0 (0.0%) |
| Bachelor's Degree or higher | 79 (87.8%) | 0 (0.0%) |
| Total | 705 (77.0%) | 27 (3.0%) |
Employment Occupations by Sex in Orwell
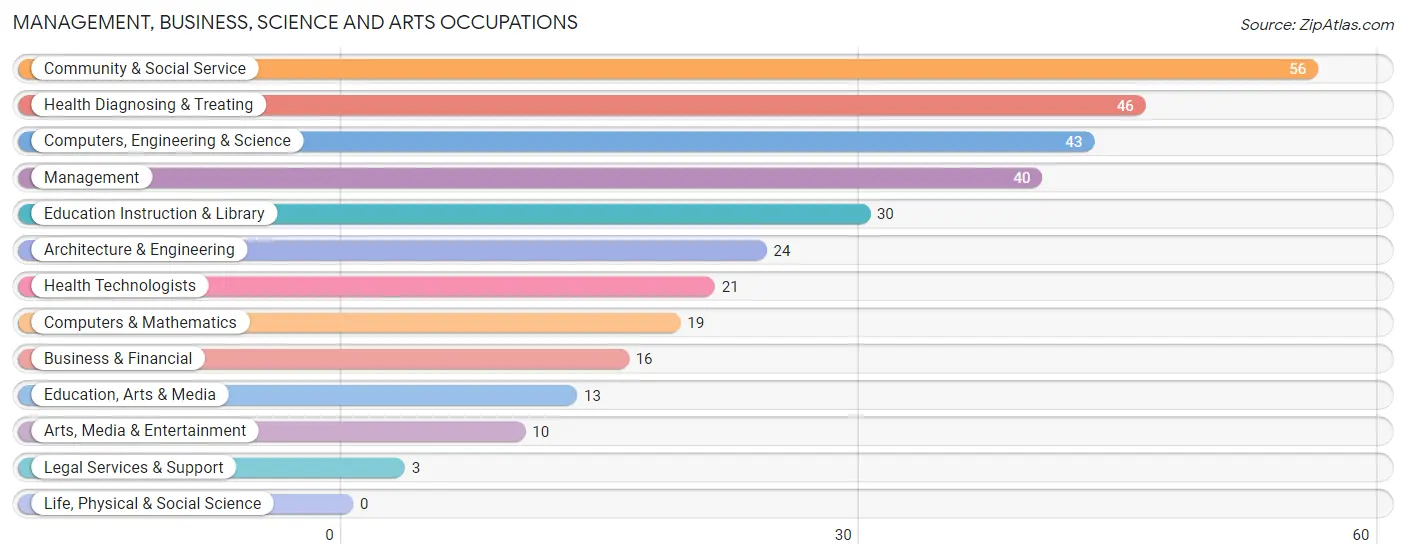
Management, Business, Science and Arts Occupations
The most common Management, Business, Science and Arts occupations in Orwell are Community & Social Service (56 | 6.9%), Health Diagnosing & Treating (46 | 5.7%), Computers, Engineering & Science (43 | 5.3%), Management (40 | 4.9%), and Education Instruction & Library (30 | 3.7%).
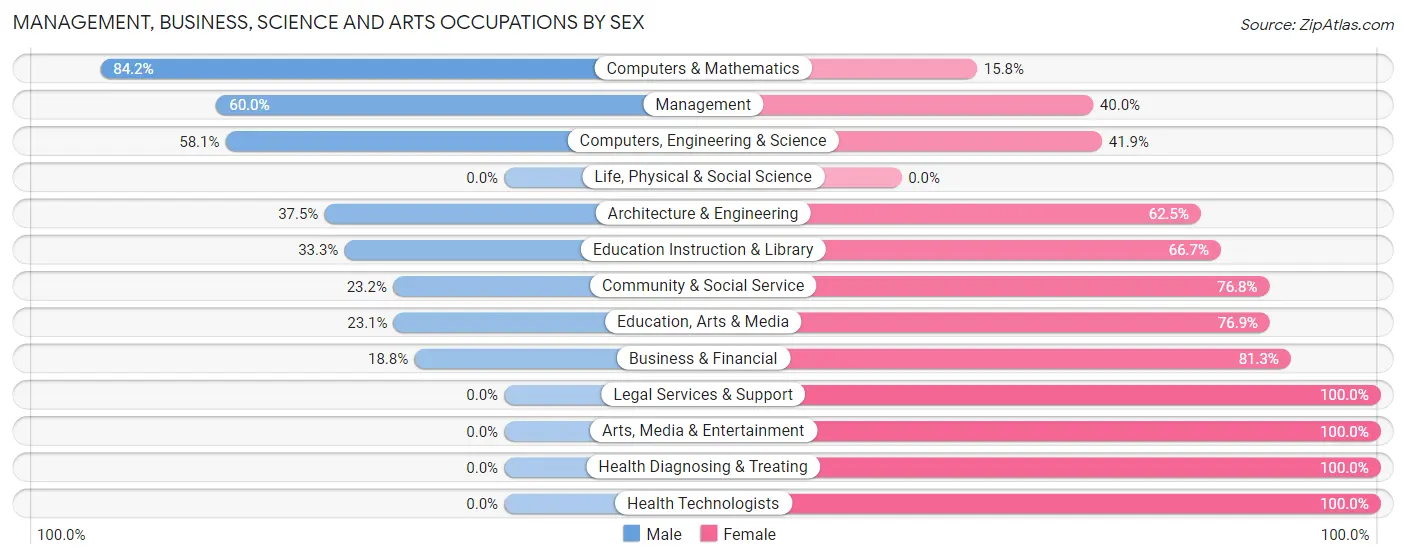
Management, Business, Science and Arts Occupations by Sex
Within the Management, Business, Science and Arts occupations in Orwell, the most male-oriented occupations are Computers & Mathematics (84.2%), Management (60.0%), and Computers, Engineering & Science (58.1%), while the most female-oriented occupations are Legal Services & Support (100.0%), Arts, Media & Entertainment (100.0%), and Health Diagnosing & Treating (100.0%).
| Occupation | Male | Female |
| Management | 24 (60.0%) | 16 (40.0%) |
| Business & Financial | 3 (18.8%) | 13 (81.2%) |
| Computers, Engineering & Science | 25 (58.1%) | 18 (41.9%) |
| Computers & Mathematics | 16 (84.2%) | 3 (15.8%) |
| Architecture & Engineering | 9 (37.5%) | 15 (62.5%) |
| Life, Physical & Social Science | 0 (0.0%) | 0 (0.0%) |
| Community & Social Service | 13 (23.2%) | 43 (76.8%) |
| Education, Arts & Media | 3 (23.1%) | 10 (76.9%) |
| Legal Services & Support | 0 (0.0%) | 3 (100.0%) |
| Education Instruction & Library | 10 (33.3%) | 20 (66.7%) |
| Arts, Media & Entertainment | 0 (0.0%) | 10 (100.0%) |
| Health Diagnosing & Treating | 0 (0.0%) | 46 (100.0%) |
| Health Technologists | 0 (0.0%) | 21 (100.0%) |
| Total (Category) | 65 (32.3%) | 136 (67.7%) |
| Total (Overall) | 410 (50.4%) | 403 (49.6%) |
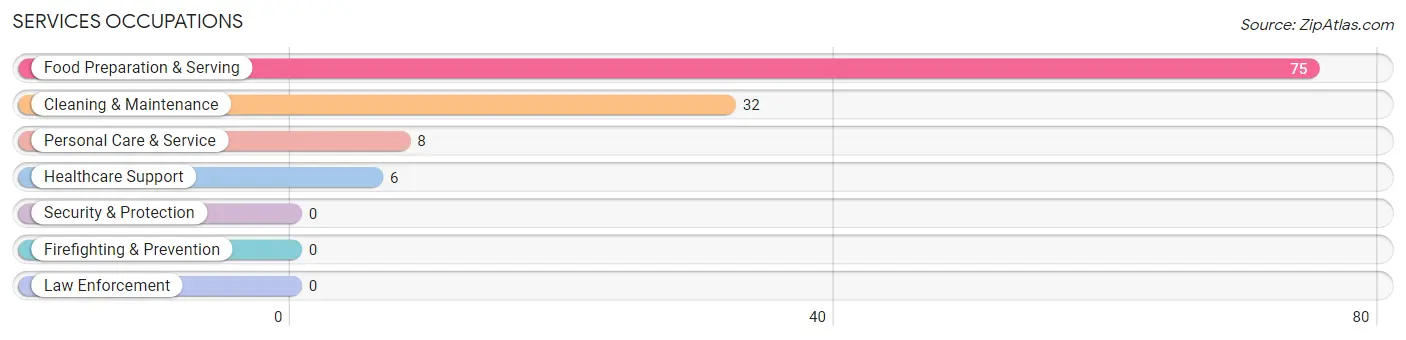
Services Occupations
The most common Services occupations in Orwell are Food Preparation & Serving (75 | 9.2%), Cleaning & Maintenance (32 | 3.9%), Personal Care & Service (8 | 1.0%), and Healthcare Support (6 | 0.7%).
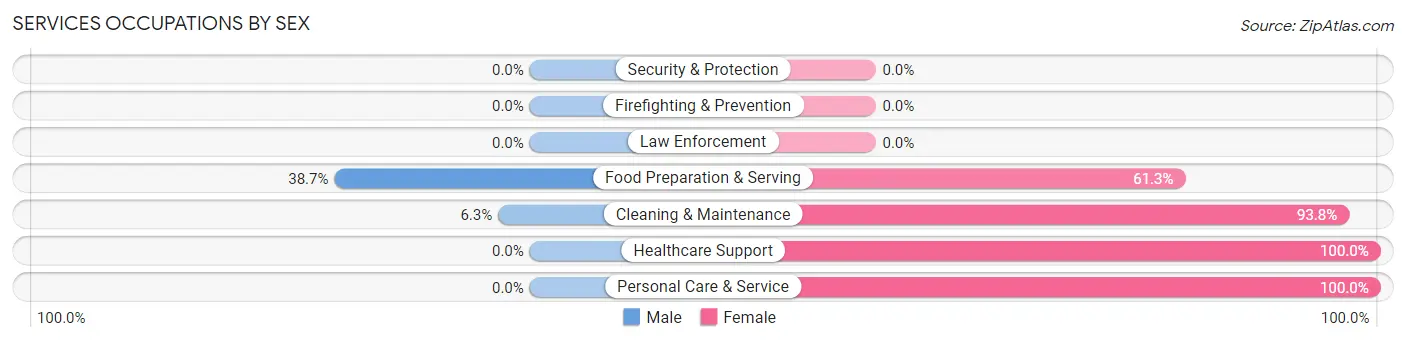
Services Occupations by Sex
Within the Services occupations in Orwell, the most male-oriented occupations are Food Preparation & Serving (38.7%), and Cleaning & Maintenance (6.2%), while the most female-oriented occupations are Healthcare Support (100.0%), Personal Care & Service (100.0%), and Cleaning & Maintenance (93.8%).
| Occupation | Male | Female |
| Healthcare Support | 0 (0.0%) | 6 (100.0%) |
| Security & Protection | 0 (0.0%) | 0 (0.0%) |
| Firefighting & Prevention | 0 (0.0%) | 0 (0.0%) |
| Law Enforcement | 0 (0.0%) | 0 (0.0%) |
| Food Preparation & Serving | 29 (38.7%) | 46 (61.3%) |
| Cleaning & Maintenance | 2 (6.2%) | 30 (93.8%) |
| Personal Care & Service | 0 (0.0%) | 8 (100.0%) |
| Total (Category) | 31 (25.6%) | 90 (74.4%) |
| Total (Overall) | 410 (50.4%) | 403 (49.6%) |
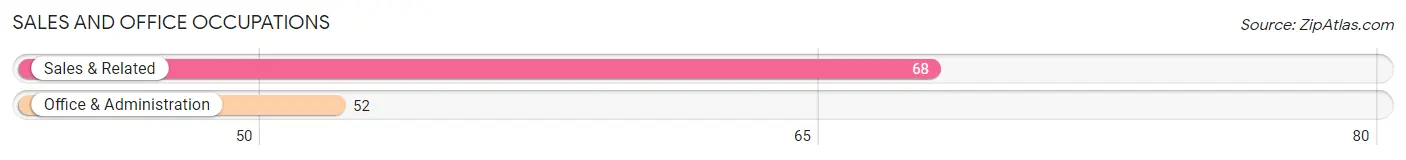
Sales and Office Occupations
The most common Sales and Office occupations in Orwell are Sales & Related (68 | 8.4%), and Office & Administration (52 | 6.4%).
Sales and Office Occupations by Sex
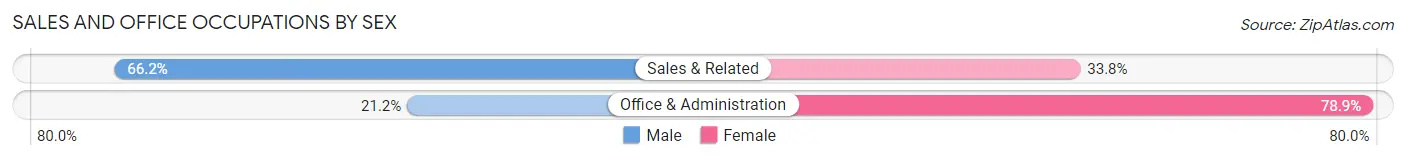
| Occupation | Male | Female |
| Sales & Related | 45 (66.2%) | 23 (33.8%) |
| Office & Administration | 11 (21.1%) | 41 (78.8%) |
| Total (Category) | 56 (46.7%) | 64 (53.3%) |
| Total (Overall) | 410 (50.4%) | 403 (49.6%) |
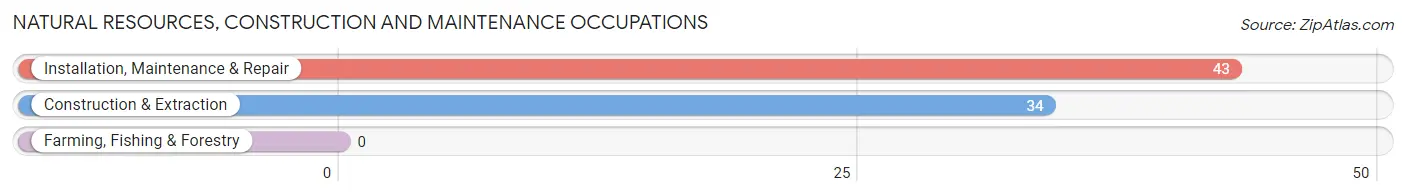
Natural Resources, Construction and Maintenance Occupations
The most common Natural Resources, Construction and Maintenance occupations in Orwell are Installation, Maintenance & Repair (43 | 5.3%), and Construction & Extraction (34 | 4.2%).
Natural Resources, Construction and Maintenance Occupations by Sex
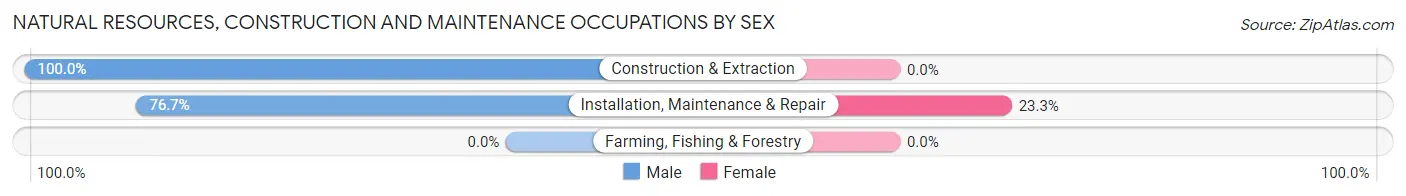
| Occupation | Male | Female |
| Farming, Fishing & Forestry | 0 (0.0%) | 0 (0.0%) |
| Construction & Extraction | 34 (100.0%) | 0 (0.0%) |
| Installation, Maintenance & Repair | 33 (76.7%) | 10 (23.3%) |
| Total (Category) | 67 (87.0%) | 10 (13.0%) |
| Total (Overall) | 410 (50.4%) | 403 (49.6%) |
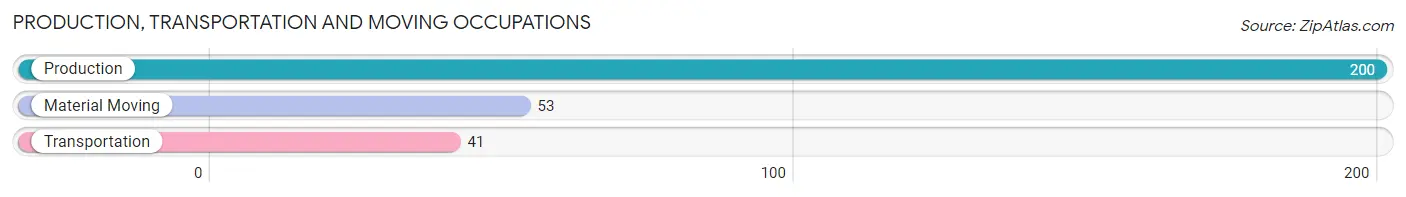
Production, Transportation and Moving Occupations
The most common Production, Transportation and Moving occupations in Orwell are Production (200 | 24.6%), Material Moving (53 | 6.5%), and Transportation (41 | 5.0%).
Production, Transportation and Moving Occupations by Sex
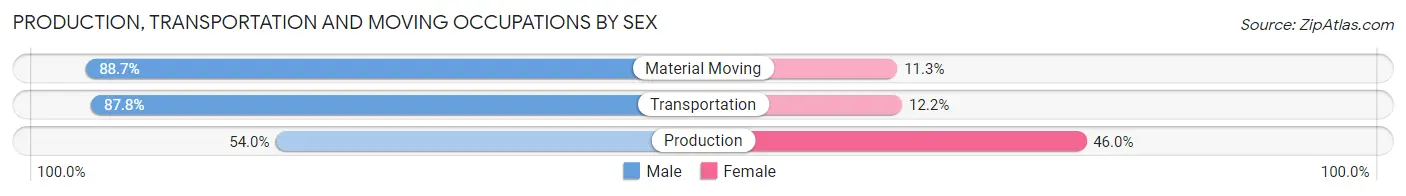
| Occupation | Male | Female |
| Production | 108 (54.0%) | 92 (46.0%) |
| Transportation | 36 (87.8%) | 5 (12.2%) |
| Material Moving | 47 (88.7%) | 6 (11.3%) |
| Total (Category) | 191 (65.0%) | 103 (35.0%) |
| Total (Overall) | 410 (50.4%) | 403 (49.6%) |
Employment Industries by Sex in Orwell
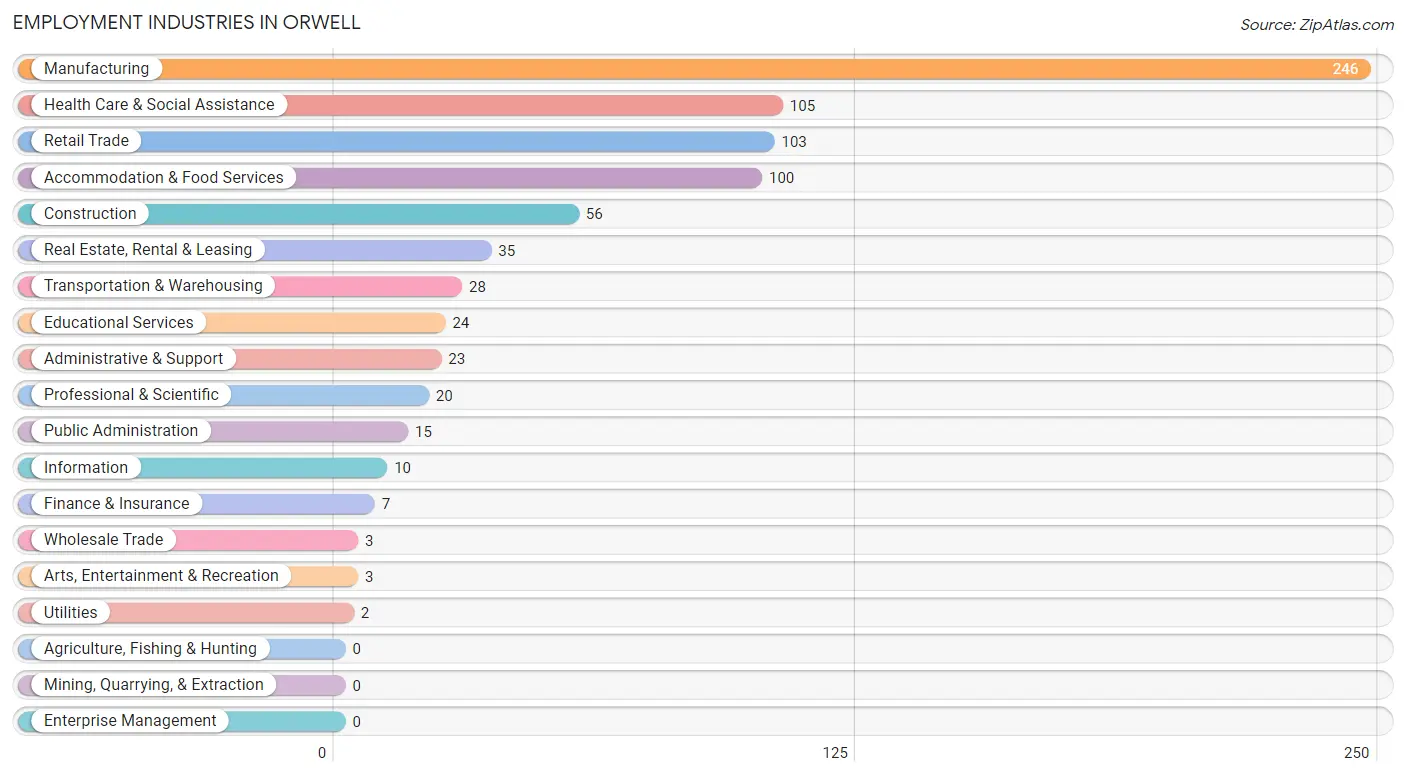
Employment Industries in Orwell
The major employment industries in Orwell include Manufacturing (246 | 30.3%), Health Care & Social Assistance (105 | 12.9%), Retail Trade (103 | 12.7%), Accommodation & Food Services (100 | 12.3%), and Construction (56 | 6.9%).
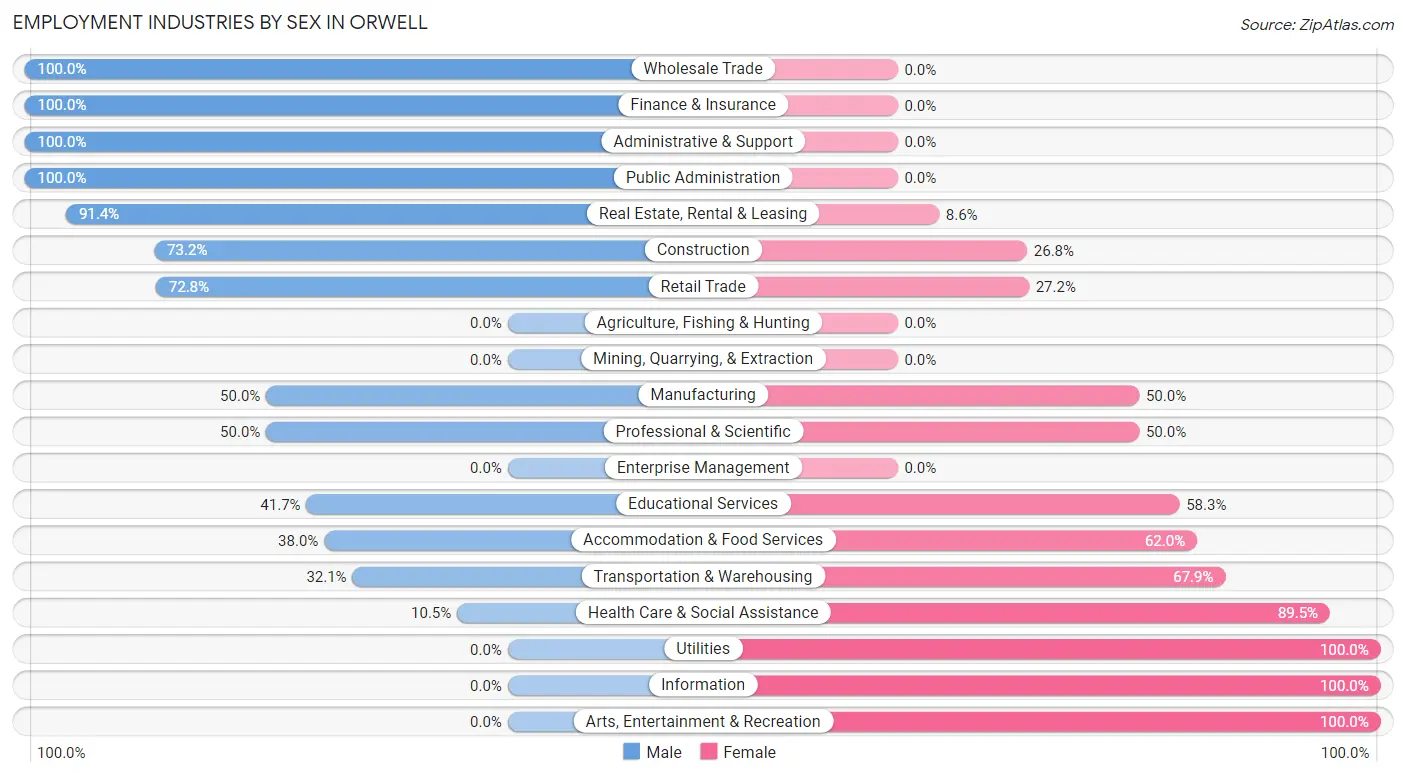
Employment Industries by Sex in Orwell
The Orwell industries that see more men than women are Wholesale Trade (100.0%), Finance & Insurance (100.0%), and Administrative & Support (100.0%), whereas the industries that tend to have a higher number of women are Utilities (100.0%), Information (100.0%), and Arts, Entertainment & Recreation (100.0%).
| Industry | Male | Female |
| Agriculture, Fishing & Hunting | 0 (0.0%) | 0 (0.0%) |
| Mining, Quarrying, & Extraction | 0 (0.0%) | 0 (0.0%) |
| Construction | 41 (73.2%) | 15 (26.8%) |
| Manufacturing | 123 (50.0%) | 123 (50.0%) |
| Wholesale Trade | 3 (100.0%) | 0 (0.0%) |
| Retail Trade | 75 (72.8%) | 28 (27.2%) |
| Transportation & Warehousing | 9 (32.1%) | 19 (67.9%) |
| Utilities | 0 (0.0%) | 2 (100.0%) |
| Information | 0 (0.0%) | 10 (100.0%) |
| Finance & Insurance | 7 (100.0%) | 0 (0.0%) |
| Real Estate, Rental & Leasing | 32 (91.4%) | 3 (8.6%) |
| Professional & Scientific | 10 (50.0%) | 10 (50.0%) |
| Enterprise Management | 0 (0.0%) | 0 (0.0%) |
| Administrative & Support | 23 (100.0%) | 0 (0.0%) |
| Educational Services | 10 (41.7%) | 14 (58.3%) |
| Health Care & Social Assistance | 11 (10.5%) | 94 (89.5%) |
| Arts, Entertainment & Recreation | 0 (0.0%) | 3 (100.0%) |
| Accommodation & Food Services | 38 (38.0%) | 62 (62.0%) |
| Public Administration | 15 (100.0%) | 0 (0.0%) |
| Total | 410 (50.4%) | 403 (49.6%) |
Education in Orwell
School Enrollment in Orwell
The most common levels of schooling among the 432 students in Orwell are middle school (117 | 27.1%), high school (117 | 27.1%), and elementary school (100 | 23.2%).
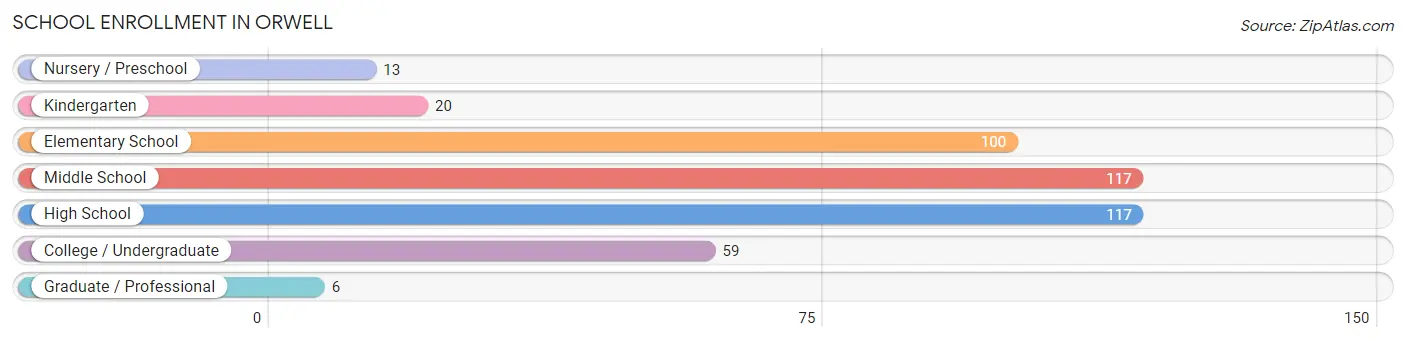
| School Level | # Students | % Students |
| Nursery / Preschool | 13 | 3.0% |
| Kindergarten | 20 | 4.6% |
| Elementary School | 100 | 23.2% |
| Middle School | 117 | 27.1% |
| High School | 117 | 27.1% |
| College / Undergraduate | 59 | 13.7% |
| Graduate / Professional | 6 | 1.4% |
| Total | 432 | 100.0% |
School Enrollment by Age by Funding Source in Orwell
Out of a total of 432 students who are enrolled in schools in Orwell, 16 (3.7%) attend a private institution, while the remaining 416 (96.3%) are enrolled in public schools. The age group of 10 to 14 year olds has the highest likelihood of being enrolled in private schools, with 12 (8.5% in the age bracket) enrolled. Conversely, the age group of 3 to 4 year olds has the lowest likelihood of being enrolled in a private school, with 4 (100.0% in the age bracket) attending a public institution.
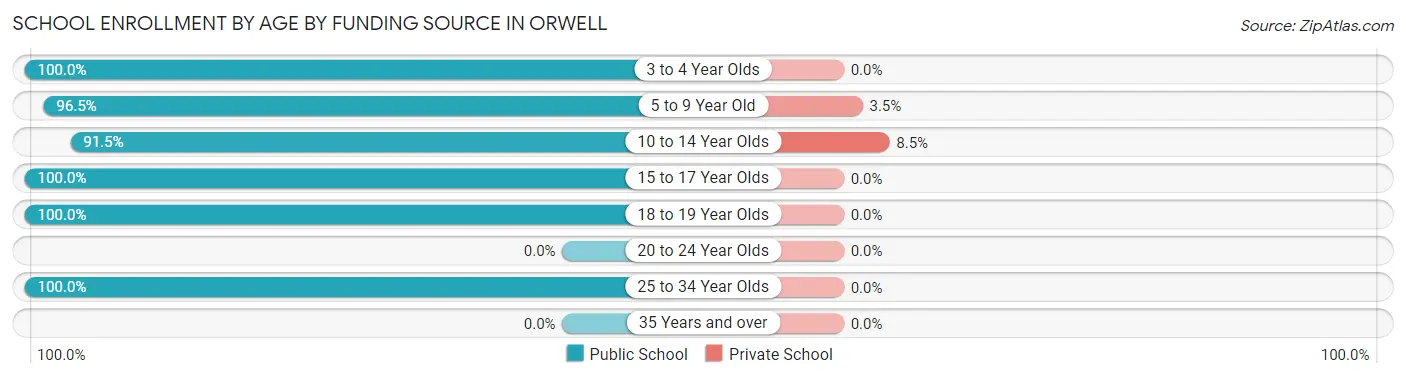
| Age Bracket | Public School | Private School |
| 3 to 4 Year Olds | 4 (100.0%) | 0 (0.0%) |
| 5 to 9 Year Old | 110 (96.5%) | 4 (3.5%) |
| 10 to 14 Year Olds | 129 (91.5%) | 12 (8.5%) |
| 15 to 17 Year Olds | 90 (100.0%) | 0 (0.0%) |
| 18 to 19 Year Olds | 36 (100.0%) | 0 (0.0%) |
| 20 to 24 Year Olds | 0 (0.0%) | 0 (0.0%) |
| 25 to 34 Year Olds | 47 (100.0%) | 0 (0.0%) |
| 35 Years and over | 0 (0.0%) | 0 (0.0%) |
| Total | 416 (96.3%) | 16 (3.7%) |
Educational Attainment by Field of Study in Orwell
Business (32 | 24.2%), education (25 | 18.9%), psychology (23 | 17.4%), liberal arts & history (19 | 14.4%), and science & technology (18 | 13.6%) are the most common fields of study among 132 individuals in Orwell who have obtained a bachelor's degree or higher.
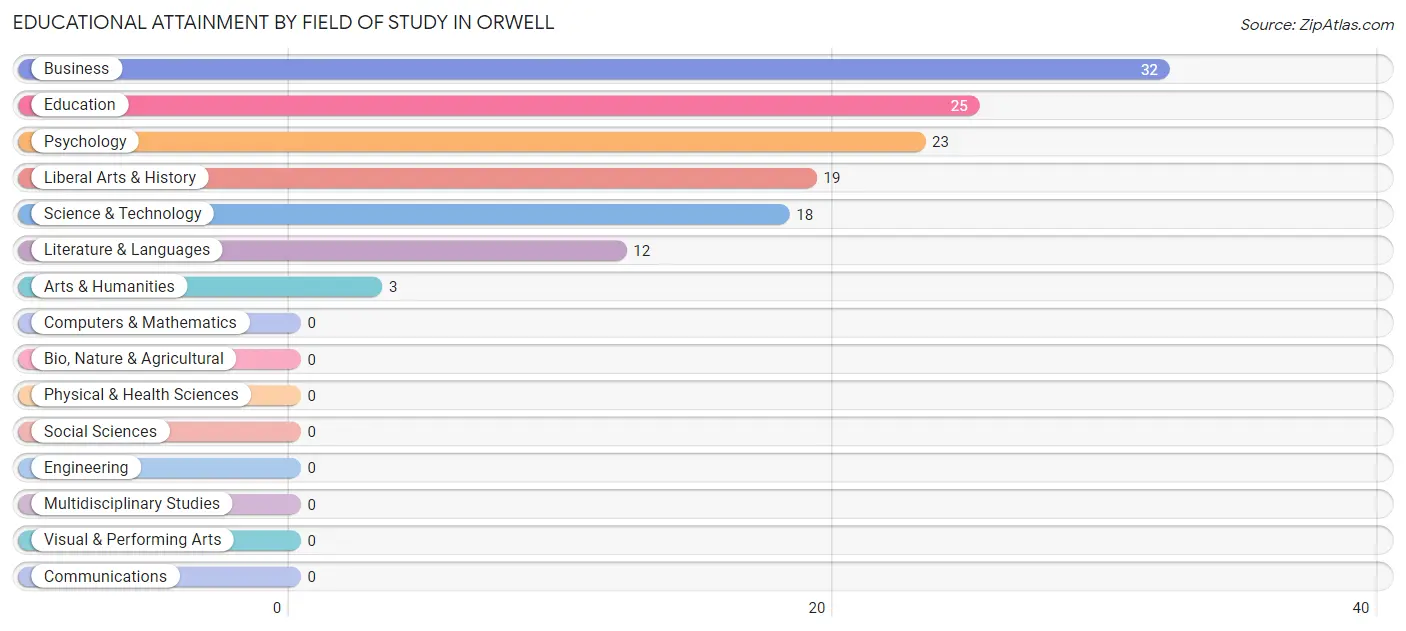
| Field of Study | # Graduates | % Graduates |
| Computers & Mathematics | 0 | 0.0% |
| Bio, Nature & Agricultural | 0 | 0.0% |
| Physical & Health Sciences | 0 | 0.0% |
| Psychology | 23 | 17.4% |
| Social Sciences | 0 | 0.0% |
| Engineering | 0 | 0.0% |
| Multidisciplinary Studies | 0 | 0.0% |
| Science & Technology | 18 | 13.6% |
| Business | 32 | 24.2% |
| Education | 25 | 18.9% |
| Literature & Languages | 12 | 9.1% |
| Liberal Arts & History | 19 | 14.4% |
| Visual & Performing Arts | 0 | 0.0% |
| Communications | 0 | 0.0% |
| Arts & Humanities | 3 | 2.3% |
| Total | 132 | 100.0% |
Transportation & Commute in Orwell
Vehicle Availability by Sex in Orwell
The most prevalent vehicle ownership categories in Orwell are males with 2 vehicles (112, accounting for 27.9%) and females with 2 vehicles (103, making up 29.8%).
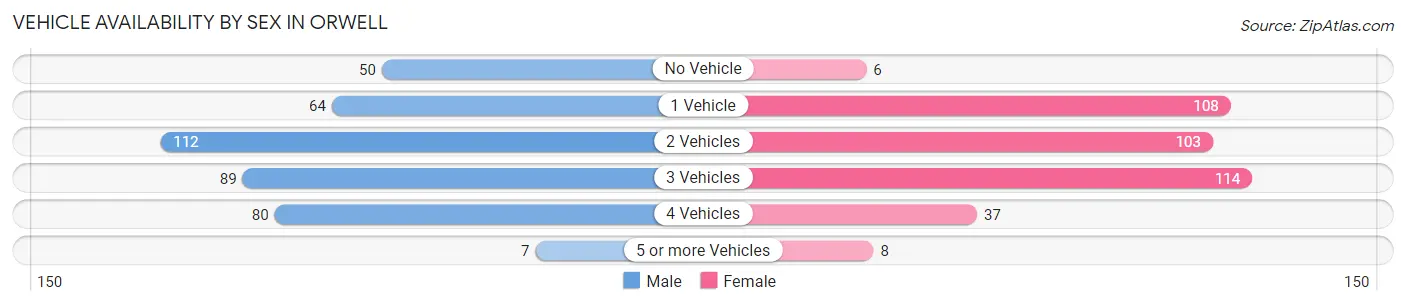
| Vehicles Available | Male | Female |
| No Vehicle | 50 (12.4%) | 6 (1.6%) |
| 1 Vehicle | 64 (15.9%) | 108 (28.7%) |
| 2 Vehicles | 112 (27.9%) | 103 (27.4%) |
| 3 Vehicles | 89 (22.1%) | 114 (30.3%) |
| 4 Vehicles | 80 (19.9%) | 37 (9.8%) |
| 5 or more Vehicles | 7 (1.7%) | 8 (2.1%) |
| Total | 402 (100.0%) | 376 (100.0%) |
Commute Time in Orwell
The most frequently occuring commute durations in Orwell are 5 to 9 minutes (143 commuters, 19.1%), less than 5 minutes (131 commuters, 17.5%), and 20 to 24 minutes (86 commuters, 11.5%).
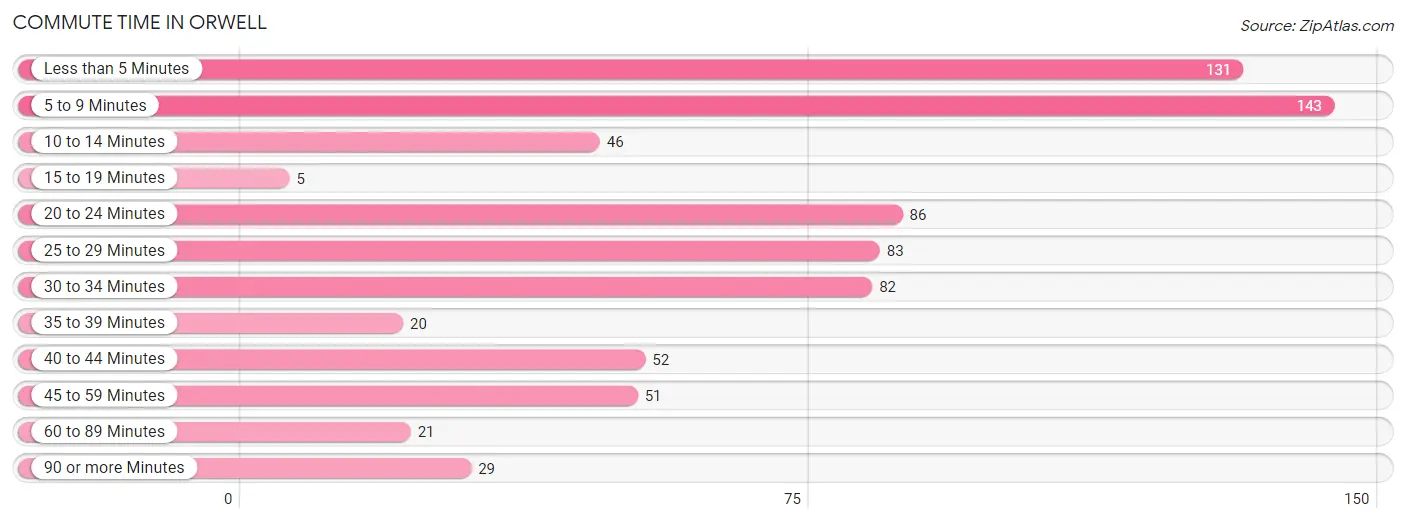
| Commute Time | # Commuters | % Commuters |
| Less than 5 Minutes | 131 | 17.5% |
| 5 to 9 Minutes | 143 | 19.1% |
| 10 to 14 Minutes | 46 | 6.1% |
| 15 to 19 Minutes | 5 | 0.7% |
| 20 to 24 Minutes | 86 | 11.5% |
| 25 to 29 Minutes | 83 | 11.1% |
| 30 to 34 Minutes | 82 | 11.0% |
| 35 to 39 Minutes | 20 | 2.7% |
| 40 to 44 Minutes | 52 | 6.9% |
| 45 to 59 Minutes | 51 | 6.8% |
| 60 to 89 Minutes | 21 | 2.8% |
| 90 or more Minutes | 29 | 3.9% |
Commute Time by Sex in Orwell
The most common commute times in Orwell are less than 5 minutes (93 commuters, 23.7%) for males and 5 to 9 minutes (115 commuters, 32.2%) for females.
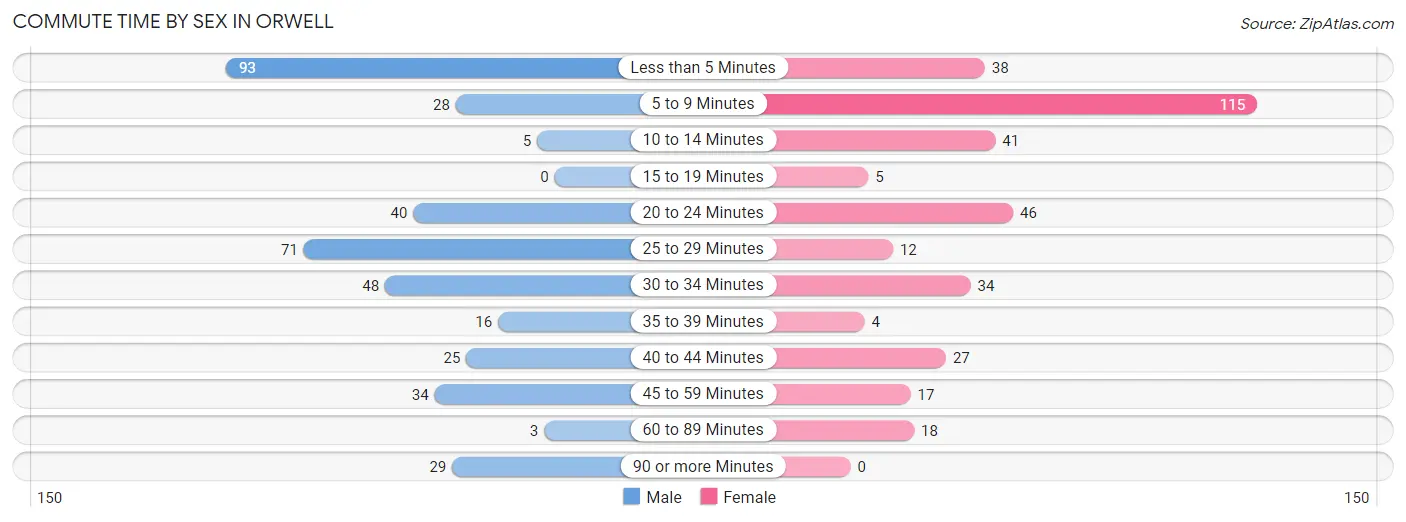
| Commute Time | Male | Female |
| Less than 5 Minutes | 93 (23.7%) | 38 (10.6%) |
| 5 to 9 Minutes | 28 (7.1%) | 115 (32.2%) |
| 10 to 14 Minutes | 5 (1.3%) | 41 (11.5%) |
| 15 to 19 Minutes | 0 (0.0%) | 5 (1.4%) |
| 20 to 24 Minutes | 40 (10.2%) | 46 (12.9%) |
| 25 to 29 Minutes | 71 (18.1%) | 12 (3.4%) |
| 30 to 34 Minutes | 48 (12.2%) | 34 (9.5%) |
| 35 to 39 Minutes | 16 (4.1%) | 4 (1.1%) |
| 40 to 44 Minutes | 25 (6.4%) | 27 (7.6%) |
| 45 to 59 Minutes | 34 (8.7%) | 17 (4.8%) |
| 60 to 89 Minutes | 3 (0.8%) | 18 (5.0%) |
| 90 or more Minutes | 29 (7.4%) | 0 (0.0%) |
Time of Departure to Work by Sex in Orwell
The most frequent times of departure to work in Orwell are 12:00 AM to 4:59 AM (80, 20.4%) for males and 8:00 AM to 8:29 AM (56, 15.7%) for females.
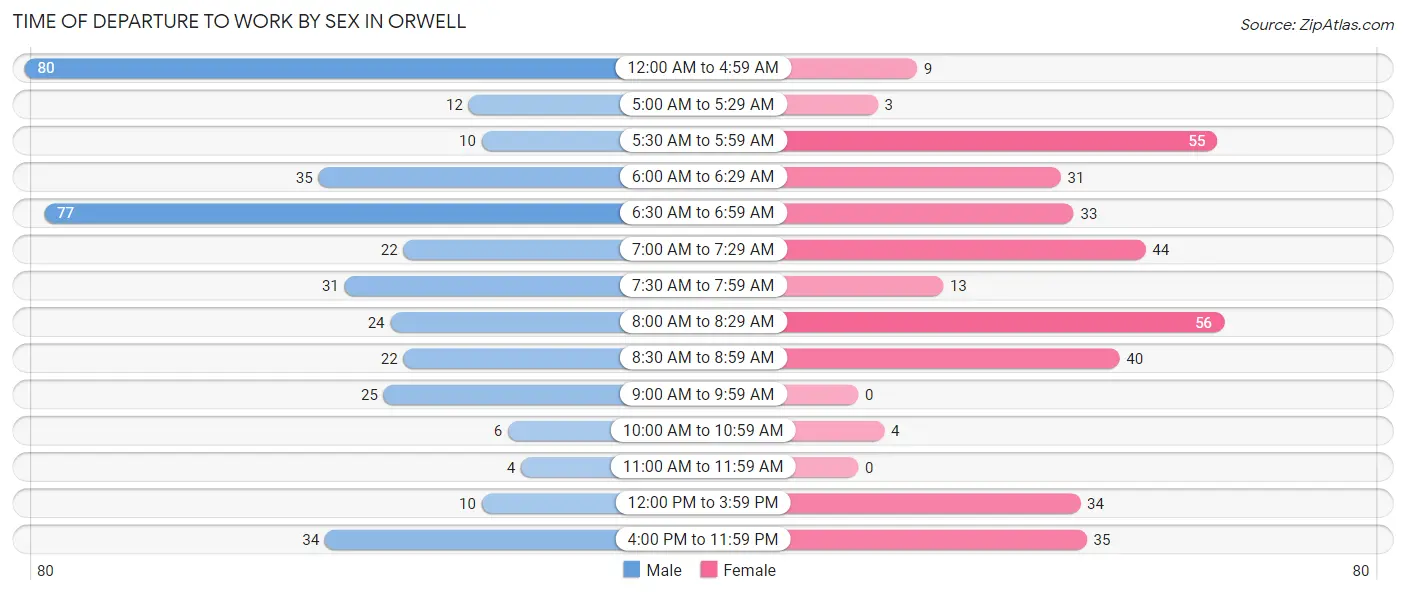
| Time of Departure | Male | Female |
| 12:00 AM to 4:59 AM | 80 (20.4%) | 9 (2.5%) |
| 5:00 AM to 5:29 AM | 12 (3.1%) | 3 (0.8%) |
| 5:30 AM to 5:59 AM | 10 (2.5%) | 55 (15.4%) |
| 6:00 AM to 6:29 AM | 35 (8.9%) | 31 (8.7%) |
| 6:30 AM to 6:59 AM | 77 (19.6%) | 33 (9.2%) |
| 7:00 AM to 7:29 AM | 22 (5.6%) | 44 (12.3%) |
| 7:30 AM to 7:59 AM | 31 (7.9%) | 13 (3.6%) |
| 8:00 AM to 8:29 AM | 24 (6.1%) | 56 (15.7%) |
| 8:30 AM to 8:59 AM | 22 (5.6%) | 40 (11.2%) |
| 9:00 AM to 9:59 AM | 25 (6.4%) | 0 (0.0%) |
| 10:00 AM to 10:59 AM | 6 (1.5%) | 4 (1.1%) |
| 11:00 AM to 11:59 AM | 4 (1.0%) | 0 (0.0%) |
| 12:00 PM to 3:59 PM | 10 (2.5%) | 34 (9.5%) |
| 4:00 PM to 11:59 PM | 34 (8.7%) | 35 (9.8%) |
| Total | 392 (100.0%) | 357 (100.0%) |
Housing Occupancy in Orwell
Occupancy by Ownership in Orwell
Of the total 689 dwellings in Orwell, owner-occupied units account for 313 (45.4%), while renter-occupied units make up 376 (54.6%).
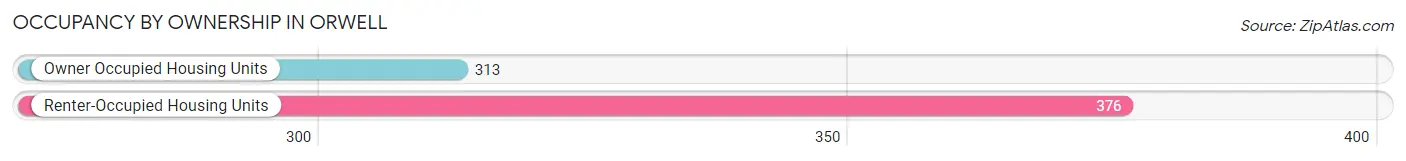
| Occupancy | # Housing Units | % Housing Units |
| Owner Occupied Housing Units | 313 | 45.4% |
| Renter-Occupied Housing Units | 376 | 54.6% |
| Total Occupied Housing Units | 689 | 100.0% |
Occupancy by Household Size in Orwell
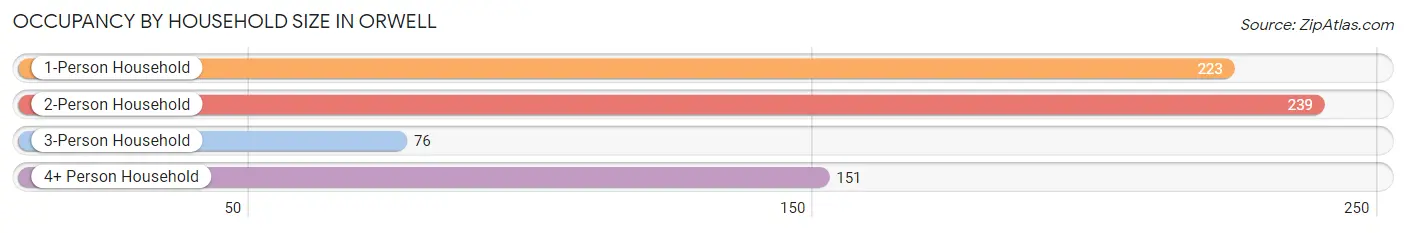
| Household Size | # Housing Units | % Housing Units |
| 1-Person Household | 223 | 32.4% |
| 2-Person Household | 239 | 34.7% |
| 3-Person Household | 76 | 11.0% |
| 4+ Person Household | 151 | 21.9% |
| Total Housing Units | 689 | 100.0% |
Occupancy by Ownership by Household Size in Orwell
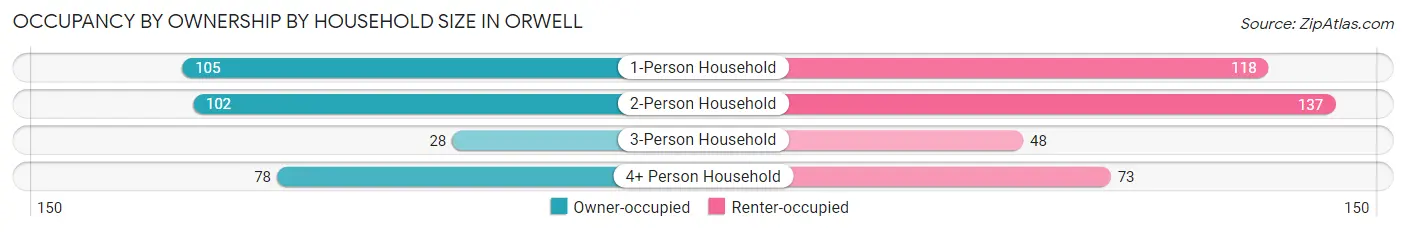
| Household Size | Owner-occupied | Renter-occupied |
| 1-Person Household | 105 (47.1%) | 118 (52.9%) |
| 2-Person Household | 102 (42.7%) | 137 (57.3%) |
| 3-Person Household | 28 (36.8%) | 48 (63.2%) |
| 4+ Person Household | 78 (51.7%) | 73 (48.3%) |
| Total Housing Units | 313 (45.4%) | 376 (54.6%) |
Occupancy by Educational Attainment in Orwell
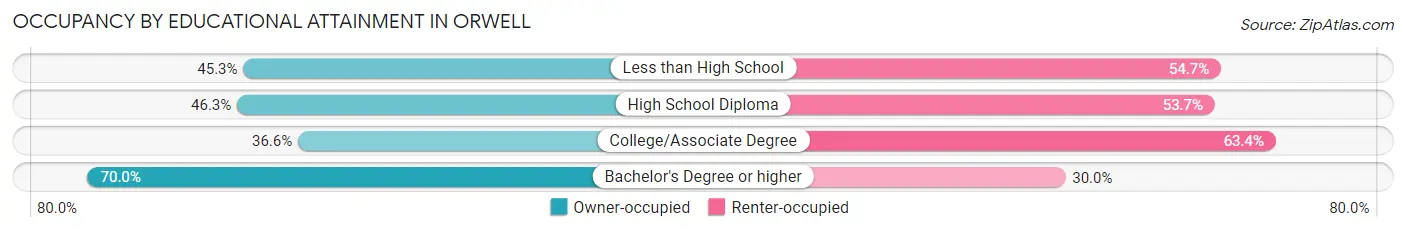
| Household Size | Owner-occupied | Renter-occupied |
| Less than High School | 53 (45.3%) | 64 (54.7%) |
| High School Diploma | 162 (46.3%) | 188 (53.7%) |
| College/Associate Degree | 63 (36.6%) | 109 (63.4%) |
| Bachelor's Degree or higher | 35 (70.0%) | 15 (30.0%) |
Occupancy by Age of Householder in Orwell
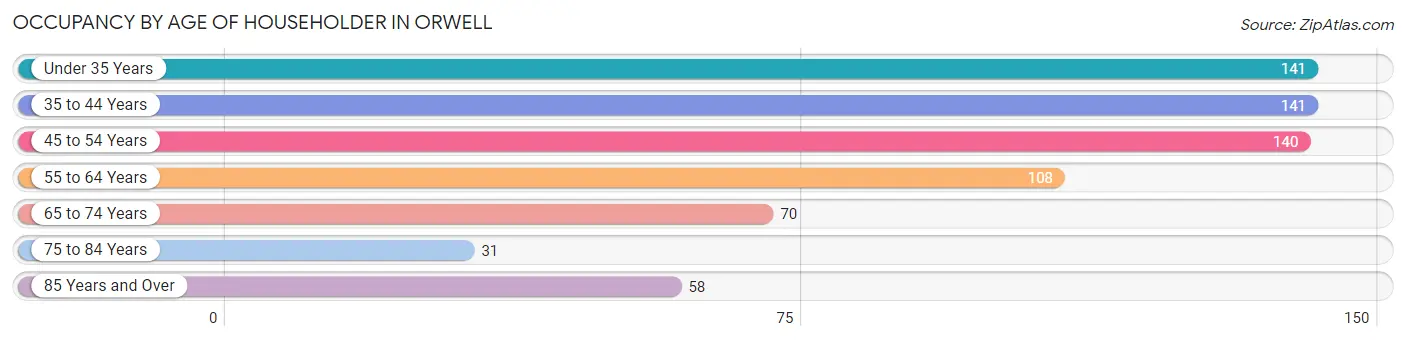
| Age Bracket | # Households | % Households |
| Under 35 Years | 141 | 20.5% |
| 35 to 44 Years | 141 | 20.5% |
| 45 to 54 Years | 140 | 20.3% |
| 55 to 64 Years | 108 | 15.7% |
| 65 to 74 Years | 70 | 10.2% |
| 75 to 84 Years | 31 | 4.5% |
| 85 Years and Over | 58 | 8.4% |
| Total | 689 | 100.0% |
Housing Finances in Orwell
Median Income by Occupancy in Orwell
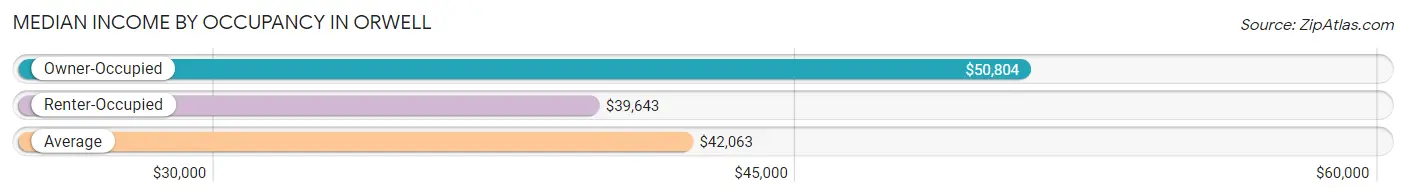
| Occupancy Type | # Households | Median Income |
| Owner-Occupied | 313 (45.4%) | $50,804 |
| Renter-Occupied | 376 (54.6%) | $39,643 |
| Average | 689 (100.0%) | $42,063 |
Occupancy by Householder Income Bracket in Orwell
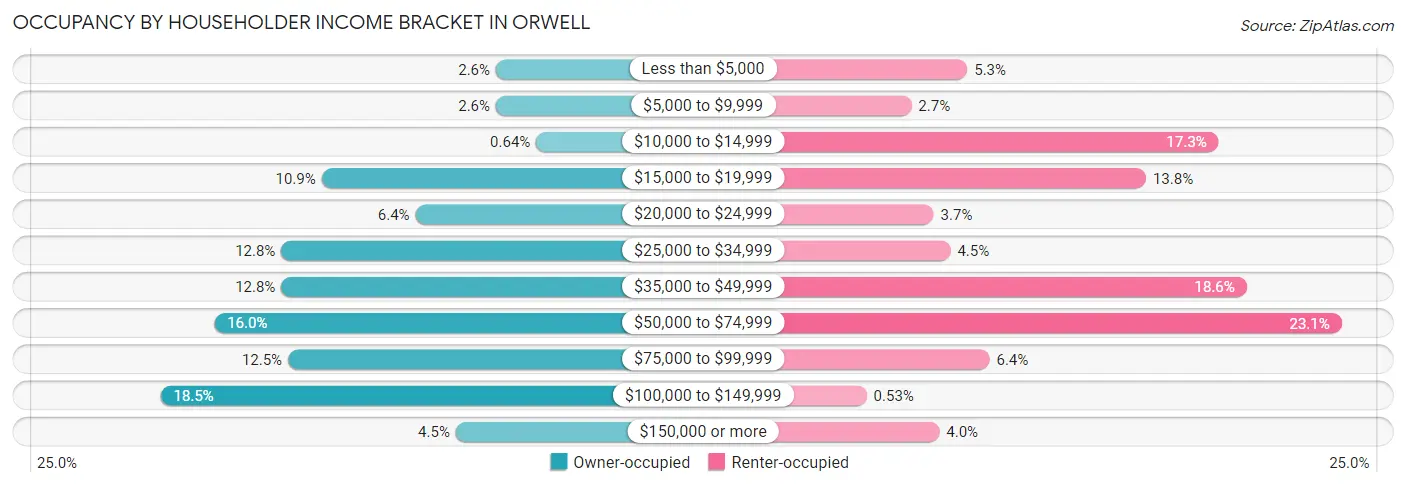
| Income Bracket | Owner-occupied | Renter-occupied |
| Less than $5,000 | 8 (2.6%) | 20 (5.3%) |
| $5,000 to $9,999 | 8 (2.6%) | 10 (2.7%) |
| $10,000 to $14,999 | 2 (0.6%) | 65 (17.3%) |
| $15,000 to $19,999 | 34 (10.9%) | 52 (13.8%) |
| $20,000 to $24,999 | 20 (6.4%) | 14 (3.7%) |
| $25,000 to $34,999 | 40 (12.8%) | 17 (4.5%) |
| $35,000 to $49,999 | 40 (12.8%) | 70 (18.6%) |
| $50,000 to $74,999 | 50 (16.0%) | 87 (23.1%) |
| $75,000 to $99,999 | 39 (12.5%) | 24 (6.4%) |
| $100,000 to $149,999 | 58 (18.5%) | 2 (0.5%) |
| $150,000 or more | 14 (4.5%) | 15 (4.0%) |
| Total | 313 (100.0%) | 376 (100.0%) |
Monthly Housing Cost Tiers in Orwell
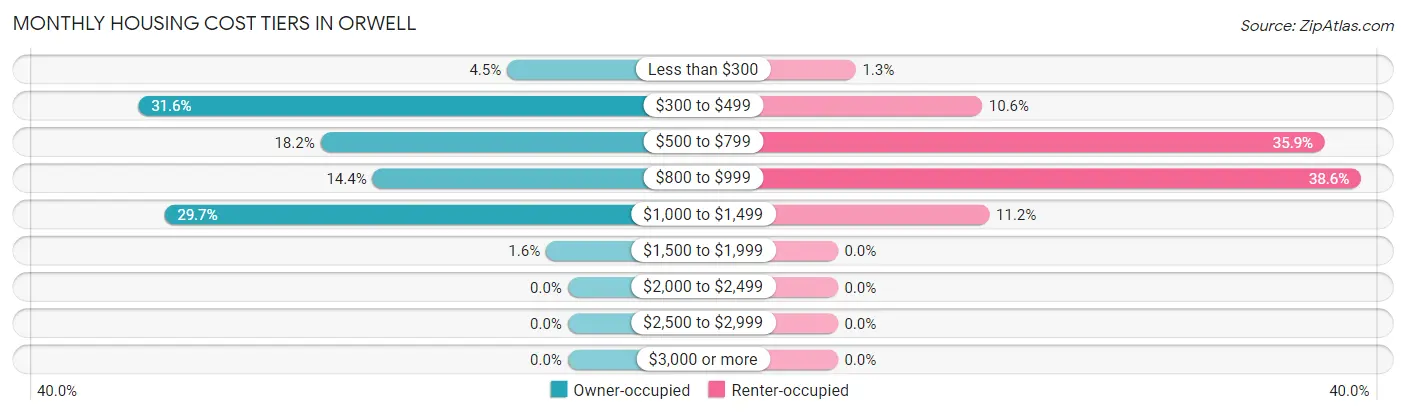
| Monthly Cost | Owner-occupied | Renter-occupied |
| Less than $300 | 14 (4.5%) | 5 (1.3%) |
| $300 to $499 | 99 (31.6%) | 40 (10.6%) |
| $500 to $799 | 57 (18.2%) | 135 (35.9%) |
| $800 to $999 | 45 (14.4%) | 145 (38.6%) |
| $1,000 to $1,499 | 93 (29.7%) | 42 (11.2%) |
| $1,500 to $1,999 | 5 (1.6%) | 0 (0.0%) |
| $2,000 to $2,499 | 0 (0.0%) | 0 (0.0%) |
| $2,500 to $2,999 | 0 (0.0%) | 0 (0.0%) |
| $3,000 or more | 0 (0.0%) | 0 (0.0%) |
| Total | 313 (100.0%) | 376 (100.0%) |
Physical Housing Characteristics in Orwell
Housing Structures in Orwell
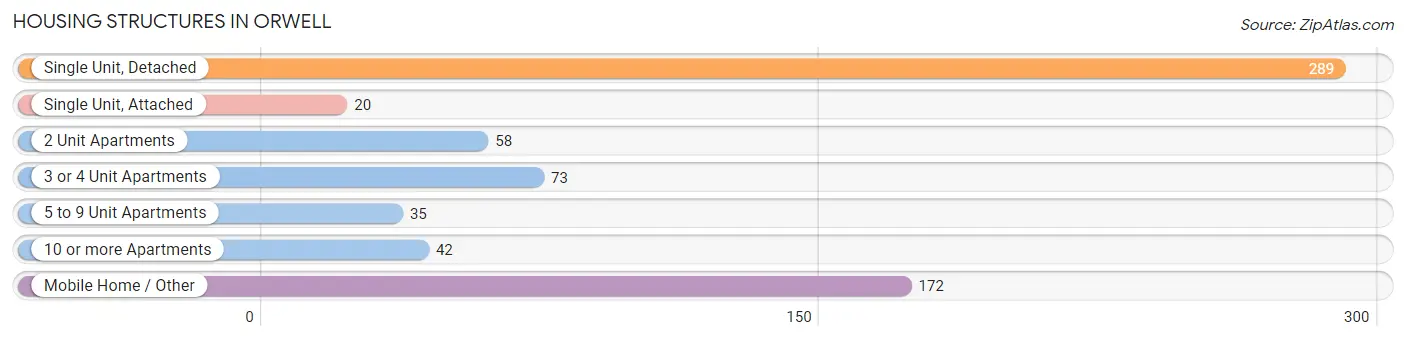
| Structure Type | # Housing Units | % Housing Units |
| Single Unit, Detached | 289 | 41.9% |
| Single Unit, Attached | 20 | 2.9% |
| 2 Unit Apartments | 58 | 8.4% |
| 3 or 4 Unit Apartments | 73 | 10.6% |
| 5 to 9 Unit Apartments | 35 | 5.1% |
| 10 or more Apartments | 42 | 6.1% |
| Mobile Home / Other | 172 | 25.0% |
| Total | 689 | 100.0% |
Housing Structures by Occupancy in Orwell
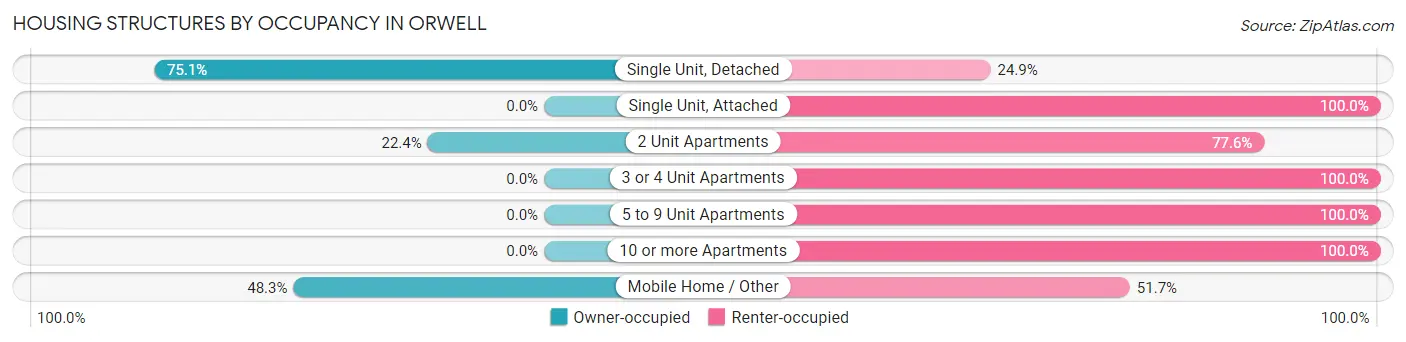
| Structure Type | Owner-occupied | Renter-occupied |
| Single Unit, Detached | 217 (75.1%) | 72 (24.9%) |
| Single Unit, Attached | 0 (0.0%) | 20 (100.0%) |
| 2 Unit Apartments | 13 (22.4%) | 45 (77.6%) |
| 3 or 4 Unit Apartments | 0 (0.0%) | 73 (100.0%) |
| 5 to 9 Unit Apartments | 0 (0.0%) | 35 (100.0%) |
| 10 or more Apartments | 0 (0.0%) | 42 (100.0%) |
| Mobile Home / Other | 83 (48.3%) | 89 (51.7%) |
| Total | 313 (45.4%) | 376 (54.6%) |
Housing Structures by Number of Rooms in Orwell
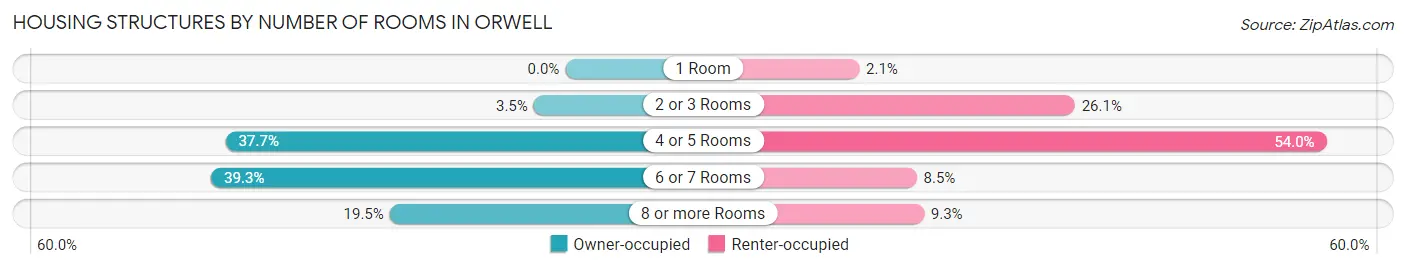
| Number of Rooms | Owner-occupied | Renter-occupied |
| 1 Room | 0 (0.0%) | 8 (2.1%) |
| 2 or 3 Rooms | 11 (3.5%) | 98 (26.1%) |
| 4 or 5 Rooms | 118 (37.7%) | 203 (54.0%) |
| 6 or 7 Rooms | 123 (39.3%) | 32 (8.5%) |
| 8 or more Rooms | 61 (19.5%) | 35 (9.3%) |
| Total | 313 (100.0%) | 376 (100.0%) |
Housing Structure by Heating Type in Orwell
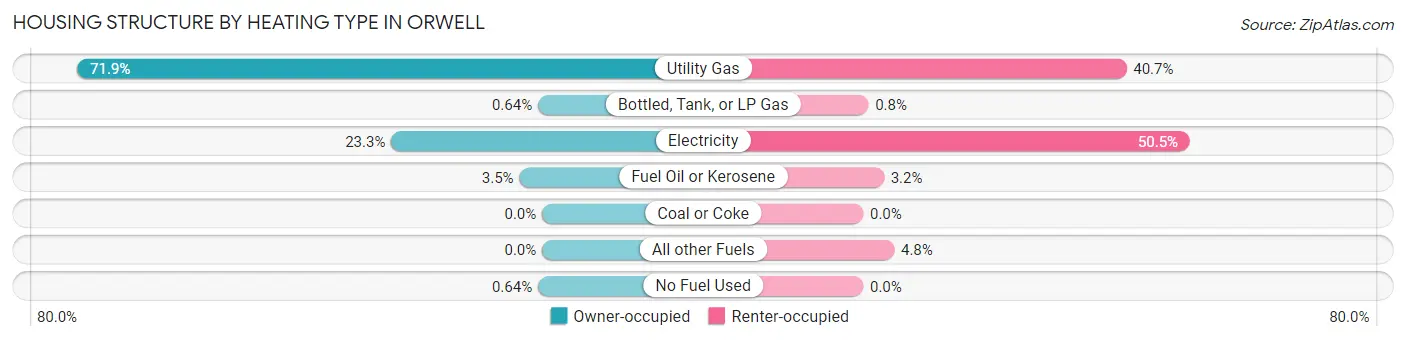
| Heating Type | Owner-occupied | Renter-occupied |
| Utility Gas | 225 (71.9%) | 153 (40.7%) |
| Bottled, Tank, or LP Gas | 2 (0.6%) | 3 (0.8%) |
| Electricity | 73 (23.3%) | 190 (50.5%) |
| Fuel Oil or Kerosene | 11 (3.5%) | 12 (3.2%) |
| Coal or Coke | 0 (0.0%) | 0 (0.0%) |
| All other Fuels | 0 (0.0%) | 18 (4.8%) |
| No Fuel Used | 2 (0.6%) | 0 (0.0%) |
| Total | 313 (100.0%) | 376 (100.0%) |
Household Vehicle Usage in Orwell
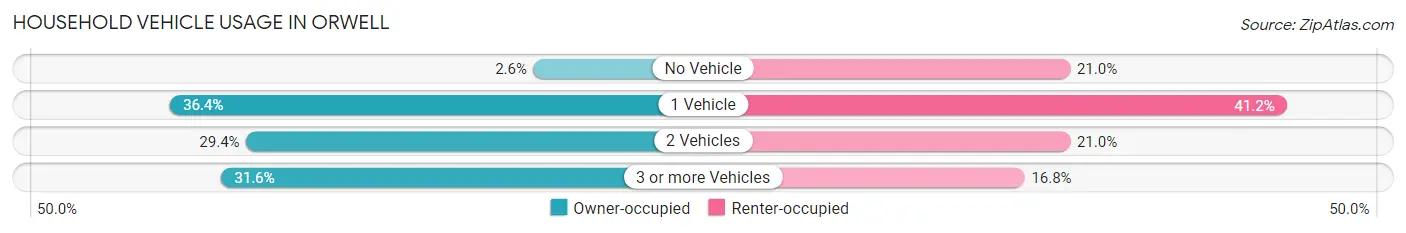
| Vehicles per Household | Owner-occupied | Renter-occupied |
| No Vehicle | 8 (2.6%) | 79 (21.0%) |
| 1 Vehicle | 114 (36.4%) | 155 (41.2%) |
| 2 Vehicles | 92 (29.4%) | 79 (21.0%) |
| 3 or more Vehicles | 99 (31.6%) | 63 (16.8%) |
| Total | 313 (100.0%) | 376 (100.0%) |
Real Estate & Mortgages in Orwell
Real Estate and Mortgage Overview in Orwell
| Characteristic | Without Mortgage | With Mortgage |
| Housing Units | 166 | 147 |
| Median Property Value | - | - |
| Median Household Income | $30,833 | $4 |
| Monthly Housing Costs | $443 | $0 |
| Real Estate Taxes | $617 | $0 |
Property Value by Mortgage Status in Orwell
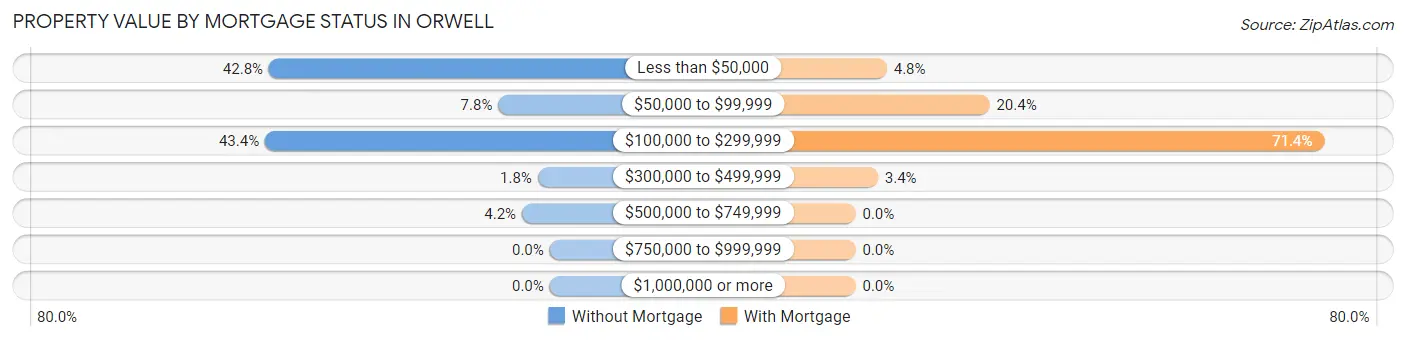
| Property Value | Without Mortgage | With Mortgage |
| Less than $50,000 | 71 (42.8%) | 7 (4.8%) |
| $50,000 to $99,999 | 13 (7.8%) | 30 (20.4%) |
| $100,000 to $299,999 | 72 (43.4%) | 105 (71.4%) |
| $300,000 to $499,999 | 3 (1.8%) | 5 (3.4%) |
| $500,000 to $749,999 | 7 (4.2%) | 0 (0.0%) |
| $750,000 to $999,999 | 0 (0.0%) | 0 (0.0%) |
| $1,000,000 or more | 0 (0.0%) | 0 (0.0%) |
| Total | 166 (100.0%) | 147 (100.0%) |
Household Income by Mortgage Status in Orwell
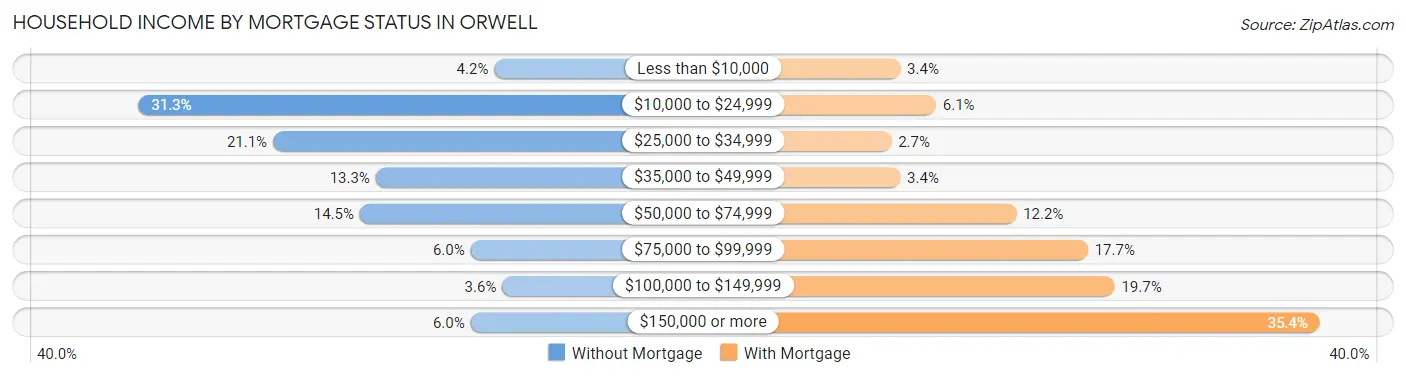
| Household Income | Without Mortgage | With Mortgage |
| Less than $10,000 | 7 (4.2%) | 5 (3.4%) |
| $10,000 to $24,999 | 52 (31.3%) | 9 (6.1%) |
| $25,000 to $34,999 | 35 (21.1%) | 4 (2.7%) |
| $35,000 to $49,999 | 22 (13.3%) | 5 (3.4%) |
| $50,000 to $74,999 | 24 (14.5%) | 18 (12.2%) |
| $75,000 to $99,999 | 10 (6.0%) | 26 (17.7%) |
| $100,000 to $149,999 | 6 (3.6%) | 29 (19.7%) |
| $150,000 or more | 10 (6.0%) | 52 (35.4%) |
| Total | 166 (100.0%) | 147 (100.0%) |
Property Value to Household Income Ratio in Orwell
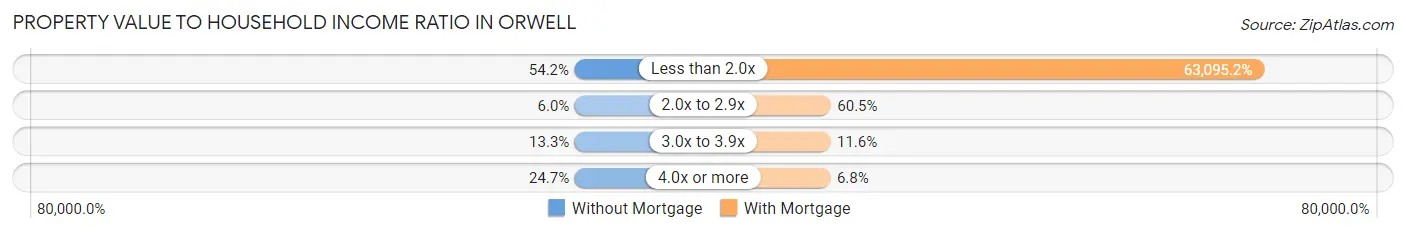
| Value-to-Income Ratio | Without Mortgage | With Mortgage |
| Less than 2.0x | 90 (54.2%) | 92,750 (63,095.2%) |
| 2.0x to 2.9x | 10 (6.0%) | 89 (60.5%) |
| 3.0x to 3.9x | 22 (13.3%) | 17 (11.6%) |
| 4.0x or more | 41 (24.7%) | 10 (6.8%) |
| Total | 166 (100.0%) | 147 (100.0%) |
Real Estate Taxes by Mortgage Status in Orwell
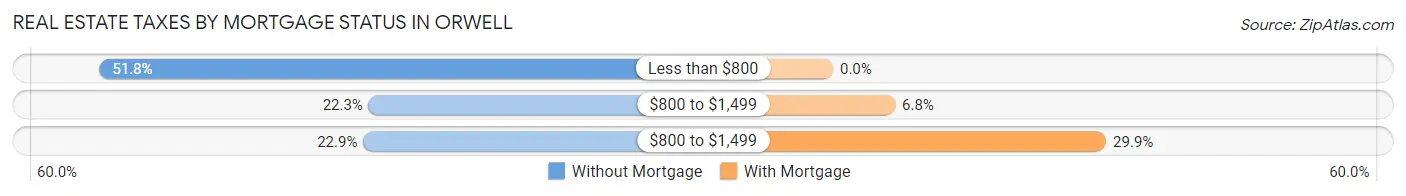
| Property Taxes | Without Mortgage | With Mortgage |
| Less than $800 | 86 (51.8%) | 0 (0.0%) |
| $800 to $1,499 | 37 (22.3%) | 10 (6.8%) |
| $800 to $1,499 | 38 (22.9%) | 44 (29.9%) |
| Total | 166 (100.0%) | 147 (100.0%) |
Health & Disability in Orwell
Health Insurance Coverage by Age in Orwell
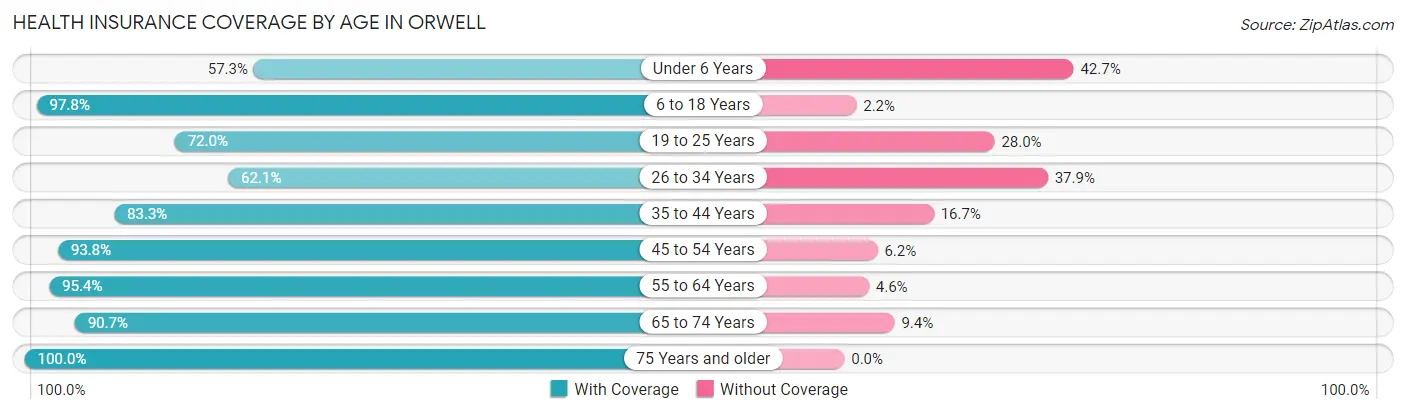
| Age Bracket | With Coverage | Without Coverage |
| Under 6 Years | 71 (57.3%) | 53 (42.7%) |
| 6 to 18 Years | 350 (97.8%) | 8 (2.2%) |
| 19 to 25 Years | 144 (72.0%) | 56 (28.0%) |
| 26 to 34 Years | 157 (62.1%) | 96 (37.9%) |
| 35 to 44 Years | 210 (83.3%) | 42 (16.7%) |
| 45 to 54 Years | 212 (93.8%) | 14 (6.2%) |
| 55 to 64 Years | 125 (95.4%) | 6 (4.6%) |
| 65 to 74 Years | 97 (90.6%) | 10 (9.3%) |
| 75 Years and older | 104 (100.0%) | 0 (0.0%) |
| Total | 1,470 (83.8%) | 285 (16.2%) |
Health Insurance Coverage by Citizenship Status in Orwell
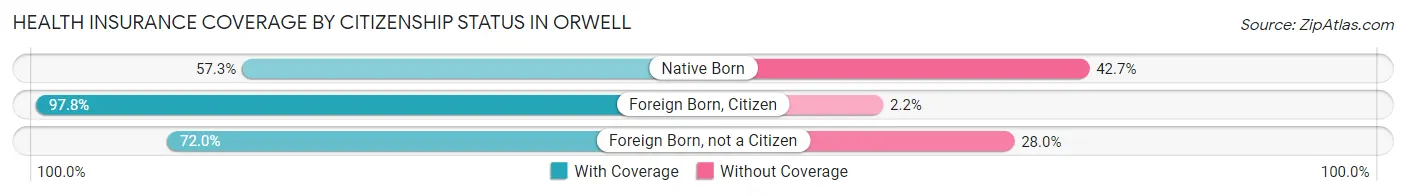
| Citizenship Status | With Coverage | Without Coverage |
| Native Born | 71 (57.3%) | 53 (42.7%) |
| Foreign Born, Citizen | 350 (97.8%) | 8 (2.2%) |
| Foreign Born, not a Citizen | 144 (72.0%) | 56 (28.0%) |
Health Insurance Coverage by Household Income in Orwell
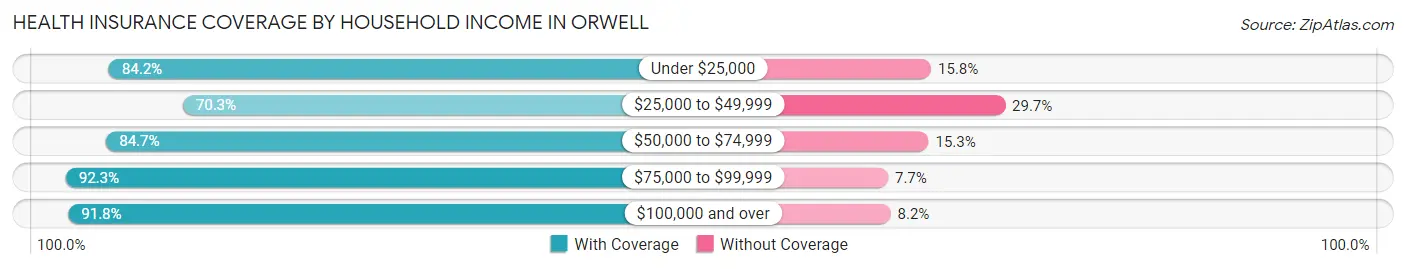
| Household Income | With Coverage | Without Coverage |
| Under $25,000 | 341 (84.2%) | 64 (15.8%) |
| $25,000 to $49,999 | 249 (70.3%) | 105 (29.7%) |
| $50,000 to $74,999 | 420 (84.7%) | 76 (15.3%) |
| $75,000 to $99,999 | 203 (92.3%) | 17 (7.7%) |
| $100,000 and over | 257 (91.8%) | 23 (8.2%) |
Public vs Private Health Insurance Coverage by Age in Orwell
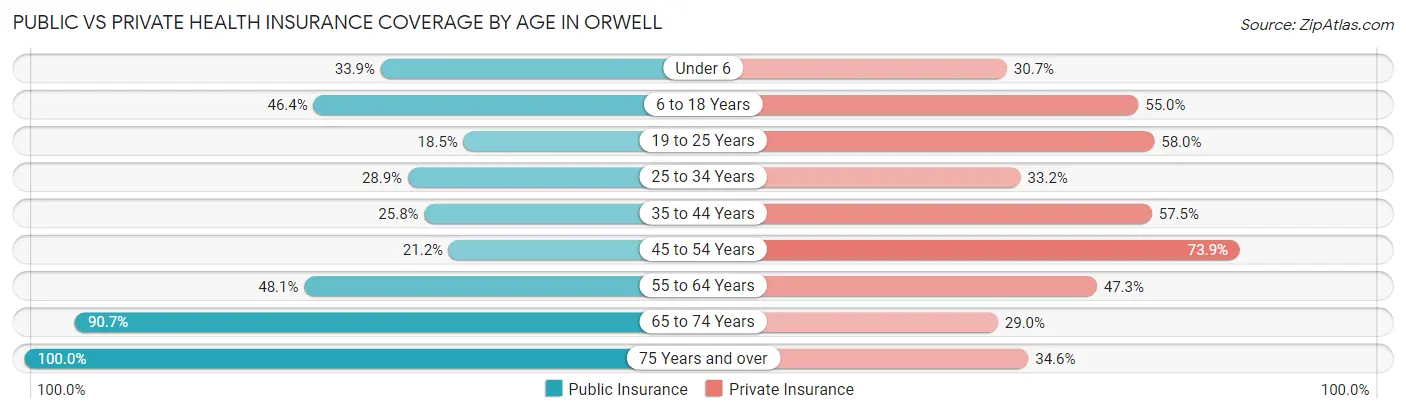
| Age Bracket | Public Insurance | Private Insurance |
| Under 6 | 42 (33.9%) | 38 (30.6%) |
| 6 to 18 Years | 166 (46.4%) | 197 (55.0%) |
| 19 to 25 Years | 37 (18.5%) | 116 (58.0%) |
| 25 to 34 Years | 73 (28.8%) | 84 (33.2%) |
| 35 to 44 Years | 65 (25.8%) | 145 (57.5%) |
| 45 to 54 Years | 48 (21.2%) | 167 (73.9%) |
| 55 to 64 Years | 63 (48.1%) | 62 (47.3%) |
| 65 to 74 Years | 97 (90.6%) | 31 (29.0%) |
| 75 Years and over | 104 (100.0%) | 36 (34.6%) |
| Total | 695 (39.6%) | 876 (49.9%) |
Disability Status by Sex by Age in Orwell
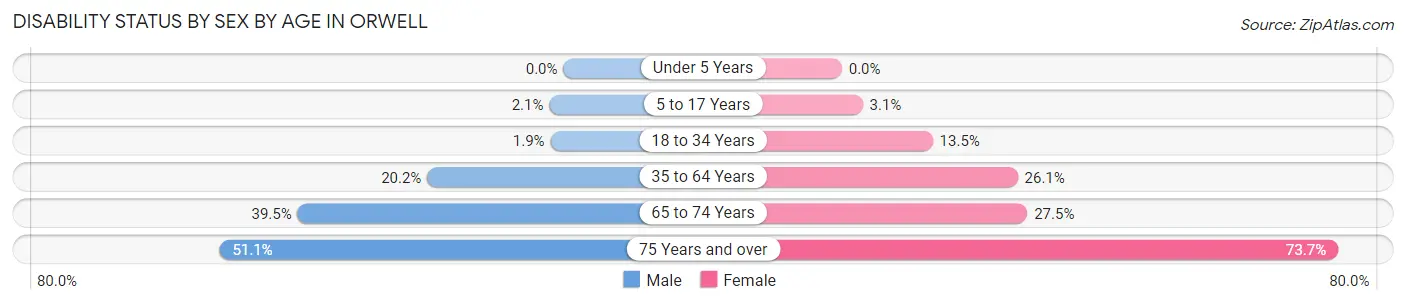
| Age Bracket | Male | Female |
| Under 5 Years | 0 (0.0%) | 0 (0.0%) |
| 5 to 17 Years | 4 (2.1%) | 5 (3.1%) |
| 18 to 34 Years | 5 (1.9%) | 29 (13.5%) |
| 35 to 64 Years | 55 (20.2%) | 88 (26.1%) |
| 65 to 74 Years | 15 (39.5%) | 19 (27.5%) |
| 75 Years and over | 24 (51.1%) | 42 (73.7%) |
Disability Class by Sex by Age in Orwell
Disability Class: Hearing Difficulty
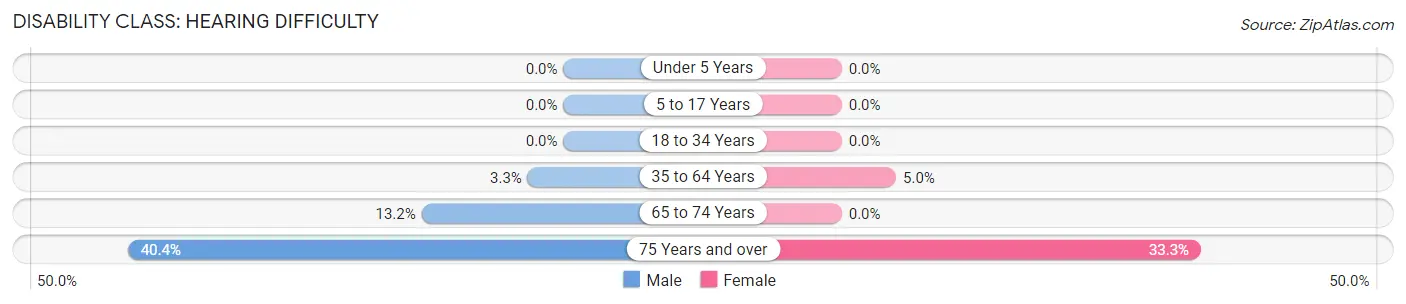
| Age Bracket | Male | Female |
| Under 5 Years | 0 (0.0%) | 0 (0.0%) |
| 5 to 17 Years | 0 (0.0%) | 0 (0.0%) |
| 18 to 34 Years | 0 (0.0%) | 0 (0.0%) |
| 35 to 64 Years | 9 (3.3%) | 17 (5.0%) |
| 65 to 74 Years | 5 (13.2%) | 0 (0.0%) |
| 75 Years and over | 19 (40.4%) | 19 (33.3%) |
Disability Class: Vision Difficulty
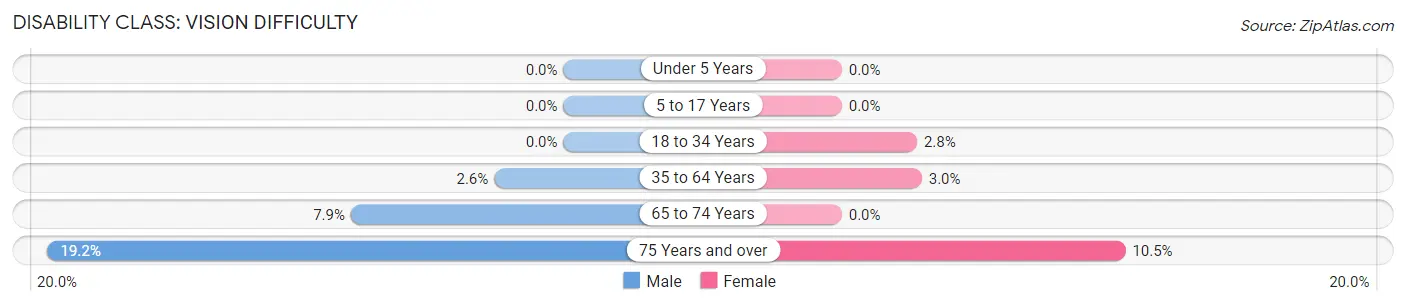
| Age Bracket | Male | Female |
| Under 5 Years | 0 (0.0%) | 0 (0.0%) |
| 5 to 17 Years | 0 (0.0%) | 0 (0.0%) |
| 18 to 34 Years | 0 (0.0%) | 6 (2.8%) |
| 35 to 64 Years | 7 (2.6%) | 10 (3.0%) |
| 65 to 74 Years | 3 (7.9%) | 0 (0.0%) |
| 75 Years and over | 9 (19.2%) | 6 (10.5%) |
Disability Class: Cognitive Difficulty
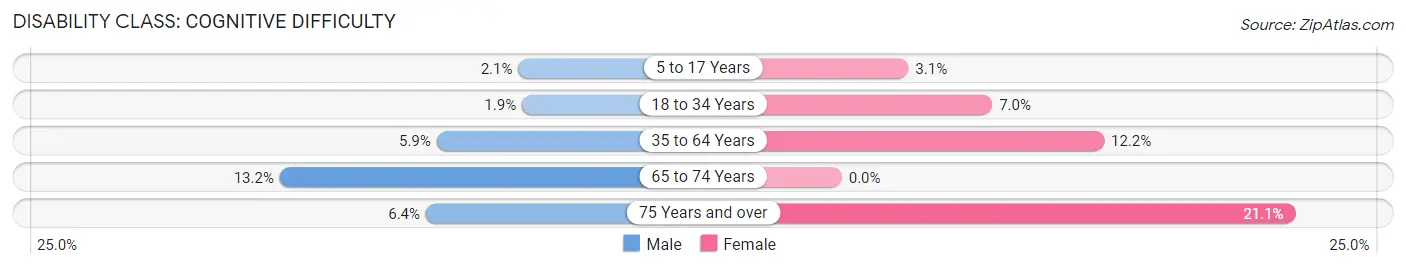
| Age Bracket | Male | Female |
| 5 to 17 Years | 4 (2.1%) | 5 (3.1%) |
| 18 to 34 Years | 5 (1.9%) | 15 (7.0%) |
| 35 to 64 Years | 16 (5.9%) | 41 (12.2%) |
| 65 to 74 Years | 5 (13.2%) | 0 (0.0%) |
| 75 Years and over | 3 (6.4%) | 12 (21.0%) |
Disability Class: Ambulatory Difficulty
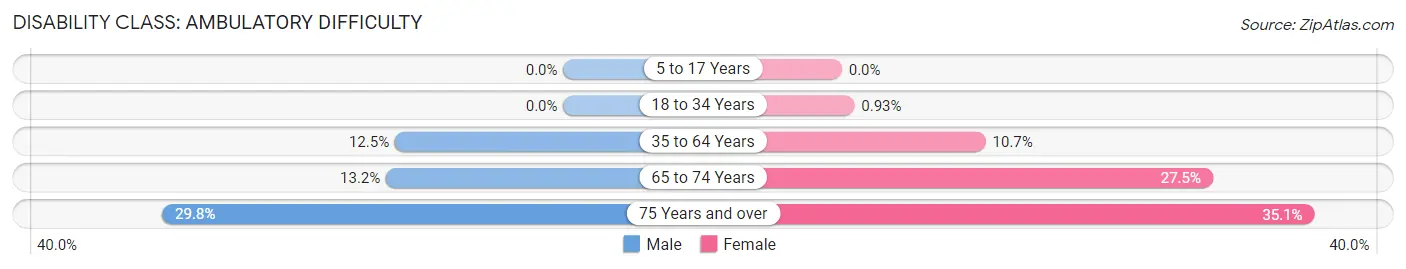
| Age Bracket | Male | Female |
| 5 to 17 Years | 0 (0.0%) | 0 (0.0%) |
| 18 to 34 Years | 0 (0.0%) | 2 (0.9%) |
| 35 to 64 Years | 34 (12.5%) | 36 (10.7%) |
| 65 to 74 Years | 5 (13.2%) | 19 (27.5%) |
| 75 Years and over | 14 (29.8%) | 20 (35.1%) |
Disability Class: Self-Care Difficulty
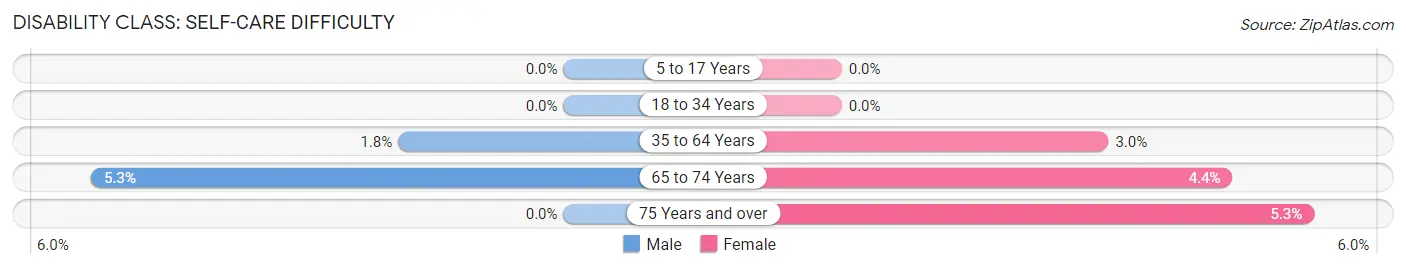
| Age Bracket | Male | Female |
| 5 to 17 Years | 0 (0.0%) | 0 (0.0%) |
| 18 to 34 Years | 0 (0.0%) | 0 (0.0%) |
| 35 to 64 Years | 5 (1.8%) | 10 (3.0%) |
| 65 to 74 Years | 2 (5.3%) | 3 (4.3%) |
| 75 Years and over | 0 (0.0%) | 3 (5.3%) |
Technology Access in Orwell
Computing Device Access in Orwell
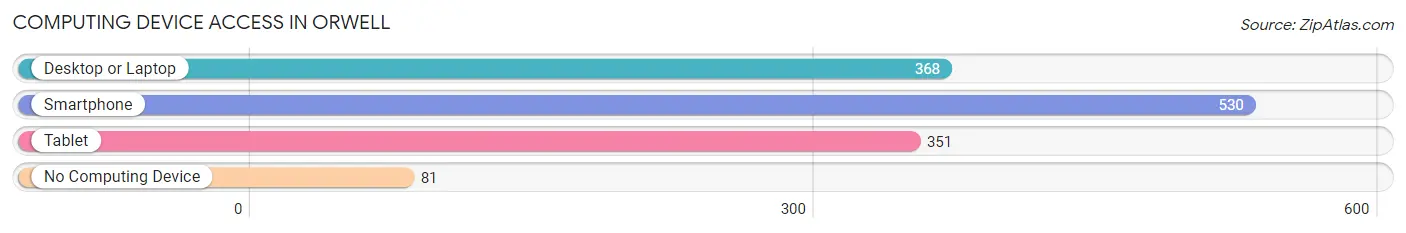
| Device Type | # Households | % Households |
| Desktop or Laptop | 368 | 53.4% |
| Smartphone | 530 | 76.9% |
| Tablet | 351 | 50.9% |
| No Computing Device | 81 | 11.8% |
| Total | 689 | 100.0% |
Internet Access in Orwell
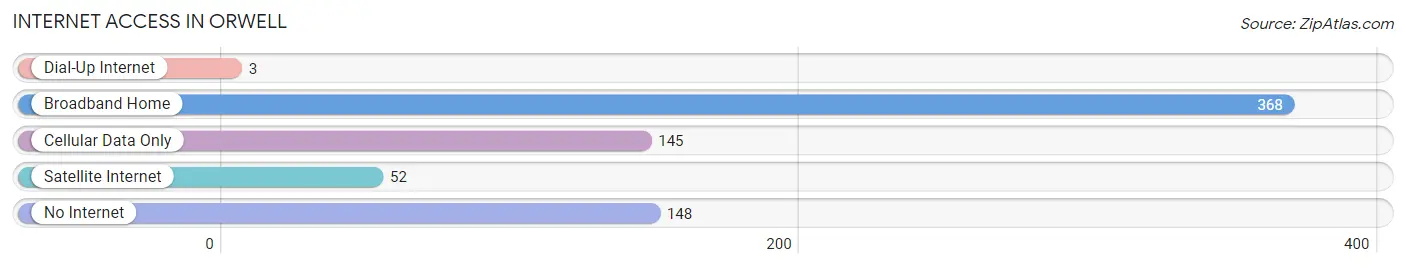
| Internet Type | # Households | % Households |
| Dial-Up Internet | 3 | 0.4% |
| Broadband Home | 368 | 53.4% |
| Cellular Data Only | 145 | 21.0% |
| Satellite Internet | 52 | 7.5% |
| No Internet | 148 | 21.5% |
| Total | 689 | 100.0% |
Orwell Summary
Orwell, Ohio is a small village located in Ashtabula County, Ohio. It is situated on the banks of the Grand River, approximately 30 miles east of Cleveland. The village was founded in 1817 and has a population of approximately 1,400 people.
History
The area that is now Orwell was first settled in 1817 by a group of settlers from Connecticut. The village was originally known as Grand River, but was later renamed Orwell in 1832 after the English author George Orwell. The village was incorporated in 1837 and was the first village in Ashtabula County to be incorporated.
The village of Orwell was an important stop on the Underground Railroad, with many of the local residents helping to hide and transport escaped slaves. The village was also home to a number of abolitionists, including the Reverend John Rankin, who was a prominent figure in the anti-slavery movement.
In the late 19th century, Orwell was a thriving agricultural community. The village was home to a number of mills, including a grist mill, a saw mill, and a woolen mill. The village also had a number of stores, including a general store, a drug store, and a hardware store.
Geography
Orwell is located in the northeast corner of Ashtabula County, Ohio. The village is situated on the banks of the Grand River, approximately 30 miles east of Cleveland. The village is surrounded by rolling hills and farmland, and is located in the heart of the Grand River Valley.
The climate in Orwell is typical of the Midwest, with cold winters and hot summers. The average temperature in the winter is around 25 degrees Fahrenheit, and the average temperature in the summer is around 75 degrees Fahrenheit.
Economy
The economy of Orwell is largely based on agriculture. The village is home to a number of farms, including dairy farms, beef farms, and vegetable farms. The village also has a number of small businesses, including a grocery store, a hardware store, and a restaurant.
The village is also home to a number of manufacturing companies, including a plastics manufacturer and a metal fabrication company. The village is also home to a number of service-based businesses, including a bank, a post office, and a library.
Demographics
As of the 2010 census, the population of Orwell was 1,400 people. The racial makeup of the village was 97.3% White, 0.7% African American, 0.3% Native American, 0.3% Asian, and 1.3% from other races. The median household income in the village was $41,250, and the median family income was $50,000.
The village is home to a number of churches, including the First Congregational Church, the First Presbyterian Church, and the First United Methodist Church. The village is also home to a number of schools, including the Orwell Elementary School, the Orwell Middle School, and the Orwell High School.
Common Questions
What is Per Capita Income in Orwell?
Per Capita income in Orwell is $21,837.
What is the Median Family Income in Orwell?
Median Family Income in Orwell is $55,109.
What is the Median Household income in Orwell?
Median Household Income in Orwell is $42,063.
What is Income or Wage Gap in Orwell?
Income or Wage Gap in Orwell is 19.3%.
Women in Orwell earn 80.7 cents for every dollar earned by a man.
What is Family Income Deficit in Orwell?
Family Income Deficit in Orwell is $6,855.
Families that are below poverty line in Orwell earn $6,855 less on average than the poverty threshold level.
What is Inequality or Gini Index in Orwell?
Inequality or Gini Index in Orwell is 0.44.
What is the Total Population of Orwell?
Total Population of Orwell is 1,804.
What is the Total Male Population of Orwell?
Total Male Population of Orwell is 893.
What is the Total Female Population of Orwell?
Total Female Population of Orwell is 911.
What is the Ratio of Males per 100 Females in Orwell?
There are 98.02 Males per 100 Females in Orwell.
What is the Ratio of Females per 100 Males in Orwell?
There are 102.02 Females per 100 Males in Orwell.
What is the Median Population Age in Orwell?
Median Population Age in Orwell is 34.3 Years.
What is the Average Family Size in Orwell
Average Family Size in Orwell is 3.3 People.
What is the Average Household Size in Orwell
Average Household Size in Orwell is 2.5 People.
How Large is the Labor Force in Orwell?
There are 874 People in the Labor Forcein in Orwell.
What is the Percentage of People in the Labor Force in Orwell?
62.2% of People are in the Labor Force in Orwell.
What is the Unemployment Rate in Orwell?
Unemployment Rate in Orwell is 7.0%.