Highland Hills, OH Map & Demographics
Highland Hills Map
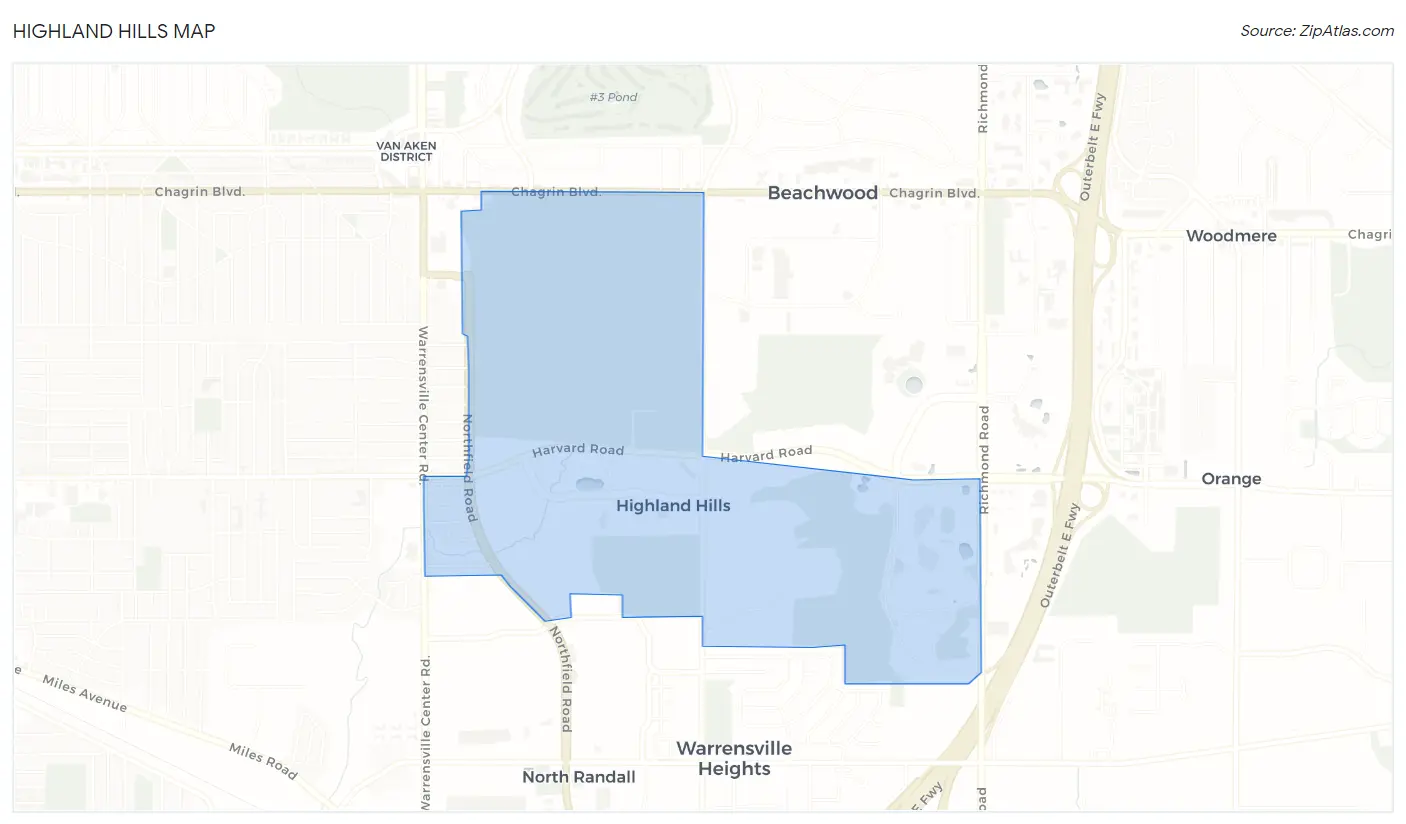
Highland Hills Overview
$23,378
PER CAPITA INCOME
$94,375
AVG FAMILY INCOME
$25,500
AVG HOUSEHOLD INCOME
34.1%
WAGE / INCOME GAP [ % ]
65.9¢/ $1
WAGE / INCOME GAP [ $ ]
0.64
INEQUALITY / GINI INDEX
699
TOTAL POPULATION
447
MALE POPULATION
252
FEMALE POPULATION
177.38
MALES / 100 FEMALES
56.38
FEMALES / 100 MALES
46.1
MEDIAN AGE
3.1
AVG FAMILY SIZE
1.7
AVG HOUSEHOLD SIZE
198
LABOR FORCE [ PEOPLE ]
29.2%
PERCENT IN LABOR FORCE
2.0%
UNEMPLOYMENT RATE
Income in Highland Hills
Income Overview in Highland Hills
Per Capita Income in Highland Hills is $23,378, while median incomes of families and households are $94,375 and $25,500 respectively.
| Characteristic | Number | Measure |
| Per Capita Income | 699 | $23,378 |
| Median Family Income | 65 | $94,375 |
| Mean Family Income | 65 | $110,711 |
| Median Household Income | 218 | $25,500 |
| Mean Household Income | 218 | $64,937 |
| Income Deficit | 65 | $0 |
| Wage / Income Gap (%) | 699 | 34.06% |
| Wage / Income Gap ($) | 699 | 65.94¢ per $1 |
| Gini / Inequality Index | 699 | 0.64 |
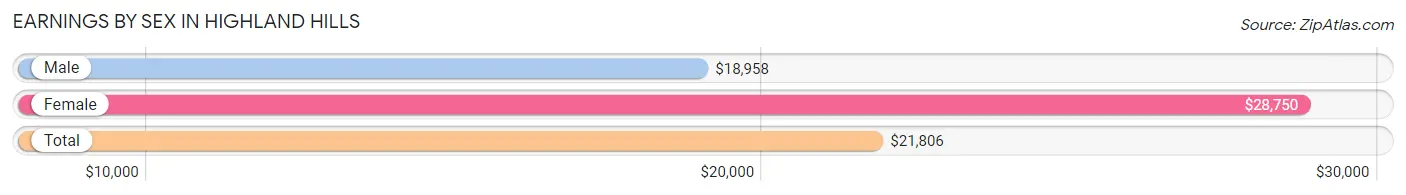
Earnings by Sex in Highland Hills
Average Earnings in Highland Hills are $21,806, $18,958 for men and $28,750 for women, a difference of 34.1%.
| Sex | Number | Average Earnings |
| Male | 126 (52.7%) | $18,958 |
| Female | 113 (47.3%) | $28,750 |
| Total | 239 (100.0%) | $21,806 |
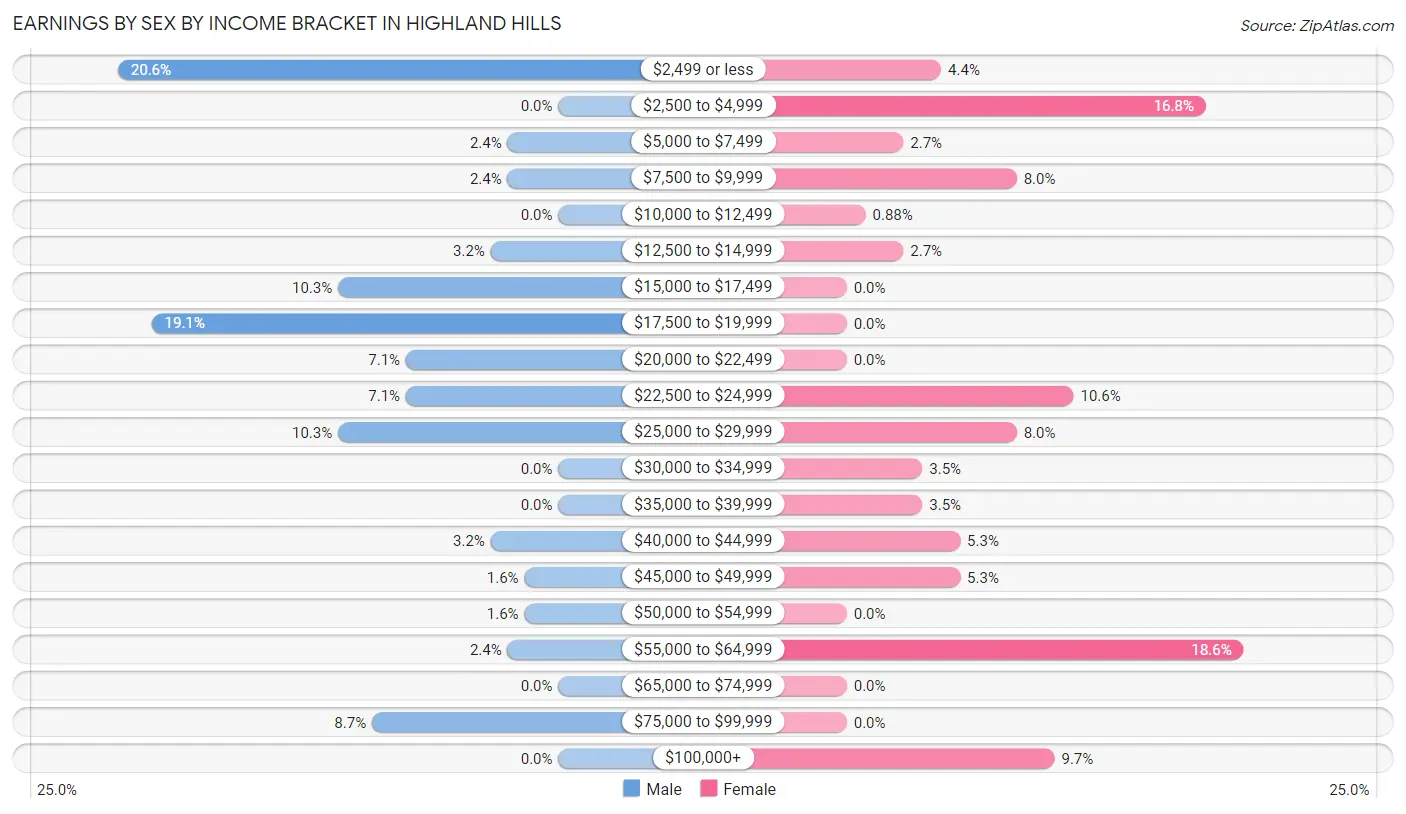
Earnings by Sex by Income Bracket in Highland Hills
The most common earnings brackets in Highland Hills are $2,499 or less for men (26 | 20.6%) and $55,000 to $64,999 for women (21 | 18.6%).
| Income | Male | Female |
| $2,499 or less | 26 (20.6%) | 5 (4.4%) |
| $2,500 to $4,999 | 0 (0.0%) | 19 (16.8%) |
| $5,000 to $7,499 | 3 (2.4%) | 3 (2.6%) |
| $7,500 to $9,999 | 3 (2.4%) | 9 (8.0%) |
| $10,000 to $12,499 | 0 (0.0%) | 1 (0.9%) |
| $12,500 to $14,999 | 4 (3.2%) | 3 (2.6%) |
| $15,000 to $17,499 | 13 (10.3%) | 0 (0.0%) |
| $17,500 to $19,999 | 24 (19.1%) | 0 (0.0%) |
| $20,000 to $22,499 | 9 (7.1%) | 0 (0.0%) |
| $22,500 to $24,999 | 9 (7.1%) | 12 (10.6%) |
| $25,000 to $29,999 | 13 (10.3%) | 9 (8.0%) |
| $30,000 to $34,999 | 0 (0.0%) | 4 (3.5%) |
| $35,000 to $39,999 | 0 (0.0%) | 4 (3.5%) |
| $40,000 to $44,999 | 4 (3.2%) | 6 (5.3%) |
| $45,000 to $49,999 | 2 (1.6%) | 6 (5.3%) |
| $50,000 to $54,999 | 2 (1.6%) | 0 (0.0%) |
| $55,000 to $64,999 | 3 (2.4%) | 21 (18.6%) |
| $65,000 to $74,999 | 0 (0.0%) | 0 (0.0%) |
| $75,000 to $99,999 | 11 (8.7%) | 0 (0.0%) |
| $100,000+ | 0 (0.0%) | 11 (9.7%) |
| Total | 126 (100.0%) | 113 (100.0%) |
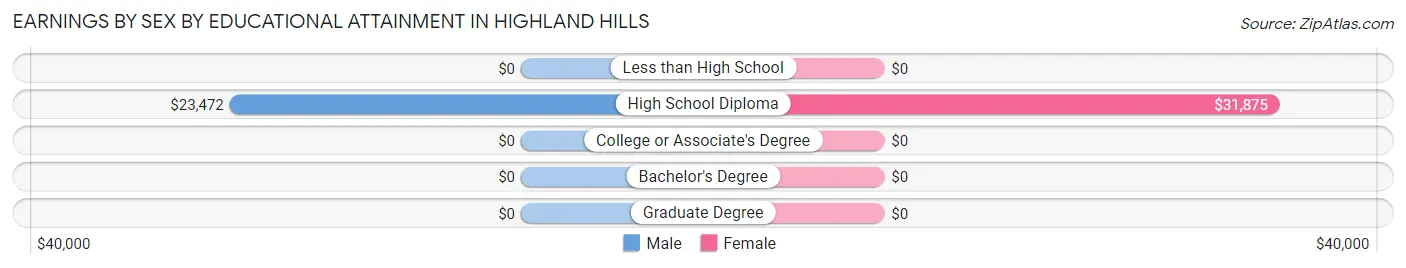
Earnings by Sex by Educational Attainment in Highland Hills
Average earnings in Highland Hills are $23,750 for men and $31,875 for women, a difference of 25.5%. Men with an educational attainment of high school diploma enjoy the highest average annual earnings of $23,472, while those with high school diploma education earn the least with $23,472. Women with an educational attainment of high school diploma earn the most with the average annual earnings of $31,875, while those with high school diploma education have the smallest earnings of $31,875.
| Educational Attainment | Male Income | Female Income |
| Less than High School | - | - |
| High School Diploma | $23,472 | $31,875 |
| College or Associate's Degree | - | - |
| Bachelor's Degree | - | - |
| Graduate Degree | - | - |
| Total | $23,750 | $31,875 |
Family Income in Highland Hills
Family Income Brackets in Highland Hills
According to the Highland Hills family income data, there are 21 families falling into the $100,000 to $149,999 income range, which is the most common income bracket and makes up 32.3% of all families.
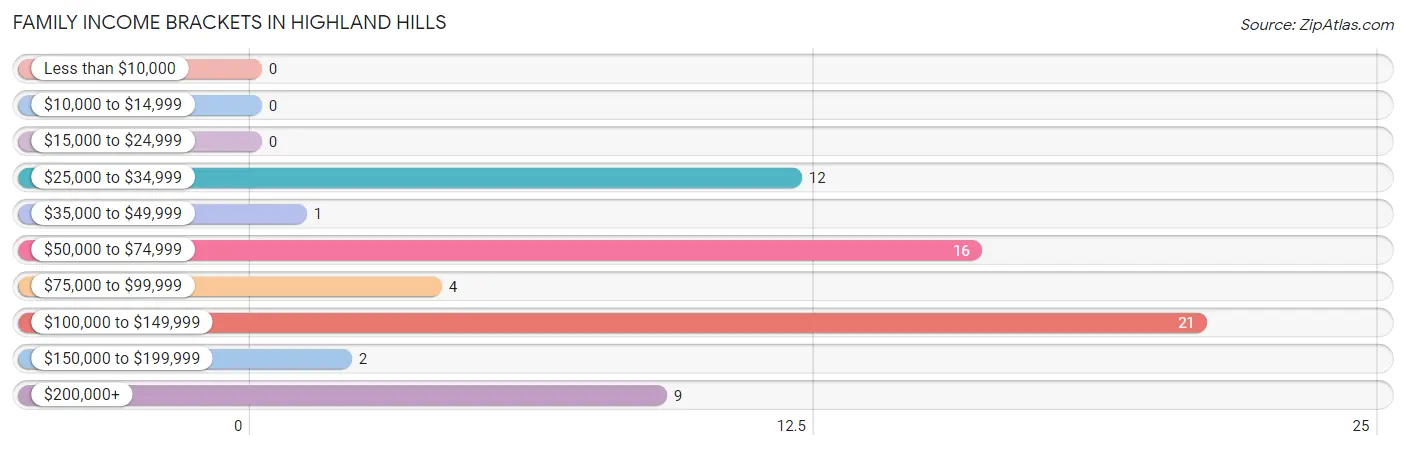
| Income Bracket | # Families | % Families |
| Less than $10,000 | 0 | 0.0% |
| $10,000 to $14,999 | 0 | 0.0% |
| $15,000 to $24,999 | 0 | 0.0% |
| $25,000 to $34,999 | 12 | 18.5% |
| $35,000 to $49,999 | 1 | 1.5% |
| $50,000 to $74,999 | 16 | 24.6% |
| $75,000 to $99,999 | 4 | 6.2% |
| $100,000 to $149,999 | 21 | 32.3% |
| $150,000 to $199,999 | 2 | 3.1% |
| $200,000+ | 9 | 13.8% |
Family Income by Famaliy Size in Highland Hills
2-person families (44 | 67.7%) account for the highest median family income in Highland Hills with $56,750 per family, while 2-person families (44 | 67.7%) have the highest median income of $28,375 per family member.
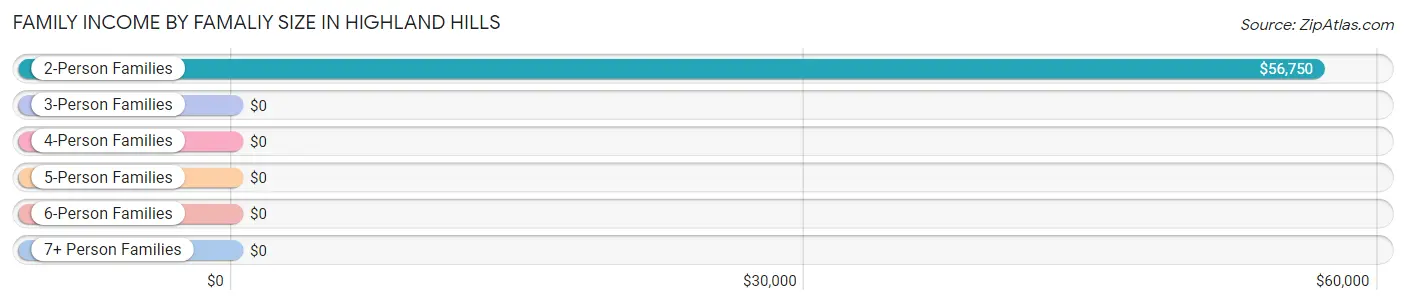
| Income Bracket | # Families | Median Income |
| 2-Person Families | 44 (67.7%) | $56,750 |
| 3-Person Families | 4 (6.1%) | $0 |
| 4-Person Families | 12 (18.5%) | $0 |
| 5-Person Families | 5 (7.7%) | $0 |
| 6-Person Families | 0 (0.0%) | $0 |
| 7+ Person Families | 0 (0.0%) | $0 |
| Total | 65 (100.0%) | $94,375 |
Family Income by Number of Earners in Highland Hills
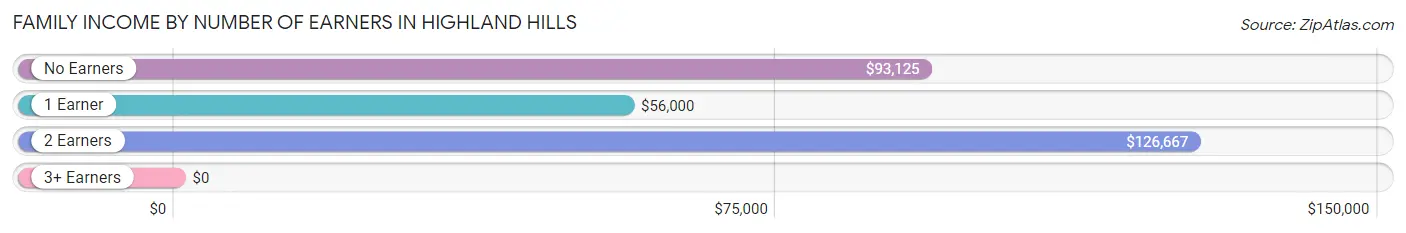
| Number of Earners | # Families | Median Income |
| No Earners | 5 (7.7%) | $93,125 |
| 1 Earner | 34 (52.3%) | $56,000 |
| 2 Earners | 6 (9.2%) | $126,667 |
| 3+ Earners | 20 (30.8%) | $0 |
| Total | 65 (100.0%) | $94,375 |
Household Income in Highland Hills
Household Income Brackets in Highland Hills
With 51 households falling in the category, the $15,000 to $24,999 income range is the most frequent in Highland Hills, accounting for 23.4% of all households. In contrast, only 2 households (0.9%) fall into the $150,000 to $199,999 income bracket, making it the least populous group.
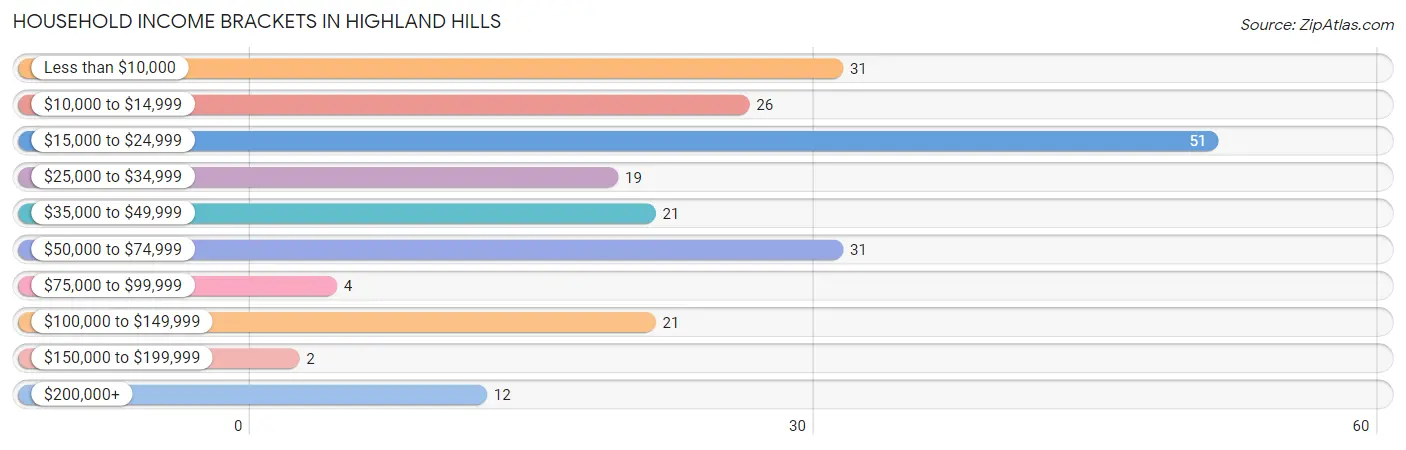
| Income Bracket | # Households | % Households |
| Less than $10,000 | 31 | 14.2% |
| $10,000 to $14,999 | 26 | 11.9% |
| $15,000 to $24,999 | 51 | 23.4% |
| $25,000 to $34,999 | 19 | 8.7% |
| $35,000 to $49,999 | 21 | 9.6% |
| $50,000 to $74,999 | 31 | 14.2% |
| $75,000 to $99,999 | 4 | 1.8% |
| $100,000 to $149,999 | 21 | 9.6% |
| $150,000 to $199,999 | 2 | 0.9% |
| $200,000+ | 12 | 5.5% |
Household Income by Householder Age in Highland Hills
The median household income in Highland Hills is $25,500, with the highest median household income of $74,375 found in the 25 to 44 years age bracket for the primary householder. A total of 26 households (11.9%) fall into this category.
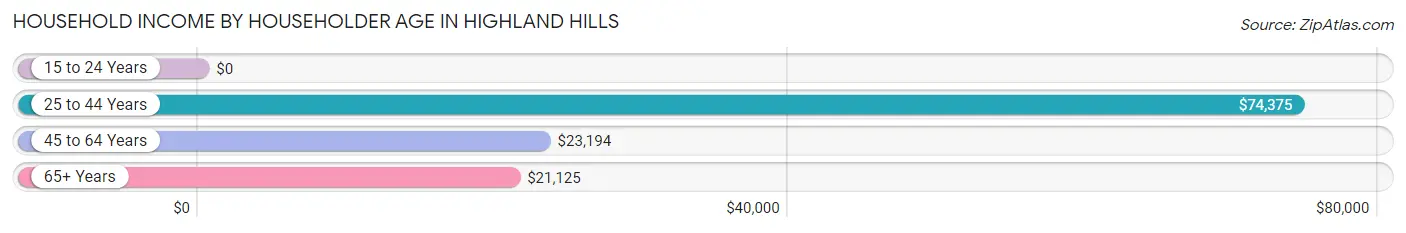
| Income Bracket | # Households | Median Income |
| 15 to 24 Years | 0 (0.0%) | $0 |
| 25 to 44 Years | 26 (11.9%) | $74,375 |
| 45 to 64 Years | 77 (35.3%) | $23,194 |
| 65+ Years | 115 (52.7%) | $21,125 |
| Total | 218 (100.0%) | $25,500 |
Poverty in Highland Hills
Income Below Poverty by Sex and Age in Highland Hills
With 44.1% poverty level for males and 23.5% for females among the residents of Highland Hills, 25 to 34 year old males and 45 to 54 year old females are the most vulnerable to poverty, with 42 males (66.7%) and 28 females (71.8%) in their respective age groups living below the poverty level.
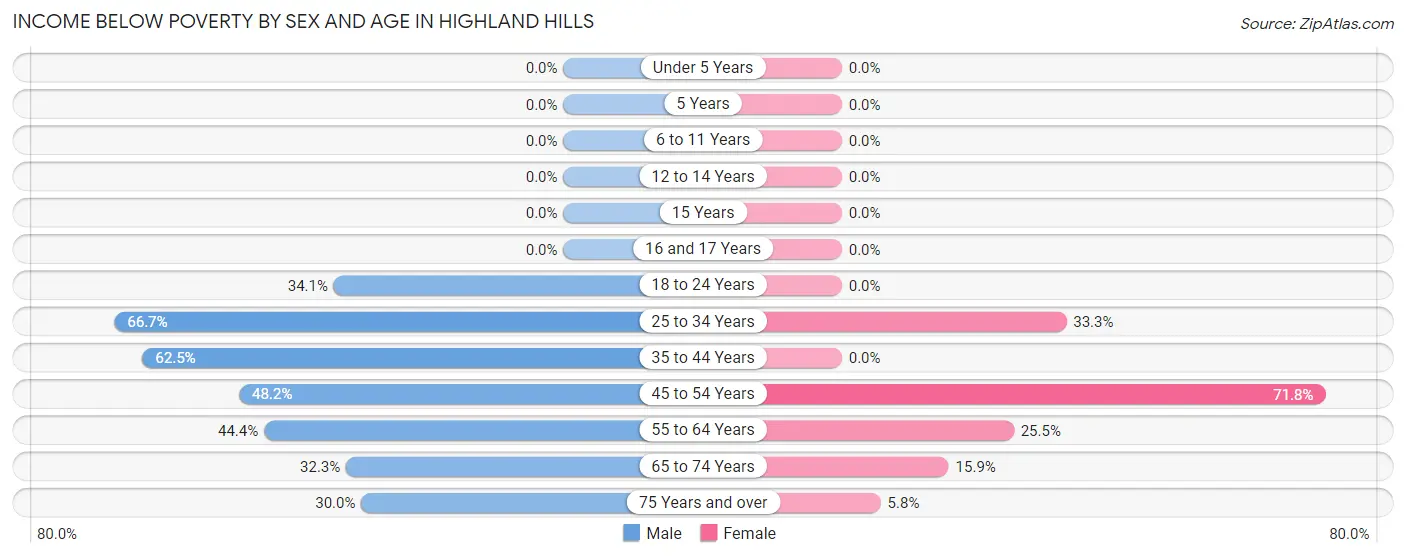
| Age Bracket | Male | Female |
| Under 5 Years | 0 (0.0%) | 0 (0.0%) |
| 5 Years | 0 (0.0%) | 0 (0.0%) |
| 6 to 11 Years | 0 (0.0%) | 0 (0.0%) |
| 12 to 14 Years | 0 (0.0%) | 0 (0.0%) |
| 15 Years | 0 (0.0%) | 0 (0.0%) |
| 16 and 17 Years | 0 (0.0%) | 0 (0.0%) |
| 18 to 24 Years | 15 (34.1%) | 0 (0.0%) |
| 25 to 34 Years | 42 (66.7%) | 5 (33.3%) |
| 35 to 44 Years | 5 (62.5%) | 0 (0.0%) |
| 45 to 54 Years | 13 (48.1%) | 28 (71.8%) |
| 55 to 64 Years | 16 (44.4%) | 12 (25.5%) |
| 65 to 74 Years | 10 (32.3%) | 10 (15.9%) |
| 75 Years and over | 3 (30.0%) | 3 (5.8%) |
| Total | 104 (44.1%) | 58 (23.5%) |
Income Above Poverty by Sex and Age in Highland Hills
According to the poverty statistics in Highland Hills, males aged 6 to 11 years and females aged 18 to 24 years are the age groups that are most secure financially, with 100.0% of males and 100.0% of females in these age groups living above the poverty line.
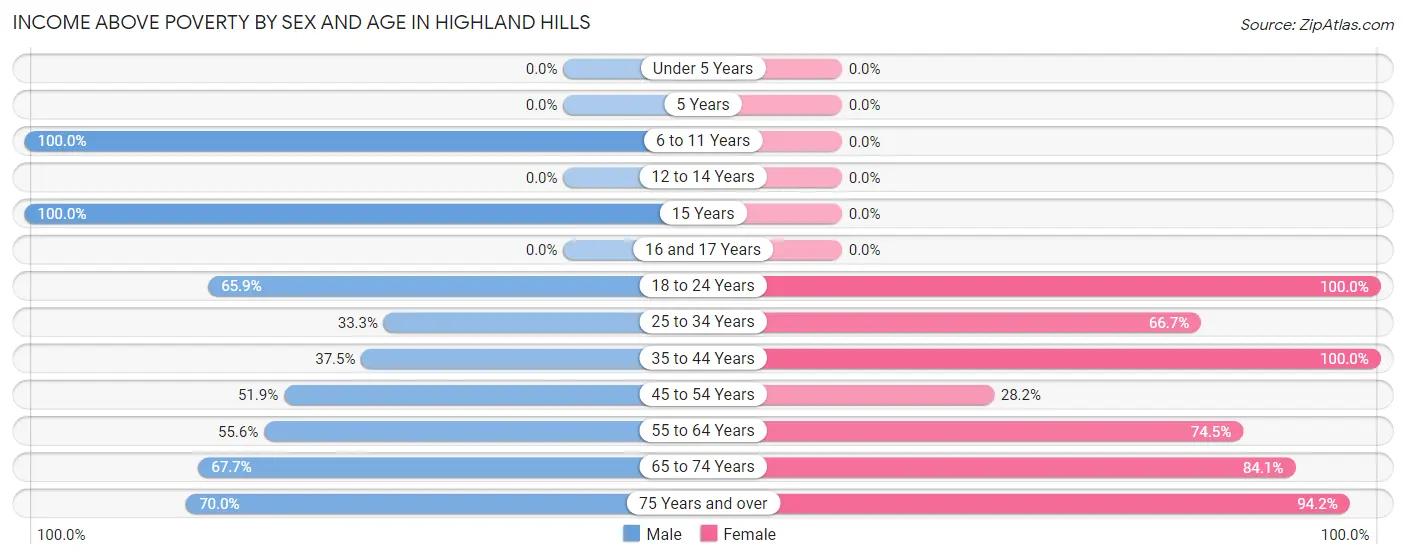
| Age Bracket | Male | Female |
| Under 5 Years | 0 (0.0%) | 0 (0.0%) |
| 5 Years | 0 (0.0%) | 0 (0.0%) |
| 6 to 11 Years | 10 (100.0%) | 0 (0.0%) |
| 12 to 14 Years | 0 (0.0%) | 0 (0.0%) |
| 15 Years | 7 (100.0%) | 0 (0.0%) |
| 16 and 17 Years | 0 (0.0%) | 0 (0.0%) |
| 18 to 24 Years | 29 (65.9%) | 15 (100.0%) |
| 25 to 34 Years | 21 (33.3%) | 10 (66.7%) |
| 35 to 44 Years | 3 (37.5%) | 16 (100.0%) |
| 45 to 54 Years | 14 (51.8%) | 11 (28.2%) |
| 55 to 64 Years | 20 (55.6%) | 35 (74.5%) |
| 65 to 74 Years | 21 (67.7%) | 53 (84.1%) |
| 75 Years and over | 7 (70.0%) | 49 (94.2%) |
| Total | 132 (55.9%) | 189 (76.5%) |
Income Below Poverty Among Married-Couple Families in Highland Hills
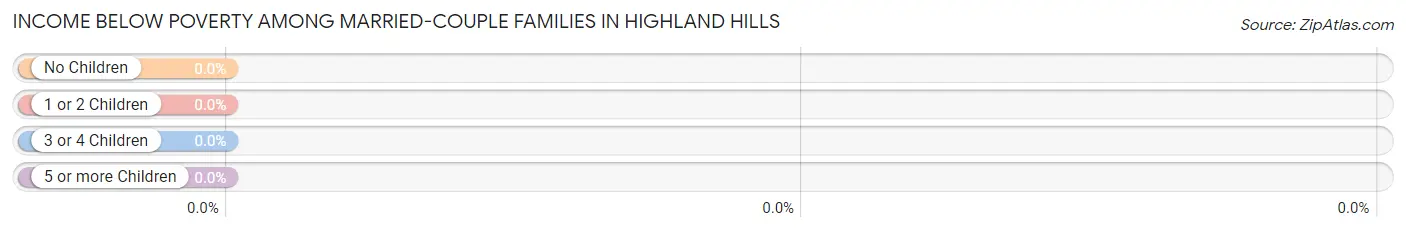
| Children | Above Poverty | Below Poverty |
| No Children | 22 (100.0%) | 0 (0.0%) |
| 1 or 2 Children | 0 (0.0%) | 0 (0.0%) |
| 3 or 4 Children | 0 (0.0%) | 0 (0.0%) |
| 5 or more Children | 0 (0.0%) | 0 (0.0%) |
| Total | 22 (100.0%) | 0 (0.0%) |
Income Below Poverty Among Single-Parent Households in Highland Hills
| Children | Single Father | Single Mother |
| No Children | 0 (0.0%) | 0 (0.0%) |
| 1 or 2 Children | 0 (0.0%) | 0 (0.0%) |
| 3 or 4 Children | 0 (0.0%) | 0 (0.0%) |
| 5 or more Children | 0 (0.0%) | 0 (0.0%) |
| Total | 0 (0.0%) | 0 (0.0%) |
Income Below Poverty Among Married-Couple vs Single-Parent Households in Highland Hills
| Children | Married-Couple Families | Single-Parent Households |
| No Children | 0 (0.0%) | 0 (0.0%) |
| 1 or 2 Children | 0 (0.0%) | 0 (0.0%) |
| 3 or 4 Children | 0 (0.0%) | 0 (0.0%) |
| 5 or more Children | 0 (0.0%) | 0 (0.0%) |
| Total | 0 (0.0%) | 0 (0.0%) |
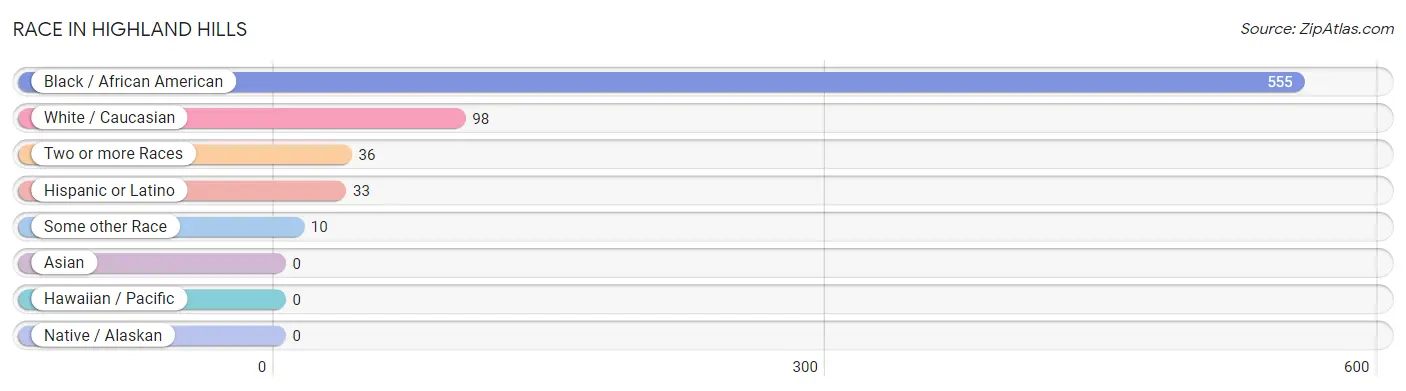
Race in Highland Hills
The most populous races in Highland Hills are Black / African American (555 | 79.4%), White / Caucasian (98 | 14.0%), and Two or more Races (36 | 5.1%).
| Race | # Population | % Population |
| Asian | 0 | 0.0% |
| Black / African American | 555 | 79.4% |
| Hawaiian / Pacific | 0 | 0.0% |
| Hispanic or Latino | 33 | 4.7% |
| Native / Alaskan | 0 | 0.0% |
| White / Caucasian | 98 | 14.0% |
| Two or more Races | 36 | 5.1% |
| Some other Race | 10 | 1.4% |
| Total | 699 | 100.0% |
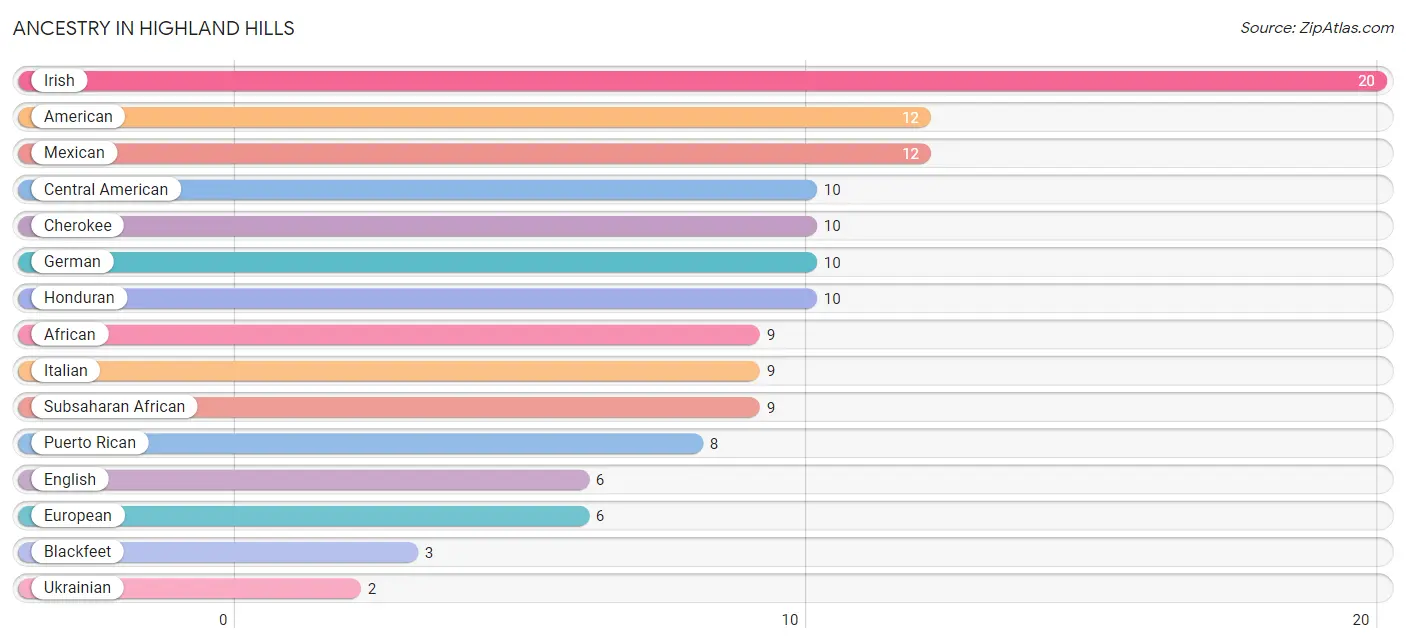
Ancestry in Highland Hills
The most populous ancestries reported in Highland Hills are Irish (20 | 2.9%), American (12 | 1.7%), Mexican (12 | 1.7%), Central American (10 | 1.4%), and Cherokee (10 | 1.4%), together accounting for 9.2% of all Highland Hills residents.
| Ancestry | # Population | % Population |
| African | 9 | 1.3% |
| American | 12 | 1.7% |
| Blackfeet | 3 | 0.4% |
| Central American | 10 | 1.4% |
| Cherokee | 10 | 1.4% |
| Dominican | 1 | 0.1% |
| English | 6 | 0.9% |
| European | 6 | 0.9% |
| German | 10 | 1.4% |
| Honduran | 10 | 1.4% |
| Irish | 20 | 2.9% |
| Italian | 9 | 1.3% |
| Jamaican | 1 | 0.1% |
| Mexican | 12 | 1.7% |
| Puerto Rican | 8 | 1.1% |
| Subsaharan African | 9 | 1.3% |
| Ukrainian | 2 | 0.3% | View All 17 Rows |
Immigrants in Highland Hills
The most numerous immigrant groups reported in Highland Hills came from Latin America (11 | 1.6%), Central America (10 | 1.4%), Honduras (10 | 1.4%), Africa (5 | 0.7%), and Liberia (5 | 0.7%), together accounting for 5.9% of all Highland Hills residents.
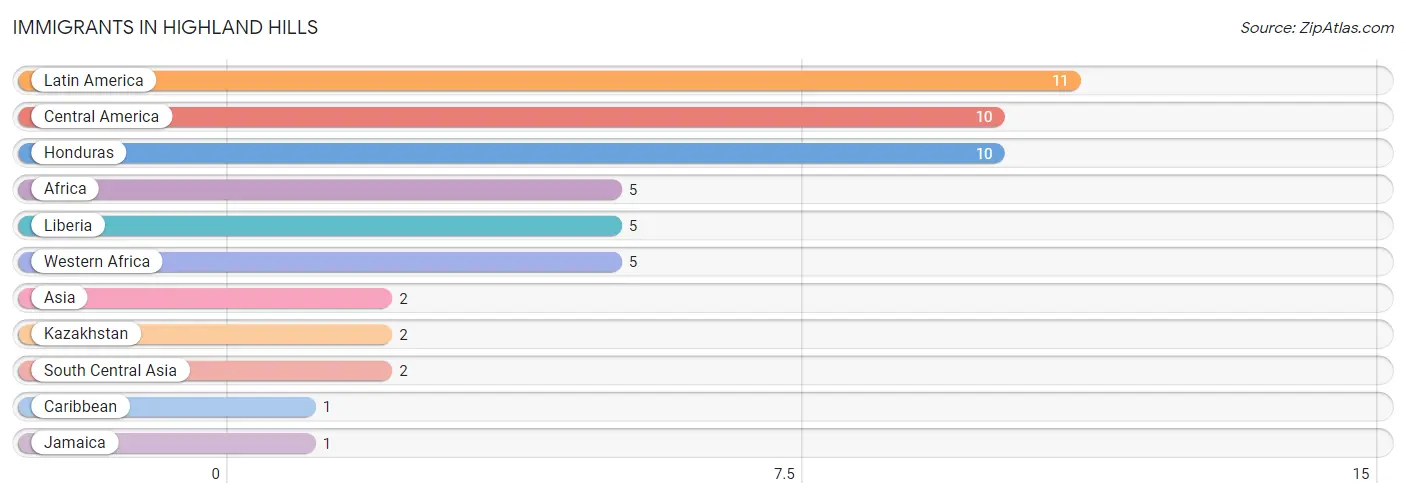
| Immigration Origin | # Population | % Population |
| Africa | 5 | 0.7% |
| Asia | 2 | 0.3% |
| Caribbean | 1 | 0.1% |
| Central America | 10 | 1.4% |
| Honduras | 10 | 1.4% |
| Jamaica | 1 | 0.1% |
| Kazakhstan | 2 | 0.3% |
| Latin America | 11 | 1.6% |
| Liberia | 5 | 0.7% |
| South Central Asia | 2 | 0.3% |
| Western Africa | 5 | 0.7% | View All 11 Rows |
Sex and Age in Highland Hills
Sex and Age in Highland Hills
The most populous age groups in Highland Hills are 15 to 19 Years (81 | 18.1%) for men and 65 to 69 Years (48 | 19.1%) for women.
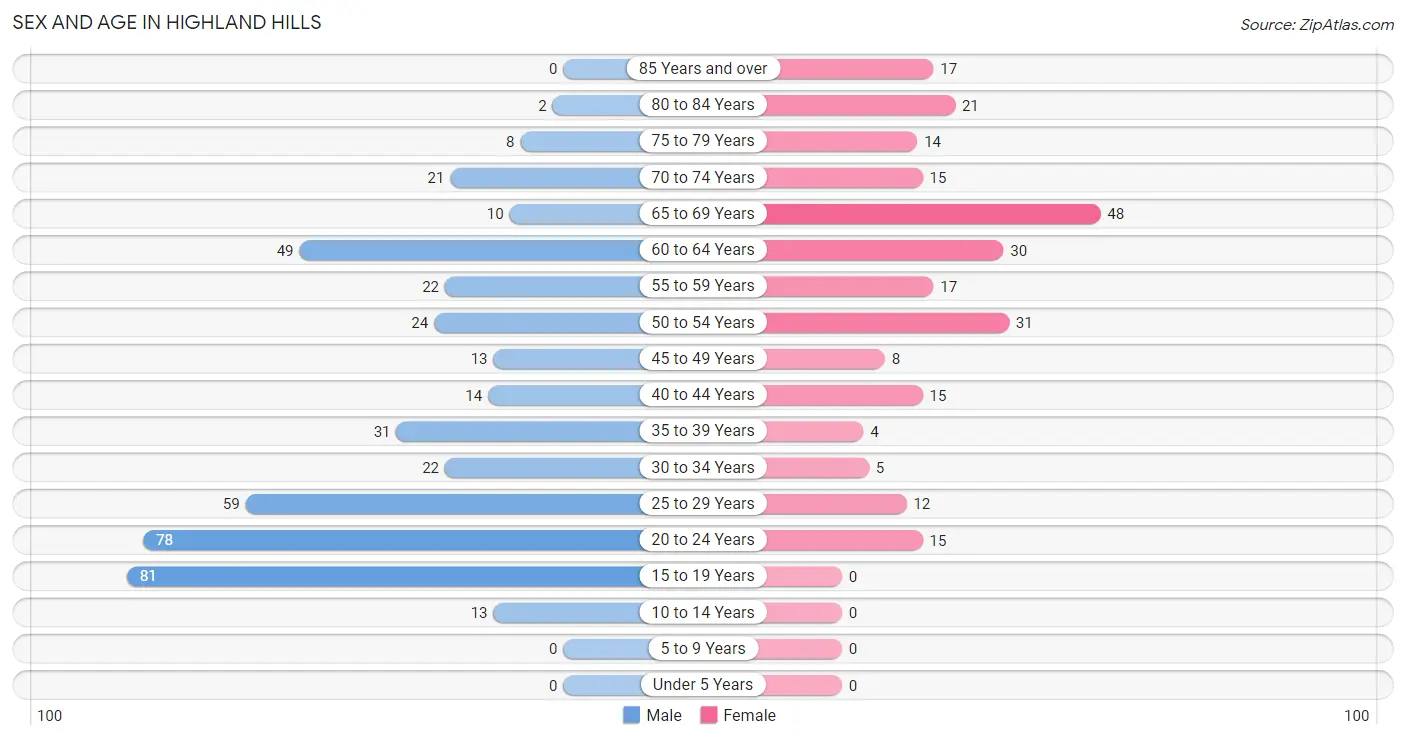
| Age Bracket | Male | Female |
| Under 5 Years | 0 (0.0%) | 0 (0.0%) |
| 5 to 9 Years | 0 (0.0%) | 0 (0.0%) |
| 10 to 14 Years | 13 (2.9%) | 0 (0.0%) |
| 15 to 19 Years | 81 (18.1%) | 0 (0.0%) |
| 20 to 24 Years | 78 (17.4%) | 15 (5.9%) |
| 25 to 29 Years | 59 (13.2%) | 12 (4.8%) |
| 30 to 34 Years | 22 (4.9%) | 5 (2.0%) |
| 35 to 39 Years | 31 (6.9%) | 4 (1.6%) |
| 40 to 44 Years | 14 (3.1%) | 15 (5.9%) |
| 45 to 49 Years | 13 (2.9%) | 8 (3.2%) |
| 50 to 54 Years | 24 (5.4%) | 31 (12.3%) |
| 55 to 59 Years | 22 (4.9%) | 17 (6.8%) |
| 60 to 64 Years | 49 (11.0%) | 30 (11.9%) |
| 65 to 69 Years | 10 (2.2%) | 48 (19.1%) |
| 70 to 74 Years | 21 (4.7%) | 15 (5.9%) |
| 75 to 79 Years | 8 (1.8%) | 14 (5.6%) |
| 80 to 84 Years | 2 (0.4%) | 21 (8.3%) |
| 85 Years and over | 0 (0.0%) | 17 (6.8%) |
| Total | 447 (100.0%) | 252 (100.0%) |
Families and Households in Highland Hills
Median Family Size in Highland Hills
The median family size in Highland Hills is 3.08 persons per family, with single female/mother families (39 | 60.0%) accounting for the largest median family size of 3.69 persons per family. On the other hand, single male/father families (4 | 6.1%) represent the smallest median family size with 1.75 persons per family.
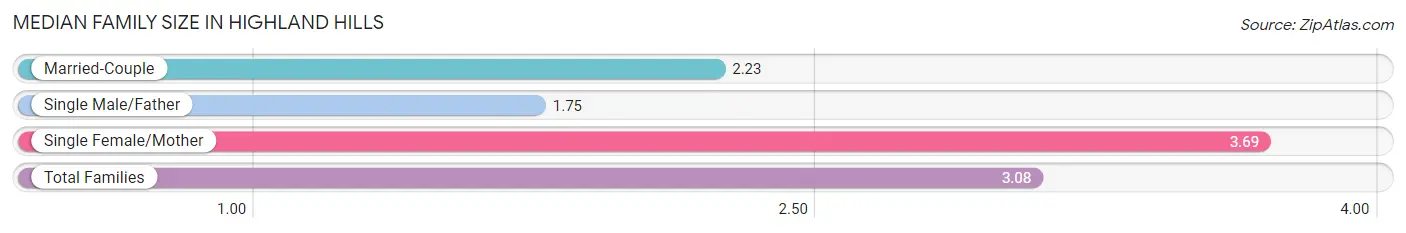
| Family Type | # Families | Family Size |
| Married-Couple | 22 (33.9%) | 2.23 |
| Single Male/Father | 4 (6.1%) | 1.75 |
| Single Female/Mother | 39 (60.0%) | 3.69 |
| Total Families | 65 (100.0%) | 3.08 |
Median Household Size in Highland Hills
The median household size in Highland Hills is 1.71 persons per household, with single female/mother households (39 | 17.9%) accounting for the largest median household size of 4.03 persons per household. non-family households (153 | 70.2%) represent the smallest median household size with 1.04 persons per household.
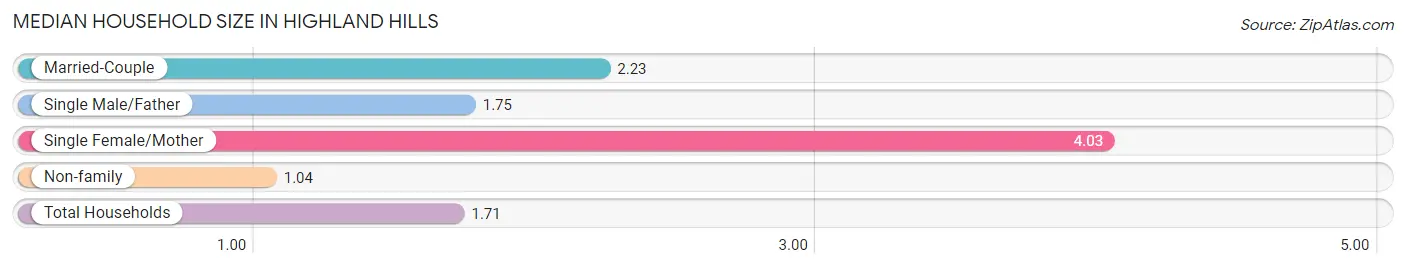
| Household Type | # Households | Household Size |
| Married-Couple | 22 (10.1%) | 2.23 |
| Single Male/Father | 4 (1.8%) | 1.75 |
| Single Female/Mother | 39 (17.9%) | 4.03 |
| Non-family | 153 (70.2%) | 1.04 |
| Total Households | 218 (100.0%) | 1.71 |
Household Size by Marriage Status in Highland Hills
Out of a total of 218 households in Highland Hills, 65 (29.8%) are family households, while 153 (70.2%) are nonfamily households. The most numerous type of family households are 2-person households, comprising 34, and the most common type of nonfamily households are 1-person households, comprising 147.
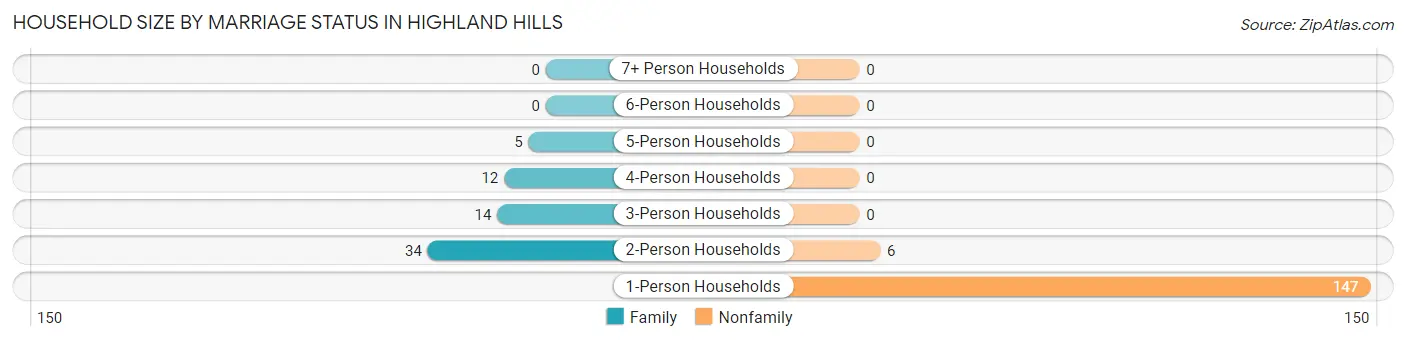
| Household Size | Family Households | Nonfamily Households |
| 1-Person Households | - | 147 (67.4%) |
| 2-Person Households | 34 (15.6%) | 6 (2.8%) |
| 3-Person Households | 14 (6.4%) | 0 (0.0%) |
| 4-Person Households | 12 (5.5%) | 0 (0.0%) |
| 5-Person Households | 5 (2.3%) | 0 (0.0%) |
| 6-Person Households | 0 (0.0%) | 0 (0.0%) |
| 7+ Person Households | 0 (0.0%) | 0 (0.0%) |
| Total | 65 (29.8%) | 153 (70.2%) |
Female Fertility in Highland Hills
Fertility by Age in Highland Hills
| Age Bracket | Women with Births | Births / 1,000 Women |
| 15 to 19 years | 0 (0.0%) | 0.0 |
| 20 to 34 years | 0 (0.0%) | 0.0 |
| 35 to 50 years | 0 (0.0%) | 0.0 |
| Total | 0 (0.0%) | 0.0 |
Fertility by Age by Marriage Status in Highland Hills
| Age Bracket | Married | Unmarried |
| 15 to 19 years | 0 (0.0%) | 0 (0.0%) |
| 20 to 34 years | 0 (0.0%) | 0 (0.0%) |
| 35 to 50 years | 0 (0.0%) | 0 (0.0%) |
| Total | 0 (0.0%) | 0 (0.0%) |
Fertility by Education in Highland Hills
| Educational Attainment | Women with Births | Births / 1,000 Women |
| Less than High School | 0 (0.0%) | 0.0 |
| High School Diploma | 0 (0.0%) | 0.0 |
| College or Associate's Degree | 0 (0.0%) | 0.0 |
| Bachelor's Degree | 0 (0.0%) | 0.0 |
| Graduate Degree | 0 (0.0%) | 0.0 |
| Total | 0 (0.0%) | 0.0 |
Fertility by Education by Marriage Status in Highland Hills
| Educational Attainment | Married | Unmarried |
| Less than High School | 0 (0.0%) | 0 (0.0%) |
| High School Diploma | 0 (0.0%) | 0 (0.0%) |
| College or Associate's Degree | 0 (0.0%) | 0 (0.0%) |
| Bachelor's Degree | 0 (0.0%) | 0 (0.0%) |
| Graduate Degree | 0 (0.0%) | 0 (0.0%) |
| Total | 0 (0.0%) | 0 (0.0%) |
Employment Characteristics in Highland Hills
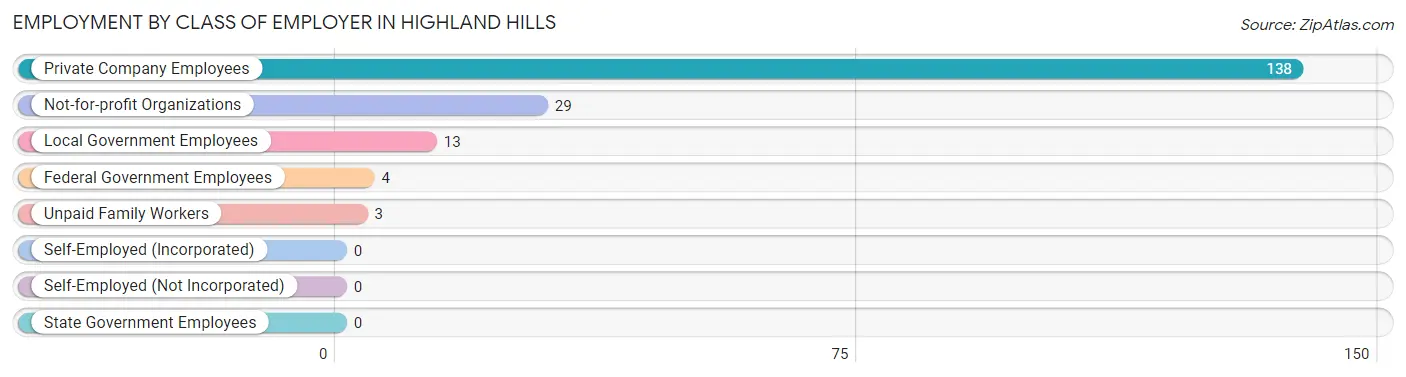
Employment by Class of Employer in Highland Hills
Among the 187 employed individuals in Highland Hills, private company employees (138 | 73.8%), not-for-profit organizations (29 | 15.5%), and local government employees (13 | 7.0%) make up the most common classes of employment.
| Employer Class | # Employees | % Employees |
| Private Company Employees | 138 | 73.8% |
| Self-Employed (Incorporated) | 0 | 0.0% |
| Self-Employed (Not Incorporated) | 0 | 0.0% |
| Not-for-profit Organizations | 29 | 15.5% |
| Local Government Employees | 13 | 7.0% |
| State Government Employees | 0 | 0.0% |
| Federal Government Employees | 4 | 2.1% |
| Unpaid Family Workers | 3 | 1.6% |
| Total | 187 | 100.0% |
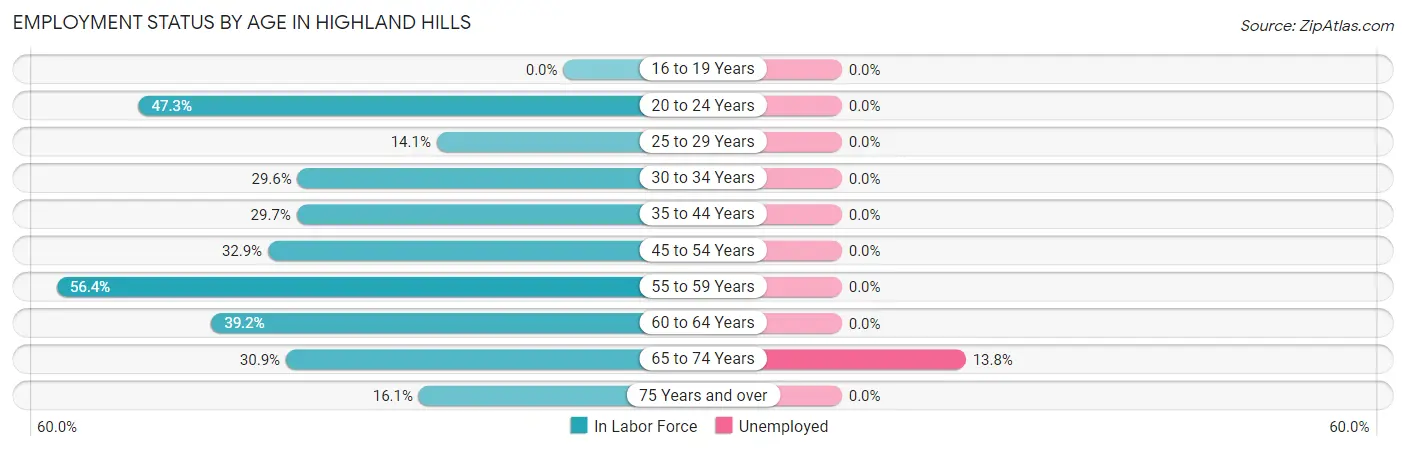
Employment Status by Age in Highland Hills
According to the labor force statistics for Highland Hills, out of the total population over 16 years of age (679), 29.2% or 198 individuals are in the labor force, with 2.0% or 4 of them unemployed. The age group with the highest labor force participation rate is 55 to 59 years, with 56.4% or 22 individuals in the labor force. Within the labor force, the 65 to 74 years age range has the highest percentage of unemployed individuals, with 13.8% or 4 of them being unemployed.
| Age Bracket | In Labor Force | Unemployed |
| 16 to 19 Years | 0 (0.0%) | 0 (0.0%) |
| 20 to 24 Years | 44 (47.3%) | 0 (0.0%) |
| 25 to 29 Years | 10 (14.1%) | 0 (0.0%) |
| 30 to 34 Years | 8 (29.6%) | 0 (0.0%) |
| 35 to 44 Years | 19 (29.7%) | 0 (0.0%) |
| 45 to 54 Years | 25 (32.9%) | 0 (0.0%) |
| 55 to 59 Years | 22 (56.4%) | 0 (0.0%) |
| 60 to 64 Years | 31 (39.2%) | 0 (0.0%) |
| 65 to 74 Years | 29 (30.9%) | 4 (13.8%) |
| 75 Years and over | 10 (16.1%) | 0 (0.0%) |
| Total | 198 (29.2%) | 4 (2.0%) |
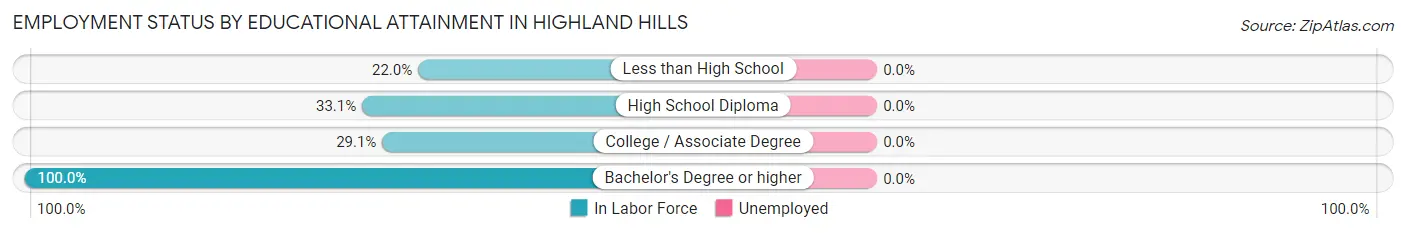
Employment Status by Educational Attainment in Highland Hills
| Educational Attainment | In Labor Force | Unemployed |
| Less than High School | 24 (22.0%) | 0 (0.0%) |
| High School Diploma | 47 (33.1%) | 0 (0.0%) |
| College / Associate Degree | 25 (29.1%) | 0 (0.0%) |
| Bachelor's Degree or higher | 19 (100.0%) | 0 (0.0%) |
| Total | 115 (32.3%) | 0 (0.0%) |
Employment Occupations by Sex in Highland Hills
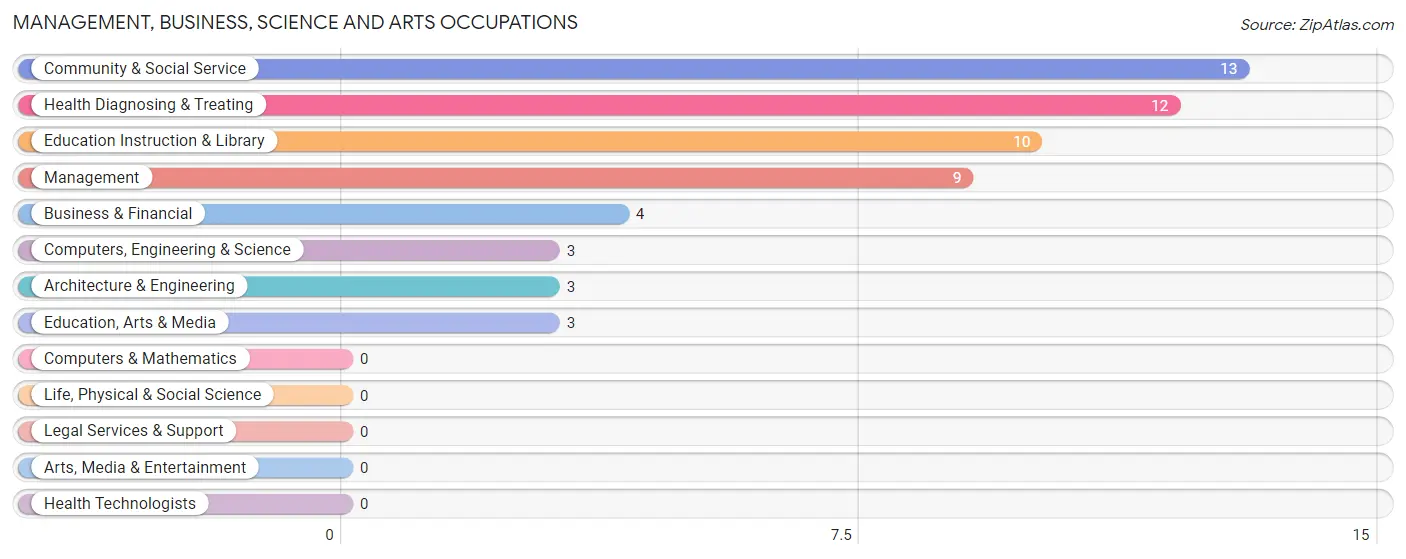
Management, Business, Science and Arts Occupations
The most common Management, Business, Science and Arts occupations in Highland Hills are Community & Social Service (13 | 6.7%), Health Diagnosing & Treating (12 | 6.2%), Education Instruction & Library (10 | 5.1%), Management (9 | 4.6%), and Business & Financial (4 | 2.1%).
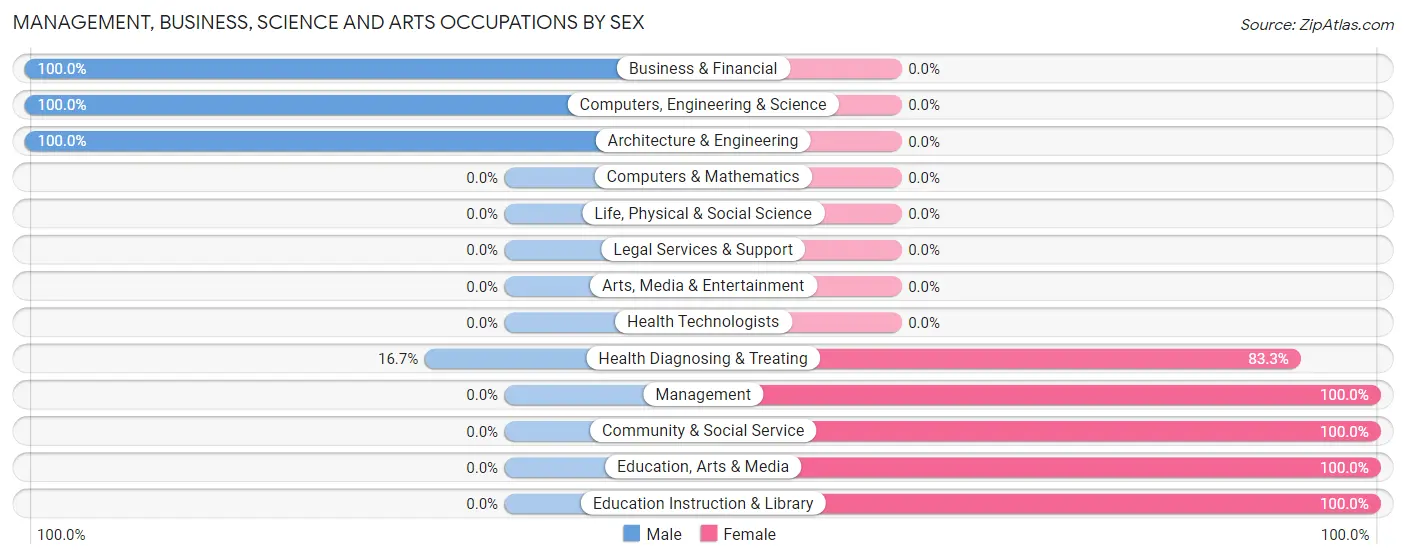
Management, Business, Science and Arts Occupations by Sex
Within the Management, Business, Science and Arts occupations in Highland Hills, the most male-oriented occupations are Business & Financial (100.0%), Computers, Engineering & Science (100.0%), and Architecture & Engineering (100.0%), while the most female-oriented occupations are Management (100.0%), Community & Social Service (100.0%), and Education, Arts & Media (100.0%).
| Occupation | Male | Female |
| Management | 0 (0.0%) | 9 (100.0%) |
| Business & Financial | 4 (100.0%) | 0 (0.0%) |
| Computers, Engineering & Science | 3 (100.0%) | 0 (0.0%) |
| Computers & Mathematics | 0 (0.0%) | 0 (0.0%) |
| Architecture & Engineering | 3 (100.0%) | 0 (0.0%) |
| Life, Physical & Social Science | 0 (0.0%) | 0 (0.0%) |
| Community & Social Service | 0 (0.0%) | 13 (100.0%) |
| Education, Arts & Media | 0 (0.0%) | 3 (100.0%) |
| Legal Services & Support | 0 (0.0%) | 0 (0.0%) |
| Education Instruction & Library | 0 (0.0%) | 10 (100.0%) |
| Arts, Media & Entertainment | 0 (0.0%) | 0 (0.0%) |
| Health Diagnosing & Treating | 2 (16.7%) | 10 (83.3%) |
| Health Technologists | 0 (0.0%) | 0 (0.0%) |
| Total (Category) | 9 (22.0%) | 32 (78.0%) |
| Total (Overall) | 87 (44.9%) | 107 (55.1%) |
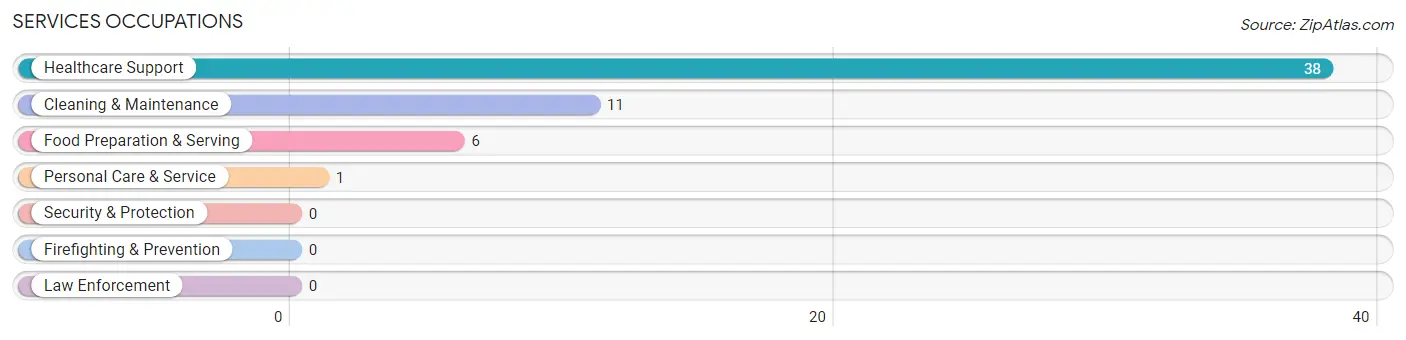
Services Occupations
The most common Services occupations in Highland Hills are Healthcare Support (38 | 19.6%), Cleaning & Maintenance (11 | 5.7%), Food Preparation & Serving (6 | 3.1%), and Personal Care & Service (1 | 0.5%).
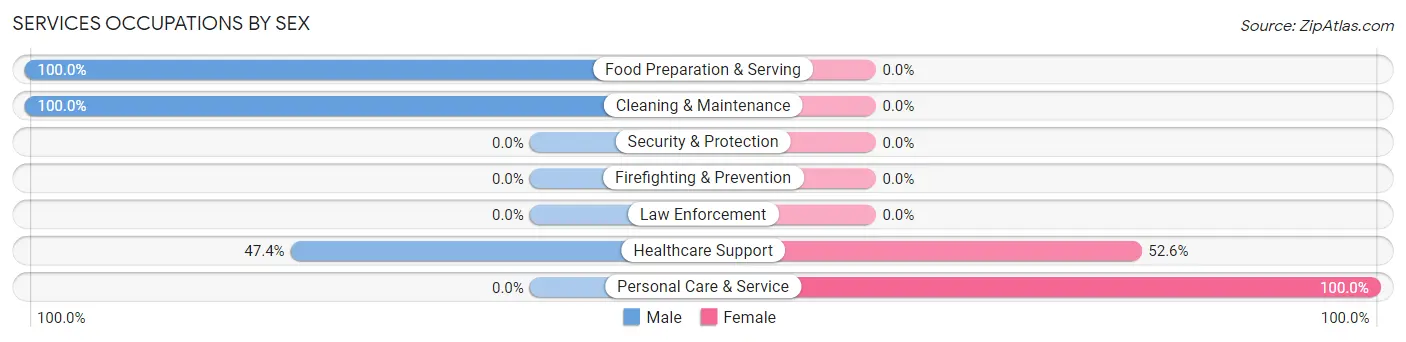
Services Occupations by Sex
Within the Services occupations in Highland Hills, the most male-oriented occupations are Food Preparation & Serving (100.0%), Cleaning & Maintenance (100.0%), and Healthcare Support (47.4%), while the most female-oriented occupations are Personal Care & Service (100.0%), and Healthcare Support (52.6%).
| Occupation | Male | Female |
| Healthcare Support | 18 (47.4%) | 20 (52.6%) |
| Security & Protection | 0 (0.0%) | 0 (0.0%) |
| Firefighting & Prevention | 0 (0.0%) | 0 (0.0%) |
| Law Enforcement | 0 (0.0%) | 0 (0.0%) |
| Food Preparation & Serving | 6 (100.0%) | 0 (0.0%) |
| Cleaning & Maintenance | 11 (100.0%) | 0 (0.0%) |
| Personal Care & Service | 0 (0.0%) | 1 (100.0%) |
| Total (Category) | 35 (62.5%) | 21 (37.5%) |
| Total (Overall) | 87 (44.9%) | 107 (55.1%) |
Sales and Office Occupations
The most common Sales and Office occupations in Highland Hills are Office & Administration (16 | 8.3%), and Sales & Related (15 | 7.7%).
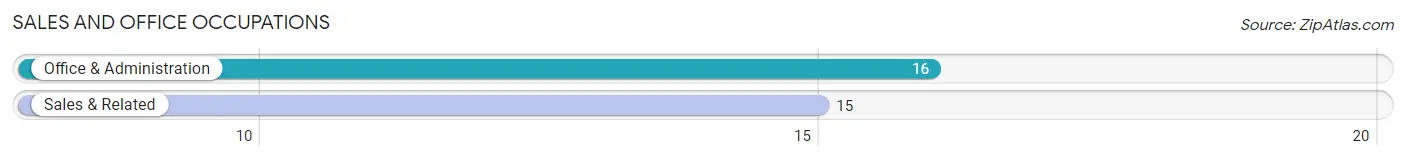
Sales and Office Occupations by Sex
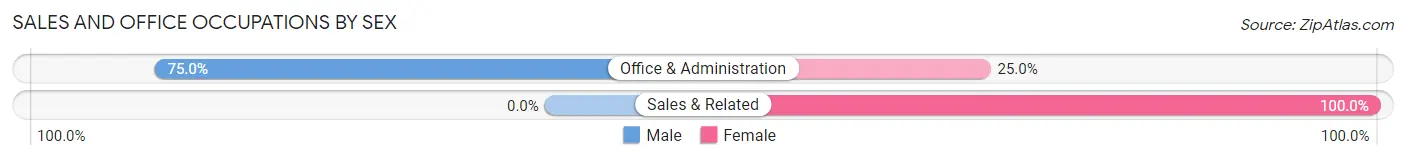
| Occupation | Male | Female |
| Sales & Related | 0 (0.0%) | 15 (100.0%) |
| Office & Administration | 12 (75.0%) | 4 (25.0%) |
| Total (Category) | 12 (38.7%) | 19 (61.3%) |
| Total (Overall) | 87 (44.9%) | 107 (55.1%) |
Natural Resources, Construction and Maintenance Occupations
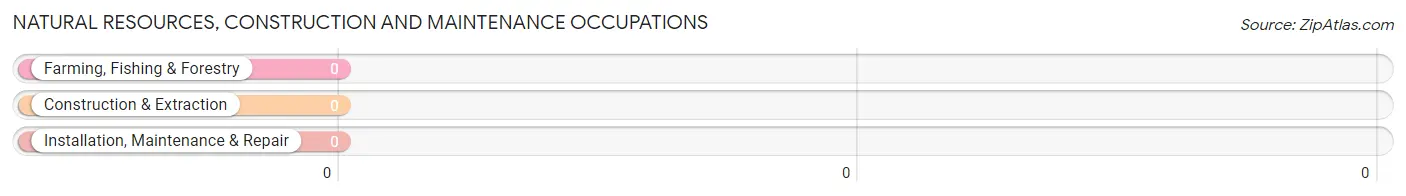
Natural Resources, Construction and Maintenance Occupations by Sex
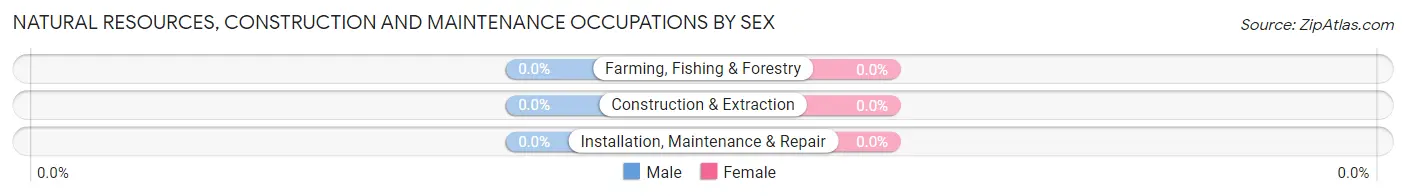
| Occupation | Male | Female |
| Farming, Fishing & Forestry | 0 (0.0%) | 0 (0.0%) |
| Construction & Extraction | 0 (0.0%) | 0 (0.0%) |
| Installation, Maintenance & Repair | 0 (0.0%) | 0 (0.0%) |
| Total (Category) | 0 (0.0%) | 0 (0.0%) |
| Total (Overall) | 87 (44.9%) | 107 (55.1%) |
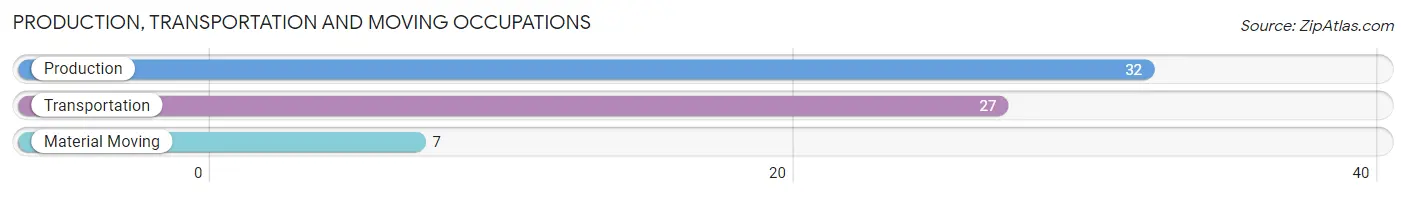
Production, Transportation and Moving Occupations
The most common Production, Transportation and Moving occupations in Highland Hills are Production (32 | 16.5%), Transportation (27 | 13.9%), and Material Moving (7 | 3.6%).
Production, Transportation and Moving Occupations by Sex
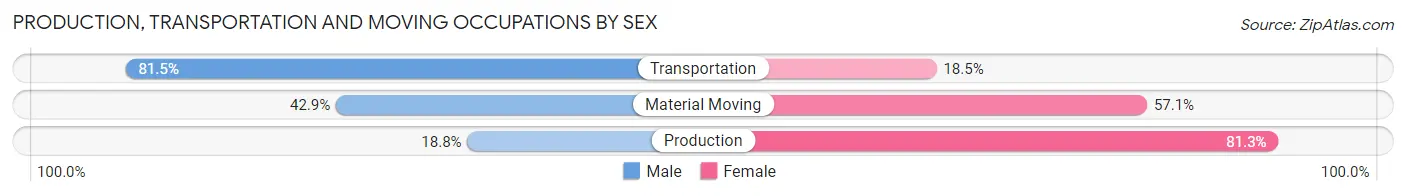
| Occupation | Male | Female |
| Production | 6 (18.8%) | 26 (81.2%) |
| Transportation | 22 (81.5%) | 5 (18.5%) |
| Material Moving | 3 (42.9%) | 4 (57.1%) |
| Total (Category) | 31 (47.0%) | 35 (53.0%) |
| Total (Overall) | 87 (44.9%) | 107 (55.1%) |
Employment Industries by Sex in Highland Hills
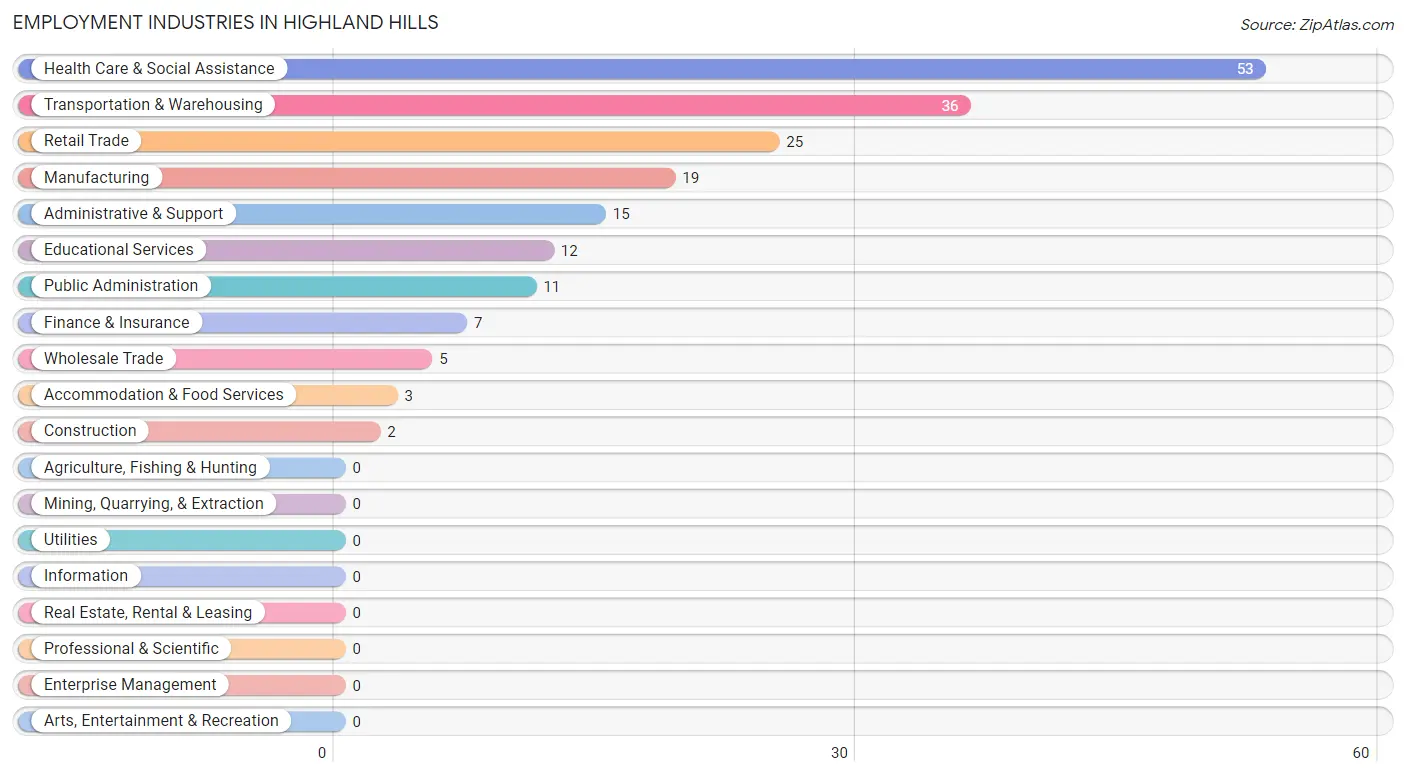
Employment Industries in Highland Hills
The major employment industries in Highland Hills include Health Care & Social Assistance (53 | 27.3%), Transportation & Warehousing (36 | 18.6%), Retail Trade (25 | 12.9%), Manufacturing (19 | 9.8%), and Administrative & Support (15 | 7.7%).
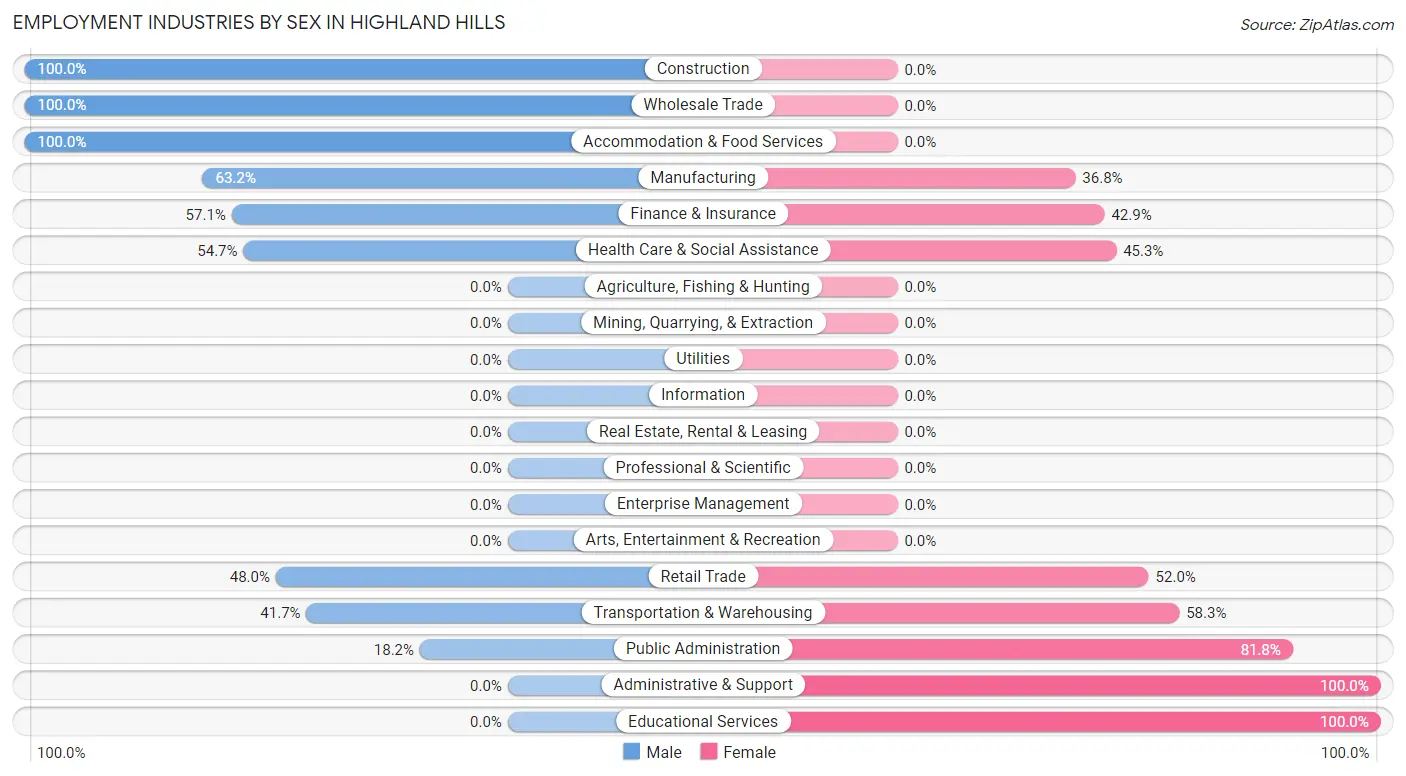
Employment Industries by Sex in Highland Hills
The Highland Hills industries that see more men than women are Construction (100.0%), Wholesale Trade (100.0%), and Accommodation & Food Services (100.0%), whereas the industries that tend to have a higher number of women are Administrative & Support (100.0%), Educational Services (100.0%), and Public Administration (81.8%).
| Industry | Male | Female |
| Agriculture, Fishing & Hunting | 0 (0.0%) | 0 (0.0%) |
| Mining, Quarrying, & Extraction | 0 (0.0%) | 0 (0.0%) |
| Construction | 2 (100.0%) | 0 (0.0%) |
| Manufacturing | 12 (63.2%) | 7 (36.8%) |
| Wholesale Trade | 5 (100.0%) | 0 (0.0%) |
| Retail Trade | 12 (48.0%) | 13 (52.0%) |
| Transportation & Warehousing | 15 (41.7%) | 21 (58.3%) |
| Utilities | 0 (0.0%) | 0 (0.0%) |
| Information | 0 (0.0%) | 0 (0.0%) |
| Finance & Insurance | 4 (57.1%) | 3 (42.9%) |
| Real Estate, Rental & Leasing | 0 (0.0%) | 0 (0.0%) |
| Professional & Scientific | 0 (0.0%) | 0 (0.0%) |
| Enterprise Management | 0 (0.0%) | 0 (0.0%) |
| Administrative & Support | 0 (0.0%) | 15 (100.0%) |
| Educational Services | 0 (0.0%) | 12 (100.0%) |
| Health Care & Social Assistance | 29 (54.7%) | 24 (45.3%) |
| Arts, Entertainment & Recreation | 0 (0.0%) | 0 (0.0%) |
| Accommodation & Food Services | 3 (100.0%) | 0 (0.0%) |
| Public Administration | 2 (18.2%) | 9 (81.8%) |
| Total | 87 (44.9%) | 107 (55.1%) |
Education in Highland Hills
School Enrollment in Highland Hills
The most common levels of schooling among the 61 students in Highland Hills are high school (39 | 63.9%), elementary school (10 | 16.4%), and college / undergraduate (9 | 14.7%).
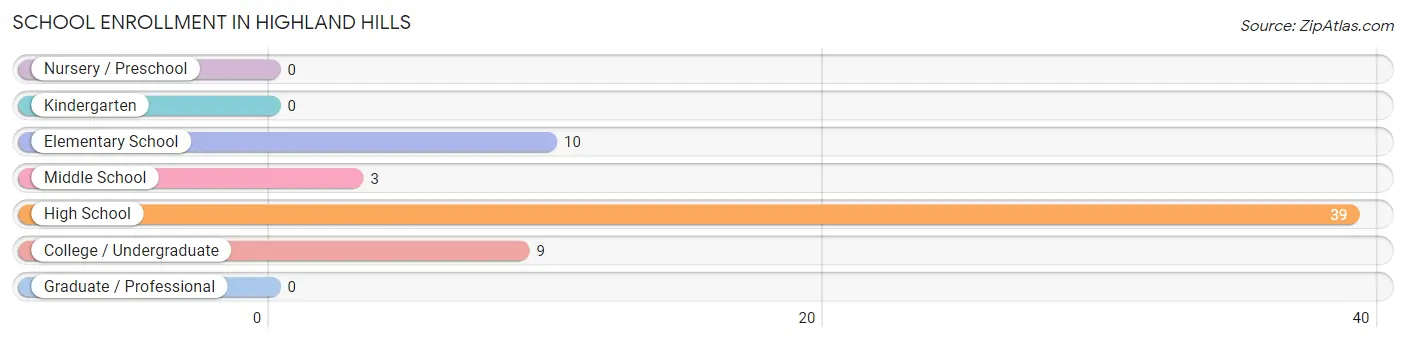
| School Level | # Students | % Students |
| Nursery / Preschool | 0 | 0.0% |
| Kindergarten | 0 | 0.0% |
| Elementary School | 10 | 16.4% |
| Middle School | 3 | 4.9% |
| High School | 39 | 63.9% |
| College / Undergraduate | 9 | 14.7% |
| Graduate / Professional | 0 | 0.0% |
| Total | 61 | 100.0% |
School Enrollment by Age by Funding Source in Highland Hills
Out of a total of 61 students who are enrolled in schools in Highland Hills, 28 (45.9%) attend a private institution, while the remaining 33 (54.1%) are enrolled in public schools. The age group of 20 to 24 year olds has the highest likelihood of being enrolled in private schools, with 4 (100.0% in the age bracket) enrolled. Conversely, the age group of 10 to 14 year olds has the lowest likelihood of being enrolled in a private school, with 13 (100.0% in the age bracket) attending a public institution.
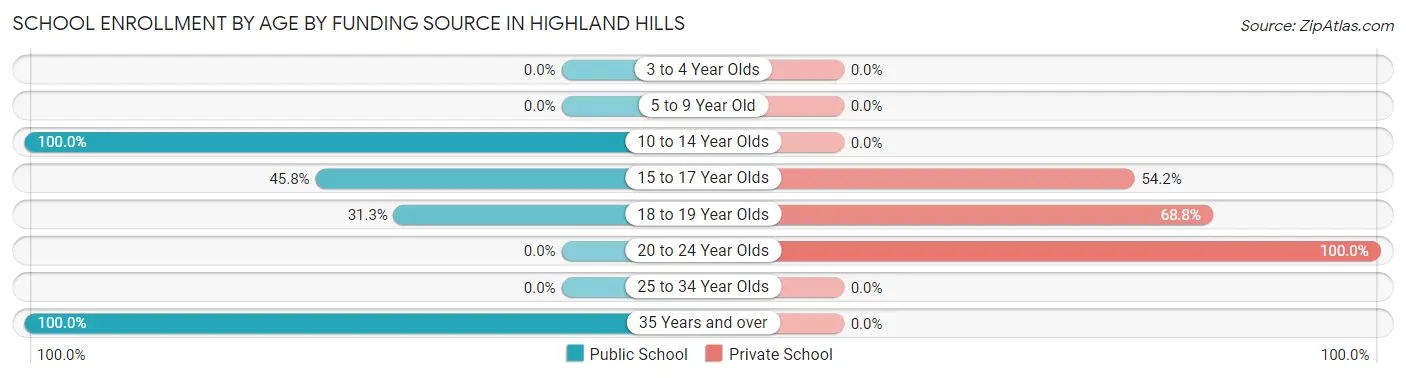
| Age Bracket | Public School | Private School |
| 3 to 4 Year Olds | 0 (0.0%) | 0 (0.0%) |
| 5 to 9 Year Old | 0 (0.0%) | 0 (0.0%) |
| 10 to 14 Year Olds | 13 (100.0%) | 0 (0.0%) |
| 15 to 17 Year Olds | 11 (45.8%) | 13 (54.2%) |
| 18 to 19 Year Olds | 5 (31.2%) | 11 (68.8%) |
| 20 to 24 Year Olds | 0 (0.0%) | 4 (100.0%) |
| 25 to 34 Year Olds | 0 (0.0%) | 0 (0.0%) |
| 35 Years and over | 4 (100.0%) | 0 (0.0%) |
| Total | 33 (54.1%) | 28 (45.9%) |
Educational Attainment by Field of Study in Highland Hills
Education (16 | 53.3%), social sciences (8 | 26.7%), bio, nature & agricultural (2 | 6.7%), science & technology (2 | 6.7%), and business (2 | 6.7%) are the most common fields of study among 30 individuals in Highland Hills who have obtained a bachelor's degree or higher.
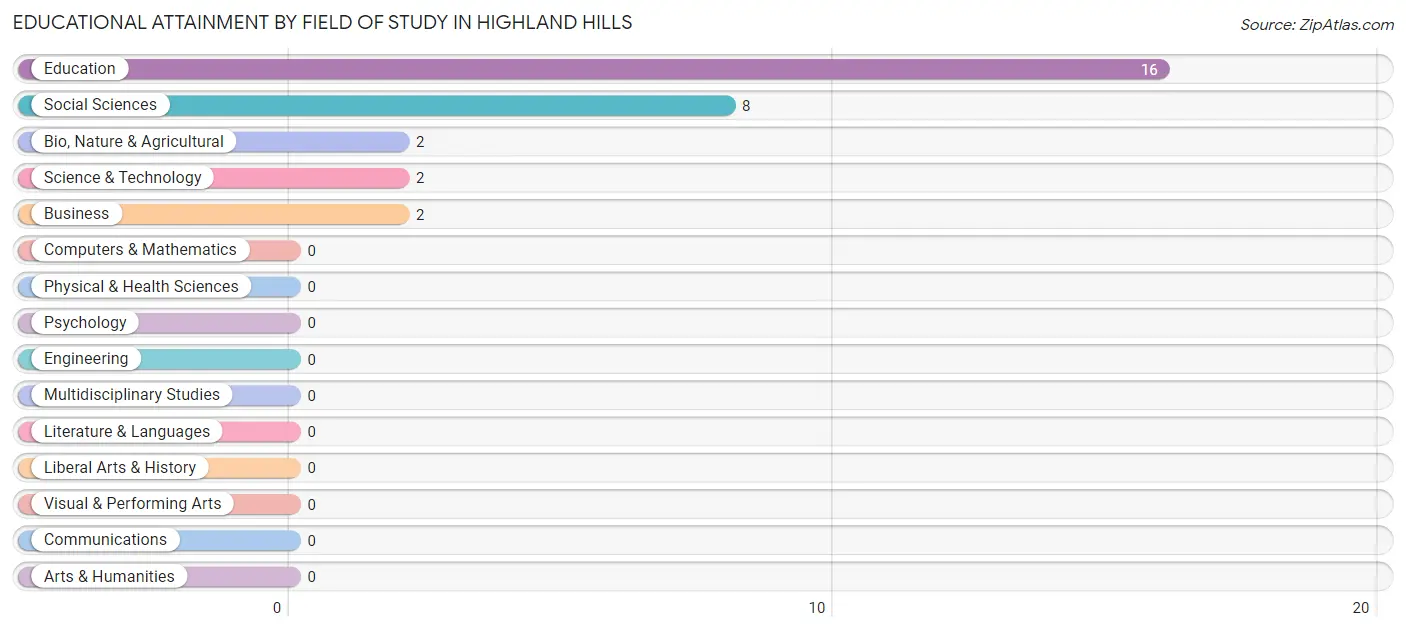
| Field of Study | # Graduates | % Graduates |
| Computers & Mathematics | 0 | 0.0% |
| Bio, Nature & Agricultural | 2 | 6.7% |
| Physical & Health Sciences | 0 | 0.0% |
| Psychology | 0 | 0.0% |
| Social Sciences | 8 | 26.7% |
| Engineering | 0 | 0.0% |
| Multidisciplinary Studies | 0 | 0.0% |
| Science & Technology | 2 | 6.7% |
| Business | 2 | 6.7% |
| Education | 16 | 53.3% |
| Literature & Languages | 0 | 0.0% |
| Liberal Arts & History | 0 | 0.0% |
| Visual & Performing Arts | 0 | 0.0% |
| Communications | 0 | 0.0% |
| Arts & Humanities | 0 | 0.0% |
| Total | 30 | 100.0% |
Transportation & Commute in Highland Hills
Vehicle Availability by Sex in Highland Hills
The most prevalent vehicle ownership categories in Highland Hills are males with 3 vehicles (17, accounting for 22.7%) and females with 3 vehicles (38, making up 17.0%).
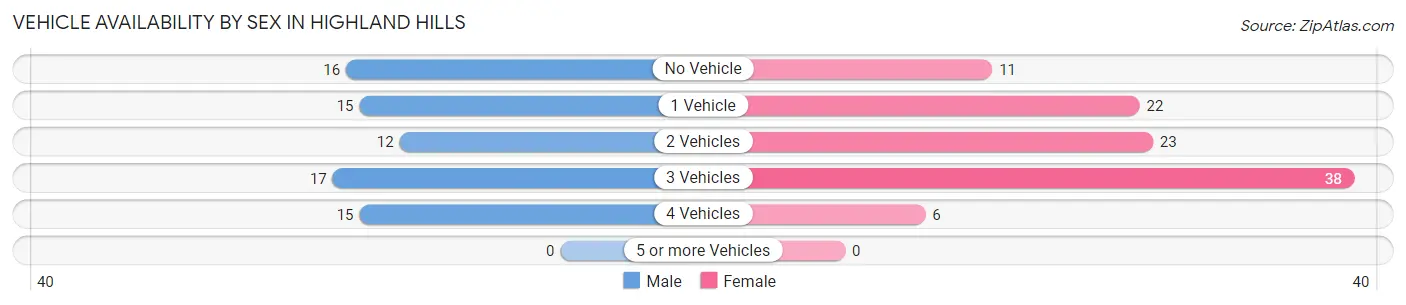
| Vehicles Available | Male | Female |
| No Vehicle | 16 (21.3%) | 11 (11.0%) |
| 1 Vehicle | 15 (20.0%) | 22 (22.0%) |
| 2 Vehicles | 12 (16.0%) | 23 (23.0%) |
| 3 Vehicles | 17 (22.7%) | 38 (38.0%) |
| 4 Vehicles | 15 (20.0%) | 6 (6.0%) |
| 5 or more Vehicles | 0 (0.0%) | 0 (0.0%) |
| Total | 75 (100.0%) | 100 (100.0%) |
Commute Time in Highland Hills
The most frequently occuring commute durations in Highland Hills are 30 to 34 minutes (50 commuters, 26.7%), 25 to 29 minutes (49 commuters, 26.2%), and 15 to 19 minutes (28 commuters, 15.0%).
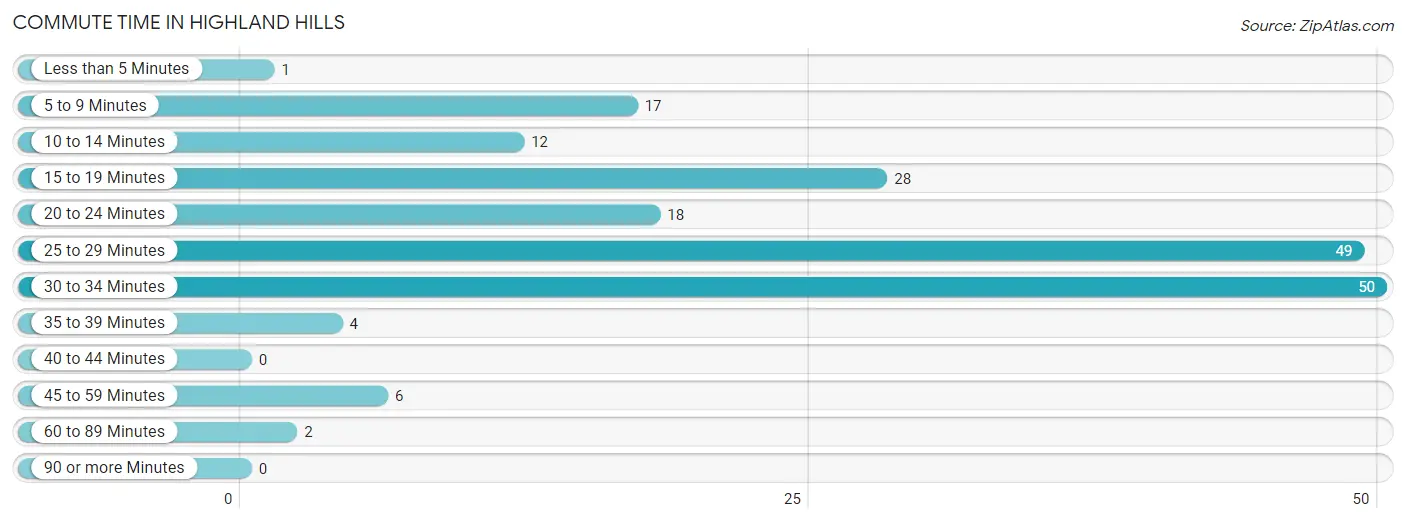
| Commute Time | # Commuters | % Commuters |
| Less than 5 Minutes | 1 | 0.5% |
| 5 to 9 Minutes | 17 | 9.1% |
| 10 to 14 Minutes | 12 | 6.4% |
| 15 to 19 Minutes | 28 | 15.0% |
| 20 to 24 Minutes | 18 | 9.6% |
| 25 to 29 Minutes | 49 | 26.2% |
| 30 to 34 Minutes | 50 | 26.7% |
| 35 to 39 Minutes | 4 | 2.1% |
| 40 to 44 Minutes | 0 | 0.0% |
| 45 to 59 Minutes | 6 | 3.2% |
| 60 to 89 Minutes | 2 | 1.1% |
| 90 or more Minutes | 0 | 0.0% |
Commute Time by Sex in Highland Hills
The most common commute times in Highland Hills are 30 to 34 minutes (41 commuters, 47.1%) for males and 25 to 29 minutes (45 commuters, 45.0%) for females.
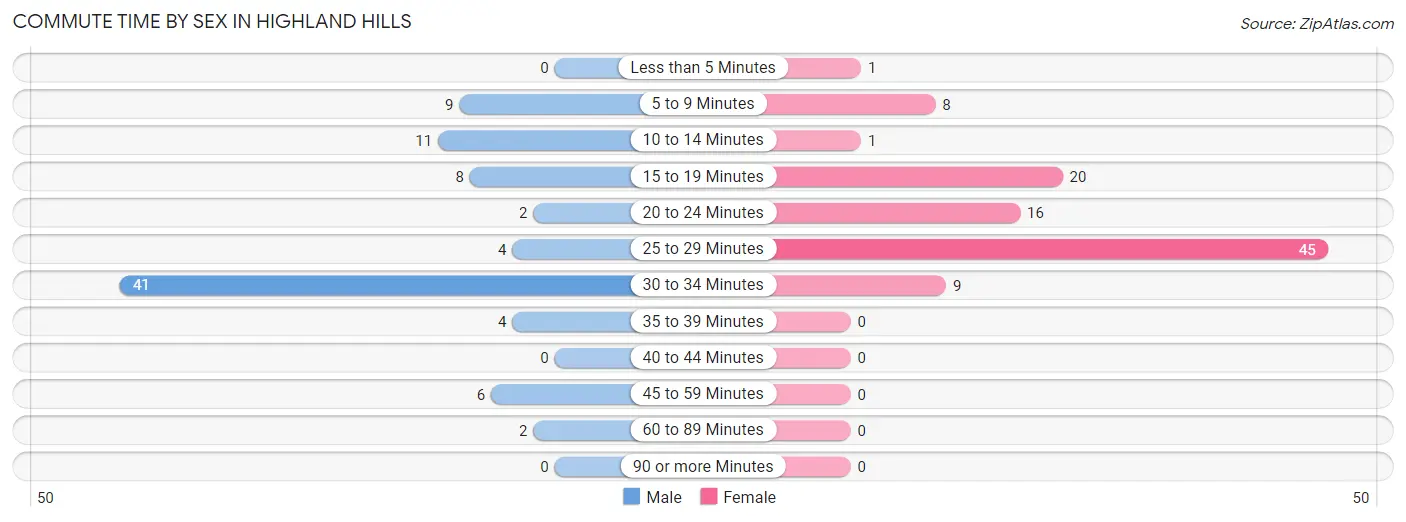
| Commute Time | Male | Female |
| Less than 5 Minutes | 0 (0.0%) | 1 (1.0%) |
| 5 to 9 Minutes | 9 (10.3%) | 8 (8.0%) |
| 10 to 14 Minutes | 11 (12.6%) | 1 (1.0%) |
| 15 to 19 Minutes | 8 (9.2%) | 20 (20.0%) |
| 20 to 24 Minutes | 2 (2.3%) | 16 (16.0%) |
| 25 to 29 Minutes | 4 (4.6%) | 45 (45.0%) |
| 30 to 34 Minutes | 41 (47.1%) | 9 (9.0%) |
| 35 to 39 Minutes | 4 (4.6%) | 0 (0.0%) |
| 40 to 44 Minutes | 0 (0.0%) | 0 (0.0%) |
| 45 to 59 Minutes | 6 (6.9%) | 0 (0.0%) |
| 60 to 89 Minutes | 2 (2.3%) | 0 (0.0%) |
| 90 or more Minutes | 0 (0.0%) | 0 (0.0%) |
Time of Departure to Work by Sex in Highland Hills
The most frequent times of departure to work in Highland Hills are 8:00 AM to 8:29 AM (20, 23.0%) for males and 12:00 PM to 3:59 PM (23, 23.0%) for females.
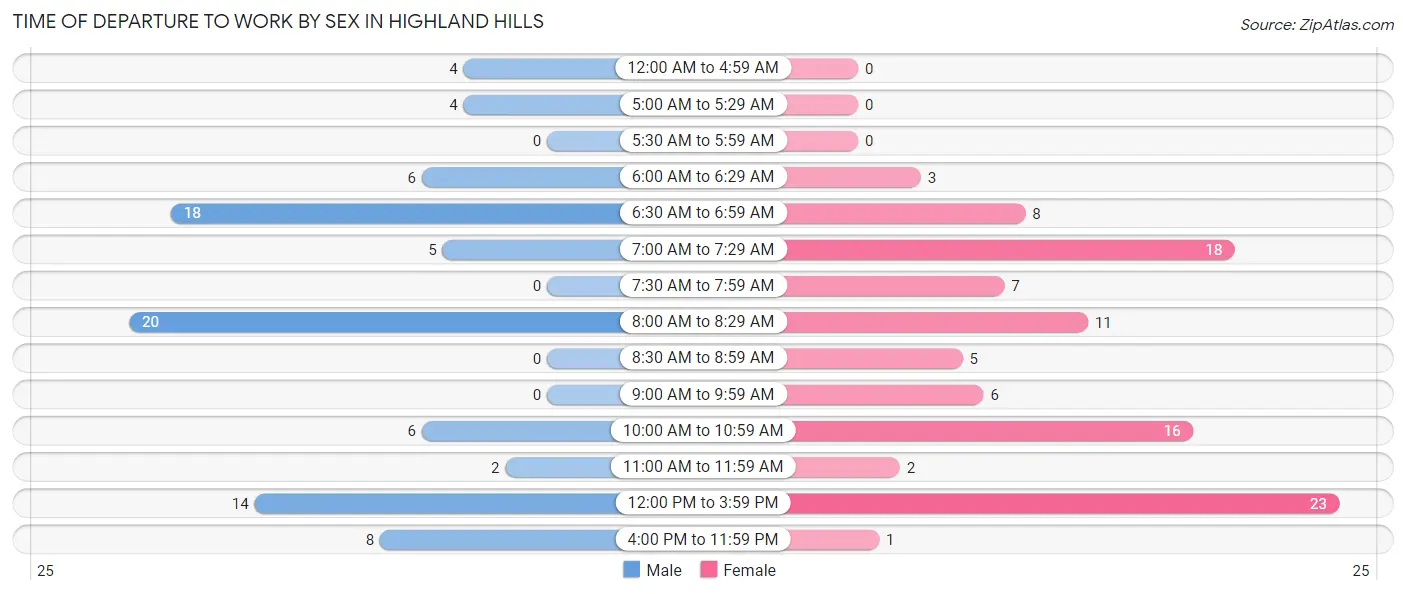
| Time of Departure | Male | Female |
| 12:00 AM to 4:59 AM | 4 (4.6%) | 0 (0.0%) |
| 5:00 AM to 5:29 AM | 4 (4.6%) | 0 (0.0%) |
| 5:30 AM to 5:59 AM | 0 (0.0%) | 0 (0.0%) |
| 6:00 AM to 6:29 AM | 6 (6.9%) | 3 (3.0%) |
| 6:30 AM to 6:59 AM | 18 (20.7%) | 8 (8.0%) |
| 7:00 AM to 7:29 AM | 5 (5.8%) | 18 (18.0%) |
| 7:30 AM to 7:59 AM | 0 (0.0%) | 7 (7.0%) |
| 8:00 AM to 8:29 AM | 20 (23.0%) | 11 (11.0%) |
| 8:30 AM to 8:59 AM | 0 (0.0%) | 5 (5.0%) |
| 9:00 AM to 9:59 AM | 0 (0.0%) | 6 (6.0%) |
| 10:00 AM to 10:59 AM | 6 (6.9%) | 16 (16.0%) |
| 11:00 AM to 11:59 AM | 2 (2.3%) | 2 (2.0%) |
| 12:00 PM to 3:59 PM | 14 (16.1%) | 23 (23.0%) |
| 4:00 PM to 11:59 PM | 8 (9.2%) | 1 (1.0%) |
| Total | 87 (100.0%) | 100 (100.0%) |
Housing Occupancy in Highland Hills
Occupancy by Ownership in Highland Hills
Of the total 218 dwellings in Highland Hills, owner-occupied units account for 63 (28.9%), while renter-occupied units make up 155 (71.1%).
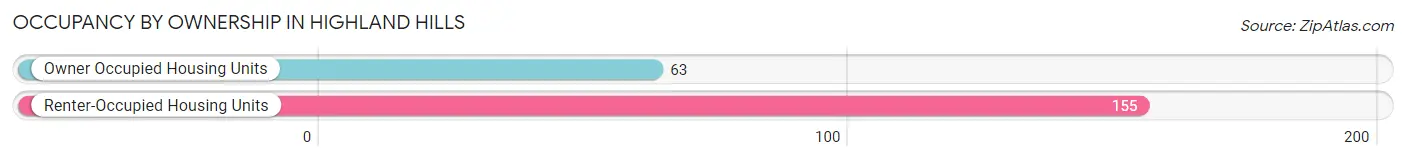
| Occupancy | # Housing Units | % Housing Units |
| Owner Occupied Housing Units | 63 | 28.9% |
| Renter-Occupied Housing Units | 155 | 71.1% |
| Total Occupied Housing Units | 218 | 100.0% |
Occupancy by Household Size in Highland Hills
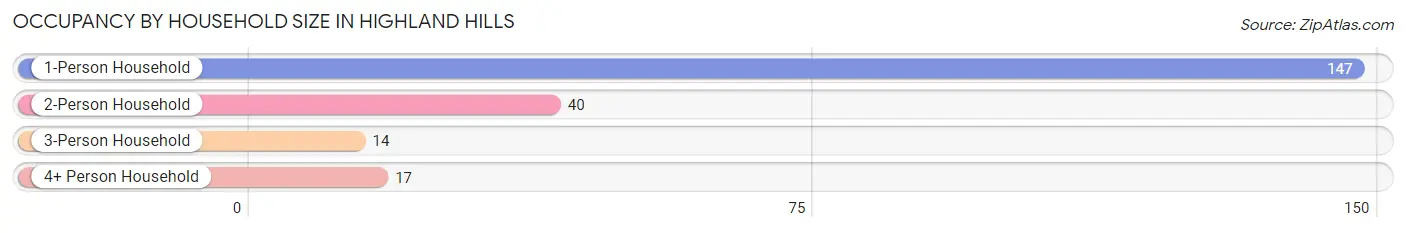
| Household Size | # Housing Units | % Housing Units |
| 1-Person Household | 147 | 67.4% |
| 2-Person Household | 40 | 18.3% |
| 3-Person Household | 14 | 6.4% |
| 4+ Person Household | 17 | 7.8% |
| Total Housing Units | 218 | 100.0% |
Occupancy by Ownership by Household Size in Highland Hills
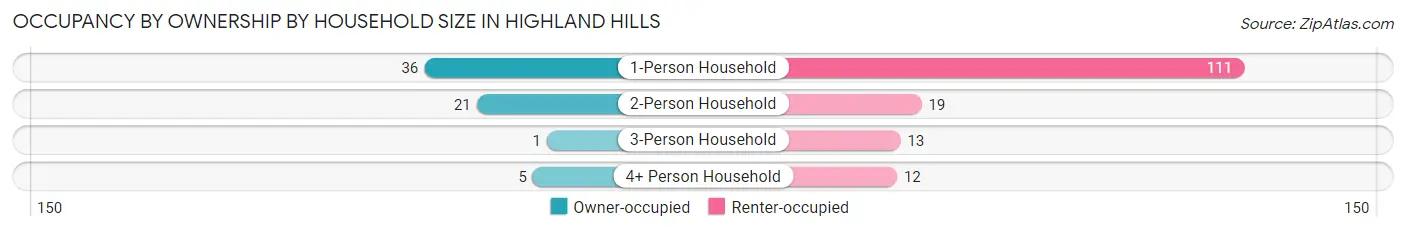
| Household Size | Owner-occupied | Renter-occupied |
| 1-Person Household | 36 (24.5%) | 111 (75.5%) |
| 2-Person Household | 21 (52.5%) | 19 (47.5%) |
| 3-Person Household | 1 (7.1%) | 13 (92.9%) |
| 4+ Person Household | 5 (29.4%) | 12 (70.6%) |
| Total Housing Units | 63 (28.9%) | 155 (71.1%) |
Occupancy by Educational Attainment in Highland Hills
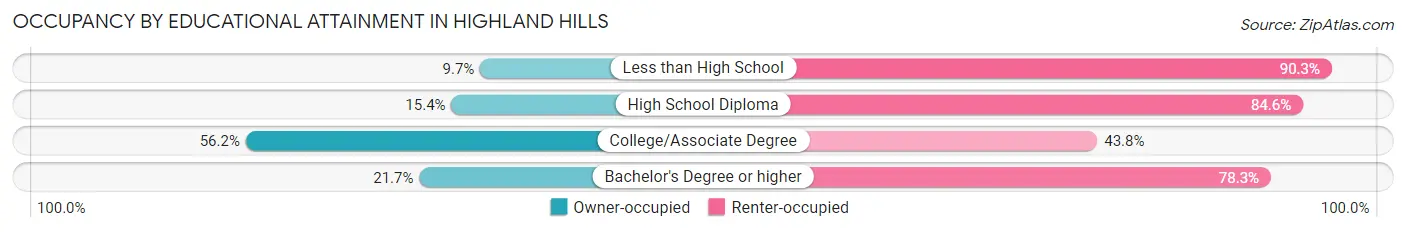
| Household Size | Owner-occupied | Renter-occupied |
| Less than High School | 3 (9.7%) | 28 (90.3%) |
| High School Diploma | 14 (15.4%) | 77 (84.6%) |
| College/Associate Degree | 41 (56.2%) | 32 (43.8%) |
| Bachelor's Degree or higher | 5 (21.7%) | 18 (78.3%) |
Occupancy by Age of Householder in Highland Hills
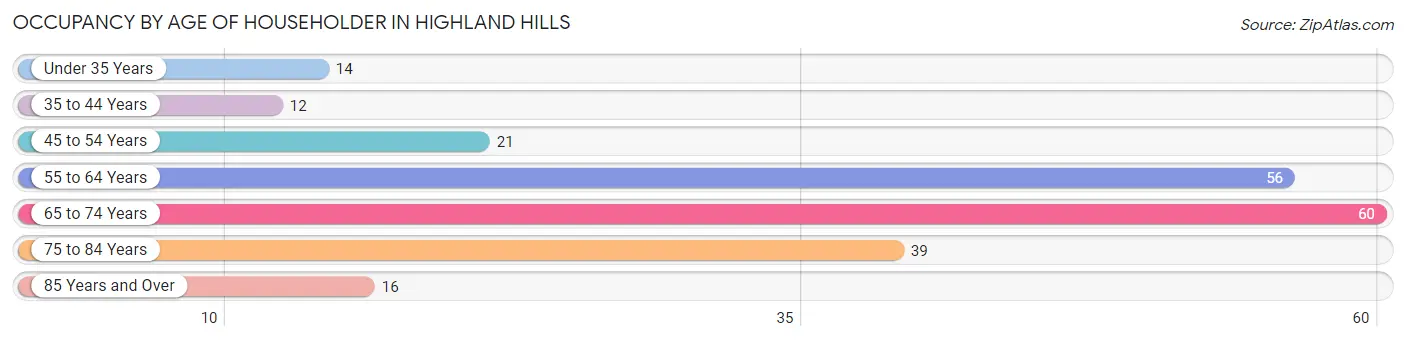
| Age Bracket | # Households | % Households |
| Under 35 Years | 14 | 6.4% |
| 35 to 44 Years | 12 | 5.5% |
| 45 to 54 Years | 21 | 9.6% |
| 55 to 64 Years | 56 | 25.7% |
| 65 to 74 Years | 60 | 27.5% |
| 75 to 84 Years | 39 | 17.9% |
| 85 Years and Over | 16 | 7.3% |
| Total | 218 | 100.0% |
Housing Finances in Highland Hills
Median Income by Occupancy in Highland Hills
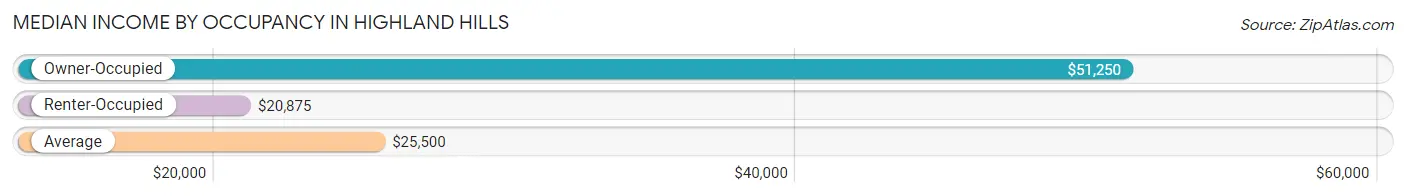
| Occupancy Type | # Households | Median Income |
| Owner-Occupied | 63 (28.9%) | $51,250 |
| Renter-Occupied | 155 (71.1%) | $20,875 |
| Average | 218 (100.0%) | $25,500 |
Occupancy by Householder Income Bracket in Highland Hills
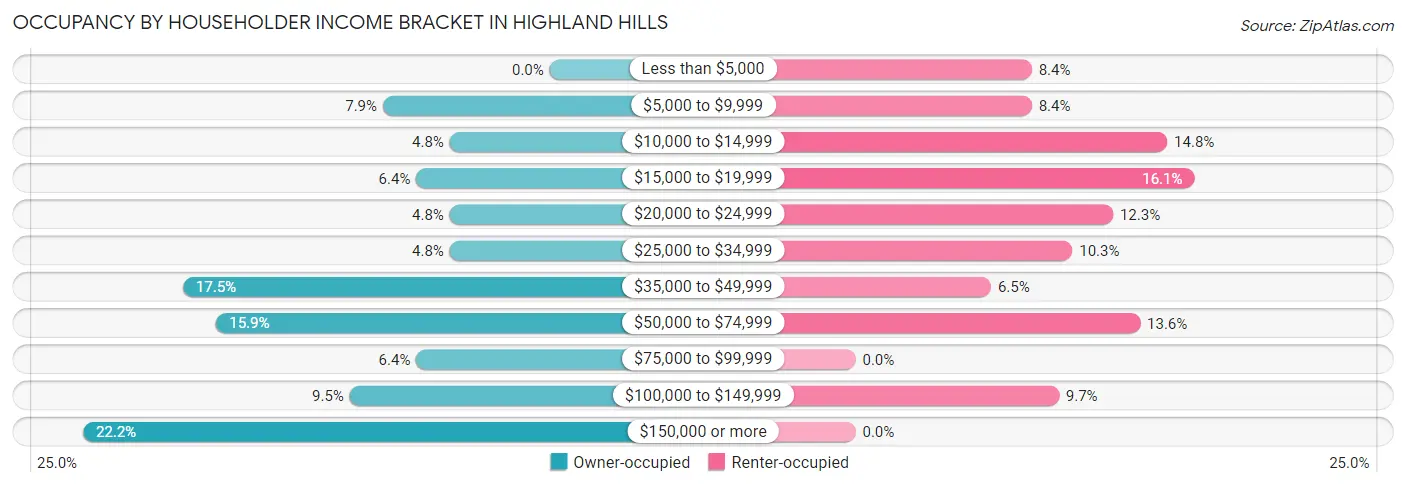
| Income Bracket | Owner-occupied | Renter-occupied |
| Less than $5,000 | 0 (0.0%) | 13 (8.4%) |
| $5,000 to $9,999 | 5 (7.9%) | 13 (8.4%) |
| $10,000 to $14,999 | 3 (4.8%) | 23 (14.8%) |
| $15,000 to $19,999 | 4 (6.4%) | 25 (16.1%) |
| $20,000 to $24,999 | 3 (4.8%) | 19 (12.3%) |
| $25,000 to $34,999 | 3 (4.8%) | 16 (10.3%) |
| $35,000 to $49,999 | 11 (17.5%) | 10 (6.5%) |
| $50,000 to $74,999 | 10 (15.9%) | 21 (13.6%) |
| $75,000 to $99,999 | 4 (6.4%) | 0 (0.0%) |
| $100,000 to $149,999 | 6 (9.5%) | 15 (9.7%) |
| $150,000 or more | 14 (22.2%) | 0 (0.0%) |
| Total | 63 (100.0%) | 155 (100.0%) |
Monthly Housing Cost Tiers in Highland Hills
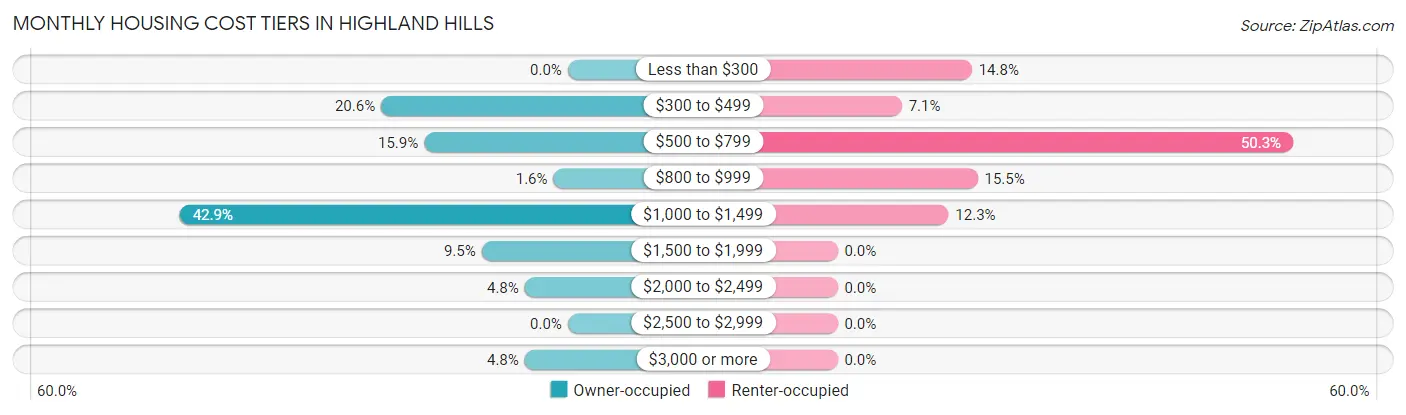
| Monthly Cost | Owner-occupied | Renter-occupied |
| Less than $300 | 0 (0.0%) | 23 (14.8%) |
| $300 to $499 | 13 (20.6%) | 11 (7.1%) |
| $500 to $799 | 10 (15.9%) | 78 (50.3%) |
| $800 to $999 | 1 (1.6%) | 24 (15.5%) |
| $1,000 to $1,499 | 27 (42.9%) | 19 (12.3%) |
| $1,500 to $1,999 | 6 (9.5%) | 0 (0.0%) |
| $2,000 to $2,499 | 3 (4.8%) | 0 (0.0%) |
| $2,500 to $2,999 | 0 (0.0%) | 0 (0.0%) |
| $3,000 or more | 3 (4.8%) | 0 (0.0%) |
| Total | 63 (100.0%) | 155 (100.0%) |
Physical Housing Characteristics in Highland Hills
Housing Structures in Highland Hills
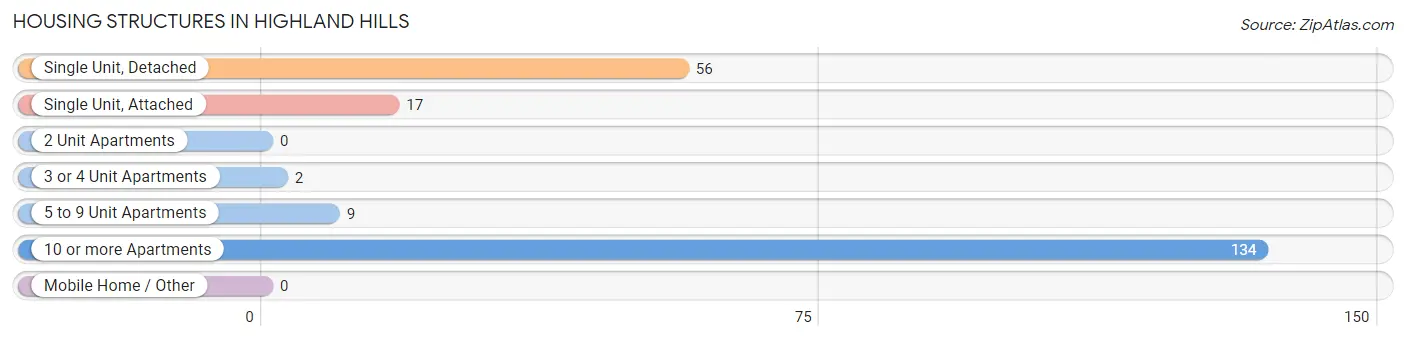
| Structure Type | # Housing Units | % Housing Units |
| Single Unit, Detached | 56 | 25.7% |
| Single Unit, Attached | 17 | 7.8% |
| 2 Unit Apartments | 0 | 0.0% |
| 3 or 4 Unit Apartments | 2 | 0.9% |
| 5 to 9 Unit Apartments | 9 | 4.1% |
| 10 or more Apartments | 134 | 61.5% |
| Mobile Home / Other | 0 | 0.0% |
| Total | 218 | 100.0% |
Housing Structures by Occupancy in Highland Hills
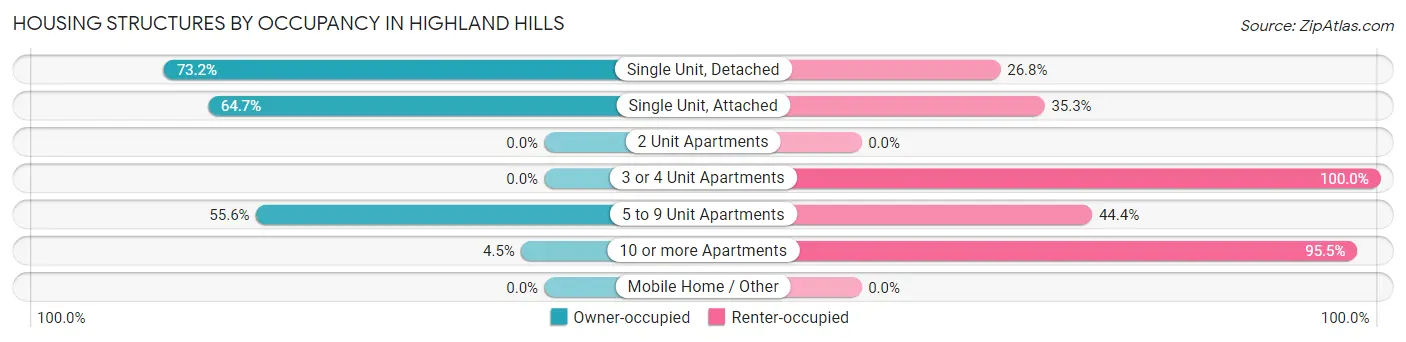
| Structure Type | Owner-occupied | Renter-occupied |
| Single Unit, Detached | 41 (73.2%) | 15 (26.8%) |
| Single Unit, Attached | 11 (64.7%) | 6 (35.3%) |
| 2 Unit Apartments | 0 (0.0%) | 0 (0.0%) |
| 3 or 4 Unit Apartments | 0 (0.0%) | 2 (100.0%) |
| 5 to 9 Unit Apartments | 5 (55.6%) | 4 (44.4%) |
| 10 or more Apartments | 6 (4.5%) | 128 (95.5%) |
| Mobile Home / Other | 0 (0.0%) | 0 (0.0%) |
| Total | 63 (28.9%) | 155 (71.1%) |
Housing Structures by Number of Rooms in Highland Hills
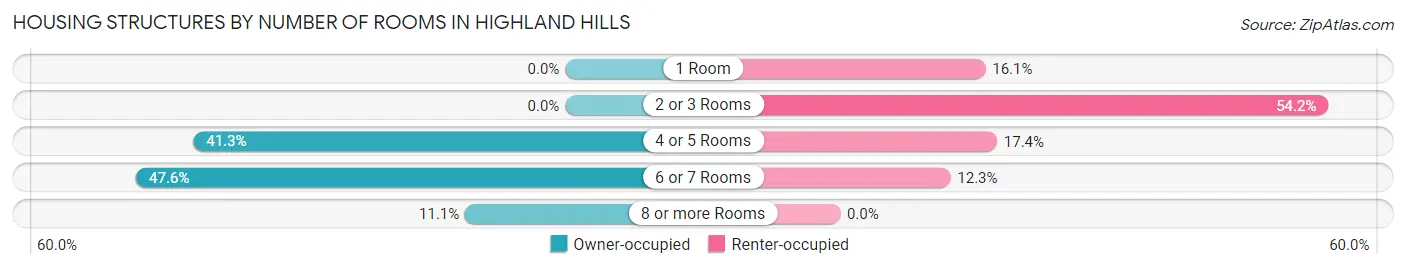
| Number of Rooms | Owner-occupied | Renter-occupied |
| 1 Room | 0 (0.0%) | 25 (16.1%) |
| 2 or 3 Rooms | 0 (0.0%) | 84 (54.2%) |
| 4 or 5 Rooms | 26 (41.3%) | 27 (17.4%) |
| 6 or 7 Rooms | 30 (47.6%) | 19 (12.3%) |
| 8 or more Rooms | 7 (11.1%) | 0 (0.0%) |
| Total | 63 (100.0%) | 155 (100.0%) |
Housing Structure by Heating Type in Highland Hills
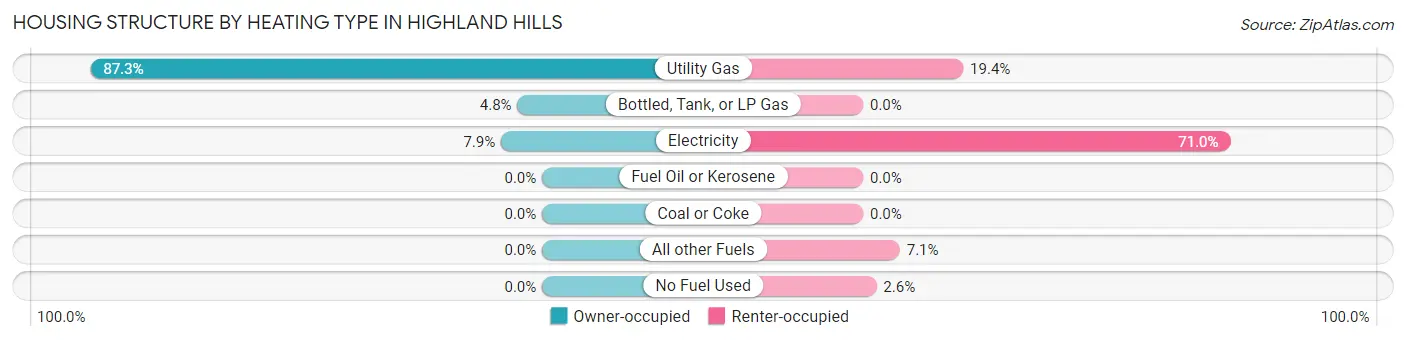
| Heating Type | Owner-occupied | Renter-occupied |
| Utility Gas | 55 (87.3%) | 30 (19.4%) |
| Bottled, Tank, or LP Gas | 3 (4.8%) | 0 (0.0%) |
| Electricity | 5 (7.9%) | 110 (71.0%) |
| Fuel Oil or Kerosene | 0 (0.0%) | 0 (0.0%) |
| Coal or Coke | 0 (0.0%) | 0 (0.0%) |
| All other Fuels | 0 (0.0%) | 11 (7.1%) |
| No Fuel Used | 0 (0.0%) | 4 (2.6%) |
| Total | 63 (100.0%) | 155 (100.0%) |
Household Vehicle Usage in Highland Hills
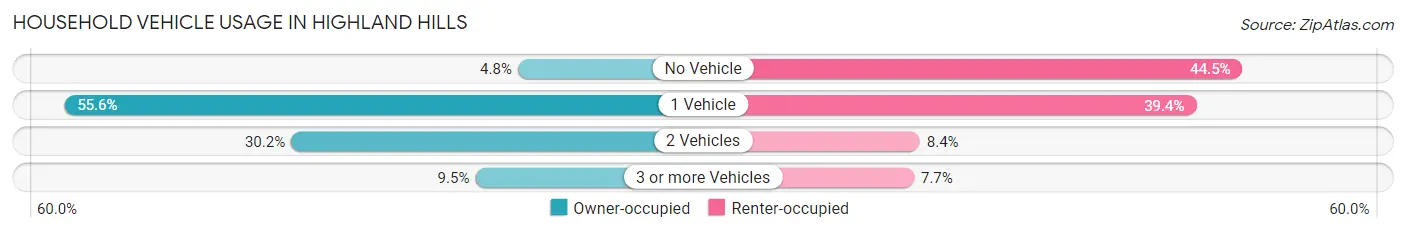
| Vehicles per Household | Owner-occupied | Renter-occupied |
| No Vehicle | 3 (4.8%) | 69 (44.5%) |
| 1 Vehicle | 35 (55.6%) | 61 (39.4%) |
| 2 Vehicles | 19 (30.2%) | 13 (8.4%) |
| 3 or more Vehicles | 6 (9.5%) | 12 (7.7%) |
| Total | 63 (100.0%) | 155 (100.0%) |
Real Estate & Mortgages in Highland Hills
Real Estate and Mortgage Overview in Highland Hills
| Characteristic | Without Mortgage | With Mortgage |
| Housing Units | 26 | 37 |
| Median Property Value | $89,200 | $114,100 |
| Median Household Income | $25,833 | $12 |
| Monthly Housing Costs | $500 | $0 |
| Real Estate Taxes | $2,313 | $0 |
Property Value by Mortgage Status in Highland Hills
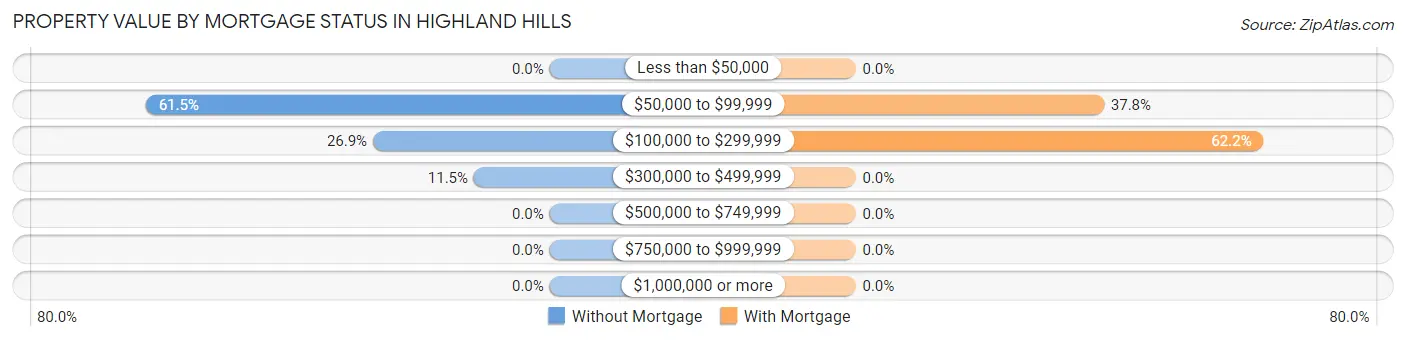
| Property Value | Without Mortgage | With Mortgage |
| Less than $50,000 | 0 (0.0%) | 0 (0.0%) |
| $50,000 to $99,999 | 16 (61.5%) | 14 (37.8%) |
| $100,000 to $299,999 | 7 (26.9%) | 23 (62.2%) |
| $300,000 to $499,999 | 3 (11.5%) | 0 (0.0%) |
| $500,000 to $749,999 | 0 (0.0%) | 0 (0.0%) |
| $750,000 to $999,999 | 0 (0.0%) | 0 (0.0%) |
| $1,000,000 or more | 0 (0.0%) | 0 (0.0%) |
| Total | 26 (100.0%) | 37 (100.0%) |
Household Income by Mortgage Status in Highland Hills
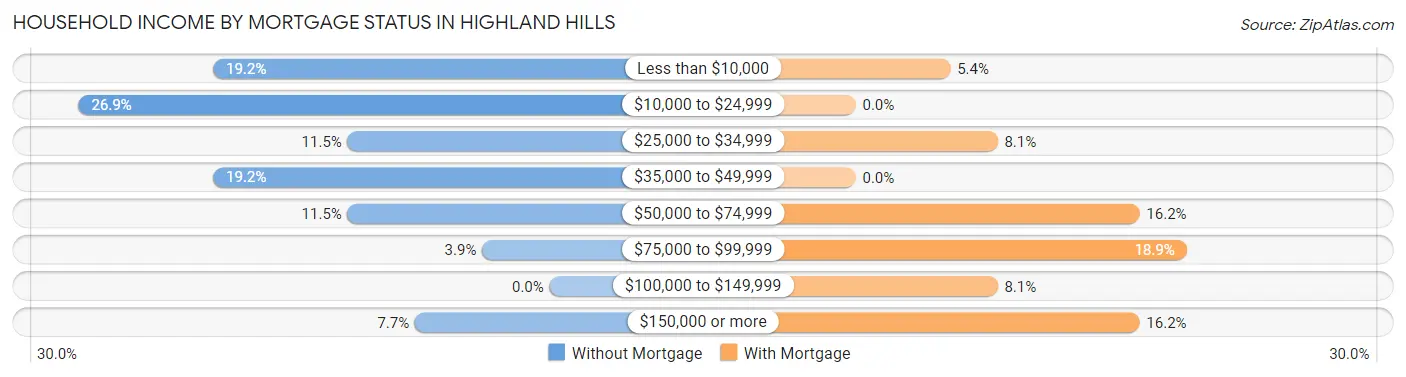
| Household Income | Without Mortgage | With Mortgage |
| Less than $10,000 | 5 (19.2%) | 2 (5.4%) |
| $10,000 to $24,999 | 7 (26.9%) | 0 (0.0%) |
| $25,000 to $34,999 | 3 (11.5%) | 3 (8.1%) |
| $35,000 to $49,999 | 5 (19.2%) | 0 (0.0%) |
| $50,000 to $74,999 | 3 (11.5%) | 6 (16.2%) |
| $75,000 to $99,999 | 1 (3.8%) | 7 (18.9%) |
| $100,000 to $149,999 | 0 (0.0%) | 3 (8.1%) |
| $150,000 or more | 2 (7.7%) | 6 (16.2%) |
| Total | 26 (100.0%) | 37 (100.0%) |
Property Value to Household Income Ratio in Highland Hills
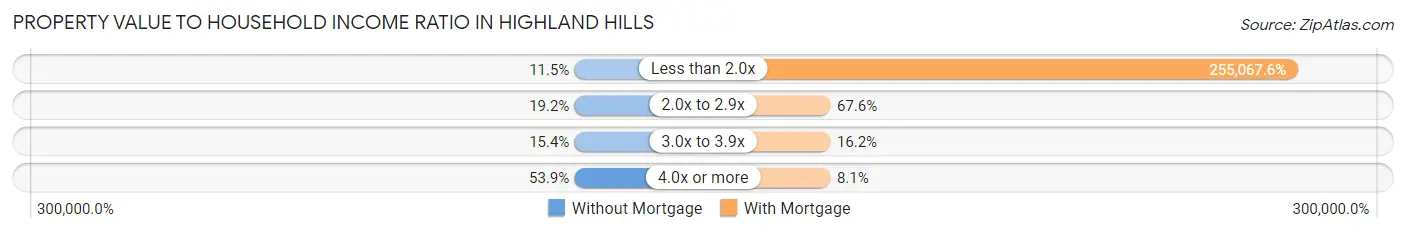
| Value-to-Income Ratio | Without Mortgage | With Mortgage |
| Less than 2.0x | 3 (11.5%) | 94,375 (255,067.6%) |
| 2.0x to 2.9x | 5 (19.2%) | 25 (67.6%) |
| 3.0x to 3.9x | 4 (15.4%) | 6 (16.2%) |
| 4.0x or more | 14 (53.8%) | 3 (8.1%) |
| Total | 26 (100.0%) | 37 (100.0%) |
Real Estate Taxes by Mortgage Status in Highland Hills
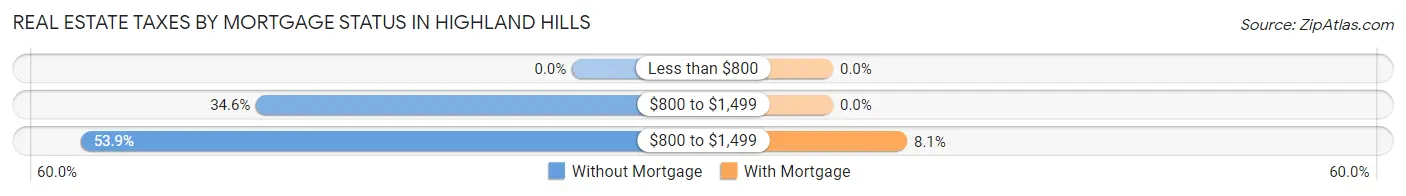
| Property Taxes | Without Mortgage | With Mortgage |
| Less than $800 | 0 (0.0%) | 0 (0.0%) |
| $800 to $1,499 | 9 (34.6%) | 0 (0.0%) |
| $800 to $1,499 | 14 (53.8%) | 3 (8.1%) |
| Total | 26 (100.0%) | 37 (100.0%) |
Health & Disability in Highland Hills
Health Insurance Coverage by Age in Highland Hills
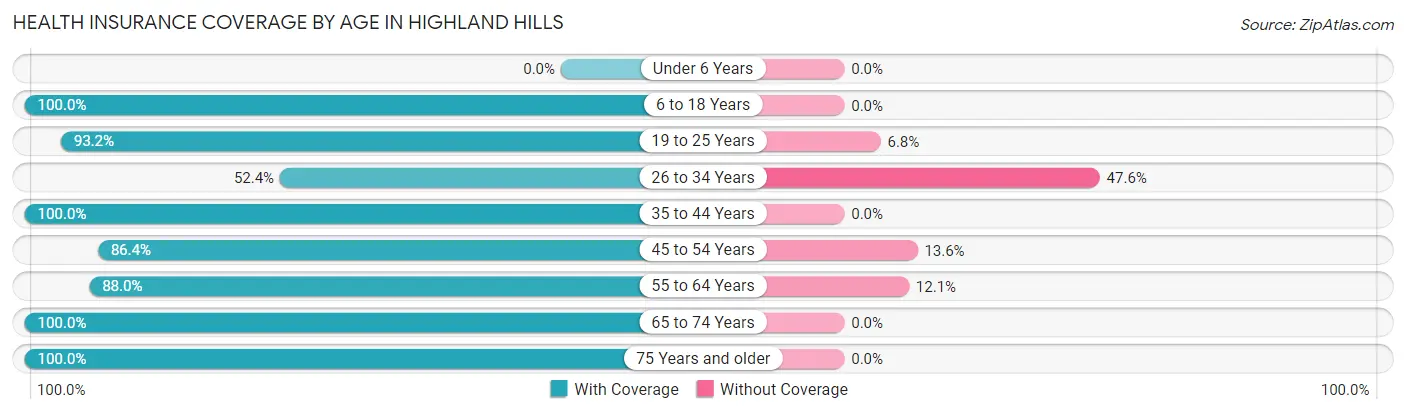
| Age Bracket | With Coverage | Without Coverage |
| Under 6 Years | 0 (0.0%) | 0 (0.0%) |
| 6 to 18 Years | 17 (100.0%) | 0 (0.0%) |
| 19 to 25 Years | 69 (93.2%) | 5 (6.8%) |
| 26 to 34 Years | 33 (52.4%) | 30 (47.6%) |
| 35 to 44 Years | 24 (100.0%) | 0 (0.0%) |
| 45 to 54 Years | 57 (86.4%) | 9 (13.6%) |
| 55 to 64 Years | 73 (87.9%) | 10 (12.0%) |
| 65 to 74 Years | 94 (100.0%) | 0 (0.0%) |
| 75 Years and older | 62 (100.0%) | 0 (0.0%) |
| Total | 429 (88.8%) | 54 (11.2%) |
Health Insurance Coverage by Citizenship Status in Highland Hills
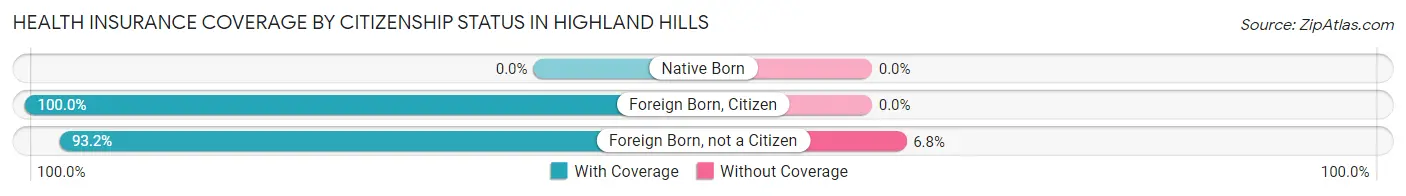
| Citizenship Status | With Coverage | Without Coverage |
| Native Born | 0 (0.0%) | 0 (0.0%) |
| Foreign Born, Citizen | 17 (100.0%) | 0 (0.0%) |
| Foreign Born, not a Citizen | 69 (93.2%) | 5 (6.8%) |
Health Insurance Coverage by Household Income in Highland Hills
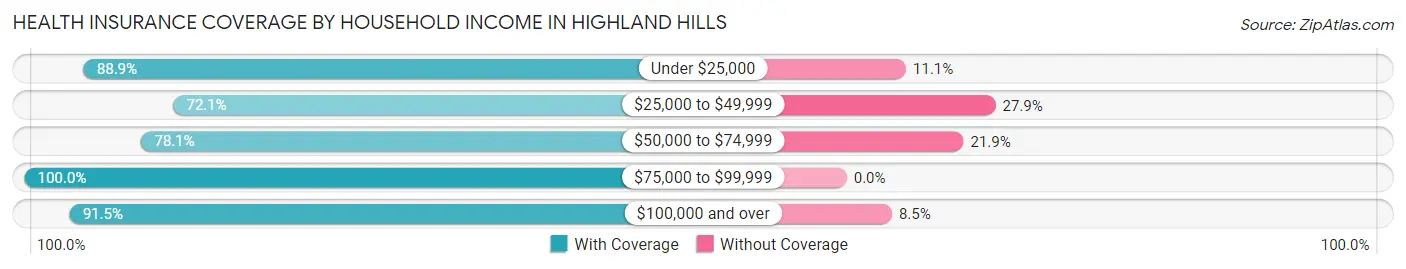
| Household Income | With Coverage | Without Coverage |
| Under $25,000 | 96 (88.9%) | 12 (11.1%) |
| $25,000 to $49,999 | 44 (72.1%) | 17 (27.9%) |
| $50,000 to $74,999 | 50 (78.1%) | 14 (21.9%) |
| $75,000 to $99,999 | 9 (100.0%) | 0 (0.0%) |
| $100,000 and over | 119 (91.5%) | 11 (8.5%) |
Public vs Private Health Insurance Coverage by Age in Highland Hills
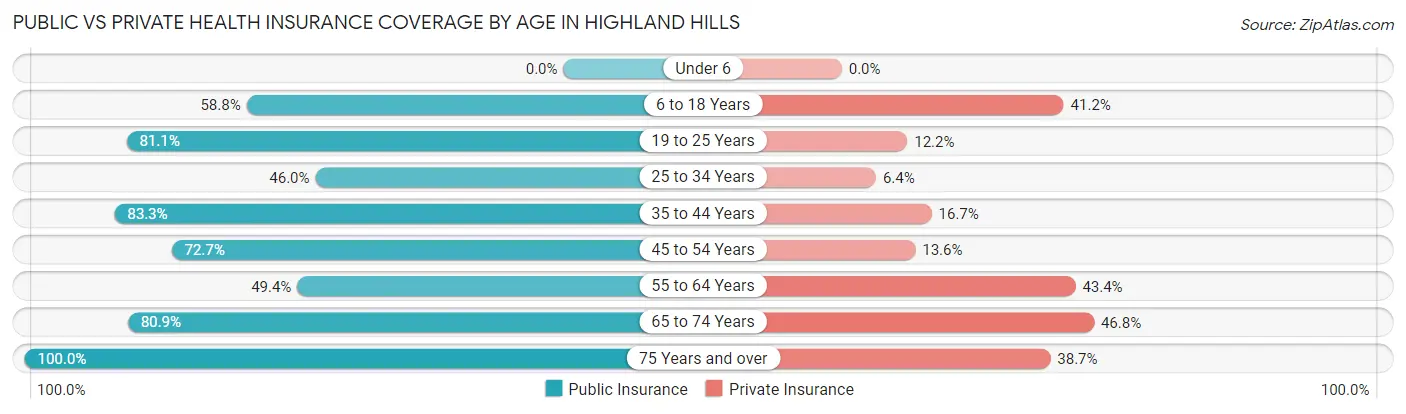
| Age Bracket | Public Insurance | Private Insurance |
| Under 6 | 0 (0.0%) | 0 (0.0%) |
| 6 to 18 Years | 10 (58.8%) | 7 (41.2%) |
| 19 to 25 Years | 60 (81.1%) | 9 (12.2%) |
| 25 to 34 Years | 29 (46.0%) | 4 (6.4%) |
| 35 to 44 Years | 20 (83.3%) | 4 (16.7%) |
| 45 to 54 Years | 48 (72.7%) | 9 (13.6%) |
| 55 to 64 Years | 41 (49.4%) | 36 (43.4%) |
| 65 to 74 Years | 76 (80.8%) | 44 (46.8%) |
| 75 Years and over | 62 (100.0%) | 24 (38.7%) |
| Total | 346 (71.6%) | 137 (28.4%) |
Disability Status by Sex by Age in Highland Hills
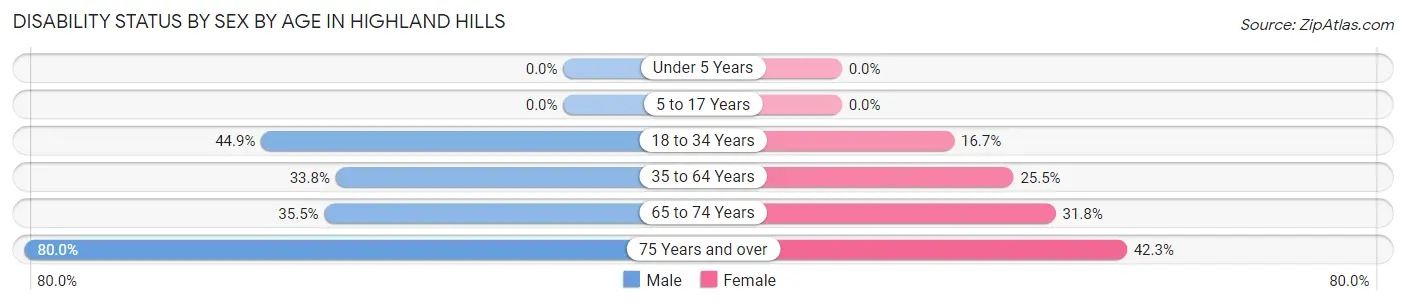
| Age Bracket | Male | Female |
| Under 5 Years | 0 (0.0%) | 0 (0.0%) |
| 5 to 17 Years | 0 (0.0%) | 0 (0.0%) |
| 18 to 34 Years | 48 (44.9%) | 5 (16.7%) |
| 35 to 64 Years | 24 (33.8%) | 26 (25.5%) |
| 65 to 74 Years | 11 (35.5%) | 20 (31.8%) |
| 75 Years and over | 8 (80.0%) | 22 (42.3%) |
Disability Class by Sex by Age in Highland Hills
Disability Class: Hearing Difficulty
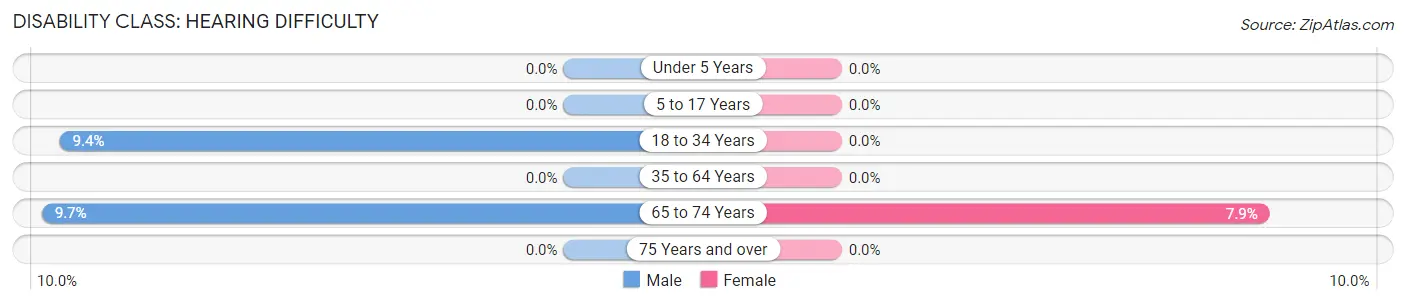
| Age Bracket | Male | Female |
| Under 5 Years | 0 (0.0%) | 0 (0.0%) |
| 5 to 17 Years | 0 (0.0%) | 0 (0.0%) |
| 18 to 34 Years | 10 (9.3%) | 0 (0.0%) |
| 35 to 64 Years | 0 (0.0%) | 0 (0.0%) |
| 65 to 74 Years | 3 (9.7%) | 5 (7.9%) |
| 75 Years and over | 0 (0.0%) | 0 (0.0%) |
Disability Class: Vision Difficulty
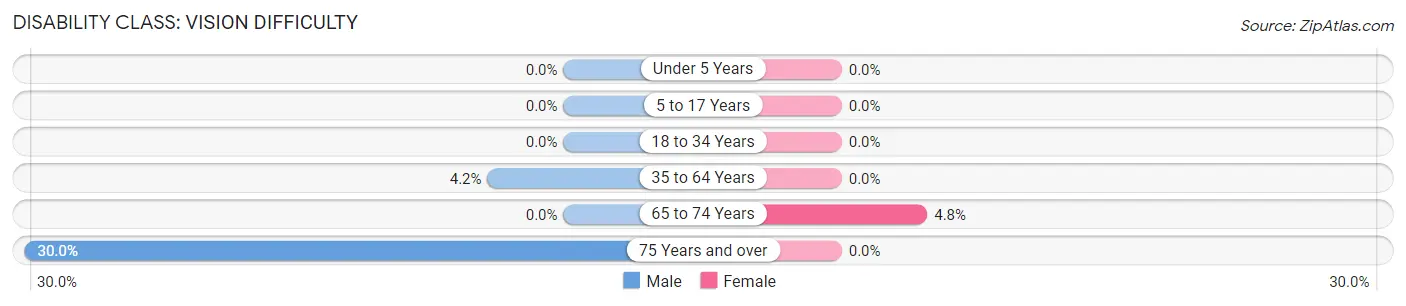
| Age Bracket | Male | Female |
| Under 5 Years | 0 (0.0%) | 0 (0.0%) |
| 5 to 17 Years | 0 (0.0%) | 0 (0.0%) |
| 18 to 34 Years | 0 (0.0%) | 0 (0.0%) |
| 35 to 64 Years | 3 (4.2%) | 0 (0.0%) |
| 65 to 74 Years | 0 (0.0%) | 3 (4.8%) |
| 75 Years and over | 3 (30.0%) | 0 (0.0%) |
Disability Class: Cognitive Difficulty
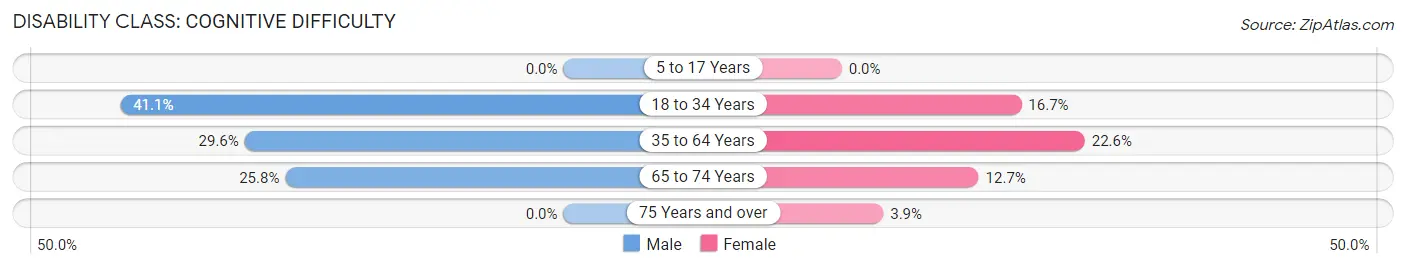
| Age Bracket | Male | Female |
| 5 to 17 Years | 0 (0.0%) | 0 (0.0%) |
| 18 to 34 Years | 44 (41.1%) | 5 (16.7%) |
| 35 to 64 Years | 21 (29.6%) | 23 (22.6%) |
| 65 to 74 Years | 8 (25.8%) | 8 (12.7%) |
| 75 Years and over | 0 (0.0%) | 2 (3.8%) |
Disability Class: Ambulatory Difficulty
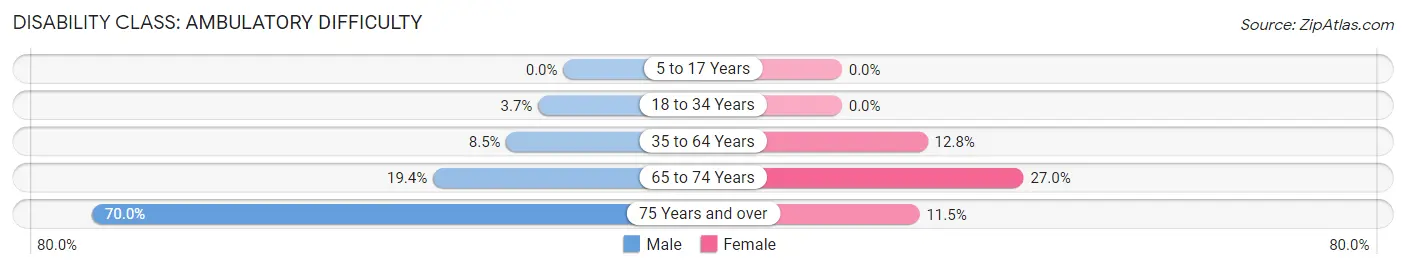
| Age Bracket | Male | Female |
| 5 to 17 Years | 0 (0.0%) | 0 (0.0%) |
| 18 to 34 Years | 4 (3.7%) | 0 (0.0%) |
| 35 to 64 Years | 6 (8.5%) | 13 (12.8%) |
| 65 to 74 Years | 6 (19.4%) | 17 (27.0%) |
| 75 Years and over | 7 (70.0%) | 6 (11.5%) |
Disability Class: Self-Care Difficulty
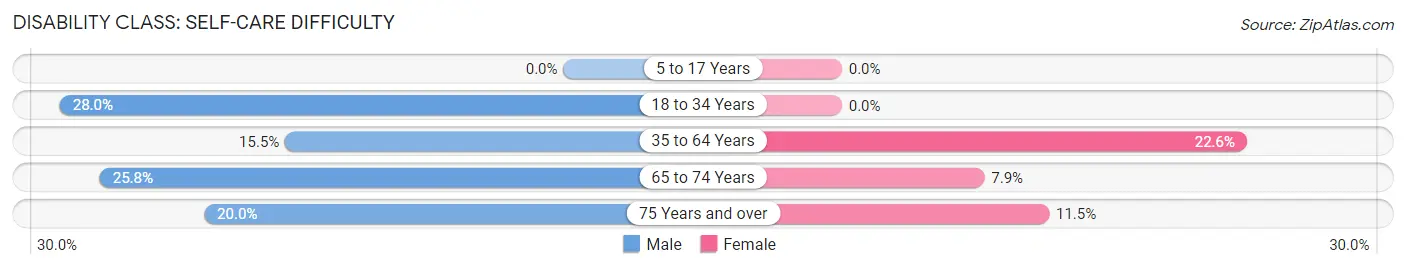
| Age Bracket | Male | Female |
| 5 to 17 Years | 0 (0.0%) | 0 (0.0%) |
| 18 to 34 Years | 30 (28.0%) | 0 (0.0%) |
| 35 to 64 Years | 11 (15.5%) | 23 (22.6%) |
| 65 to 74 Years | 8 (25.8%) | 5 (7.9%) |
| 75 Years and over | 2 (20.0%) | 6 (11.5%) |
Technology Access in Highland Hills
Computing Device Access in Highland Hills
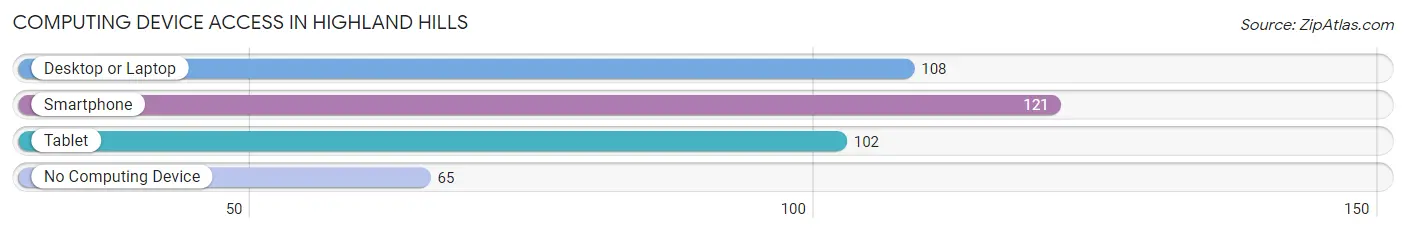
| Device Type | # Households | % Households |
| Desktop or Laptop | 108 | 49.5% |
| Smartphone | 121 | 55.5% |
| Tablet | 102 | 46.8% |
| No Computing Device | 65 | 29.8% |
| Total | 218 | 100.0% |
Internet Access in Highland Hills
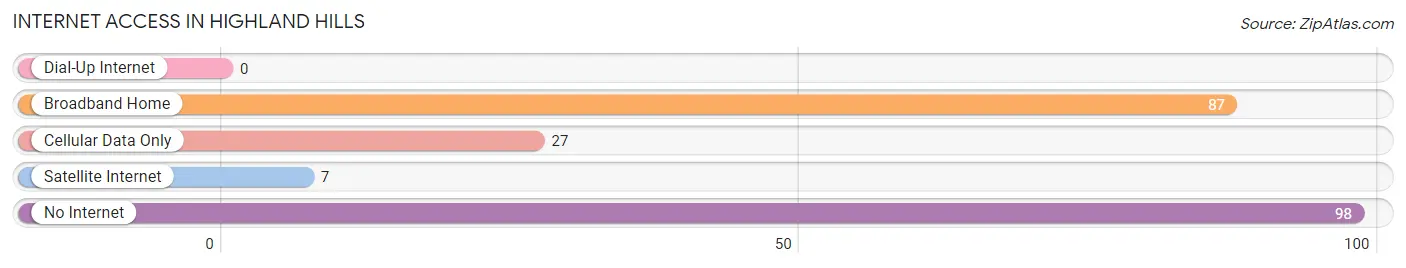
| Internet Type | # Households | % Households |
| Dial-Up Internet | 0 | 0.0% |
| Broadband Home | 87 | 39.9% |
| Cellular Data Only | 27 | 12.4% |
| Satellite Internet | 7 | 3.2% |
| No Internet | 98 | 45.0% |
| Total | 218 | 100.0% |
Highland Hills Summary
Highland Hills, Ohio is a small village located in Cuyahoga County, Ohio. It is a suburb of Cleveland and is located approximately 10 miles southeast of the city. The village has a population of 2,845 people, according to the 2010 census.
History
Highland Hills was founded in the early 1900s by a group of farmers who wanted to create a community that was close to the city of Cleveland. The village was originally known as “Highland” and was incorporated in 1921. The name was changed to “Highland Hills” in 1925.
The village was primarily a farming community until the 1950s when it began to experience rapid growth due to the expansion of Cleveland. The population of Highland Hills increased from 1,000 in 1950 to over 4,000 in 1970.
Geography
Highland Hills is located in Cuyahoga County, Ohio. It is situated approximately 10 miles southeast of Cleveland. The village is bordered by the cities of Garfield Heights, Bedford, and Maple Heights.
The village is situated on a plateau that is approximately 500 feet above sea level. The terrain is mostly flat with some rolling hills. The village is located in the Cuyahoga Valley National Park and is surrounded by several parks and nature preserves.
Economy
Highland Hills is primarily a residential community. The village does not have any major industries or businesses. The majority of the population is employed in the service sector, with many people working in the nearby cities of Cleveland and Garfield Heights.
The village does have a few small businesses, including a grocery store, a gas station, and a few restaurants. The village also has a few small office buildings and industrial parks.
Demographics
According to the 2010 census, the population of Highland Hills was 2,845. The population is predominantly African American, with a small percentage of white and Hispanic residents. The median household income is $37,000, and the median age is 37.
Highland Hills is a safe and friendly community. The village has a low crime rate and is a great place to raise a family. The village is served by the Garfield Heights City School District.
Highland Hills is a great place to live and work. The village has a small-town feel with easy access to the amenities of the nearby cities of Cleveland and Garfield Heights. The village is a great place to call home.
Common Questions
What is Per Capita Income in Highland Hills?
Per Capita income in Highland Hills is $23,378.
What is the Median Family Income in Highland Hills?
Median Family Income in Highland Hills is $94,375.
What is the Median Household income in Highland Hills?
Median Household Income in Highland Hills is $25,500.
What is Income or Wage Gap in Highland Hills?
Income or Wage Gap in Highland Hills is 34.1%.
Women in Highland Hills earn 65.9 cents for every dollar earned by a man.
What is Inequality or Gini Index in Highland Hills?
Inequality or Gini Index in Highland Hills is 0.64.
What is the Total Population of Highland Hills?
Total Population of Highland Hills is 699.
What is the Total Male Population of Highland Hills?
Total Male Population of Highland Hills is 447.
What is the Total Female Population of Highland Hills?
Total Female Population of Highland Hills is 252.
What is the Ratio of Males per 100 Females in Highland Hills?
There are 177.38 Males per 100 Females in Highland Hills.
What is the Ratio of Females per 100 Males in Highland Hills?
There are 56.38 Females per 100 Males in Highland Hills.
What is the Median Population Age in Highland Hills?
Median Population Age in Highland Hills is 46.1 Years.
What is the Average Family Size in Highland Hills
Average Family Size in Highland Hills is 3.1 People.
What is the Average Household Size in Highland Hills
Average Household Size in Highland Hills is 1.7 People.
How Large is the Labor Force in Highland Hills?
There are 198 People in the Labor Forcein in Highland Hills.
What is the Percentage of People in the Labor Force in Highland Hills?
29.2% of People are in the Labor Force in Highland Hills.
What is the Unemployment Rate in Highland Hills?
Unemployment Rate in Highland Hills is 2.0%.