Oakwood village Cuyahoga County, OH Map & Demographics
Oakwood village Cuyahoga County Overview
$29,531
PER CAPITA INCOME
$85,750
AVG FAMILY INCOME
$56,316
AVG HOUSEHOLD INCOME
23.9%
WAGE / INCOME GAP [ % ]
76.1¢/ $1
WAGE / INCOME GAP [ $ ]
$20,816
FAMILY INCOME DEFICIT
0.45
INEQUALITY / GINI INDEX
3,551
TOTAL POPULATION
1,787
MALE POPULATION
1,764
FEMALE POPULATION
101.30
MALES / 100 FEMALES
98.71
FEMALES / 100 MALES
51.6
MEDIAN AGE
3.4
AVG FAMILY SIZE
2.5
AVG HOUSEHOLD SIZE
1,524
LABOR FORCE [ PEOPLE ]
50.3%
PERCENT IN LABOR FORCE
5.2%
UNEMPLOYMENT RATE
Income in Oakwood village Cuyahoga County
Income Overview in Oakwood village Cuyahoga County
Per Capita Income in Oakwood village Cuyahoga County is $29,531, while median incomes of families and households are $85,750 and $56,316 respectively.
| Characteristic | Number | Measure |
| Per Capita Income | 3,551 | $29,531 |
| Median Family Income | 746 | $85,750 |
| Mean Family Income | 746 | $94,862 |
| Median Household Income | 1,361 | $56,316 |
| Mean Household Income | 1,361 | $70,468 |
| Income Deficit | 746 | $20,816 |
| Wage / Income Gap (%) | 3,551 | 23.88% |
| Wage / Income Gap ($) | 3,551 | 76.12¢ per $1 |
| Gini / Inequality Index | 3,551 | 0.45 |
Earnings by Sex in Oakwood village Cuyahoga County
Average Earnings in Oakwood village Cuyahoga County are $39,771, $45,760 for men and $34,833 for women, a difference of 23.9%.
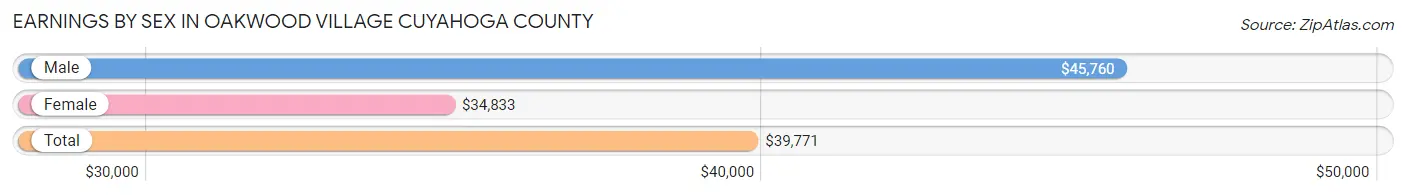
| Sex | Number | Average Earnings |
| Male | 867 (55.7%) | $45,760 |
| Female | 690 (44.3%) | $34,833 |
| Total | 1,557 (100.0%) | $39,771 |
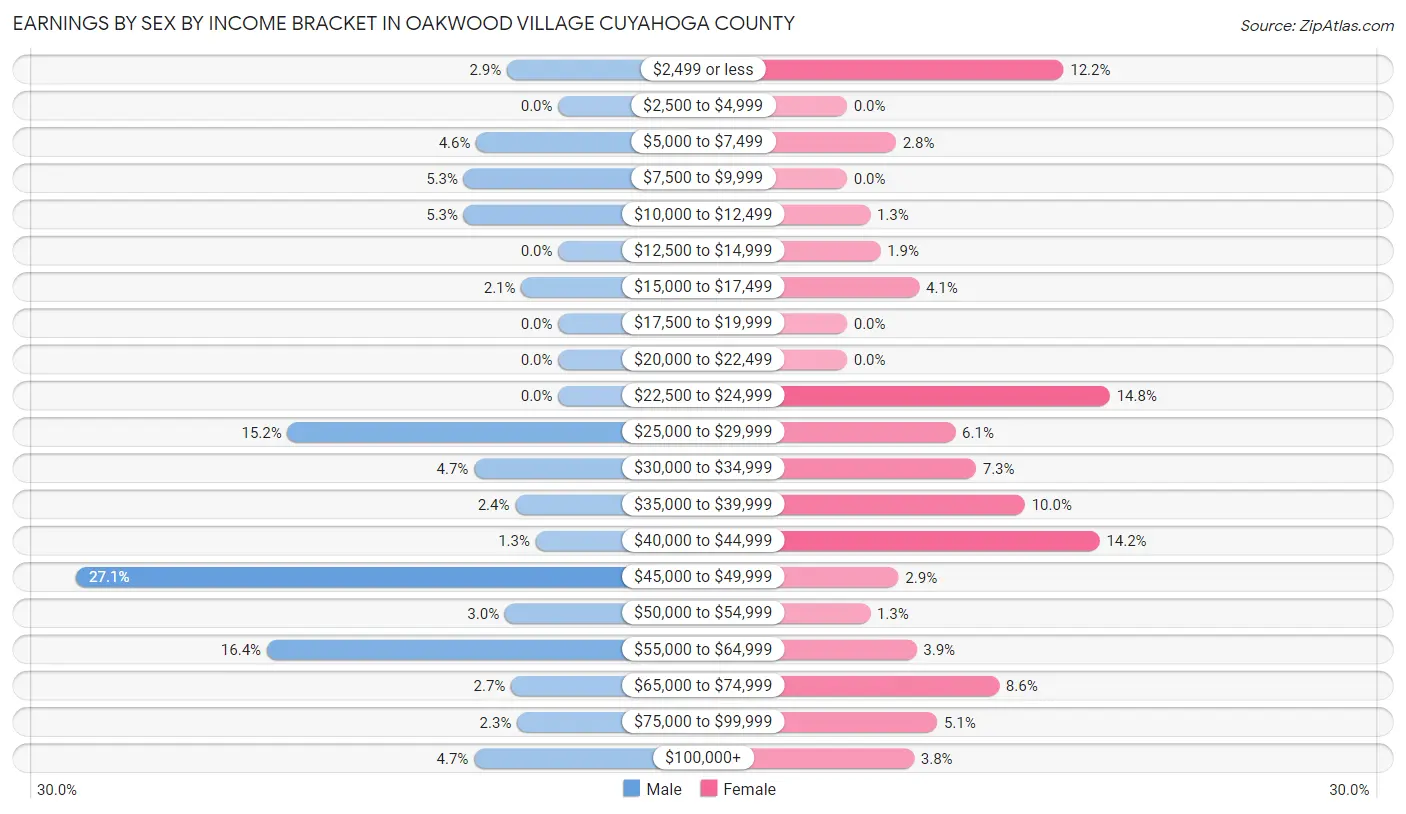
Earnings by Sex by Income Bracket in Oakwood village Cuyahoga County
The most common earnings brackets in Oakwood village Cuyahoga County are $45,000 to $49,999 for men (235 | 27.1%) and $22,500 to $24,999 for women (102 | 14.8%).
| Income | Male | Female |
| $2,499 or less | 25 (2.9%) | 84 (12.2%) |
| $2,500 to $4,999 | 0 (0.0%) | 0 (0.0%) |
| $5,000 to $7,499 | 40 (4.6%) | 19 (2.8%) |
| $7,500 to $9,999 | 46 (5.3%) | 0 (0.0%) |
| $10,000 to $12,499 | 46 (5.3%) | 9 (1.3%) |
| $12,500 to $14,999 | 0 (0.0%) | 13 (1.9%) |
| $15,000 to $17,499 | 18 (2.1%) | 28 (4.1%) |
| $17,500 to $19,999 | 0 (0.0%) | 0 (0.0%) |
| $20,000 to $22,499 | 0 (0.0%) | 0 (0.0%) |
| $22,500 to $24,999 | 0 (0.0%) | 102 (14.8%) |
| $25,000 to $29,999 | 132 (15.2%) | 42 (6.1%) |
| $30,000 to $34,999 | 41 (4.7%) | 50 (7.2%) |
| $35,000 to $39,999 | 21 (2.4%) | 69 (10.0%) |
| $40,000 to $44,999 | 11 (1.3%) | 98 (14.2%) |
| $45,000 to $49,999 | 235 (27.1%) | 20 (2.9%) |
| $50,000 to $54,999 | 26 (3.0%) | 9 (1.3%) |
| $55,000 to $64,999 | 142 (16.4%) | 27 (3.9%) |
| $65,000 to $74,999 | 23 (2.6%) | 59 (8.6%) |
| $75,000 to $99,999 | 20 (2.3%) | 35 (5.1%) |
| $100,000+ | 41 (4.7%) | 26 (3.8%) |
| Total | 867 (100.0%) | 690 (100.0%) |
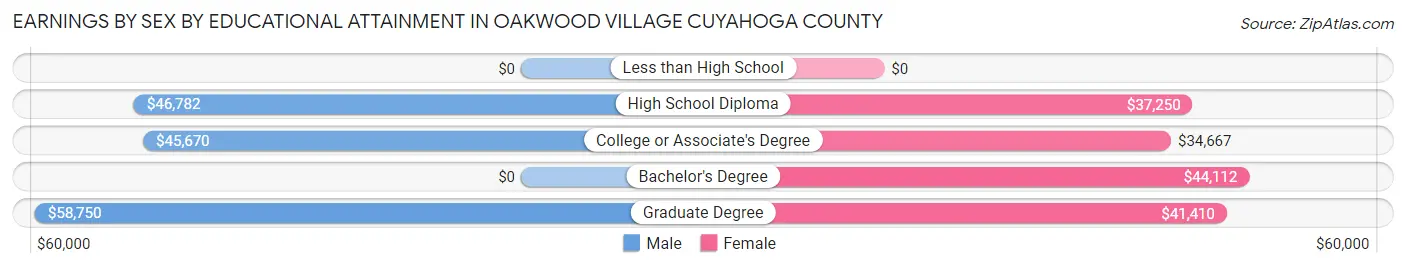
Earnings by Sex by Educational Attainment in Oakwood village Cuyahoga County
Average earnings in Oakwood village Cuyahoga County are $46,286 for men and $39,322 for women, a difference of 15.0%. Men with an educational attainment of graduate degree enjoy the highest average annual earnings of $58,750, while those with college or associate's degree education earn the least with $45,670. Women with an educational attainment of bachelor's degree earn the most with the average annual earnings of $44,112, while those with college or associate's degree education have the smallest earnings of $34,667.
| Educational Attainment | Male Income | Female Income |
| Less than High School | - | - |
| High School Diploma | $46,782 | $37,250 |
| College or Associate's Degree | $45,670 | $34,667 |
| Bachelor's Degree | - | - |
| Graduate Degree | $58,750 | $41,410 |
| Total | $46,286 | $39,322 |
Family Income in Oakwood village Cuyahoga County
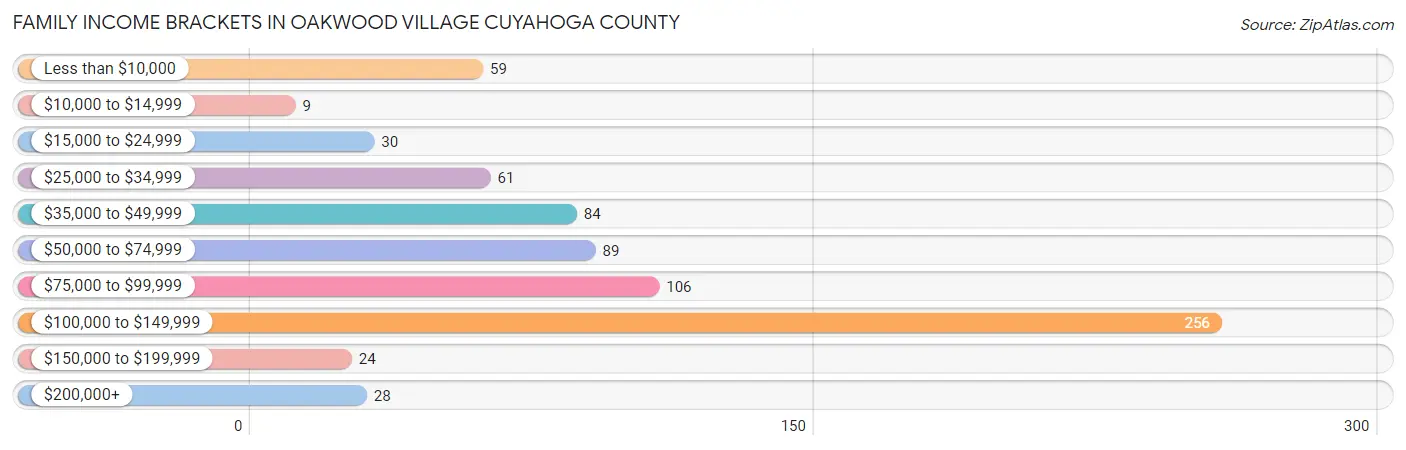
Family Income Brackets in Oakwood village Cuyahoga County
According to the Oakwood village Cuyahoga County family income data, there are 256 families falling into the $100,000 to $149,999 income range, which is the most common income bracket and makes up 34.3% of all families. Conversely, the $10,000 to $14,999 income bracket is the least frequent group with only 9 families (1.2%) belonging to this category.
| Income Bracket | # Families | % Families |
| Less than $10,000 | 59 | 7.9% |
| $10,000 to $14,999 | 9 | 1.2% |
| $15,000 to $24,999 | 30 | 4.0% |
| $25,000 to $34,999 | 61 | 8.2% |
| $35,000 to $49,999 | 84 | 11.3% |
| $50,000 to $74,999 | 89 | 11.9% |
| $75,000 to $99,999 | 106 | 14.2% |
| $100,000 to $149,999 | 256 | 34.3% |
| $150,000 to $199,999 | 24 | 3.2% |
| $200,000+ | 28 | 3.8% |
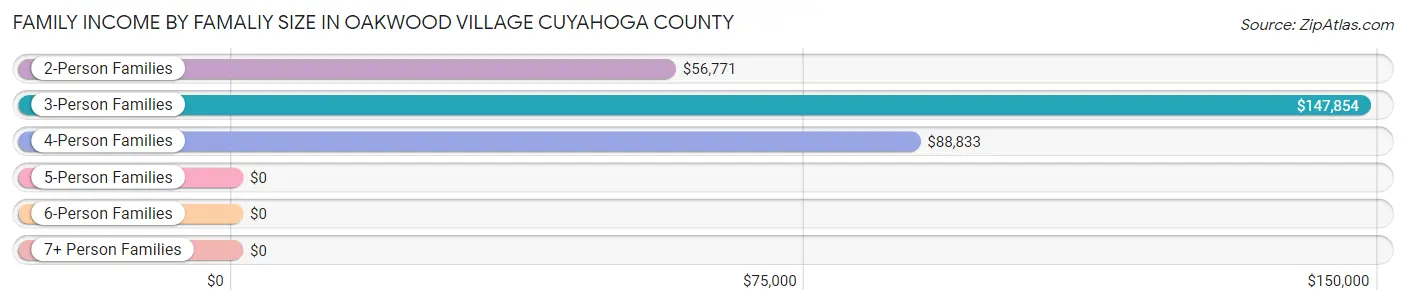
Family Income by Famaliy Size in Oakwood village Cuyahoga County
3-person families (103 | 13.8%) account for the highest median family income in Oakwood village Cuyahoga County with $147,854 per family, while 3-person families (103 | 13.8%) have the highest median income of $49,285 per family member.
| Income Bracket | # Families | Median Income |
| 2-Person Families | 378 (50.7%) | $56,771 |
| 3-Person Families | 103 (13.8%) | $147,854 |
| 4-Person Families | 130 (17.4%) | $88,833 |
| 5-Person Families | 119 (16.0%) | $0 |
| 6-Person Families | 0 (0.0%) | $0 |
| 7+ Person Families | 16 (2.1%) | $0 |
| Total | 746 (100.0%) | $85,750 |
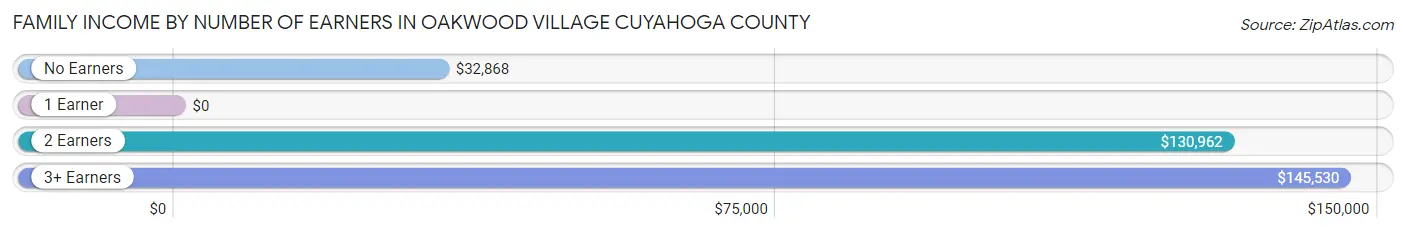
Family Income by Number of Earners in Oakwood village Cuyahoga County
| Number of Earners | # Families | Median Income |
| No Earners | 188 (25.2%) | $32,868 |
| 1 Earner | 193 (25.9%) | $0 |
| 2 Earners | 272 (36.5%) | $130,962 |
| 3+ Earners | 93 (12.5%) | $145,530 |
| Total | 746 (100.0%) | $85,750 |
Household Income in Oakwood village Cuyahoga County
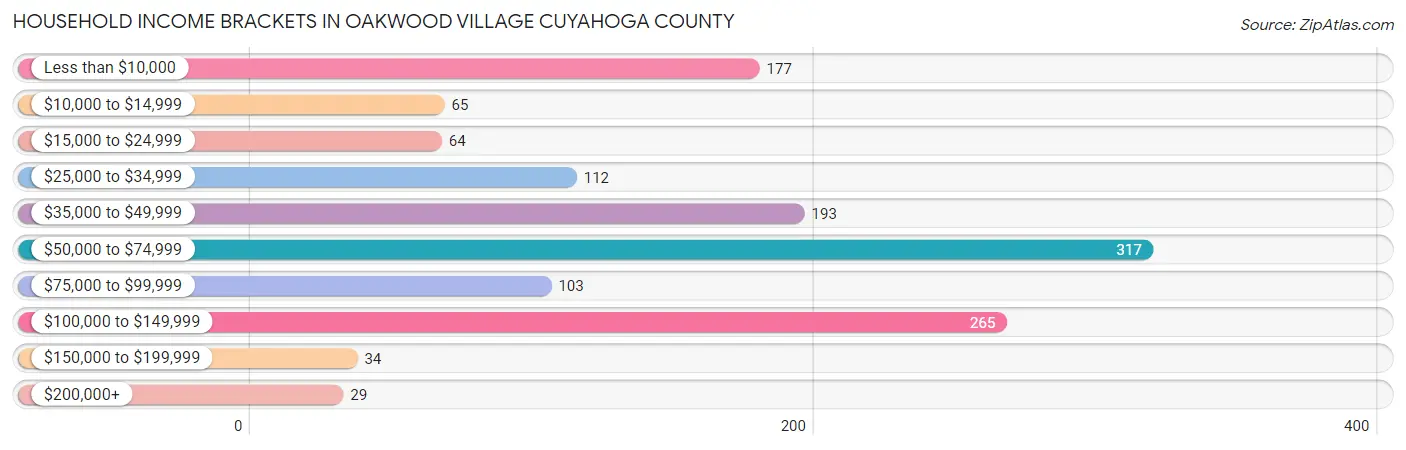
Household Income Brackets in Oakwood village Cuyahoga County
With 317 households falling in the category, the $50,000 to $74,999 income range is the most frequent in Oakwood village Cuyahoga County, accounting for 23.3% of all households. In contrast, only 29 households (2.1%) fall into the $200,000+ income bracket, making it the least populous group.
| Income Bracket | # Households | % Households |
| Less than $10,000 | 177 | 13.0% |
| $10,000 to $14,999 | 65 | 4.8% |
| $15,000 to $24,999 | 64 | 4.7% |
| $25,000 to $34,999 | 112 | 8.2% |
| $35,000 to $49,999 | 193 | 14.2% |
| $50,000 to $74,999 | 317 | 23.3% |
| $75,000 to $99,999 | 103 | 7.6% |
| $100,000 to $149,999 | 265 | 19.5% |
| $150,000 to $199,999 | 34 | 2.5% |
| $200,000+ | 29 | 2.1% |
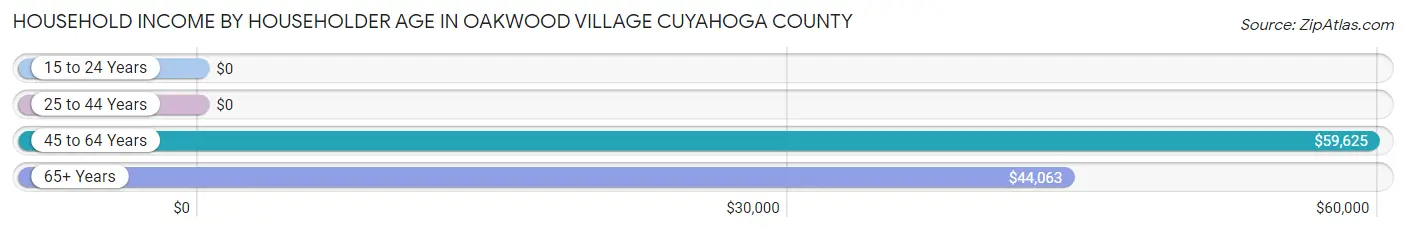
Household Income by Householder Age in Oakwood village Cuyahoga County
The median household income in Oakwood village Cuyahoga County is $56,316, with the highest median household income of $59,625 found in the 45 to 64 years age bracket for the primary householder. A total of 295 households (21.7%) fall into this category. Meanwhile, the 15 to 24 years age bracket for the primary householder has the lowest median household income of $0, with 13 households (1.0%) in this group.
| Income Bracket | # Households | Median Income |
| 15 to 24 Years | 13 (1.0%) | $0 |
| 25 to 44 Years | 301 (22.1%) | $0 |
| 45 to 64 Years | 295 (21.7%) | $59,625 |
| 65+ Years | 752 (55.2%) | $44,063 |
| Total | 1,361 (100.0%) | $56,316 |
Poverty in Oakwood village Cuyahoga County
Income Below Poverty by Sex and Age in Oakwood village Cuyahoga County
With 21.1% poverty level for males and 24.9% for females among the residents of Oakwood village Cuyahoga County, 6 to 11 year old males and 55 to 64 year old females are the most vulnerable to poverty, with 51 males (83.6%) and 203 females (63.2%) in their respective age groups living below the poverty level.
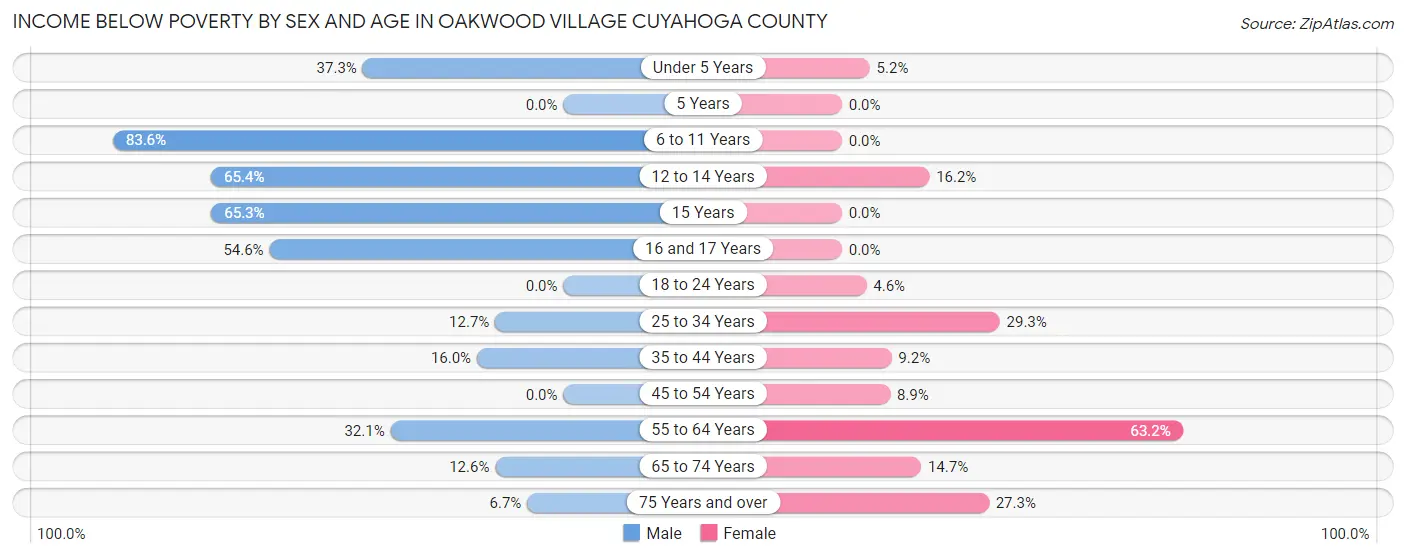
| Age Bracket | Male | Female |
| Under 5 Years | 57 (37.2%) | 6 (5.2%) |
| 5 Years | 0 (0.0%) | 0 (0.0%) |
| 6 to 11 Years | 51 (83.6%) | 0 (0.0%) |
| 12 to 14 Years | 17 (65.4%) | 6 (16.2%) |
| 15 Years | 49 (65.3%) | 0 (0.0%) |
| 16 and 17 Years | 30 (54.5%) | 0 (0.0%) |
| 18 to 24 Years | 0 (0.0%) | 5 (4.5%) |
| 25 to 34 Years | 50 (12.7%) | 58 (29.3%) |
| 35 to 44 Years | 17 (16.0%) | 14 (9.2%) |
| 45 to 54 Years | 0 (0.0%) | 11 (8.9%) |
| 55 to 64 Years | 43 (32.1%) | 203 (63.2%) |
| 65 to 74 Years | 45 (12.6%) | 51 (14.7%) |
| 75 Years and over | 10 (6.7%) | 63 (27.3%) |
| Total | 369 (21.1%) | 417 (24.9%) |
Income Above Poverty by Sex and Age in Oakwood village Cuyahoga County
According to the poverty statistics in Oakwood village Cuyahoga County, males aged 5 years and females aged 6 to 11 years are the age groups that are most secure financially, with 100.0% of males and 100.0% of females in these age groups living above the poverty line.
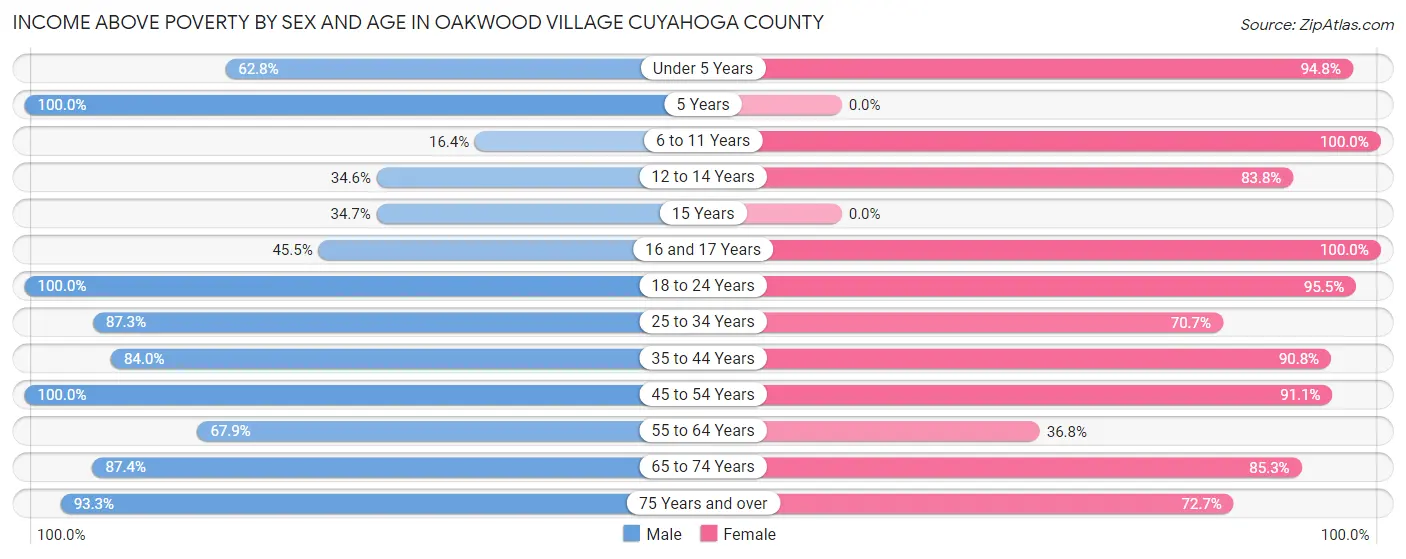
| Age Bracket | Male | Female |
| Under 5 Years | 96 (62.7%) | 110 (94.8%) |
| 5 Years | 44 (100.0%) | 0 (0.0%) |
| 6 to 11 Years | 10 (16.4%) | 9 (100.0%) |
| 12 to 14 Years | 9 (34.6%) | 31 (83.8%) |
| 15 Years | 26 (34.7%) | 0 (0.0%) |
| 16 and 17 Years | 25 (45.5%) | 28 (100.0%) |
| 18 to 24 Years | 97 (100.0%) | 105 (95.5%) |
| 25 to 34 Years | 345 (87.3%) | 140 (70.7%) |
| 35 to 44 Years | 89 (84.0%) | 138 (90.8%) |
| 45 to 54 Years | 94 (100.0%) | 112 (91.1%) |
| 55 to 64 Years | 91 (67.9%) | 118 (36.8%) |
| 65 to 74 Years | 311 (87.4%) | 296 (85.3%) |
| 75 Years and over | 139 (93.3%) | 168 (72.7%) |
| Total | 1,376 (78.8%) | 1,255 (75.1%) |
Income Below Poverty Among Married-Couple Families in Oakwood village Cuyahoga County
The poverty statistics for married-couple families in Oakwood village Cuyahoga County show that 6.2% or 33 of the total 536 families live below the poverty line. Families with 5 or more children have the highest poverty rate of 100.0%, comprising of 16 families. On the other hand, families with 1 or 2 children have the lowest poverty rate of 0.0%, which includes 0 families.
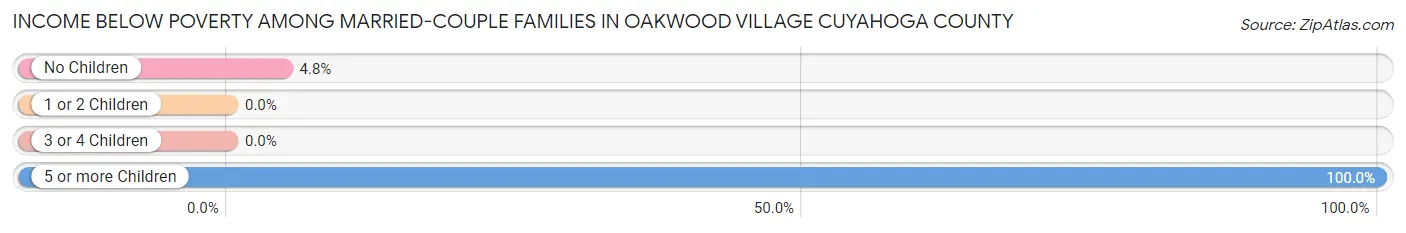
| Children | Above Poverty | Below Poverty |
| No Children | 341 (95.3%) | 17 (4.8%) |
| 1 or 2 Children | 128 (100.0%) | 0 (0.0%) |
| 3 or 4 Children | 34 (100.0%) | 0 (0.0%) |
| 5 or more Children | 0 (0.0%) | 16 (100.0%) |
| Total | 503 (93.8%) | 33 (6.2%) |
Income Below Poverty Among Single-Parent Households in Oakwood village Cuyahoga County
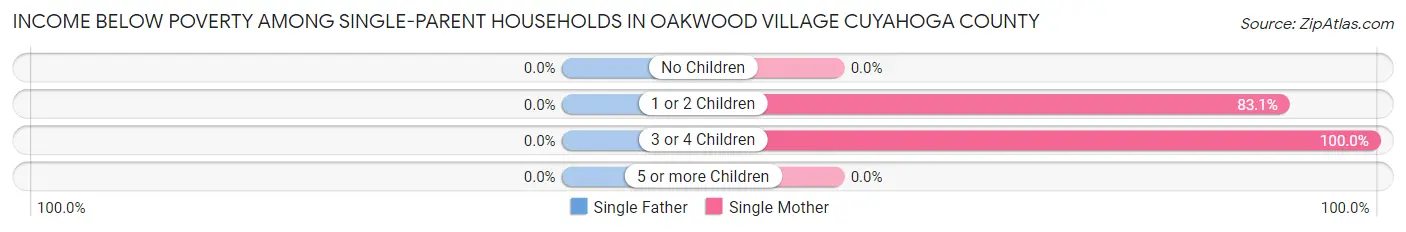
| Children | Single Father | Single Mother |
| No Children | 0 (0.0%) | 0 (0.0%) |
| 1 or 2 Children | 0 (0.0%) | 49 (83.1%) |
| 3 or 4 Children | 0 (0.0%) | 6 (100.0%) |
| 5 or more Children | 0 (0.0%) | 0 (0.0%) |
| Total | 0 (0.0%) | 55 (31.4%) |
Income Below Poverty Among Married-Couple vs Single-Parent Households in Oakwood village Cuyahoga County
The poverty data for Oakwood village Cuyahoga County shows that 33 of the married-couple family households (6.2%) and 55 of the single-parent households (26.2%) are living below the poverty level. Within the married-couple family households, those with 5 or more children have the highest poverty rate, with 16 households (100.0%) falling below the poverty line. Among the single-parent households, those with 3 or 4 children have the highest poverty rate, with 6 household (100.0%) living below poverty.
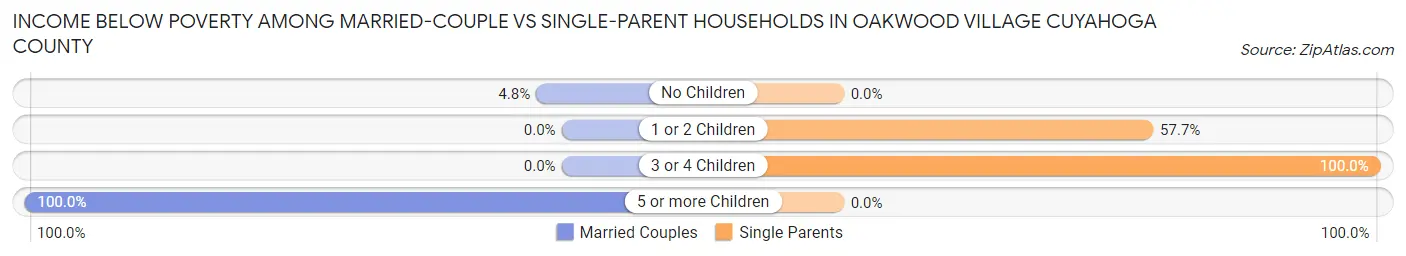
| Children | Married-Couple Families | Single-Parent Households |
| No Children | 17 (4.8%) | 0 (0.0%) |
| 1 or 2 Children | 0 (0.0%) | 49 (57.7%) |
| 3 or 4 Children | 0 (0.0%) | 6 (100.0%) |
| 5 or more Children | 16 (100.0%) | 0 (0.0%) |
| Total | 33 (6.2%) | 55 (26.2%) |
Race in Oakwood village Cuyahoga County
The most populous races in Oakwood village Cuyahoga County are White / Caucasian (1,719 | 48.4%), Black / African American (1,499 | 42.2%), and Two or more Races (333 | 9.4%).
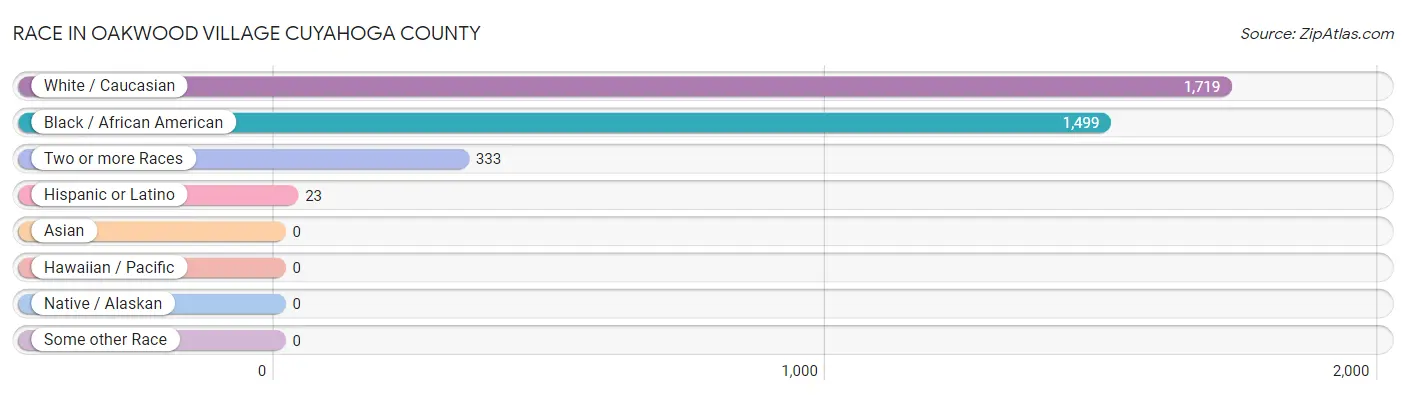
| Race | # Population | % Population |
| Asian | 0 | 0.0% |
| Black / African American | 1,499 | 42.2% |
| Hawaiian / Pacific | 0 | 0.0% |
| Hispanic or Latino | 23 | 0.6% |
| Native / Alaskan | 0 | 0.0% |
| White / Caucasian | 1,719 | 48.4% |
| Two or more Races | 333 | 9.4% |
| Some other Race | 0 | 0.0% |
| Total | 3,551 | 100.0% |
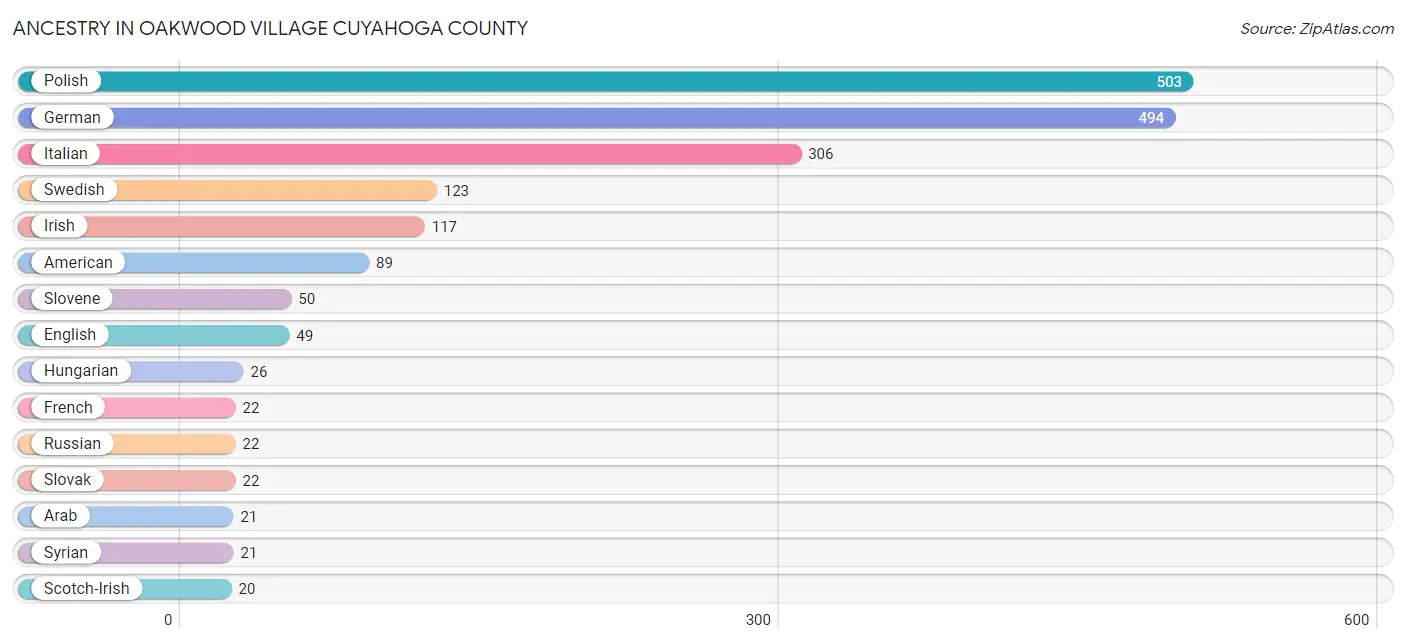
Ancestry in Oakwood village Cuyahoga County
The most populous ancestries reported in Oakwood village Cuyahoga County are Polish (503 | 14.2%), German (494 | 13.9%), Italian (306 | 8.6%), Swedish (123 | 3.5%), and Irish (117 | 3.3%), together accounting for 43.4% of all Oakwood village Cuyahoga County residents.
| Ancestry | # Population | % Population |
| American | 89 | 2.5% |
| Arab | 21 | 0.6% |
| Belgian | 9 | 0.3% |
| Bermudan | 9 | 0.3% |
| British | 13 | 0.4% |
| Czech | 13 | 0.4% |
| Czechoslovakian | 8 | 0.2% |
| English | 49 | 1.4% |
| European | 9 | 0.3% |
| French | 22 | 0.6% |
| French Canadian | 8 | 0.2% |
| German | 494 | 13.9% |
| Hungarian | 26 | 0.7% |
| Irish | 117 | 3.3% |
| Italian | 306 | 8.6% |
| Mexican | 15 | 0.4% |
| Polish | 503 | 14.2% |
| Romanian | 17 | 0.5% |
| Russian | 22 | 0.6% |
| Scotch-Irish | 20 | 0.6% |
| Scottish | 10 | 0.3% |
| Slovak | 22 | 0.6% |
| Slovene | 50 | 1.4% |
| Spanish | 8 | 0.2% |
| Subsaharan African | 8 | 0.2% |
| Swedish | 123 | 3.5% |
| Swiss | 9 | 0.3% |
| Syrian | 21 | 0.6% | View All 28 Rows |
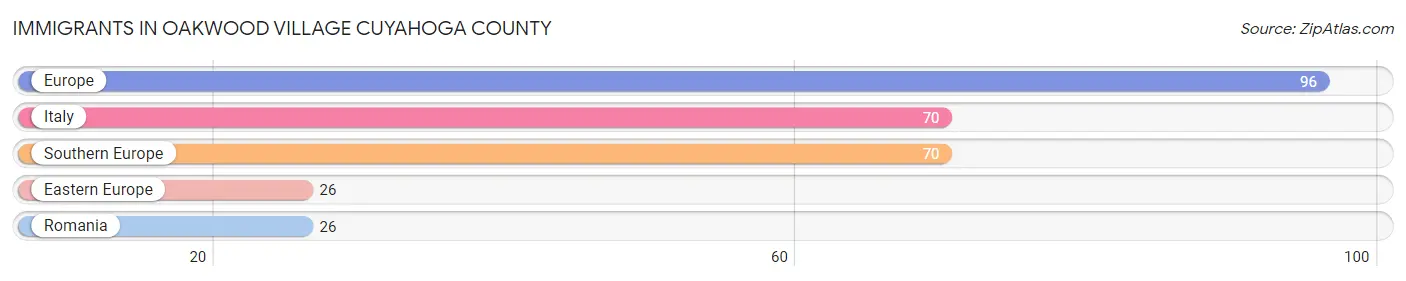
Immigrants in Oakwood village Cuyahoga County
The most numerous immigrant groups reported in Oakwood village Cuyahoga County came from Europe (96 | 2.7%), Italy (70 | 2.0%), Southern Europe (70 | 2.0%), Eastern Europe (26 | 0.7%), and Romania (26 | 0.7%), together accounting for 8.1% of all Oakwood village Cuyahoga County residents.
| Immigration Origin | # Population | % Population |
| Eastern Europe | 26 | 0.7% |
| Europe | 96 | 2.7% |
| Italy | 70 | 2.0% |
| Romania | 26 | 0.7% |
| Southern Europe | 70 | 2.0% | View All 5 Rows |
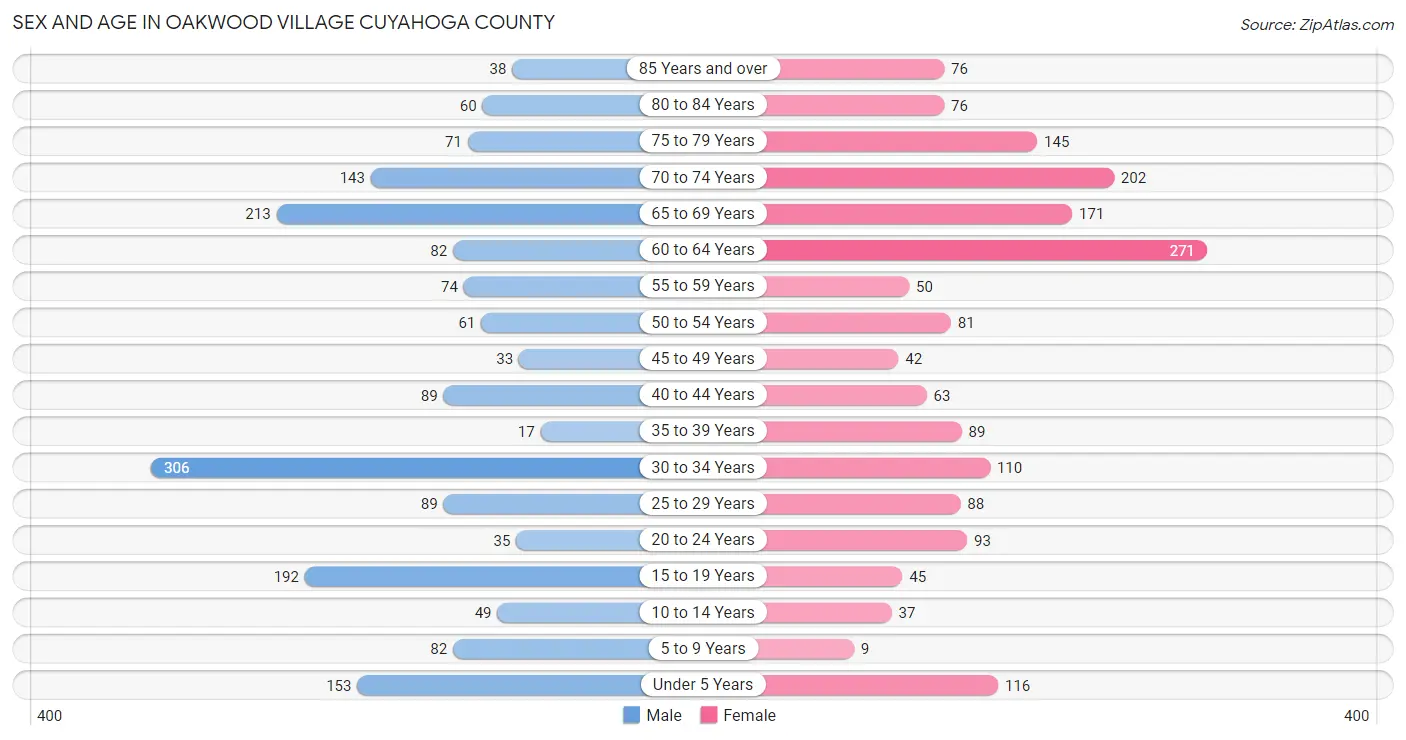
Sex and Age in Oakwood village Cuyahoga County
Sex and Age in Oakwood village Cuyahoga County
The most populous age groups in Oakwood village Cuyahoga County are 30 to 34 Years (306 | 17.1%) for men and 60 to 64 Years (271 | 15.4%) for women.
| Age Bracket | Male | Female |
| Under 5 Years | 153 (8.6%) | 116 (6.6%) |
| 5 to 9 Years | 82 (4.6%) | 9 (0.5%) |
| 10 to 14 Years | 49 (2.7%) | 37 (2.1%) |
| 15 to 19 Years | 192 (10.7%) | 45 (2.5%) |
| 20 to 24 Years | 35 (2.0%) | 93 (5.3%) |
| 25 to 29 Years | 89 (5.0%) | 88 (5.0%) |
| 30 to 34 Years | 306 (17.1%) | 110 (6.2%) |
| 35 to 39 Years | 17 (0.9%) | 89 (5.1%) |
| 40 to 44 Years | 89 (5.0%) | 63 (3.6%) |
| 45 to 49 Years | 33 (1.8%) | 42 (2.4%) |
| 50 to 54 Years | 61 (3.4%) | 81 (4.6%) |
| 55 to 59 Years | 74 (4.1%) | 50 (2.8%) |
| 60 to 64 Years | 82 (4.6%) | 271 (15.4%) |
| 65 to 69 Years | 213 (11.9%) | 171 (9.7%) |
| 70 to 74 Years | 143 (8.0%) | 202 (11.5%) |
| 75 to 79 Years | 71 (4.0%) | 145 (8.2%) |
| 80 to 84 Years | 60 (3.4%) | 76 (4.3%) |
| 85 Years and over | 38 (2.1%) | 76 (4.3%) |
| Total | 1,787 (100.0%) | 1,764 (100.0%) |
Families and Households in Oakwood village Cuyahoga County
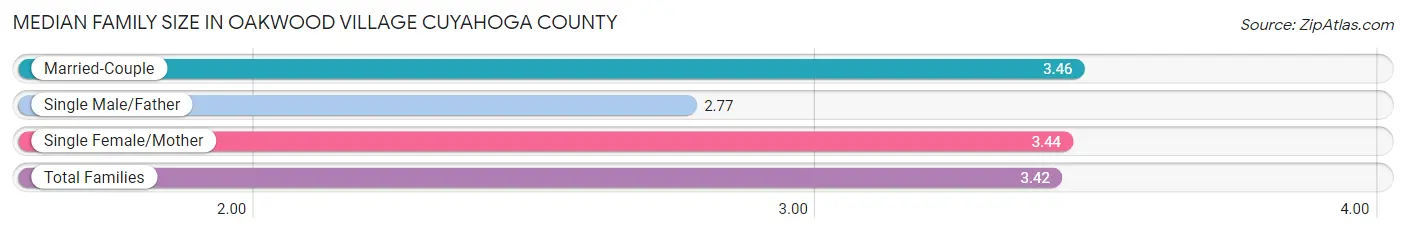
Median Family Size in Oakwood village Cuyahoga County
The median family size in Oakwood village Cuyahoga County is 3.42 persons per family, with married-couple families (536 | 71.9%) accounting for the largest median family size of 3.46 persons per family. On the other hand, single male/father families (35 | 4.7%) represent the smallest median family size with 2.77 persons per family.
| Family Type | # Families | Family Size |
| Married-Couple | 536 (71.9%) | 3.46 |
| Single Male/Father | 35 (4.7%) | 2.77 |
| Single Female/Mother | 175 (23.5%) | 3.44 |
| Total Families | 746 (100.0%) | 3.42 |
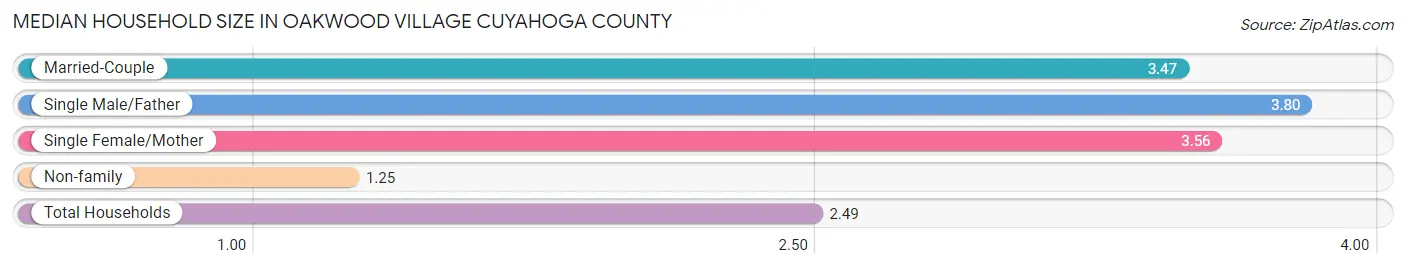
Median Household Size in Oakwood village Cuyahoga County
The median household size in Oakwood village Cuyahoga County is 2.49 persons per household, with single male/father households (35 | 2.6%) accounting for the largest median household size of 3.8 persons per household. non-family households (615 | 45.2%) represent the smallest median household size with 1.25 persons per household.
| Household Type | # Households | Household Size |
| Married-Couple | 536 (39.4%) | 3.47 |
| Single Male/Father | 35 (2.6%) | 3.80 |
| Single Female/Mother | 175 (12.9%) | 3.56 |
| Non-family | 615 (45.2%) | 1.25 |
| Total Households | 1,361 (100.0%) | 2.49 |
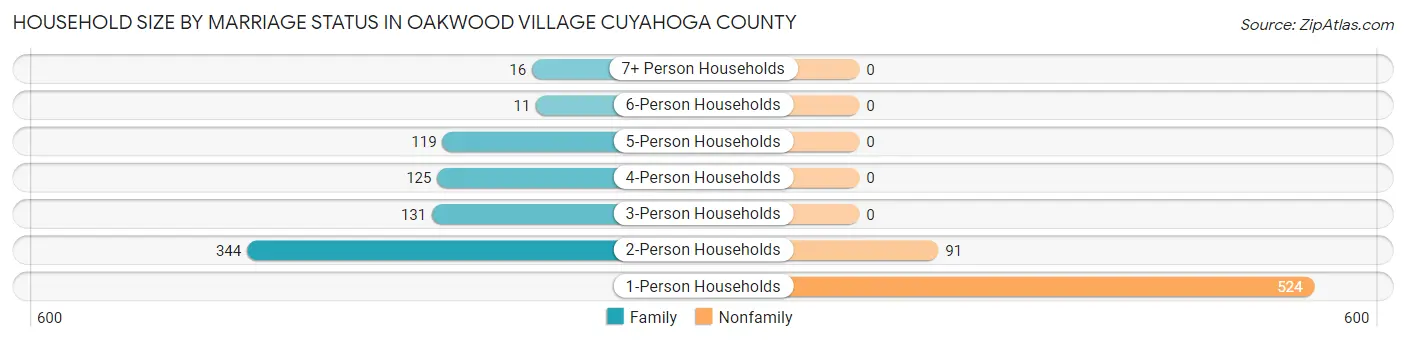
Household Size by Marriage Status in Oakwood village Cuyahoga County
Out of a total of 1,361 households in Oakwood village Cuyahoga County, 746 (54.8%) are family households, while 615 (45.2%) are nonfamily households. The most numerous type of family households are 2-person households, comprising 344, and the most common type of nonfamily households are 1-person households, comprising 524.
| Household Size | Family Households | Nonfamily Households |
| 1-Person Households | - | 524 (38.5%) |
| 2-Person Households | 344 (25.3%) | 91 (6.7%) |
| 3-Person Households | 131 (9.6%) | 0 (0.0%) |
| 4-Person Households | 125 (9.2%) | 0 (0.0%) |
| 5-Person Households | 119 (8.7%) | 0 (0.0%) |
| 6-Person Households | 11 (0.8%) | 0 (0.0%) |
| 7+ Person Households | 16 (1.2%) | 0 (0.0%) |
| Total | 746 (54.8%) | 615 (45.2%) |
Female Fertility in Oakwood village Cuyahoga County
Fertility by Age in Oakwood village Cuyahoga County
Average fertility rate in Oakwood village Cuyahoga County is 81.0 births per 1,000 women. Women in the age bracket of 15 to 19 years have the highest fertility rate with 267.0 births per 1,000 women. Women in the age bracket of 20 to 34 years acount for 72.1% of all women with births.
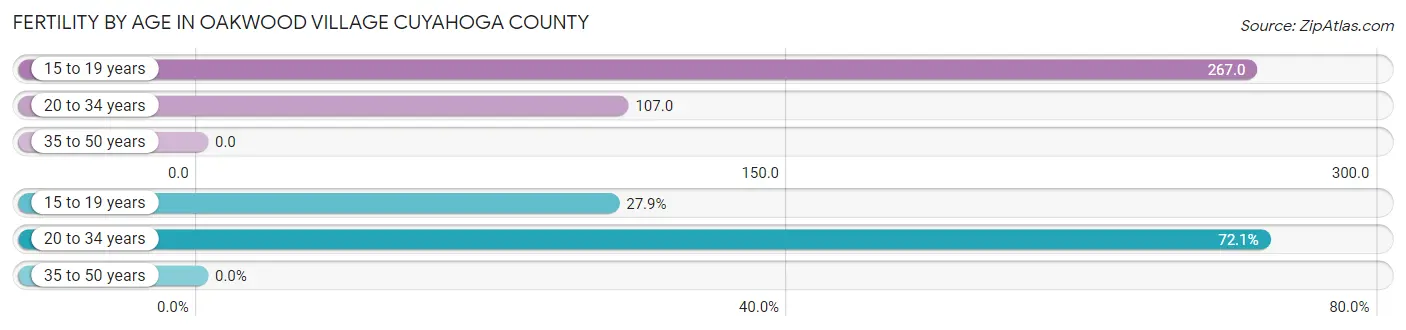
| Age Bracket | Women with Births | Births / 1,000 Women |
| 15 to 19 years | 12 (27.9%) | 267.0 |
| 20 to 34 years | 31 (72.1%) | 107.0 |
| 35 to 50 years | 0 (0.0%) | 0.0 |
| Total | 43 (100.0%) | 81.0 |
Fertility by Age by Marriage Status in Oakwood village Cuyahoga County
72.1% of women with births (43) in Oakwood village Cuyahoga County are married. The highest percentage of unmarried women with births falls into 15 to 19 years age bracket with 100.0% of them unmarried at the time of birth, while the lowest percentage of unmarried women with births belong to 20 to 34 years age bracket with 0.0% of them unmarried.
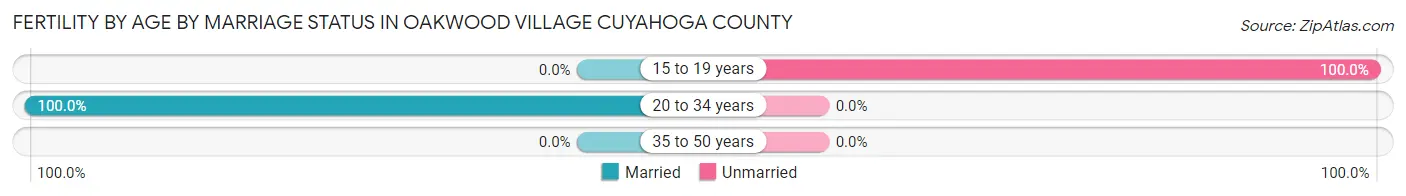
| Age Bracket | Married | Unmarried |
| 15 to 19 years | 0 (0.0%) | 12 (100.0%) |
| 20 to 34 years | 31 (100.0%) | 0 (0.0%) |
| 35 to 50 years | 0 (0.0%) | 0 (0.0%) |
| Total | 31 (72.1%) | 12 (27.9%) |
Fertility by Education in Oakwood village Cuyahoga County
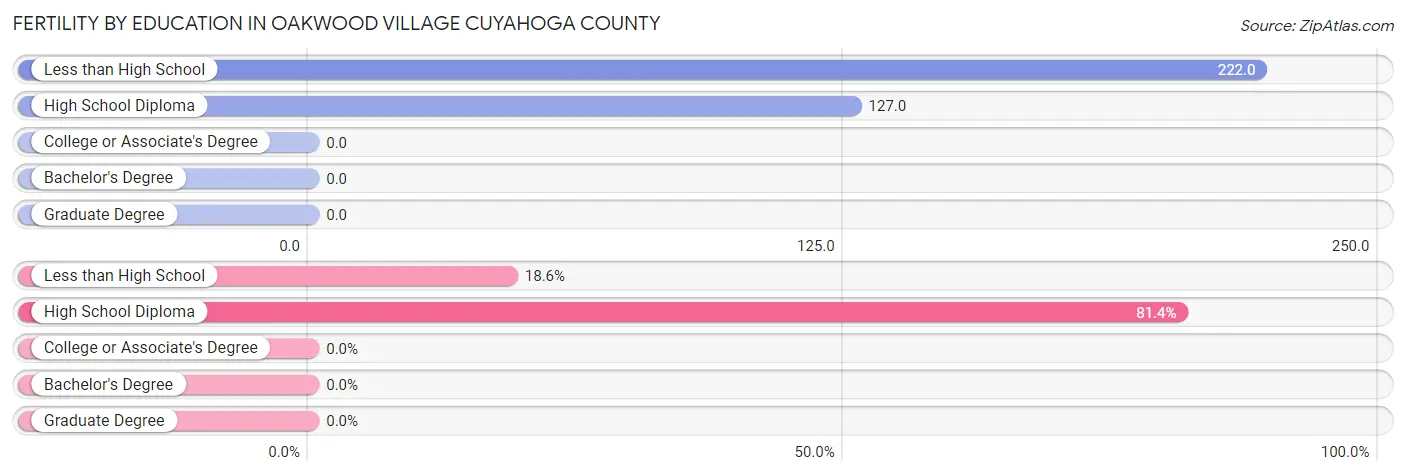
| Educational Attainment | Women with Births | Births / 1,000 Women |
| Less than High School | 8 (18.6%) | 222.0 |
| High School Diploma | 35 (81.4%) | 127.0 |
| College or Associate's Degree | 0 (0.0%) | 0.0 |
| Bachelor's Degree | 0 (0.0%) | 0.0 |
| Graduate Degree | 0 (0.0%) | 0.0 |
| Total | 43 (100.0%) | 81.0 |
Fertility by Education by Marriage Status in Oakwood village Cuyahoga County
27.9% of women with births in Oakwood village Cuyahoga County are unmarried. Women with the educational attainment of less than high school are most likely to be married with 100.0% of them married at childbirth, while women with the educational attainment of high school diploma are least likely to be married with 34.3% of them unmarried at childbirth.
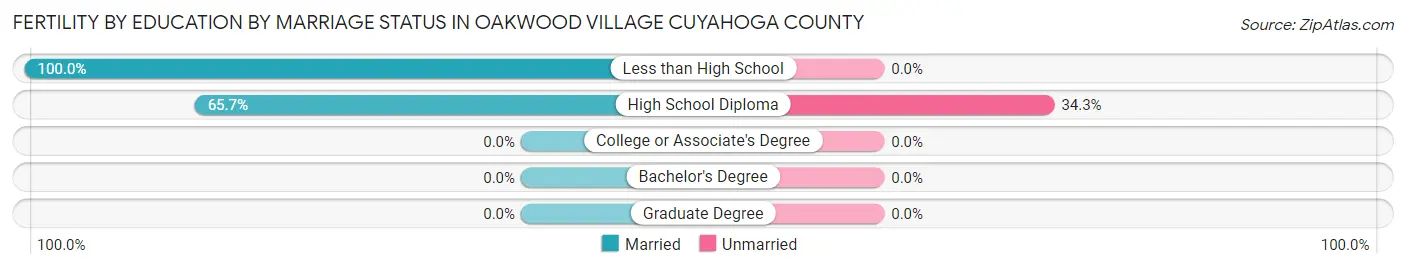
| Educational Attainment | Married | Unmarried |
| Less than High School | 8 (100.0%) | 0 (0.0%) |
| High School Diploma | 23 (65.7%) | 12 (34.3%) |
| College or Associate's Degree | 0 (0.0%) | 0 (0.0%) |
| Bachelor's Degree | 0 (0.0%) | 0 (0.0%) |
| Graduate Degree | 0 (0.0%) | 0 (0.0%) |
| Total | 31 (72.1%) | 12 (27.9%) |
Employment Characteristics in Oakwood village Cuyahoga County
Employment by Class of Employer in Oakwood village Cuyahoga County
Among the 1,395 employed individuals in Oakwood village Cuyahoga County, private company employees (1,022 | 73.3%), local government employees (141 | 10.1%), and not-for-profit organizations (81 | 5.8%) make up the most common classes of employment.
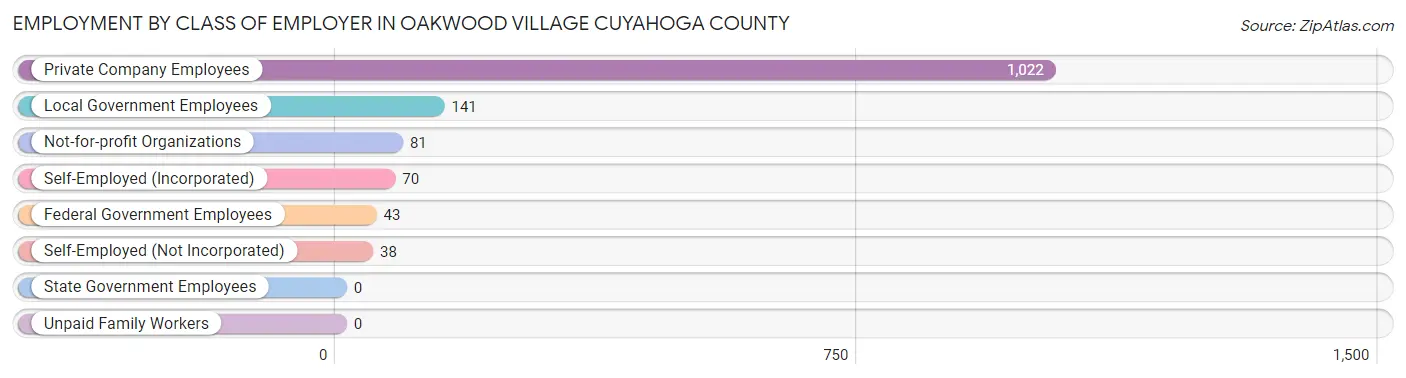
| Employer Class | # Employees | % Employees |
| Private Company Employees | 1,022 | 73.3% |
| Self-Employed (Incorporated) | 70 | 5.0% |
| Self-Employed (Not Incorporated) | 38 | 2.7% |
| Not-for-profit Organizations | 81 | 5.8% |
| Local Government Employees | 141 | 10.1% |
| State Government Employees | 0 | 0.0% |
| Federal Government Employees | 43 | 3.1% |
| Unpaid Family Workers | 0 | 0.0% |
| Total | 1,395 | 100.0% |
Employment Status by Age in Oakwood village Cuyahoga County
According to the labor force statistics for Oakwood village Cuyahoga County, out of the total population over 16 years of age (3,030), 50.3% or 1,524 individuals are in the labor force, with 5.2% or 79 of them unemployed. The age group with the highest labor force participation rate is 25 to 29 years, with 97.7% or 173 individuals in the labor force. Within the labor force, the 16 to 19 years age range has the highest percentage of unemployed individuals, with 23.3% or 30 of them being unemployed.
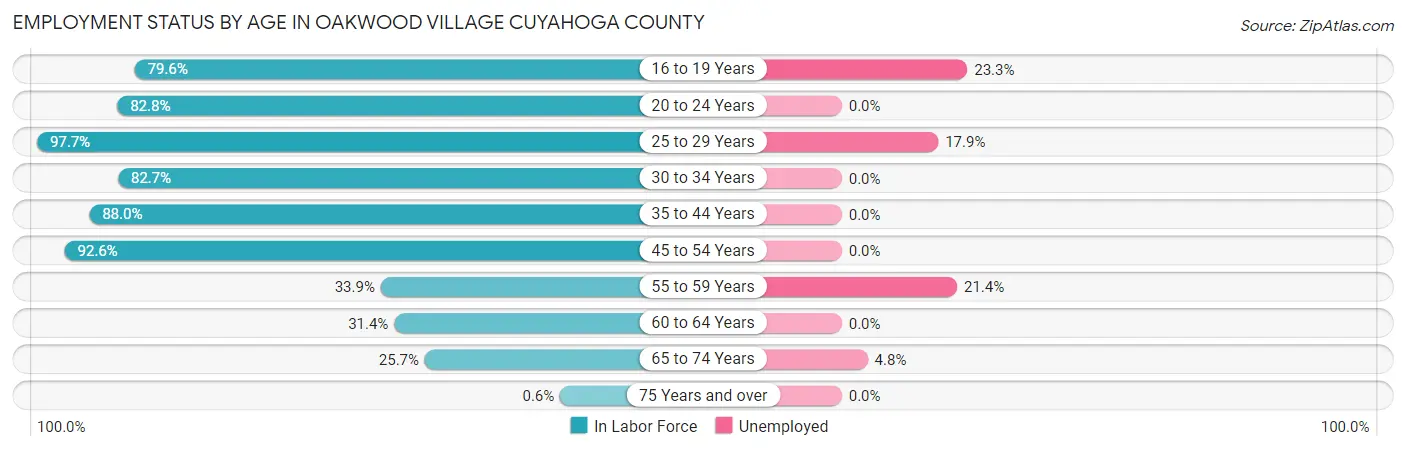
| Age Bracket | In Labor Force | Unemployed |
| 16 to 19 Years | 129 (79.6%) | 30 (23.3%) |
| 20 to 24 Years | 106 (82.8%) | 0 (0.0%) |
| 25 to 29 Years | 173 (97.7%) | 31 (17.9%) |
| 30 to 34 Years | 344 (82.7%) | 0 (0.0%) |
| 35 to 44 Years | 227 (88.0%) | 0 (0.0%) |
| 45 to 54 Years | 201 (92.6%) | 0 (0.0%) |
| 55 to 59 Years | 42 (33.9%) | 9 (21.4%) |
| 60 to 64 Years | 111 (31.4%) | 0 (0.0%) |
| 65 to 74 Years | 187 (25.7%) | 9 (4.8%) |
| 75 Years and over | 3 (0.6%) | 0 (0.0%) |
| Total | 1,524 (50.3%) | 79 (5.2%) |
Employment Status by Educational Attainment in Oakwood village Cuyahoga County
According to labor force statistics for Oakwood village Cuyahoga County, 71.1% of individuals (1,098) out of the total population between 25 and 64 years of age (1,545) are in the labor force, with 3.6% or 40 of them being unemployed. The group with the highest labor force participation rate are those with the educational attainment of bachelor's degree or higher, with 81.0% or 289 individuals in the labor force. Within the labor force, individuals with less than high school education have the highest percentage of unemployment, with 23.9% or 16 of them being unemployed.
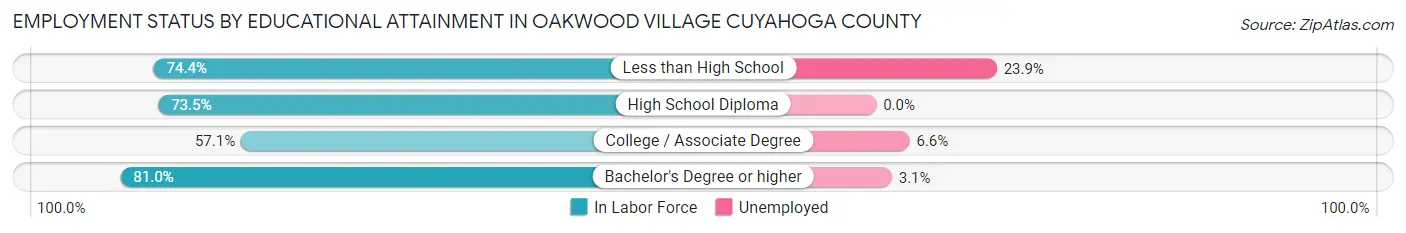
| Educational Attainment | In Labor Force | Unemployed |
| Less than High School | 67 (74.4%) | 22 (23.9%) |
| High School Diploma | 514 (73.5%) | 0 (0.0%) |
| College / Associate Degree | 228 (57.1%) | 26 (6.6%) |
| Bachelor's Degree or higher | 289 (81.0%) | 11 (3.1%) |
| Total | 1,098 (71.1%) | 56 (3.6%) |
Employment Occupations by Sex in Oakwood village Cuyahoga County
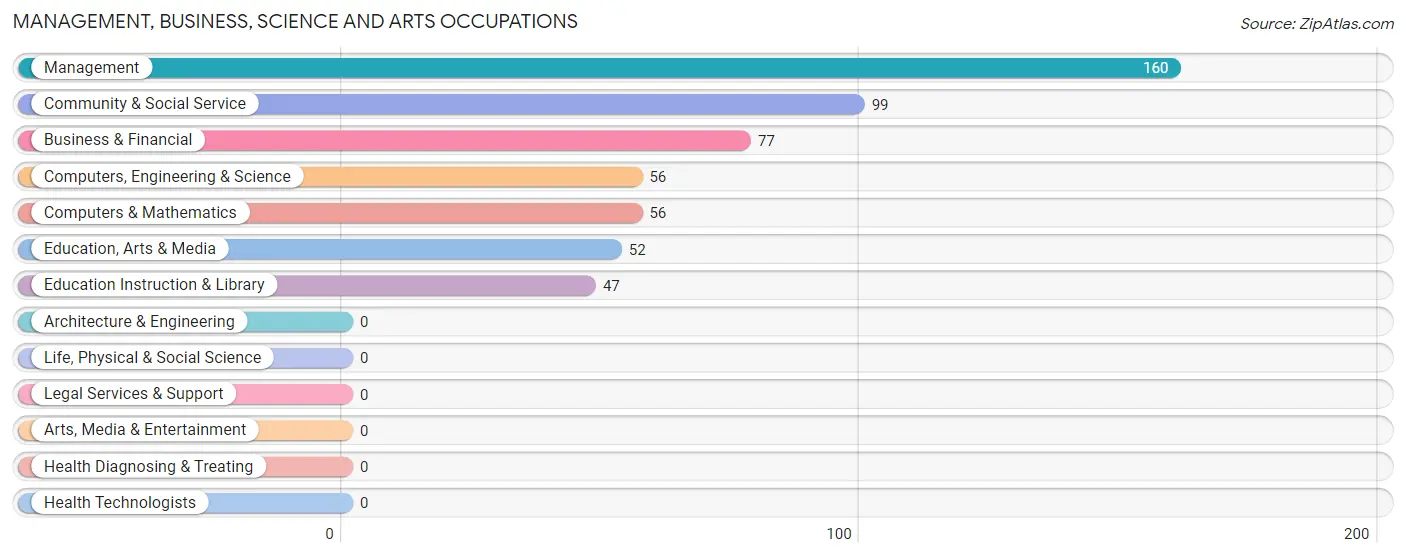
Management, Business, Science and Arts Occupations
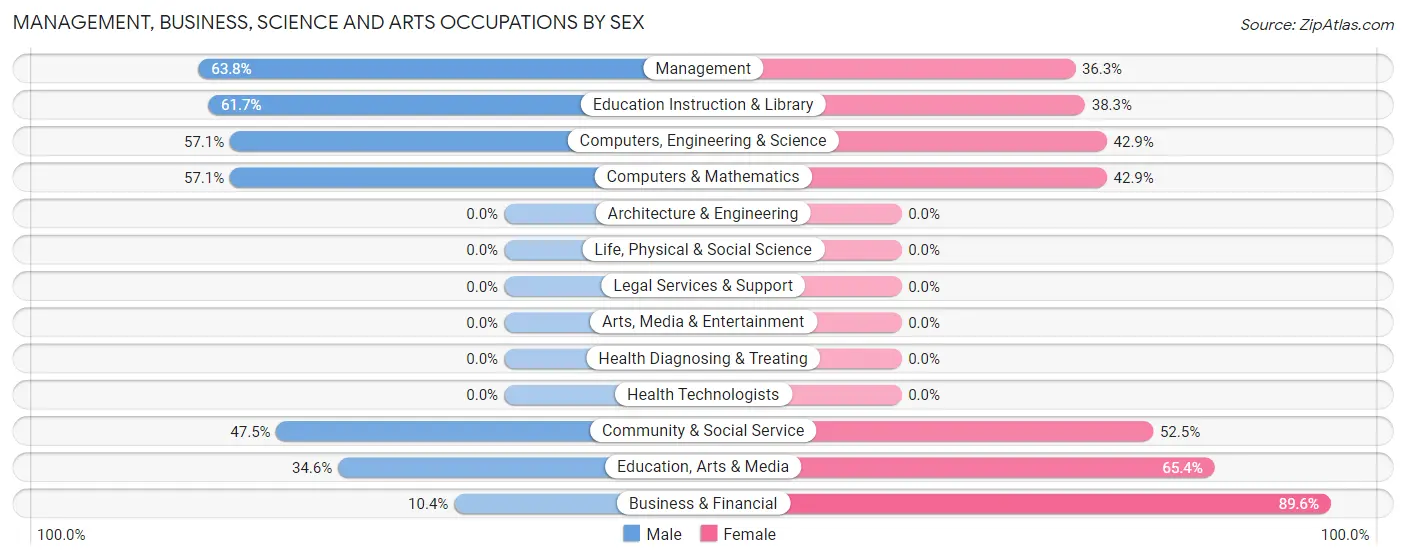
The most common Management, Business, Science and Arts occupations in Oakwood village Cuyahoga County are Management (160 | 11.1%), Community & Social Service (99 | 6.9%), Business & Financial (77 | 5.3%), Computers, Engineering & Science (56 | 3.9%), and Computers & Mathematics (56 | 3.9%).
Management, Business, Science and Arts Occupations by Sex
Within the Management, Business, Science and Arts occupations in Oakwood village Cuyahoga County, the most male-oriented occupations are Management (63.7%), Education Instruction & Library (61.7%), and Computers, Engineering & Science (57.1%), while the most female-oriented occupations are Business & Financial (89.6%), Education, Arts & Media (65.4%), and Community & Social Service (52.5%).
| Occupation | Male | Female |
| Management | 102 (63.7%) | 58 (36.2%) |
| Business & Financial | 8 (10.4%) | 69 (89.6%) |
| Computers, Engineering & Science | 32 (57.1%) | 24 (42.9%) |
| Computers & Mathematics | 32 (57.1%) | 24 (42.9%) |
| Architecture & Engineering | 0 (0.0%) | 0 (0.0%) |
| Life, Physical & Social Science | 0 (0.0%) | 0 (0.0%) |
| Community & Social Service | 47 (47.5%) | 52 (52.5%) |
| Education, Arts & Media | 18 (34.6%) | 34 (65.4%) |
| Legal Services & Support | 0 (0.0%) | 0 (0.0%) |
| Education Instruction & Library | 29 (61.7%) | 18 (38.3%) |
| Arts, Media & Entertainment | 0 (0.0%) | 0 (0.0%) |
| Health Diagnosing & Treating | 0 (0.0%) | 0 (0.0%) |
| Health Technologists | 0 (0.0%) | 0 (0.0%) |
| Total (Category) | 189 (48.2%) | 203 (51.8%) |
| Total (Overall) | 809 (56.0%) | 635 (44.0%) |
Services Occupations
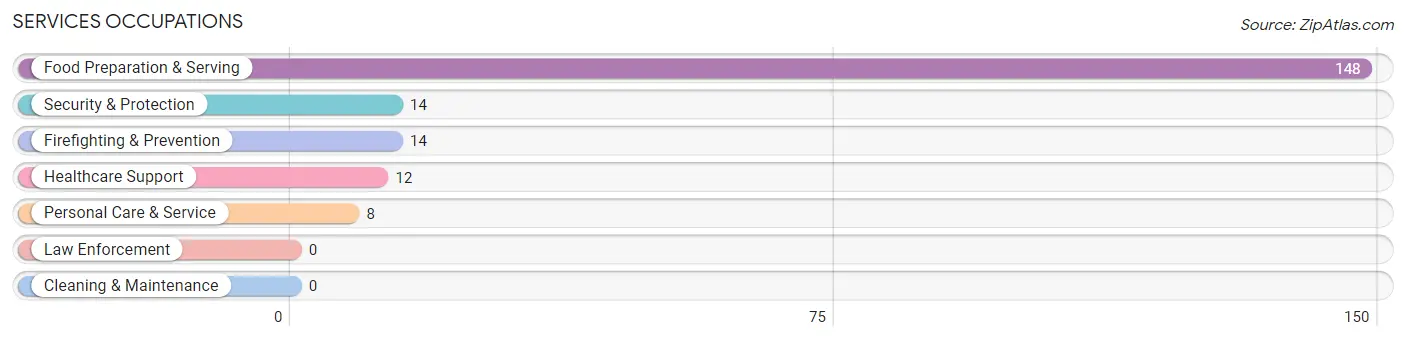
The most common Services occupations in Oakwood village Cuyahoga County are Food Preparation & Serving (148 | 10.2%), Security & Protection (14 | 1.0%), Firefighting & Prevention (14 | 1.0%), Healthcare Support (12 | 0.8%), and Personal Care & Service (8 | 0.5%).
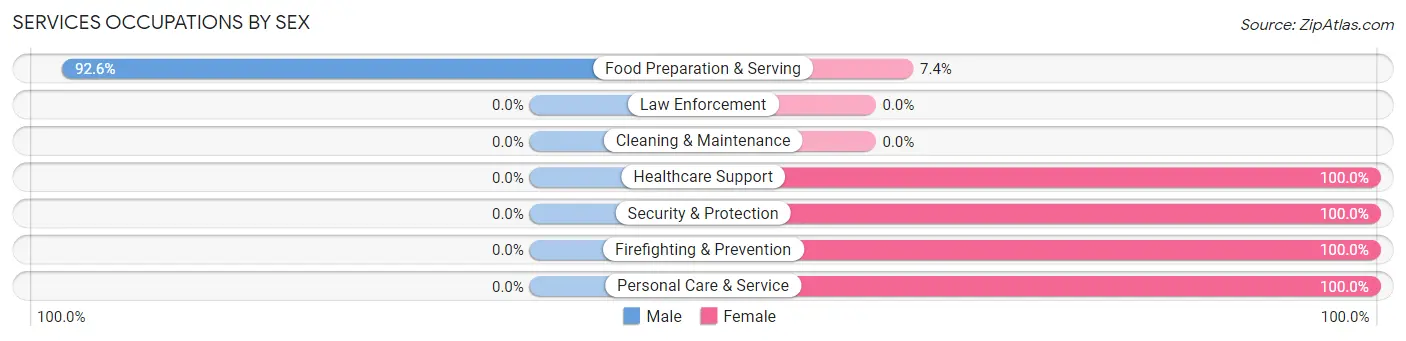
Services Occupations by Sex
| Occupation | Male | Female |
| Healthcare Support | 0 (0.0%) | 12 (100.0%) |
| Security & Protection | 0 (0.0%) | 14 (100.0%) |
| Firefighting & Prevention | 0 (0.0%) | 14 (100.0%) |
| Law Enforcement | 0 (0.0%) | 0 (0.0%) |
| Food Preparation & Serving | 137 (92.6%) | 11 (7.4%) |
| Cleaning & Maintenance | 0 (0.0%) | 0 (0.0%) |
| Personal Care & Service | 0 (0.0%) | 8 (100.0%) |
| Total (Category) | 137 (75.3%) | 45 (24.7%) |
| Total (Overall) | 809 (56.0%) | 635 (44.0%) |
Sales and Office Occupations
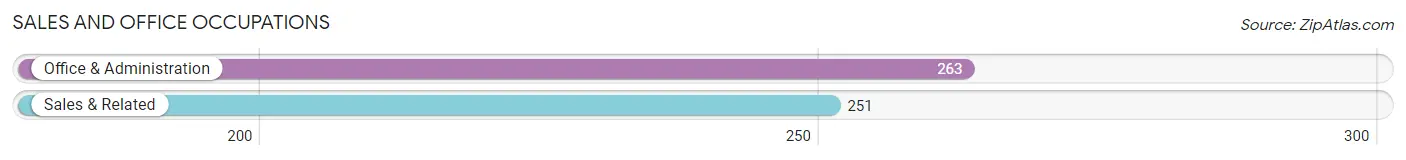
The most common Sales and Office occupations in Oakwood village Cuyahoga County are Office & Administration (263 | 18.2%), and Sales & Related (251 | 17.4%).
Sales and Office Occupations by Sex
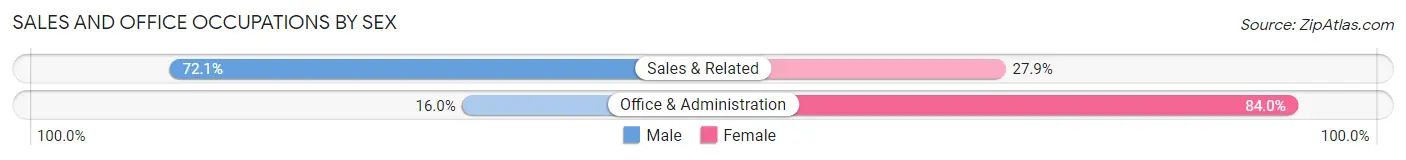
| Occupation | Male | Female |
| Sales & Related | 181 (72.1%) | 70 (27.9%) |
| Office & Administration | 42 (16.0%) | 221 (84.0%) |
| Total (Category) | 223 (43.4%) | 291 (56.6%) |
| Total (Overall) | 809 (56.0%) | 635 (44.0%) |
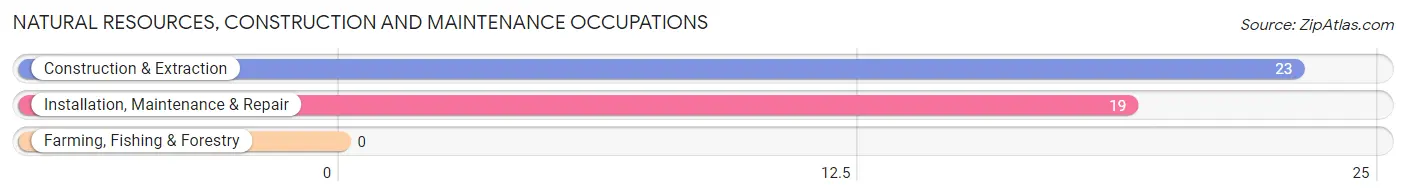
Natural Resources, Construction and Maintenance Occupations
The most common Natural Resources, Construction and Maintenance occupations in Oakwood village Cuyahoga County are Construction & Extraction (23 | 1.6%), and Installation, Maintenance & Repair (19 | 1.3%).
Natural Resources, Construction and Maintenance Occupations by Sex
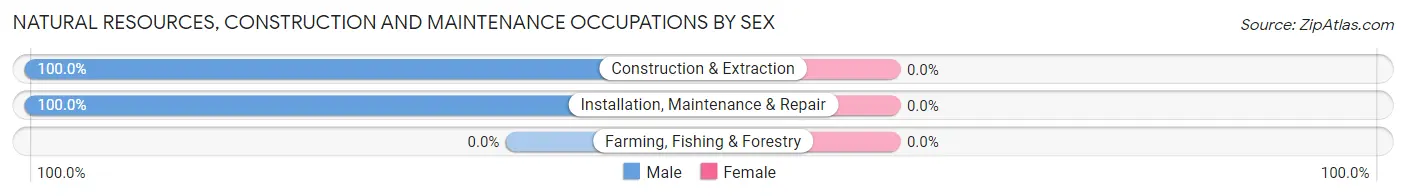
| Occupation | Male | Female |
| Farming, Fishing & Forestry | 0 (0.0%) | 0 (0.0%) |
| Construction & Extraction | 23 (100.0%) | 0 (0.0%) |
| Installation, Maintenance & Repair | 19 (100.0%) | 0 (0.0%) |
| Total (Category) | 42 (100.0%) | 0 (0.0%) |
| Total (Overall) | 809 (56.0%) | 635 (44.0%) |
Production, Transportation and Moving Occupations
The most common Production, Transportation and Moving occupations in Oakwood village Cuyahoga County are Transportation (108 | 7.5%), Material Moving (104 | 7.2%), and Production (102 | 7.1%).
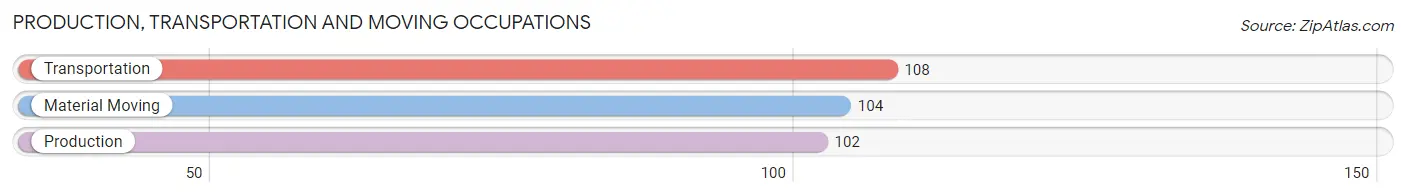
Production, Transportation and Moving Occupations by Sex
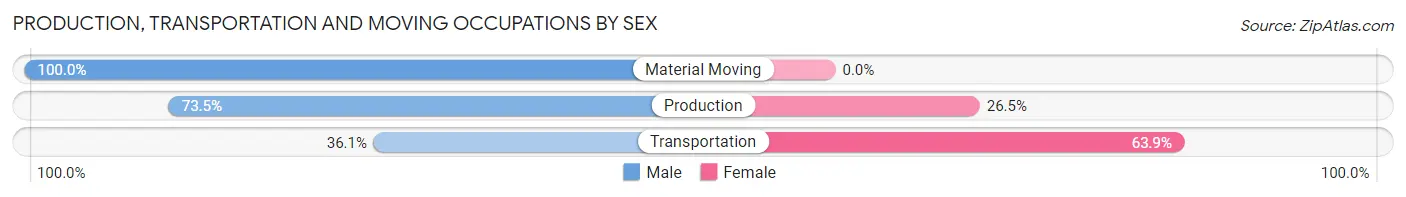
| Occupation | Male | Female |
| Production | 75 (73.5%) | 27 (26.5%) |
| Transportation | 39 (36.1%) | 69 (63.9%) |
| Material Moving | 104 (100.0%) | 0 (0.0%) |
| Total (Category) | 218 (69.4%) | 96 (30.6%) |
| Total (Overall) | 809 (56.0%) | 635 (44.0%) |
Employment Industries by Sex in Oakwood village Cuyahoga County
Employment Industries in Oakwood village Cuyahoga County
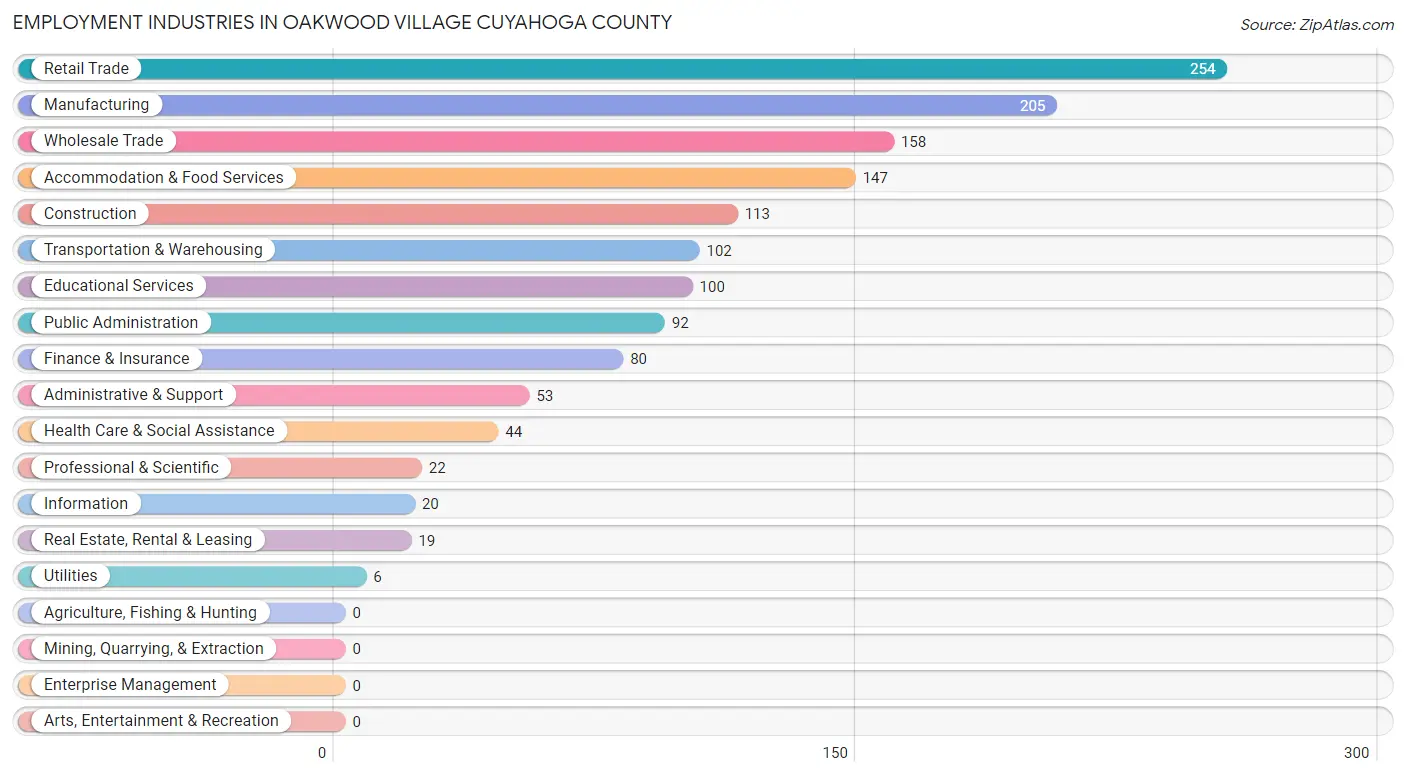
The major employment industries in Oakwood village Cuyahoga County include Retail Trade (254 | 17.6%), Manufacturing (205 | 14.2%), Wholesale Trade (158 | 10.9%), Accommodation & Food Services (147 | 10.2%), and Construction (113 | 7.8%).
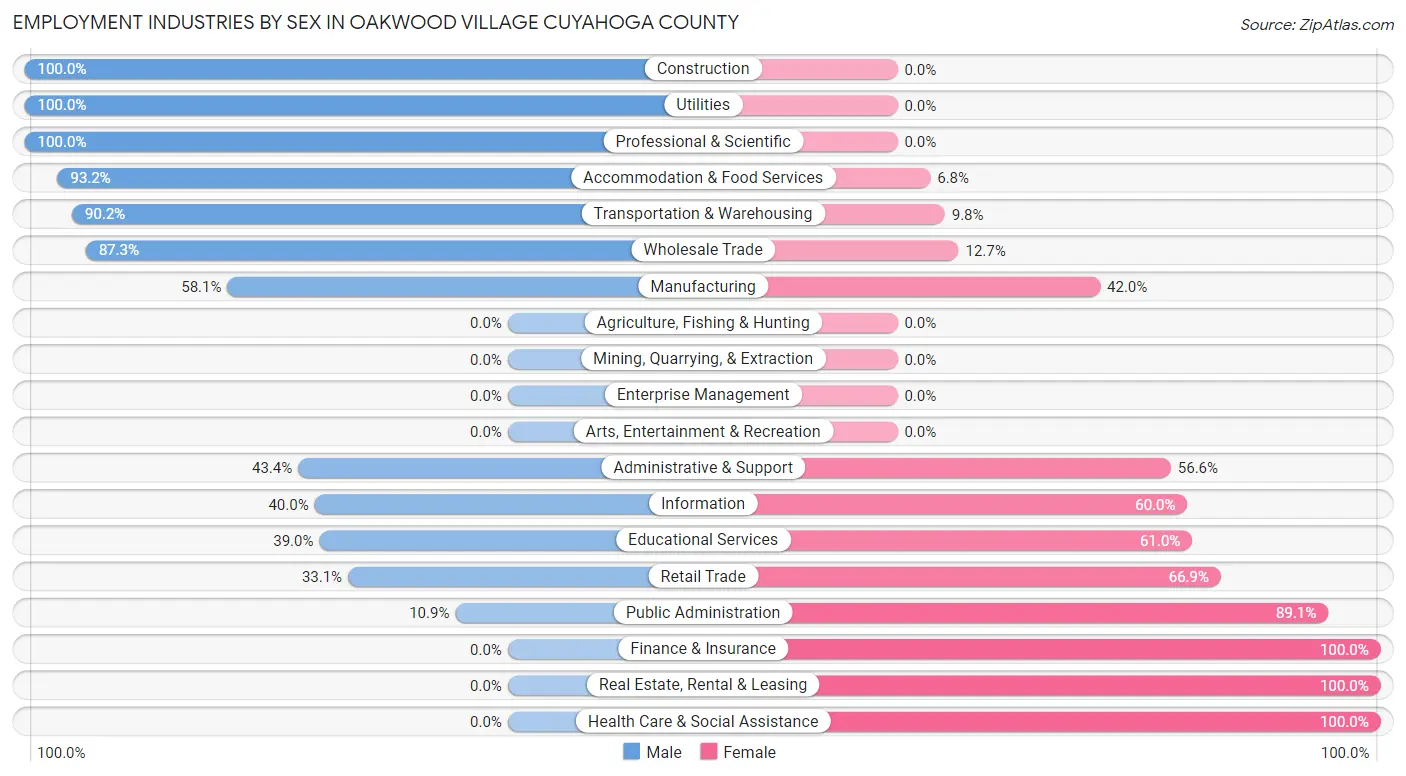
Employment Industries by Sex in Oakwood village Cuyahoga County
The Oakwood village Cuyahoga County industries that see more men than women are Construction (100.0%), Utilities (100.0%), and Professional & Scientific (100.0%), whereas the industries that tend to have a higher number of women are Finance & Insurance (100.0%), Real Estate, Rental & Leasing (100.0%), and Health Care & Social Assistance (100.0%).
| Industry | Male | Female |
| Agriculture, Fishing & Hunting | 0 (0.0%) | 0 (0.0%) |
| Mining, Quarrying, & Extraction | 0 (0.0%) | 0 (0.0%) |
| Construction | 113 (100.0%) | 0 (0.0%) |
| Manufacturing | 119 (58.1%) | 86 (41.9%) |
| Wholesale Trade | 138 (87.3%) | 20 (12.7%) |
| Retail Trade | 84 (33.1%) | 170 (66.9%) |
| Transportation & Warehousing | 92 (90.2%) | 10 (9.8%) |
| Utilities | 6 (100.0%) | 0 (0.0%) |
| Information | 8 (40.0%) | 12 (60.0%) |
| Finance & Insurance | 0 (0.0%) | 80 (100.0%) |
| Real Estate, Rental & Leasing | 0 (0.0%) | 19 (100.0%) |
| Professional & Scientific | 22 (100.0%) | 0 (0.0%) |
| Enterprise Management | 0 (0.0%) | 0 (0.0%) |
| Administrative & Support | 23 (43.4%) | 30 (56.6%) |
| Educational Services | 39 (39.0%) | 61 (61.0%) |
| Health Care & Social Assistance | 0 (0.0%) | 44 (100.0%) |
| Arts, Entertainment & Recreation | 0 (0.0%) | 0 (0.0%) |
| Accommodation & Food Services | 137 (93.2%) | 10 (6.8%) |
| Public Administration | 10 (10.9%) | 82 (89.1%) |
| Total | 809 (56.0%) | 635 (44.0%) |
Education in Oakwood village Cuyahoga County
School Enrollment in Oakwood village Cuyahoga County
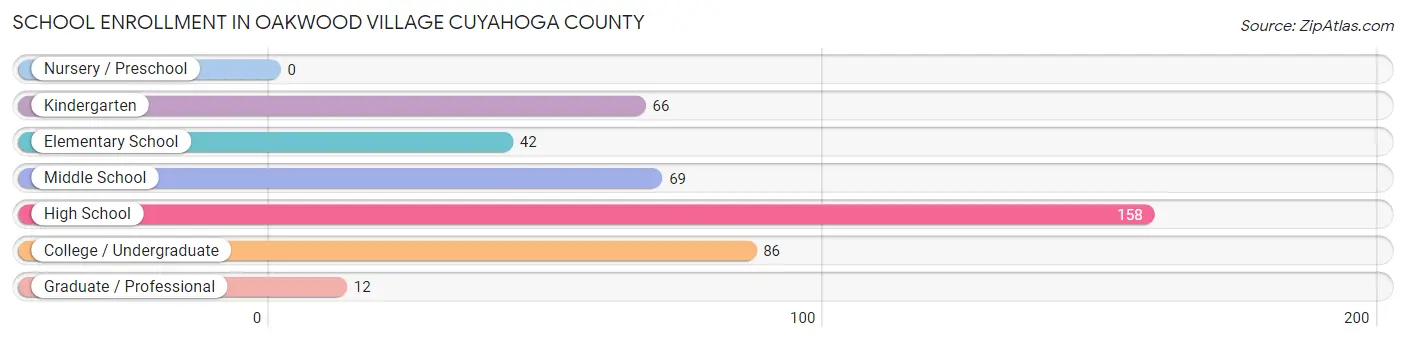
The most common levels of schooling among the 433 students in Oakwood village Cuyahoga County are high school (158 | 36.5%), college / undergraduate (86 | 19.9%), and middle school (69 | 15.9%).
| School Level | # Students | % Students |
| Nursery / Preschool | 0 | 0.0% |
| Kindergarten | 66 | 15.2% |
| Elementary School | 42 | 9.7% |
| Middle School | 69 | 15.9% |
| High School | 158 | 36.5% |
| College / Undergraduate | 86 | 19.9% |
| Graduate / Professional | 12 | 2.8% |
| Total | 433 | 100.0% |
School Enrollment by Age by Funding Source in Oakwood village Cuyahoga County
Out of a total of 433 students who are enrolled in schools in Oakwood village Cuyahoga County, 158 (36.5%) attend a private institution, while the remaining 275 (63.5%) are enrolled in public schools. The age group of 18 to 19 year olds has the highest likelihood of being enrolled in private schools, with 5 (100.0% in the age bracket) enrolled. Conversely, the age group of 35 years and over has the lowest likelihood of being enrolled in a private school, with 45 (100.0% in the age bracket) attending a public institution.
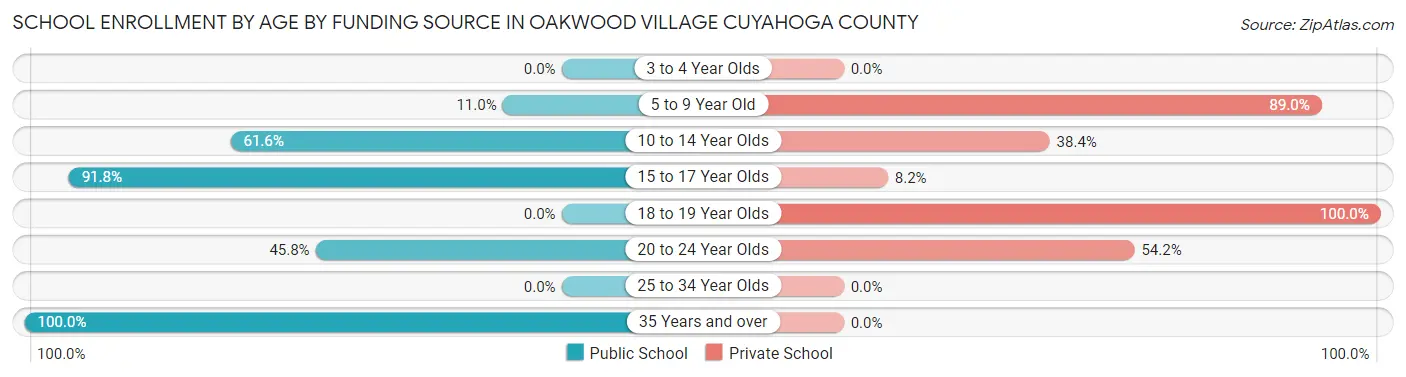
| Age Bracket | Public School | Private School |
| 3 to 4 Year Olds | 0 (0.0%) | 0 (0.0%) |
| 5 to 9 Year Old | 10 (11.0%) | 81 (89.0%) |
| 10 to 14 Year Olds | 53 (61.6%) | 33 (38.4%) |
| 15 to 17 Year Olds | 145 (91.8%) | 13 (8.2%) |
| 18 to 19 Year Olds | 0 (0.0%) | 5 (100.0%) |
| 20 to 24 Year Olds | 22 (45.8%) | 26 (54.2%) |
| 25 to 34 Year Olds | 0 (0.0%) | 0 (0.0%) |
| 35 Years and over | 45 (100.0%) | 0 (0.0%) |
| Total | 275 (63.5%) | 158 (36.5%) |
Educational Attainment by Field of Study in Oakwood village Cuyahoga County
Psychology (131 | 23.9%), business (97 | 17.7%), communications (82 | 14.9%), science & technology (51 | 9.3%), and education (48 | 8.7%) are the most common fields of study among 549 individuals in Oakwood village Cuyahoga County who have obtained a bachelor's degree or higher.
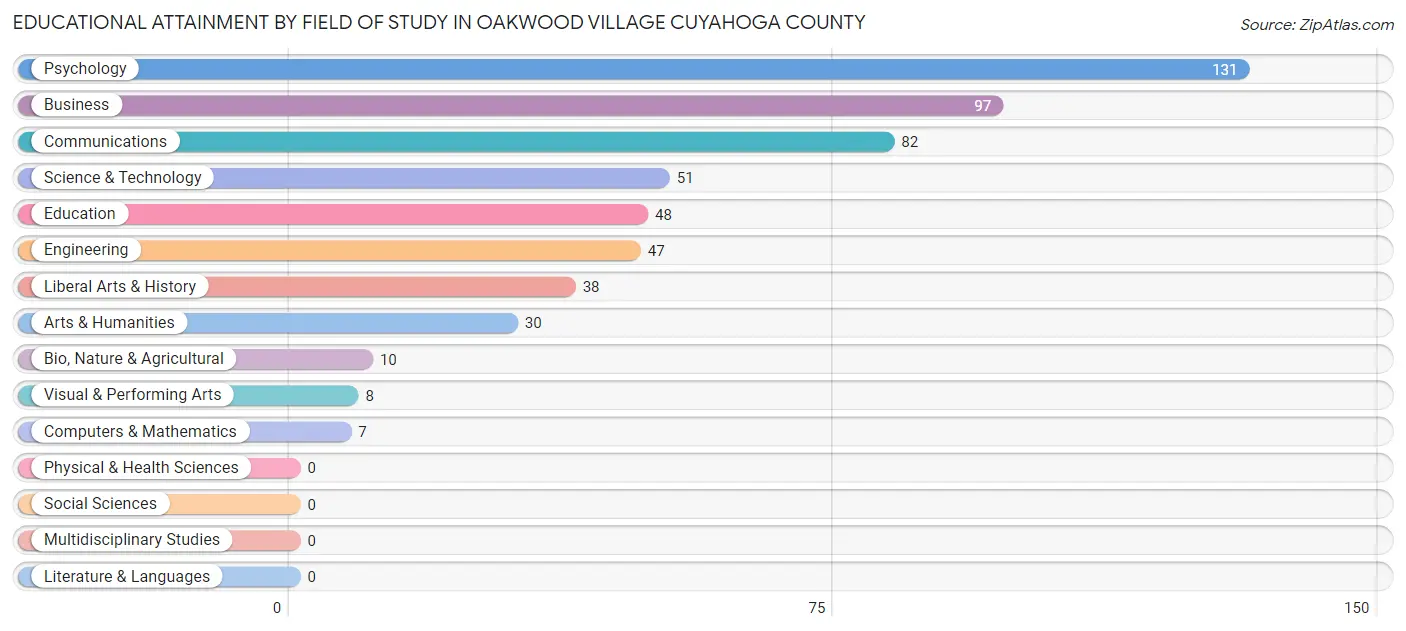
| Field of Study | # Graduates | % Graduates |
| Computers & Mathematics | 7 | 1.3% |
| Bio, Nature & Agricultural | 10 | 1.8% |
| Physical & Health Sciences | 0 | 0.0% |
| Psychology | 131 | 23.9% |
| Social Sciences | 0 | 0.0% |
| Engineering | 47 | 8.6% |
| Multidisciplinary Studies | 0 | 0.0% |
| Science & Technology | 51 | 9.3% |
| Business | 97 | 17.7% |
| Education | 48 | 8.7% |
| Literature & Languages | 0 | 0.0% |
| Liberal Arts & History | 38 | 6.9% |
| Visual & Performing Arts | 8 | 1.5% |
| Communications | 82 | 14.9% |
| Arts & Humanities | 30 | 5.5% |
| Total | 549 | 100.0% |
Transportation & Commute in Oakwood village Cuyahoga County
Vehicle Availability by Sex in Oakwood village Cuyahoga County
The most prevalent vehicle ownership categories in Oakwood village Cuyahoga County are males with 4 vehicles (265, accounting for 34.5%) and females with 4 vehicles (193, making up 42.6%).
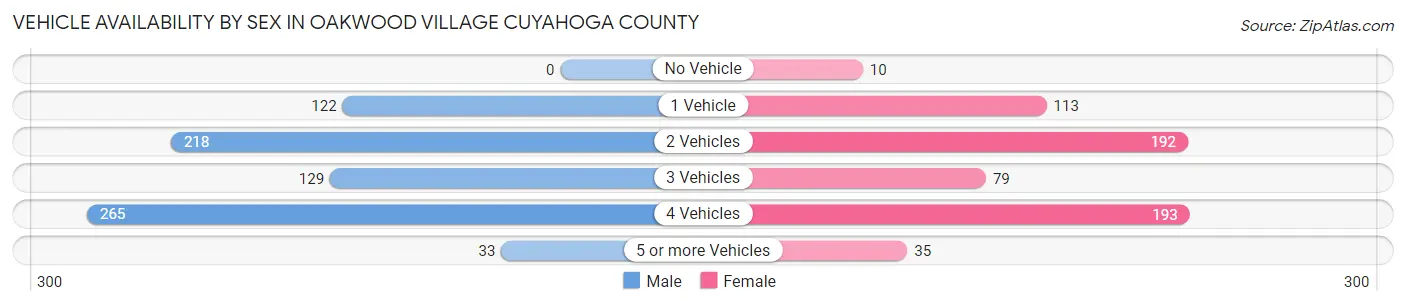
| Vehicles Available | Male | Female |
| No Vehicle | 0 (0.0%) | 10 (1.6%) |
| 1 Vehicle | 122 (15.9%) | 113 (18.2%) |
| 2 Vehicles | 218 (28.4%) | 192 (30.9%) |
| 3 Vehicles | 129 (16.8%) | 79 (12.7%) |
| 4 Vehicles | 265 (34.5%) | 193 (31.0%) |
| 5 or more Vehicles | 33 (4.3%) | 35 (5.6%) |
| Total | 767 (100.0%) | 622 (100.0%) |
Commute Time in Oakwood village Cuyahoga County
The most frequently occuring commute durations in Oakwood village Cuyahoga County are 15 to 19 minutes (308 commuters, 25.8%), 5 to 9 minutes (276 commuters, 23.1%), and 25 to 29 minutes (183 commuters, 15.3%).
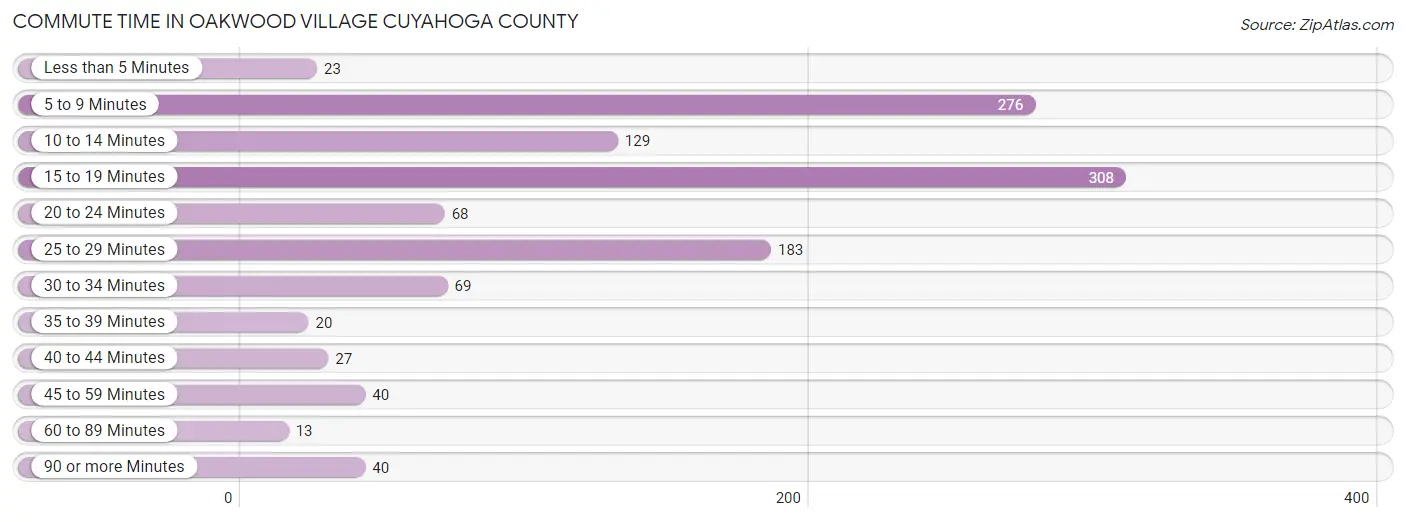
| Commute Time | # Commuters | % Commuters |
| Less than 5 Minutes | 23 | 1.9% |
| 5 to 9 Minutes | 276 | 23.1% |
| 10 to 14 Minutes | 129 | 10.8% |
| 15 to 19 Minutes | 308 | 25.8% |
| 20 to 24 Minutes | 68 | 5.7% |
| 25 to 29 Minutes | 183 | 15.3% |
| 30 to 34 Minutes | 69 | 5.8% |
| 35 to 39 Minutes | 20 | 1.7% |
| 40 to 44 Minutes | 27 | 2.3% |
| 45 to 59 Minutes | 40 | 3.3% |
| 60 to 89 Minutes | 13 | 1.1% |
| 90 or more Minutes | 40 | 3.3% |
Commute Time by Sex in Oakwood village Cuyahoga County
The most common commute times in Oakwood village Cuyahoga County are 15 to 19 minutes (287 commuters, 42.8%) for males and 25 to 29 minutes (168 commuters, 32.0%) for females.
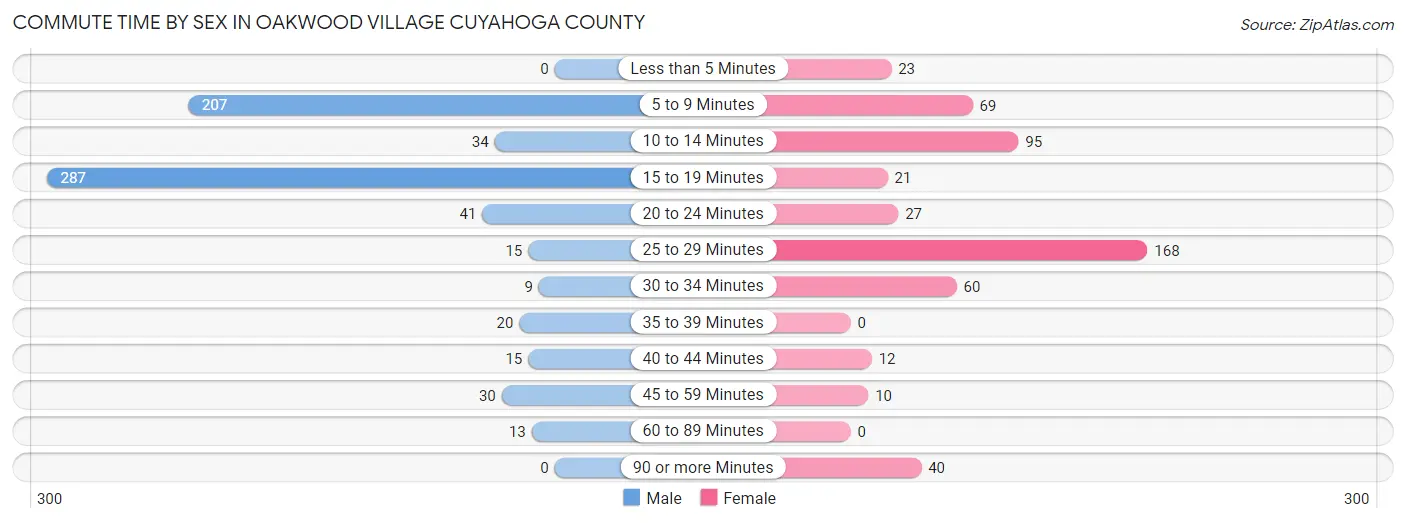
| Commute Time | Male | Female |
| Less than 5 Minutes | 0 (0.0%) | 23 (4.4%) |
| 5 to 9 Minutes | 207 (30.8%) | 69 (13.1%) |
| 10 to 14 Minutes | 34 (5.1%) | 95 (18.1%) |
| 15 to 19 Minutes | 287 (42.8%) | 21 (4.0%) |
| 20 to 24 Minutes | 41 (6.1%) | 27 (5.1%) |
| 25 to 29 Minutes | 15 (2.2%) | 168 (32.0%) |
| 30 to 34 Minutes | 9 (1.3%) | 60 (11.4%) |
| 35 to 39 Minutes | 20 (3.0%) | 0 (0.0%) |
| 40 to 44 Minutes | 15 (2.2%) | 12 (2.3%) |
| 45 to 59 Minutes | 30 (4.5%) | 10 (1.9%) |
| 60 to 89 Minutes | 13 (1.9%) | 0 (0.0%) |
| 90 or more Minutes | 0 (0.0%) | 40 (7.6%) |
Time of Departure to Work by Sex in Oakwood village Cuyahoga County
The most frequent times of departure to work in Oakwood village Cuyahoga County are 4:00 PM to 11:59 PM (136, 20.3%) for males and 7:30 AM to 7:59 AM (198, 37.7%) for females.
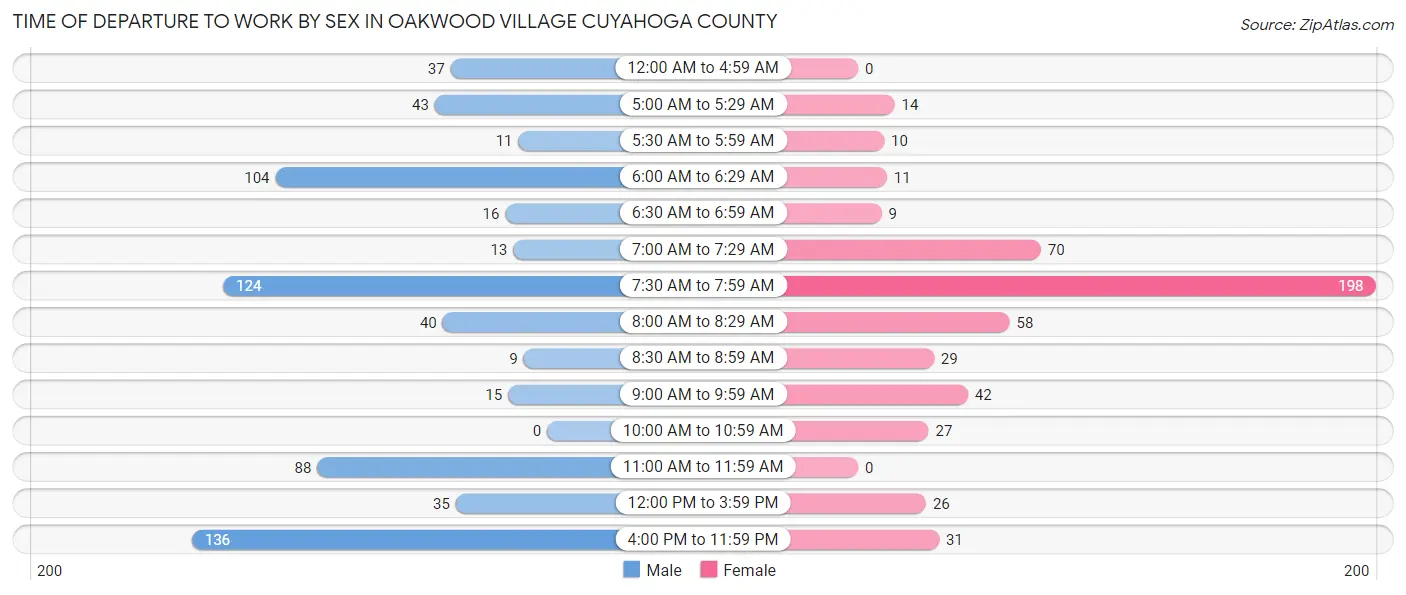
| Time of Departure | Male | Female |
| 12:00 AM to 4:59 AM | 37 (5.5%) | 0 (0.0%) |
| 5:00 AM to 5:29 AM | 43 (6.4%) | 14 (2.7%) |
| 5:30 AM to 5:59 AM | 11 (1.6%) | 10 (1.9%) |
| 6:00 AM to 6:29 AM | 104 (15.5%) | 11 (2.1%) |
| 6:30 AM to 6:59 AM | 16 (2.4%) | 9 (1.7%) |
| 7:00 AM to 7:29 AM | 13 (1.9%) | 70 (13.3%) |
| 7:30 AM to 7:59 AM | 124 (18.5%) | 198 (37.7%) |
| 8:00 AM to 8:29 AM | 40 (6.0%) | 58 (11.1%) |
| 8:30 AM to 8:59 AM | 9 (1.3%) | 29 (5.5%) |
| 9:00 AM to 9:59 AM | 15 (2.2%) | 42 (8.0%) |
| 10:00 AM to 10:59 AM | 0 (0.0%) | 27 (5.1%) |
| 11:00 AM to 11:59 AM | 88 (13.1%) | 0 (0.0%) |
| 12:00 PM to 3:59 PM | 35 (5.2%) | 26 (5.0%) |
| 4:00 PM to 11:59 PM | 136 (20.3%) | 31 (5.9%) |
| Total | 671 (100.0%) | 525 (100.0%) |
Housing Occupancy in Oakwood village Cuyahoga County
Occupancy by Ownership in Oakwood village Cuyahoga County
Of the total 1,361 dwellings in Oakwood village Cuyahoga County, owner-occupied units account for 969 (71.2%), while renter-occupied units make up 392 (28.8%).
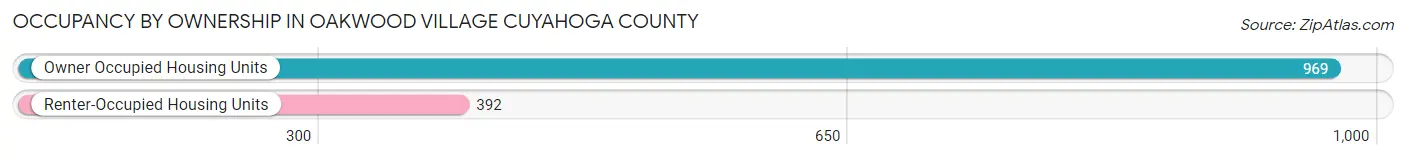
| Occupancy | # Housing Units | % Housing Units |
| Owner Occupied Housing Units | 969 | 71.2% |
| Renter-Occupied Housing Units | 392 | 28.8% |
| Total Occupied Housing Units | 1,361 | 100.0% |
Occupancy by Household Size in Oakwood village Cuyahoga County
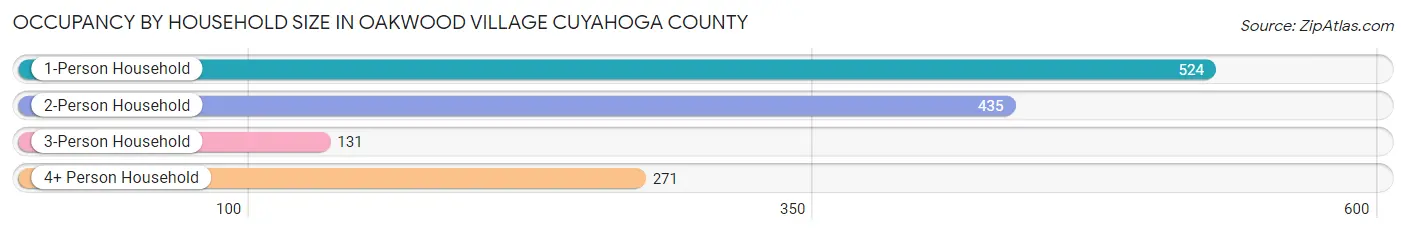
| Household Size | # Housing Units | % Housing Units |
| 1-Person Household | 524 | 38.5% |
| 2-Person Household | 435 | 32.0% |
| 3-Person Household | 131 | 9.6% |
| 4+ Person Household | 271 | 19.9% |
| Total Housing Units | 1,361 | 100.0% |
Occupancy by Ownership by Household Size in Oakwood village Cuyahoga County
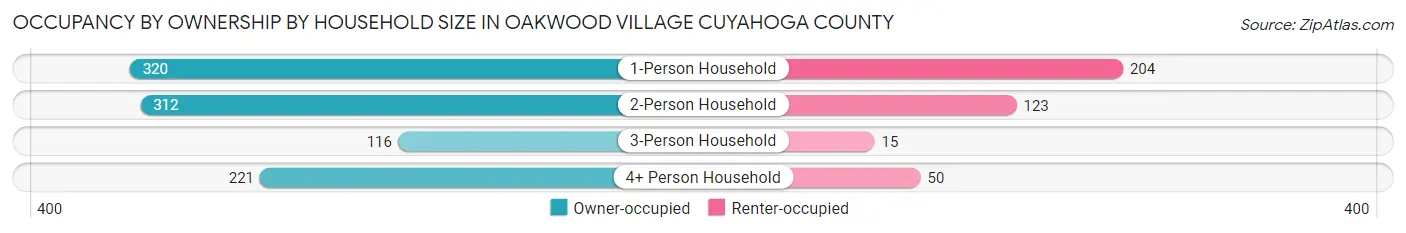
| Household Size | Owner-occupied | Renter-occupied |
| 1-Person Household | 320 (61.1%) | 204 (38.9%) |
| 2-Person Household | 312 (71.7%) | 123 (28.3%) |
| 3-Person Household | 116 (88.5%) | 15 (11.5%) |
| 4+ Person Household | 221 (81.6%) | 50 (18.4%) |
| Total Housing Units | 969 (71.2%) | 392 (28.8%) |
Occupancy by Educational Attainment in Oakwood village Cuyahoga County
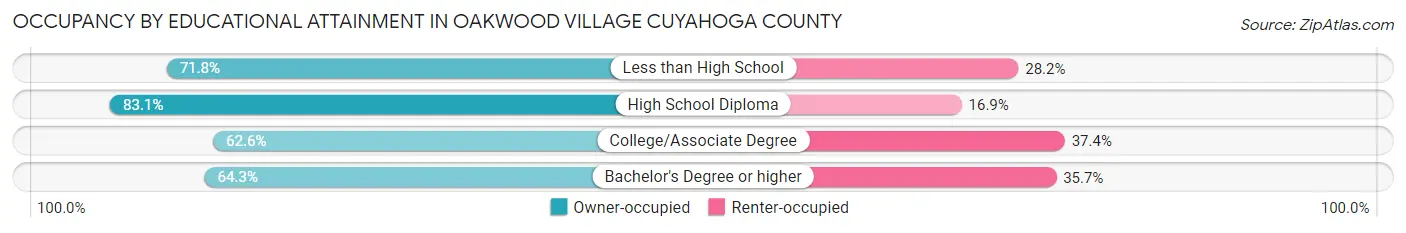
| Household Size | Owner-occupied | Renter-occupied |
| Less than High School | 79 (71.8%) | 31 (28.2%) |
| High School Diploma | 412 (83.1%) | 84 (16.9%) |
| College/Associate Degree | 278 (62.6%) | 166 (37.4%) |
| Bachelor's Degree or higher | 200 (64.3%) | 111 (35.7%) |
Occupancy by Age of Householder in Oakwood village Cuyahoga County
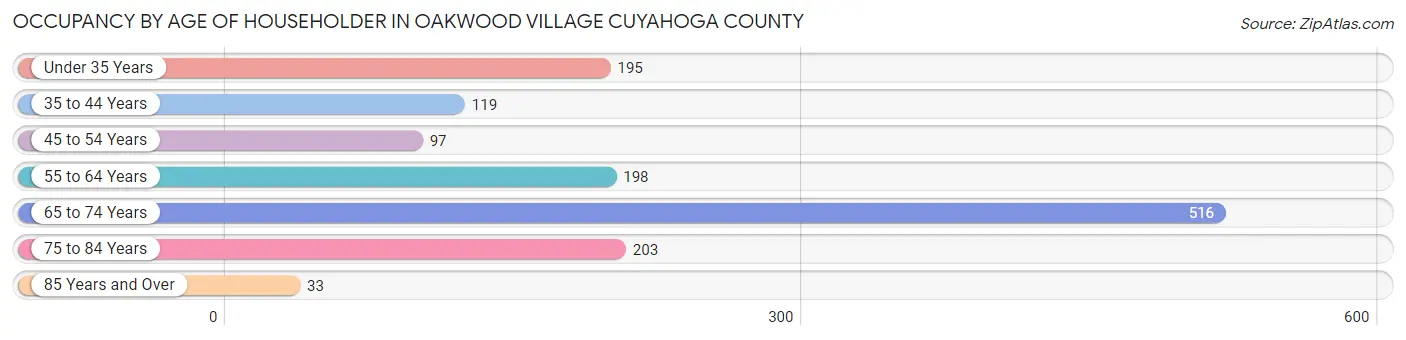
| Age Bracket | # Households | % Households |
| Under 35 Years | 195 | 14.3% |
| 35 to 44 Years | 119 | 8.7% |
| 45 to 54 Years | 97 | 7.1% |
| 55 to 64 Years | 198 | 14.5% |
| 65 to 74 Years | 516 | 37.9% |
| 75 to 84 Years | 203 | 14.9% |
| 85 Years and Over | 33 | 2.4% |
| Total | 1,361 | 100.0% |
Housing Finances in Oakwood village Cuyahoga County
Median Income by Occupancy in Oakwood village Cuyahoga County
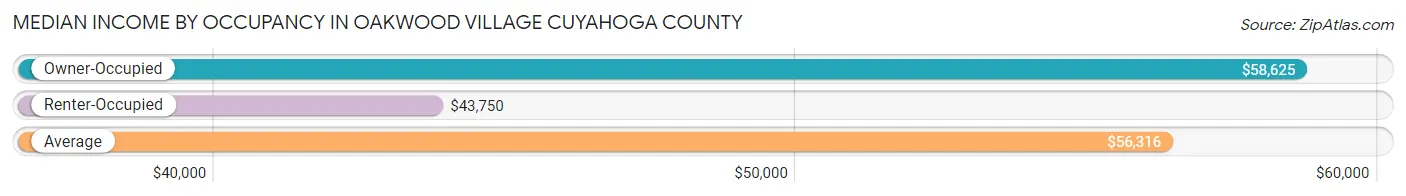
| Occupancy Type | # Households | Median Income |
| Owner-Occupied | 969 (71.2%) | $58,625 |
| Renter-Occupied | 392 (28.8%) | $43,750 |
| Average | 1,361 (100.0%) | $56,316 |
Occupancy by Householder Income Bracket in Oakwood village Cuyahoga County
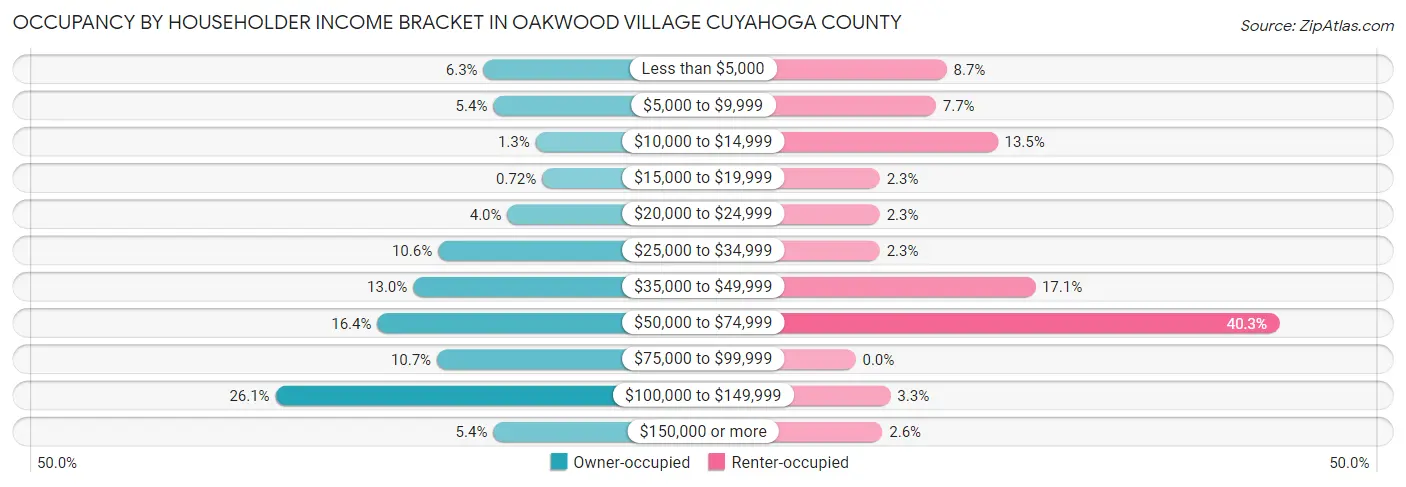
| Income Bracket | Owner-occupied | Renter-occupied |
| Less than $5,000 | 61 (6.3%) | 34 (8.7%) |
| $5,000 to $9,999 | 52 (5.4%) | 30 (7.6%) |
| $10,000 to $14,999 | 13 (1.3%) | 53 (13.5%) |
| $15,000 to $19,999 | 7 (0.7%) | 9 (2.3%) |
| $20,000 to $24,999 | 39 (4.0%) | 9 (2.3%) |
| $25,000 to $34,999 | 103 (10.6%) | 9 (2.3%) |
| $35,000 to $49,999 | 126 (13.0%) | 67 (17.1%) |
| $50,000 to $74,999 | 159 (16.4%) | 158 (40.3%) |
| $75,000 to $99,999 | 104 (10.7%) | 0 (0.0%) |
| $100,000 to $149,999 | 253 (26.1%) | 13 (3.3%) |
| $150,000 or more | 52 (5.4%) | 10 (2.5%) |
| Total | 969 (100.0%) | 392 (100.0%) |
Monthly Housing Cost Tiers in Oakwood village Cuyahoga County
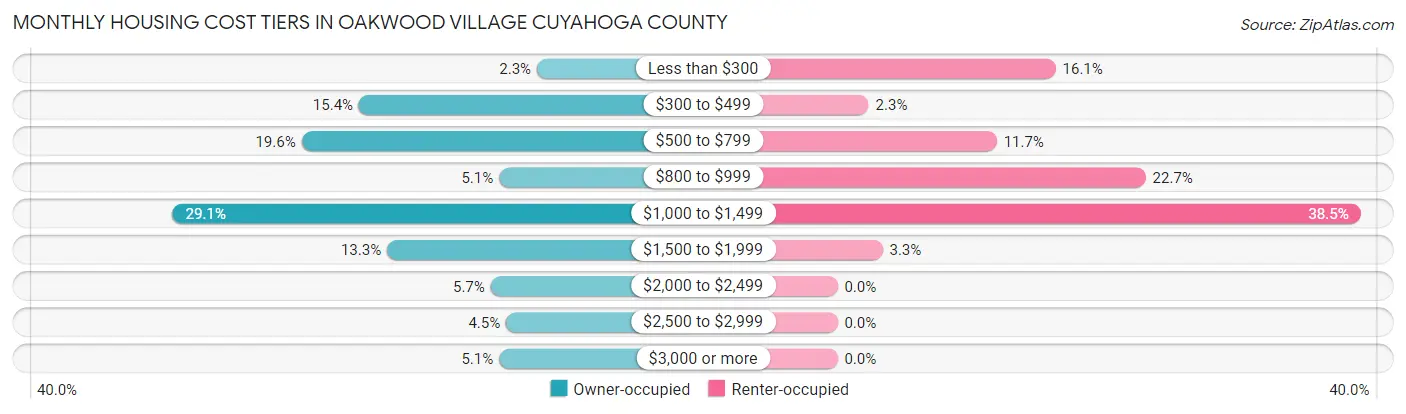
| Monthly Cost | Owner-occupied | Renter-occupied |
| Less than $300 | 22 (2.3%) | 63 (16.1%) |
| $300 to $499 | 149 (15.4%) | 9 (2.3%) |
| $500 to $799 | 190 (19.6%) | 46 (11.7%) |
| $800 to $999 | 49 (5.1%) | 89 (22.7%) |
| $1,000 to $1,499 | 282 (29.1%) | 151 (38.5%) |
| $1,500 to $1,999 | 129 (13.3%) | 13 (3.3%) |
| $2,000 to $2,499 | 55 (5.7%) | 0 (0.0%) |
| $2,500 to $2,999 | 44 (4.5%) | 0 (0.0%) |
| $3,000 or more | 49 (5.1%) | 0 (0.0%) |
| Total | 969 (100.0%) | 392 (100.0%) |
Physical Housing Characteristics in Oakwood village Cuyahoga County
Housing Structures in Oakwood village Cuyahoga County
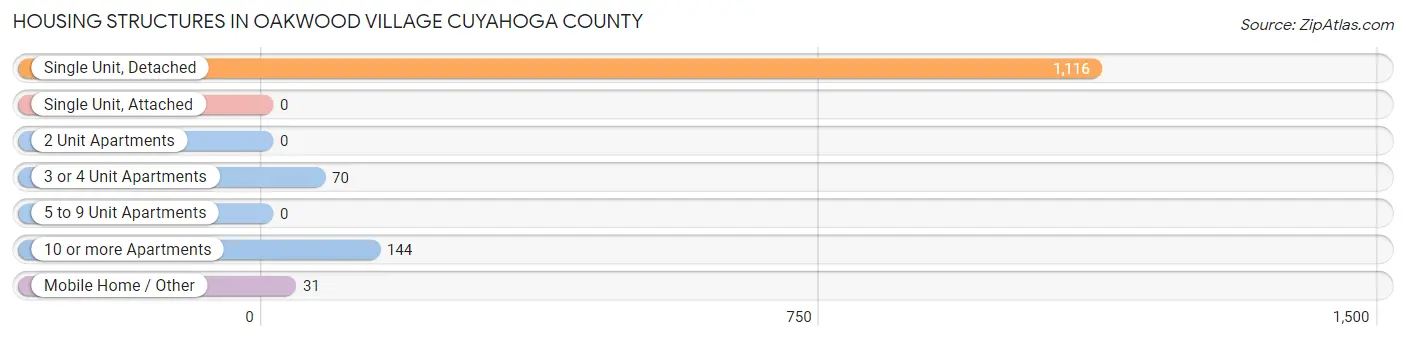
| Structure Type | # Housing Units | % Housing Units |
| Single Unit, Detached | 1,116 | 82.0% |
| Single Unit, Attached | 0 | 0.0% |
| 2 Unit Apartments | 0 | 0.0% |
| 3 or 4 Unit Apartments | 70 | 5.1% |
| 5 to 9 Unit Apartments | 0 | 0.0% |
| 10 or more Apartments | 144 | 10.6% |
| Mobile Home / Other | 31 | 2.3% |
| Total | 1,361 | 100.0% |
Housing Structures by Occupancy in Oakwood village Cuyahoga County
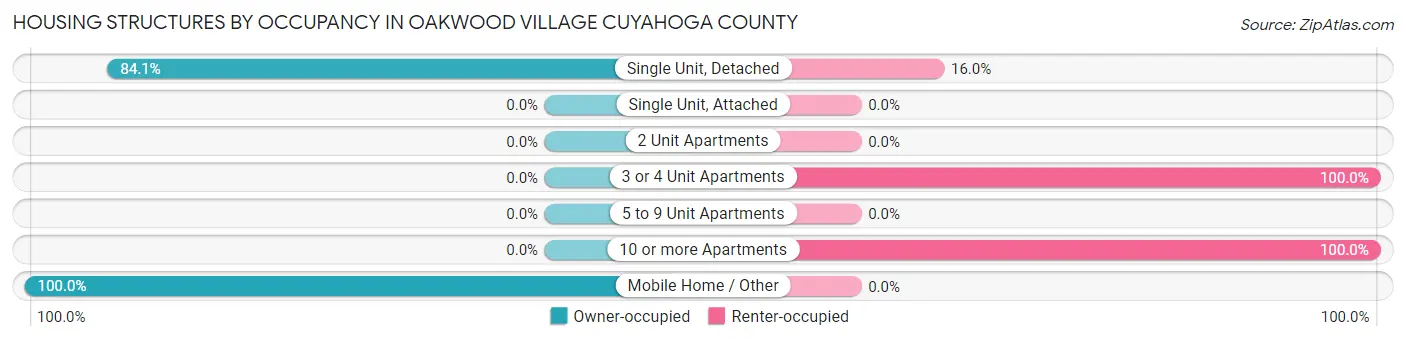
| Structure Type | Owner-occupied | Renter-occupied |
| Single Unit, Detached | 938 (84.1%) | 178 (16.0%) |
| Single Unit, Attached | 0 (0.0%) | 0 (0.0%) |
| 2 Unit Apartments | 0 (0.0%) | 0 (0.0%) |
| 3 or 4 Unit Apartments | 0 (0.0%) | 70 (100.0%) |
| 5 to 9 Unit Apartments | 0 (0.0%) | 0 (0.0%) |
| 10 or more Apartments | 0 (0.0%) | 144 (100.0%) |
| Mobile Home / Other | 31 (100.0%) | 0 (0.0%) |
| Total | 969 (71.2%) | 392 (28.8%) |
Housing Structures by Number of Rooms in Oakwood village Cuyahoga County
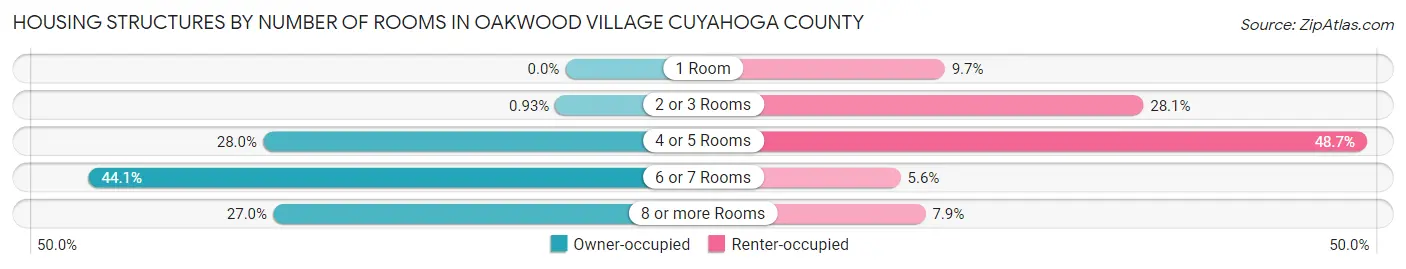
| Number of Rooms | Owner-occupied | Renter-occupied |
| 1 Room | 0 (0.0%) | 38 (9.7%) |
| 2 or 3 Rooms | 9 (0.9%) | 110 (28.1%) |
| 4 or 5 Rooms | 271 (28.0%) | 191 (48.7%) |
| 6 or 7 Rooms | 427 (44.1%) | 22 (5.6%) |
| 8 or more Rooms | 262 (27.0%) | 31 (7.9%) |
| Total | 969 (100.0%) | 392 (100.0%) |
Housing Structure by Heating Type in Oakwood village Cuyahoga County
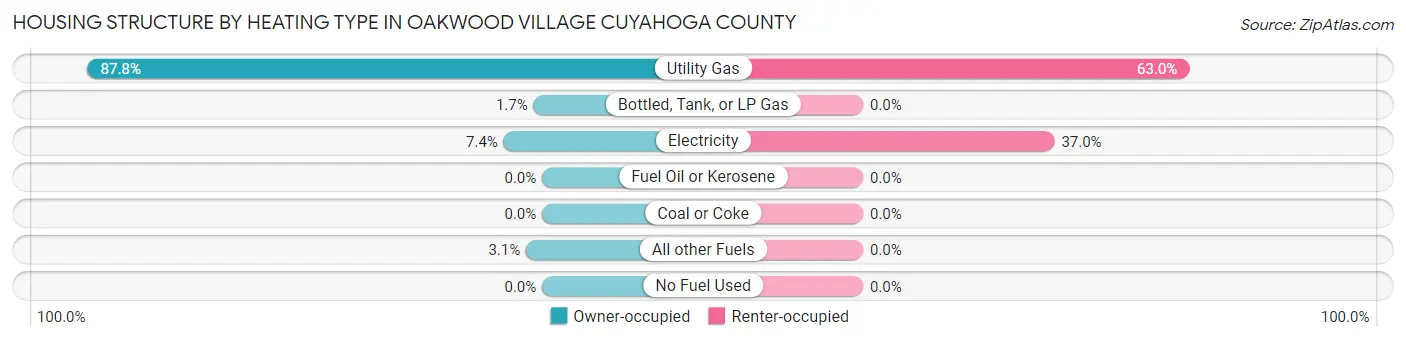
| Heating Type | Owner-occupied | Renter-occupied |
| Utility Gas | 851 (87.8%) | 247 (63.0%) |
| Bottled, Tank, or LP Gas | 16 (1.7%) | 0 (0.0%) |
| Electricity | 72 (7.4%) | 145 (37.0%) |
| Fuel Oil or Kerosene | 0 (0.0%) | 0 (0.0%) |
| Coal or Coke | 0 (0.0%) | 0 (0.0%) |
| All other Fuels | 30 (3.1%) | 0 (0.0%) |
| No Fuel Used | 0 (0.0%) | 0 (0.0%) |
| Total | 969 (100.0%) | 392 (100.0%) |
Household Vehicle Usage in Oakwood village Cuyahoga County
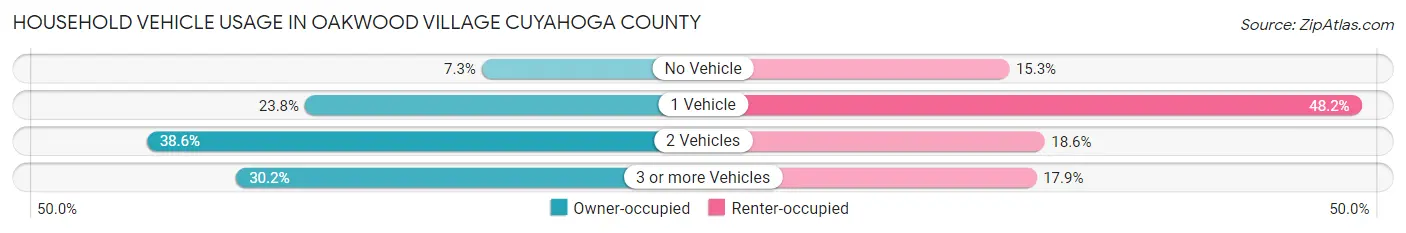
| Vehicles per Household | Owner-occupied | Renter-occupied |
| No Vehicle | 71 (7.3%) | 60 (15.3%) |
| 1 Vehicle | 231 (23.8%) | 189 (48.2%) |
| 2 Vehicles | 374 (38.6%) | 73 (18.6%) |
| 3 or more Vehicles | 293 (30.2%) | 70 (17.9%) |
| Total | 969 (100.0%) | 392 (100.0%) |
Real Estate & Mortgages in Oakwood village Cuyahoga County
Real Estate and Mortgage Overview in Oakwood village Cuyahoga County
| Characteristic | Without Mortgage | With Mortgage |
| Housing Units | 321 | 648 |
| Median Property Value | $124,300 | $146,500 |
| Median Household Income | $63,938 | $42 |
| Monthly Housing Costs | $500 | $49 |
| Real Estate Taxes | $2,263 | $3 |
Property Value by Mortgage Status in Oakwood village Cuyahoga County
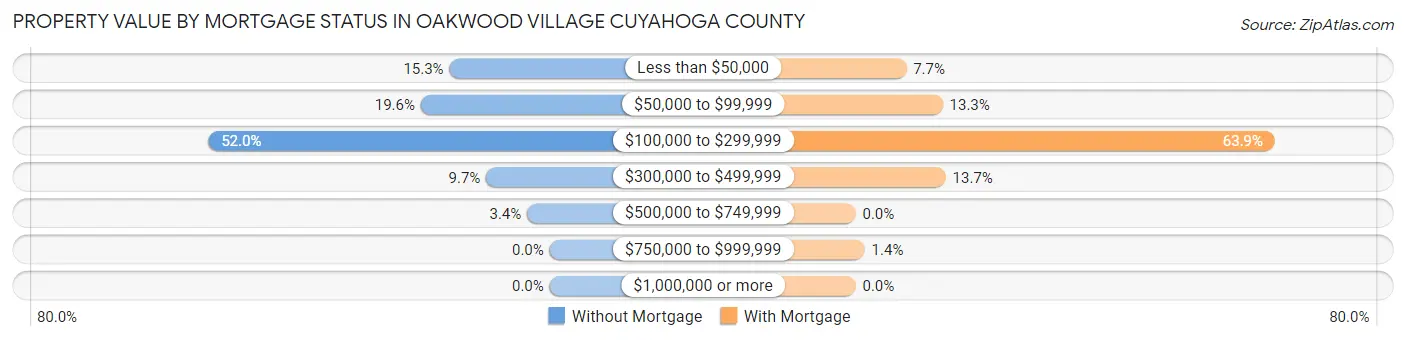
| Property Value | Without Mortgage | With Mortgage |
| Less than $50,000 | 49 (15.3%) | 50 (7.7%) |
| $50,000 to $99,999 | 63 (19.6%) | 86 (13.3%) |
| $100,000 to $299,999 | 167 (52.0%) | 414 (63.9%) |
| $300,000 to $499,999 | 31 (9.7%) | 89 (13.7%) |
| $500,000 to $749,999 | 11 (3.4%) | 0 (0.0%) |
| $750,000 to $999,999 | 0 (0.0%) | 9 (1.4%) |
| $1,000,000 or more | 0 (0.0%) | 0 (0.0%) |
| Total | 321 (100.0%) | 648 (100.0%) |
Household Income by Mortgage Status in Oakwood village Cuyahoga County
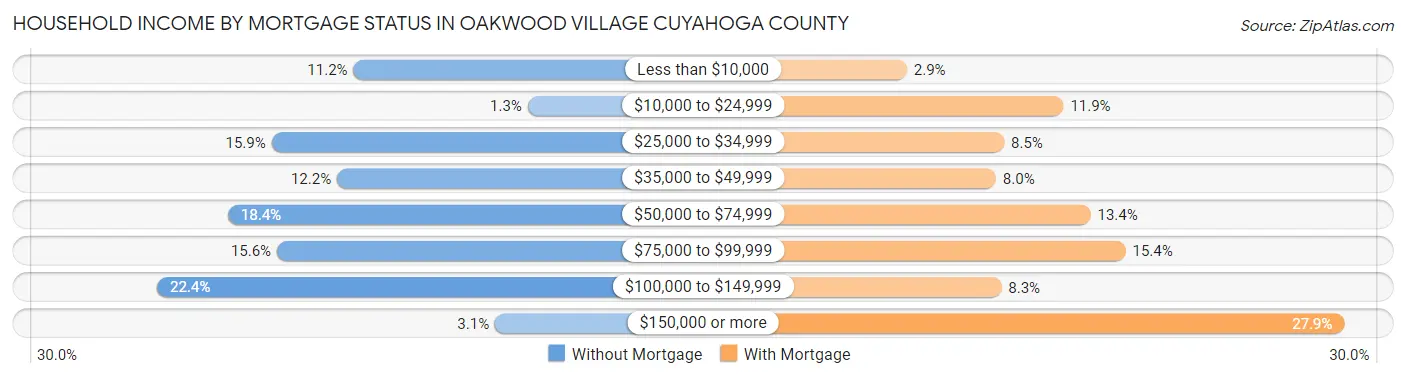
| Household Income | Without Mortgage | With Mortgage |
| Less than $10,000 | 36 (11.2%) | 19 (2.9%) |
| $10,000 to $24,999 | 4 (1.3%) | 77 (11.9%) |
| $25,000 to $34,999 | 51 (15.9%) | 55 (8.5%) |
| $35,000 to $49,999 | 39 (12.1%) | 52 (8.0%) |
| $50,000 to $74,999 | 59 (18.4%) | 87 (13.4%) |
| $75,000 to $99,999 | 50 (15.6%) | 100 (15.4%) |
| $100,000 to $149,999 | 72 (22.4%) | 54 (8.3%) |
| $150,000 or more | 10 (3.1%) | 181 (27.9%) |
| Total | 321 (100.0%) | 648 (100.0%) |
Property Value to Household Income Ratio in Oakwood village Cuyahoga County
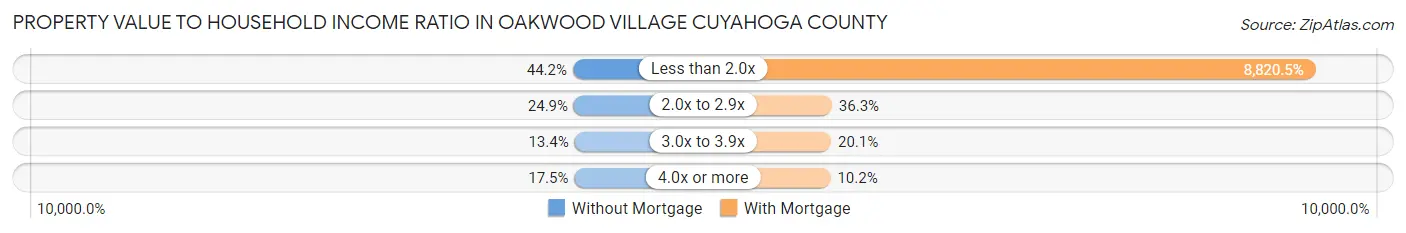
| Value-to-Income Ratio | Without Mortgage | With Mortgage |
| Less than 2.0x | 142 (44.2%) | 57,157 (8,820.5%) |
| 2.0x to 2.9x | 80 (24.9%) | 235 (36.3%) |
| 3.0x to 3.9x | 43 (13.4%) | 130 (20.1%) |
| 4.0x or more | 56 (17.4%) | 66 (10.2%) |
| Total | 321 (100.0%) | 648 (100.0%) |
Real Estate Taxes by Mortgage Status in Oakwood village Cuyahoga County
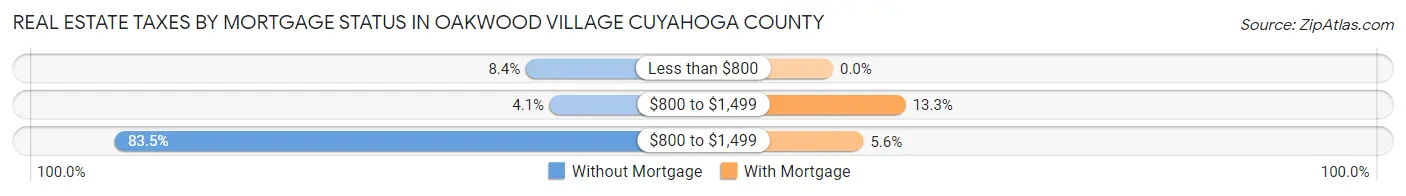
| Property Taxes | Without Mortgage | With Mortgage |
| Less than $800 | 27 (8.4%) | 0 (0.0%) |
| $800 to $1,499 | 13 (4.1%) | 86 (13.3%) |
| $800 to $1,499 | 268 (83.5%) | 36 (5.6%) |
| Total | 321 (100.0%) | 648 (100.0%) |
Health & Disability in Oakwood village Cuyahoga County
Health Insurance Coverage by Age in Oakwood village Cuyahoga County
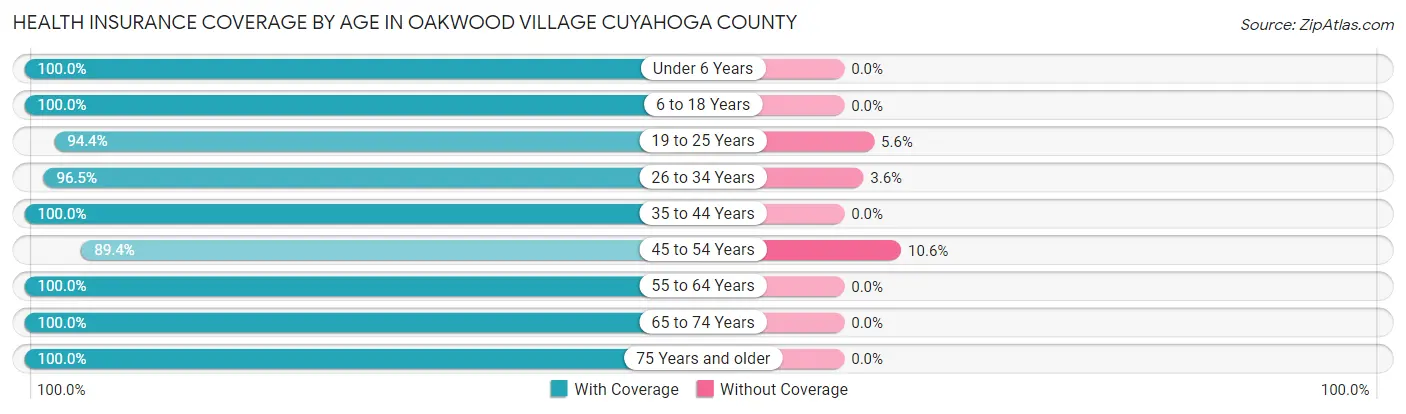
| Age Bracket | With Coverage | Without Coverage |
| Under 6 Years | 313 (100.0%) | 0 (0.0%) |
| 6 to 18 Years | 358 (100.0%) | 0 (0.0%) |
| 19 to 25 Years | 187 (94.4%) | 11 (5.6%) |
| 26 to 34 Years | 516 (96.5%) | 19 (3.5%) |
| 35 to 44 Years | 258 (100.0%) | 0 (0.0%) |
| 45 to 54 Years | 194 (89.4%) | 23 (10.6%) |
| 55 to 64 Years | 455 (100.0%) | 0 (0.0%) |
| 65 to 74 Years | 703 (100.0%) | 0 (0.0%) |
| 75 Years and older | 380 (100.0%) | 0 (0.0%) |
| Total | 3,364 (98.5%) | 53 (1.5%) |
Health Insurance Coverage by Citizenship Status in Oakwood village Cuyahoga County
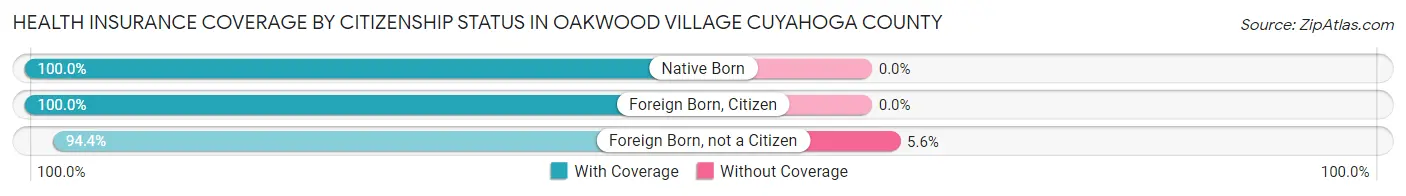
| Citizenship Status | With Coverage | Without Coverage |
| Native Born | 313 (100.0%) | 0 (0.0%) |
| Foreign Born, Citizen | 358 (100.0%) | 0 (0.0%) |
| Foreign Born, not a Citizen | 187 (94.4%) | 11 (5.6%) |
Health Insurance Coverage by Household Income in Oakwood village Cuyahoga County
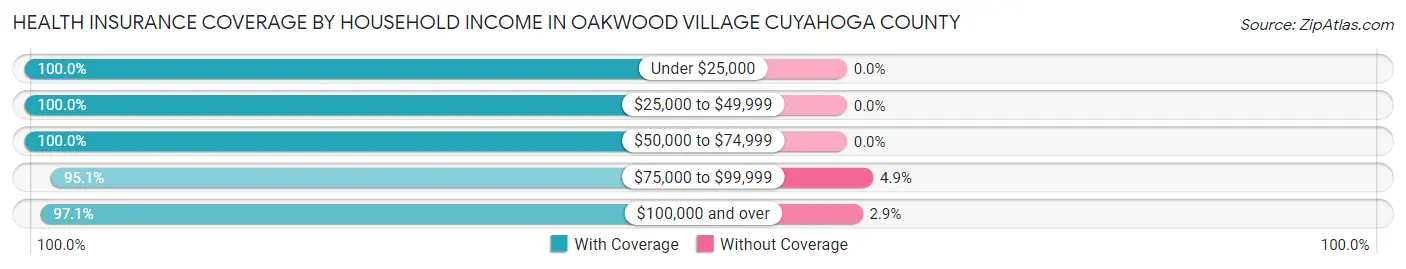
| Household Income | With Coverage | Without Coverage |
| Under $25,000 | 661 (100.0%) | 0 (0.0%) |
| $25,000 to $49,999 | 498 (100.0%) | 0 (0.0%) |
| $50,000 to $74,999 | 688 (100.0%) | 0 (0.0%) |
| $75,000 to $99,999 | 366 (95.1%) | 19 (4.9%) |
| $100,000 and over | 1,121 (97.1%) | 34 (2.9%) |
Public vs Private Health Insurance Coverage by Age in Oakwood village Cuyahoga County
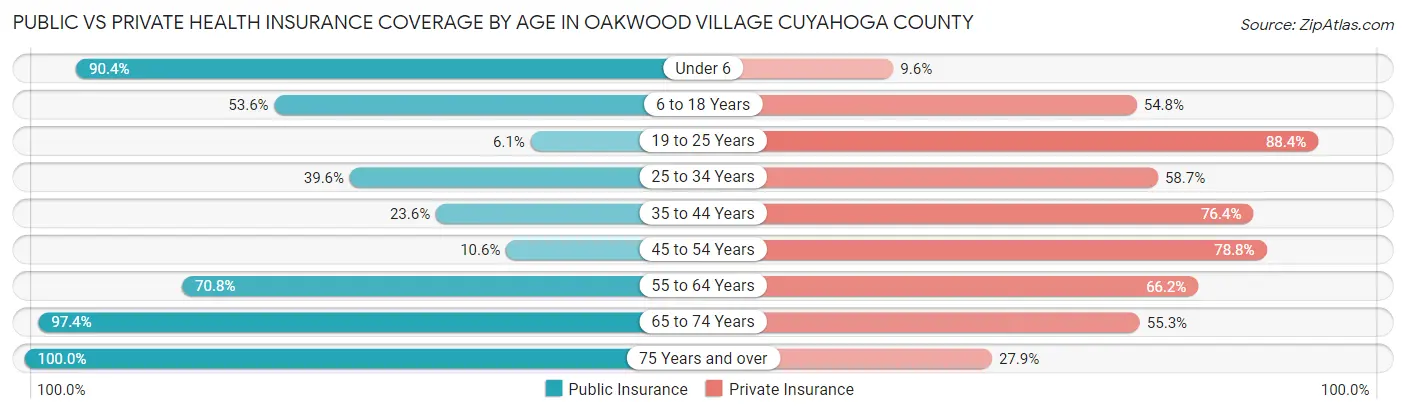
| Age Bracket | Public Insurance | Private Insurance |
| Under 6 | 283 (90.4%) | 30 (9.6%) |
| 6 to 18 Years | 192 (53.6%) | 196 (54.7%) |
| 19 to 25 Years | 12 (6.1%) | 175 (88.4%) |
| 25 to 34 Years | 212 (39.6%) | 314 (58.7%) |
| 35 to 44 Years | 61 (23.6%) | 197 (76.4%) |
| 45 to 54 Years | 23 (10.6%) | 171 (78.8%) |
| 55 to 64 Years | 322 (70.8%) | 301 (66.1%) |
| 65 to 74 Years | 685 (97.4%) | 389 (55.3%) |
| 75 Years and over | 380 (100.0%) | 106 (27.9%) |
| Total | 2,170 (63.5%) | 1,879 (55.0%) |
Disability Status by Sex by Age in Oakwood village Cuyahoga County
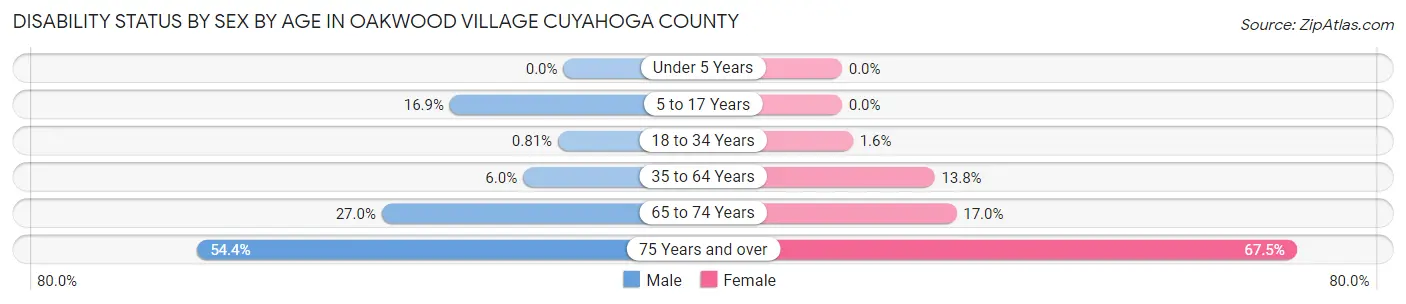
| Age Bracket | Male | Female |
| Under 5 Years | 0 (0.0%) | 0 (0.0%) |
| 5 to 17 Years | 44 (16.9%) | 0 (0.0%) |
| 18 to 34 Years | 4 (0.8%) | 5 (1.6%) |
| 35 to 64 Years | 20 (6.0%) | 82 (13.8%) |
| 65 to 74 Years | 96 (27.0%) | 59 (17.0%) |
| 75 Years and over | 81 (54.4%) | 156 (67.5%) |
Disability Class by Sex by Age in Oakwood village Cuyahoga County
Disability Class: Hearing Difficulty
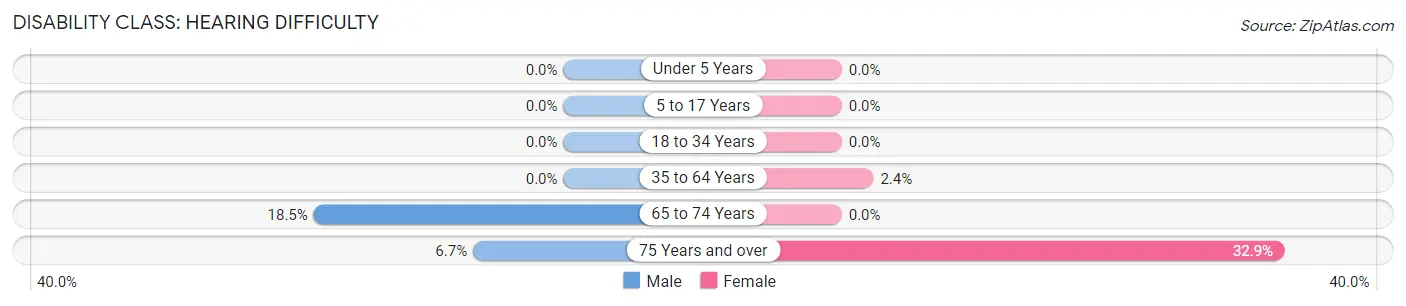
| Age Bracket | Male | Female |
| Under 5 Years | 0 (0.0%) | 0 (0.0%) |
| 5 to 17 Years | 0 (0.0%) | 0 (0.0%) |
| 18 to 34 Years | 0 (0.0%) | 0 (0.0%) |
| 35 to 64 Years | 0 (0.0%) | 14 (2.4%) |
| 65 to 74 Years | 66 (18.5%) | 0 (0.0%) |
| 75 Years and over | 10 (6.7%) | 76 (32.9%) |
Disability Class: Vision Difficulty
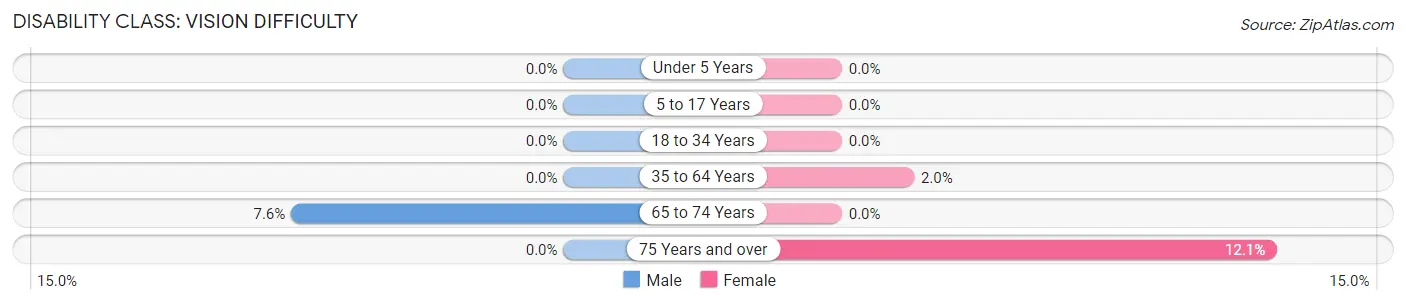
| Age Bracket | Male | Female |
| Under 5 Years | 0 (0.0%) | 0 (0.0%) |
| 5 to 17 Years | 0 (0.0%) | 0 (0.0%) |
| 18 to 34 Years | 0 (0.0%) | 0 (0.0%) |
| 35 to 64 Years | 0 (0.0%) | 12 (2.0%) |
| 65 to 74 Years | 27 (7.6%) | 0 (0.0%) |
| 75 Years and over | 0 (0.0%) | 28 (12.1%) |
Disability Class: Cognitive Difficulty
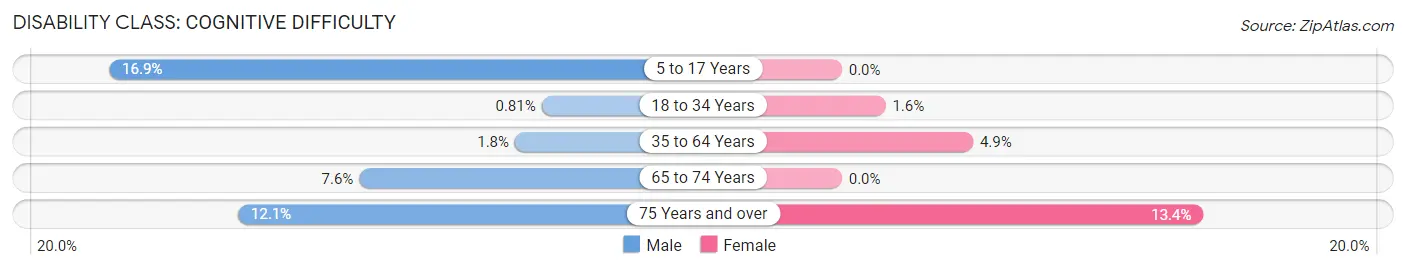
| Age Bracket | Male | Female |
| 5 to 17 Years | 44 (16.9%) | 0 (0.0%) |
| 18 to 34 Years | 4 (0.8%) | 5 (1.6%) |
| 35 to 64 Years | 6 (1.8%) | 29 (4.9%) |
| 65 to 74 Years | 27 (7.6%) | 0 (0.0%) |
| 75 Years and over | 18 (12.1%) | 31 (13.4%) |
Disability Class: Ambulatory Difficulty
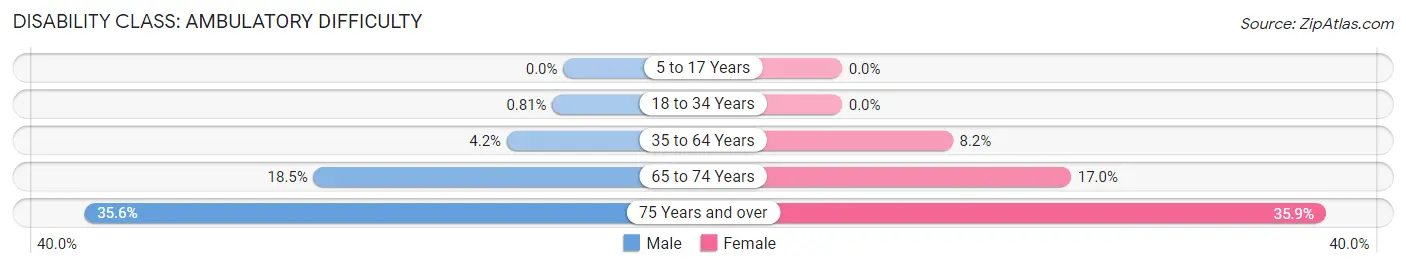
| Age Bracket | Male | Female |
| 5 to 17 Years | 0 (0.0%) | 0 (0.0%) |
| 18 to 34 Years | 4 (0.8%) | 0 (0.0%) |
| 35 to 64 Years | 14 (4.2%) | 49 (8.2%) |
| 65 to 74 Years | 66 (18.5%) | 59 (17.0%) |
| 75 Years and over | 53 (35.6%) | 83 (35.9%) |
Disability Class: Self-Care Difficulty
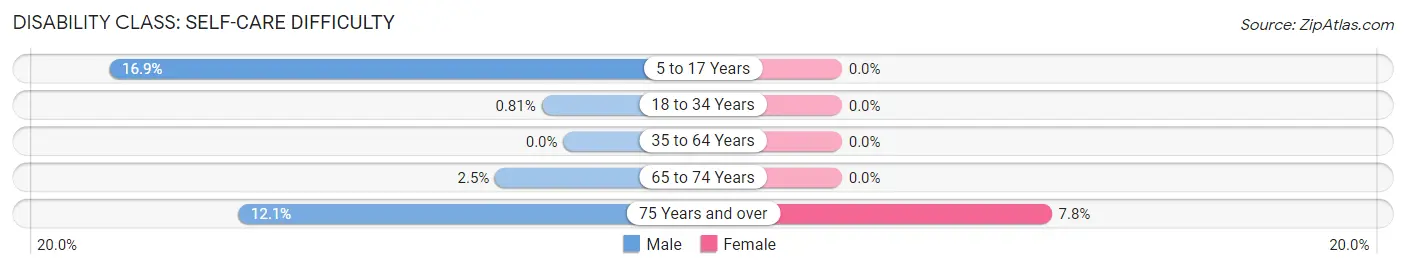
| Age Bracket | Male | Female |
| 5 to 17 Years | 44 (16.9%) | 0 (0.0%) |
| 18 to 34 Years | 4 (0.8%) | 0 (0.0%) |
| 35 to 64 Years | 0 (0.0%) | 0 (0.0%) |
| 65 to 74 Years | 9 (2.5%) | 0 (0.0%) |
| 75 Years and over | 18 (12.1%) | 18 (7.8%) |
Technology Access in Oakwood village Cuyahoga County
Computing Device Access in Oakwood village Cuyahoga County
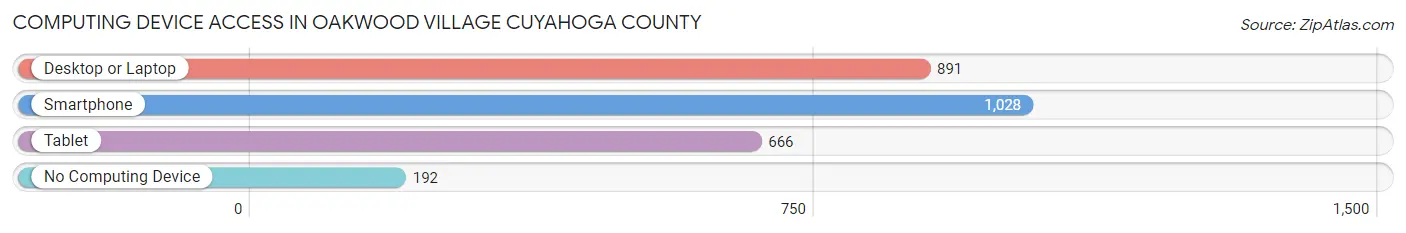
| Device Type | # Households | % Households |
| Desktop or Laptop | 891 | 65.5% |
| Smartphone | 1,028 | 75.5% |
| Tablet | 666 | 48.9% |
| No Computing Device | 192 | 14.1% |
| Total | 1,361 | 100.0% |
Internet Access in Oakwood village Cuyahoga County
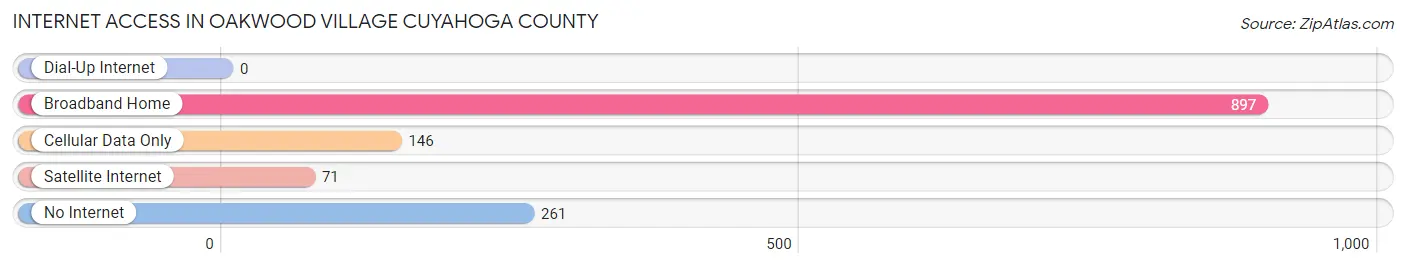
| Internet Type | # Households | % Households |
| Dial-Up Internet | 0 | 0.0% |
| Broadband Home | 897 | 65.9% |
| Cellular Data Only | 146 | 10.7% |
| Satellite Internet | 71 | 5.2% |
| No Internet | 261 | 19.2% |
| Total | 1,361 | 100.0% |
Oakwood village Cuyahoga County Summary
Oakwood Village is a small village located in Cuyahoga County, Ohio. It is situated in the eastern part of the county, just south of Cleveland. The village has a population of approximately 4,000 people and covers an area of 1.3 square miles.
History
Oakwood Village was founded in 1818 by a group of settlers from Connecticut. The village was originally known as Oakwood, but the name was changed to Oakwood Village in 1845. The village was incorporated in 1874 and has remained a small, rural community ever since.
The village was originally a farming community, but in the late 19th century, it began to develop into a residential area. The village was home to a number of small businesses, including a general store, a blacksmith shop, and a sawmill.
In the early 20th century, Oakwood Village began to experience rapid growth. The village was home to a number of factories, including a steel mill, a paper mill, and a brickyard. The village also had a number of churches, schools, and other amenities.
Geography
Oakwood Village is located in the eastern part of Cuyahoga County, Ohio. It is situated just south of Cleveland and is bordered by the cities of Garfield Heights, Maple Heights, and Bedford. The village is located on the banks of the Cuyahoga River and is surrounded by rolling hills and wooded areas.
The village has a total area of 1.3 square miles, all of which is land. The village is located at an elevation of 845 feet above sea level.
Economy
Oakwood Village is a primarily residential community. The village is home to a number of small businesses, including restaurants, retail stores, and professional services. The village also has a number of industrial businesses, including a steel mill, a paper mill, and a brickyard.
Demographics
As of the 2010 census, the population of Oakwood Village was 4,000. The racial makeup of the village was 94.2% White, 2.2% African American, 0.7% Asian, 0.3% Native American, and 2.6% from other races. The median household income was $45,000 and the median family income was $50,000.
Conclusion
Oakwood Village is a small village located in Cuyahoga County, Ohio. It is situated in the eastern part of the county, just south of Cleveland. The village has a population of approximately 4,000 people and covers an area of 1.3 square miles. The village was founded in 1818 and has remained a small, rural community ever since. The village is primarily residential, but it is also home to a number of small businesses and industrial businesses. The population of Oakwood Village is primarily White, with a small percentage of African American, Asian, and Native American residents. The median household income is $45,000 and the median family income is $50,000.
Common Questions
What is Per Capita Income in Oakwood village Cuyahoga County?
Per Capita income in Oakwood village Cuyahoga County is $29,531.
What is the Median Family Income in Oakwood village Cuyahoga County?
Median Family Income in Oakwood village Cuyahoga County is $85,750.
What is the Median Household income in Oakwood village Cuyahoga County?
Median Household Income in Oakwood village Cuyahoga County is $56,316.
What is Income or Wage Gap in Oakwood village Cuyahoga County?
Income or Wage Gap in Oakwood village Cuyahoga County is 23.9%.
Women in Oakwood village Cuyahoga County earn 76.1 cents for every dollar earned by a man.
What is Family Income Deficit in Oakwood village Cuyahoga County?
Family Income Deficit in Oakwood village Cuyahoga County is $20,816.
Families that are below poverty line in Oakwood village Cuyahoga County earn $20,816 less on average than the poverty threshold level.
What is Inequality or Gini Index in Oakwood village Cuyahoga County?
Inequality or Gini Index in Oakwood village Cuyahoga County is 0.45.
What is the Total Population of Oakwood village Cuyahoga County?
Total Population of Oakwood village Cuyahoga County is 3,551.
What is the Total Male Population of Oakwood village Cuyahoga County?
Total Male Population of Oakwood village Cuyahoga County is 1,787.
What is the Total Female Population of Oakwood village Cuyahoga County?
Total Female Population of Oakwood village Cuyahoga County is 1,764.
What is the Ratio of Males per 100 Females in Oakwood village Cuyahoga County?
There are 101.30 Males per 100 Females in Oakwood village Cuyahoga County.
What is the Ratio of Females per 100 Males in Oakwood village Cuyahoga County?
There are 98.71 Females per 100 Males in Oakwood village Cuyahoga County.
What is the Median Population Age in Oakwood village Cuyahoga County?
Median Population Age in Oakwood village Cuyahoga County is 51.6 Years.
What is the Average Family Size in Oakwood village Cuyahoga County
Average Family Size in Oakwood village Cuyahoga County is 3.4 People.
What is the Average Household Size in Oakwood village Cuyahoga County
Average Household Size in Oakwood village Cuyahoga County is 2.5 People.
How Large is the Labor Force in Oakwood village Cuyahoga County?
There are 1,524 People in the Labor Forcein in Oakwood village Cuyahoga County.
What is the Percentage of People in the Labor Force in Oakwood village Cuyahoga County?
50.3% of People are in the Labor Force in Oakwood village Cuyahoga County.
What is the Unemployment Rate in Oakwood village Cuyahoga County?
Unemployment Rate in Oakwood village Cuyahoga County is 5.2%.