Northbrook, OH Map & Demographics
Northbrook Map
Northbrook Overview
$26,977
PER CAPITA INCOME
$67,661
AVG FAMILY INCOME
$55,710
AVG HOUSEHOLD INCOME
2.8%
WAGE / INCOME GAP [ % ]
97.2¢/ $1
WAGE / INCOME GAP [ $ ]
0.38
INEQUALITY / GINI INDEX
11,199
TOTAL POPULATION
5,796
MALE POPULATION
5,403
FEMALE POPULATION
107.27
MALES / 100 FEMALES
93.22
FEMALES / 100 MALES
36.5
MEDIAN AGE
3.2
AVG FAMILY SIZE
2.6
AVG HOUSEHOLD SIZE
5,895
LABOR FORCE [ PEOPLE ]
67.9%
PERCENT IN LABOR FORCE
4.6%
UNEMPLOYMENT RATE
Income in Northbrook
Income Overview in Northbrook
Per Capita Income in Northbrook is $26,977, while median incomes of families and households are $67,661 and $55,710 respectively.
| Characteristic | Number | Measure |
| Per Capita Income | 11,199 | $26,977 |
| Median Family Income | 2,807 | $67,661 |
| Mean Family Income | 2,807 | $76,553 |
| Median Household Income | 4,279 | $55,710 |
| Mean Household Income | 4,279 | $68,782 |
| Income Deficit | 2,807 | $0 |
| Wage / Income Gap (%) | 11,199 | 2.81% |
| Wage / Income Gap ($) | 11,199 | 97.19¢ per $1 |
| Gini / Inequality Index | 11,199 | 0.38 |
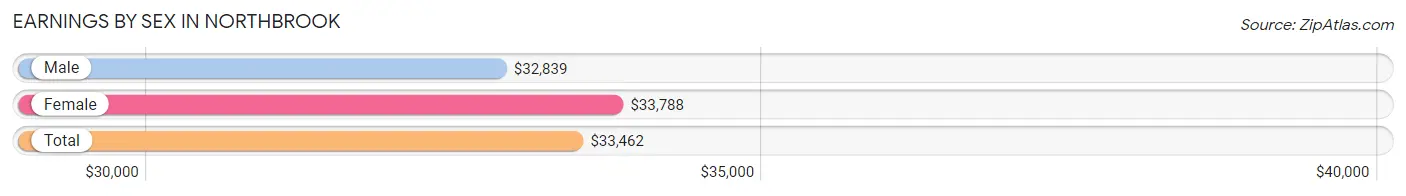
Earnings by Sex in Northbrook
Average Earnings in Northbrook are $33,462, $32,839 for men and $33,788 for women, a difference of 2.8%.
| Sex | Number | Average Earnings |
| Male | 3,312 (51.0%) | $32,839 |
| Female | 3,181 (49.0%) | $33,788 |
| Total | 6,493 (100.0%) | $33,462 |
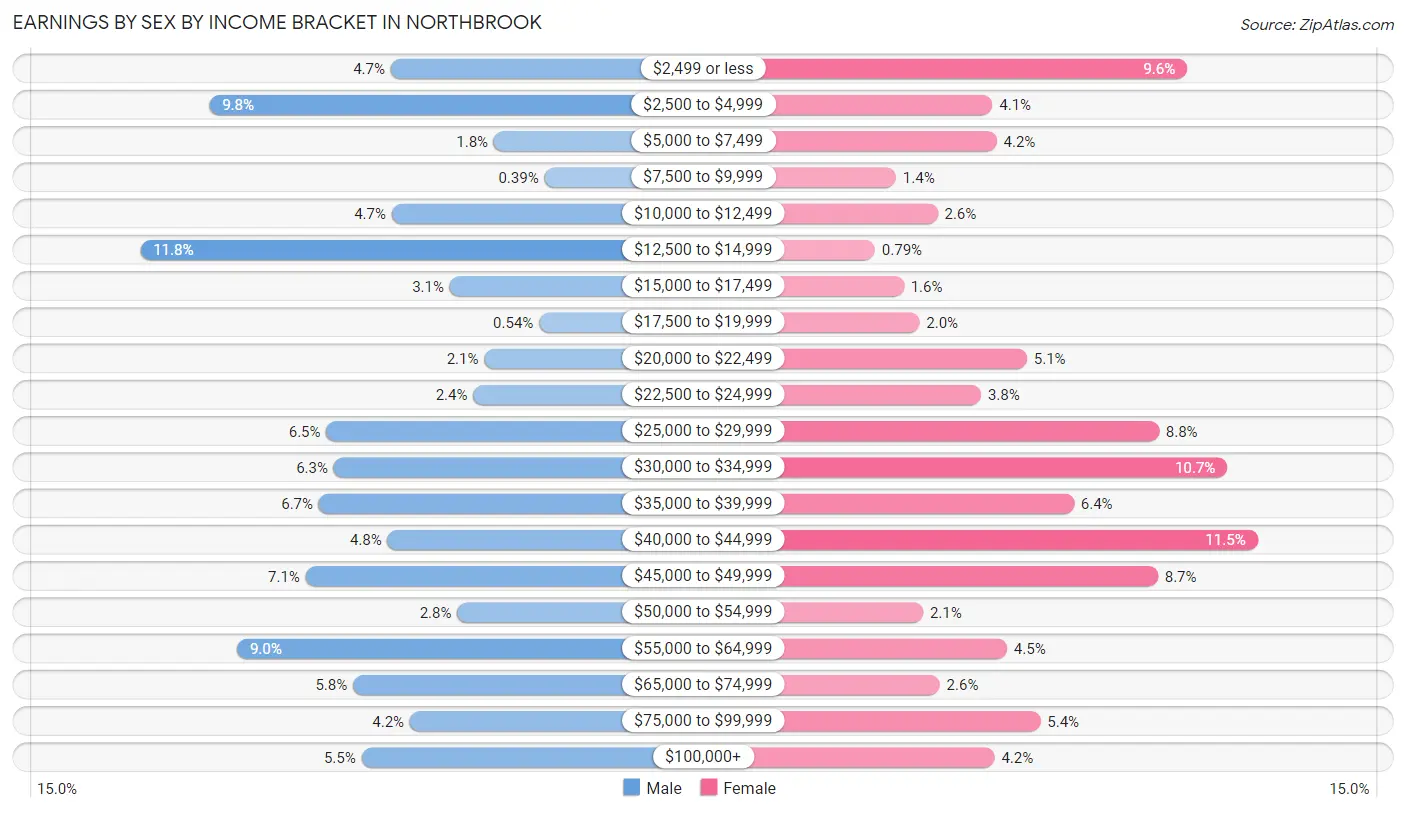
Earnings by Sex by Income Bracket in Northbrook
The most common earnings brackets in Northbrook are $12,500 to $14,999 for men (389 | 11.7%) and $40,000 to $44,999 for women (367 | 11.5%).
| Income | Male | Female |
| $2,499 or less | 156 (4.7%) | 304 (9.6%) |
| $2,500 to $4,999 | 325 (9.8%) | 130 (4.1%) |
| $5,000 to $7,499 | 60 (1.8%) | 134 (4.2%) |
| $7,500 to $9,999 | 13 (0.4%) | 44 (1.4%) |
| $10,000 to $12,499 | 155 (4.7%) | 81 (2.5%) |
| $12,500 to $14,999 | 389 (11.7%) | 25 (0.8%) |
| $15,000 to $17,499 | 101 (3.0%) | 51 (1.6%) |
| $17,500 to $19,999 | 18 (0.5%) | 65 (2.0%) |
| $20,000 to $22,499 | 69 (2.1%) | 161 (5.1%) |
| $22,500 to $24,999 | 79 (2.4%) | 120 (3.8%) |
| $25,000 to $29,999 | 216 (6.5%) | 279 (8.8%) |
| $30,000 to $34,999 | 209 (6.3%) | 340 (10.7%) |
| $35,000 to $39,999 | 223 (6.7%) | 203 (6.4%) |
| $40,000 to $44,999 | 159 (4.8%) | 367 (11.5%) |
| $45,000 to $49,999 | 235 (7.1%) | 278 (8.7%) |
| $50,000 to $54,999 | 94 (2.8%) | 68 (2.1%) |
| $55,000 to $64,999 | 299 (9.0%) | 143 (4.5%) |
| $65,000 to $74,999 | 191 (5.8%) | 83 (2.6%) |
| $75,000 to $99,999 | 138 (4.2%) | 173 (5.4%) |
| $100,000+ | 183 (5.5%) | 132 (4.2%) |
| Total | 3,312 (100.0%) | 3,181 (100.0%) |
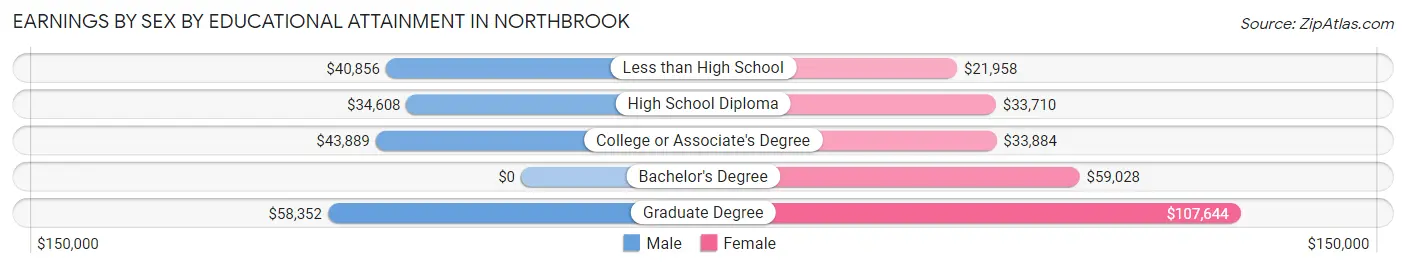
Earnings by Sex by Educational Attainment in Northbrook
Average earnings in Northbrook are $36,609 for men and $34,902 for women, a difference of 4.7%. Men with an educational attainment of graduate degree enjoy the highest average annual earnings of $58,352, while those with high school diploma education earn the least with $34,608. Women with an educational attainment of graduate degree earn the most with the average annual earnings of $107,644, while those with less than high school education have the smallest earnings of $21,958.
| Educational Attainment | Male Income | Female Income |
| Less than High School | $40,856 | $21,958 |
| High School Diploma | $34,608 | $33,710 |
| College or Associate's Degree | $43,889 | $33,884 |
| Bachelor's Degree | - | - |
| Graduate Degree | $58,352 | $107,644 |
| Total | $36,609 | $34,902 |
Family Income in Northbrook
Family Income Brackets in Northbrook
According to the Northbrook family income data, there are 685 families falling into the $50,000 to $74,999 income range, which is the most common income bracket and makes up 24.4% of all families. Conversely, the less than $10,000 income bracket is the least frequent group with only 39 families (1.4%) belonging to this category.
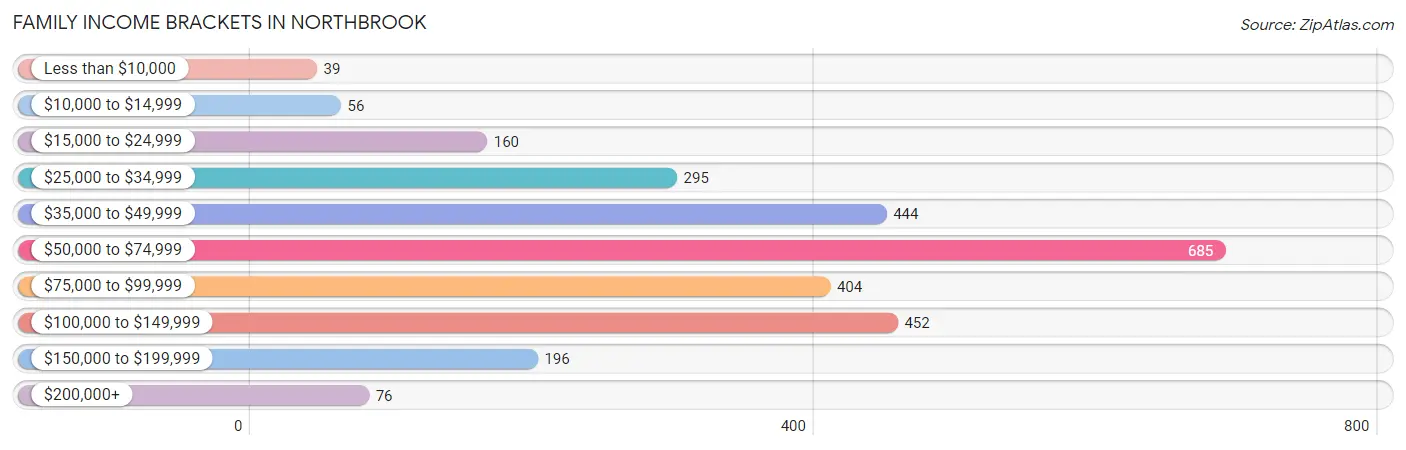
| Income Bracket | # Families | % Families |
| Less than $10,000 | 39 | 1.4% |
| $10,000 to $14,999 | 56 | 2.0% |
| $15,000 to $24,999 | 160 | 5.7% |
| $25,000 to $34,999 | 295 | 10.5% |
| $35,000 to $49,999 | 444 | 15.8% |
| $50,000 to $74,999 | 685 | 24.4% |
| $75,000 to $99,999 | 404 | 14.4% |
| $100,000 to $149,999 | 452 | 16.1% |
| $150,000 to $199,999 | 196 | 7.0% |
| $200,000+ | 76 | 2.7% |
Family Income by Famaliy Size in Northbrook
5-person families (211 | 7.5%) account for the highest median family income in Northbrook with $93,286 per family, while 2-person families (1,229 | 43.8%) have the highest median income of $33,213 per family member.
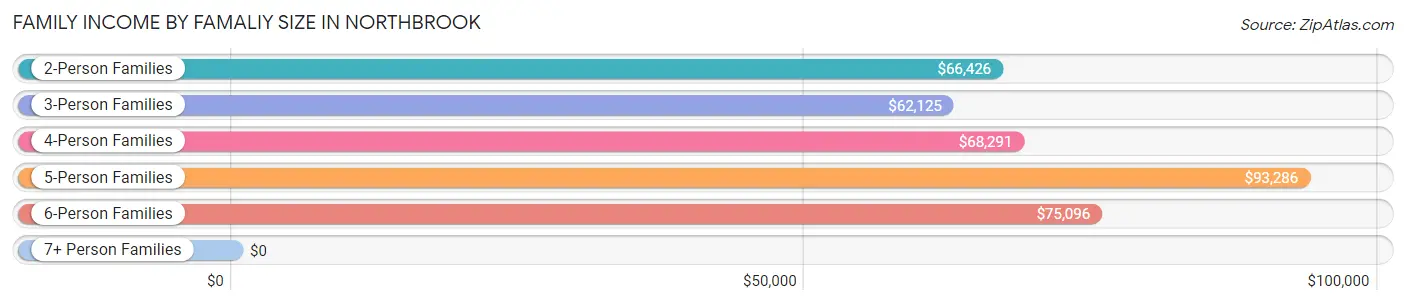
| Income Bracket | # Families | Median Income |
| 2-Person Families | 1,229 (43.8%) | $66,426 |
| 3-Person Families | 805 (28.7%) | $62,125 |
| 4-Person Families | 458 (16.3%) | $68,291 |
| 5-Person Families | 211 (7.5%) | $93,286 |
| 6-Person Families | 87 (3.1%) | $75,096 |
| 7+ Person Families | 17 (0.6%) | $0 |
| Total | 2,807 (100.0%) | $67,661 |
Family Income by Number of Earners in Northbrook
The median family income in Northbrook is $67,661, with families comprising 3+ earners (404) having the highest median family income of $93,427, while families with no earners (335) have the lowest median family income of $40,511, accounting for 14.4% and 11.9% of families, respectively.
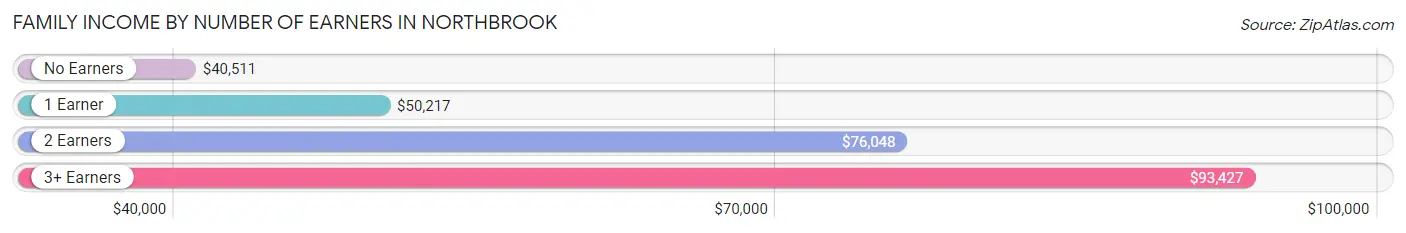
| Number of Earners | # Families | Median Income |
| No Earners | 335 (11.9%) | $40,511 |
| 1 Earner | 876 (31.2%) | $50,217 |
| 2 Earners | 1,192 (42.5%) | $76,048 |
| 3+ Earners | 404 (14.4%) | $93,427 |
| Total | 2,807 (100.0%) | $67,661 |
Household Income in Northbrook
Household Income Brackets in Northbrook
With 971 households falling in the category, the $50,000 to $74,999 income range is the most frequent in Northbrook, accounting for 22.7% of all households. In contrast, only 128 households (3.0%) fall into the $10,000 to $14,999 income bracket, making it the least populous group.
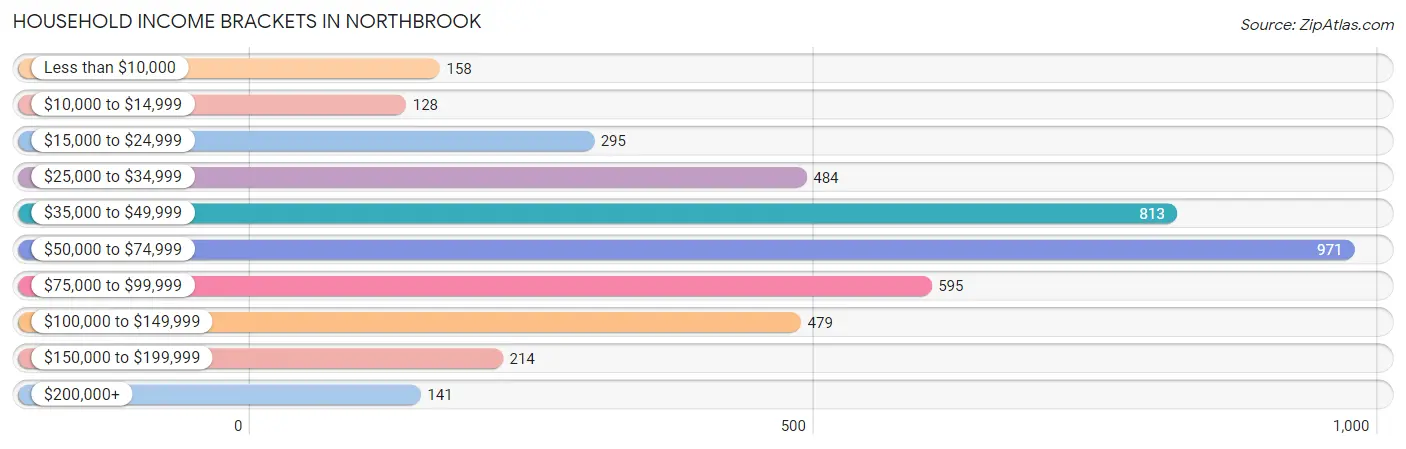
| Income Bracket | # Households | % Households |
| Less than $10,000 | 158 | 3.7% |
| $10,000 to $14,999 | 128 | 3.0% |
| $15,000 to $24,999 | 295 | 6.9% |
| $25,000 to $34,999 | 484 | 11.3% |
| $35,000 to $49,999 | 813 | 19.0% |
| $50,000 to $74,999 | 971 | 22.7% |
| $75,000 to $99,999 | 595 | 13.9% |
| $100,000 to $149,999 | 479 | 11.2% |
| $150,000 to $199,999 | 214 | 5.0% |
| $200,000+ | 141 | 3.3% |
Household Income by Householder Age in Northbrook
The median household income in Northbrook is $55,710, with the highest median household income of $68,274 found in the 25 to 44 years age bracket for the primary householder. A total of 1,508 households (35.2%) fall into this category. Meanwhile, the 15 to 24 years age bracket for the primary householder has the lowest median household income of $0, with 209 households (4.9%) in this group.
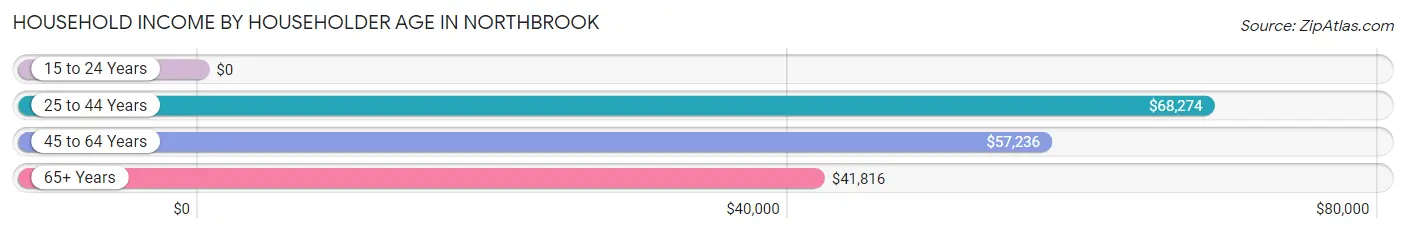
| Income Bracket | # Households | Median Income |
| 15 to 24 Years | 209 (4.9%) | $0 |
| 25 to 44 Years | 1,508 (35.2%) | $68,274 |
| 45 to 64 Years | 1,635 (38.2%) | $57,236 |
| 65+ Years | 927 (21.7%) | $41,816 |
| Total | 4,279 (100.0%) | $55,710 |
Poverty in Northbrook
Income Below Poverty by Sex and Age in Northbrook
With 13.8% poverty level for males and 11.8% for females among the residents of Northbrook, 16 and 17 year old males and 5 year old females are the most vulnerable to poverty, with 28 males (35.4%) and 31 females (48.4%) in their respective age groups living below the poverty level.
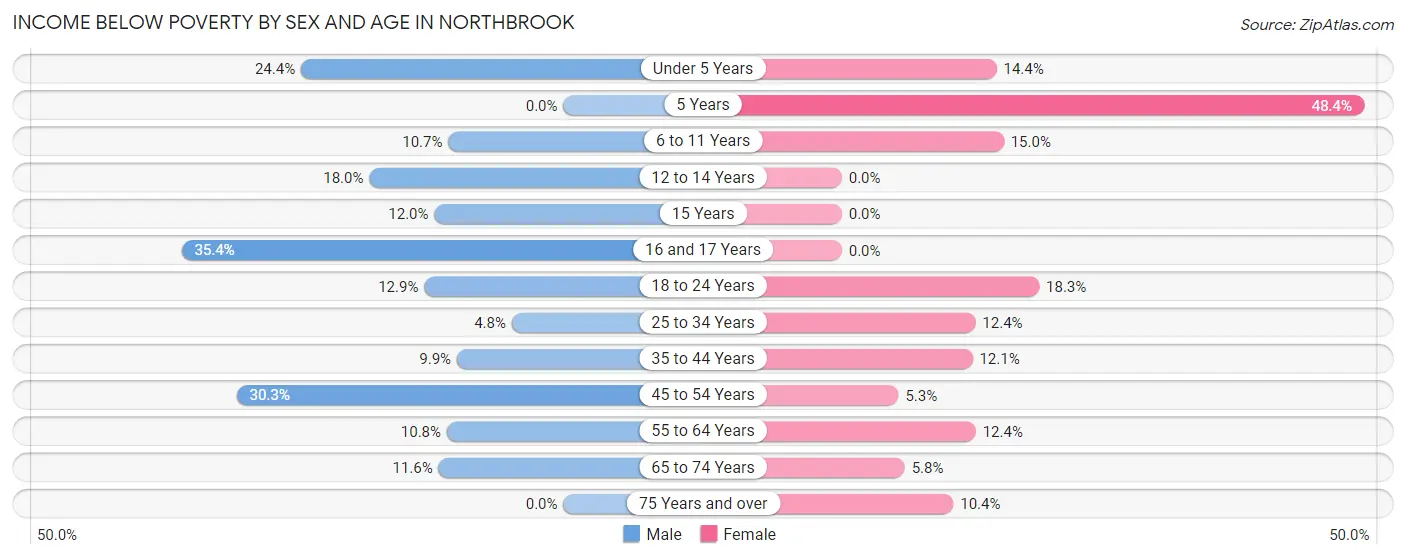
| Age Bracket | Male | Female |
| Under 5 Years | 93 (24.3%) | 53 (14.4%) |
| 5 Years | 0 (0.0%) | 31 (48.4%) |
| 6 to 11 Years | 63 (10.7%) | 78 (15.0%) |
| 12 to 14 Years | 49 (18.0%) | 0 (0.0%) |
| 15 Years | 14 (12.0%) | 0 (0.0%) |
| 16 and 17 Years | 28 (35.4%) | 0 (0.0%) |
| 18 to 24 Years | 74 (12.9%) | 89 (18.3%) |
| 25 to 34 Years | 41 (4.8%) | 92 (12.4%) |
| 35 to 44 Years | 75 (9.9%) | 87 (12.1%) |
| 45 to 54 Years | 256 (30.3%) | 34 (5.3%) |
| 55 to 64 Years | 67 (10.8%) | 105 (12.4%) |
| 65 to 74 Years | 41 (11.6%) | 25 (5.8%) |
| 75 Years and over | 0 (0.0%) | 44 (10.3%) |
| Total | 801 (13.8%) | 638 (11.8%) |
Income Above Poverty by Sex and Age in Northbrook
According to the poverty statistics in Northbrook, males aged 5 years and females aged 12 to 14 years are the age groups that are most secure financially, with 100.0% of males and 100.0% of females in these age groups living above the poverty line.
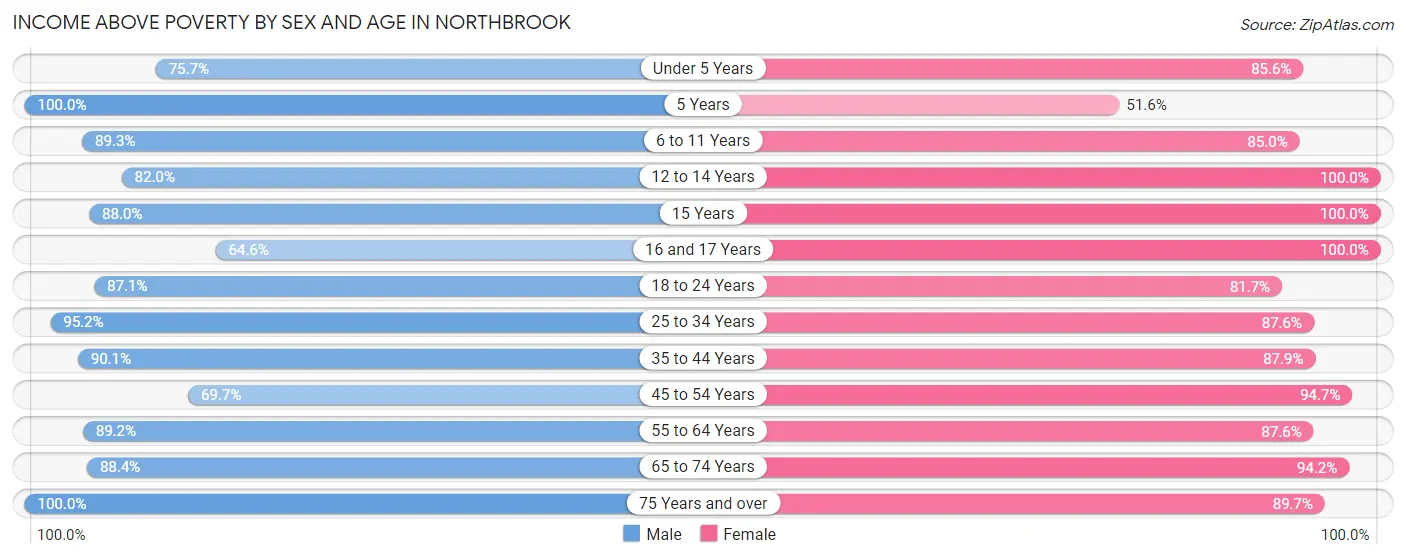
| Age Bracket | Male | Female |
| Under 5 Years | 289 (75.6%) | 316 (85.6%) |
| 5 Years | 92 (100.0%) | 33 (51.6%) |
| 6 to 11 Years | 527 (89.3%) | 441 (85.0%) |
| 12 to 14 Years | 223 (82.0%) | 89 (100.0%) |
| 15 Years | 103 (88.0%) | 23 (100.0%) |
| 16 and 17 Years | 51 (64.6%) | 50 (100.0%) |
| 18 to 24 Years | 499 (87.1%) | 397 (81.7%) |
| 25 to 34 Years | 817 (95.2%) | 650 (87.6%) |
| 35 to 44 Years | 684 (90.1%) | 630 (87.9%) |
| 45 to 54 Years | 588 (69.7%) | 612 (94.7%) |
| 55 to 64 Years | 553 (89.2%) | 740 (87.6%) |
| 65 to 74 Years | 313 (88.4%) | 403 (94.2%) |
| 75 Years and over | 256 (100.0%) | 381 (89.6%) |
| Total | 4,995 (86.2%) | 4,765 (88.2%) |
Income Below Poverty Among Married-Couple Families in Northbrook
The poverty statistics for married-couple families in Northbrook show that 4.6% or 72 of the total 1,579 families live below the poverty line. Families with 3 or 4 children have the highest poverty rate of 14.4%, comprising of 18 families. On the other hand, families with 1 or 2 children have the lowest poverty rate of 0.0%, which includes 0 families.
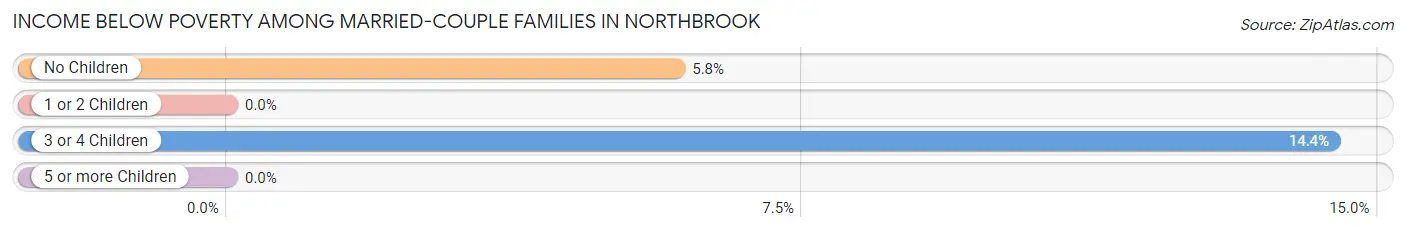
| Children | Above Poverty | Below Poverty |
| No Children | 871 (94.2%) | 54 (5.8%) |
| 1 or 2 Children | 529 (100.0%) | 0 (0.0%) |
| 3 or 4 Children | 107 (85.6%) | 18 (14.4%) |
| 5 or more Children | 0 (0.0%) | 0 (0.0%) |
| Total | 1,507 (95.4%) | 72 (4.6%) |
Income Below Poverty Among Single-Parent Households in Northbrook
According to the poverty data in Northbrook, 1.3% or 4 single-father households and 13.8% or 127 single-mother households are living below the poverty line. Among single-father households, those with no children have the highest poverty rate, with 4 households (1.7%) experiencing poverty. Likewise, among single-mother households, those with 3 or 4 children have the highest poverty rate, with 70 households (42.9%) falling below the poverty line.
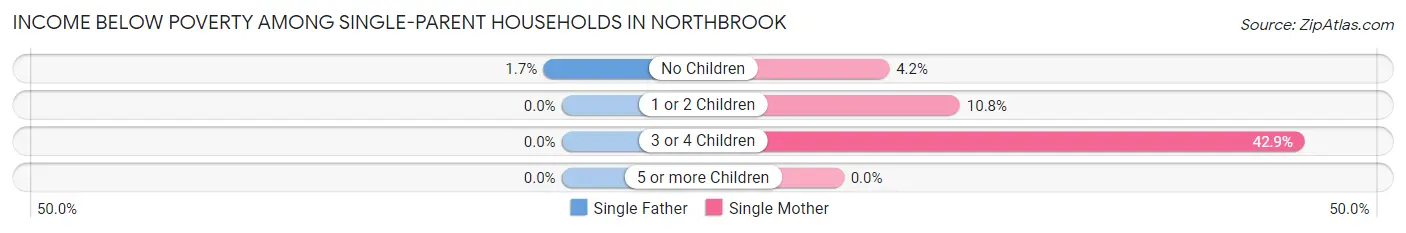
| Children | Single Father | Single Mother |
| No Children | 4 (1.7%) | 16 (4.2%) |
| 1 or 2 Children | 0 (0.0%) | 41 (10.8%) |
| 3 or 4 Children | 0 (0.0%) | 70 (42.9%) |
| 5 or more Children | 0 (0.0%) | 0 (0.0%) |
| Total | 4 (1.3%) | 127 (13.8%) |
Income Below Poverty Among Married-Couple vs Single-Parent Households in Northbrook
The poverty data for Northbrook shows that 72 of the married-couple family households (4.6%) and 131 of the single-parent households (10.7%) are living below the poverty level. Within the married-couple family households, those with 3 or 4 children have the highest poverty rate, with 18 households (14.4%) falling below the poverty line. Among the single-parent households, those with 3 or 4 children have the highest poverty rate, with 70 household (42.9%) living below poverty.
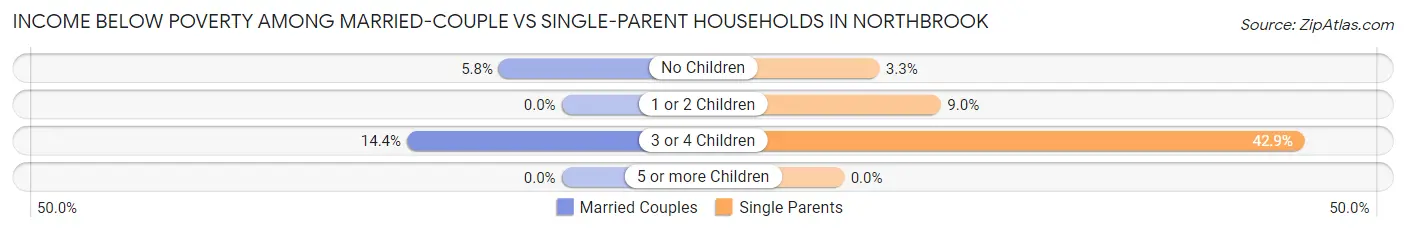
| Children | Married-Couple Families | Single-Parent Households |
| No Children | 54 (5.8%) | 20 (3.3%) |
| 1 or 2 Children | 0 (0.0%) | 41 (9.0%) |
| 3 or 4 Children | 18 (14.4%) | 70 (42.9%) |
| 5 or more Children | 0 (0.0%) | 0 (0.0%) |
| Total | 72 (4.6%) | 131 (10.7%) |
Race in Northbrook
The most populous races in Northbrook are White / Caucasian (4,955 | 44.3%), Black / African American (4,714 | 42.1%), and Two or more Races (912 | 8.1%).
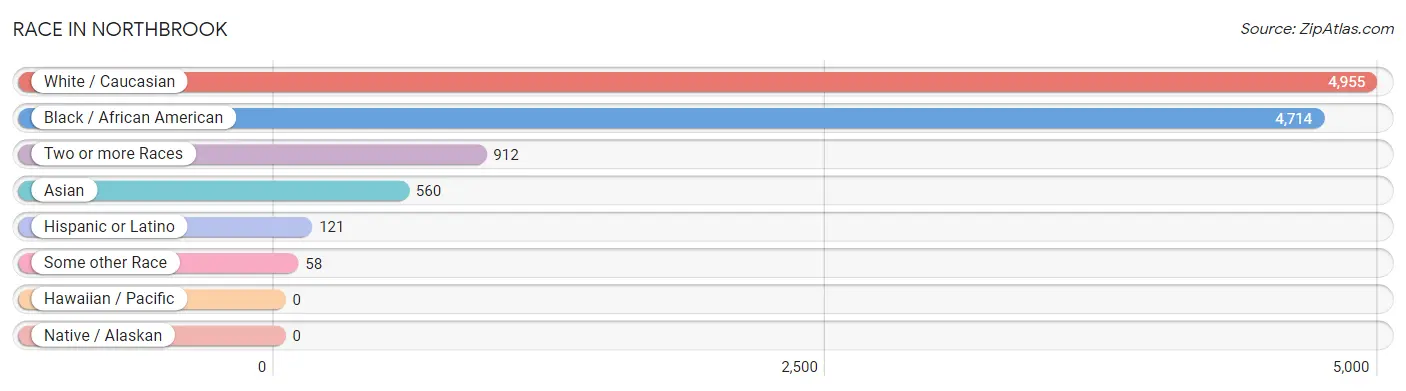
| Race | # Population | % Population |
| Asian | 560 | 5.0% |
| Black / African American | 4,714 | 42.1% |
| Hawaiian / Pacific | 0 | 0.0% |
| Hispanic or Latino | 121 | 1.1% |
| Native / Alaskan | 0 | 0.0% |
| White / Caucasian | 4,955 | 44.3% |
| Two or more Races | 912 | 8.1% |
| Some other Race | 58 | 0.5% |
| Total | 11,199 | 100.0% |
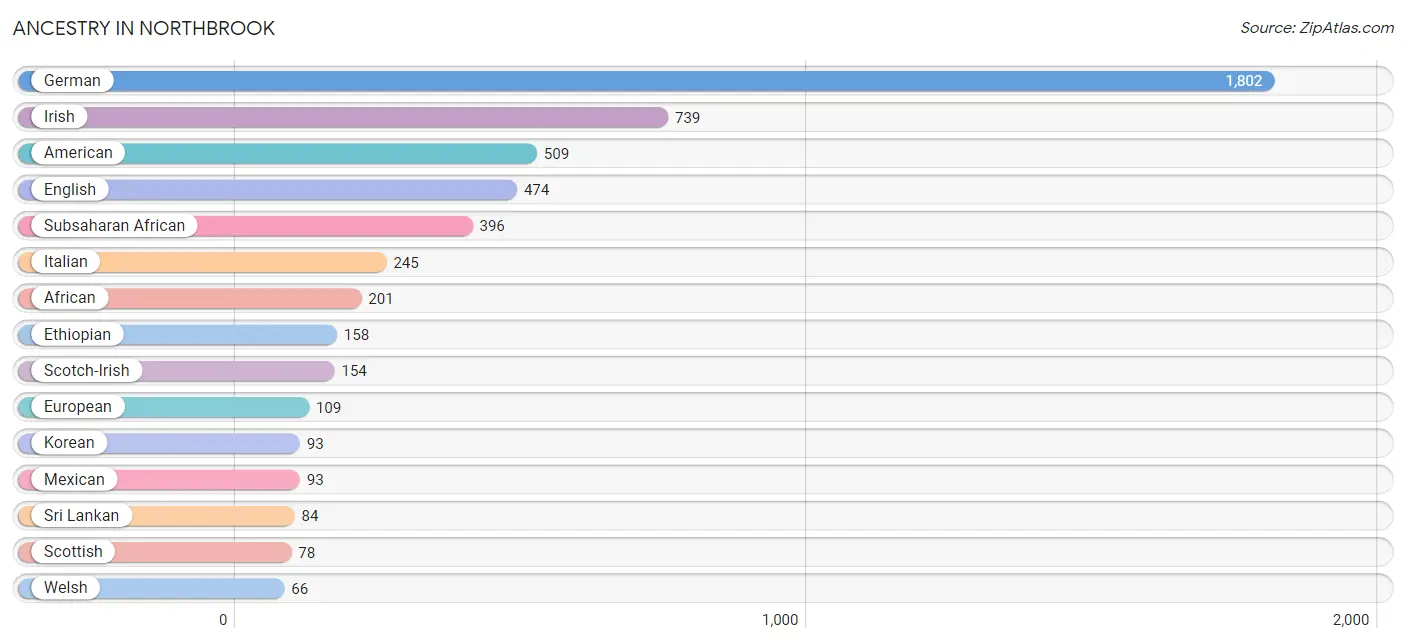
Ancestry in Northbrook
The most populous ancestries reported in Northbrook are German (1,802 | 16.1%), Irish (739 | 6.6%), American (509 | 4.5%), English (474 | 4.2%), and Subsaharan African (396 | 3.5%), together accounting for 35.0% of all Northbrook residents.
| Ancestry | # Population | % Population |
| African | 201 | 1.8% |
| American | 509 | 4.5% |
| British | 11 | 0.1% |
| Burmese | 12 | 0.1% |
| Canadian | 27 | 0.2% |
| Central American | 26 | 0.2% |
| Cherokee | 41 | 0.4% |
| Colombian | 2 | 0.0% |
| Croatian | 9 | 0.1% |
| Czech | 33 | 0.3% |
| Dutch | 31 | 0.3% |
| Eastern European | 1 | 0.0% |
| English | 474 | 4.2% |
| Ethiopian | 158 | 1.4% |
| European | 109 | 1.0% |
| Filipino | 11 | 0.1% |
| French | 65 | 0.6% |
| German | 1,802 | 16.1% |
| Greek | 11 | 0.1% |
| Hungarian | 15 | 0.1% |
| Indian (Asian) | 63 | 0.6% |
| Iranian | 1 | 0.0% |
| Irish | 739 | 6.6% |
| Israeli | 21 | 0.2% |
| Italian | 245 | 2.2% |
| Korean | 93 | 0.8% |
| Lithuanian | 13 | 0.1% |
| Mexican | 93 | 0.8% |
| Norwegian | 26 | 0.2% |
| Pennsylvania German | 24 | 0.2% |
| Polish | 45 | 0.4% |
| Salvadoran | 26 | 0.2% |
| Samoan | 9 | 0.1% |
| Scandinavian | 18 | 0.2% |
| Scotch-Irish | 154 | 1.4% |
| Scottish | 78 | 0.7% |
| Senegalese | 40 | 0.4% |
| Slovak | 27 | 0.2% |
| South American | 2 | 0.0% |
| Sri Lankan | 84 | 0.7% |
| Subsaharan African | 396 | 3.5% |
| Swedish | 29 | 0.3% |
| Thai | 9 | 0.1% |
| Welsh | 66 | 0.6% | View All 44 Rows |
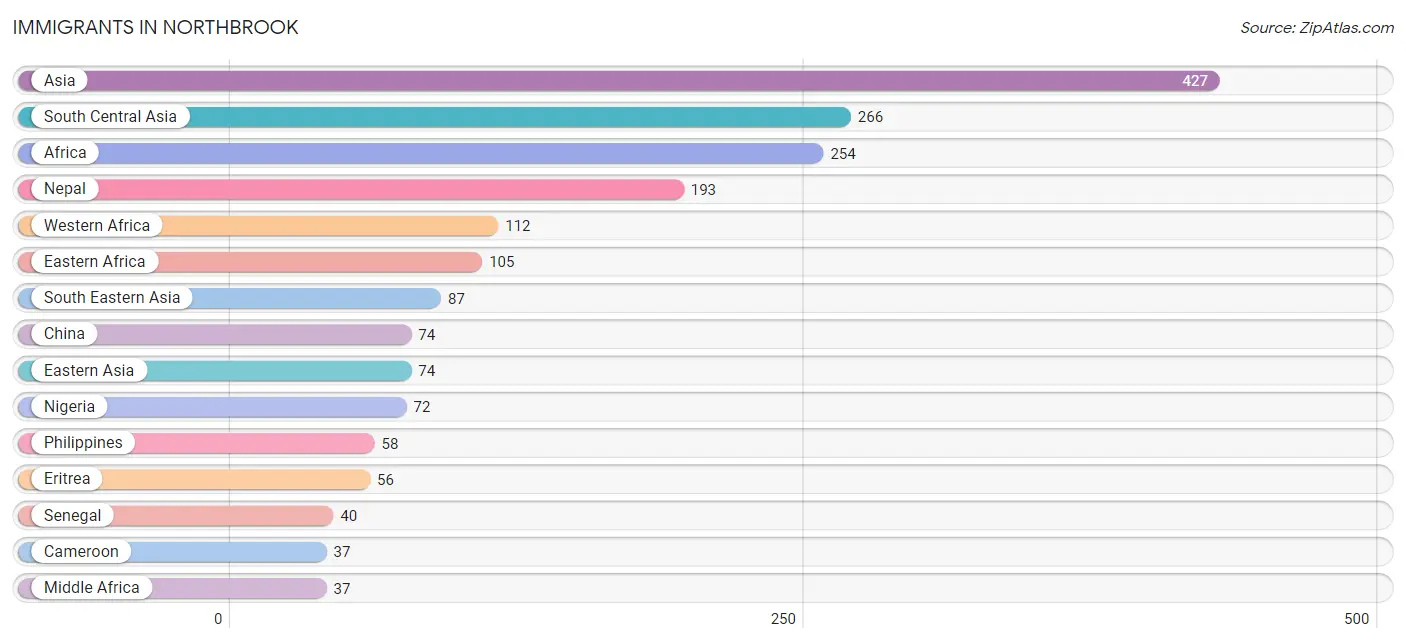
Immigrants in Northbrook
The most numerous immigrant groups reported in Northbrook came from Asia (427 | 3.8%), South Central Asia (266 | 2.4%), Africa (254 | 2.3%), Nepal (193 | 1.7%), and Western Africa (112 | 1.0%), together accounting for 11.2% of all Northbrook residents.
| Immigration Origin | # Population | % Population |
| Africa | 254 | 2.3% |
| Asia | 427 | 3.8% |
| Belarus | 13 | 0.1% |
| Cameroon | 37 | 0.3% |
| Canada | 10 | 0.1% |
| Central America | 8 | 0.1% |
| China | 74 | 0.7% |
| Colombia | 2 | 0.0% |
| Eastern Africa | 105 | 0.9% |
| Eastern Asia | 74 | 0.7% |
| Eastern Europe | 26 | 0.2% |
| El Salvador | 8 | 0.1% |
| Eritrea | 56 | 0.5% |
| Europe | 26 | 0.2% |
| Latin America | 10 | 0.1% |
| Lithuania | 13 | 0.1% |
| Middle Africa | 37 | 0.3% |
| Nepal | 193 | 1.7% |
| Nigeria | 72 | 0.6% |
| Philippines | 58 | 0.5% |
| Senegal | 40 | 0.4% |
| South America | 2 | 0.0% |
| South Central Asia | 266 | 2.4% |
| South Eastern Asia | 87 | 0.8% |
| Taiwan | 11 | 0.1% |
| Vietnam | 29 | 0.3% |
| Western Africa | 112 | 1.0% | View All 27 Rows |
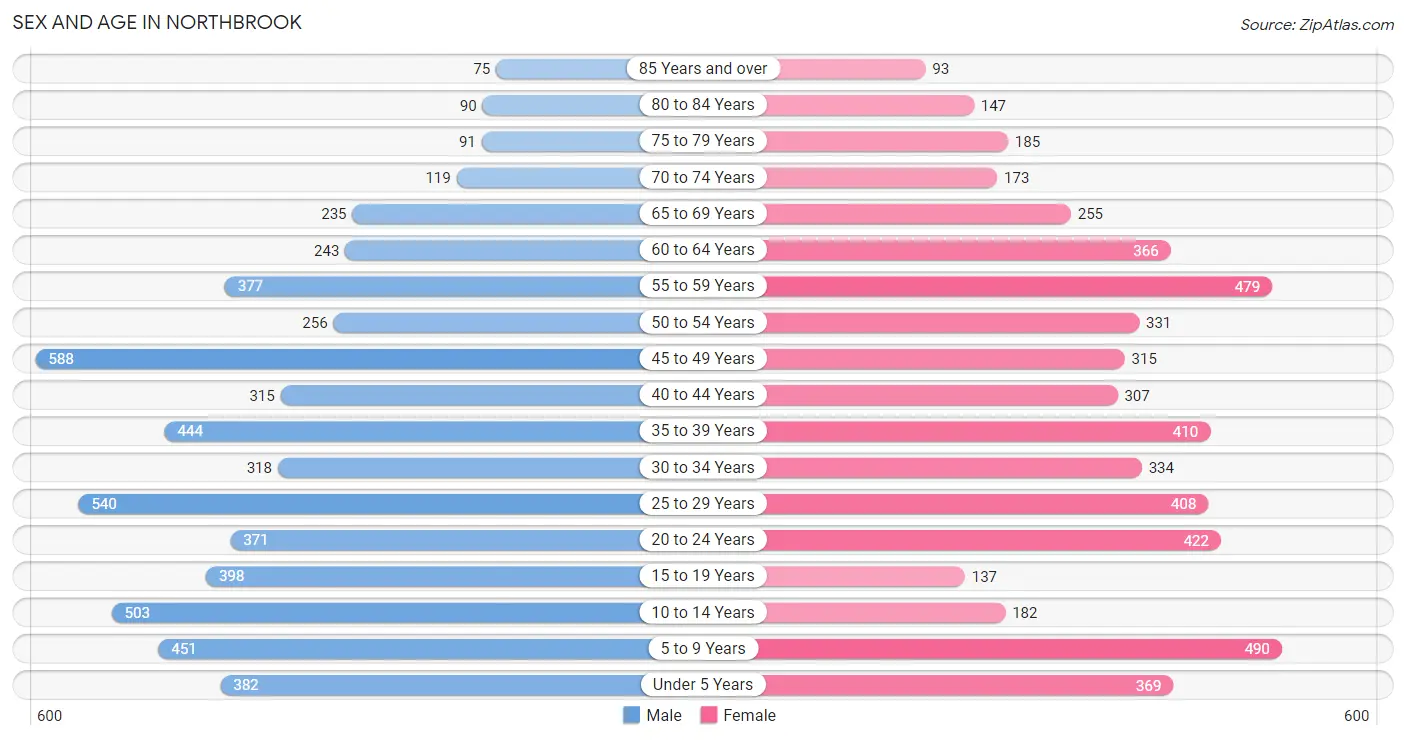
Sex and Age in Northbrook
Sex and Age in Northbrook
The most populous age groups in Northbrook are 45 to 49 Years (588 | 10.1%) for men and 5 to 9 Years (490 | 9.1%) for women.
| Age Bracket | Male | Female |
| Under 5 Years | 382 (6.6%) | 369 (6.8%) |
| 5 to 9 Years | 451 (7.8%) | 490 (9.1%) |
| 10 to 14 Years | 503 (8.7%) | 182 (3.4%) |
| 15 to 19 Years | 398 (6.9%) | 137 (2.5%) |
| 20 to 24 Years | 371 (6.4%) | 422 (7.8%) |
| 25 to 29 Years | 540 (9.3%) | 408 (7.5%) |
| 30 to 34 Years | 318 (5.5%) | 334 (6.2%) |
| 35 to 39 Years | 444 (7.7%) | 410 (7.6%) |
| 40 to 44 Years | 315 (5.4%) | 307 (5.7%) |
| 45 to 49 Years | 588 (10.1%) | 315 (5.8%) |
| 50 to 54 Years | 256 (4.4%) | 331 (6.1%) |
| 55 to 59 Years | 377 (6.5%) | 479 (8.9%) |
| 60 to 64 Years | 243 (4.2%) | 366 (6.8%) |
| 65 to 69 Years | 235 (4.1%) | 255 (4.7%) |
| 70 to 74 Years | 119 (2.1%) | 173 (3.2%) |
| 75 to 79 Years | 91 (1.6%) | 185 (3.4%) |
| 80 to 84 Years | 90 (1.5%) | 147 (2.7%) |
| 85 Years and over | 75 (1.3%) | 93 (1.7%) |
| Total | 5,796 (100.0%) | 5,403 (100.0%) |
Families and Households in Northbrook
Median Family Size in Northbrook
The median family size in Northbrook is 3.19 persons per family, with single female/mother families (919 | 32.7%) accounting for the largest median family size of 3.32 persons per family. On the other hand, single male/father families (309 | 11.0%) represent the smallest median family size with 2.21 persons per family.

| Family Type | # Families | Family Size |
| Married-Couple | 1,579 (56.2%) | 3.31 |
| Single Male/Father | 309 (11.0%) | 2.21 |
| Single Female/Mother | 919 (32.7%) | 3.32 |
| Total Families | 2,807 (100.0%) | 3.19 |
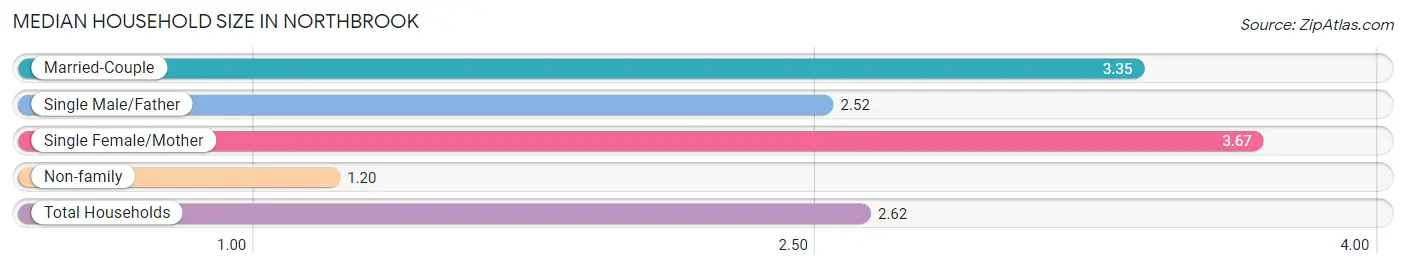
Median Household Size in Northbrook
The median household size in Northbrook is 2.62 persons per household, with single female/mother households (919 | 21.5%) accounting for the largest median household size of 3.67 persons per household. non-family households (1,472 | 34.4%) represent the smallest median household size with 1.20 persons per household.
| Household Type | # Households | Household Size |
| Married-Couple | 1,579 (36.9%) | 3.35 |
| Single Male/Father | 309 (7.2%) | 2.52 |
| Single Female/Mother | 919 (21.5%) | 3.67 |
| Non-family | 1,472 (34.4%) | 1.20 |
| Total Households | 4,279 (100.0%) | 2.62 |
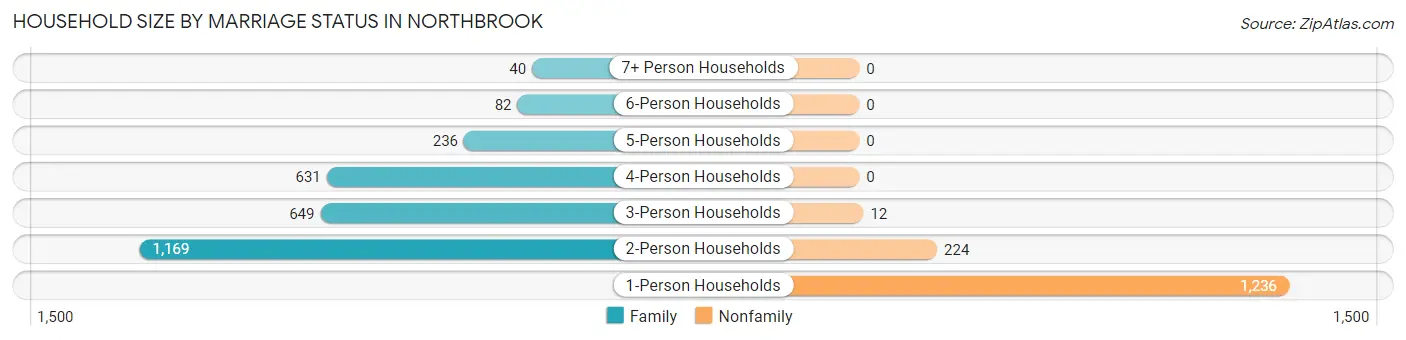
Household Size by Marriage Status in Northbrook
Out of a total of 4,279 households in Northbrook, 2,807 (65.6%) are family households, while 1,472 (34.4%) are nonfamily households. The most numerous type of family households are 2-person households, comprising 1,169, and the most common type of nonfamily households are 1-person households, comprising 1,236.
| Household Size | Family Households | Nonfamily Households |
| 1-Person Households | - | 1,236 (28.9%) |
| 2-Person Households | 1,169 (27.3%) | 224 (5.2%) |
| 3-Person Households | 649 (15.2%) | 12 (0.3%) |
| 4-Person Households | 631 (14.7%) | 0 (0.0%) |
| 5-Person Households | 236 (5.5%) | 0 (0.0%) |
| 6-Person Households | 82 (1.9%) | 0 (0.0%) |
| 7+ Person Households | 40 (0.9%) | 0 (0.0%) |
| Total | 2,807 (65.6%) | 1,472 (34.4%) |
Female Fertility in Northbrook
Fertility by Age in Northbrook
Average fertility rate in Northbrook is 105.0 births per 1,000 women. Women in the age bracket of 20 to 34 years have the highest fertility rate with 164.0 births per 1,000 women. Women in the age bracket of 20 to 34 years acount for 75.2% of all women with births.
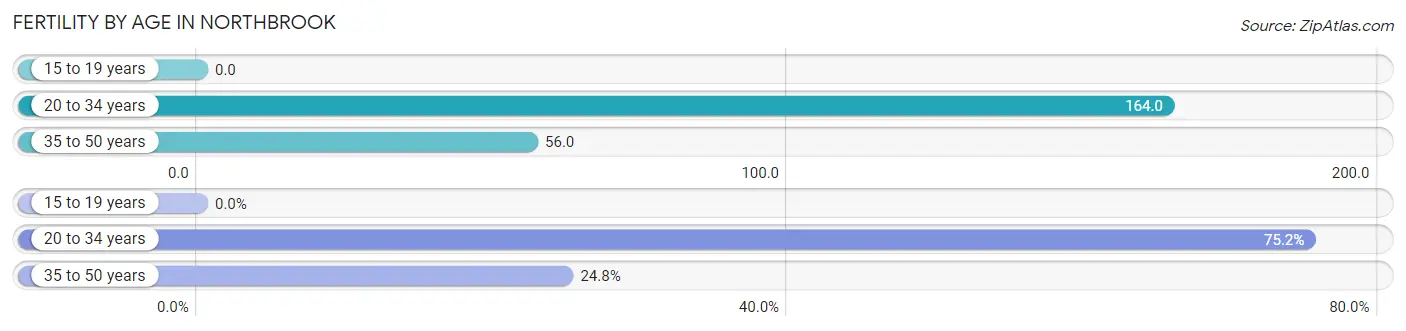
| Age Bracket | Women with Births | Births / 1,000 Women |
| 15 to 19 years | 0 (0.0%) | 0.0 |
| 20 to 34 years | 191 (75.2%) | 164.0 |
| 35 to 50 years | 63 (24.8%) | 56.0 |
| Total | 254 (100.0%) | 105.0 |
Fertility by Age by Marriage Status in Northbrook
27.6% of women with births (254) in Northbrook are married. The highest percentage of unmarried women with births falls into 20 to 34 years age bracket with 89.0% of them unmarried at the time of birth, while the lowest percentage of unmarried women with births belong to 35 to 50 years age bracket with 22.2% of them unmarried.
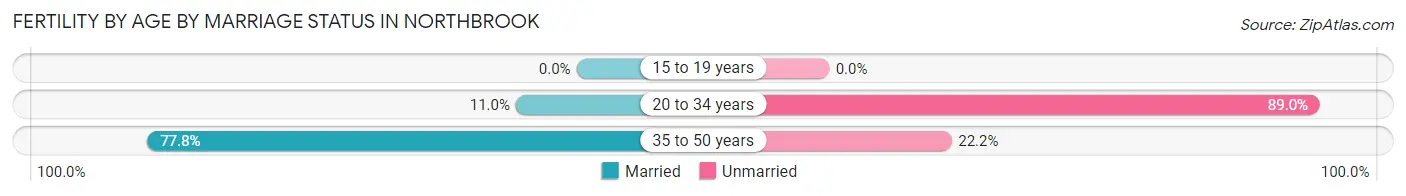
| Age Bracket | Married | Unmarried |
| 15 to 19 years | 0 (0.0%) | 0 (0.0%) |
| 20 to 34 years | 21 (11.0%) | 170 (89.0%) |
| 35 to 50 years | 49 (77.8%) | 14 (22.2%) |
| Total | 70 (27.6%) | 184 (72.4%) |
Fertility by Education in Northbrook
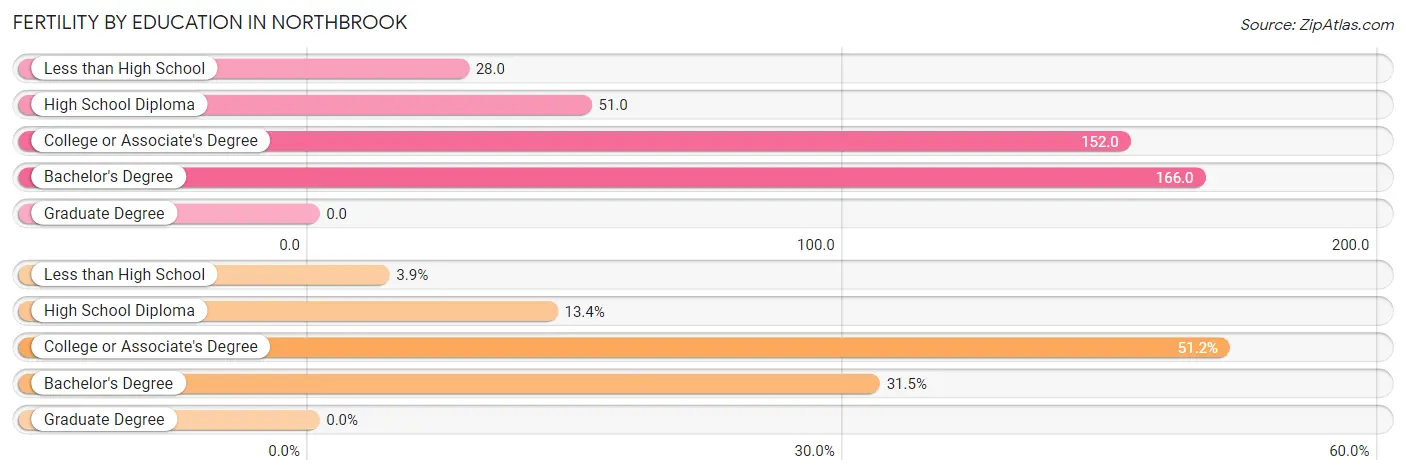
| Educational Attainment | Women with Births | Births / 1,000 Women |
| Less than High School | 10 (3.9%) | 28.0 |
| High School Diploma | 34 (13.4%) | 51.0 |
| College or Associate's Degree | 130 (51.2%) | 152.0 |
| Bachelor's Degree | 80 (31.5%) | 166.0 |
| Graduate Degree | 0 (0.0%) | 0.0 |
| Total | 254 (100.0%) | 105.0 |
Fertility by Education by Marriage Status in Northbrook
72.4% of women with births in Northbrook are unmarried. Women with the educational attainment of less than high school are most likely to be married with 100.0% of them married at childbirth, while women with the educational attainment of college or associate's degree are least likely to be married with 100.0% of them unmarried at childbirth.
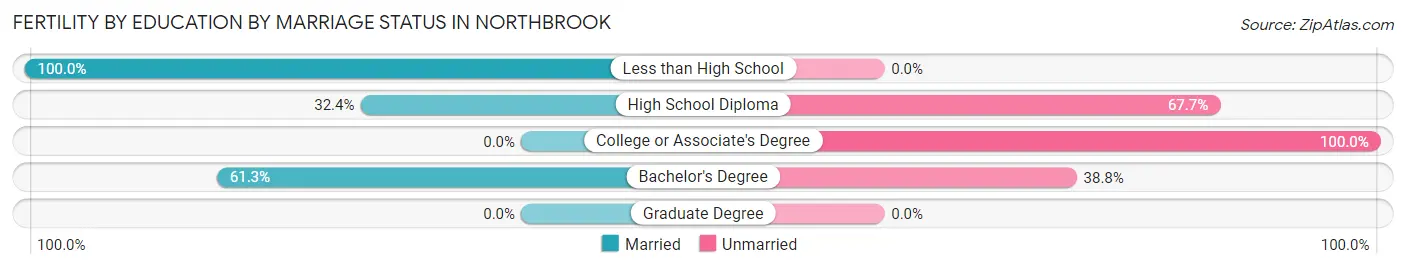
| Educational Attainment | Married | Unmarried |
| Less than High School | 10 (100.0%) | 0 (0.0%) |
| High School Diploma | 11 (32.4%) | 23 (67.6%) |
| College or Associate's Degree | 0 (0.0%) | 130 (100.0%) |
| Bachelor's Degree | 49 (61.3%) | 31 (38.8%) |
| Graduate Degree | 0 (0.0%) | 0 (0.0%) |
| Total | 70 (27.6%) | 184 (72.4%) |
Employment Characteristics in Northbrook
Employment by Class of Employer in Northbrook
Among the 5,477 employed individuals in Northbrook, private company employees (3,968 | 72.5%), not-for-profit organizations (560 | 10.2%), and local government employees (340 | 6.2%) make up the most common classes of employment.
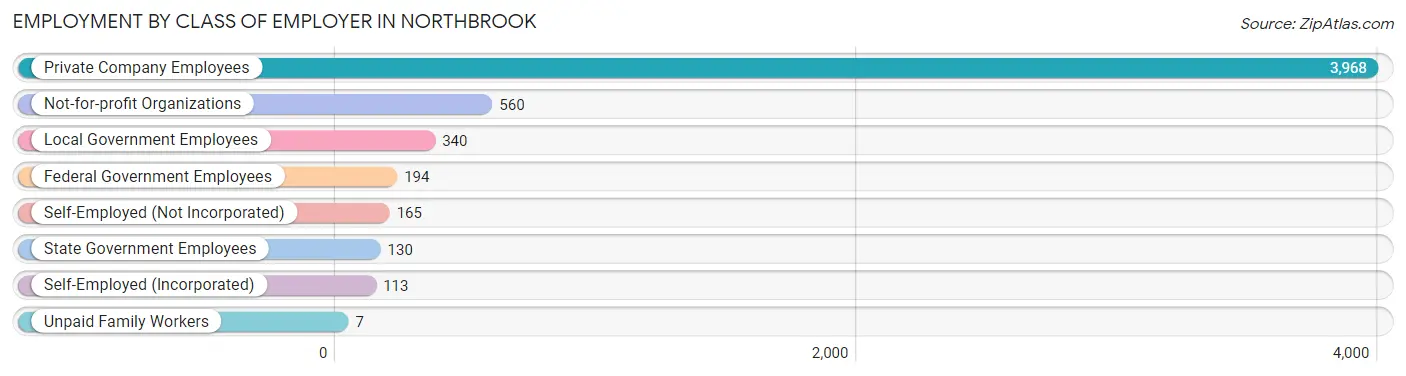
| Employer Class | # Employees | % Employees |
| Private Company Employees | 3,968 | 72.5% |
| Self-Employed (Incorporated) | 113 | 2.1% |
| Self-Employed (Not Incorporated) | 165 | 3.0% |
| Not-for-profit Organizations | 560 | 10.2% |
| Local Government Employees | 340 | 6.2% |
| State Government Employees | 130 | 2.4% |
| Federal Government Employees | 194 | 3.5% |
| Unpaid Family Workers | 7 | 0.1% |
| Total | 5,477 | 100.0% |
Employment Status by Age in Northbrook
According to the labor force statistics for Northbrook, out of the total population over 16 years of age (8,682), 67.9% or 5,895 individuals are in the labor force, with 4.6% or 271 of them unemployed. The age group with the highest labor force participation rate is 30 to 34 years, with 97.1% or 633 individuals in the labor force. Within the labor force, the 16 to 19 years age range has the highest percentage of unemployed individuals, with 26.4% or 61 of them being unemployed.
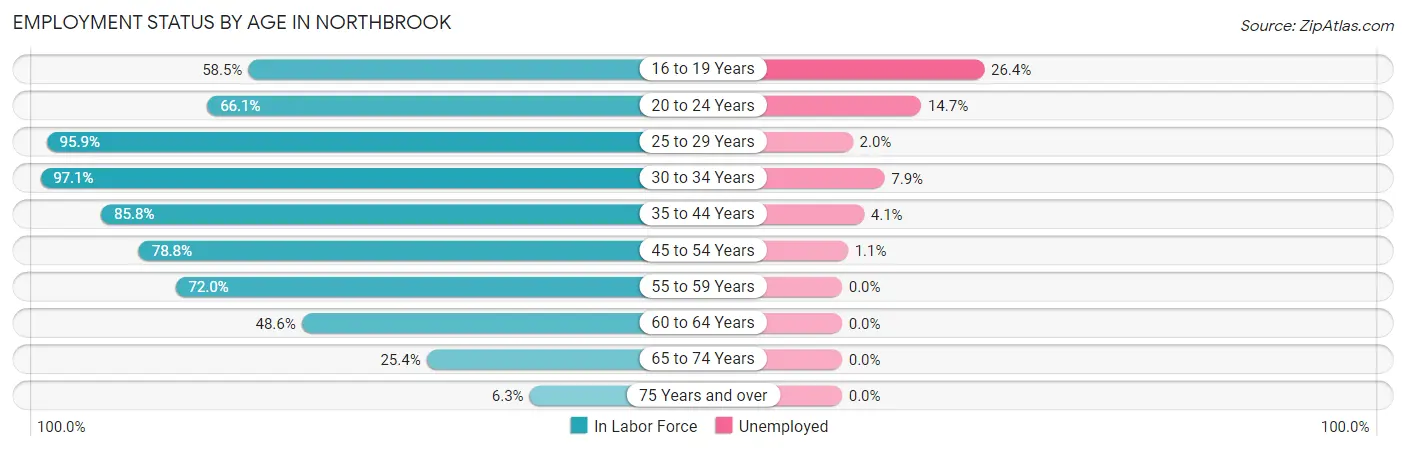
| Age Bracket | In Labor Force | Unemployed |
| 16 to 19 Years | 231 (58.5%) | 61 (26.4%) |
| 20 to 24 Years | 524 (66.1%) | 77 (14.7%) |
| 25 to 29 Years | 909 (95.9%) | 18 (2.0%) |
| 30 to 34 Years | 633 (97.1%) | 50 (7.9%) |
| 35 to 44 Years | 1,266 (85.8%) | 52 (4.1%) |
| 45 to 54 Years | 1,174 (78.8%) | 13 (1.1%) |
| 55 to 59 Years | 616 (72.0%) | 0 (0.0%) |
| 60 to 64 Years | 296 (48.6%) | 0 (0.0%) |
| 65 to 74 Years | 199 (25.4%) | 0 (0.0%) |
| 75 Years and over | 43 (6.3%) | 0 (0.0%) |
| Total | 5,895 (67.9%) | 271 (4.6%) |
Employment Status by Educational Attainment in Northbrook
According to labor force statistics for Northbrook, 81.2% of individuals (4,897) out of the total population between 25 and 64 years of age (6,031) are in the labor force, with 2.7% or 132 of them being unemployed. The group with the highest labor force participation rate are those with the educational attainment of college / associate degree, with 88.8% or 1,636 individuals in the labor force. Within the labor force, individuals with less than high school education have the highest percentage of unemployment, with 5.4% or 27 of them being unemployed.
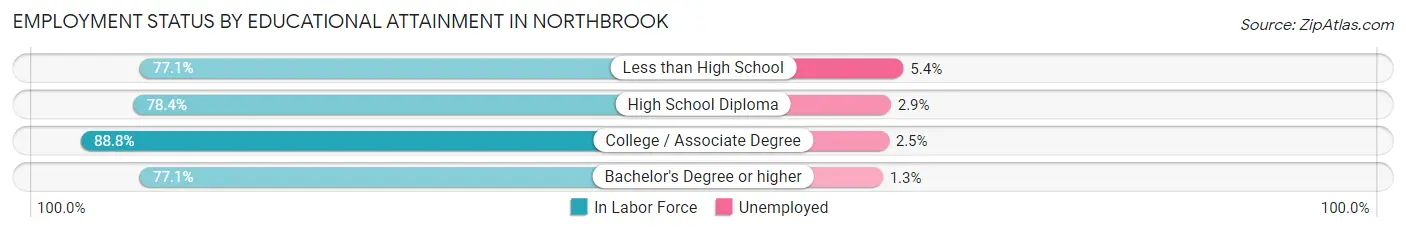
| Educational Attainment | In Labor Force | Unemployed |
| Less than High School | 497 (77.1%) | 35 (5.4%) |
| High School Diploma | 1,786 (78.4%) | 66 (2.9%) |
| College / Associate Degree | 1,636 (88.8%) | 46 (2.5%) |
| Bachelor's Degree or higher | 976 (77.1%) | 16 (1.3%) |
| Total | 4,897 (81.2%) | 163 (2.7%) |
Employment Occupations by Sex in Northbrook
Management, Business, Science and Arts Occupations
The most common Management, Business, Science and Arts occupations in Northbrook are Community & Social Service (472 | 8.4%), Management (451 | 8.0%), Business & Financial (313 | 5.6%), Education Instruction & Library (198 | 3.5%), and Health Diagnosing & Treating (155 | 2.8%).
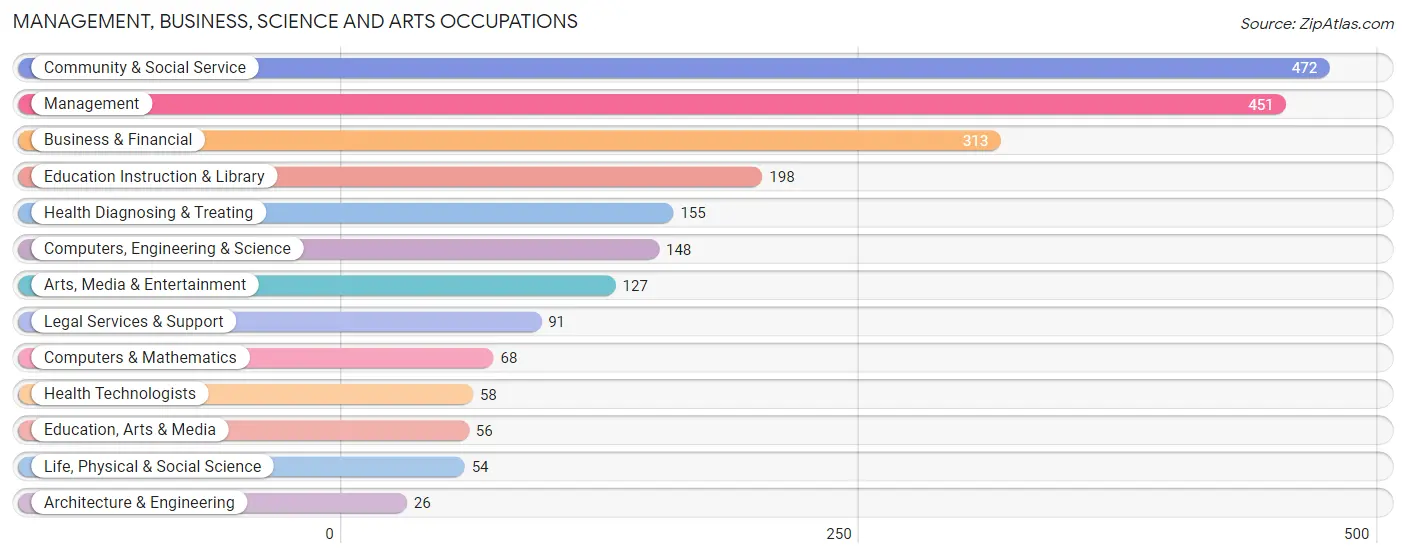
Management, Business, Science and Arts Occupations by Sex
Within the Management, Business, Science and Arts occupations in Northbrook, the most male-oriented occupations are Computers & Mathematics (100.0%), Architecture & Engineering (61.5%), and Computers, Engineering & Science (56.8%), while the most female-oriented occupations are Life, Physical & Social Science (100.0%), Legal Services & Support (100.0%), and Health Diagnosing & Treating (100.0%).
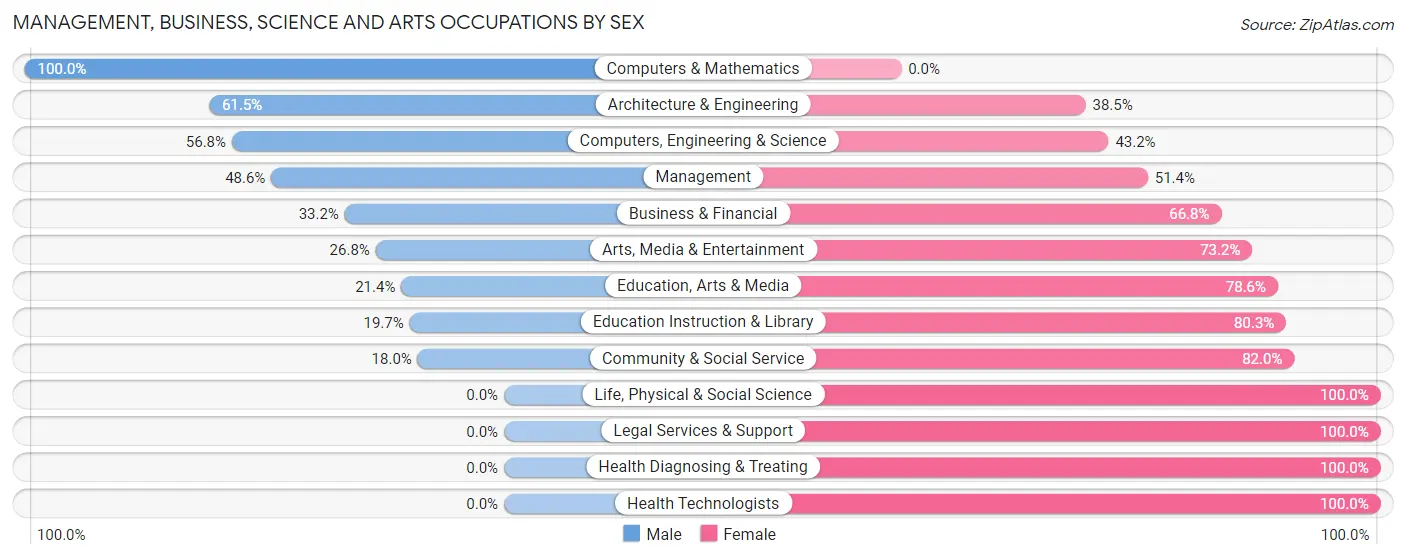
| Occupation | Male | Female |
| Management | 219 (48.6%) | 232 (51.4%) |
| Business & Financial | 104 (33.2%) | 209 (66.8%) |
| Computers, Engineering & Science | 84 (56.8%) | 64 (43.2%) |
| Computers & Mathematics | 68 (100.0%) | 0 (0.0%) |
| Architecture & Engineering | 16 (61.5%) | 10 (38.5%) |
| Life, Physical & Social Science | 0 (0.0%) | 54 (100.0%) |
| Community & Social Service | 85 (18.0%) | 387 (82.0%) |
| Education, Arts & Media | 12 (21.4%) | 44 (78.6%) |
| Legal Services & Support | 0 (0.0%) | 91 (100.0%) |
| Education Instruction & Library | 39 (19.7%) | 159 (80.3%) |
| Arts, Media & Entertainment | 34 (26.8%) | 93 (73.2%) |
| Health Diagnosing & Treating | 0 (0.0%) | 155 (100.0%) |
| Health Technologists | 0 (0.0%) | 58 (100.0%) |
| Total (Category) | 492 (32.0%) | 1,047 (68.0%) |
| Total (Overall) | 2,858 (50.8%) | 2,763 (49.1%) |
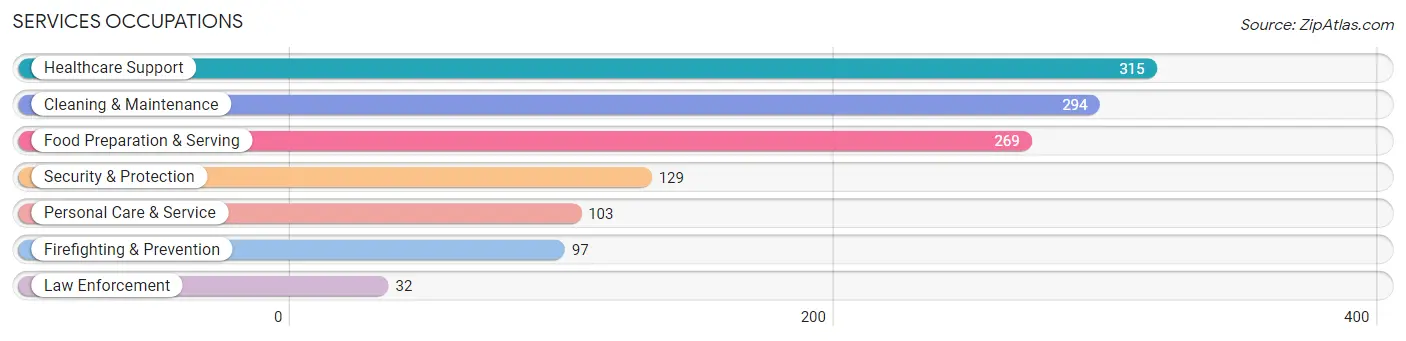
Services Occupations
The most common Services occupations in Northbrook are Healthcare Support (315 | 5.6%), Cleaning & Maintenance (294 | 5.2%), Food Preparation & Serving (269 | 4.8%), Security & Protection (129 | 2.3%), and Personal Care & Service (103 | 1.8%).
Services Occupations by Sex
Within the Services occupations in Northbrook, the most male-oriented occupations are Law Enforcement (100.0%), Food Preparation & Serving (71.8%), and Security & Protection (69.8%), while the most female-oriented occupations are Personal Care & Service (100.0%), Healthcare Support (98.4%), and Cleaning & Maintenance (41.2%).
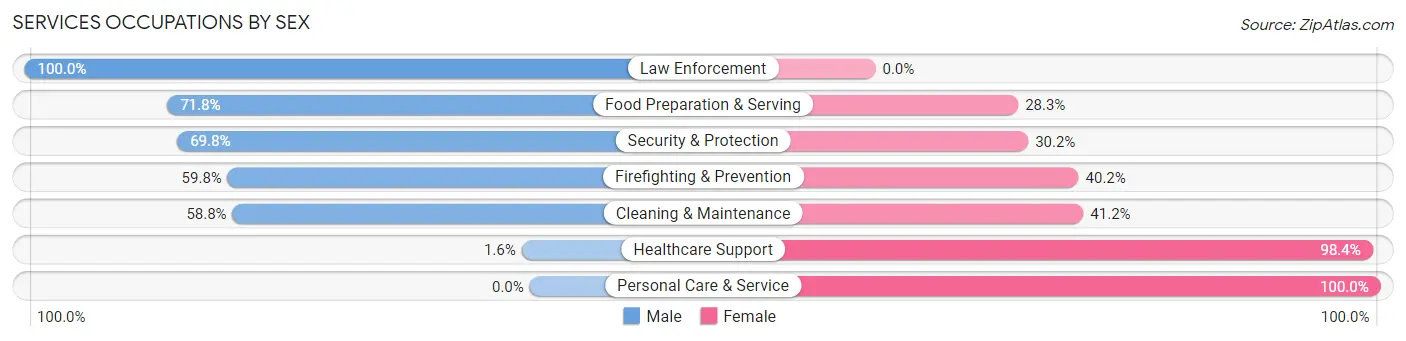
| Occupation | Male | Female |
| Healthcare Support | 5 (1.6%) | 310 (98.4%) |
| Security & Protection | 90 (69.8%) | 39 (30.2%) |
| Firefighting & Prevention | 58 (59.8%) | 39 (40.2%) |
| Law Enforcement | 32 (100.0%) | 0 (0.0%) |
| Food Preparation & Serving | 193 (71.8%) | 76 (28.2%) |
| Cleaning & Maintenance | 173 (58.8%) | 121 (41.2%) |
| Personal Care & Service | 0 (0.0%) | 103 (100.0%) |
| Total (Category) | 461 (41.5%) | 649 (58.5%) |
| Total (Overall) | 2,858 (50.8%) | 2,763 (49.1%) |
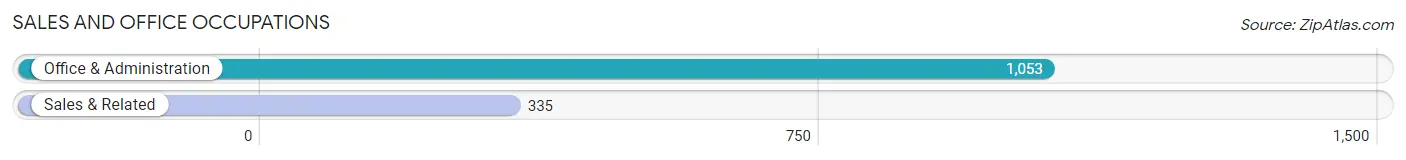
Sales and Office Occupations
The most common Sales and Office occupations in Northbrook are Office & Administration (1,053 | 18.7%), and Sales & Related (335 | 6.0%).
Sales and Office Occupations by Sex
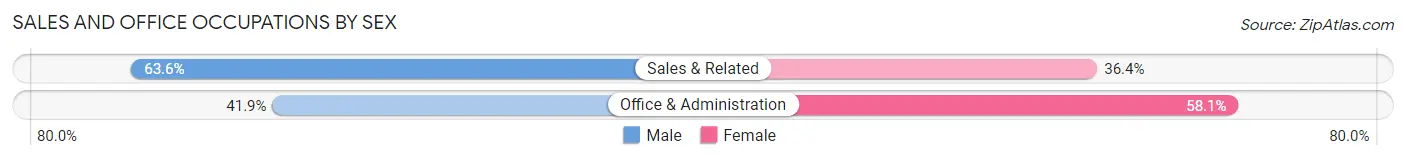
| Occupation | Male | Female |
| Sales & Related | 213 (63.6%) | 122 (36.4%) |
| Office & Administration | 441 (41.9%) | 612 (58.1%) |
| Total (Category) | 654 (47.1%) | 734 (52.9%) |
| Total (Overall) | 2,858 (50.8%) | 2,763 (49.1%) |
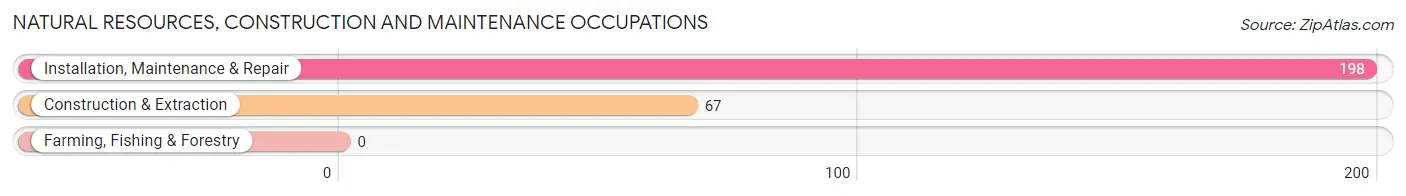
Natural Resources, Construction and Maintenance Occupations
The most common Natural Resources, Construction and Maintenance occupations in Northbrook are Installation, Maintenance & Repair (198 | 3.5%), and Construction & Extraction (67 | 1.2%).
Natural Resources, Construction and Maintenance Occupations by Sex
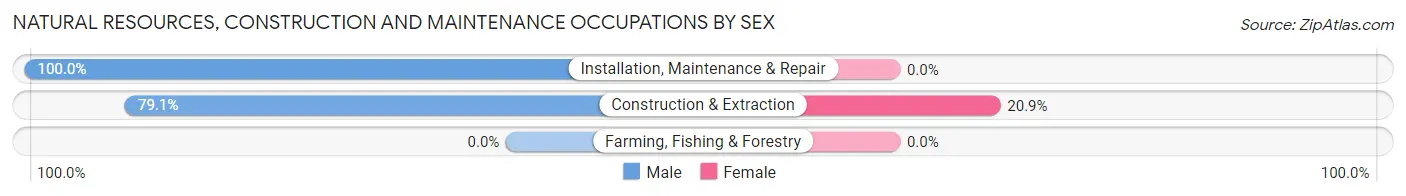
| Occupation | Male | Female |
| Farming, Fishing & Forestry | 0 (0.0%) | 0 (0.0%) |
| Construction & Extraction | 53 (79.1%) | 14 (20.9%) |
| Installation, Maintenance & Repair | 198 (100.0%) | 0 (0.0%) |
| Total (Category) | 251 (94.7%) | 14 (5.3%) |
| Total (Overall) | 2,858 (50.8%) | 2,763 (49.1%) |
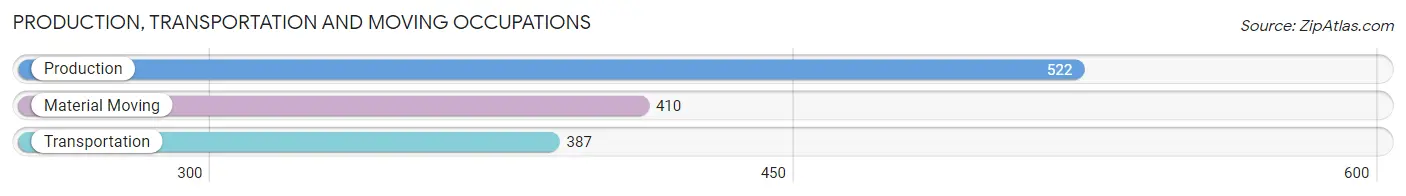
Production, Transportation and Moving Occupations
The most common Production, Transportation and Moving occupations in Northbrook are Production (522 | 9.3%), Material Moving (410 | 7.3%), and Transportation (387 | 6.9%).
Production, Transportation and Moving Occupations by Sex
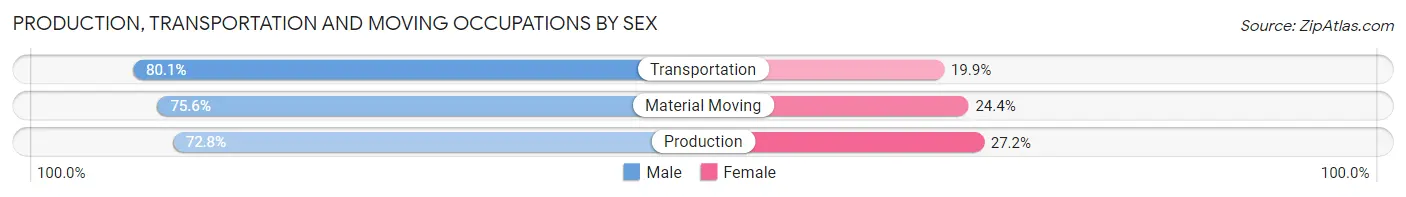
| Occupation | Male | Female |
| Production | 380 (72.8%) | 142 (27.2%) |
| Transportation | 310 (80.1%) | 77 (19.9%) |
| Material Moving | 310 (75.6%) | 100 (24.4%) |
| Total (Category) | 1,000 (75.8%) | 319 (24.2%) |
| Total (Overall) | 2,858 (50.8%) | 2,763 (49.1%) |
Employment Industries by Sex in Northbrook
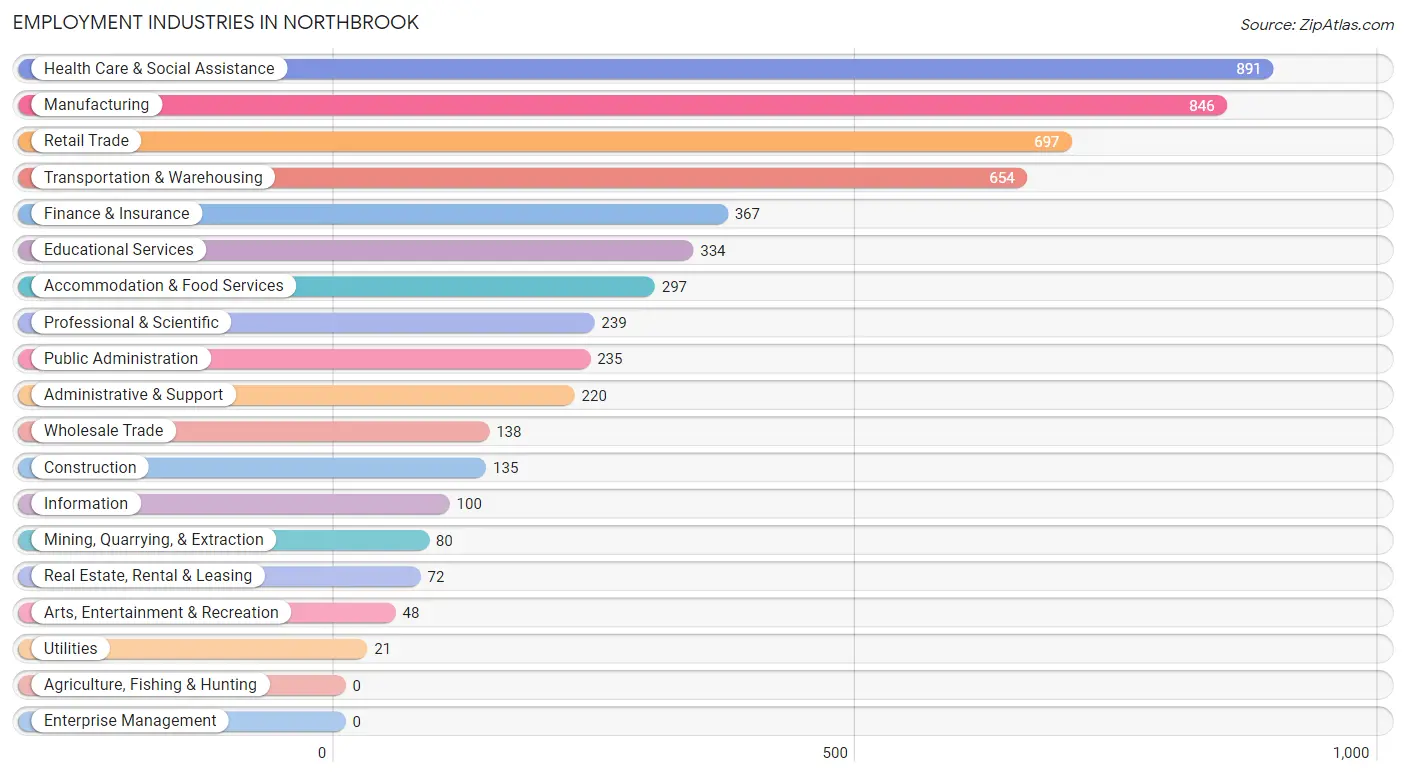
Employment Industries in Northbrook
The major employment industries in Northbrook include Health Care & Social Assistance (891 | 15.9%), Manufacturing (846 | 15.0%), Retail Trade (697 | 12.4%), Transportation & Warehousing (654 | 11.6%), and Finance & Insurance (367 | 6.5%).
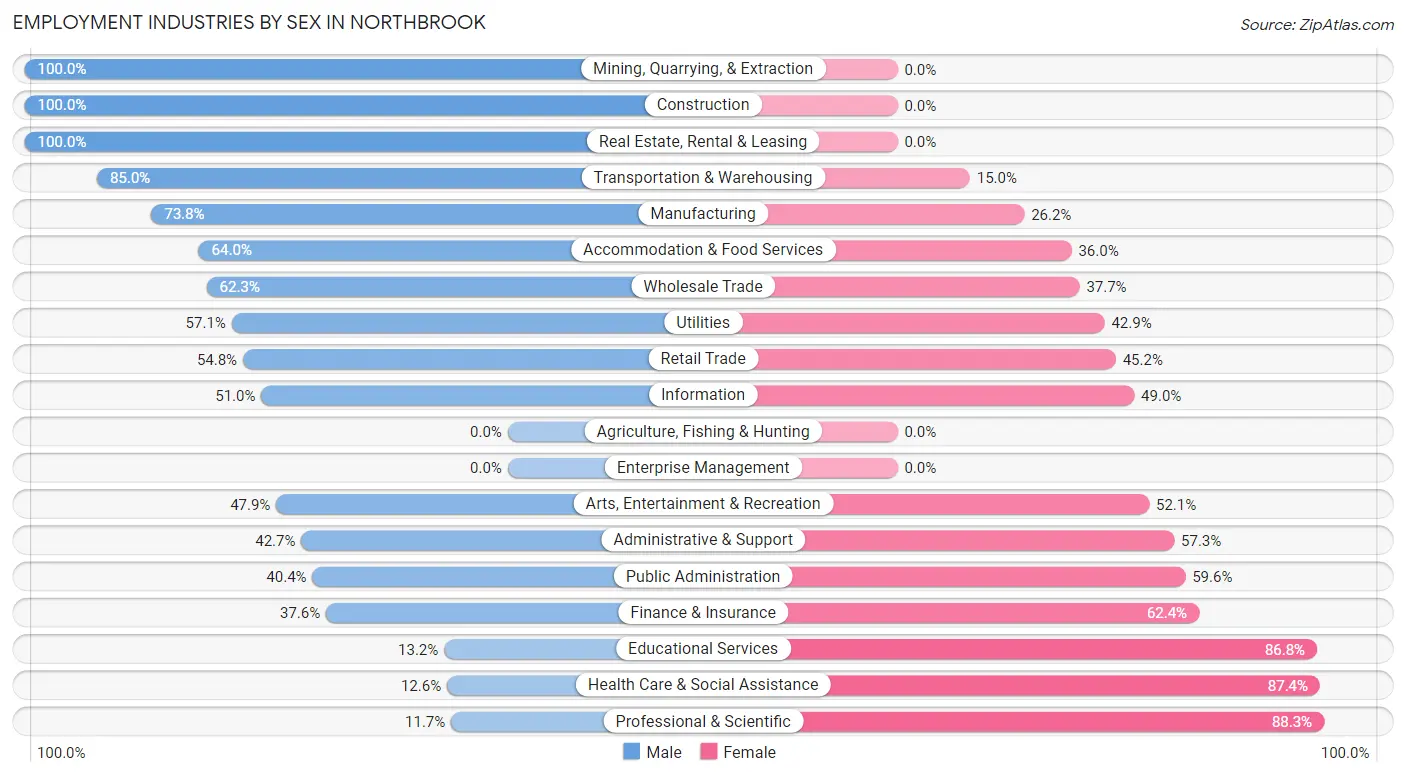
Employment Industries by Sex in Northbrook
The Northbrook industries that see more men than women are Mining, Quarrying, & Extraction (100.0%), Construction (100.0%), and Real Estate, Rental & Leasing (100.0%), whereas the industries that tend to have a higher number of women are Professional & Scientific (88.3%), Health Care & Social Assistance (87.4%), and Educational Services (86.8%).
| Industry | Male | Female |
| Agriculture, Fishing & Hunting | 0 (0.0%) | 0 (0.0%) |
| Mining, Quarrying, & Extraction | 80 (100.0%) | 0 (0.0%) |
| Construction | 135 (100.0%) | 0 (0.0%) |
| Manufacturing | 624 (73.8%) | 222 (26.2%) |
| Wholesale Trade | 86 (62.3%) | 52 (37.7%) |
| Retail Trade | 382 (54.8%) | 315 (45.2%) |
| Transportation & Warehousing | 556 (85.0%) | 98 (15.0%) |
| Utilities | 12 (57.1%) | 9 (42.9%) |
| Information | 51 (51.0%) | 49 (49.0%) |
| Finance & Insurance | 138 (37.6%) | 229 (62.4%) |
| Real Estate, Rental & Leasing | 72 (100.0%) | 0 (0.0%) |
| Professional & Scientific | 28 (11.7%) | 211 (88.3%) |
| Enterprise Management | 0 (0.0%) | 0 (0.0%) |
| Administrative & Support | 94 (42.7%) | 126 (57.3%) |
| Educational Services | 44 (13.2%) | 290 (86.8%) |
| Health Care & Social Assistance | 112 (12.6%) | 779 (87.4%) |
| Arts, Entertainment & Recreation | 23 (47.9%) | 25 (52.1%) |
| Accommodation & Food Services | 190 (64.0%) | 107 (36.0%) |
| Public Administration | 95 (40.4%) | 140 (59.6%) |
| Total | 2,858 (50.8%) | 2,763 (49.1%) |
Education in Northbrook
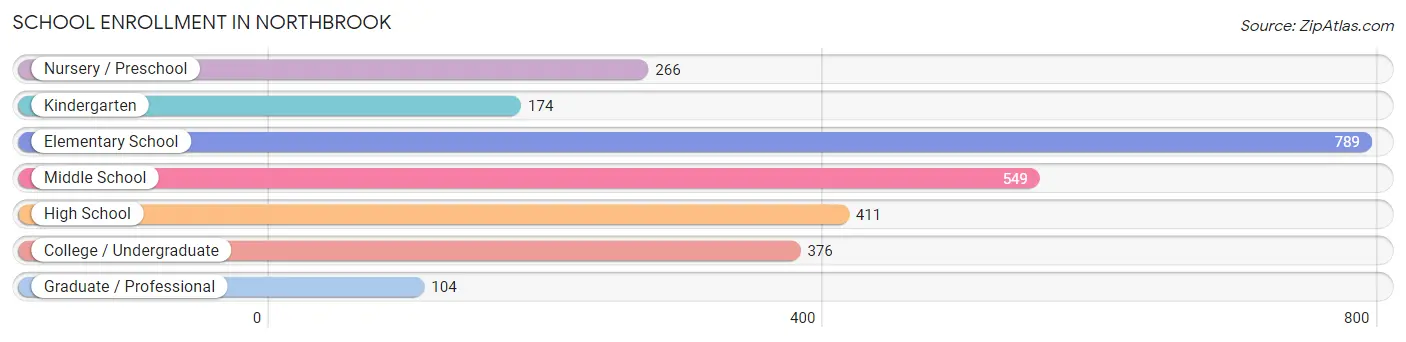
School Enrollment in Northbrook
The most common levels of schooling among the 2,669 students in Northbrook are elementary school (789 | 29.6%), middle school (549 | 20.6%), and high school (411 | 15.4%).
| School Level | # Students | % Students |
| Nursery / Preschool | 266 | 10.0% |
| Kindergarten | 174 | 6.5% |
| Elementary School | 789 | 29.6% |
| Middle School | 549 | 20.6% |
| High School | 411 | 15.4% |
| College / Undergraduate | 376 | 14.1% |
| Graduate / Professional | 104 | 3.9% |
| Total | 2,669 | 100.0% |
School Enrollment by Age by Funding Source in Northbrook
Out of a total of 2,669 students who are enrolled in schools in Northbrook, 422 (15.8%) attend a private institution, while the remaining 2,247 (84.2%) are enrolled in public schools. The age group of 25 to 34 year olds has the highest likelihood of being enrolled in private schools, with 59 (47.6% in the age bracket) enrolled. Conversely, the age group of 20 to 24 year olds has the lowest likelihood of being enrolled in a private school, with 207 (96.3% in the age bracket) attending a public institution.
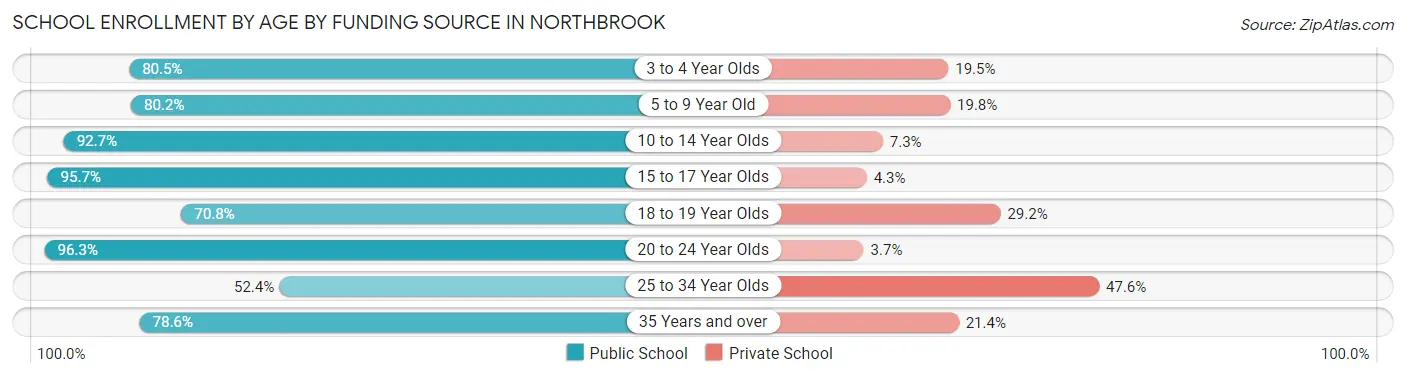
| Age Bracket | Public School | Private School |
| 3 to 4 Year Olds | 157 (80.5%) | 38 (19.5%) |
| 5 to 9 Year Old | 736 (80.2%) | 182 (19.8%) |
| 10 to 14 Year Olds | 635 (92.7%) | 50 (7.3%) |
| 15 to 17 Year Olds | 245 (95.7%) | 11 (4.3%) |
| 18 to 19 Year Olds | 126 (70.8%) | 52 (29.2%) |
| 20 to 24 Year Olds | 207 (96.3%) | 8 (3.7%) |
| 25 to 34 Year Olds | 65 (52.4%) | 59 (47.6%) |
| 35 Years and over | 77 (78.6%) | 21 (21.4%) |
| Total | 2,247 (84.2%) | 422 (15.8%) |
Educational Attainment by Field of Study in Northbrook
Business (331 | 22.9%), communications (308 | 21.3%), science & technology (202 | 14.0%), education (184 | 12.7%), and bio, nature & agricultural (93 | 6.4%) are the most common fields of study among 1,445 individuals in Northbrook who have obtained a bachelor's degree or higher.
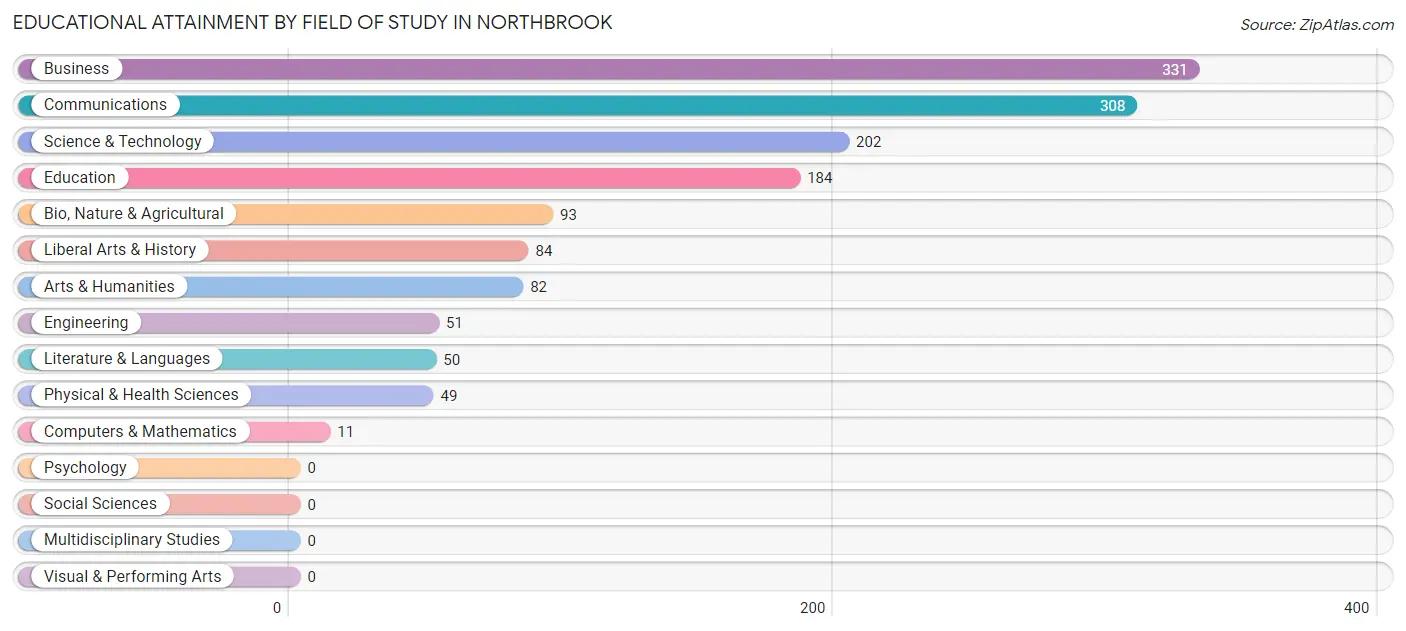
| Field of Study | # Graduates | % Graduates |
| Computers & Mathematics | 11 | 0.8% |
| Bio, Nature & Agricultural | 93 | 6.4% |
| Physical & Health Sciences | 49 | 3.4% |
| Psychology | 0 | 0.0% |
| Social Sciences | 0 | 0.0% |
| Engineering | 51 | 3.5% |
| Multidisciplinary Studies | 0 | 0.0% |
| Science & Technology | 202 | 14.0% |
| Business | 331 | 22.9% |
| Education | 184 | 12.7% |
| Literature & Languages | 50 | 3.5% |
| Liberal Arts & History | 84 | 5.8% |
| Visual & Performing Arts | 0 | 0.0% |
| Communications | 308 | 21.3% |
| Arts & Humanities | 82 | 5.7% |
| Total | 1,445 | 100.0% |
Transportation & Commute in Northbrook
Vehicle Availability by Sex in Northbrook
The most prevalent vehicle ownership categories in Northbrook are males with 2 vehicles (1,478, accounting for 53.0%) and females with 2 vehicles (1,279, making up 55.0%).
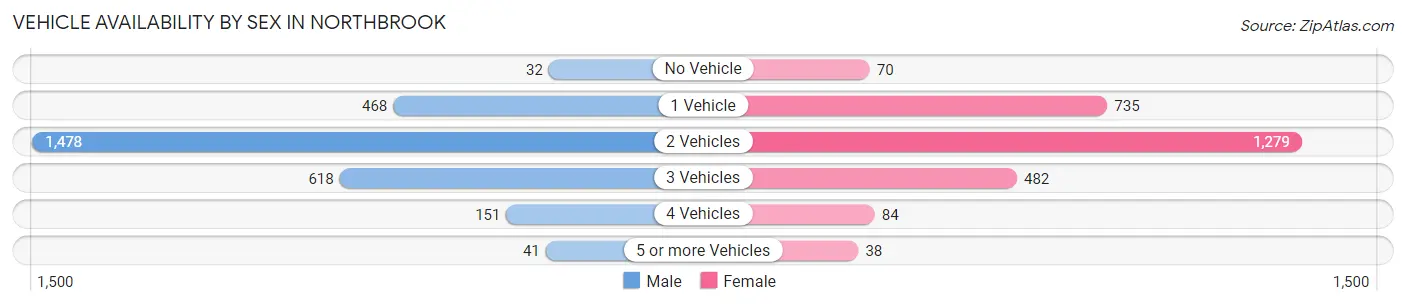
| Vehicles Available | Male | Female |
| No Vehicle | 32 (1.1%) | 70 (2.6%) |
| 1 Vehicle | 468 (16.8%) | 735 (27.3%) |
| 2 Vehicles | 1,478 (53.0%) | 1,279 (47.6%) |
| 3 Vehicles | 618 (22.2%) | 482 (17.9%) |
| 4 Vehicles | 151 (5.4%) | 84 (3.1%) |
| 5 or more Vehicles | 41 (1.5%) | 38 (1.4%) |
| Total | 2,788 (100.0%) | 2,688 (100.0%) |
Commute Time in Northbrook
The most frequently occuring commute durations in Northbrook are 30 to 34 minutes (1,176 commuters, 23.3%), 20 to 24 minutes (1,017 commuters, 20.2%), and 15 to 19 minutes (925 commuters, 18.3%).
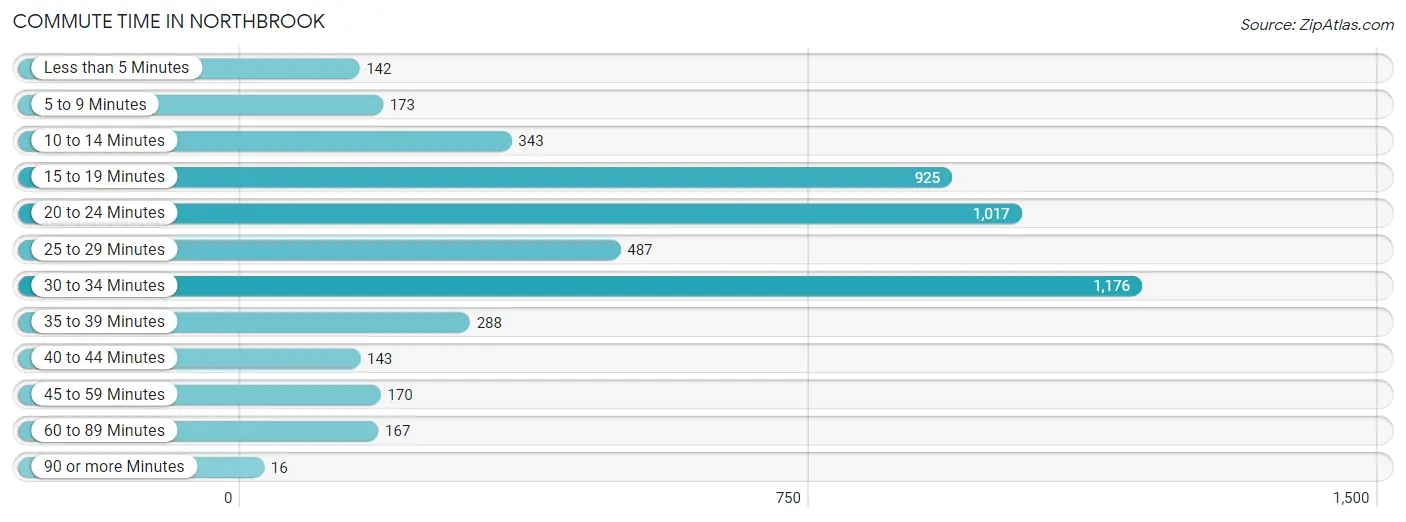
| Commute Time | # Commuters | % Commuters |
| Less than 5 Minutes | 142 | 2.8% |
| 5 to 9 Minutes | 173 | 3.4% |
| 10 to 14 Minutes | 343 | 6.8% |
| 15 to 19 Minutes | 925 | 18.3% |
| 20 to 24 Minutes | 1,017 | 20.2% |
| 25 to 29 Minutes | 487 | 9.7% |
| 30 to 34 Minutes | 1,176 | 23.3% |
| 35 to 39 Minutes | 288 | 5.7% |
| 40 to 44 Minutes | 143 | 2.8% |
| 45 to 59 Minutes | 170 | 3.4% |
| 60 to 89 Minutes | 167 | 3.3% |
| 90 or more Minutes | 16 | 0.3% |
Commute Time by Sex in Northbrook
The most common commute times in Northbrook are 30 to 34 minutes (704 commuters, 25.8%) for males and 20 to 24 minutes (504 commuters, 21.7%) for females.
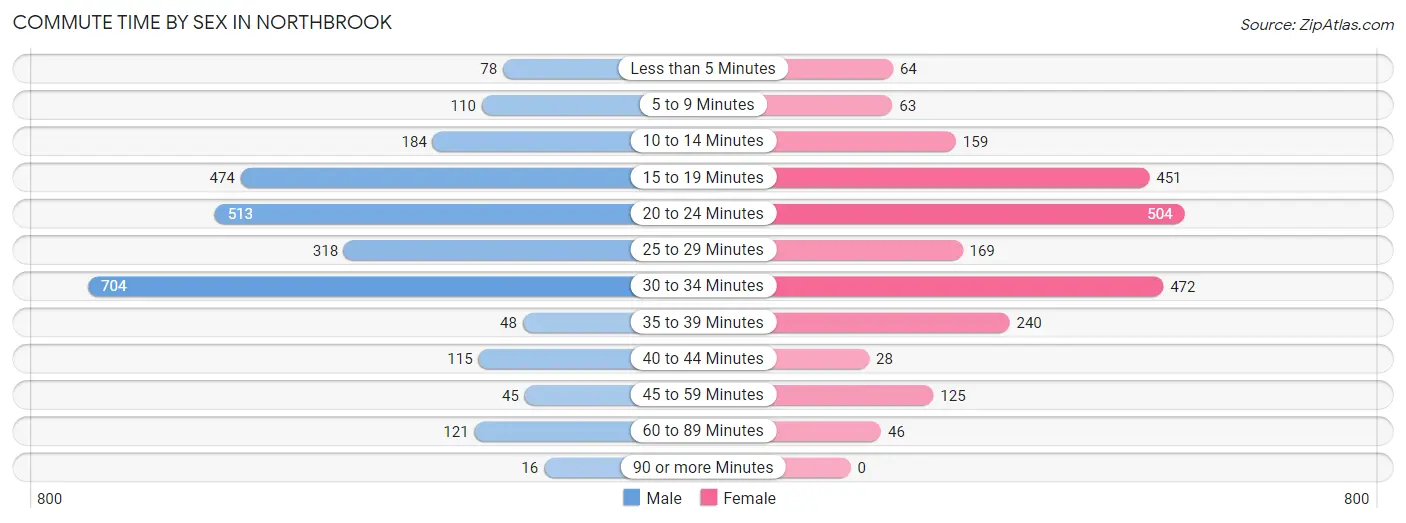
| Commute Time | Male | Female |
| Less than 5 Minutes | 78 (2.9%) | 64 (2.8%) |
| 5 to 9 Minutes | 110 (4.0%) | 63 (2.7%) |
| 10 to 14 Minutes | 184 (6.8%) | 159 (6.9%) |
| 15 to 19 Minutes | 474 (17.4%) | 451 (19.4%) |
| 20 to 24 Minutes | 513 (18.8%) | 504 (21.7%) |
| 25 to 29 Minutes | 318 (11.7%) | 169 (7.3%) |
| 30 to 34 Minutes | 704 (25.8%) | 472 (20.3%) |
| 35 to 39 Minutes | 48 (1.8%) | 240 (10.3%) |
| 40 to 44 Minutes | 115 (4.2%) | 28 (1.2%) |
| 45 to 59 Minutes | 45 (1.7%) | 125 (5.4%) |
| 60 to 89 Minutes | 121 (4.4%) | 46 (2.0%) |
| 90 or more Minutes | 16 (0.6%) | 0 (0.0%) |
Time of Departure to Work by Sex in Northbrook
The most frequent times of departure to work in Northbrook are 4:00 PM to 11:59 PM (532, 19.5%) for males and 7:00 AM to 7:29 AM (500, 21.5%) for females.
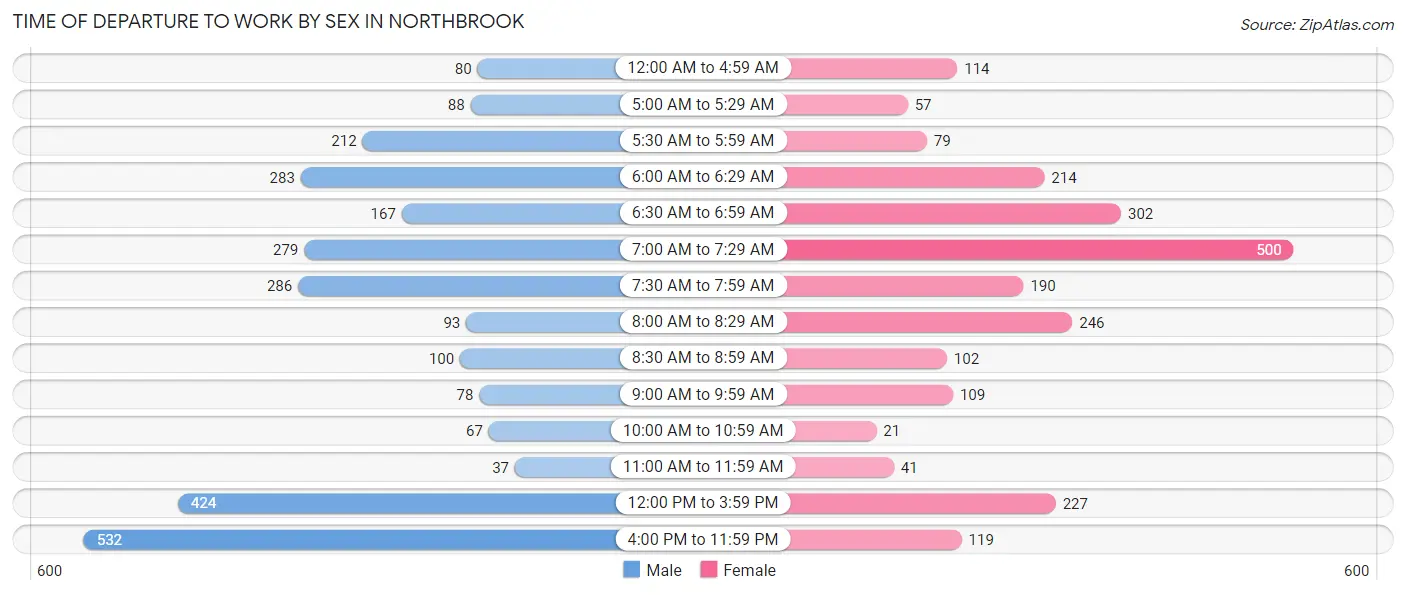
| Time of Departure | Male | Female |
| 12:00 AM to 4:59 AM | 80 (2.9%) | 114 (4.9%) |
| 5:00 AM to 5:29 AM | 88 (3.2%) | 57 (2.5%) |
| 5:30 AM to 5:59 AM | 212 (7.8%) | 79 (3.4%) |
| 6:00 AM to 6:29 AM | 283 (10.4%) | 214 (9.2%) |
| 6:30 AM to 6:59 AM | 167 (6.1%) | 302 (13.0%) |
| 7:00 AM to 7:29 AM | 279 (10.2%) | 500 (21.5%) |
| 7:30 AM to 7:59 AM | 286 (10.5%) | 190 (8.2%) |
| 8:00 AM to 8:29 AM | 93 (3.4%) | 246 (10.6%) |
| 8:30 AM to 8:59 AM | 100 (3.7%) | 102 (4.4%) |
| 9:00 AM to 9:59 AM | 78 (2.9%) | 109 (4.7%) |
| 10:00 AM to 10:59 AM | 67 (2.5%) | 21 (0.9%) |
| 11:00 AM to 11:59 AM | 37 (1.4%) | 41 (1.8%) |
| 12:00 PM to 3:59 PM | 424 (15.5%) | 227 (9.8%) |
| 4:00 PM to 11:59 PM | 532 (19.5%) | 119 (5.1%) |
| Total | 2,726 (100.0%) | 2,321 (100.0%) |
Housing Occupancy in Northbrook
Occupancy by Ownership in Northbrook
Of the total 4,279 dwellings in Northbrook, owner-occupied units account for 3,052 (71.3%), while renter-occupied units make up 1,227 (28.7%).
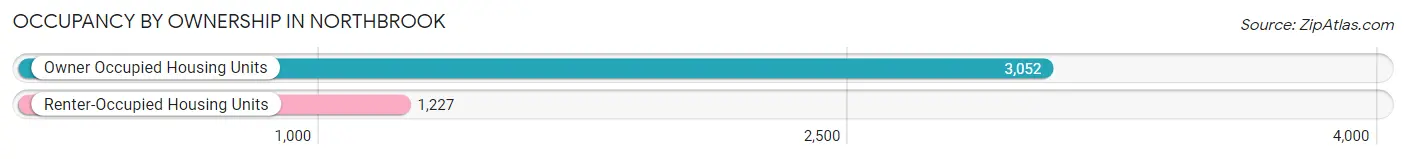
| Occupancy | # Housing Units | % Housing Units |
| Owner Occupied Housing Units | 3,052 | 71.3% |
| Renter-Occupied Housing Units | 1,227 | 28.7% |
| Total Occupied Housing Units | 4,279 | 100.0% |
Occupancy by Household Size in Northbrook
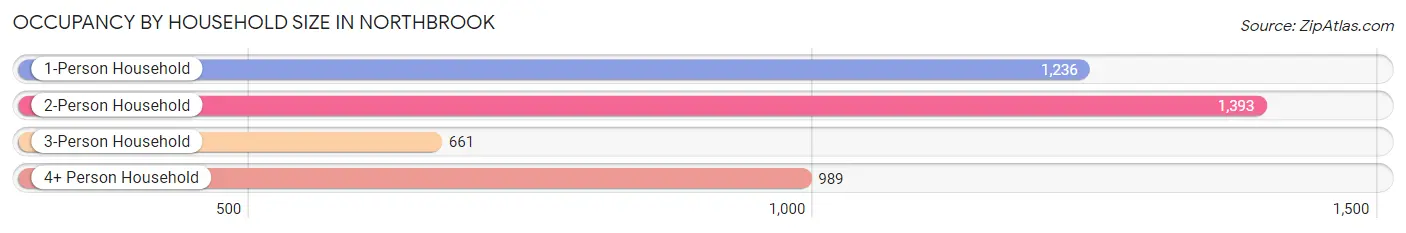
| Household Size | # Housing Units | % Housing Units |
| 1-Person Household | 1,236 | 28.9% |
| 2-Person Household | 1,393 | 32.6% |
| 3-Person Household | 661 | 15.4% |
| 4+ Person Household | 989 | 23.1% |
| Total Housing Units | 4,279 | 100.0% |
Occupancy by Ownership by Household Size in Northbrook
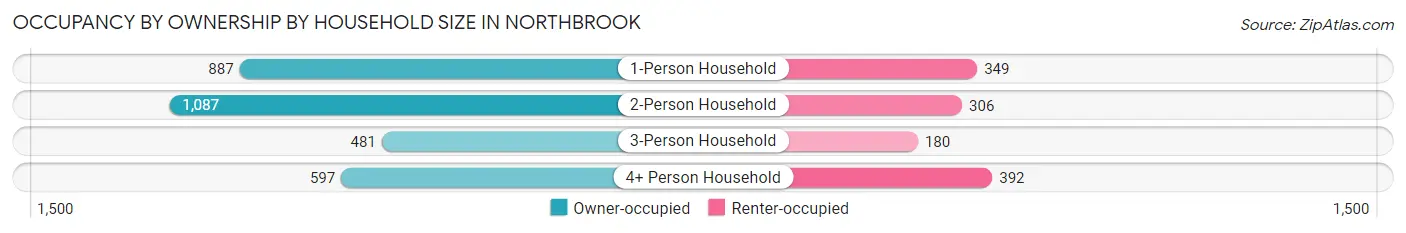
| Household Size | Owner-occupied | Renter-occupied |
| 1-Person Household | 887 (71.8%) | 349 (28.2%) |
| 2-Person Household | 1,087 (78.0%) | 306 (22.0%) |
| 3-Person Household | 481 (72.8%) | 180 (27.2%) |
| 4+ Person Household | 597 (60.4%) | 392 (39.6%) |
| Total Housing Units | 3,052 (71.3%) | 1,227 (28.7%) |
Occupancy by Educational Attainment in Northbrook
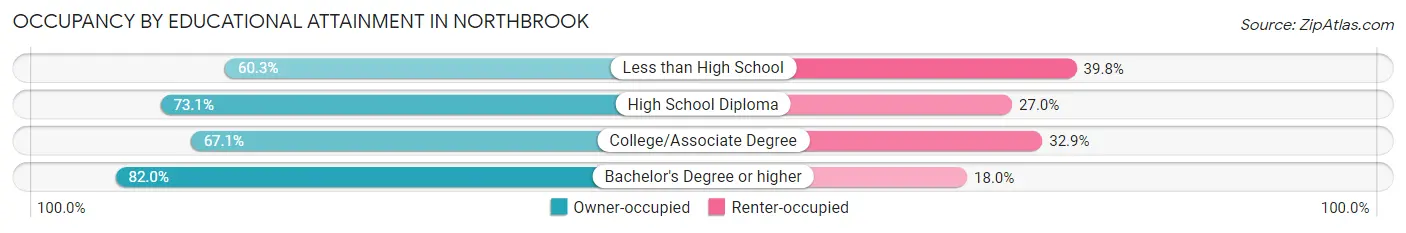
| Household Size | Owner-occupied | Renter-occupied |
| Less than High School | 335 (60.3%) | 221 (39.8%) |
| High School Diploma | 1,103 (73.1%) | 407 (27.0%) |
| College/Associate Degree | 900 (67.1%) | 442 (32.9%) |
| Bachelor's Degree or higher | 714 (82.0%) | 157 (18.0%) |
Occupancy by Age of Householder in Northbrook
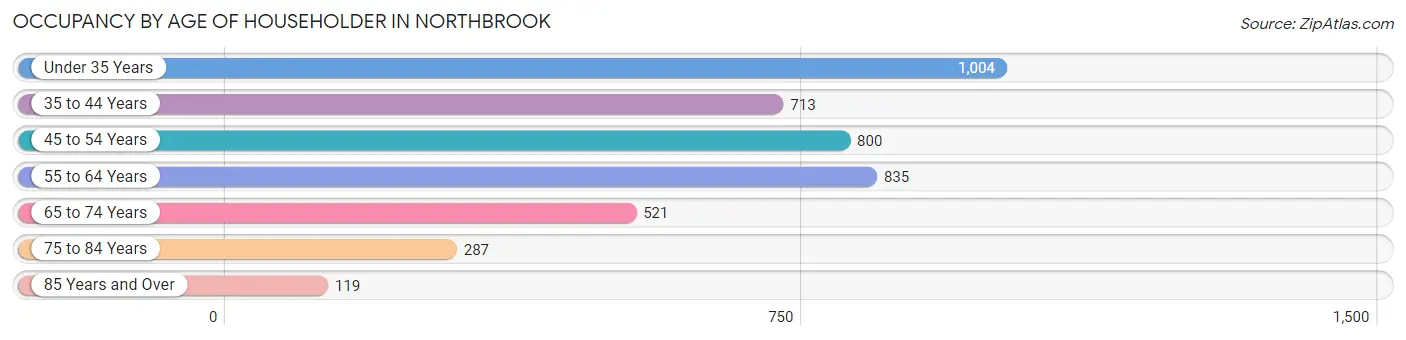
| Age Bracket | # Households | % Households |
| Under 35 Years | 1,004 | 23.5% |
| 35 to 44 Years | 713 | 16.7% |
| 45 to 54 Years | 800 | 18.7% |
| 55 to 64 Years | 835 | 19.5% |
| 65 to 74 Years | 521 | 12.2% |
| 75 to 84 Years | 287 | 6.7% |
| 85 Years and Over | 119 | 2.8% |
| Total | 4,279 | 100.0% |
Housing Finances in Northbrook
Median Income by Occupancy in Northbrook
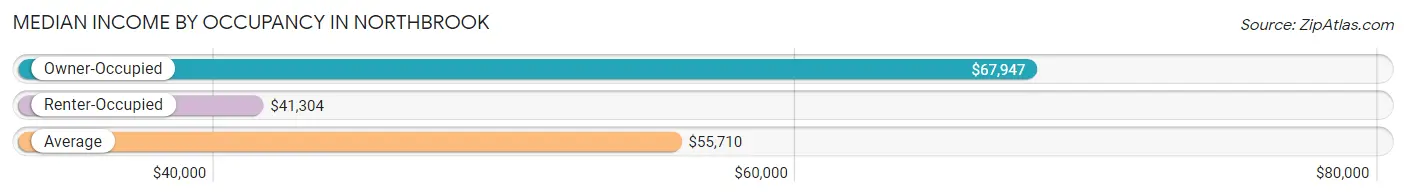
| Occupancy Type | # Households | Median Income |
| Owner-Occupied | 3,052 (71.3%) | $67,947 |
| Renter-Occupied | 1,227 (28.7%) | $41,304 |
| Average | 4,279 (100.0%) | $55,710 |
Occupancy by Householder Income Bracket in Northbrook
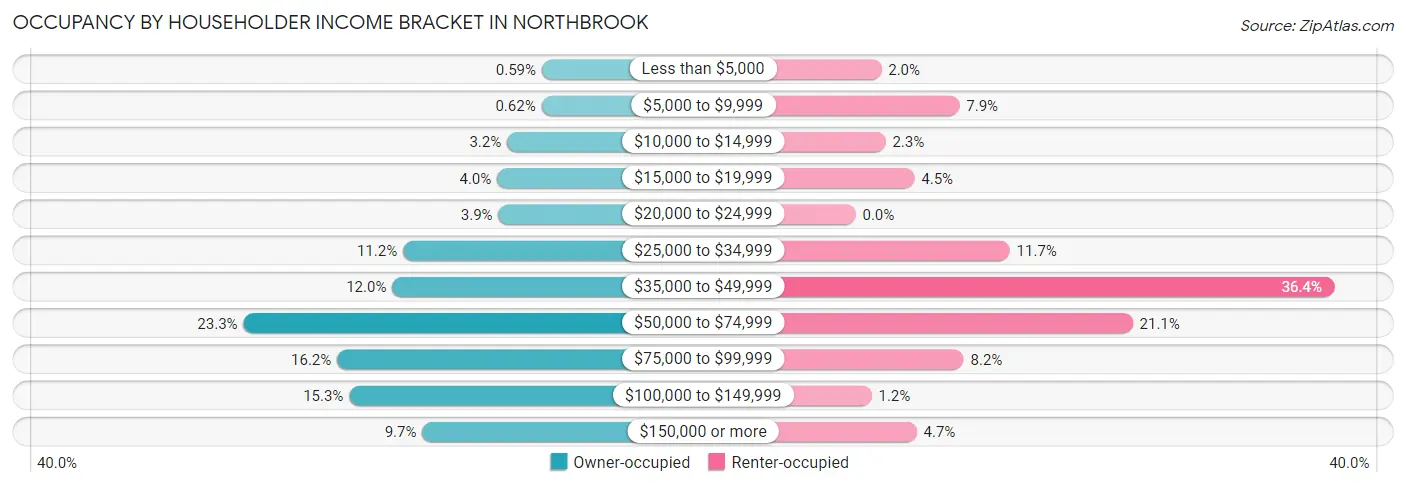
| Income Bracket | Owner-occupied | Renter-occupied |
| Less than $5,000 | 18 (0.6%) | 24 (2.0%) |
| $5,000 to $9,999 | 19 (0.6%) | 97 (7.9%) |
| $10,000 to $14,999 | 99 (3.2%) | 28 (2.3%) |
| $15,000 to $19,999 | 122 (4.0%) | 55 (4.5%) |
| $20,000 to $24,999 | 119 (3.9%) | 0 (0.0%) |
| $25,000 to $34,999 | 341 (11.2%) | 144 (11.7%) |
| $35,000 to $49,999 | 366 (12.0%) | 447 (36.4%) |
| $50,000 to $74,999 | 712 (23.3%) | 259 (21.1%) |
| $75,000 to $99,999 | 494 (16.2%) | 101 (8.2%) |
| $100,000 to $149,999 | 466 (15.3%) | 15 (1.2%) |
| $150,000 or more | 296 (9.7%) | 57 (4.6%) |
| Total | 3,052 (100.0%) | 1,227 (100.0%) |
Monthly Housing Cost Tiers in Northbrook
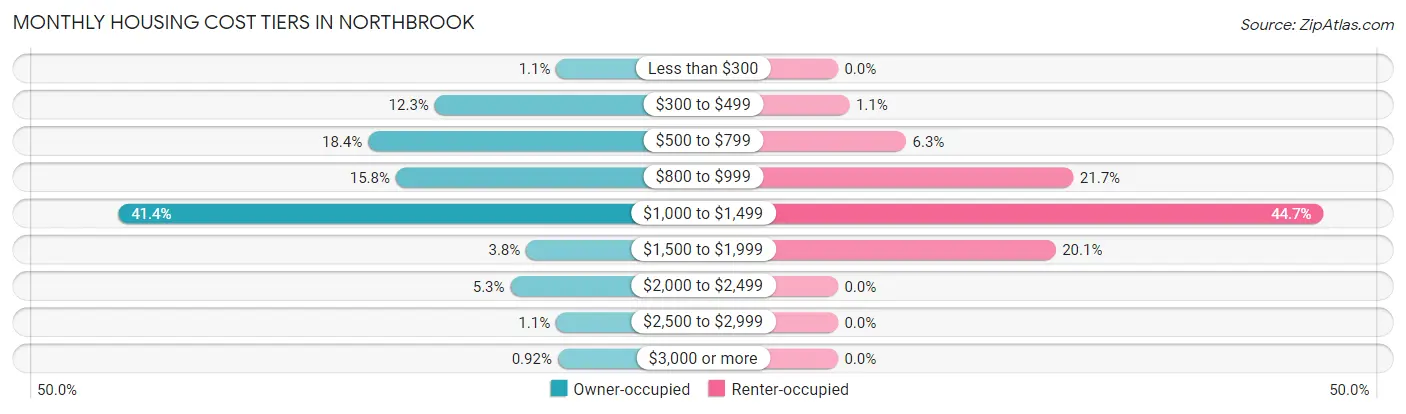
| Monthly Cost | Owner-occupied | Renter-occupied |
| Less than $300 | 32 (1.1%) | 0 (0.0%) |
| $300 to $499 | 374 (12.2%) | 13 (1.1%) |
| $500 to $799 | 561 (18.4%) | 77 (6.3%) |
| $800 to $999 | 483 (15.8%) | 266 (21.7%) |
| $1,000 to $1,499 | 1,263 (41.4%) | 549 (44.7%) |
| $1,500 to $1,999 | 117 (3.8%) | 246 (20.1%) |
| $2,000 to $2,499 | 161 (5.3%) | 0 (0.0%) |
| $2,500 to $2,999 | 33 (1.1%) | 0 (0.0%) |
| $3,000 or more | 28 (0.9%) | 0 (0.0%) |
| Total | 3,052 (100.0%) | 1,227 (100.0%) |
Physical Housing Characteristics in Northbrook
Housing Structures in Northbrook
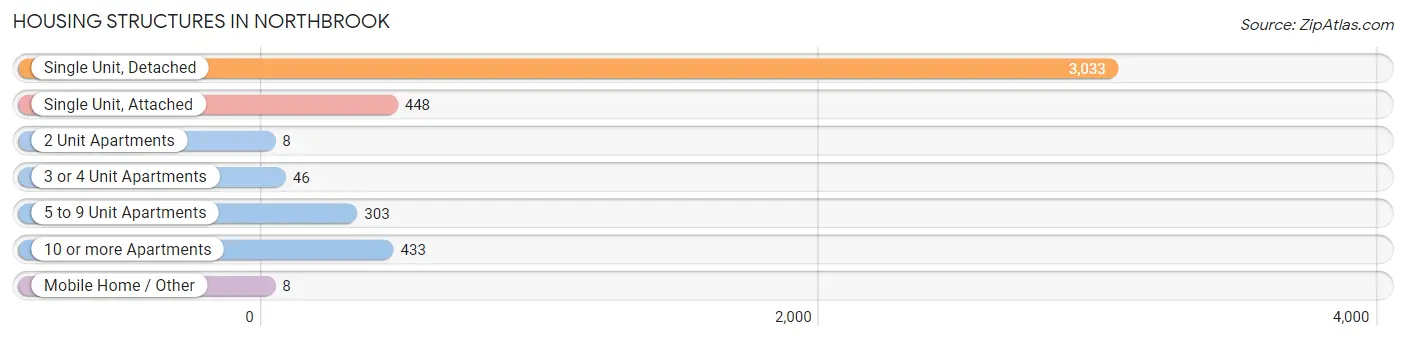
| Structure Type | # Housing Units | % Housing Units |
| Single Unit, Detached | 3,033 | 70.9% |
| Single Unit, Attached | 448 | 10.5% |
| 2 Unit Apartments | 8 | 0.2% |
| 3 or 4 Unit Apartments | 46 | 1.1% |
| 5 to 9 Unit Apartments | 303 | 7.1% |
| 10 or more Apartments | 433 | 10.1% |
| Mobile Home / Other | 8 | 0.2% |
| Total | 4,279 | 100.0% |
Housing Structures by Occupancy in Northbrook
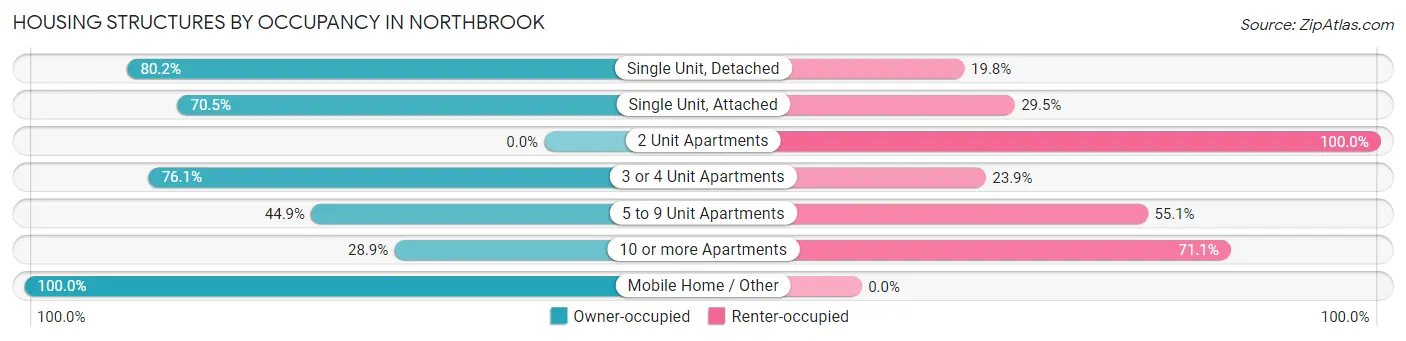
| Structure Type | Owner-occupied | Renter-occupied |
| Single Unit, Detached | 2,432 (80.2%) | 601 (19.8%) |
| Single Unit, Attached | 316 (70.5%) | 132 (29.5%) |
| 2 Unit Apartments | 0 (0.0%) | 8 (100.0%) |
| 3 or 4 Unit Apartments | 35 (76.1%) | 11 (23.9%) |
| 5 to 9 Unit Apartments | 136 (44.9%) | 167 (55.1%) |
| 10 or more Apartments | 125 (28.9%) | 308 (71.1%) |
| Mobile Home / Other | 8 (100.0%) | 0 (0.0%) |
| Total | 3,052 (71.3%) | 1,227 (28.7%) |
Housing Structures by Number of Rooms in Northbrook
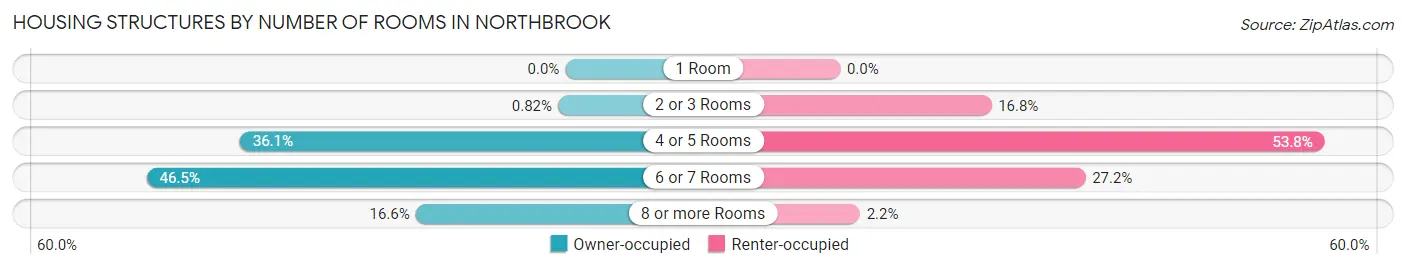
| Number of Rooms | Owner-occupied | Renter-occupied |
| 1 Room | 0 (0.0%) | 0 (0.0%) |
| 2 or 3 Rooms | 25 (0.8%) | 206 (16.8%) |
| 4 or 5 Rooms | 1,102 (36.1%) | 660 (53.8%) |
| 6 or 7 Rooms | 1,418 (46.5%) | 334 (27.2%) |
| 8 or more Rooms | 507 (16.6%) | 27 (2.2%) |
| Total | 3,052 (100.0%) | 1,227 (100.0%) |
Housing Structure by Heating Type in Northbrook
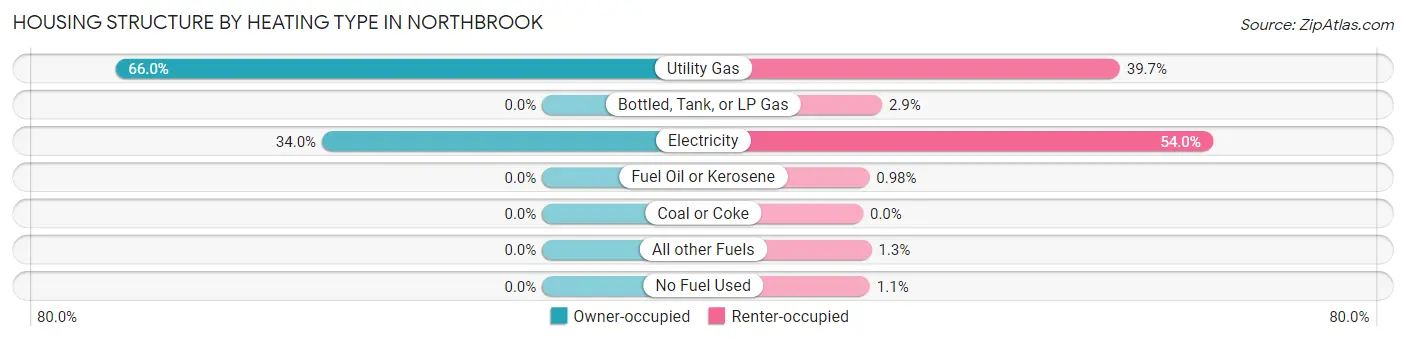
| Heating Type | Owner-occupied | Renter-occupied |
| Utility Gas | 2,013 (66.0%) | 487 (39.7%) |
| Bottled, Tank, or LP Gas | 0 (0.0%) | 36 (2.9%) |
| Electricity | 1,039 (34.0%) | 663 (54.0%) |
| Fuel Oil or Kerosene | 0 (0.0%) | 12 (1.0%) |
| Coal or Coke | 0 (0.0%) | 0 (0.0%) |
| All other Fuels | 0 (0.0%) | 16 (1.3%) |
| No Fuel Used | 0 (0.0%) | 13 (1.1%) |
| Total | 3,052 (100.0%) | 1,227 (100.0%) |
Household Vehicle Usage in Northbrook
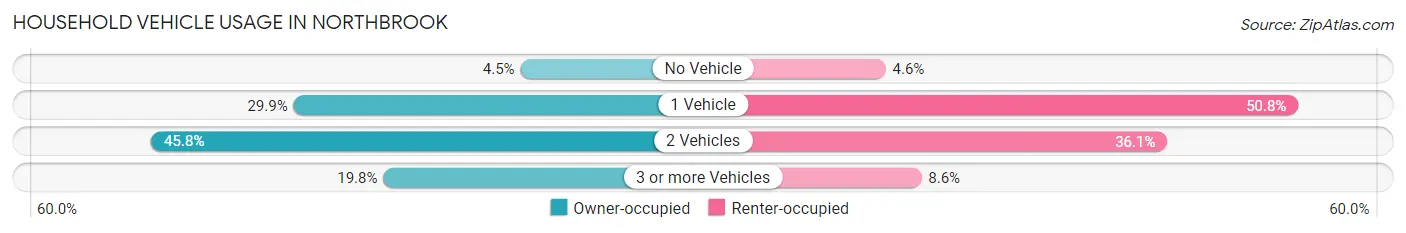
| Vehicles per Household | Owner-occupied | Renter-occupied |
| No Vehicle | 136 (4.5%) | 56 (4.6%) |
| 1 Vehicle | 912 (29.9%) | 623 (50.8%) |
| 2 Vehicles | 1,399 (45.8%) | 443 (36.1%) |
| 3 or more Vehicles | 605 (19.8%) | 105 (8.6%) |
| Total | 3,052 (100.0%) | 1,227 (100.0%) |
Real Estate & Mortgages in Northbrook
Real Estate and Mortgage Overview in Northbrook
| Characteristic | Without Mortgage | With Mortgage |
| Housing Units | 819 | 2,233 |
| Median Property Value | $97,800 | $122,100 |
| Median Household Income | $44,904 | $224 |
| Monthly Housing Costs | $506 | $28 |
| Real Estate Taxes | $1,552 | $91 |
Property Value by Mortgage Status in Northbrook
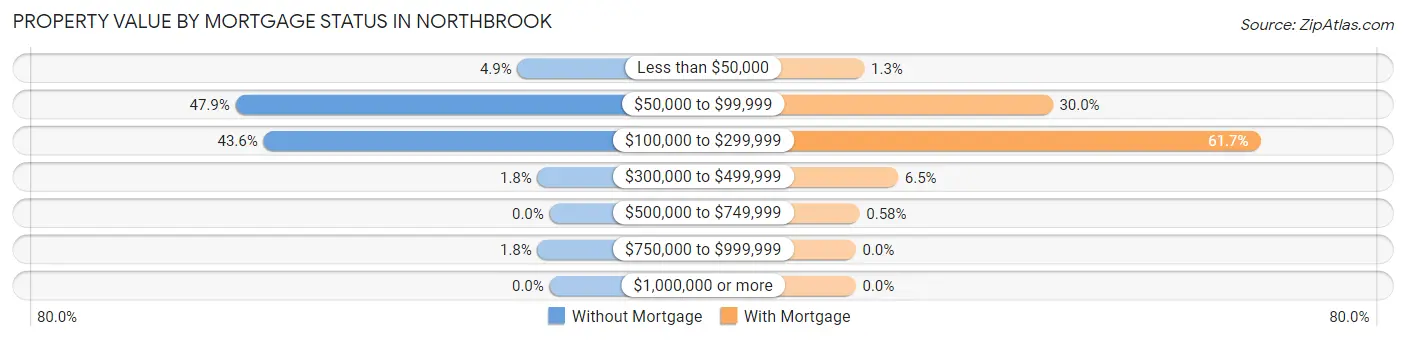
| Property Value | Without Mortgage | With Mortgage |
| Less than $50,000 | 40 (4.9%) | 29 (1.3%) |
| $50,000 to $99,999 | 392 (47.9%) | 670 (30.0%) |
| $100,000 to $299,999 | 357 (43.6%) | 1,377 (61.7%) |
| $300,000 to $499,999 | 15 (1.8%) | 144 (6.5%) |
| $500,000 to $749,999 | 0 (0.0%) | 13 (0.6%) |
| $750,000 to $999,999 | 15 (1.8%) | 0 (0.0%) |
| $1,000,000 or more | 0 (0.0%) | 0 (0.0%) |
| Total | 819 (100.0%) | 2,233 (100.0%) |
Household Income by Mortgage Status in Northbrook
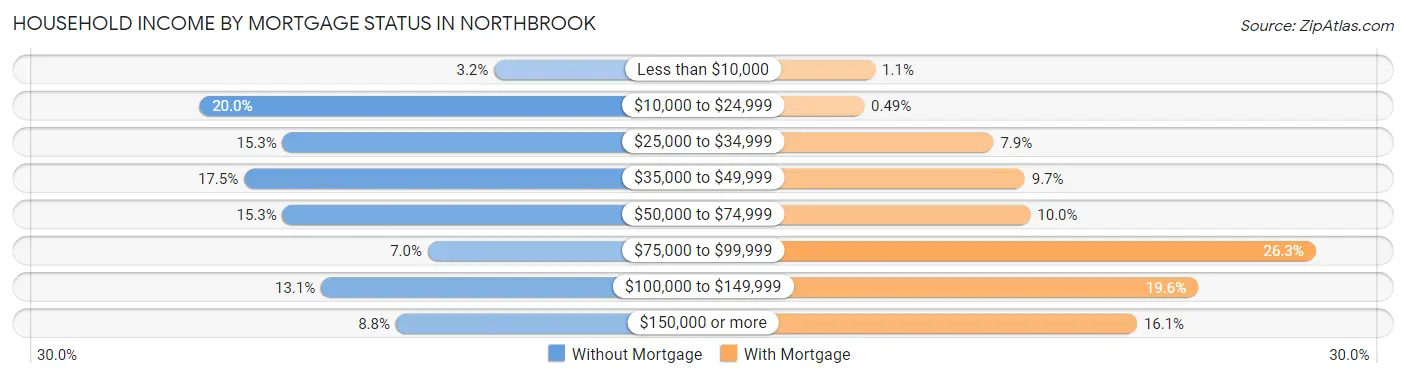
| Household Income | Without Mortgage | With Mortgage |
| Less than $10,000 | 26 (3.2%) | 25 (1.1%) |
| $10,000 to $24,999 | 164 (20.0%) | 11 (0.5%) |
| $25,000 to $34,999 | 125 (15.3%) | 176 (7.9%) |
| $35,000 to $49,999 | 143 (17.5%) | 216 (9.7%) |
| $50,000 to $74,999 | 125 (15.3%) | 223 (10.0%) |
| $75,000 to $99,999 | 57 (7.0%) | 587 (26.3%) |
| $100,000 to $149,999 | 107 (13.1%) | 437 (19.6%) |
| $150,000 or more | 72 (8.8%) | 359 (16.1%) |
| Total | 819 (100.0%) | 2,233 (100.0%) |
Property Value to Household Income Ratio in Northbrook
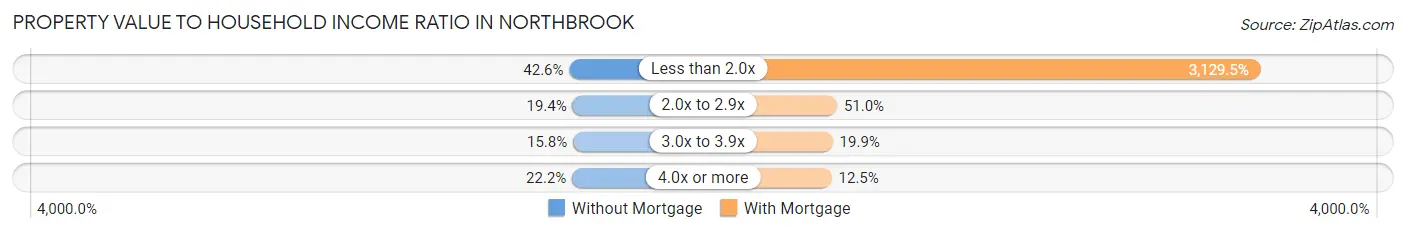
| Value-to-Income Ratio | Without Mortgage | With Mortgage |
| Less than 2.0x | 349 (42.6%) | 69,881 (3,129.5%) |
| 2.0x to 2.9x | 159 (19.4%) | 1,138 (51.0%) |
| 3.0x to 3.9x | 129 (15.8%) | 445 (19.9%) |
| 4.0x or more | 182 (22.2%) | 278 (12.4%) |
| Total | 819 (100.0%) | 2,233 (100.0%) |
Real Estate Taxes by Mortgage Status in Northbrook
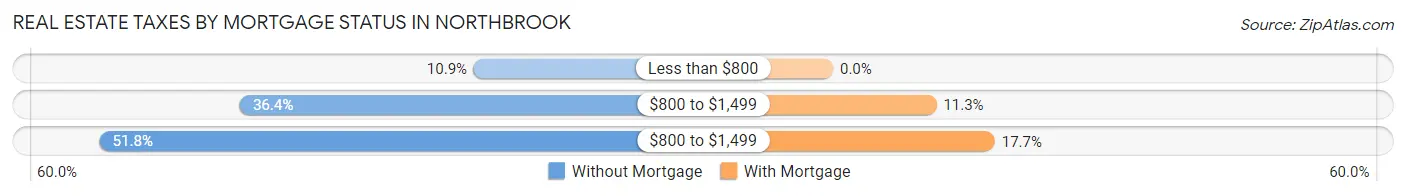
| Property Taxes | Without Mortgage | With Mortgage |
| Less than $800 | 89 (10.9%) | 0 (0.0%) |
| $800 to $1,499 | 298 (36.4%) | 253 (11.3%) |
| $800 to $1,499 | 424 (51.8%) | 396 (17.7%) |
| Total | 819 (100.0%) | 2,233 (100.0%) |
Health & Disability in Northbrook
Health Insurance Coverage by Age in Northbrook
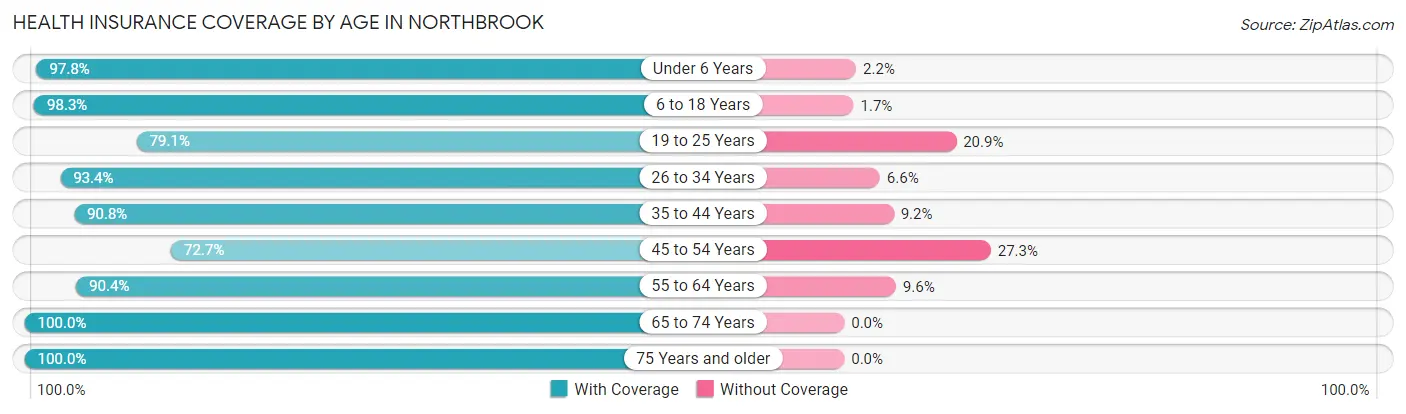
| Age Bracket | With Coverage | Without Coverage |
| Under 6 Years | 887 (97.8%) | 20 (2.2%) |
| 6 to 18 Years | 1,916 (98.3%) | 34 (1.7%) |
| 19 to 25 Years | 1,020 (79.1%) | 269 (20.9%) |
| 26 to 34 Years | 1,082 (93.4%) | 77 (6.6%) |
| 35 to 44 Years | 1,340 (90.8%) | 136 (9.2%) |
| 45 to 54 Years | 1,083 (72.7%) | 407 (27.3%) |
| 55 to 64 Years | 1,324 (90.4%) | 141 (9.6%) |
| 65 to 74 Years | 782 (100.0%) | 0 (0.0%) |
| 75 Years and older | 681 (100.0%) | 0 (0.0%) |
| Total | 10,115 (90.3%) | 1,084 (9.7%) |
Health Insurance Coverage by Citizenship Status in Northbrook
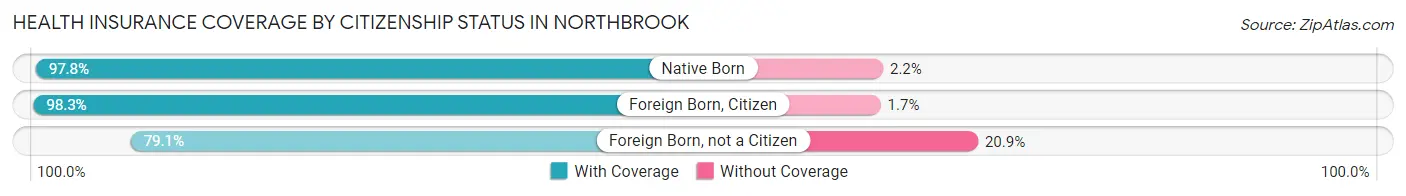
| Citizenship Status | With Coverage | Without Coverage |
| Native Born | 887 (97.8%) | 20 (2.2%) |
| Foreign Born, Citizen | 1,916 (98.3%) | 34 (1.7%) |
| Foreign Born, not a Citizen | 1,020 (79.1%) | 269 (20.9%) |
Health Insurance Coverage by Household Income in Northbrook
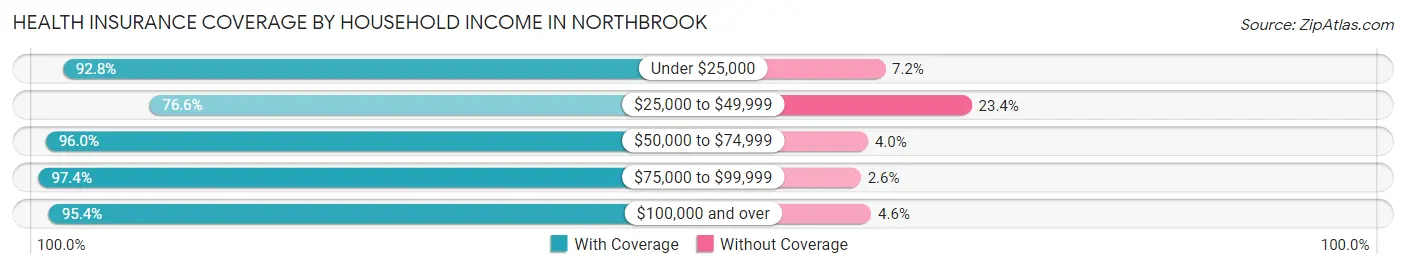
| Household Income | With Coverage | Without Coverage |
| Under $25,000 | 1,022 (92.8%) | 79 (7.2%) |
| $25,000 to $49,999 | 2,406 (76.6%) | 734 (23.4%) |
| $50,000 to $74,999 | 2,472 (96.0%) | 102 (4.0%) |
| $75,000 to $99,999 | 1,529 (97.4%) | 41 (2.6%) |
| $100,000 and over | 2,681 (95.4%) | 128 (4.6%) |
Public vs Private Health Insurance Coverage by Age in Northbrook
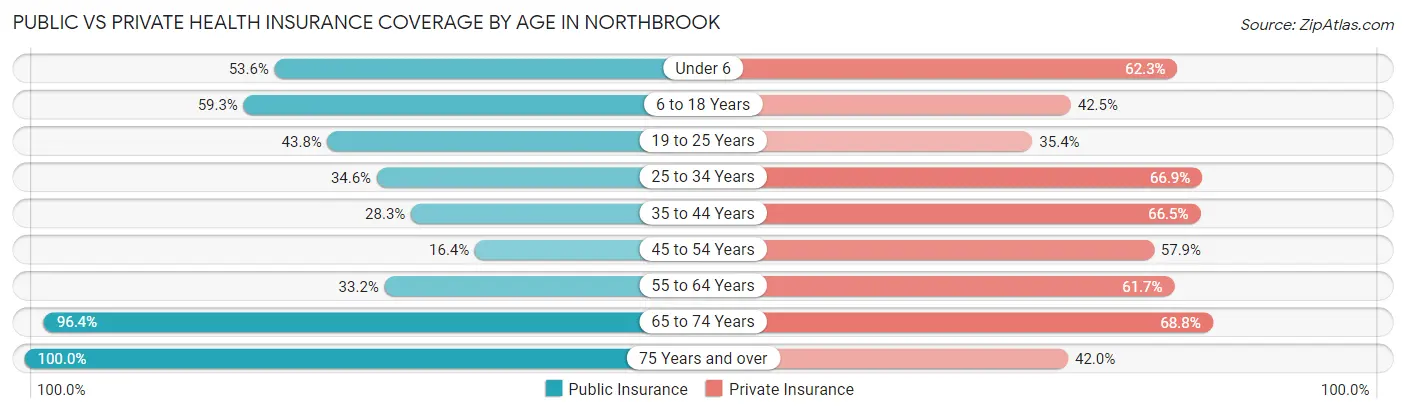
| Age Bracket | Public Insurance | Private Insurance |
| Under 6 | 486 (53.6%) | 565 (62.3%) |
| 6 to 18 Years | 1,157 (59.3%) | 829 (42.5%) |
| 19 to 25 Years | 564 (43.8%) | 456 (35.4%) |
| 25 to 34 Years | 401 (34.6%) | 775 (66.9%) |
| 35 to 44 Years | 417 (28.2%) | 982 (66.5%) |
| 45 to 54 Years | 244 (16.4%) | 863 (57.9%) |
| 55 to 64 Years | 486 (33.2%) | 904 (61.7%) |
| 65 to 74 Years | 754 (96.4%) | 538 (68.8%) |
| 75 Years and over | 681 (100.0%) | 286 (42.0%) |
| Total | 5,190 (46.3%) | 6,198 (55.3%) |
Disability Status by Sex by Age in Northbrook
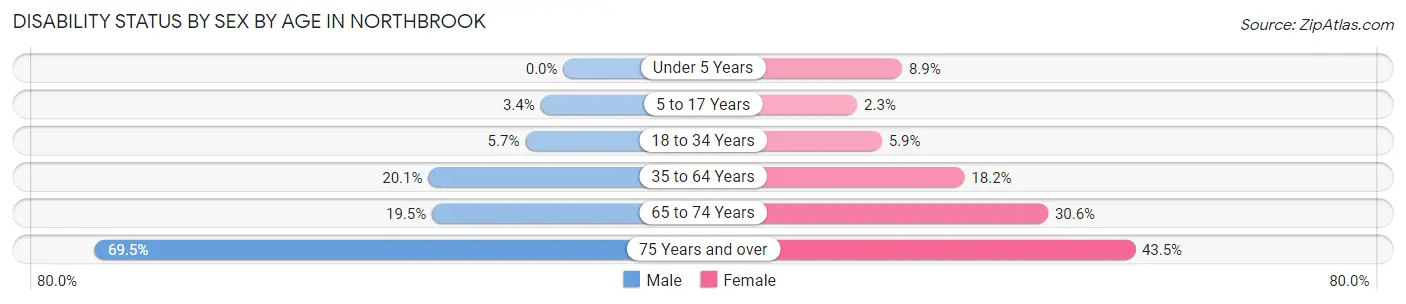
| Age Bracket | Male | Female |
| Under 5 Years | 0 (0.0%) | 33 (8.9%) |
| 5 to 17 Years | 39 (3.4%) | 17 (2.3%) |
| 18 to 34 Years | 81 (5.7%) | 73 (5.9%) |
| 35 to 64 Years | 446 (20.1%) | 402 (18.2%) |
| 65 to 74 Years | 69 (19.5%) | 131 (30.6%) |
| 75 Years and over | 178 (69.5%) | 185 (43.5%) |
Disability Class by Sex by Age in Northbrook
Disability Class: Hearing Difficulty
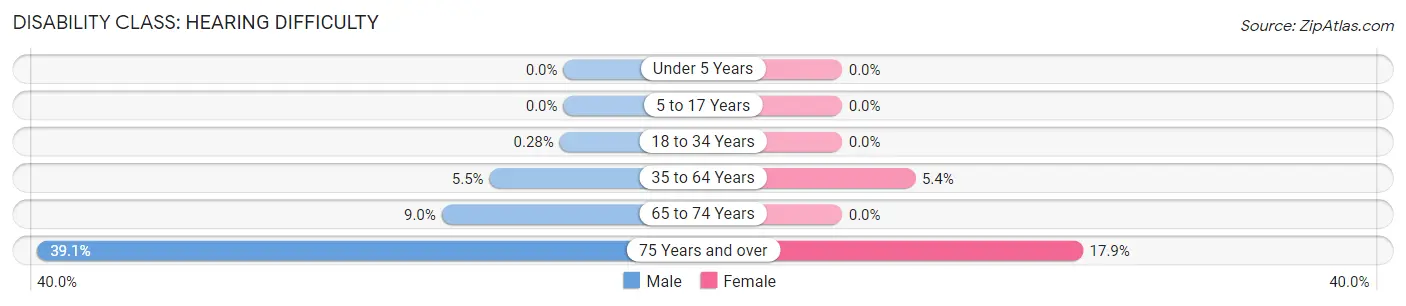
| Age Bracket | Male | Female |
| Under 5 Years | 0 (0.0%) | 0 (0.0%) |
| 5 to 17 Years | 0 (0.0%) | 0 (0.0%) |
| 18 to 34 Years | 4 (0.3%) | 0 (0.0%) |
| 35 to 64 Years | 122 (5.5%) | 120 (5.4%) |
| 65 to 74 Years | 32 (9.0%) | 0 (0.0%) |
| 75 Years and over | 100 (39.1%) | 76 (17.9%) |
Disability Class: Vision Difficulty
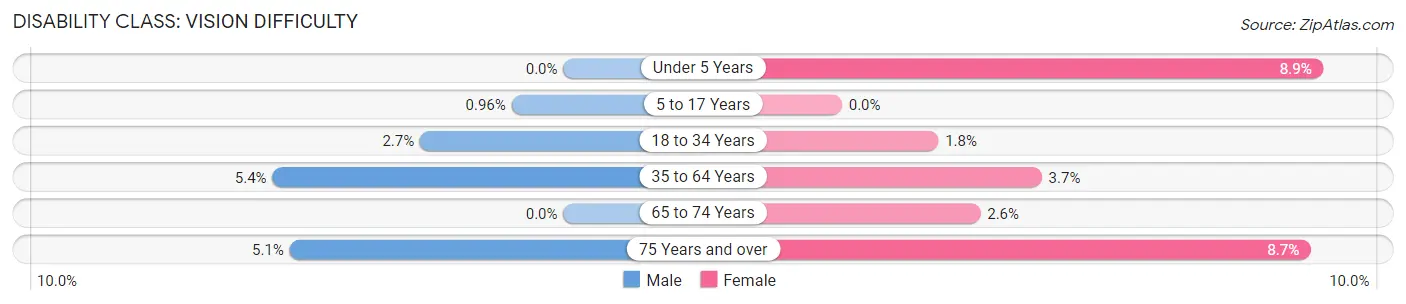
| Age Bracket | Male | Female |
| Under 5 Years | 0 (0.0%) | 33 (8.9%) |
| 5 to 17 Years | 11 (1.0%) | 0 (0.0%) |
| 18 to 34 Years | 38 (2.7%) | 22 (1.8%) |
| 35 to 64 Years | 120 (5.4%) | 82 (3.7%) |
| 65 to 74 Years | 0 (0.0%) | 11 (2.6%) |
| 75 Years and over | 13 (5.1%) | 37 (8.7%) |
Disability Class: Cognitive Difficulty
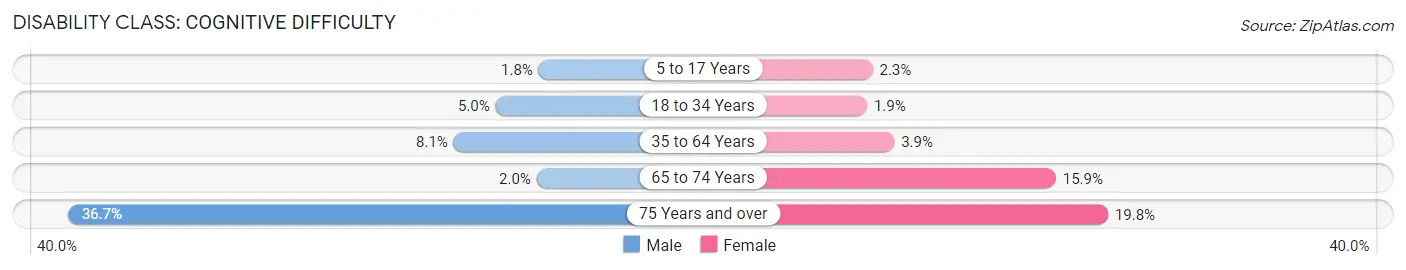
| Age Bracket | Male | Female |
| 5 to 17 Years | 21 (1.8%) | 17 (2.3%) |
| 18 to 34 Years | 72 (5.0%) | 23 (1.9%) |
| 35 to 64 Years | 181 (8.1%) | 86 (3.9%) |
| 65 to 74 Years | 7 (2.0%) | 68 (15.9%) |
| 75 Years and over | 94 (36.7%) | 84 (19.8%) |
Disability Class: Ambulatory Difficulty
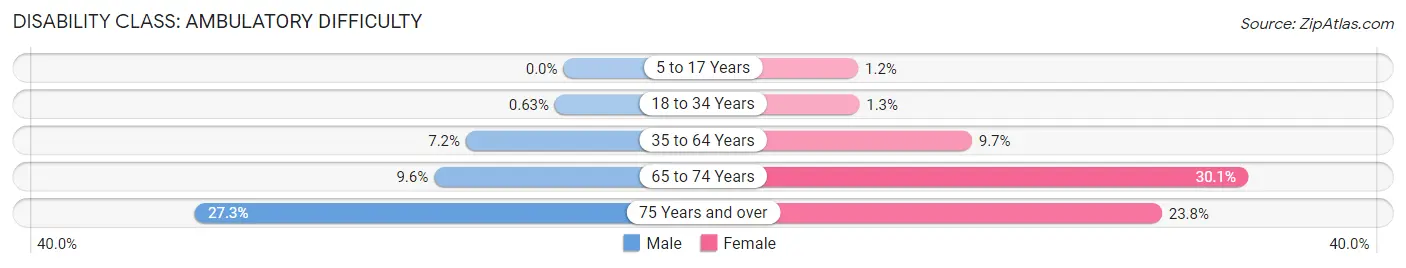
| Age Bracket | Male | Female |
| 5 to 17 Years | 0 (0.0%) | 9 (1.2%) |
| 18 to 34 Years | 9 (0.6%) | 16 (1.3%) |
| 35 to 64 Years | 161 (7.2%) | 213 (9.7%) |
| 65 to 74 Years | 34 (9.6%) | 129 (30.1%) |
| 75 Years and over | 70 (27.3%) | 101 (23.8%) |
Disability Class: Self-Care Difficulty
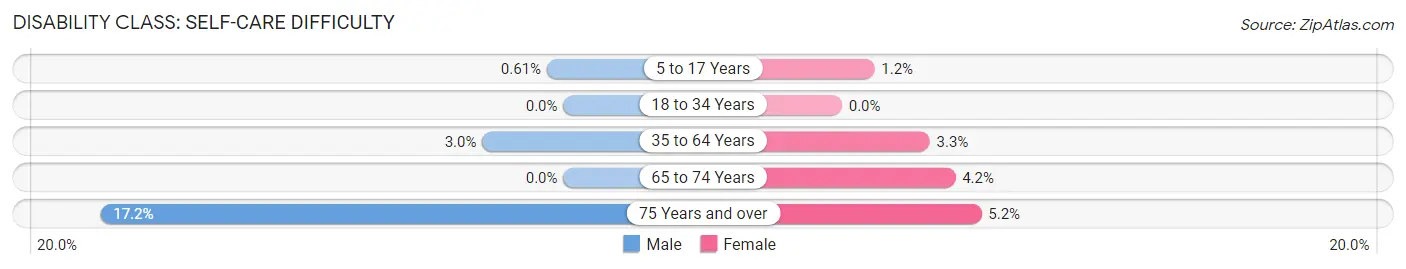
| Age Bracket | Male | Female |
| 5 to 17 Years | 7 (0.6%) | 9 (1.2%) |
| 18 to 34 Years | 0 (0.0%) | 0 (0.0%) |
| 35 to 64 Years | 67 (3.0%) | 72 (3.3%) |
| 65 to 74 Years | 0 (0.0%) | 18 (4.2%) |
| 75 Years and over | 44 (17.2%) | 22 (5.2%) |
Technology Access in Northbrook
Computing Device Access in Northbrook
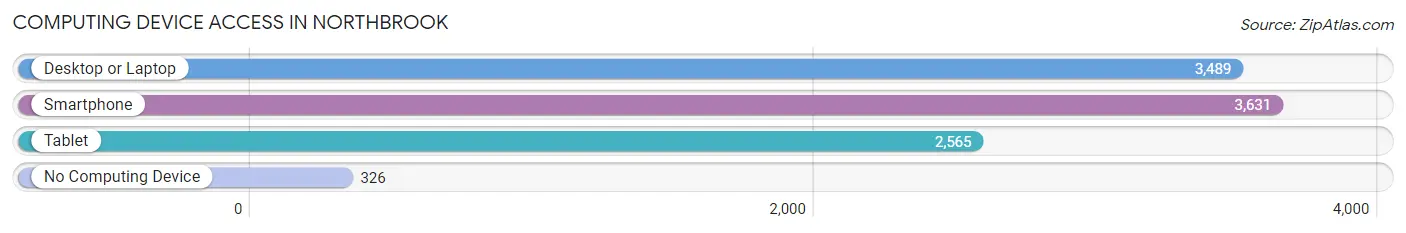
| Device Type | # Households | % Households |
| Desktop or Laptop | 3,489 | 81.5% |
| Smartphone | 3,631 | 84.9% |
| Tablet | 2,565 | 59.9% |
| No Computing Device | 326 | 7.6% |
| Total | 4,279 | 100.0% |
Internet Access in Northbrook
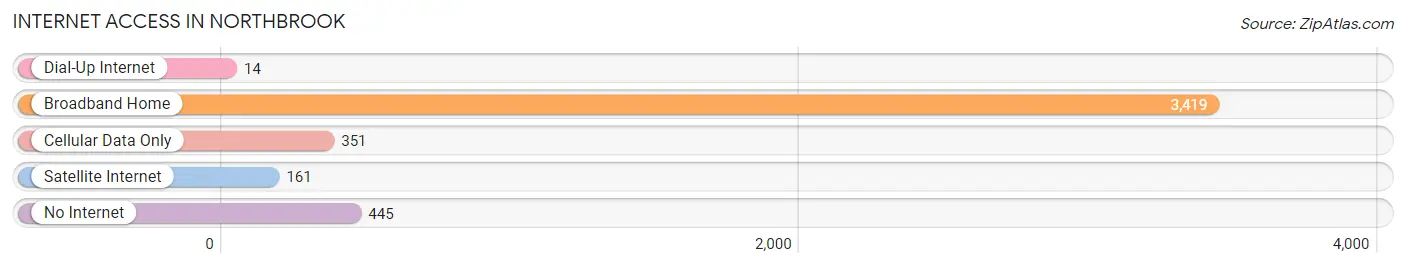
| Internet Type | # Households | % Households |
| Dial-Up Internet | 14 | 0.3% |
| Broadband Home | 3,419 | 79.9% |
| Cellular Data Only | 351 | 8.2% |
| Satellite Internet | 161 | 3.8% |
| No Internet | 445 | 10.4% |
| Total | 4,279 | 100.0% |
Northbrook Summary
Northbrook, Ohio is a small village located in Hamilton County, Ohio. It is situated on the banks of the Little Miami River, just north of Cincinnati. The village was founded in 1817 and has a population of approximately 1,500 people.
Geography
Northbrook is located in the southwestern corner of Hamilton County, Ohio. It is situated on the banks of the Little Miami River, just north of Cincinnati. The village is bordered by the cities of Cincinnati, Blue Ash, and Montgomery. The village is located in the Cincinnati metropolitan area, which is the 28th largest metropolitan area in the United States. The village is located in the Little Miami River Valley, which is a region of rolling hills and valleys. The village is located in the Eastern Standard Time Zone.
Economy
Northbrook’s economy is largely based on the service industry. The village is home to several small businesses, including restaurants, retail stores, and professional services. The village is also home to a number of manufacturing companies, including a plastics manufacturer and a metal fabrication company. The village is also home to a number of small farms, which produce a variety of crops, including corn, soybeans, and wheat.
Demographics
As of the 2010 census, the population of Northbrook was 1,500 people. The racial makeup of the village was 95.3% White, 1.3% African American, 0.7% Asian, 0.3% Native American, and 2.3% from other races. The median household income in the village was $50,000, and the median family income was $60,000. The per capita income in the village was $25,000.
History
Northbrook was founded in 1817 by a group of settlers from North Carolina. The village was originally known as North Brook, but the name was changed to Northbrook in 1820. The village was incorporated in 1845. The village was originally a farming community, but it began to grow in the late 19th century when the Cincinnati, Hamilton, and Dayton Railroad was built through the village. The village was also home to a number of manufacturing companies, including a plastics manufacturer and a metal fabrication company. The village was also home to a number of small farms, which produced a variety of crops, including corn, soybeans, and wheat.
In the late 20th century, the village began to experience a decline in population as many of the manufacturing companies moved away. The village has since experienced a resurgence in population, as many of the businesses have returned to the village. The village is now home to a number of small businesses, including restaurants, retail stores, and professional services. The village is also home to a number of small farms, which produce a variety of crops, including corn, soybeans, and wheat.
Common Questions
What is Per Capita Income in Northbrook?
Per Capita income in Northbrook is $26,977.
What is the Median Family Income in Northbrook?
Median Family Income in Northbrook is $67,661.
What is the Median Household income in Northbrook?
Median Household Income in Northbrook is $55,710.
What is Income or Wage Gap in Northbrook?
Income or Wage Gap in Northbrook is 2.8%.
Women in Northbrook earn 97.2 cents for every dollar earned by a man.
What is Inequality or Gini Index in Northbrook?
Inequality or Gini Index in Northbrook is 0.38.
What is the Total Population of Northbrook?
Total Population of Northbrook is 11,199.
What is the Total Male Population of Northbrook?
Total Male Population of Northbrook is 5,796.
What is the Total Female Population of Northbrook?
Total Female Population of Northbrook is 5,403.
What is the Ratio of Males per 100 Females in Northbrook?
There are 107.27 Males per 100 Females in Northbrook.
What is the Ratio of Females per 100 Males in Northbrook?
There are 93.22 Females per 100 Males in Northbrook.
What is the Median Population Age in Northbrook?
Median Population Age in Northbrook is 36.5 Years.
What is the Average Family Size in Northbrook
Average Family Size in Northbrook is 3.2 People.
What is the Average Household Size in Northbrook
Average Household Size in Northbrook is 2.6 People.
How Large is the Labor Force in Northbrook?
There are 5,895 People in the Labor Forcein in Northbrook.
What is the Percentage of People in the Labor Force in Northbrook?
67.9% of People are in the Labor Force in Northbrook.
What is the Unemployment Rate in Northbrook?
Unemployment Rate in Northbrook is 4.6%.