South Euclid, OH Map & Demographics
South Euclid Map
South Euclid Overview
$35,667
PER CAPITA INCOME
$82,595
AVG FAMILY INCOME
$75,933
AVG HOUSEHOLD INCOME
8.1%
WAGE / INCOME GAP [ % ]
91.9¢/ $1
WAGE / INCOME GAP [ $ ]
0.40
INEQUALITY / GINI INDEX
21,754
TOTAL POPULATION
11,023
MALE POPULATION
10,731
FEMALE POPULATION
102.72
MALES / 100 FEMALES
97.35
FEMALES / 100 MALES
36.1
MEDIAN AGE
3.1
AVG FAMILY SIZE
2.4
AVG HOUSEHOLD SIZE
12,030
LABOR FORCE [ PEOPLE ]
68.3%
PERCENT IN LABOR FORCE
5.9%
UNEMPLOYMENT RATE
Income in South Euclid
Income Overview in South Euclid
Per Capita Income in South Euclid is $35,667, while median incomes of families and households are $82,595 and $75,933 respectively.
| Characteristic | Number | Measure |
| Per Capita Income | 21,754 | $35,667 |
| Median Family Income | 5,253 | $82,595 |
| Mean Family Income | 5,253 | $100,669 |
| Median Household Income | 8,756 | $75,933 |
| Mean Household Income | 8,756 | $86,368 |
| Income Deficit | 5,253 | $0 |
| Wage / Income Gap (%) | 21,754 | 8.10% |
| Wage / Income Gap ($) | 21,754 | 91.90¢ per $1 |
| Gini / Inequality Index | 21,754 | 0.40 |
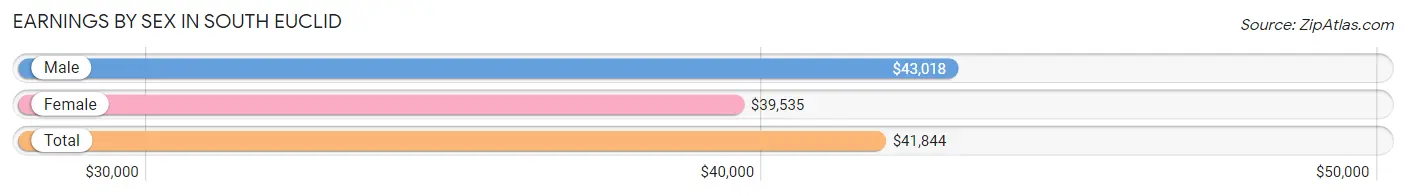
Earnings by Sex in South Euclid
Average Earnings in South Euclid are $41,844, $43,018 for men and $39,535 for women, a difference of 8.1%.
| Sex | Number | Average Earnings |
| Male | 5,992 (48.0%) | $43,018 |
| Female | 6,486 (52.0%) | $39,535 |
| Total | 12,478 (100.0%) | $41,844 |
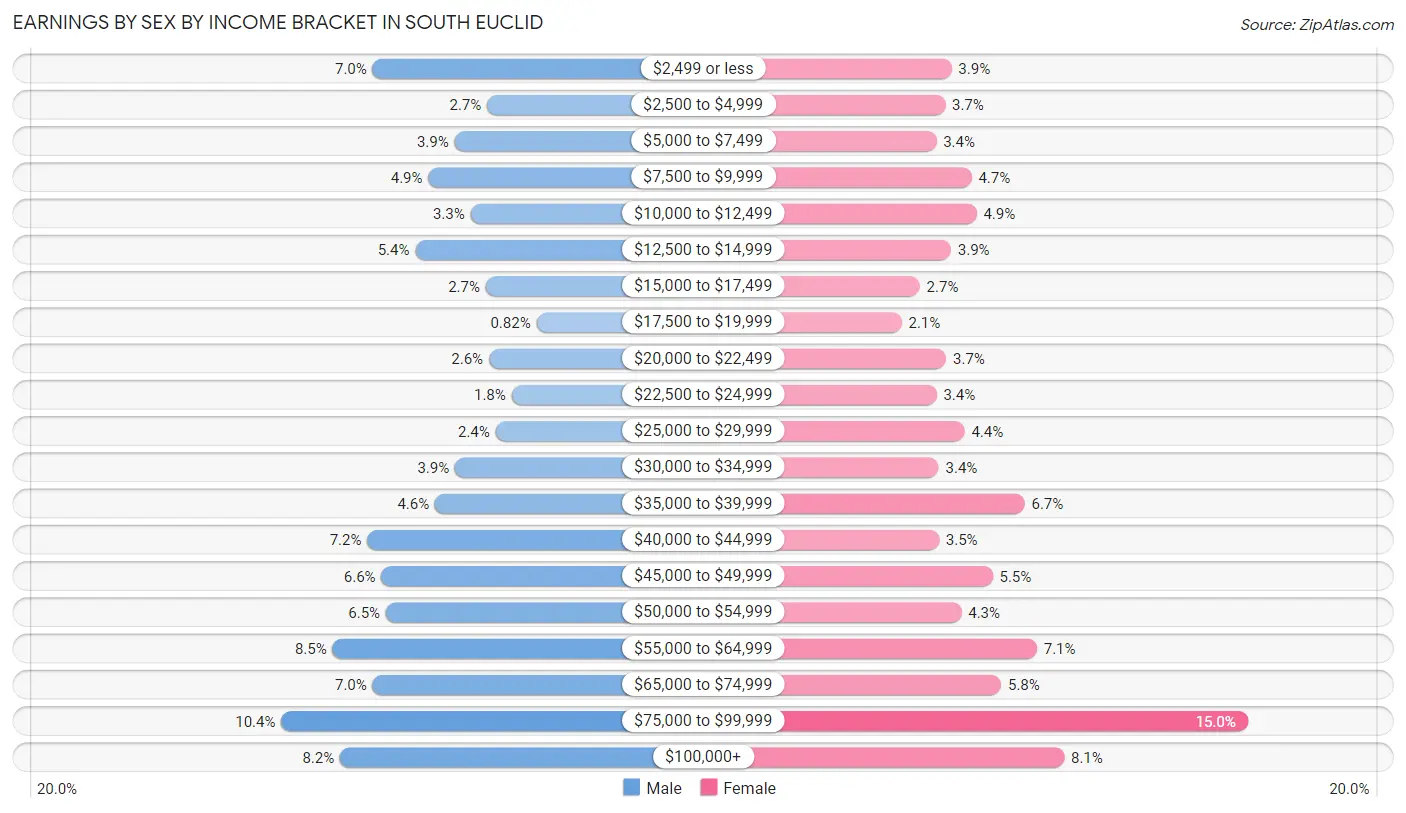
Earnings by Sex by Income Bracket in South Euclid
The most common earnings brackets in South Euclid are $75,000 to $99,999 for men (622 | 10.4%) and $75,000 to $99,999 for women (974 | 15.0%).
| Income | Male | Female |
| $2,499 or less | 417 (7.0%) | 254 (3.9%) |
| $2,500 to $4,999 | 160 (2.7%) | 239 (3.7%) |
| $5,000 to $7,499 | 233 (3.9%) | 217 (3.4%) |
| $7,500 to $9,999 | 292 (4.9%) | 303 (4.7%) |
| $10,000 to $12,499 | 197 (3.3%) | 315 (4.9%) |
| $12,500 to $14,999 | 321 (5.4%) | 253 (3.9%) |
| $15,000 to $17,499 | 163 (2.7%) | 177 (2.7%) |
| $17,500 to $19,999 | 49 (0.8%) | 133 (2.1%) |
| $20,000 to $22,499 | 156 (2.6%) | 241 (3.7%) |
| $22,500 to $24,999 | 105 (1.8%) | 218 (3.4%) |
| $25,000 to $29,999 | 141 (2.4%) | 286 (4.4%) |
| $30,000 to $34,999 | 232 (3.9%) | 223 (3.4%) |
| $35,000 to $39,999 | 277 (4.6%) | 432 (6.7%) |
| $40,000 to $44,999 | 429 (7.2%) | 224 (3.5%) |
| $45,000 to $49,999 | 397 (6.6%) | 354 (5.5%) |
| $50,000 to $54,999 | 387 (6.5%) | 278 (4.3%) |
| $55,000 to $64,999 | 507 (8.5%) | 462 (7.1%) |
| $65,000 to $74,999 | 417 (7.0%) | 375 (5.8%) |
| $75,000 to $99,999 | 622 (10.4%) | 974 (15.0%) |
| $100,000+ | 490 (8.2%) | 528 (8.1%) |
| Total | 5,992 (100.0%) | 6,486 (100.0%) |
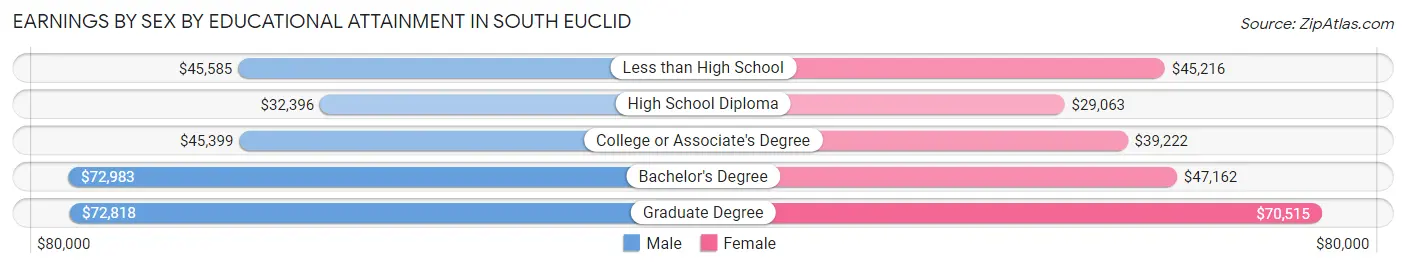
Earnings by Sex by Educational Attainment in South Euclid
Average earnings in South Euclid are $49,924 for men and $46,504 for women, a difference of 6.9%. Men with an educational attainment of bachelor's degree enjoy the highest average annual earnings of $72,983, while those with high school diploma education earn the least with $32,396. Women with an educational attainment of graduate degree earn the most with the average annual earnings of $70,515, while those with high school diploma education have the smallest earnings of $29,063.
| Educational Attainment | Male Income | Female Income |
| Less than High School | $45,585 | $45,216 |
| High School Diploma | $32,396 | $29,063 |
| College or Associate's Degree | $45,399 | $39,222 |
| Bachelor's Degree | $72,983 | $47,162 |
| Graduate Degree | $72,818 | $70,515 |
| Total | $49,924 | $46,504 |
Family Income in South Euclid
Family Income Brackets in South Euclid
According to the South Euclid family income data, there are 1,266 families falling into the $75,000 to $99,999 income range, which is the most common income bracket and makes up 24.1% of all families. Conversely, the $15,000 to $24,999 income bracket is the least frequent group with only 100 families (1.9%) belonging to this category.
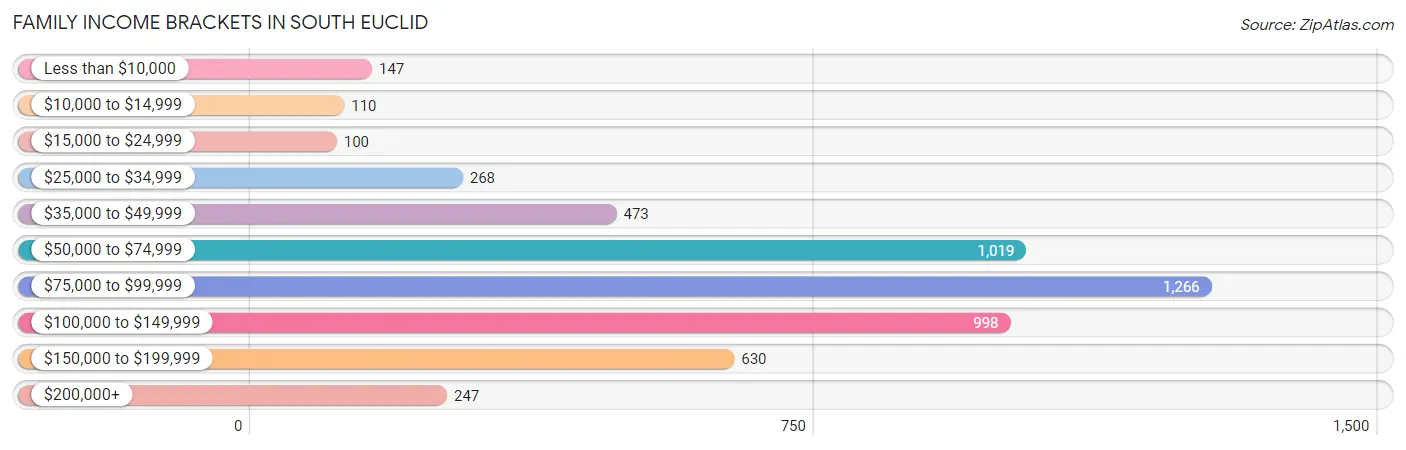
| Income Bracket | # Families | % Families |
| Less than $10,000 | 147 | 2.8% |
| $10,000 to $14,999 | 110 | 2.1% |
| $15,000 to $24,999 | 100 | 1.9% |
| $25,000 to $34,999 | 268 | 5.1% |
| $35,000 to $49,999 | 473 | 9.0% |
| $50,000 to $74,999 | 1,019 | 19.4% |
| $75,000 to $99,999 | 1,266 | 24.1% |
| $100,000 to $149,999 | 998 | 19.0% |
| $150,000 to $199,999 | 630 | 12.0% |
| $200,000+ | 247 | 4.7% |
Family Income by Famaliy Size in South Euclid
3-person families (1,163 | 22.1%) account for the highest median family income in South Euclid with $91,280 per family, while 2-person families (2,661 | 50.7%) have the highest median income of $39,962 per family member.
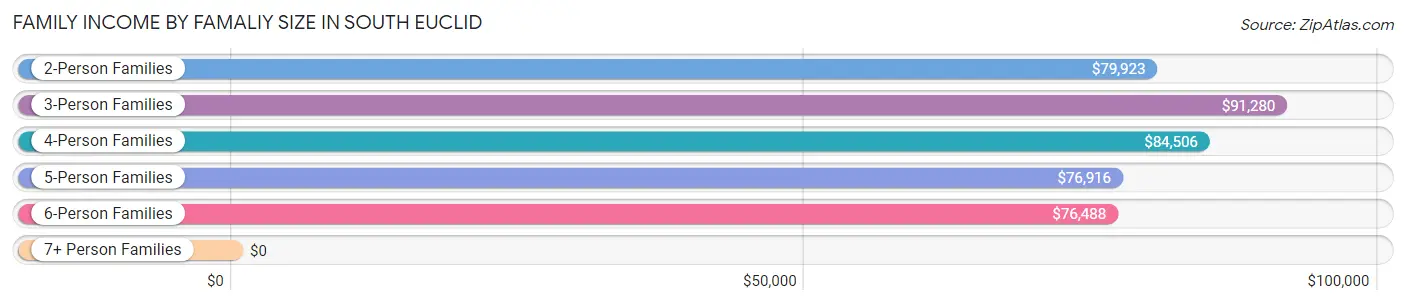
| Income Bracket | # Families | Median Income |
| 2-Person Families | 2,661 (50.7%) | $79,923 |
| 3-Person Families | 1,163 (22.1%) | $91,280 |
| 4-Person Families | 943 (17.9%) | $84,506 |
| 5-Person Families | 381 (7.2%) | $76,916 |
| 6-Person Families | 97 (1.8%) | $76,488 |
| 7+ Person Families | 8 (0.2%) | $0 |
| Total | 5,253 (100.0%) | $82,595 |
Family Income by Number of Earners in South Euclid
The median family income in South Euclid is $82,595, with families comprising 3+ earners (350) having the highest median family income of $136,515, while families with no earners (555) have the lowest median family income of $52,049, accounting for 6.7% and 10.6% of families, respectively.
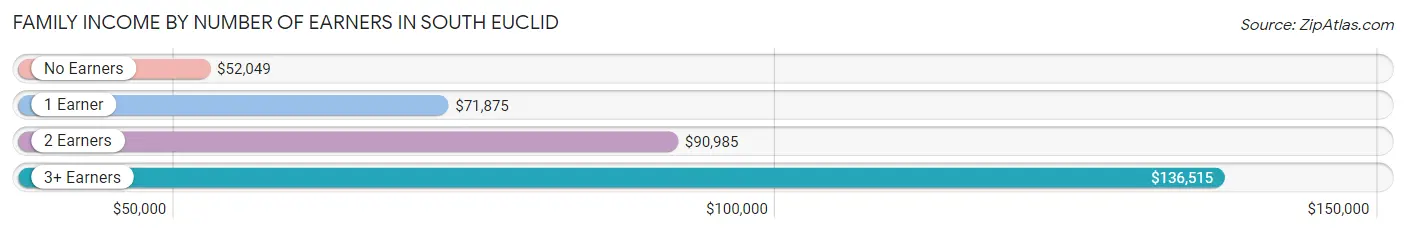
| Number of Earners | # Families | Median Income |
| No Earners | 555 (10.6%) | $52,049 |
| 1 Earner | 1,686 (32.1%) | $71,875 |
| 2 Earners | 2,662 (50.7%) | $90,985 |
| 3+ Earners | 350 (6.7%) | $136,515 |
| Total | 5,253 (100.0%) | $82,595 |
Household Income in South Euclid
Household Income Brackets in South Euclid
With 1,874 households falling in the category, the $75,000 to $99,999 income range is the most frequent in South Euclid, accounting for 21.4% of all households. In contrast, only 298 households (3.4%) fall into the $200,000+ income bracket, making it the least populous group.
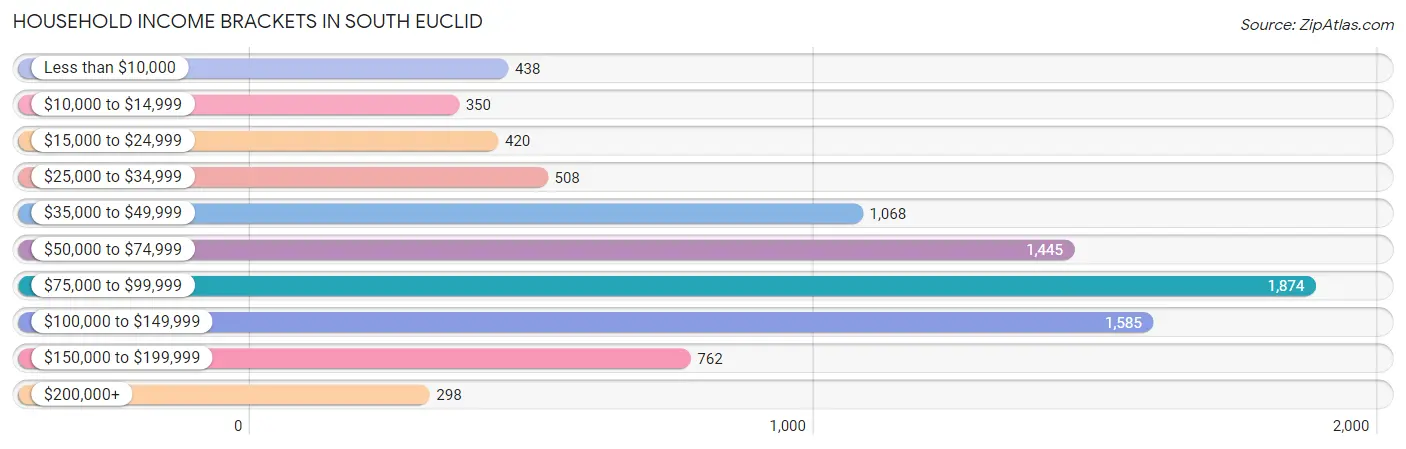
| Income Bracket | # Households | % Households |
| Less than $10,000 | 438 | 5.0% |
| $10,000 to $14,999 | 350 | 4.0% |
| $15,000 to $24,999 | 420 | 4.8% |
| $25,000 to $34,999 | 508 | 5.8% |
| $35,000 to $49,999 | 1,068 | 12.2% |
| $50,000 to $74,999 | 1,445 | 16.5% |
| $75,000 to $99,999 | 1,874 | 21.4% |
| $100,000 to $149,999 | 1,585 | 18.1% |
| $150,000 to $199,999 | 762 | 8.7% |
| $200,000+ | 298 | 3.4% |
Household Income by Householder Age in South Euclid
The median household income in South Euclid is $75,933, with the highest median household income of $82,864 found in the 25 to 44 years age bracket for the primary householder. A total of 2,978 households (34.0%) fall into this category. Meanwhile, the 15 to 24 years age bracket for the primary householder has the lowest median household income of $0, with 318 households (3.6%) in this group.
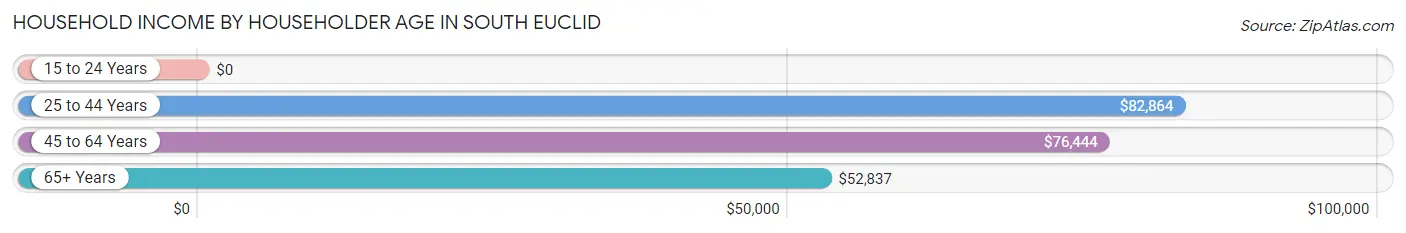
| Income Bracket | # Households | Median Income |
| 15 to 24 Years | 318 (3.6%) | $0 |
| 25 to 44 Years | 2,978 (34.0%) | $82,864 |
| 45 to 64 Years | 3,374 (38.5%) | $76,444 |
| 65+ Years | 2,086 (23.8%) | $52,837 |
| Total | 8,756 (100.0%) | $75,933 |
Poverty in South Euclid
Income Below Poverty by Sex and Age in South Euclid
With 7.6% poverty level for males and 10.1% for females among the residents of South Euclid, 16 and 17 year old males and 15 year old females are the most vulnerable to poverty, with 71 males (17.2%) and 20 females (62.5%) in their respective age groups living below the poverty level.
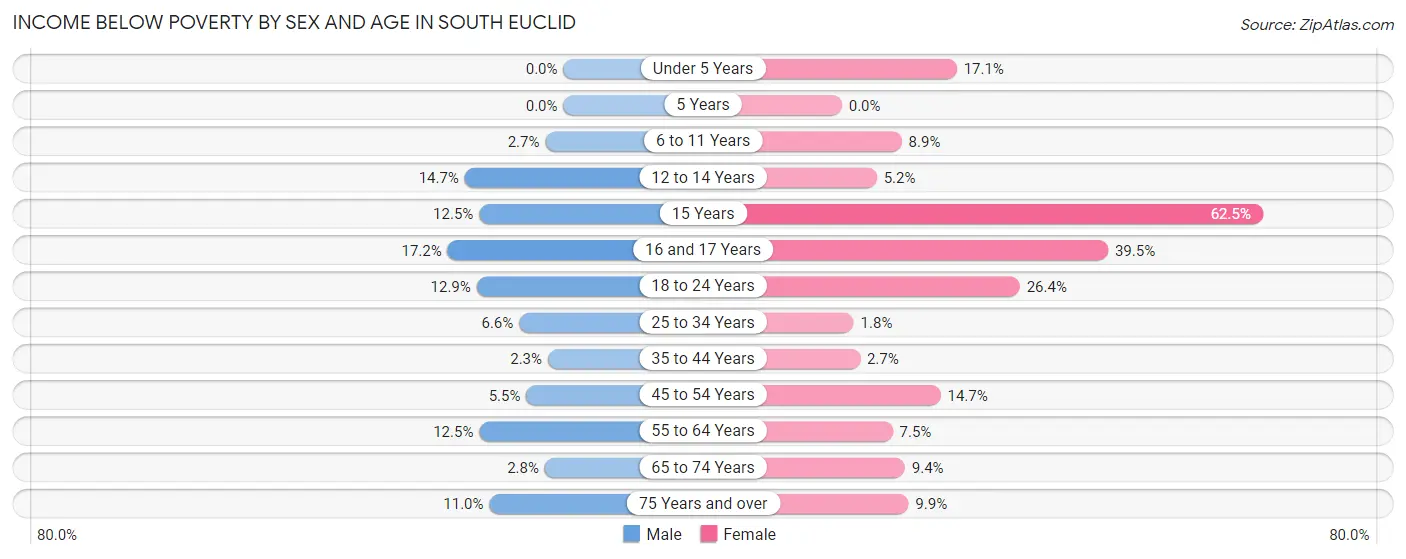
| Age Bracket | Male | Female |
| Under 5 Years | 0 (0.0%) | 95 (17.1%) |
| 5 Years | 0 (0.0%) | 0 (0.0%) |
| 6 to 11 Years | 19 (2.7%) | 49 (8.9%) |
| 12 to 14 Years | 58 (14.6%) | 24 (5.2%) |
| 15 Years | 41 (12.5%) | 20 (62.5%) |
| 16 and 17 Years | 71 (17.2%) | 68 (39.5%) |
| 18 to 24 Years | 197 (12.9%) | 233 (26.4%) |
| 25 to 34 Years | 86 (6.6%) | 23 (1.8%) |
| 35 to 44 Years | 31 (2.3%) | 44 (2.7%) |
| 45 to 54 Years | 61 (5.5%) | 202 (14.7%) |
| 55 to 64 Years | 171 (12.5%) | 109 (7.5%) |
| 65 to 74 Years | 21 (2.8%) | 105 (9.4%) |
| 75 Years and over | 51 (11.0%) | 80 (9.9%) |
| Total | 807 (7.6%) | 1,052 (10.1%) |
Income Above Poverty by Sex and Age in South Euclid
According to the poverty statistics in South Euclid, males aged under 5 years and females aged 5 years are the age groups that are most secure financially, with 100.0% of males and 100.0% of females in these age groups living above the poverty line.
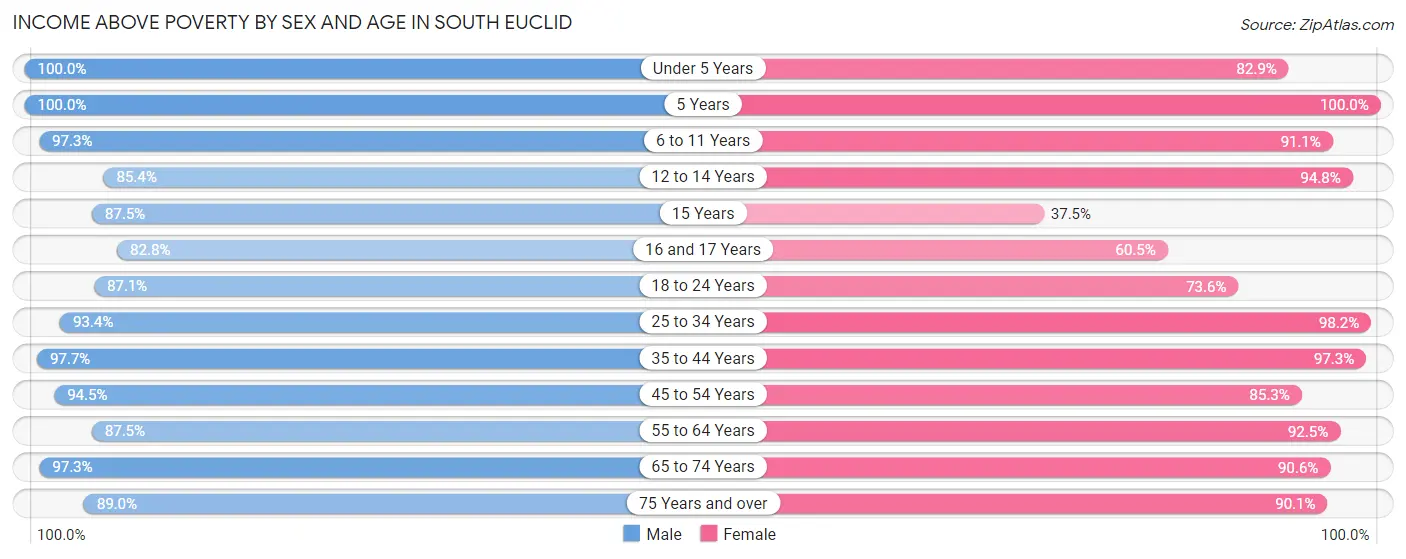
| Age Bracket | Male | Female |
| Under 5 Years | 650 (100.0%) | 462 (82.9%) |
| 5 Years | 202 (100.0%) | 59 (100.0%) |
| 6 to 11 Years | 690 (97.3%) | 502 (91.1%) |
| 12 to 14 Years | 338 (85.4%) | 438 (94.8%) |
| 15 Years | 287 (87.5%) | 12 (37.5%) |
| 16 and 17 Years | 342 (82.8%) | 104 (60.5%) |
| 18 to 24 Years | 1,333 (87.1%) | 649 (73.6%) |
| 25 to 34 Years | 1,223 (93.4%) | 1,286 (98.2%) |
| 35 to 44 Years | 1,314 (97.7%) | 1,585 (97.3%) |
| 45 to 54 Years | 1,048 (94.5%) | 1,176 (85.3%) |
| 55 to 64 Years | 1,198 (87.5%) | 1,336 (92.5%) |
| 65 to 74 Years | 742 (97.3%) | 1,017 (90.6%) |
| 75 Years and over | 413 (89.0%) | 729 (90.1%) |
| Total | 9,780 (92.4%) | 9,355 (89.9%) |
Income Below Poverty Among Married-Couple Families in South Euclid
The poverty statistics for married-couple families in South Euclid show that 2.1% or 68 of the total 3,324 families live below the poverty line. Families with 1 or 2 children have the highest poverty rate of 2.8%, comprising of 24 families. On the other hand, families with 3 or 4 children have the lowest poverty rate of 0.0%, which includes 0 families.
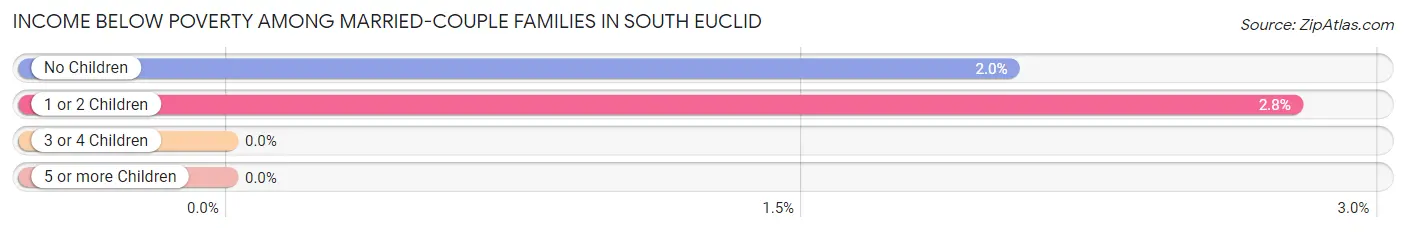
| Children | Above Poverty | Below Poverty |
| No Children | 2,114 (98.0%) | 44 (2.0%) |
| 1 or 2 Children | 838 (97.2%) | 24 (2.8%) |
| 3 or 4 Children | 304 (100.0%) | 0 (0.0%) |
| 5 or more Children | 0 (0.0%) | 0 (0.0%) |
| Total | 3,256 (98.0%) | 68 (2.1%) |
Income Below Poverty Among Single-Parent Households in South Euclid
According to the poverty data in South Euclid, 2.6% or 7 single-father households and 16.6% or 275 single-mother households are living below the poverty line. Among single-father households, those with no children have the highest poverty rate, with 7 households (3.4%) experiencing poverty. Likewise, among single-mother households, those with 1 or 2 children have the highest poverty rate, with 264 households (25.8%) falling below the poverty line.
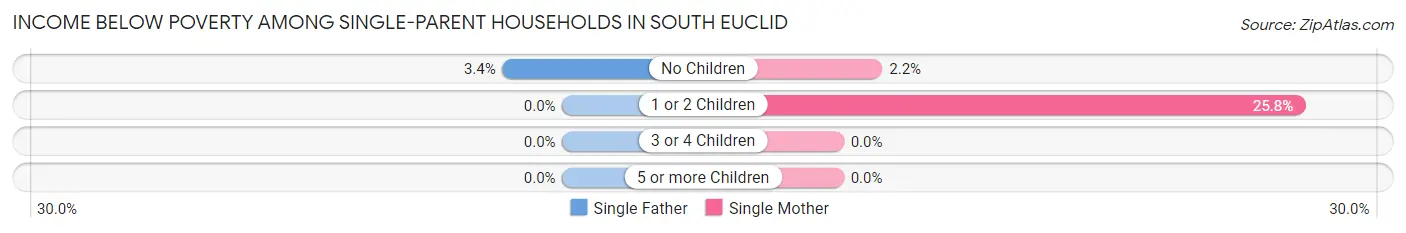
| Children | Single Father | Single Mother |
| No Children | 7 (3.4%) | 11 (2.2%) |
| 1 or 2 Children | 0 (0.0%) | 264 (25.8%) |
| 3 or 4 Children | 0 (0.0%) | 0 (0.0%) |
| 5 or more Children | 0 (0.0%) | 0 (0.0%) |
| Total | 7 (2.6%) | 275 (16.6%) |
Income Below Poverty Among Married-Couple vs Single-Parent Households in South Euclid
The poverty data for South Euclid shows that 68 of the married-couple family households (2.1%) and 282 of the single-parent households (14.6%) are living below the poverty level. Within the married-couple family households, those with 1 or 2 children have the highest poverty rate, with 24 households (2.8%) falling below the poverty line. Among the single-parent households, those with 1 or 2 children have the highest poverty rate, with 264 household (24.3%) living below poverty.
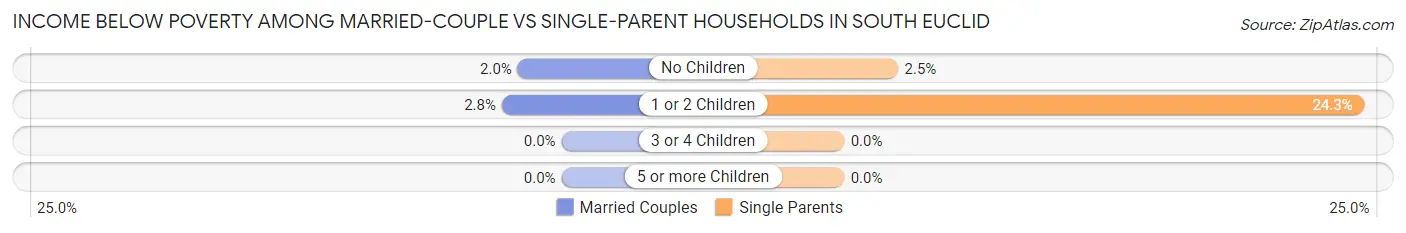
| Children | Married-Couple Families | Single-Parent Households |
| No Children | 44 (2.0%) | 18 (2.5%) |
| 1 or 2 Children | 24 (2.8%) | 264 (24.3%) |
| 3 or 4 Children | 0 (0.0%) | 0 (0.0%) |
| 5 or more Children | 0 (0.0%) | 0 (0.0%) |
| Total | 68 (2.1%) | 282 (14.6%) |
Race in South Euclid
The most populous races in South Euclid are Black / African American (11,297 | 51.9%), White / Caucasian (9,011 | 41.4%), and Two or more Races (951 | 4.4%).
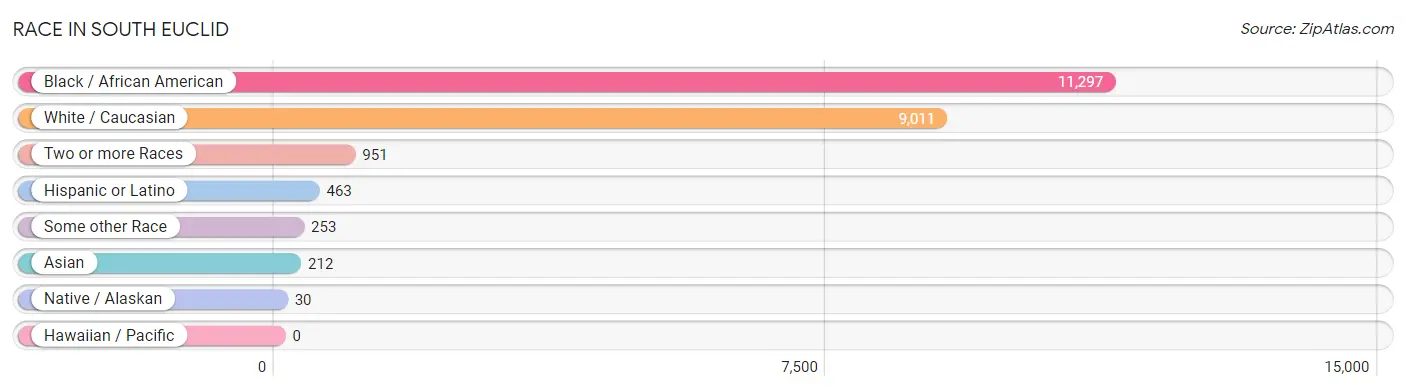
| Race | # Population | % Population |
| Asian | 212 | 1.0% |
| Black / African American | 11,297 | 51.9% |
| Hawaiian / Pacific | 0 | 0.0% |
| Hispanic or Latino | 463 | 2.1% |
| Native / Alaskan | 30 | 0.1% |
| White / Caucasian | 9,011 | 41.4% |
| Two or more Races | 951 | 4.4% |
| Some other Race | 253 | 1.2% |
| Total | 21,754 | 100.0% |
Ancestry in South Euclid
The most populous ancestries reported in South Euclid are German (1,844 | 8.5%), Italian (1,763 | 8.1%), Irish (1,517 | 7.0%), English (770 | 3.5%), and Polish (730 | 3.4%), together accounting for 30.4% of all South Euclid residents.
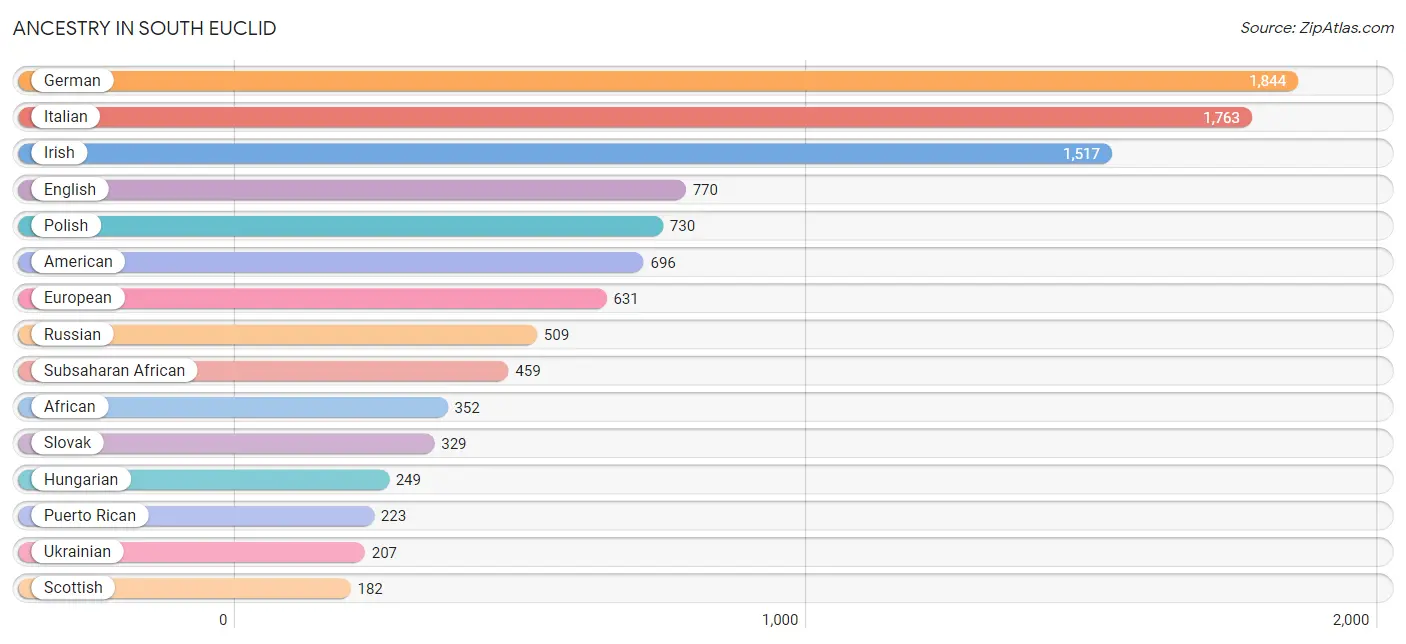
| Ancestry | # Population | % Population |
| African | 352 | 1.6% |
| Albanian | 17 | 0.1% |
| American | 696 | 3.2% |
| Arab | 82 | 0.4% |
| Armenian | 9 | 0.0% |
| Austrian | 69 | 0.3% |
| Belgian | 31 | 0.1% |
| Bhutanese | 66 | 0.3% |
| Blackfeet | 34 | 0.2% |
| Brazilian | 17 | 0.1% |
| British | 151 | 0.7% |
| Burmese | 78 | 0.4% |
| Canadian | 9 | 0.0% |
| Central American | 9 | 0.0% |
| Central American Indian | 8 | 0.0% |
| Cherokee | 50 | 0.2% |
| Chilean | 23 | 0.1% |
| Chippewa | 4 | 0.0% |
| Croatian | 49 | 0.2% |
| Cuban | 24 | 0.1% |
| Czech | 138 | 0.6% |
| Czechoslovakian | 16 | 0.1% |
| Danish | 10 | 0.1% |
| Dutch | 73 | 0.3% |
| Eastern European | 125 | 0.6% |
| English | 770 | 3.5% |
| European | 631 | 2.9% |
| Finnish | 23 | 0.1% |
| French | 76 | 0.4% |
| French Canadian | 30 | 0.1% |
| German | 1,844 | 8.5% |
| German Russian | 6 | 0.0% |
| Ghanaian | 10 | 0.1% |
| Greek | 50 | 0.2% |
| Guamanian / Chamorro | 62 | 0.3% |
| Guatemalan | 9 | 0.0% |
| Guyanese | 75 | 0.3% |
| Hungarian | 249 | 1.1% |
| Indian (Asian) | 72 | 0.3% |
| Irish | 1,517 | 7.0% |
| Israeli | 25 | 0.1% |
| Italian | 1,763 | 8.1% |
| Jamaican | 118 | 0.5% |
| Japanese | 30 | 0.1% |
| Korean | 2 | 0.0% |
| Lebanese | 24 | 0.1% |
| Liberian | 10 | 0.1% |
| Lithuanian | 71 | 0.3% |
| Malaysian | 10 | 0.1% |
| Mexican | 119 | 0.5% |
| Mongolian | 4 | 0.0% |
| Navajo | 10 | 0.1% |
| Nigerian | 89 | 0.4% |
| Northern European | 6 | 0.0% |
| Norwegian | 75 | 0.3% |
| Palestinian | 14 | 0.1% |
| Pennsylvania German | 14 | 0.1% |
| Peruvian | 16 | 0.1% |
| Polish | 730 | 3.4% |
| Puerto Rican | 223 | 1.0% |
| Romanian | 8 | 0.0% |
| Russian | 509 | 2.3% |
| Scandinavian | 39 | 0.2% |
| Scotch-Irish | 103 | 0.5% |
| Scottish | 182 | 0.8% |
| Sierra Leonean | 1 | 0.0% |
| Slovak | 329 | 1.5% |
| Slovene | 109 | 0.5% |
| South American | 39 | 0.2% |
| Spaniard | 4 | 0.0% |
| Sri Lankan | 15 | 0.1% |
| Subsaharan African | 459 | 2.1% |
| Swedish | 107 | 0.5% |
| Swiss | 9 | 0.0% |
| Thai | 63 | 0.3% |
| Ukrainian | 207 | 0.9% |
| Welsh | 41 | 0.2% |
| West Indian | 24 | 0.1% | View All 78 Rows |
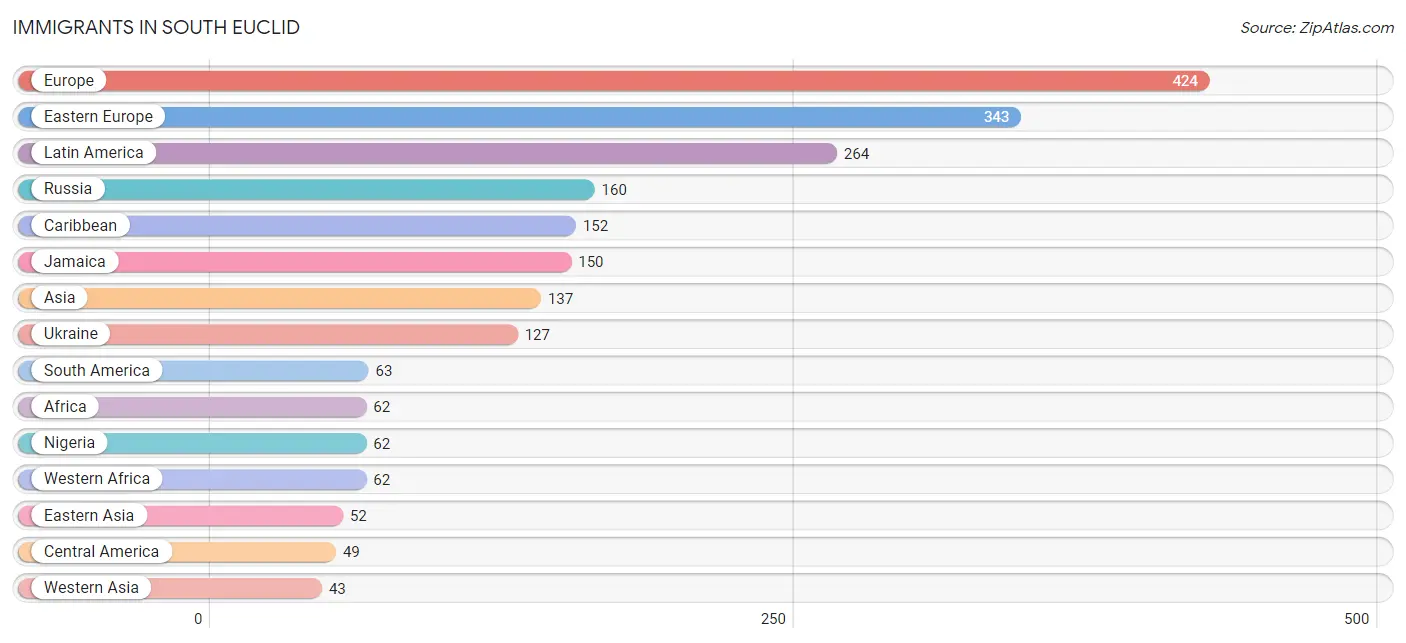
Immigrants in South Euclid
The most numerous immigrant groups reported in South Euclid came from Europe (424 | 1.9%), Eastern Europe (343 | 1.6%), Latin America (264 | 1.2%), Russia (160 | 0.7%), and Caribbean (152 | 0.7%), together accounting for 6.2% of all South Euclid residents.
| Immigration Origin | # Population | % Population |
| Africa | 62 | 0.3% |
| Albania | 8 | 0.0% |
| Asia | 137 | 0.6% |
| Austria | 6 | 0.0% |
| Belarus | 7 | 0.0% |
| Brazil | 17 | 0.1% |
| Canada | 6 | 0.0% |
| Caribbean | 152 | 0.7% |
| Central America | 49 | 0.2% |
| China | 30 | 0.1% |
| Croatia | 13 | 0.1% |
| Cuba | 2 | 0.0% |
| Eastern Asia | 52 | 0.2% |
| Eastern Europe | 343 | 1.6% |
| Europe | 424 | 1.9% |
| Germany | 22 | 0.1% |
| Guatemala | 9 | 0.0% |
| Guyana | 39 | 0.2% |
| Honduras | 24 | 0.1% |
| Hong Kong | 10 | 0.1% |
| India | 27 | 0.1% |
| Israel | 25 | 0.1% |
| Italy | 31 | 0.1% |
| Jamaica | 150 | 0.7% |
| Korea | 22 | 0.1% |
| Latin America | 264 | 1.2% |
| Lithuania | 15 | 0.1% |
| Mexico | 16 | 0.1% |
| Moldova | 3 | 0.0% |
| Nepal | 7 | 0.0% |
| Nigeria | 62 | 0.3% |
| Northern Europe | 18 | 0.1% |
| Peru | 7 | 0.0% |
| Poland | 10 | 0.1% |
| Russia | 160 | 0.7% |
| Scotland | 14 | 0.1% |
| South America | 63 | 0.3% |
| South Central Asia | 37 | 0.2% |
| South Eastern Asia | 5 | 0.0% |
| Southern Europe | 35 | 0.2% |
| Spain | 4 | 0.0% |
| Ukraine | 127 | 0.6% |
| Uzbekistan | 3 | 0.0% |
| Vietnam | 5 | 0.0% |
| Western Africa | 62 | 0.3% |
| Western Asia | 43 | 0.2% |
| Western Europe | 28 | 0.1% | View All 47 Rows |
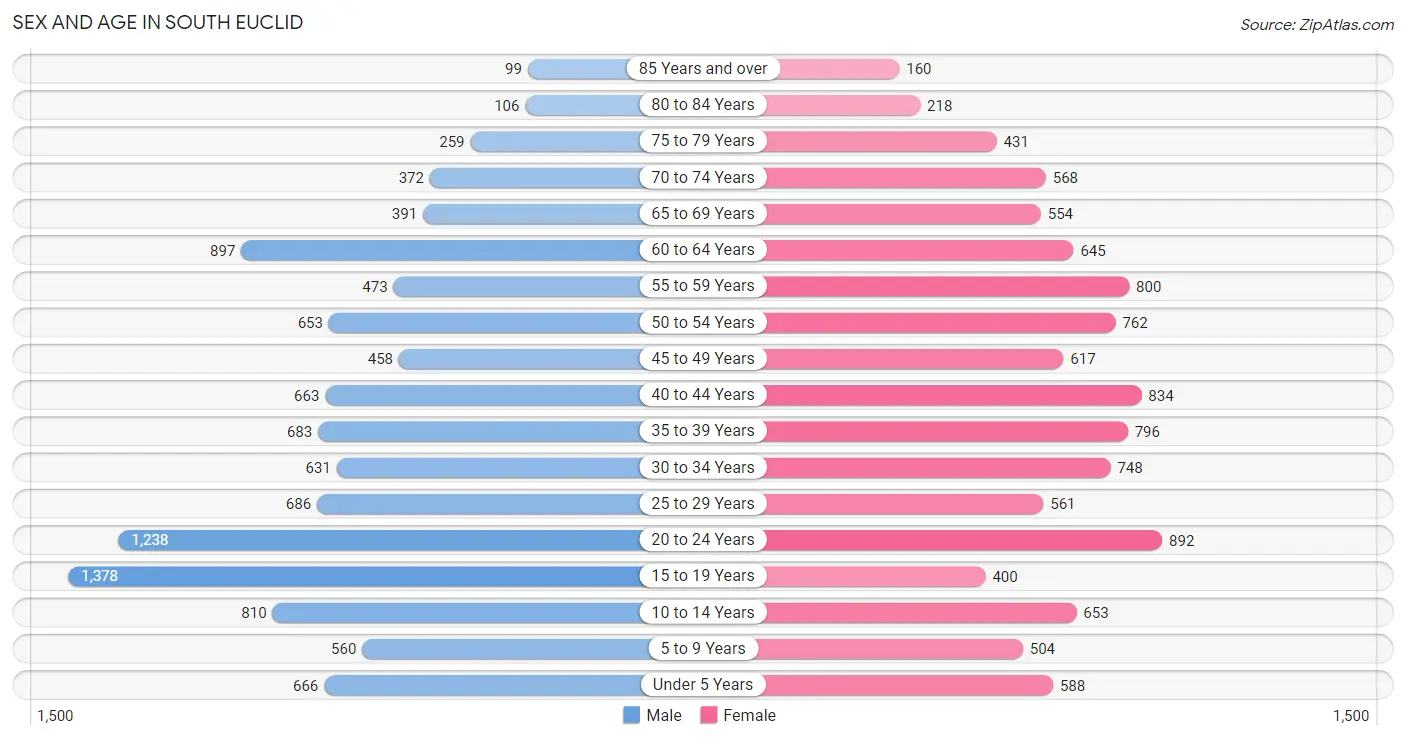
Sex and Age in South Euclid
Sex and Age in South Euclid
The most populous age groups in South Euclid are 15 to 19 Years (1,378 | 12.5%) for men and 20 to 24 Years (892 | 8.3%) for women.
| Age Bracket | Male | Female |
| Under 5 Years | 666 (6.0%) | 588 (5.5%) |
| 5 to 9 Years | 560 (5.1%) | 504 (4.7%) |
| 10 to 14 Years | 810 (7.3%) | 653 (6.1%) |
| 15 to 19 Years | 1,378 (12.5%) | 400 (3.7%) |
| 20 to 24 Years | 1,238 (11.2%) | 892 (8.3%) |
| 25 to 29 Years | 686 (6.2%) | 561 (5.2%) |
| 30 to 34 Years | 631 (5.7%) | 748 (7.0%) |
| 35 to 39 Years | 683 (6.2%) | 796 (7.4%) |
| 40 to 44 Years | 663 (6.0%) | 834 (7.8%) |
| 45 to 49 Years | 458 (4.2%) | 617 (5.8%) |
| 50 to 54 Years | 653 (5.9%) | 762 (7.1%) |
| 55 to 59 Years | 473 (4.3%) | 800 (7.5%) |
| 60 to 64 Years | 897 (8.1%) | 645 (6.0%) |
| 65 to 69 Years | 391 (3.5%) | 554 (5.2%) |
| 70 to 74 Years | 372 (3.4%) | 568 (5.3%) |
| 75 to 79 Years | 259 (2.4%) | 431 (4.0%) |
| 80 to 84 Years | 106 (1.0%) | 218 (2.0%) |
| 85 Years and over | 99 (0.9%) | 160 (1.5%) |
| Total | 11,023 (100.0%) | 10,731 (100.0%) |
Families and Households in South Euclid
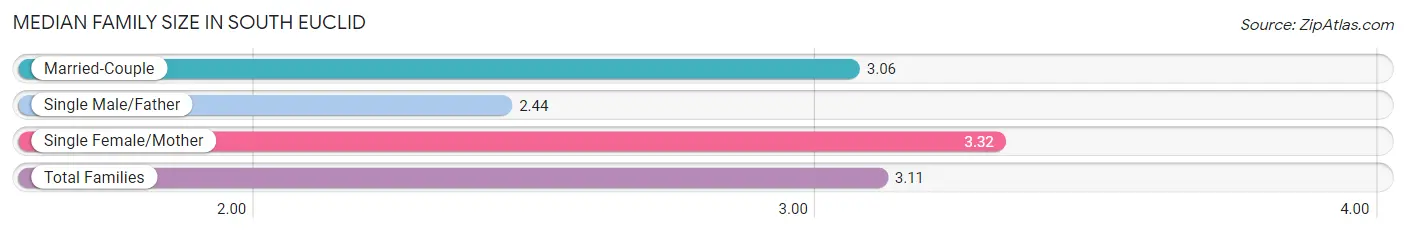
Median Family Size in South Euclid
The median family size in South Euclid is 3.11 persons per family, with single female/mother families (1,656 | 31.5%) accounting for the largest median family size of 3.32 persons per family. On the other hand, single male/father families (273 | 5.2%) represent the smallest median family size with 2.44 persons per family.
| Family Type | # Families | Family Size |
| Married-Couple | 3,324 (63.3%) | 3.06 |
| Single Male/Father | 273 (5.2%) | 2.44 |
| Single Female/Mother | 1,656 (31.5%) | 3.32 |
| Total Families | 5,253 (100.0%) | 3.11 |
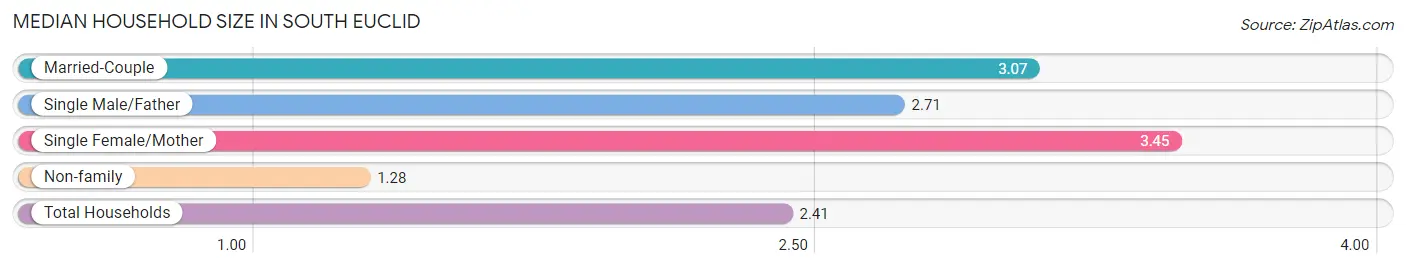
Median Household Size in South Euclid
The median household size in South Euclid is 2.41 persons per household, with single female/mother households (1,656 | 18.9%) accounting for the largest median household size of 3.45 persons per household. non-family households (3,503 | 40.0%) represent the smallest median household size with 1.28 persons per household.
| Household Type | # Households | Household Size |
| Married-Couple | 3,324 (38.0%) | 3.07 |
| Single Male/Father | 273 (3.1%) | 2.71 |
| Single Female/Mother | 1,656 (18.9%) | 3.45 |
| Non-family | 3,503 (40.0%) | 1.28 |
| Total Households | 8,756 (100.0%) | 2.41 |
Household Size by Marriage Status in South Euclid
Out of a total of 8,756 households in South Euclid, 5,253 (60.0%) are family households, while 3,503 (40.0%) are nonfamily households. The most numerous type of family households are 2-person households, comprising 2,566, and the most common type of nonfamily households are 1-person households, comprising 2,846.
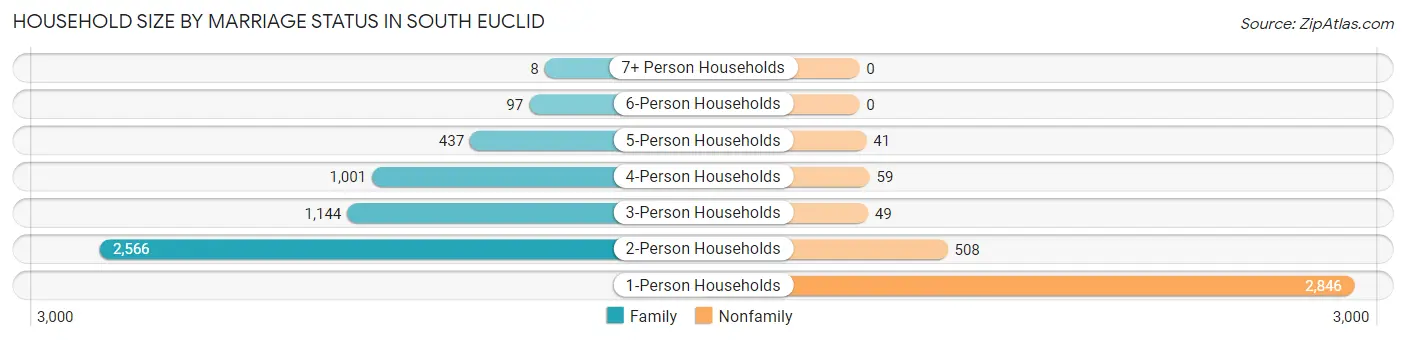
| Household Size | Family Households | Nonfamily Households |
| 1-Person Households | - | 2,846 (32.5%) |
| 2-Person Households | 2,566 (29.3%) | 508 (5.8%) |
| 3-Person Households | 1,144 (13.1%) | 49 (0.6%) |
| 4-Person Households | 1,001 (11.4%) | 59 (0.7%) |
| 5-Person Households | 437 (5.0%) | 41 (0.5%) |
| 6-Person Households | 97 (1.1%) | 0 (0.0%) |
| 7+ Person Households | 8 (0.1%) | 0 (0.0%) |
| Total | 5,253 (60.0%) | 3,503 (40.0%) |
Female Fertility in South Euclid
Fertility by Age in South Euclid
Average fertility rate in South Euclid is 63.0 births per 1,000 women. Women in the age bracket of 20 to 34 years have the highest fertility rate with 135.0 births per 1,000 women. Women in the age bracket of 20 to 34 years acount for 93.7% of all women with births.
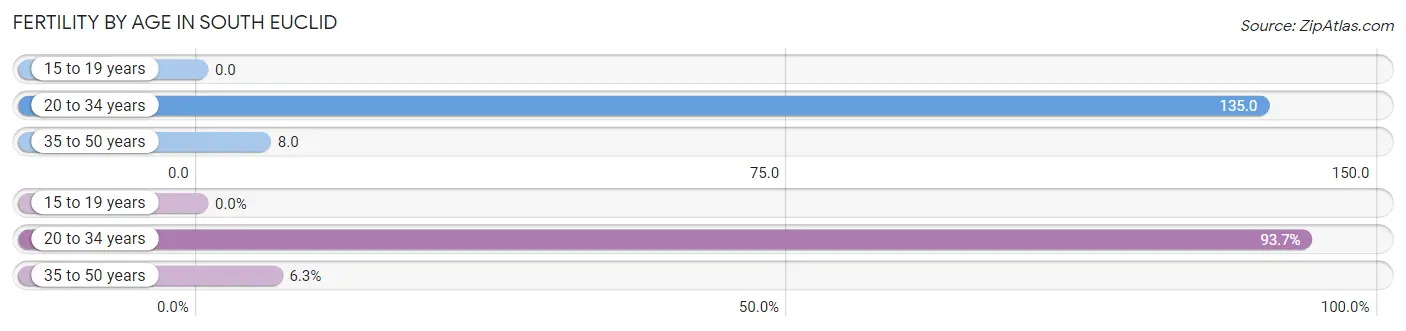
| Age Bracket | Women with Births | Births / 1,000 Women |
| 15 to 19 years | 0 (0.0%) | 0.0 |
| 20 to 34 years | 297 (93.7%) | 135.0 |
| 35 to 50 years | 20 (6.3%) | 8.0 |
| Total | 317 (100.0%) | 63.0 |
Fertility by Age by Marriage Status in South Euclid
68.5% of women with births (317) in South Euclid are married. The highest percentage of unmarried women with births falls into 20 to 34 years age bracket with 33.7% of them unmarried at the time of birth, while the lowest percentage of unmarried women with births belong to 35 to 50 years age bracket with 0.0% of them unmarried.
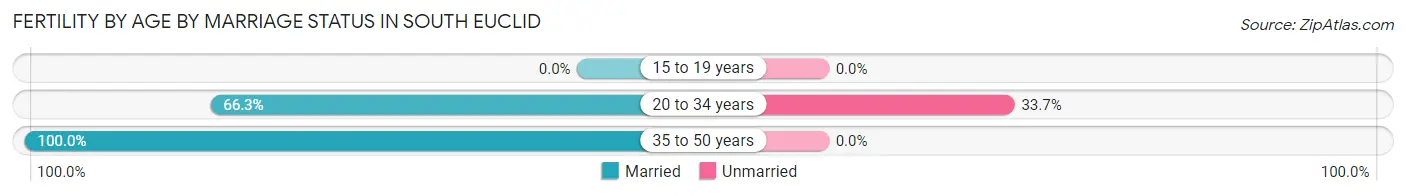
| Age Bracket | Married | Unmarried |
| 15 to 19 years | 0 (0.0%) | 0 (0.0%) |
| 20 to 34 years | 197 (66.3%) | 100 (33.7%) |
| 35 to 50 years | 20 (100.0%) | 0 (0.0%) |
| Total | 217 (68.4%) | 100 (31.6%) |
Fertility by Education in South Euclid
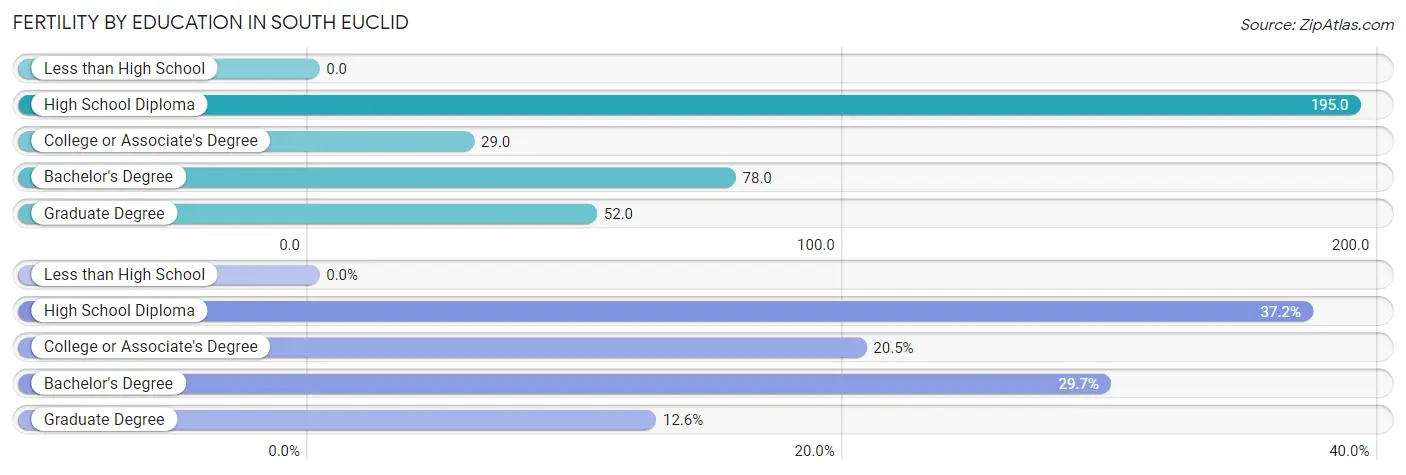
| Educational Attainment | Women with Births | Births / 1,000 Women |
| Less than High School | 0 (0.0%) | 0.0 |
| High School Diploma | 118 (37.2%) | 195.0 |
| College or Associate's Degree | 65 (20.5%) | 29.0 |
| Bachelor's Degree | 94 (29.6%) | 78.0 |
| Graduate Degree | 40 (12.6%) | 52.0 |
| Total | 317 (100.0%) | 63.0 |
Fertility by Education by Marriage Status in South Euclid
31.6% of women with births in South Euclid are unmarried. Women with the educational attainment of college or associate's degree are most likely to be married with 100.0% of them married at childbirth, while women with the educational attainment of high school diploma are least likely to be married with 84.8% of them unmarried at childbirth.
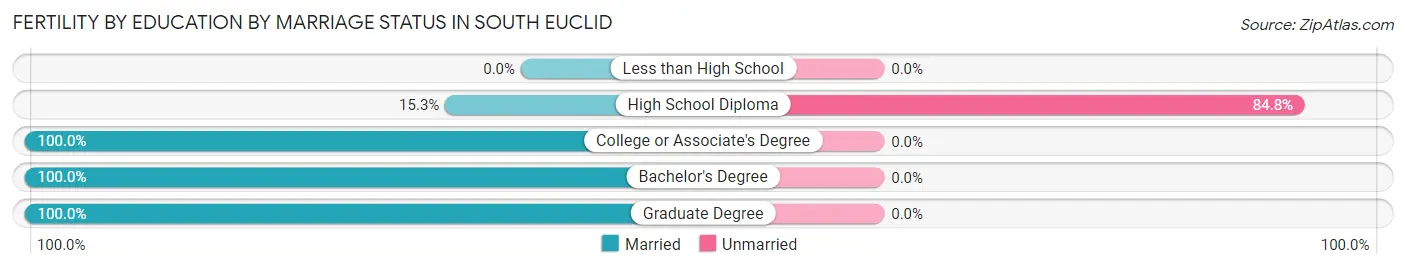
| Educational Attainment | Married | Unmarried |
| Less than High School | 0 (0.0%) | 0 (0.0%) |
| High School Diploma | 18 (15.2%) | 100 (84.8%) |
| College or Associate's Degree | 65 (100.0%) | 0 (0.0%) |
| Bachelor's Degree | 94 (100.0%) | 0 (0.0%) |
| Graduate Degree | 40 (100.0%) | 0 (0.0%) |
| Total | 217 (68.4%) | 100 (31.6%) |
Employment Characteristics in South Euclid
Employment by Class of Employer in South Euclid
Among the 11,043 employed individuals in South Euclid, private company employees (6,549 | 59.3%), not-for-profit organizations (2,353 | 21.3%), and local government employees (1,037 | 9.4%) make up the most common classes of employment.
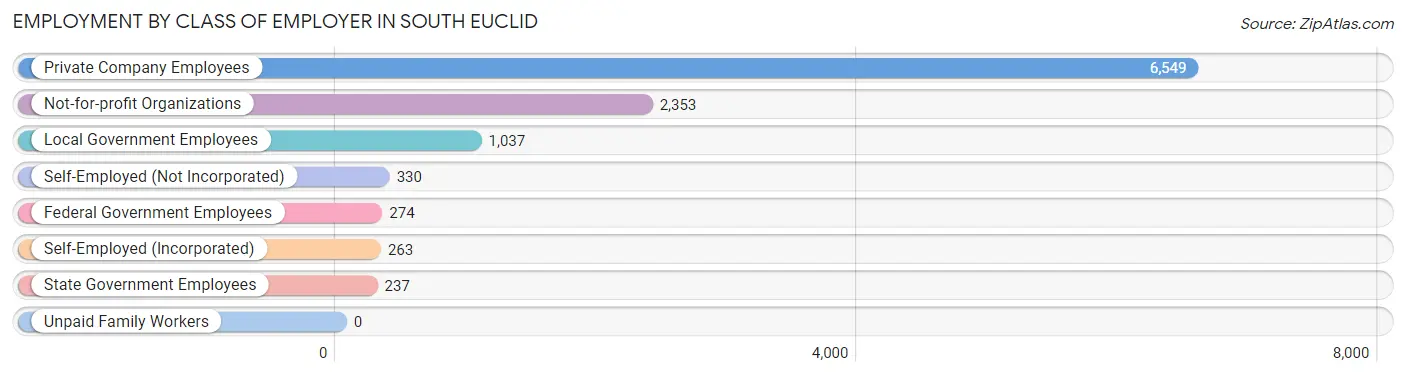
| Employer Class | # Employees | % Employees |
| Private Company Employees | 6,549 | 59.3% |
| Self-Employed (Incorporated) | 263 | 2.4% |
| Self-Employed (Not Incorporated) | 330 | 3.0% |
| Not-for-profit Organizations | 2,353 | 21.3% |
| Local Government Employees | 1,037 | 9.4% |
| State Government Employees | 237 | 2.1% |
| Federal Government Employees | 274 | 2.5% |
| Unpaid Family Workers | 0 | 0.0% |
| Total | 11,043 | 100.0% |
Employment Status by Age in South Euclid
According to the labor force statistics for South Euclid, out of the total population over 16 years of age (17,613), 68.3% or 12,030 individuals are in the labor force, with 5.9% or 710 of them unemployed. The age group with the highest labor force participation rate is 35 to 44 years, with 92.2% or 2,744 individuals in the labor force. Within the labor force, the 20 to 24 years age range has the highest percentage of unemployed individuals, with 19.5% or 306 of them being unemployed.
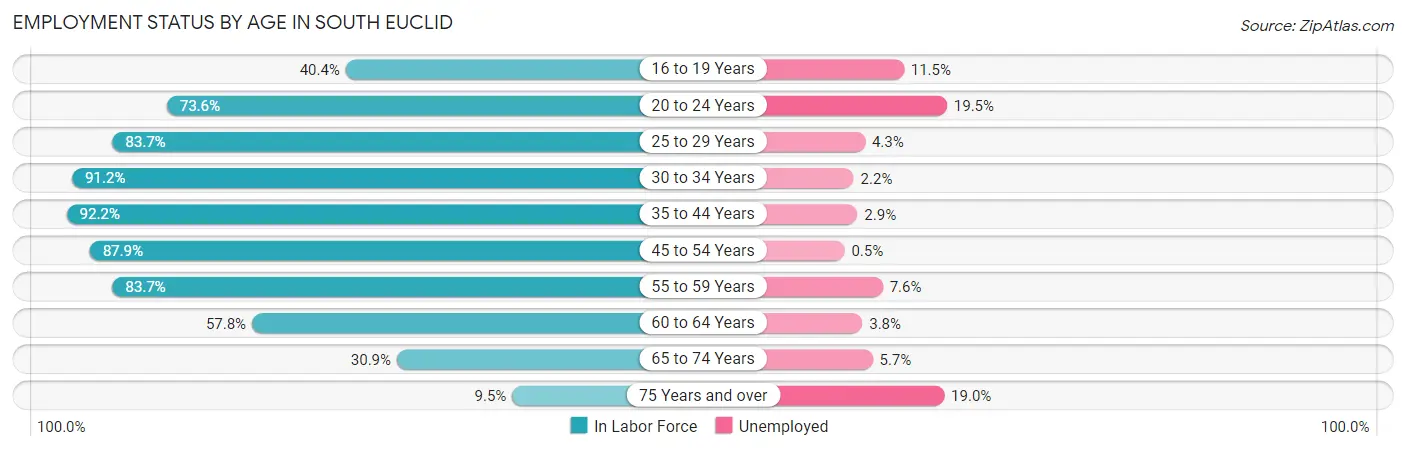
| Age Bracket | In Labor Force | Unemployed |
| 16 to 19 Years | 573 (40.4%) | 66 (11.5%) |
| 20 to 24 Years | 1,568 (73.6%) | 306 (19.5%) |
| 25 to 29 Years | 1,044 (83.7%) | 45 (4.3%) |
| 30 to 34 Years | 1,258 (91.2%) | 28 (2.2%) |
| 35 to 44 Years | 2,744 (92.2%) | 80 (2.9%) |
| 45 to 54 Years | 2,189 (87.9%) | 11 (0.5%) |
| 55 to 59 Years | 1,066 (83.7%) | 81 (7.6%) |
| 60 to 64 Years | 891 (57.8%) | 34 (3.8%) |
| 65 to 74 Years | 582 (30.9%) | 33 (5.7%) |
| 75 Years and over | 121 (9.5%) | 23 (19.0%) |
| Total | 12,030 (68.3%) | 710 (5.9%) |
Employment Status by Educational Attainment in South Euclid
According to labor force statistics for South Euclid, 84.3% of individuals (9,195) out of the total population between 25 and 64 years of age (10,907) are in the labor force, with 3.0% or 276 of them being unemployed. The group with the highest labor force participation rate are those with the educational attainment of bachelor's degree or higher, with 86.1% or 4,176 individuals in the labor force. Within the labor force, individuals with college / associate degree education have the highest percentage of unemployment, with 4.9% or 159 of them being unemployed.
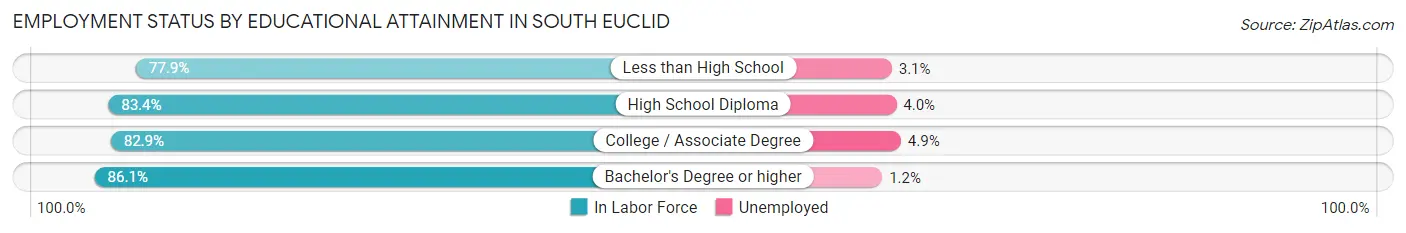
| Educational Attainment | In Labor Force | Unemployed |
| Less than High School | 261 (77.9%) | 10 (3.1%) |
| High School Diploma | 1,497 (83.4%) | 72 (4.0%) |
| College / Associate Degree | 3,255 (82.9%) | 192 (4.9%) |
| Bachelor's Degree or higher | 4,176 (86.1%) | 58 (1.2%) |
| Total | 9,195 (84.3%) | 327 (3.0%) |
Employment Occupations by Sex in South Euclid
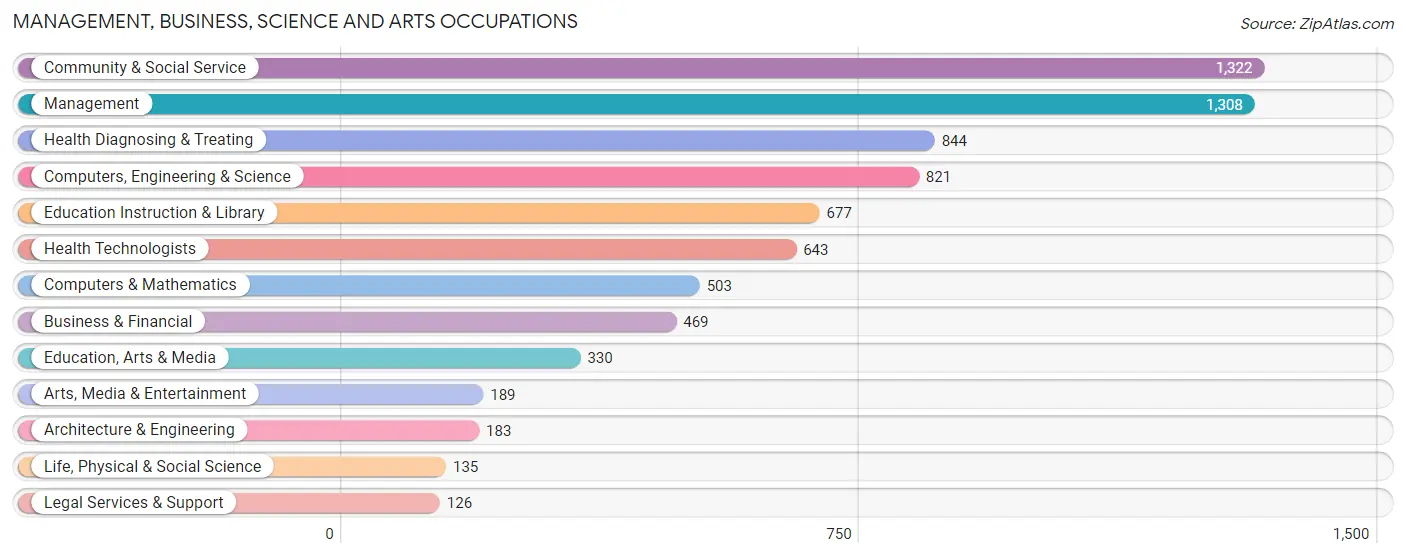
Management, Business, Science and Arts Occupations
The most common Management, Business, Science and Arts occupations in South Euclid are Community & Social Service (1,322 | 11.7%), Management (1,308 | 11.6%), Health Diagnosing & Treating (844 | 7.5%), Computers, Engineering & Science (821 | 7.3%), and Education Instruction & Library (677 | 6.0%).
Management, Business, Science and Arts Occupations by Sex
Within the Management, Business, Science and Arts occupations in South Euclid, the most male-oriented occupations are Arts, Media & Entertainment (90.5%), Computers & Mathematics (83.7%), and Computers, Engineering & Science (81.6%), while the most female-oriented occupations are Education, Arts & Media (79.7%), Legal Services & Support (77.8%), and Education Instruction & Library (77.7%).
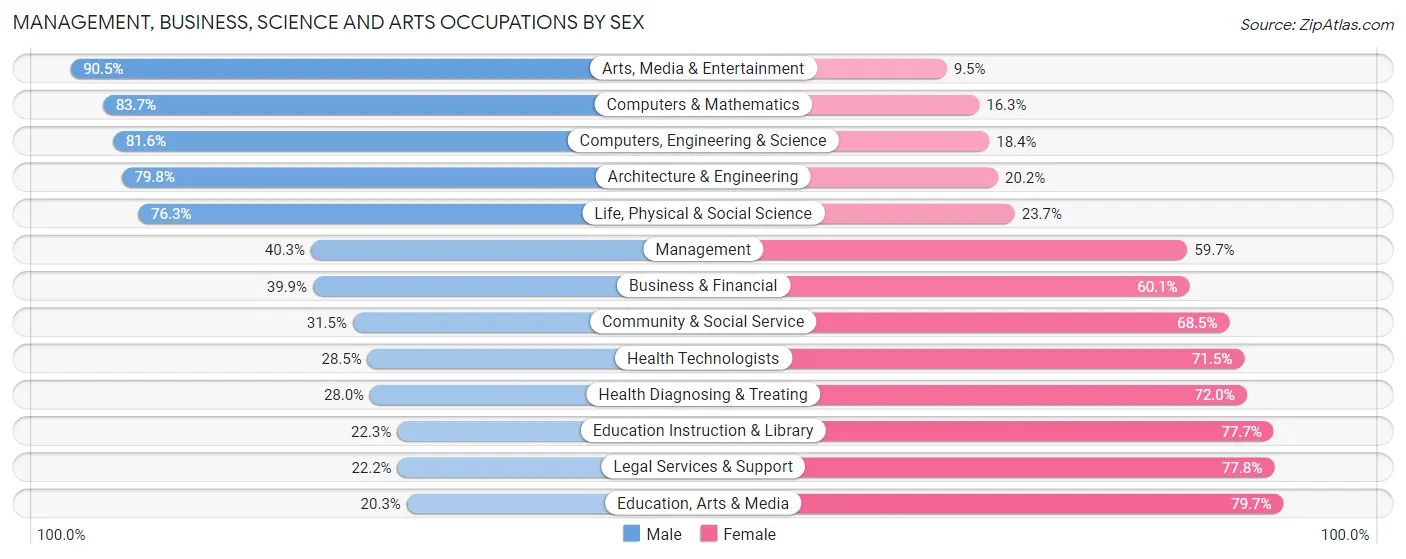
| Occupation | Male | Female |
| Management | 527 (40.3%) | 781 (59.7%) |
| Business & Financial | 187 (39.9%) | 282 (60.1%) |
| Computers, Engineering & Science | 670 (81.6%) | 151 (18.4%) |
| Computers & Mathematics | 421 (83.7%) | 82 (16.3%) |
| Architecture & Engineering | 146 (79.8%) | 37 (20.2%) |
| Life, Physical & Social Science | 103 (76.3%) | 32 (23.7%) |
| Community & Social Service | 417 (31.5%) | 905 (68.5%) |
| Education, Arts & Media | 67 (20.3%) | 263 (79.7%) |
| Legal Services & Support | 28 (22.2%) | 98 (77.8%) |
| Education Instruction & Library | 151 (22.3%) | 526 (77.7%) |
| Arts, Media & Entertainment | 171 (90.5%) | 18 (9.5%) |
| Health Diagnosing & Treating | 236 (28.0%) | 608 (72.0%) |
| Health Technologists | 183 (28.5%) | 460 (71.5%) |
| Total (Category) | 2,037 (42.8%) | 2,727 (57.2%) |
| Total (Overall) | 5,461 (48.3%) | 5,852 (51.7%) |
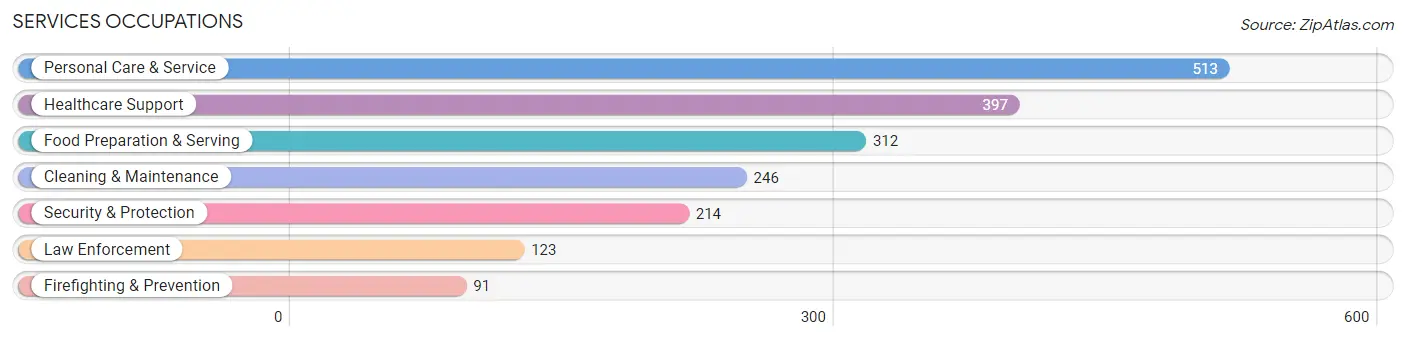
Services Occupations
The most common Services occupations in South Euclid are Personal Care & Service (513 | 4.5%), Healthcare Support (397 | 3.5%), Food Preparation & Serving (312 | 2.8%), Cleaning & Maintenance (246 | 2.2%), and Security & Protection (214 | 1.9%).
Services Occupations by Sex
Within the Services occupations in South Euclid, the most male-oriented occupations are Law Enforcement (100.0%), Cleaning & Maintenance (84.6%), and Security & Protection (80.8%), while the most female-oriented occupations are Healthcare Support (77.1%), Personal Care & Service (72.5%), and Food Preparation & Serving (51.6%).
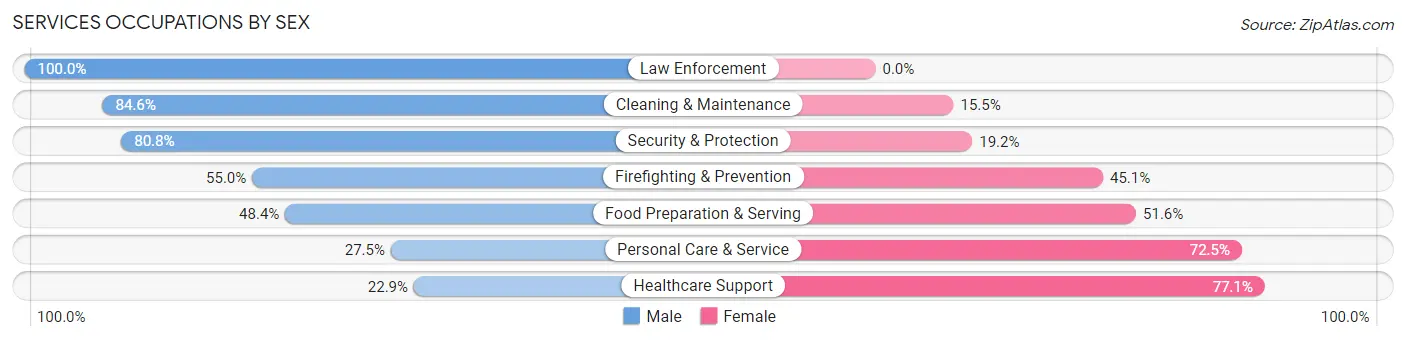
| Occupation | Male | Female |
| Healthcare Support | 91 (22.9%) | 306 (77.1%) |
| Security & Protection | 173 (80.8%) | 41 (19.2%) |
| Firefighting & Prevention | 50 (54.9%) | 41 (45.1%) |
| Law Enforcement | 123 (100.0%) | 0 (0.0%) |
| Food Preparation & Serving | 151 (48.4%) | 161 (51.6%) |
| Cleaning & Maintenance | 208 (84.6%) | 38 (15.4%) |
| Personal Care & Service | 141 (27.5%) | 372 (72.5%) |
| Total (Category) | 764 (45.4%) | 918 (54.6%) |
| Total (Overall) | 5,461 (48.3%) | 5,852 (51.7%) |
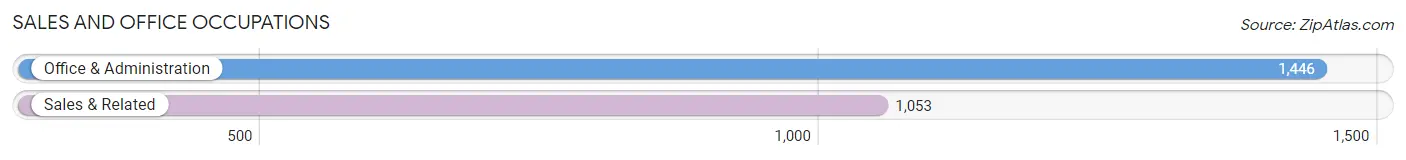
Sales and Office Occupations
The most common Sales and Office occupations in South Euclid are Office & Administration (1,446 | 12.8%), and Sales & Related (1,053 | 9.3%).
Sales and Office Occupations by Sex
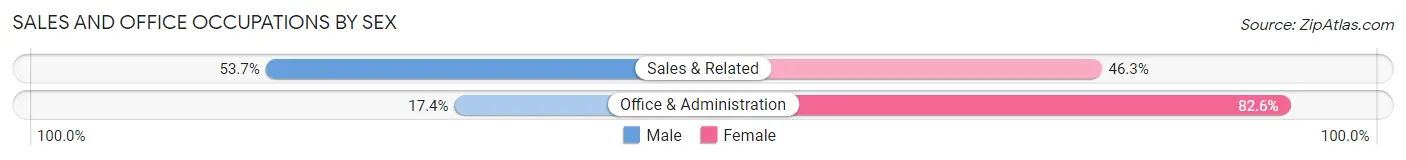
| Occupation | Male | Female |
| Sales & Related | 565 (53.7%) | 488 (46.3%) |
| Office & Administration | 251 (17.4%) | 1,195 (82.6%) |
| Total (Category) | 816 (32.7%) | 1,683 (67.3%) |
| Total (Overall) | 5,461 (48.3%) | 5,852 (51.7%) |
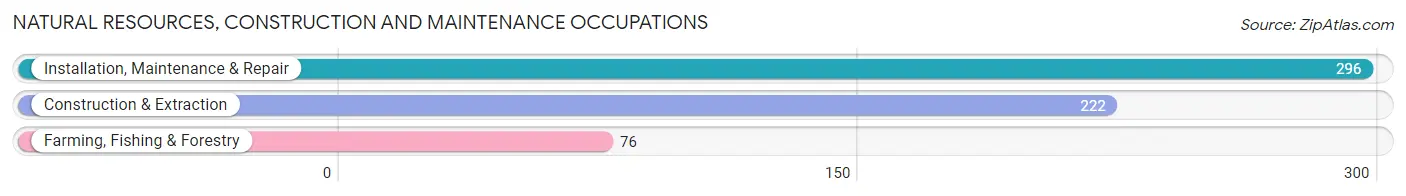
Natural Resources, Construction and Maintenance Occupations
The most common Natural Resources, Construction and Maintenance occupations in South Euclid are Installation, Maintenance & Repair (296 | 2.6%), Construction & Extraction (222 | 2.0%), and Farming, Fishing & Forestry (76 | 0.7%).
Natural Resources, Construction and Maintenance Occupations by Sex
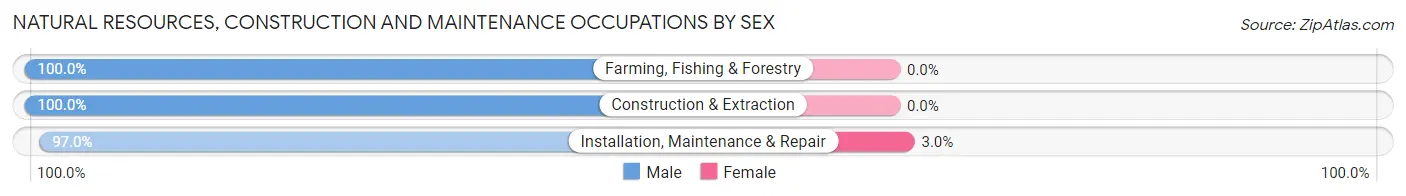
| Occupation | Male | Female |
| Farming, Fishing & Forestry | 76 (100.0%) | 0 (0.0%) |
| Construction & Extraction | 222 (100.0%) | 0 (0.0%) |
| Installation, Maintenance & Repair | 287 (97.0%) | 9 (3.0%) |
| Total (Category) | 585 (98.5%) | 9 (1.5%) |
| Total (Overall) | 5,461 (48.3%) | 5,852 (51.7%) |
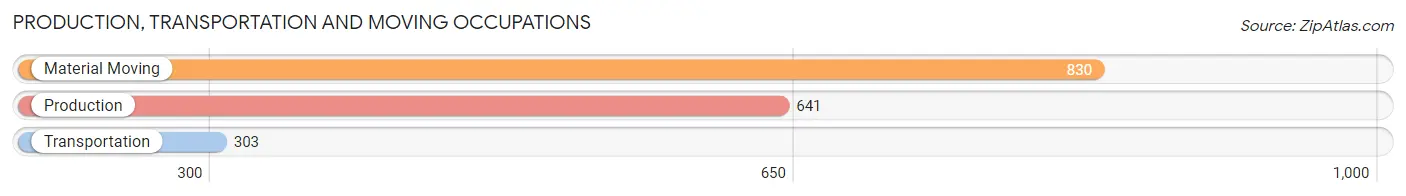
Production, Transportation and Moving Occupations
The most common Production, Transportation and Moving occupations in South Euclid are Material Moving (830 | 7.3%), Production (641 | 5.7%), and Transportation (303 | 2.7%).
Production, Transportation and Moving Occupations by Sex
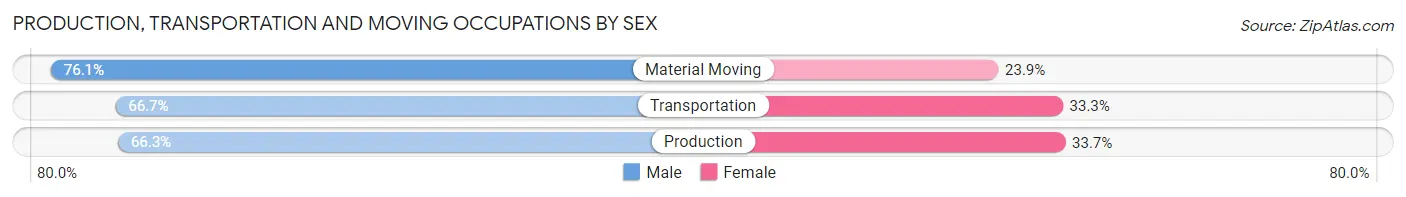
| Occupation | Male | Female |
| Production | 425 (66.3%) | 216 (33.7%) |
| Transportation | 202 (66.7%) | 101 (33.3%) |
| Material Moving | 632 (76.1%) | 198 (23.9%) |
| Total (Category) | 1,259 (71.0%) | 515 (29.0%) |
| Total (Overall) | 5,461 (48.3%) | 5,852 (51.7%) |
Employment Industries by Sex in South Euclid
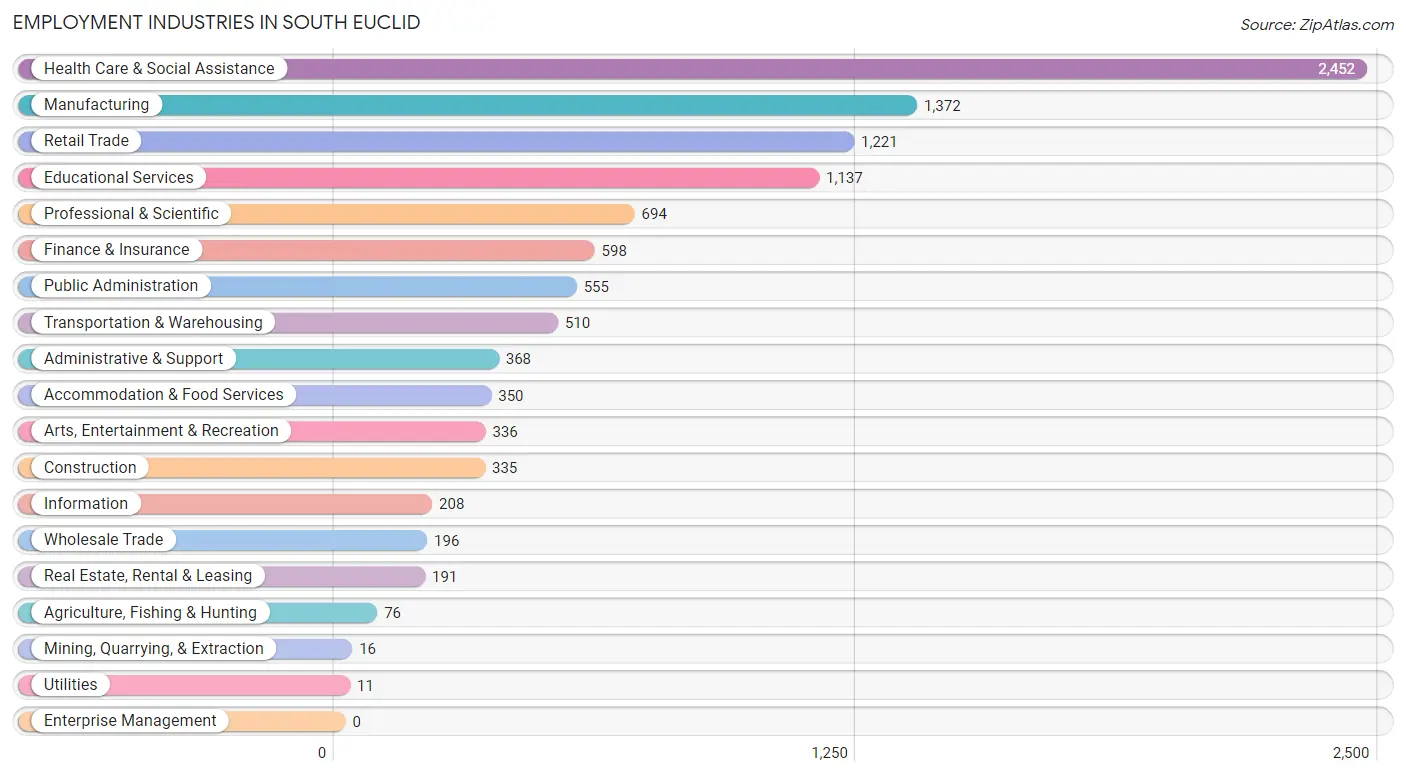
Employment Industries in South Euclid
The major employment industries in South Euclid include Health Care & Social Assistance (2,452 | 21.7%), Manufacturing (1,372 | 12.1%), Retail Trade (1,221 | 10.8%), Educational Services (1,137 | 10.1%), and Professional & Scientific (694 | 6.1%).
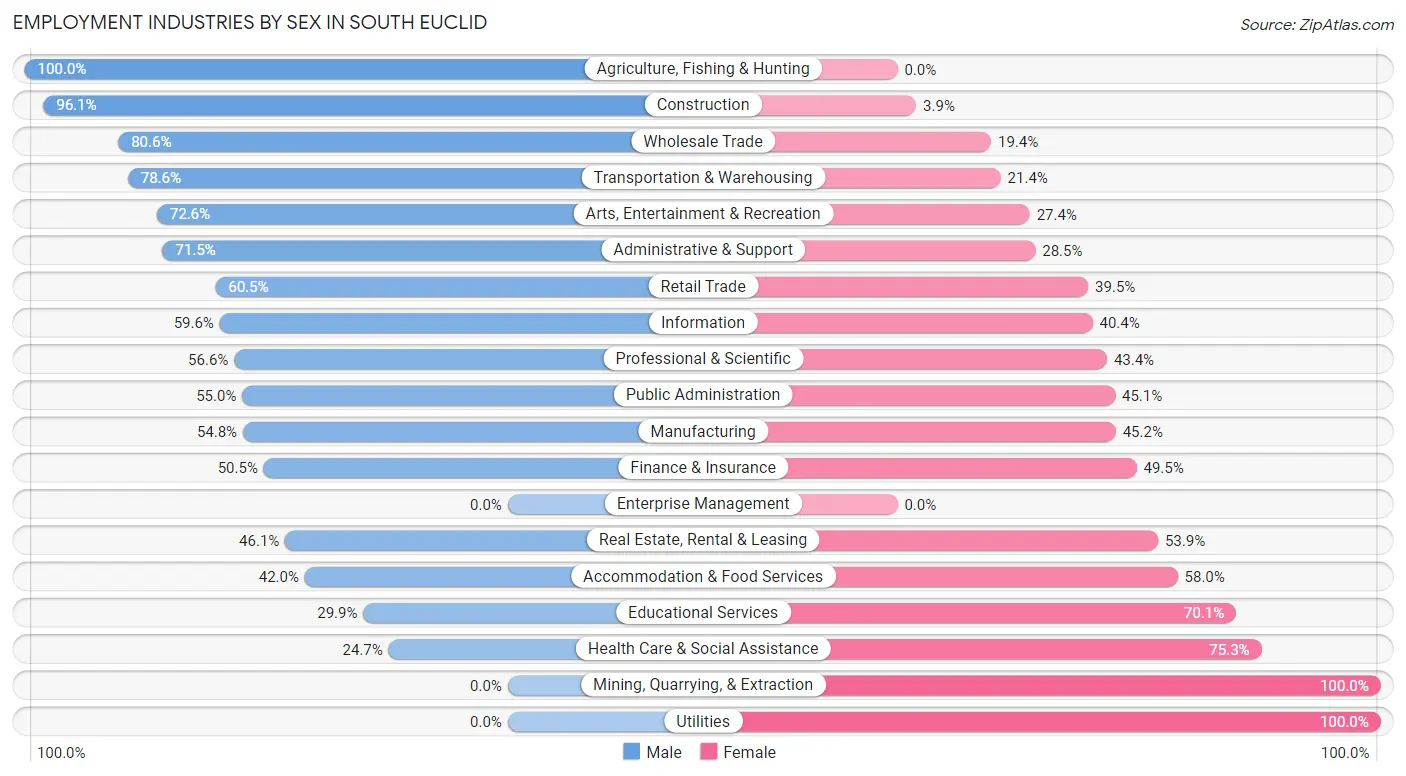
Employment Industries by Sex in South Euclid
The South Euclid industries that see more men than women are Agriculture, Fishing & Hunting (100.0%), Construction (96.1%), and Wholesale Trade (80.6%), whereas the industries that tend to have a higher number of women are Mining, Quarrying, & Extraction (100.0%), Utilities (100.0%), and Health Care & Social Assistance (75.3%).
| Industry | Male | Female |
| Agriculture, Fishing & Hunting | 76 (100.0%) | 0 (0.0%) |
| Mining, Quarrying, & Extraction | 0 (0.0%) | 16 (100.0%) |
| Construction | 322 (96.1%) | 13 (3.9%) |
| Manufacturing | 752 (54.8%) | 620 (45.2%) |
| Wholesale Trade | 158 (80.6%) | 38 (19.4%) |
| Retail Trade | 739 (60.5%) | 482 (39.5%) |
| Transportation & Warehousing | 401 (78.6%) | 109 (21.4%) |
| Utilities | 0 (0.0%) | 11 (100.0%) |
| Information | 124 (59.6%) | 84 (40.4%) |
| Finance & Insurance | 302 (50.5%) | 296 (49.5%) |
| Real Estate, Rental & Leasing | 88 (46.1%) | 103 (53.9%) |
| Professional & Scientific | 393 (56.6%) | 301 (43.4%) |
| Enterprise Management | 0 (0.0%) | 0 (0.0%) |
| Administrative & Support | 263 (71.5%) | 105 (28.5%) |
| Educational Services | 340 (29.9%) | 797 (70.1%) |
| Health Care & Social Assistance | 605 (24.7%) | 1,847 (75.3%) |
| Arts, Entertainment & Recreation | 244 (72.6%) | 92 (27.4%) |
| Accommodation & Food Services | 147 (42.0%) | 203 (58.0%) |
| Public Administration | 305 (54.9%) | 250 (45.1%) |
| Total | 5,461 (48.3%) | 5,852 (51.7%) |
Education in South Euclid
School Enrollment in South Euclid
The most common levels of schooling among the 6,038 students in South Euclid are college / undergraduate (1,870 | 31.0%), high school (1,203 | 19.9%), and middle school (991 | 16.4%).
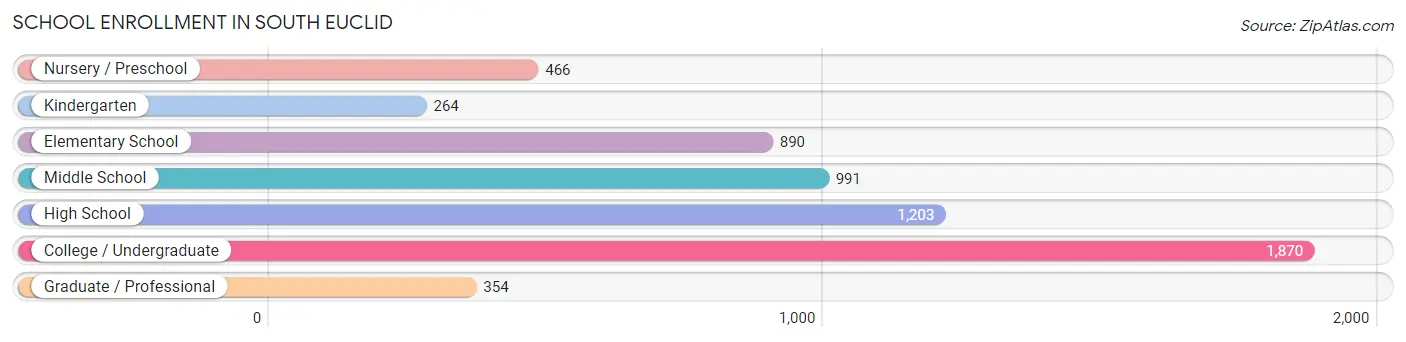
| School Level | # Students | % Students |
| Nursery / Preschool | 466 | 7.7% |
| Kindergarten | 264 | 4.4% |
| Elementary School | 890 | 14.7% |
| Middle School | 991 | 16.4% |
| High School | 1,203 | 19.9% |
| College / Undergraduate | 1,870 | 31.0% |
| Graduate / Professional | 354 | 5.9% |
| Total | 6,038 | 100.0% |
School Enrollment by Age by Funding Source in South Euclid
Out of a total of 6,038 students who are enrolled in schools in South Euclid, 1,516 (25.1%) attend a private institution, while the remaining 4,522 (74.9%) are enrolled in public schools. The age group of 3 to 4 year olds has the highest likelihood of being enrolled in private schools, with 230 (59.7% in the age bracket) enrolled. Conversely, the age group of 15 to 17 year olds has the lowest likelihood of being enrolled in a private school, with 918 (97.5% in the age bracket) attending a public institution.
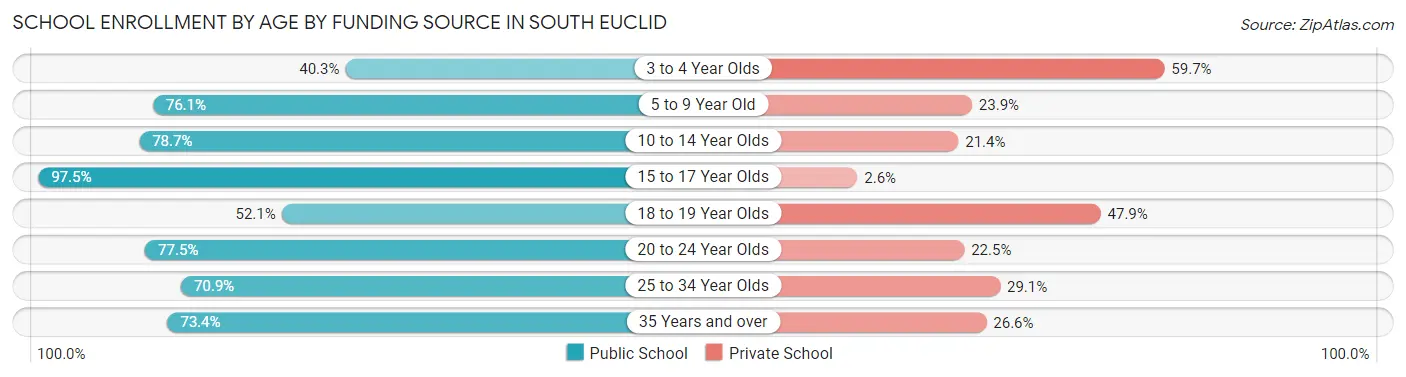
| Age Bracket | Public School | Private School |
| 3 to 4 Year Olds | 155 (40.3%) | 230 (59.7%) |
| 5 to 9 Year Old | 806 (76.1%) | 253 (23.9%) |
| 10 to 14 Year Olds | 1,035 (78.6%) | 281 (21.3%) |
| 15 to 17 Year Olds | 918 (97.5%) | 24 (2.5%) |
| 18 to 19 Year Olds | 353 (52.1%) | 324 (47.9%) |
| 20 to 24 Year Olds | 856 (77.5%) | 248 (22.5%) |
| 25 to 34 Year Olds | 236 (70.9%) | 97 (29.1%) |
| 35 Years and over | 163 (73.4%) | 59 (26.6%) |
| Total | 4,522 (74.9%) | 1,516 (25.1%) |
Educational Attainment by Field of Study in South Euclid
Business (1,018 | 15.1%), social sciences (799 | 11.8%), education (791 | 11.7%), science & technology (754 | 11.2%), and arts & humanities (583 | 8.6%) are the most common fields of study among 6,760 individuals in South Euclid who have obtained a bachelor's degree or higher.
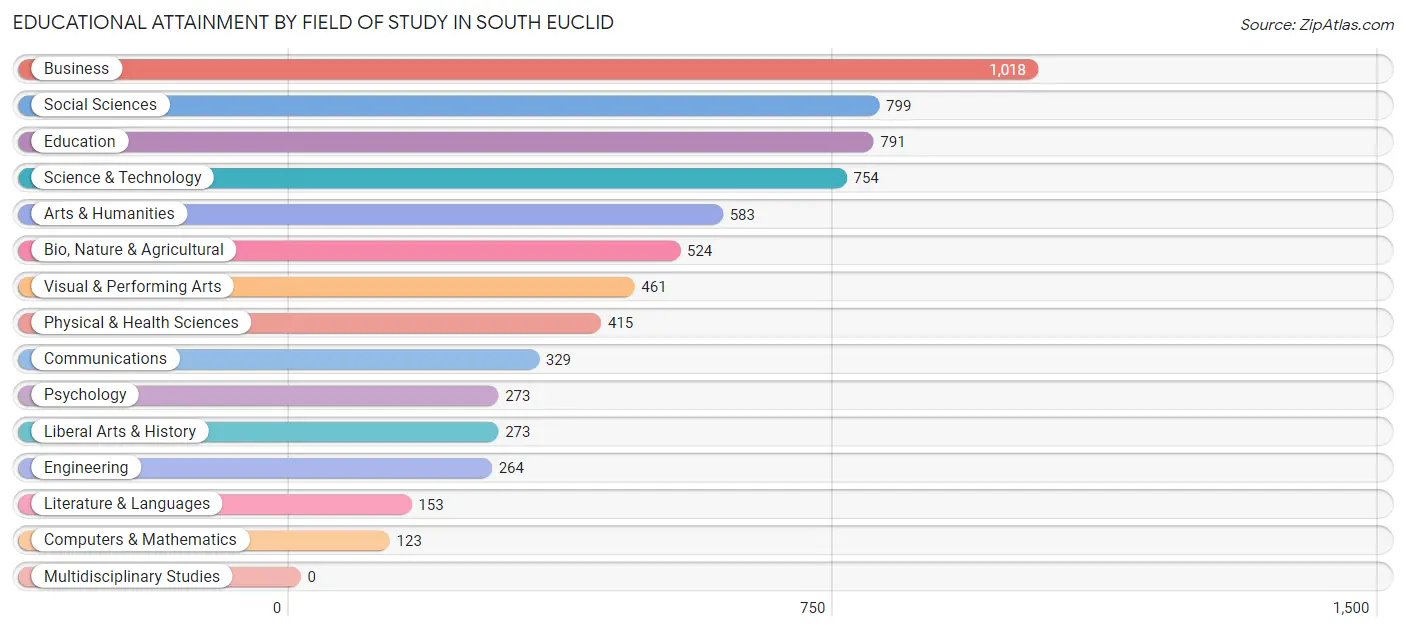
| Field of Study | # Graduates | % Graduates |
| Computers & Mathematics | 123 | 1.8% |
| Bio, Nature & Agricultural | 524 | 7.7% |
| Physical & Health Sciences | 415 | 6.1% |
| Psychology | 273 | 4.0% |
| Social Sciences | 799 | 11.8% |
| Engineering | 264 | 3.9% |
| Multidisciplinary Studies | 0 | 0.0% |
| Science & Technology | 754 | 11.2% |
| Business | 1,018 | 15.1% |
| Education | 791 | 11.7% |
| Literature & Languages | 153 | 2.3% |
| Liberal Arts & History | 273 | 4.0% |
| Visual & Performing Arts | 461 | 6.8% |
| Communications | 329 | 4.9% |
| Arts & Humanities | 583 | 8.6% |
| Total | 6,760 | 100.0% |
Transportation & Commute in South Euclid
Vehicle Availability by Sex in South Euclid
The most prevalent vehicle ownership categories in South Euclid are males with 2 vehicles (2,800, accounting for 53.8%) and females with 2 vehicles (2,329, making up 50.0%).
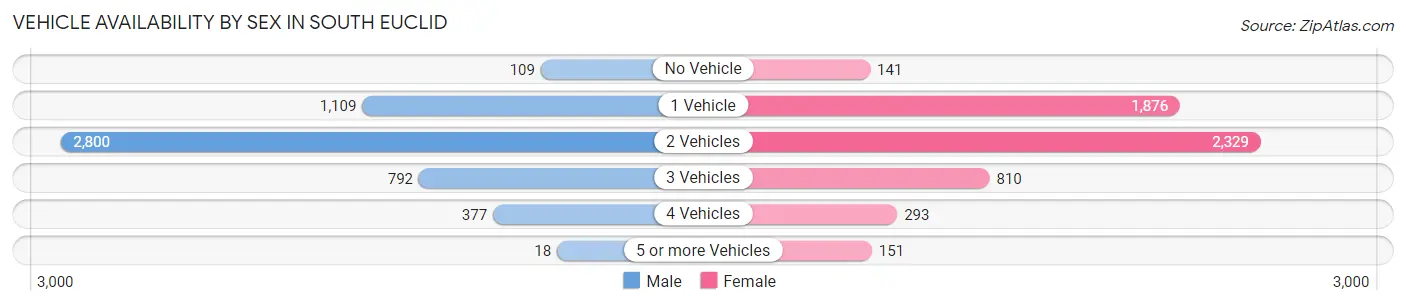
| Vehicles Available | Male | Female |
| No Vehicle | 109 (2.1%) | 141 (2.5%) |
| 1 Vehicle | 1,109 (21.3%) | 1,876 (33.5%) |
| 2 Vehicles | 2,800 (53.8%) | 2,329 (41.6%) |
| 3 Vehicles | 792 (15.2%) | 810 (14.5%) |
| 4 Vehicles | 377 (7.2%) | 293 (5.2%) |
| 5 or more Vehicles | 18 (0.4%) | 151 (2.7%) |
| Total | 5,205 (100.0%) | 5,600 (100.0%) |
Commute Time in South Euclid
The most frequently occuring commute durations in South Euclid are 15 to 19 minutes (1,861 commuters, 19.6%), 20 to 24 minutes (1,796 commuters, 18.9%), and 30 to 34 minutes (1,466 commuters, 15.4%).
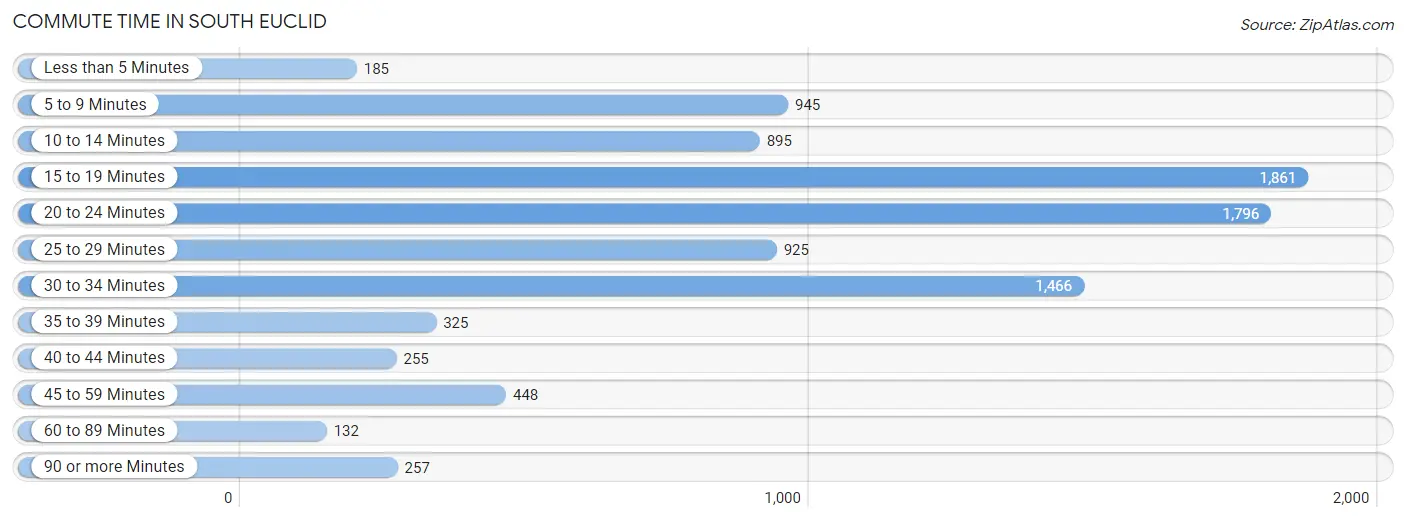
| Commute Time | # Commuters | % Commuters |
| Less than 5 Minutes | 185 | 1.9% |
| 5 to 9 Minutes | 945 | 10.0% |
| 10 to 14 Minutes | 895 | 9.4% |
| 15 to 19 Minutes | 1,861 | 19.6% |
| 20 to 24 Minutes | 1,796 | 18.9% |
| 25 to 29 Minutes | 925 | 9.8% |
| 30 to 34 Minutes | 1,466 | 15.4% |
| 35 to 39 Minutes | 325 | 3.4% |
| 40 to 44 Minutes | 255 | 2.7% |
| 45 to 59 Minutes | 448 | 4.7% |
| 60 to 89 Minutes | 132 | 1.4% |
| 90 or more Minutes | 257 | 2.7% |
Commute Time by Sex in South Euclid
The most common commute times in South Euclid are 20 to 24 minutes (921 commuters, 19.6%) for males and 15 to 19 minutes (1,134 commuters, 23.6%) for females.
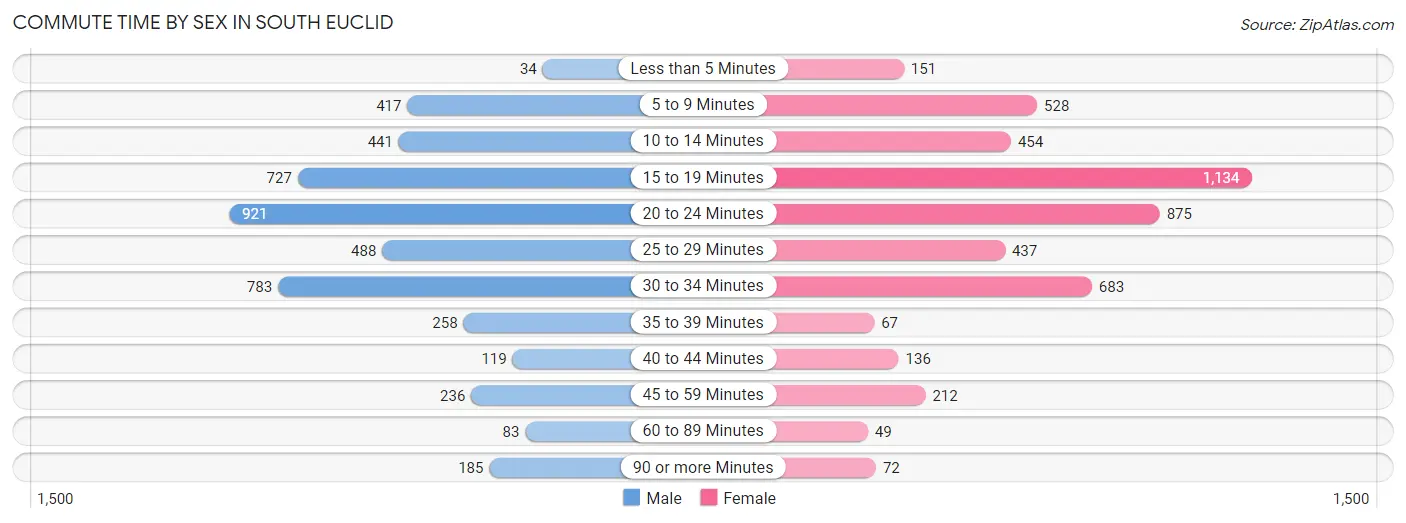
| Commute Time | Male | Female |
| Less than 5 Minutes | 34 (0.7%) | 151 (3.2%) |
| 5 to 9 Minutes | 417 (8.9%) | 528 (11.0%) |
| 10 to 14 Minutes | 441 (9.4%) | 454 (9.5%) |
| 15 to 19 Minutes | 727 (15.5%) | 1,134 (23.6%) |
| 20 to 24 Minutes | 921 (19.6%) | 875 (18.2%) |
| 25 to 29 Minutes | 488 (10.4%) | 437 (9.1%) |
| 30 to 34 Minutes | 783 (16.7%) | 683 (14.2%) |
| 35 to 39 Minutes | 258 (5.5%) | 67 (1.4%) |
| 40 to 44 Minutes | 119 (2.5%) | 136 (2.8%) |
| 45 to 59 Minutes | 236 (5.0%) | 212 (4.4%) |
| 60 to 89 Minutes | 83 (1.8%) | 49 (1.0%) |
| 90 or more Minutes | 185 (3.9%) | 72 (1.5%) |
Time of Departure to Work by Sex in South Euclid
The most frequent times of departure to work in South Euclid are 8:00 AM to 8:29 AM (644, 13.7%) for males and 7:30 AM to 7:59 AM (1,027, 21.4%) for females.
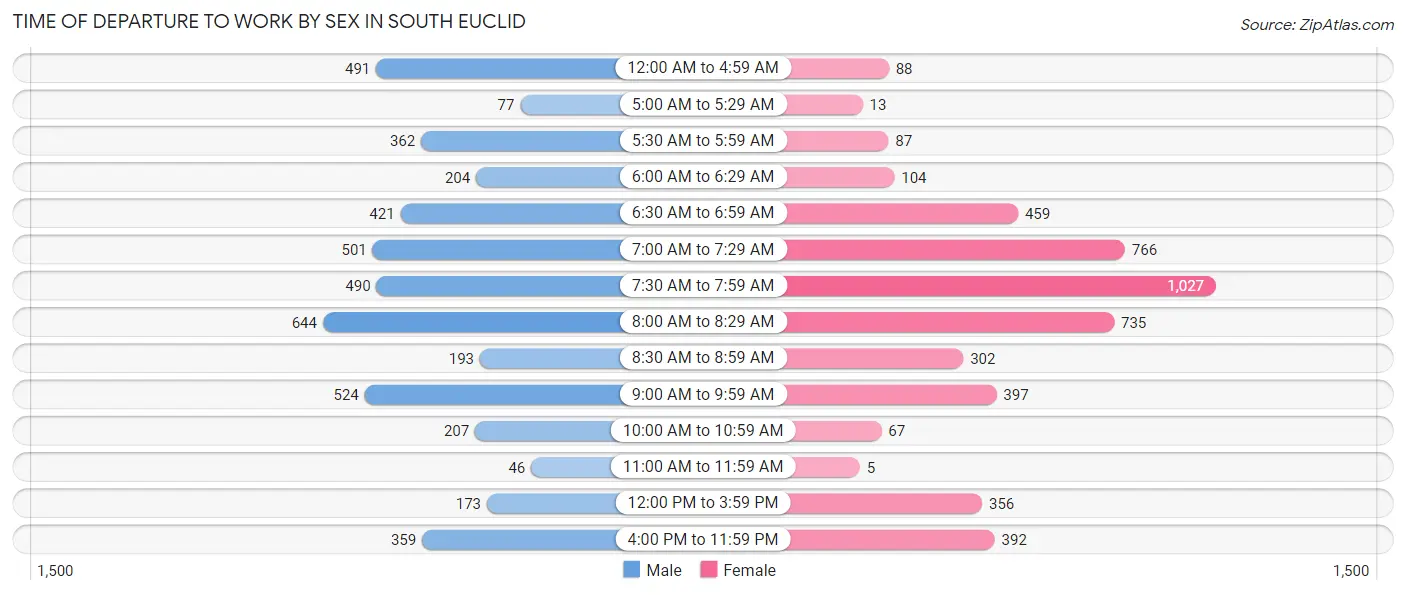
| Time of Departure | Male | Female |
| 12:00 AM to 4:59 AM | 491 (10.5%) | 88 (1.8%) |
| 5:00 AM to 5:29 AM | 77 (1.6%) | 13 (0.3%) |
| 5:30 AM to 5:59 AM | 362 (7.7%) | 87 (1.8%) |
| 6:00 AM to 6:29 AM | 204 (4.3%) | 104 (2.2%) |
| 6:30 AM to 6:59 AM | 421 (9.0%) | 459 (9.6%) |
| 7:00 AM to 7:29 AM | 501 (10.7%) | 766 (16.0%) |
| 7:30 AM to 7:59 AM | 490 (10.4%) | 1,027 (21.4%) |
| 8:00 AM to 8:29 AM | 644 (13.7%) | 735 (15.3%) |
| 8:30 AM to 8:59 AM | 193 (4.1%) | 302 (6.3%) |
| 9:00 AM to 9:59 AM | 524 (11.2%) | 397 (8.3%) |
| 10:00 AM to 10:59 AM | 207 (4.4%) | 67 (1.4%) |
| 11:00 AM to 11:59 AM | 46 (1.0%) | 5 (0.1%) |
| 12:00 PM to 3:59 PM | 173 (3.7%) | 356 (7.4%) |
| 4:00 PM to 11:59 PM | 359 (7.6%) | 392 (8.2%) |
| Total | 4,692 (100.0%) | 4,798 (100.0%) |
Housing Occupancy in South Euclid
Occupancy by Ownership in South Euclid
Of the total 8,756 dwellings in South Euclid, owner-occupied units account for 6,846 (78.2%), while renter-occupied units make up 1,910 (21.8%).
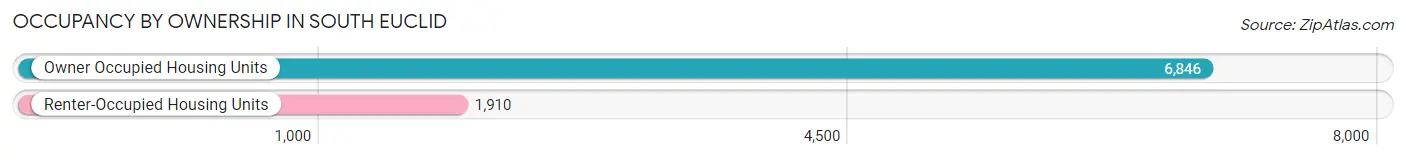
| Occupancy | # Housing Units | % Housing Units |
| Owner Occupied Housing Units | 6,846 | 78.2% |
| Renter-Occupied Housing Units | 1,910 | 21.8% |
| Total Occupied Housing Units | 8,756 | 100.0% |
Occupancy by Household Size in South Euclid
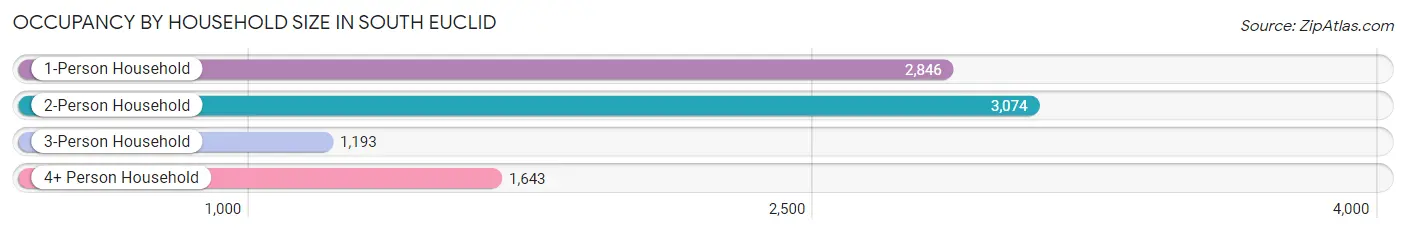
| Household Size | # Housing Units | % Housing Units |
| 1-Person Household | 2,846 | 32.5% |
| 2-Person Household | 3,074 | 35.1% |
| 3-Person Household | 1,193 | 13.6% |
| 4+ Person Household | 1,643 | 18.8% |
| Total Housing Units | 8,756 | 100.0% |
Occupancy by Ownership by Household Size in South Euclid
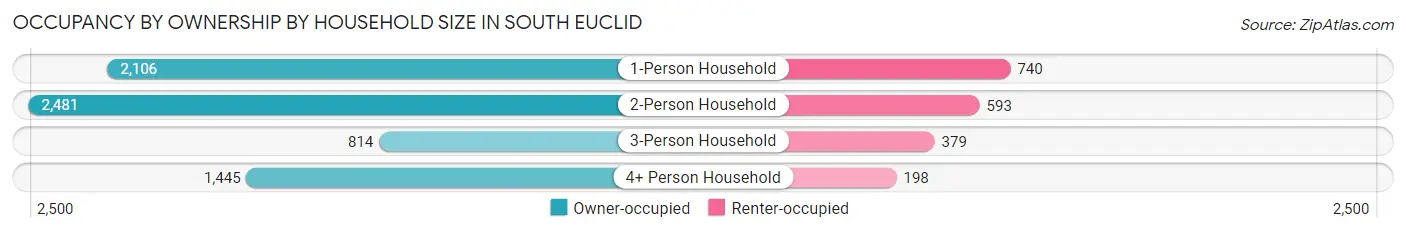
| Household Size | Owner-occupied | Renter-occupied |
| 1-Person Household | 2,106 (74.0%) | 740 (26.0%) |
| 2-Person Household | 2,481 (80.7%) | 593 (19.3%) |
| 3-Person Household | 814 (68.2%) | 379 (31.8%) |
| 4+ Person Household | 1,445 (87.9%) | 198 (12.0%) |
| Total Housing Units | 6,846 (78.2%) | 1,910 (21.8%) |
Occupancy by Educational Attainment in South Euclid
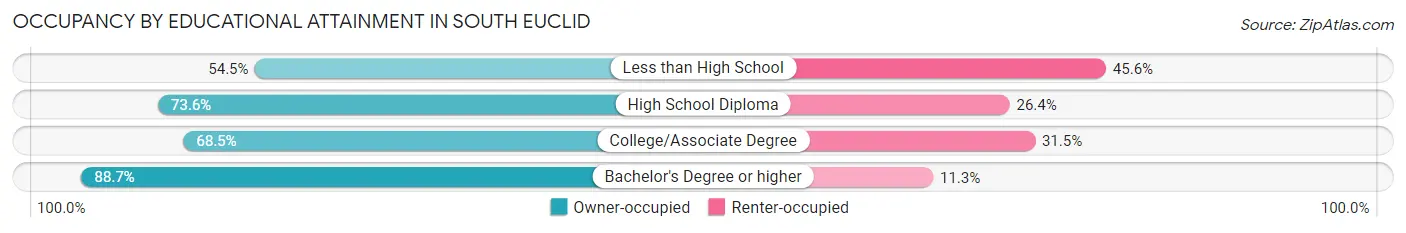
| Household Size | Owner-occupied | Renter-occupied |
| Less than High School | 153 (54.4%) | 128 (45.6%) |
| High School Diploma | 818 (73.6%) | 294 (26.4%) |
| College/Associate Degree | 2,230 (68.5%) | 1,025 (31.5%) |
| Bachelor's Degree or higher | 3,645 (88.7%) | 463 (11.3%) |
Occupancy by Age of Householder in South Euclid
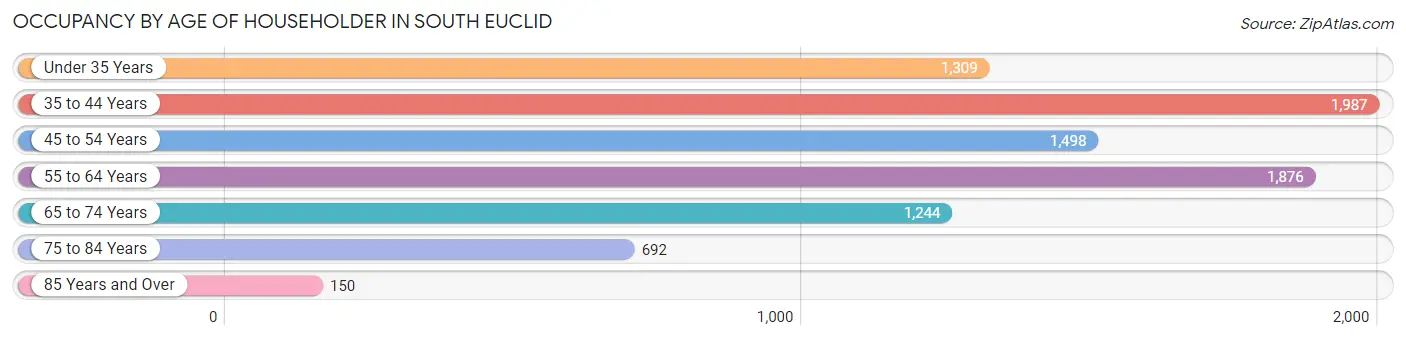
| Age Bracket | # Households | % Households |
| Under 35 Years | 1,309 | 14.9% |
| 35 to 44 Years | 1,987 | 22.7% |
| 45 to 54 Years | 1,498 | 17.1% |
| 55 to 64 Years | 1,876 | 21.4% |
| 65 to 74 Years | 1,244 | 14.2% |
| 75 to 84 Years | 692 | 7.9% |
| 85 Years and Over | 150 | 1.7% |
| Total | 8,756 | 100.0% |
Housing Finances in South Euclid
Median Income by Occupancy in South Euclid
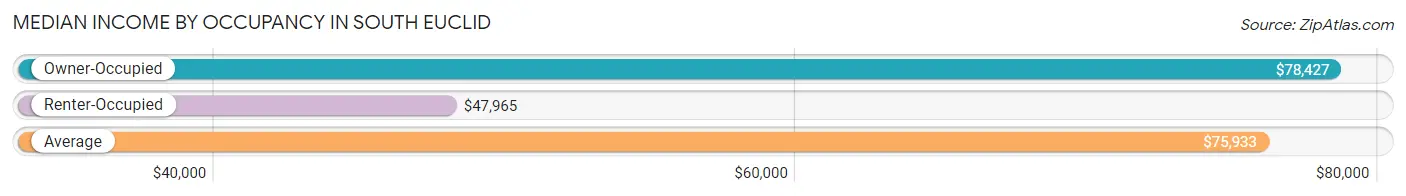
| Occupancy Type | # Households | Median Income |
| Owner-Occupied | 6,846 (78.2%) | $78,427 |
| Renter-Occupied | 1,910 (21.8%) | $47,965 |
| Average | 8,756 (100.0%) | $75,933 |
Occupancy by Householder Income Bracket in South Euclid
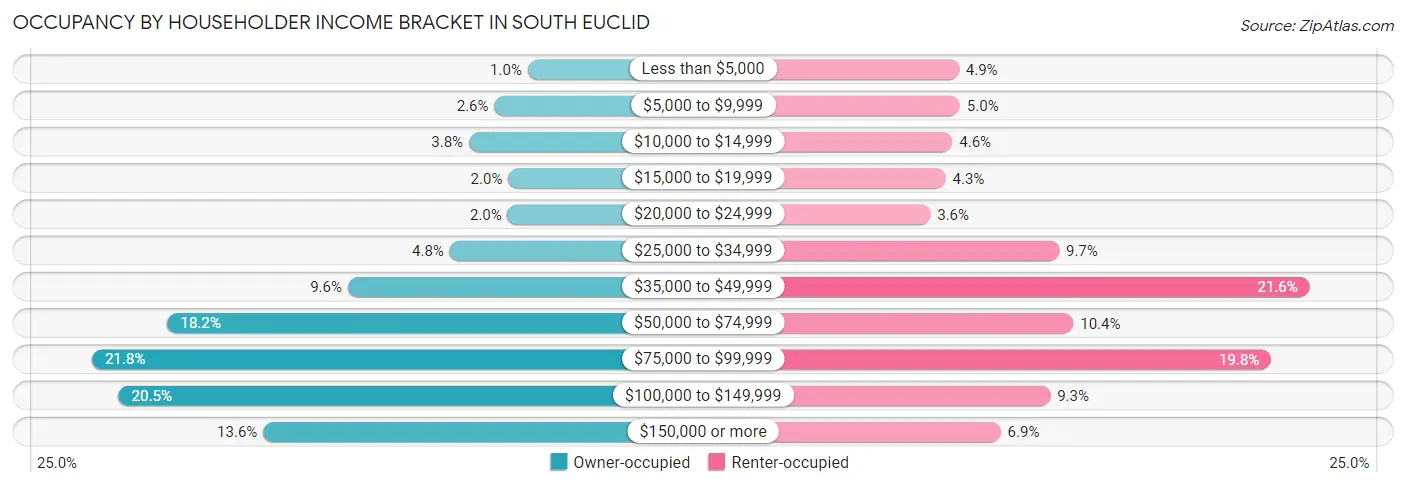
| Income Bracket | Owner-occupied | Renter-occupied |
| Less than $5,000 | 71 (1.0%) | 94 (4.9%) |
| $5,000 to $9,999 | 180 (2.6%) | 95 (5.0%) |
| $10,000 to $14,999 | 263 (3.8%) | 88 (4.6%) |
| $15,000 to $19,999 | 135 (2.0%) | 82 (4.3%) |
| $20,000 to $24,999 | 137 (2.0%) | 68 (3.6%) |
| $25,000 to $34,999 | 326 (4.8%) | 185 (9.7%) |
| $35,000 to $49,999 | 658 (9.6%) | 413 (21.6%) |
| $50,000 to $74,999 | 1,245 (18.2%) | 198 (10.4%) |
| $75,000 to $99,999 | 1,492 (21.8%) | 378 (19.8%) |
| $100,000 to $149,999 | 1,405 (20.5%) | 177 (9.3%) |
| $150,000 or more | 934 (13.6%) | 132 (6.9%) |
| Total | 6,846 (100.0%) | 1,910 (100.0%) |
Monthly Housing Cost Tiers in South Euclid
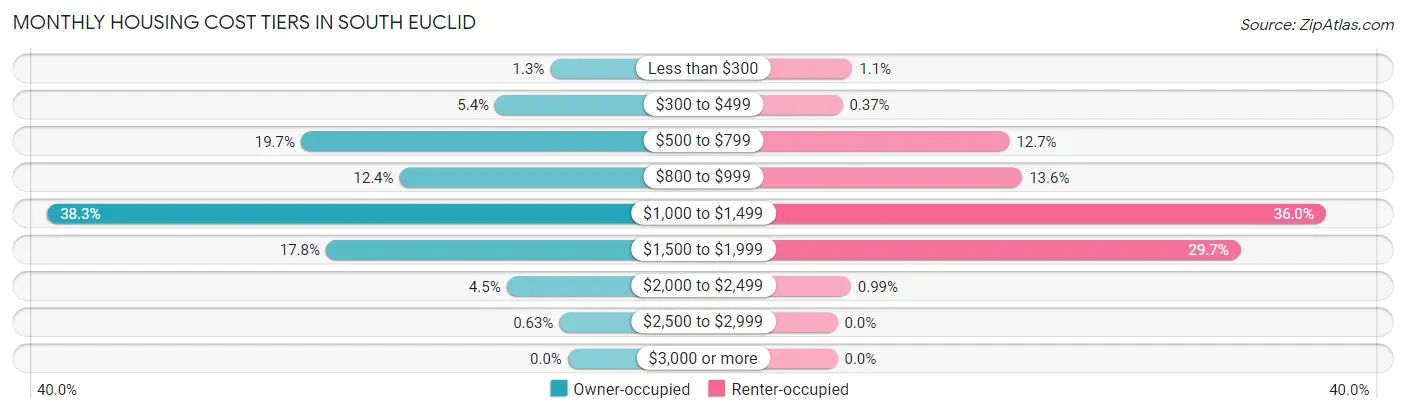
| Monthly Cost | Owner-occupied | Renter-occupied |
| Less than $300 | 88 (1.3%) | 21 (1.1%) |
| $300 to $499 | 367 (5.4%) | 7 (0.4%) |
| $500 to $799 | 1,346 (19.7%) | 242 (12.7%) |
| $800 to $999 | 849 (12.4%) | 260 (13.6%) |
| $1,000 to $1,499 | 2,624 (38.3%) | 687 (36.0%) |
| $1,500 to $1,999 | 1,220 (17.8%) | 567 (29.7%) |
| $2,000 to $2,499 | 309 (4.5%) | 19 (1.0%) |
| $2,500 to $2,999 | 43 (0.6%) | 0 (0.0%) |
| $3,000 or more | 0 (0.0%) | 0 (0.0%) |
| Total | 6,846 (100.0%) | 1,910 (100.0%) |
Physical Housing Characteristics in South Euclid
Housing Structures in South Euclid
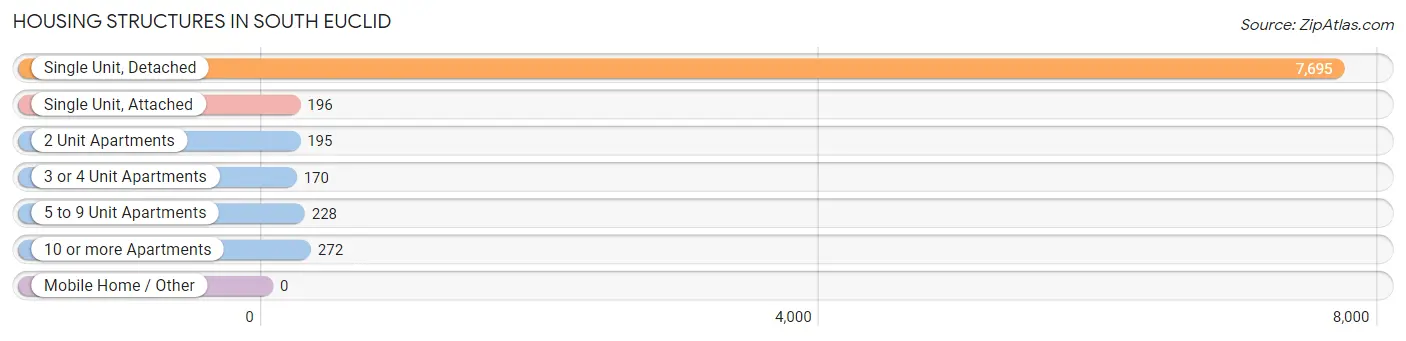
| Structure Type | # Housing Units | % Housing Units |
| Single Unit, Detached | 7,695 | 87.9% |
| Single Unit, Attached | 196 | 2.2% |
| 2 Unit Apartments | 195 | 2.2% |
| 3 or 4 Unit Apartments | 170 | 1.9% |
| 5 to 9 Unit Apartments | 228 | 2.6% |
| 10 or more Apartments | 272 | 3.1% |
| Mobile Home / Other | 0 | 0.0% |
| Total | 8,756 | 100.0% |
Housing Structures by Occupancy in South Euclid
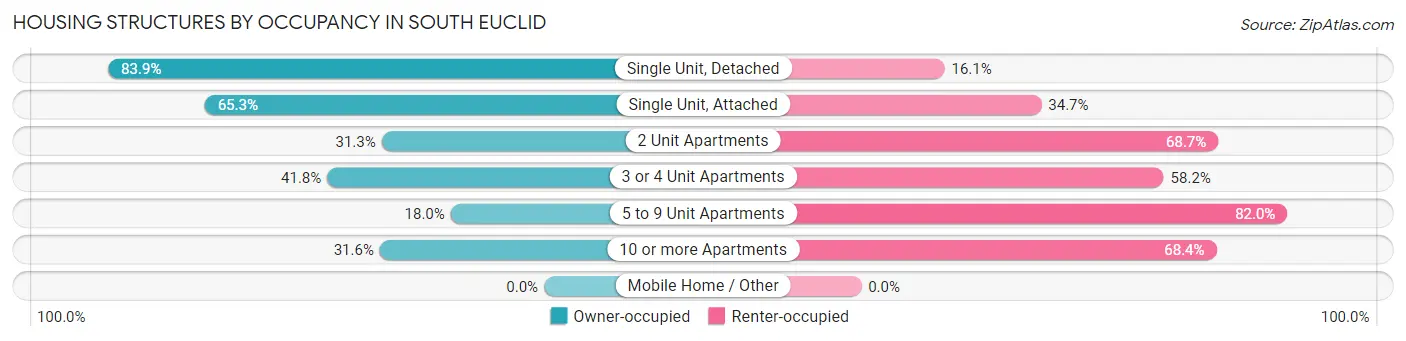
| Structure Type | Owner-occupied | Renter-occupied |
| Single Unit, Detached | 6,459 (83.9%) | 1,236 (16.1%) |
| Single Unit, Attached | 128 (65.3%) | 68 (34.7%) |
| 2 Unit Apartments | 61 (31.3%) | 134 (68.7%) |
| 3 or 4 Unit Apartments | 71 (41.8%) | 99 (58.2%) |
| 5 to 9 Unit Apartments | 41 (18.0%) | 187 (82.0%) |
| 10 or more Apartments | 86 (31.6%) | 186 (68.4%) |
| Mobile Home / Other | 0 (0.0%) | 0 (0.0%) |
| Total | 6,846 (78.2%) | 1,910 (21.8%) |
Housing Structures by Number of Rooms in South Euclid
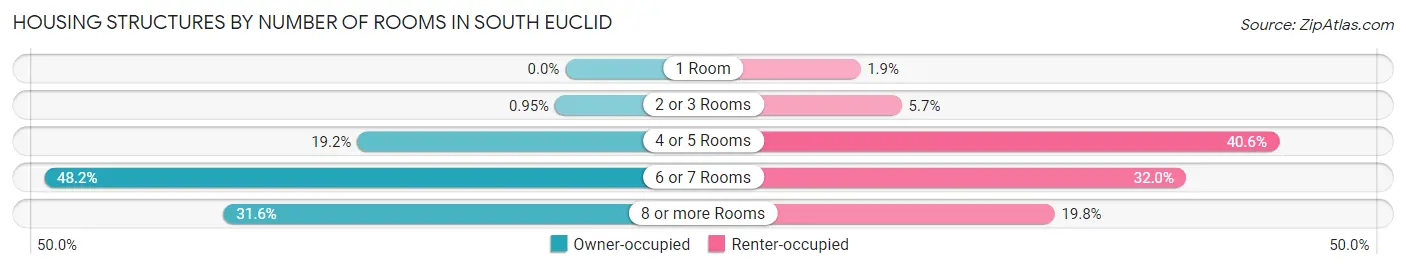
| Number of Rooms | Owner-occupied | Renter-occupied |
| 1 Room | 0 (0.0%) | 36 (1.9%) |
| 2 or 3 Rooms | 65 (0.9%) | 109 (5.7%) |
| 4 or 5 Rooms | 1,317 (19.2%) | 775 (40.6%) |
| 6 or 7 Rooms | 3,300 (48.2%) | 611 (32.0%) |
| 8 or more Rooms | 2,164 (31.6%) | 379 (19.8%) |
| Total | 6,846 (100.0%) | 1,910 (100.0%) |
Housing Structure by Heating Type in South Euclid
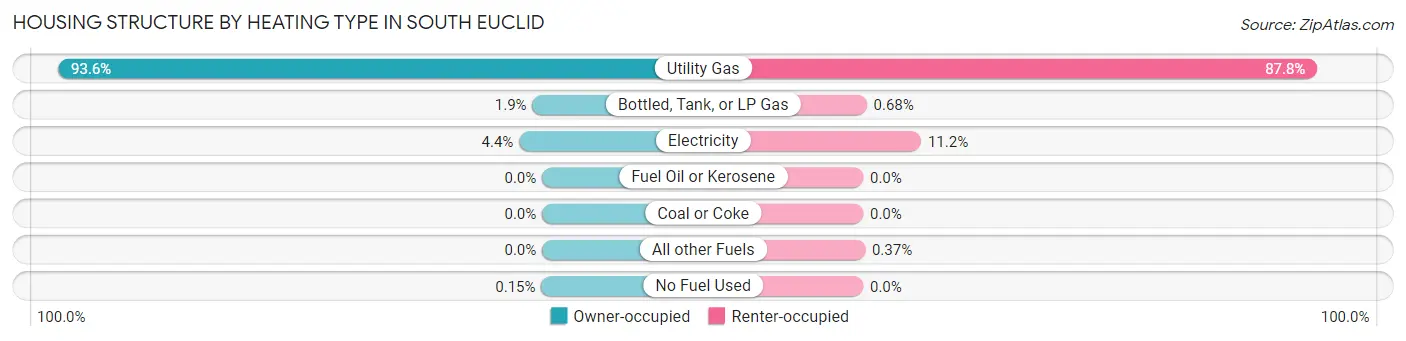
| Heating Type | Owner-occupied | Renter-occupied |
| Utility Gas | 6,405 (93.6%) | 1,676 (87.7%) |
| Bottled, Tank, or LP Gas | 128 (1.9%) | 13 (0.7%) |
| Electricity | 303 (4.4%) | 214 (11.2%) |
| Fuel Oil or Kerosene | 0 (0.0%) | 0 (0.0%) |
| Coal or Coke | 0 (0.0%) | 0 (0.0%) |
| All other Fuels | 0 (0.0%) | 7 (0.4%) |
| No Fuel Used | 10 (0.2%) | 0 (0.0%) |
| Total | 6,846 (100.0%) | 1,910 (100.0%) |
Household Vehicle Usage in South Euclid
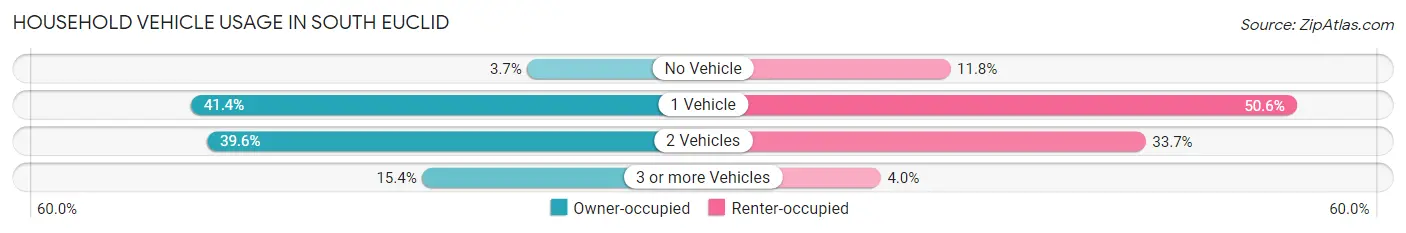
| Vehicles per Household | Owner-occupied | Renter-occupied |
| No Vehicle | 250 (3.6%) | 225 (11.8%) |
| 1 Vehicle | 2,832 (41.4%) | 966 (50.6%) |
| 2 Vehicles | 2,708 (39.6%) | 643 (33.7%) |
| 3 or more Vehicles | 1,056 (15.4%) | 76 (4.0%) |
| Total | 6,846 (100.0%) | 1,910 (100.0%) |
Real Estate & Mortgages in South Euclid
Real Estate and Mortgage Overview in South Euclid
| Characteristic | Without Mortgage | With Mortgage |
| Housing Units | 2,002 | 4,844 |
| Median Property Value | $123,300 | $123,100 |
| Median Household Income | $56,205 | $667 |
| Monthly Housing Costs | $634 | $0 |
| Real Estate Taxes | $3,504 | $55 |
Property Value by Mortgage Status in South Euclid
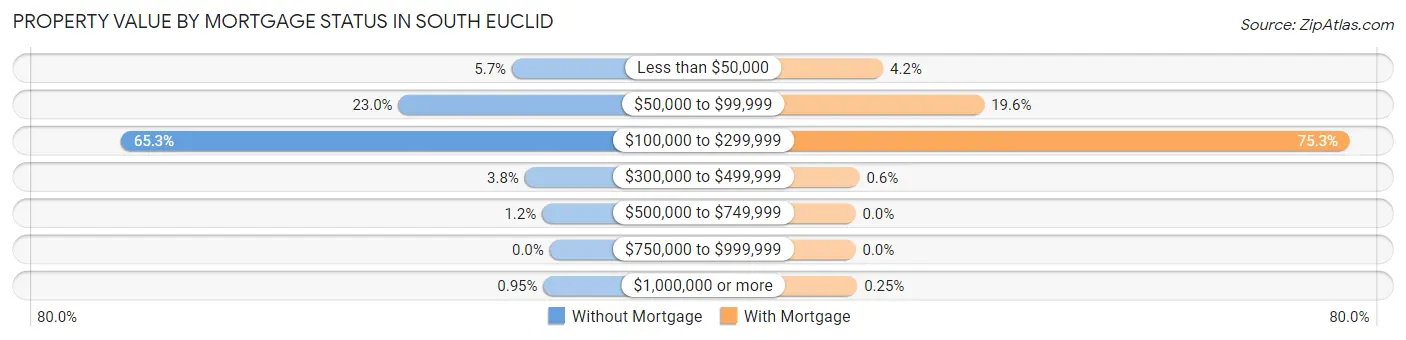
| Property Value | Without Mortgage | With Mortgage |
| Less than $50,000 | 115 (5.7%) | 204 (4.2%) |
| $50,000 to $99,999 | 461 (23.0%) | 950 (19.6%) |
| $100,000 to $299,999 | 1,308 (65.3%) | 3,649 (75.3%) |
| $300,000 to $499,999 | 76 (3.8%) | 29 (0.6%) |
| $500,000 to $749,999 | 23 (1.1%) | 0 (0.0%) |
| $750,000 to $999,999 | 0 (0.0%) | 0 (0.0%) |
| $1,000,000 or more | 19 (0.9%) | 12 (0.3%) |
| Total | 2,002 (100.0%) | 4,844 (100.0%) |
Household Income by Mortgage Status in South Euclid
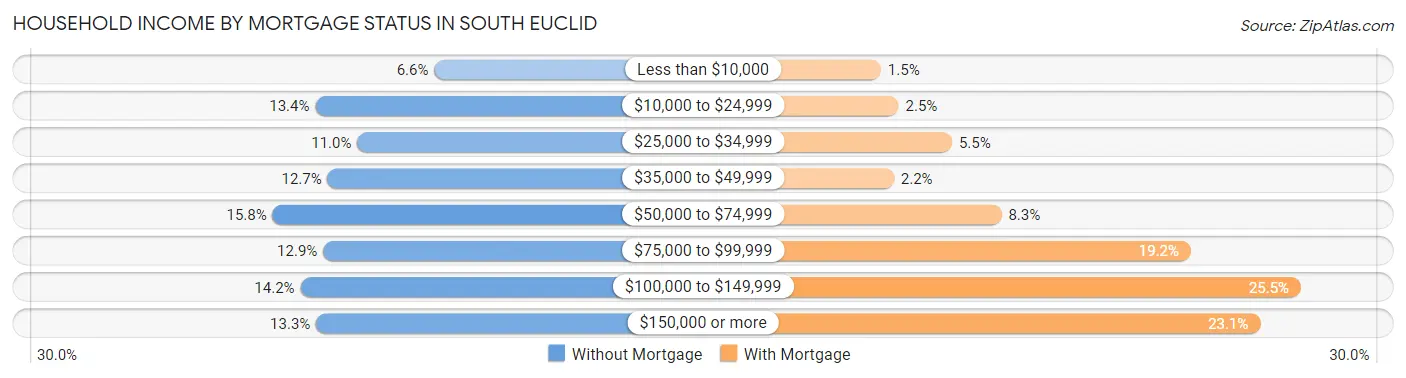
| Household Income | Without Mortgage | With Mortgage |
| Less than $10,000 | 132 (6.6%) | 70 (1.5%) |
| $10,000 to $24,999 | 268 (13.4%) | 119 (2.5%) |
| $25,000 to $34,999 | 220 (11.0%) | 267 (5.5%) |
| $35,000 to $49,999 | 254 (12.7%) | 106 (2.2%) |
| $50,000 to $74,999 | 317 (15.8%) | 404 (8.3%) |
| $75,000 to $99,999 | 259 (12.9%) | 928 (19.2%) |
| $100,000 to $149,999 | 285 (14.2%) | 1,233 (25.5%) |
| $150,000 or more | 267 (13.3%) | 1,120 (23.1%) |
| Total | 2,002 (100.0%) | 4,844 (100.0%) |
Property Value to Household Income Ratio in South Euclid
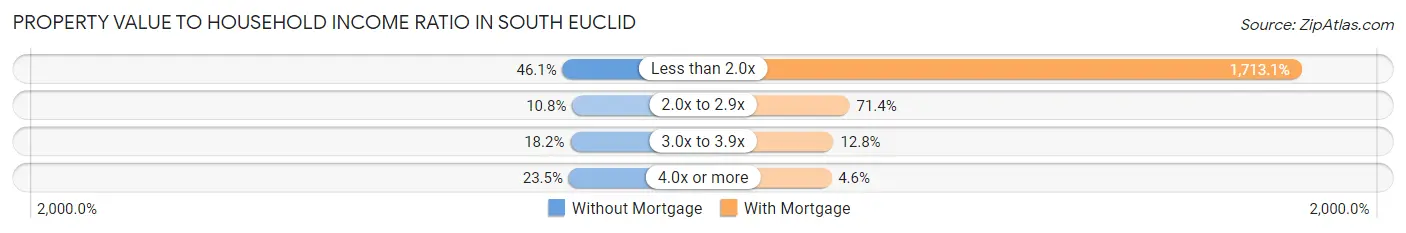
| Value-to-Income Ratio | Without Mortgage | With Mortgage |
| Less than 2.0x | 922 (46.1%) | 82,983 (1,713.1%) |
| 2.0x to 2.9x | 217 (10.8%) | 3,457 (71.4%) |
| 3.0x to 3.9x | 365 (18.2%) | 622 (12.8%) |
| 4.0x or more | 470 (23.5%) | 223 (4.6%) |
| Total | 2,002 (100.0%) | 4,844 (100.0%) |
Real Estate Taxes by Mortgage Status in South Euclid
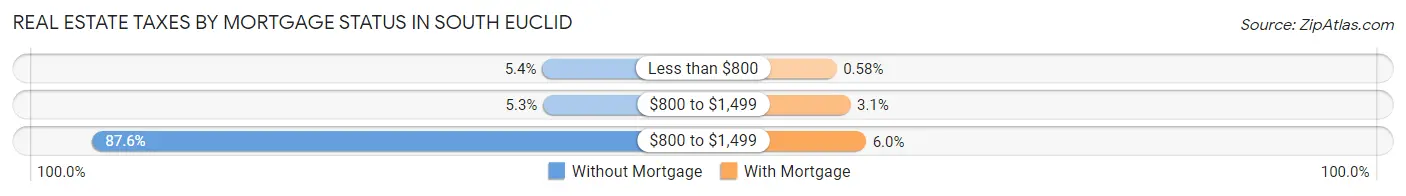
| Property Taxes | Without Mortgage | With Mortgage |
| Less than $800 | 109 (5.4%) | 28 (0.6%) |
| $800 to $1,499 | 106 (5.3%) | 150 (3.1%) |
| $800 to $1,499 | 1,754 (87.6%) | 289 (6.0%) |
| Total | 2,002 (100.0%) | 4,844 (100.0%) |
Health & Disability in South Euclid
Health Insurance Coverage by Age in South Euclid
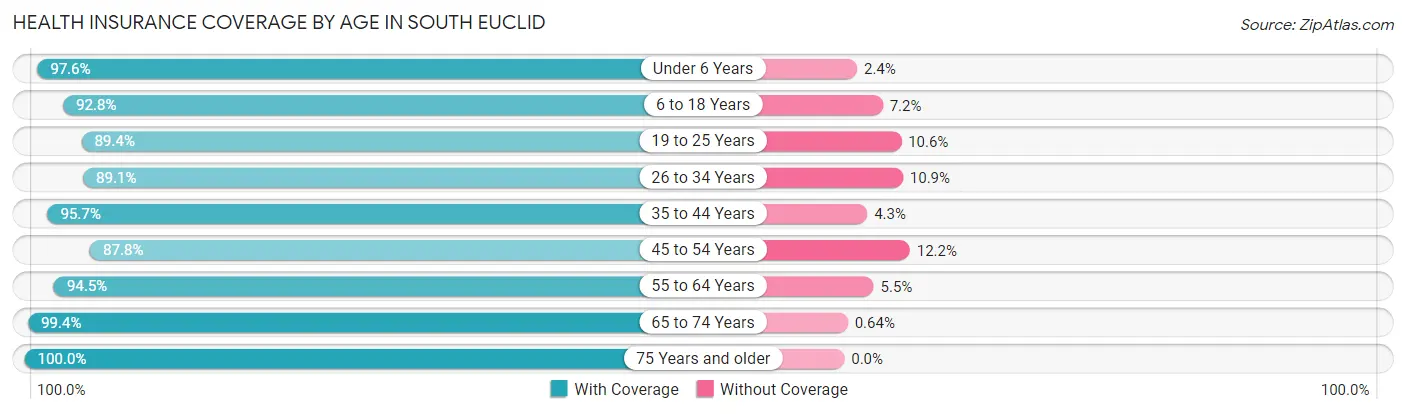
| Age Bracket | With Coverage | Without Coverage |
| Under 6 Years | 1,479 (97.6%) | 36 (2.4%) |
| 6 to 18 Years | 3,326 (92.8%) | 257 (7.2%) |
| 19 to 25 Years | 2,495 (89.4%) | 296 (10.6%) |
| 26 to 34 Years | 2,145 (89.1%) | 263 (10.9%) |
| 35 to 44 Years | 2,847 (95.7%) | 127 (4.3%) |
| 45 to 54 Years | 2,183 (87.8%) | 304 (12.2%) |
| 55 to 64 Years | 2,660 (94.5%) | 154 (5.5%) |
| 65 to 74 Years | 1,873 (99.4%) | 12 (0.6%) |
| 75 Years and older | 1,273 (100.0%) | 0 (0.0%) |
| Total | 20,281 (93.3%) | 1,449 (6.7%) |
Health Insurance Coverage by Citizenship Status in South Euclid
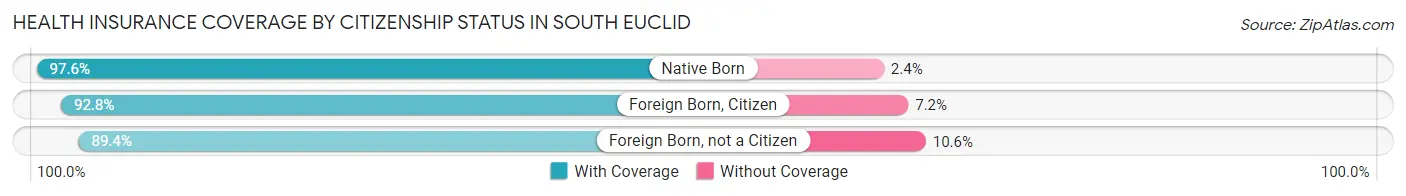
| Citizenship Status | With Coverage | Without Coverage |
| Native Born | 1,479 (97.6%) | 36 (2.4%) |
| Foreign Born, Citizen | 3,326 (92.8%) | 257 (7.2%) |
| Foreign Born, not a Citizen | 2,495 (89.4%) | 296 (10.6%) |
Health Insurance Coverage by Household Income in South Euclid
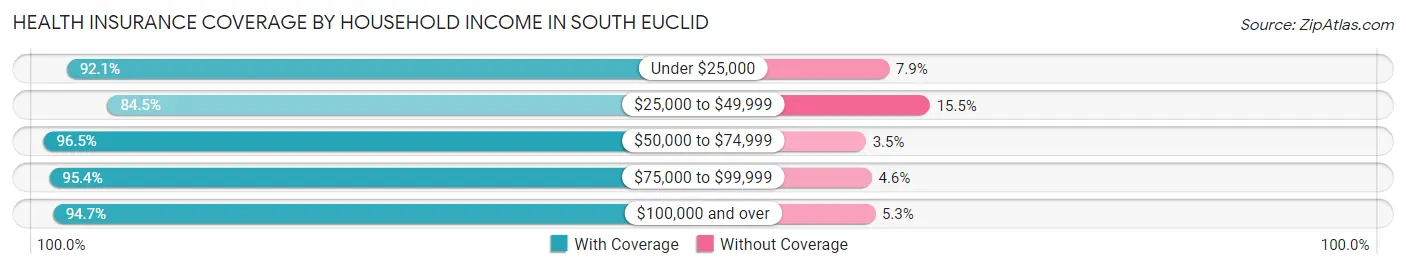
| Household Income | With Coverage | Without Coverage |
| Under $25,000 | 1,705 (92.1%) | 146 (7.9%) |
| $25,000 to $49,999 | 2,686 (84.5%) | 494 (15.5%) |
| $50,000 to $74,999 | 3,485 (96.5%) | 128 (3.5%) |
| $75,000 to $99,999 | 4,733 (95.4%) | 230 (4.6%) |
| $100,000 and over | 7,115 (94.7%) | 397 (5.3%) |
Public vs Private Health Insurance Coverage by Age in South Euclid
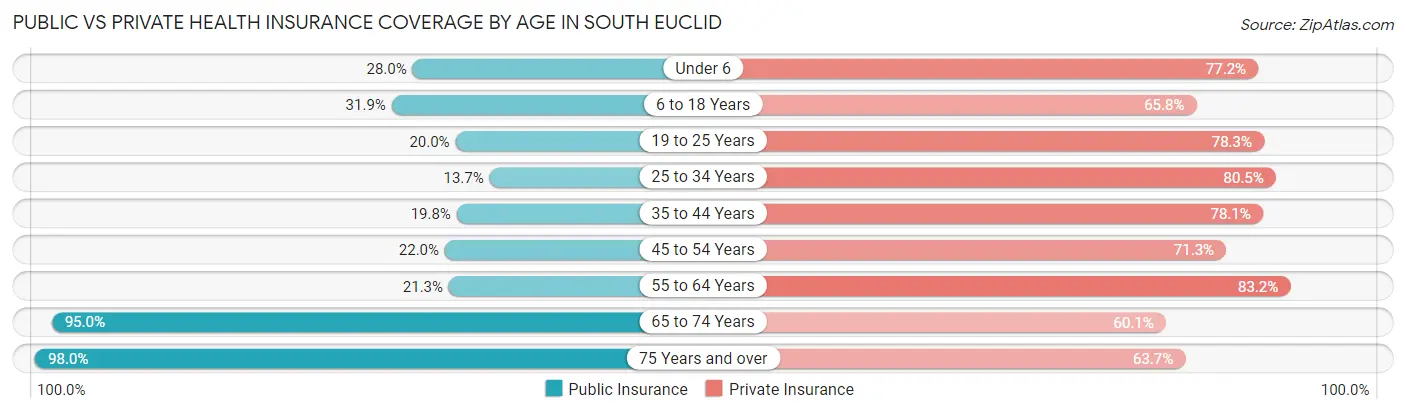
| Age Bracket | Public Insurance | Private Insurance |
| Under 6 | 424 (28.0%) | 1,170 (77.2%) |
| 6 to 18 Years | 1,142 (31.9%) | 2,357 (65.8%) |
| 19 to 25 Years | 559 (20.0%) | 2,186 (78.3%) |
| 25 to 34 Years | 330 (13.7%) | 1,939 (80.5%) |
| 35 to 44 Years | 589 (19.8%) | 2,323 (78.1%) |
| 45 to 54 Years | 547 (22.0%) | 1,773 (71.3%) |
| 55 to 64 Years | 598 (21.2%) | 2,341 (83.2%) |
| 65 to 74 Years | 1,790 (95.0%) | 1,133 (60.1%) |
| 75 Years and over | 1,248 (98.0%) | 811 (63.7%) |
| Total | 7,227 (33.3%) | 16,033 (73.8%) |
Disability Status by Sex by Age in South Euclid
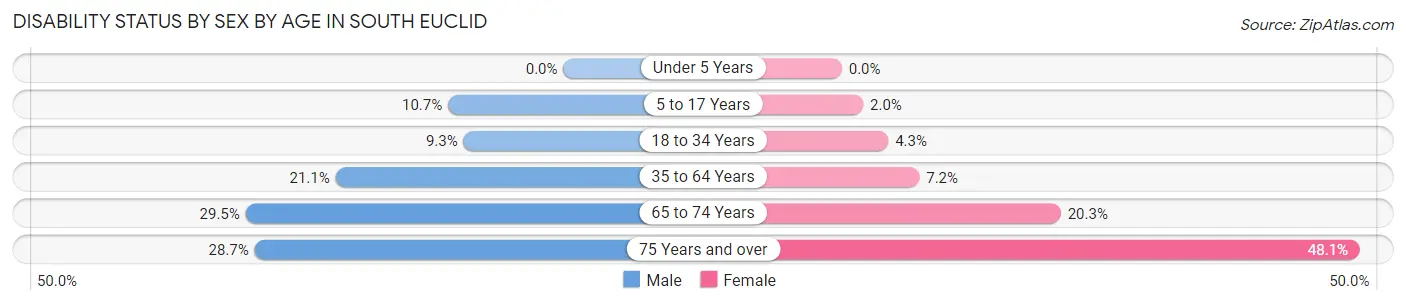
| Age Bracket | Male | Female |
| Under 5 Years | 0 (0.0%) | 0 (0.0%) |
| 5 to 17 Years | 227 (10.7%) | 27 (2.0%) |
| 18 to 34 Years | 293 (9.3%) | 103 (4.3%) |
| 35 to 64 Years | 808 (21.1%) | 320 (7.2%) |
| 65 to 74 Years | 225 (29.5%) | 228 (20.3%) |
| 75 Years and over | 133 (28.7%) | 389 (48.1%) |
Disability Class by Sex by Age in South Euclid
Disability Class: Hearing Difficulty
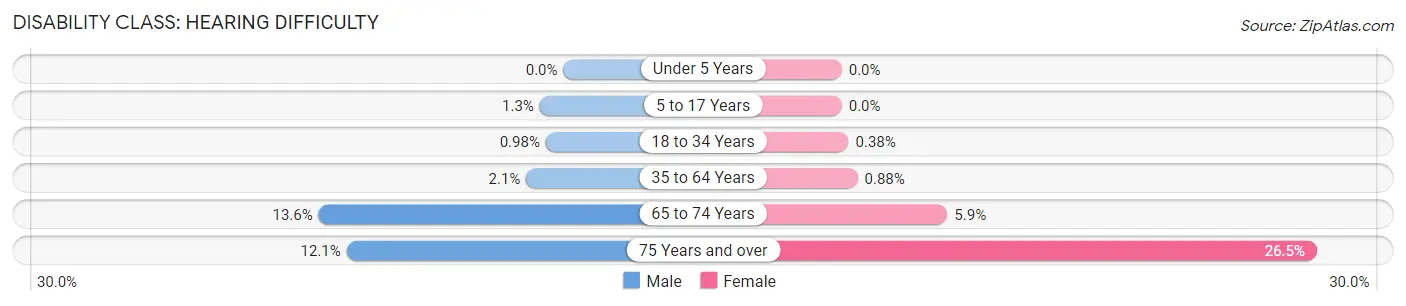
| Age Bracket | Male | Female |
| Under 5 Years | 0 (0.0%) | 0 (0.0%) |
| 5 to 17 Years | 28 (1.3%) | 0 (0.0%) |
| 18 to 34 Years | 31 (1.0%) | 9 (0.4%) |
| 35 to 64 Years | 79 (2.1%) | 39 (0.9%) |
| 65 to 74 Years | 104 (13.6%) | 66 (5.9%) |
| 75 Years and over | 56 (12.1%) | 214 (26.5%) |
Disability Class: Vision Difficulty
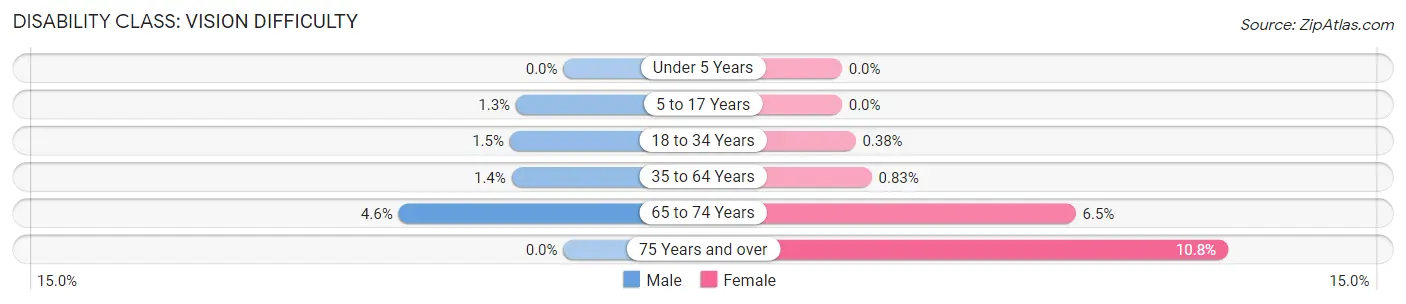
| Age Bracket | Male | Female |
| Under 5 Years | 0 (0.0%) | 0 (0.0%) |
| 5 to 17 Years | 28 (1.3%) | 0 (0.0%) |
| 18 to 34 Years | 47 (1.5%) | 9 (0.4%) |
| 35 to 64 Years | 55 (1.4%) | 37 (0.8%) |
| 65 to 74 Years | 35 (4.6%) | 73 (6.5%) |
| 75 Years and over | 0 (0.0%) | 87 (10.7%) |
Disability Class: Cognitive Difficulty
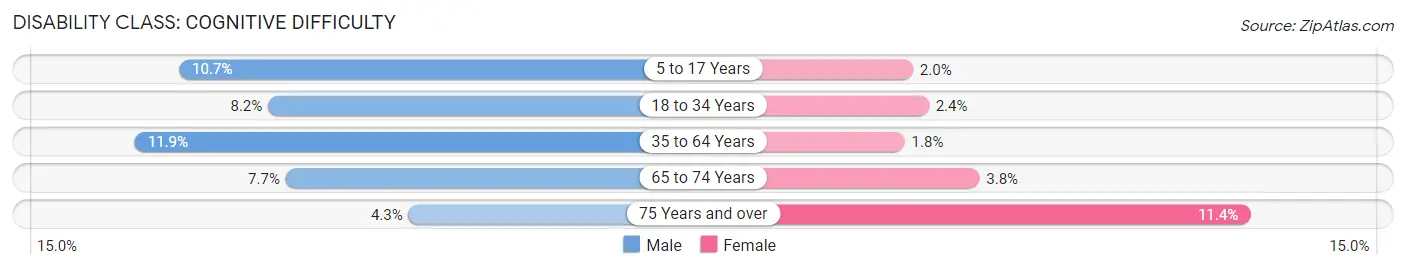
| Age Bracket | Male | Female |
| 5 to 17 Years | 227 (10.7%) | 27 (2.0%) |
| 18 to 34 Years | 260 (8.2%) | 58 (2.4%) |
| 35 to 64 Years | 456 (11.9%) | 78 (1.8%) |
| 65 to 74 Years | 59 (7.7%) | 43 (3.8%) |
| 75 Years and over | 20 (4.3%) | 92 (11.4%) |
Disability Class: Ambulatory Difficulty
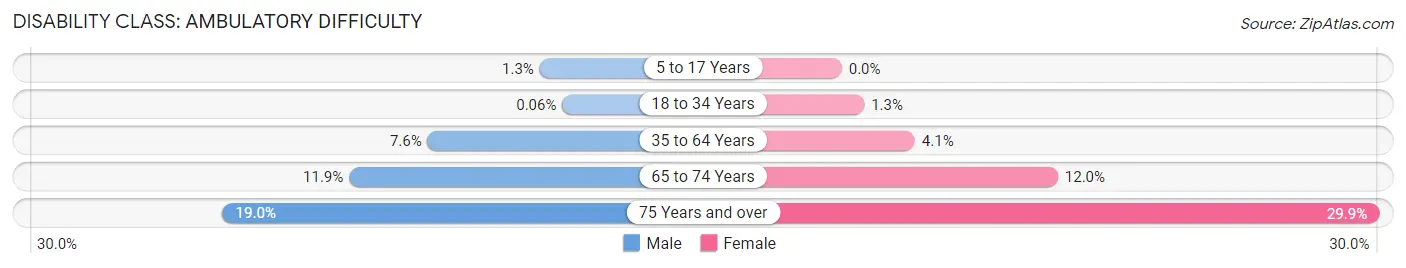
| Age Bracket | Male | Female |
| 5 to 17 Years | 28 (1.3%) | 0 (0.0%) |
| 18 to 34 Years | 2 (0.1%) | 30 (1.3%) |
| 35 to 64 Years | 289 (7.6%) | 181 (4.1%) |
| 65 to 74 Years | 91 (11.9%) | 135 (12.0%) |
| 75 Years and over | 88 (19.0%) | 242 (29.9%) |
Disability Class: Self-Care Difficulty
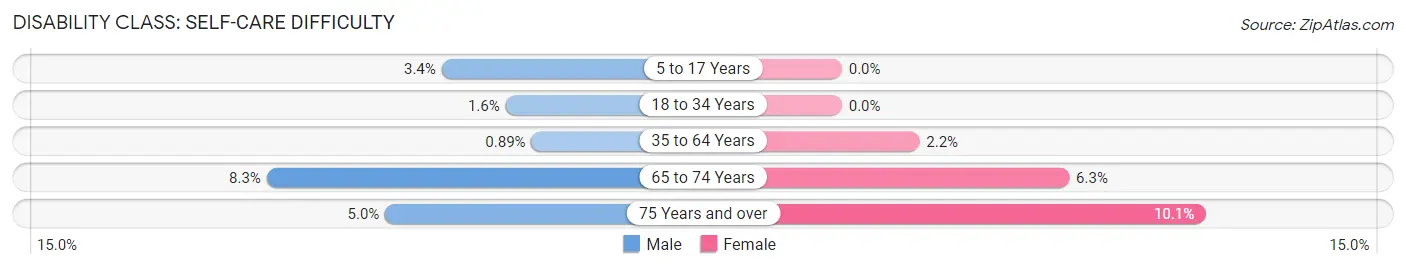
| Age Bracket | Male | Female |
| 5 to 17 Years | 72 (3.4%) | 0 (0.0%) |
| 18 to 34 Years | 51 (1.6%) | 0 (0.0%) |
| 35 to 64 Years | 34 (0.9%) | 96 (2.2%) |
| 65 to 74 Years | 63 (8.3%) | 71 (6.3%) |
| 75 Years and over | 23 (5.0%) | 82 (10.1%) |
Technology Access in South Euclid
Computing Device Access in South Euclid
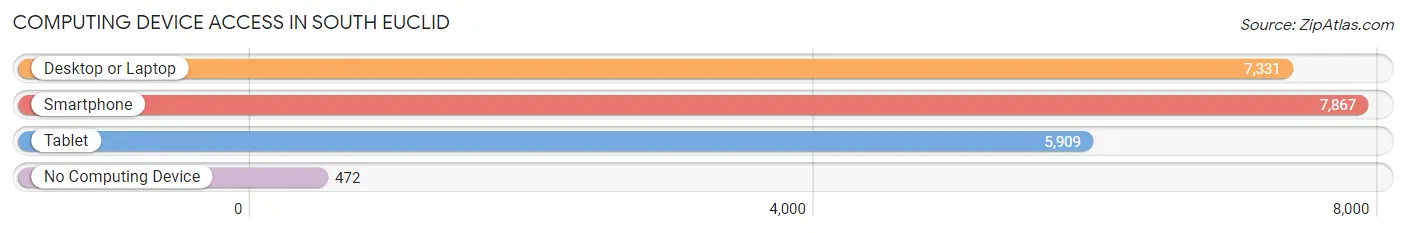
| Device Type | # Households | % Households |
| Desktop or Laptop | 7,331 | 83.7% |
| Smartphone | 7,867 | 89.8% |
| Tablet | 5,909 | 67.5% |
| No Computing Device | 472 | 5.4% |
| Total | 8,756 | 100.0% |
Internet Access in South Euclid
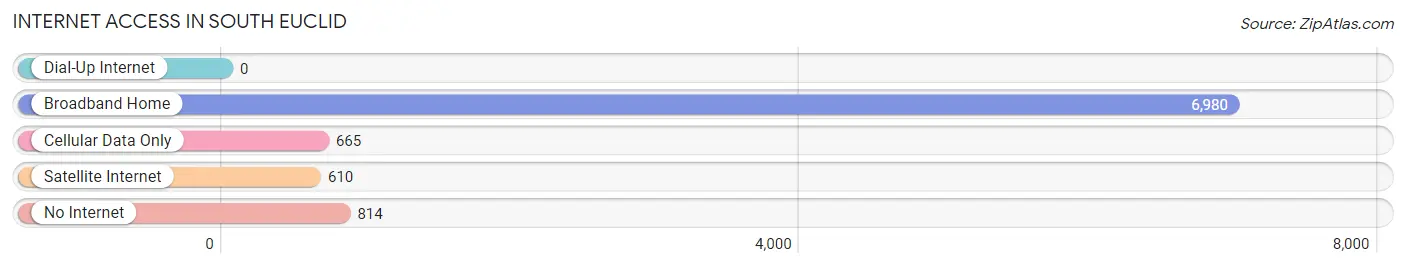
| Internet Type | # Households | % Households |
| Dial-Up Internet | 0 | 0.0% |
| Broadband Home | 6,980 | 79.7% |
| Cellular Data Only | 665 | 7.6% |
| Satellite Internet | 610 | 7.0% |
| No Internet | 814 | 9.3% |
| Total | 8,756 | 100.0% |
South Euclid Summary
History
South Euclid is a city located in Cuyahoga County, Ohio. It is a suburb of Cleveland and is part of the Greater Cleveland Metropolitan Area. The city was founded in 1917 and was originally part of Euclid Township. It was incorporated as a village in 1930 and became a city in 1941.
The city was named after the Greek mathematician Euclid, who lived in the area in the 4th century BC. The city was originally a farming community and was known for its dairy farms. In the early 20th century, the city began to develop as a residential suburb of Cleveland. The city was home to a number of prominent families, including the Van Sweringen brothers, who developed the Shaker Heights Rapid Transit line.
Geography
South Euclid is located in Cuyahoga County, Ohio. It is situated on the western edge of the Cleveland metropolitan area. The city is bordered by Cleveland to the north, Euclid to the east, Lyndhurst to the south, and Richmond Heights to the west. The city covers an area of 5.3 square miles and has a population of 22,295 as of the 2010 census.
The city is located on the edge of the Western Reserve, a region of Ohio that was originally part of the Connecticut Western Reserve. The city is situated on a plateau that is part of the Allegheny Plateau. The city is located on the edge of the Cuyahoga Valley National Park, which is a popular destination for outdoor recreation.
Economy
South Euclid is a residential suburb of Cleveland and is home to a number of businesses and industries. The city is home to a number of corporate headquarters, including the headquarters of the National City Bank, which is now part of PNC Financial Services. The city is also home to a number of retail stores, restaurants, and other businesses.
The city is home to a number of educational institutions, including Notre Dame College, Ursuline College, and John Carroll University. The city is also home to a number of healthcare facilities, including the Cleveland Clinic Euclid Hospital.
Demographics
As of the 2010 census, South Euclid had a population of 22,295. The racial makeup of the city was 79.2% White, 14.2% African American, 0.3% Native American, 2.2% Asian, 0.1% Pacific Islander, and 3.9% from other races. Hispanic or Latino of any race were 4.3% of the population.
The median household income in South Euclid was $45,945, and the median family income was $54,945. The per capita income for the city was $22,945. About 8.3% of families and 10.2% of the population were below the poverty line, including 14.2% of those under age 18 and 6.2% of those age 65 or over.
Common Questions
What is Per Capita Income in South Euclid?
Per Capita income in South Euclid is $35,667.
What is the Median Family Income in South Euclid?
Median Family Income in South Euclid is $82,595.
What is the Median Household income in South Euclid?
Median Household Income in South Euclid is $75,933.
What is Income or Wage Gap in South Euclid?
Income or Wage Gap in South Euclid is 8.1%.
Women in South Euclid earn 91.9 cents for every dollar earned by a man.
What is Inequality or Gini Index in South Euclid?
Inequality or Gini Index in South Euclid is 0.40.
What is the Total Population of South Euclid?
Total Population of South Euclid is 21,754.
What is the Total Male Population of South Euclid?
Total Male Population of South Euclid is 11,023.
What is the Total Female Population of South Euclid?
Total Female Population of South Euclid is 10,731.
What is the Ratio of Males per 100 Females in South Euclid?
There are 102.72 Males per 100 Females in South Euclid.
What is the Ratio of Females per 100 Males in South Euclid?
There are 97.35 Females per 100 Males in South Euclid.
What is the Median Population Age in South Euclid?
Median Population Age in South Euclid is 36.1 Years.
What is the Average Family Size in South Euclid
Average Family Size in South Euclid is 3.1 People.
What is the Average Household Size in South Euclid
Average Household Size in South Euclid is 2.4 People.
How Large is the Labor Force in South Euclid?
There are 12,030 People in the Labor Forcein in South Euclid.
What is the Percentage of People in the Labor Force in South Euclid?
68.3% of People are in the Labor Force in South Euclid.
What is the Unemployment Rate in South Euclid?
Unemployment Rate in South Euclid is 5.9%.