Lockland, OH Map & Demographics
Lockland Map
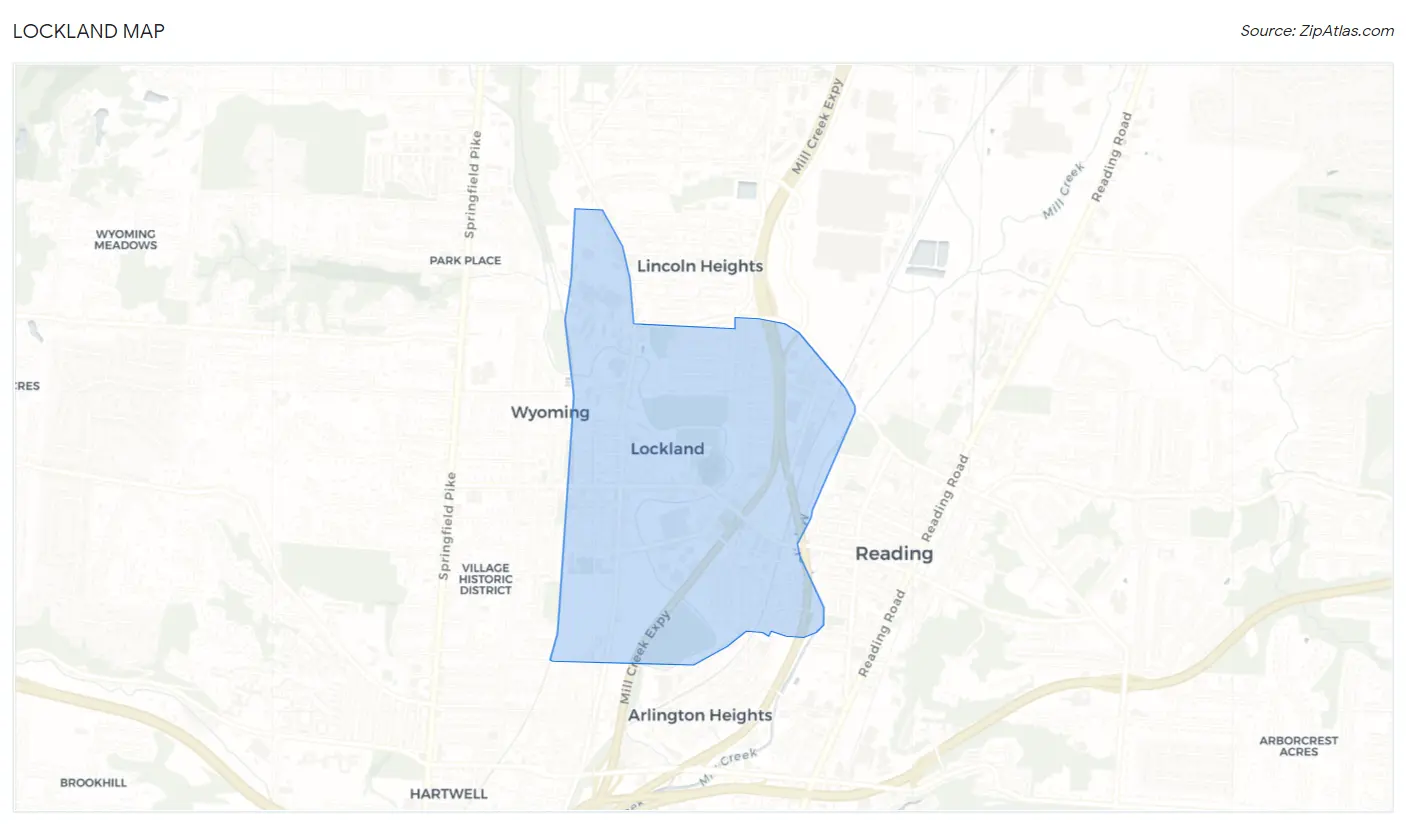
Lockland Overview
$25,433
PER CAPITA INCOME
$62,177
AVG FAMILY INCOME
$44,770
AVG HOUSEHOLD INCOME
29.4%
WAGE / INCOME GAP [ % ]
70.6¢/ $1
WAGE / INCOME GAP [ $ ]
$12,466
FAMILY INCOME DEFICIT
0.42
INEQUALITY / GINI INDEX
3,497
TOTAL POPULATION
1,559
MALE POPULATION
1,938
FEMALE POPULATION
80.44
MALES / 100 FEMALES
124.31
FEMALES / 100 MALES
43.7
MEDIAN AGE
3.0
AVG FAMILY SIZE
2.3
AVG HOUSEHOLD SIZE
1,938
LABOR FORCE [ PEOPLE ]
66.8%
PERCENT IN LABOR FORCE
7.3%
UNEMPLOYMENT RATE
Lockland Area Codes
Income in Lockland
Income Overview in Lockland
Per Capita Income in Lockland is $25,433, while median incomes of families and households are $62,177 and $44,770 respectively.
| Characteristic | Number | Measure |
| Per Capita Income | 3,497 | $25,433 |
| Median Family Income | 828 | $62,177 |
| Mean Family Income | 828 | $65,721 |
| Median Household Income | 1,499 | $44,770 |
| Mean Household Income | 1,499 | $55,706 |
| Income Deficit | 828 | $12,466 |
| Wage / Income Gap (%) | 3,497 | 29.38% |
| Wage / Income Gap ($) | 3,497 | 70.62¢ per $1 |
| Gini / Inequality Index | 3,497 | 0.42 |
Earnings by Sex in Lockland
Average Earnings in Lockland are $32,899, $39,621 for men and $27,980 for women, a difference of 29.4%.
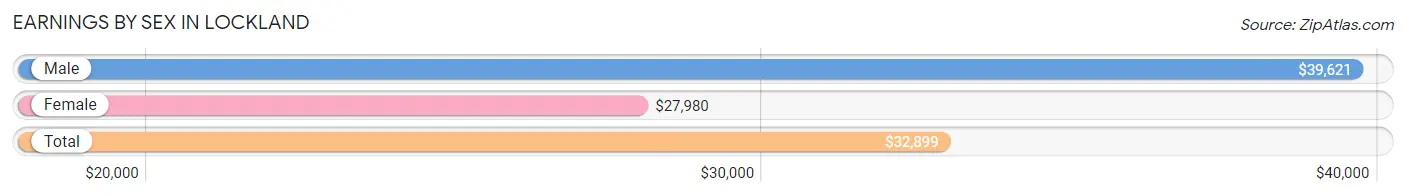
| Sex | Number | Average Earnings |
| Male | 960 (49.3%) | $39,621 |
| Female | 987 (50.7%) | $27,980 |
| Total | 1,947 (100.0%) | $32,899 |
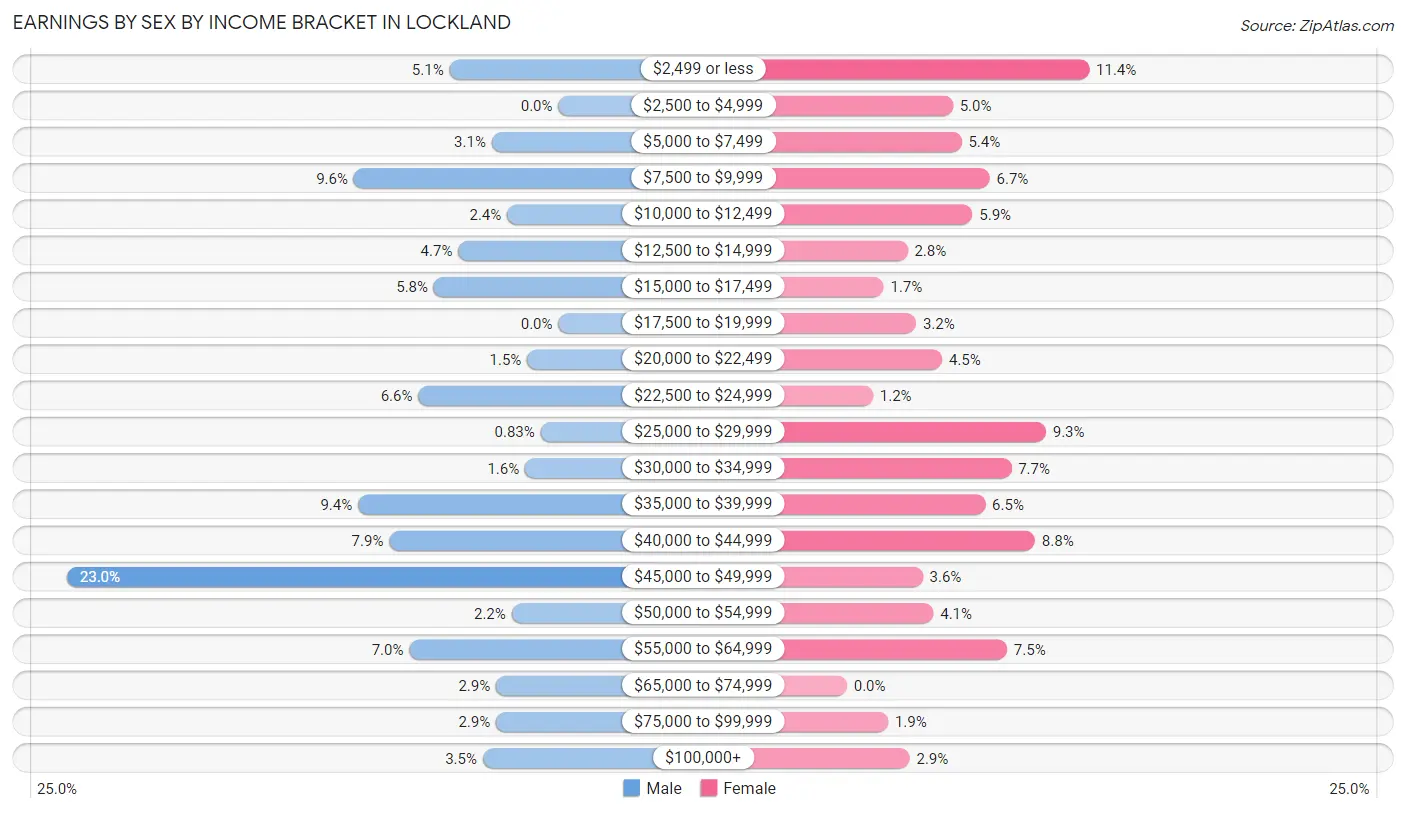
Earnings by Sex by Income Bracket in Lockland
The most common earnings brackets in Lockland are $45,000 to $49,999 for men (221 | 23.0%) and $2,499 or less for women (112 | 11.4%).
| Income | Male | Female |
| $2,499 or less | 49 (5.1%) | 112 (11.4%) |
| $2,500 to $4,999 | 0 (0.0%) | 49 (5.0%) |
| $5,000 to $7,499 | 30 (3.1%) | 53 (5.4%) |
| $7,500 to $9,999 | 92 (9.6%) | 66 (6.7%) |
| $10,000 to $12,499 | 23 (2.4%) | 58 (5.9%) |
| $12,500 to $14,999 | 45 (4.7%) | 28 (2.8%) |
| $15,000 to $17,499 | 56 (5.8%) | 17 (1.7%) |
| $17,500 to $19,999 | 0 (0.0%) | 32 (3.2%) |
| $20,000 to $22,499 | 14 (1.5%) | 44 (4.5%) |
| $22,500 to $24,999 | 63 (6.6%) | 12 (1.2%) |
| $25,000 to $29,999 | 8 (0.8%) | 92 (9.3%) |
| $30,000 to $34,999 | 15 (1.6%) | 76 (7.7%) |
| $35,000 to $39,999 | 90 (9.4%) | 64 (6.5%) |
| $40,000 to $44,999 | 76 (7.9%) | 87 (8.8%) |
| $45,000 to $49,999 | 221 (23.0%) | 35 (3.5%) |
| $50,000 to $54,999 | 21 (2.2%) | 40 (4.1%) |
| $55,000 to $64,999 | 67 (7.0%) | 74 (7.5%) |
| $65,000 to $74,999 | 28 (2.9%) | 0 (0.0%) |
| $75,000 to $99,999 | 28 (2.9%) | 19 (1.9%) |
| $100,000+ | 34 (3.5%) | 29 (2.9%) |
| Total | 960 (100.0%) | 987 (100.0%) |
Earnings by Sex by Educational Attainment in Lockland
Average earnings in Lockland are $44,576 for men and $33,323 for women, a difference of 25.2%. Men with an educational attainment of high school diploma enjoy the highest average annual earnings of $45,447, while those with college or associate's degree education earn the least with $44,013. Women with an educational attainment of college or associate's degree earn the most with the average annual earnings of $37,885, while those with less than high school education have the smallest earnings of $2,499.
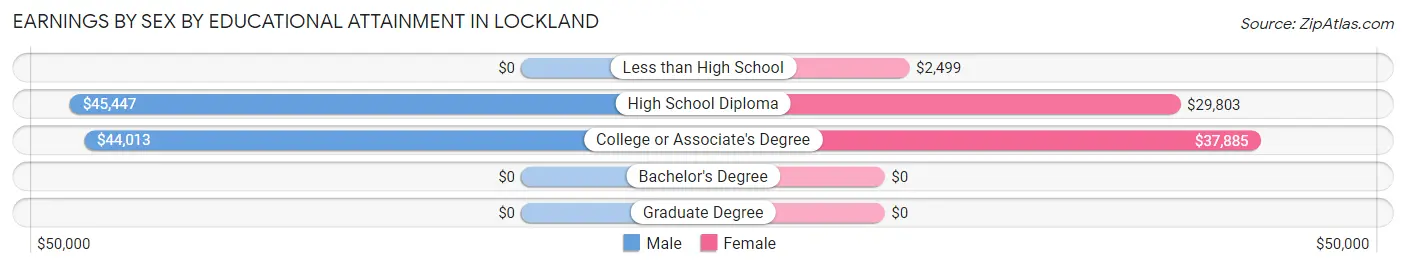
| Educational Attainment | Male Income | Female Income |
| Less than High School | - | - |
| High School Diploma | $45,447 | $29,803 |
| College or Associate's Degree | $44,013 | $37,885 |
| Bachelor's Degree | - | - |
| Graduate Degree | - | - |
| Total | $44,576 | $33,323 |
Family Income in Lockland
Family Income Brackets in Lockland
According to the Lockland family income data, there are 201 families falling into the $100,000 to $149,999 income range, which is the most common income bracket and makes up 24.3% of all families.
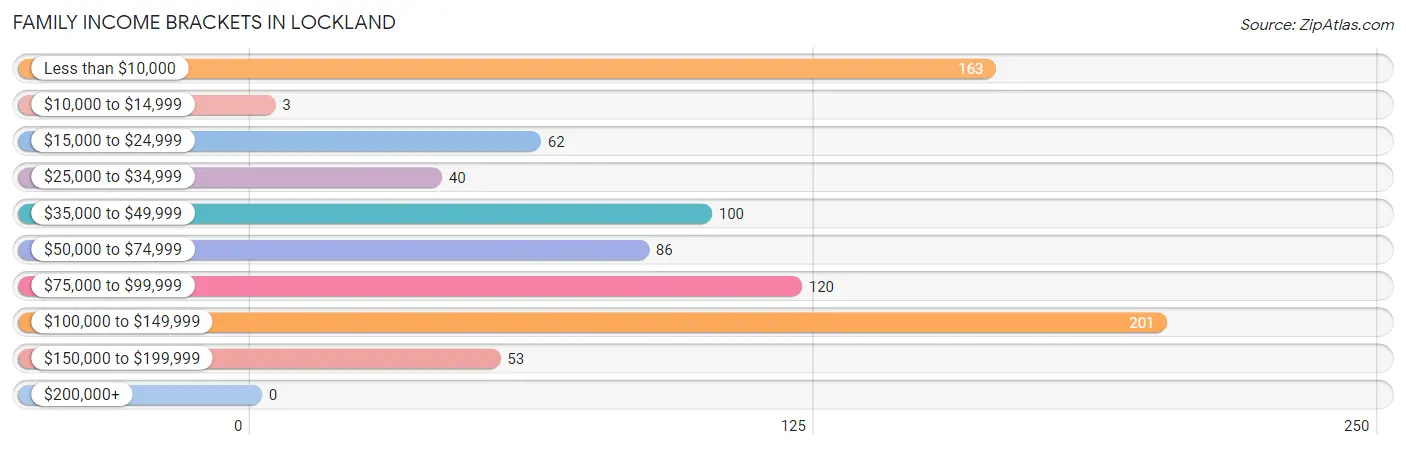
| Income Bracket | # Families | % Families |
| Less than $10,000 | 163 | 19.7% |
| $10,000 to $14,999 | 3 | 0.4% |
| $15,000 to $24,999 | 62 | 7.5% |
| $25,000 to $34,999 | 40 | 4.8% |
| $35,000 to $49,999 | 100 | 12.1% |
| $50,000 to $74,999 | 86 | 10.4% |
| $75,000 to $99,999 | 120 | 14.5% |
| $100,000 to $149,999 | 201 | 24.3% |
| $150,000 to $199,999 | 53 | 6.4% |
| $200,000+ | 0 | 0.0% |
Family Income by Famaliy Size in Lockland
2-person families (387 | 46.7%) account for the highest median family income in Lockland with $61,845 per family, while 2-person families (387 | 46.7%) have the highest median income of $30,922 per family member.
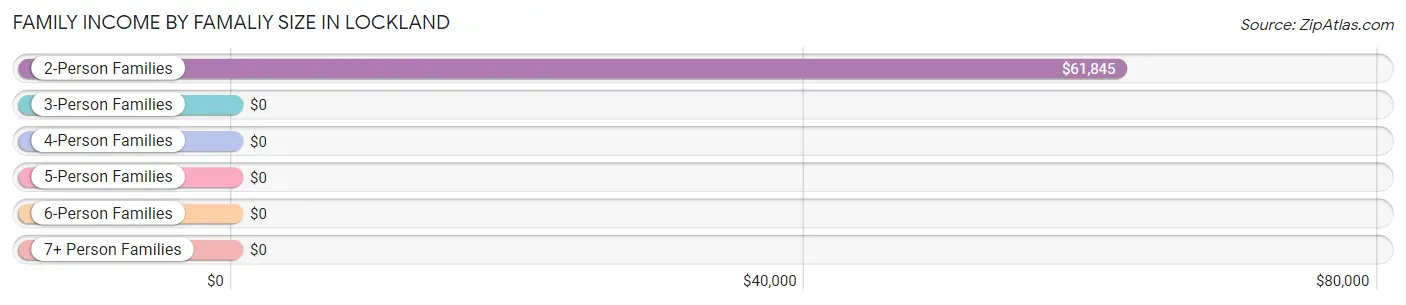
| Income Bracket | # Families | Median Income |
| 2-Person Families | 387 (46.7%) | $61,845 |
| 3-Person Families | 282 (34.1%) | $0 |
| 4-Person Families | 100 (12.1%) | $0 |
| 5-Person Families | 52 (6.3%) | $0 |
| 6-Person Families | 0 (0.0%) | $0 |
| 7+ Person Families | 7 (0.9%) | $0 |
| Total | 828 (100.0%) | $62,177 |
Family Income by Number of Earners in Lockland
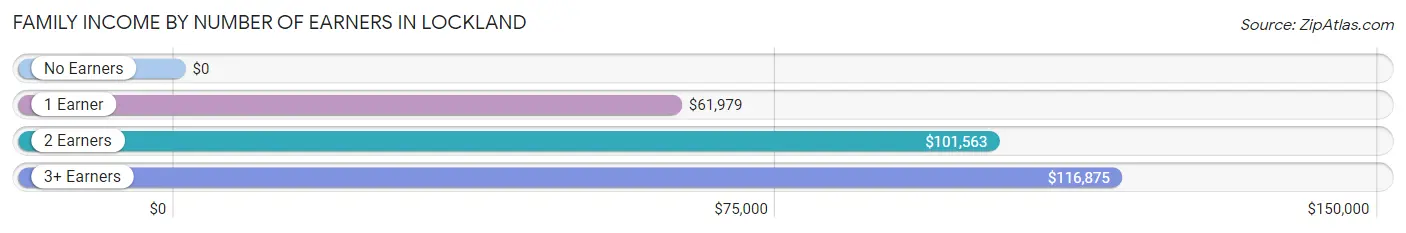
| Number of Earners | # Families | Median Income |
| No Earners | 144 (17.4%) | $0 |
| 1 Earner | 413 (49.9%) | $61,979 |
| 2 Earners | 204 (24.6%) | $101,563 |
| 3+ Earners | 67 (8.1%) | $116,875 |
| Total | 828 (100.0%) | $62,177 |
Household Income in Lockland
Household Income Brackets in Lockland
With 259 households falling in the category, the less than $10,000 income range is the most frequent in Lockland, accounting for 17.3% of all households.
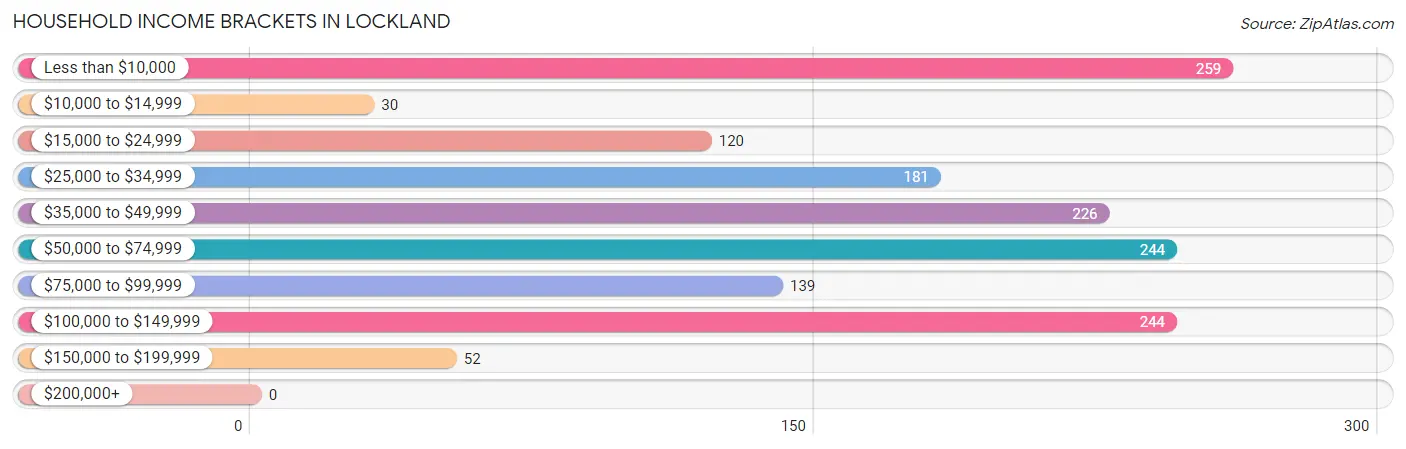
| Income Bracket | # Households | % Households |
| Less than $10,000 | 259 | 17.3% |
| $10,000 to $14,999 | 30 | 2.0% |
| $15,000 to $24,999 | 120 | 8.0% |
| $25,000 to $34,999 | 181 | 12.1% |
| $35,000 to $49,999 | 226 | 15.1% |
| $50,000 to $74,999 | 244 | 16.3% |
| $75,000 to $99,999 | 139 | 9.3% |
| $100,000 to $149,999 | 244 | 16.3% |
| $150,000 to $199,999 | 52 | 3.5% |
| $200,000+ | 0 | 0.0% |
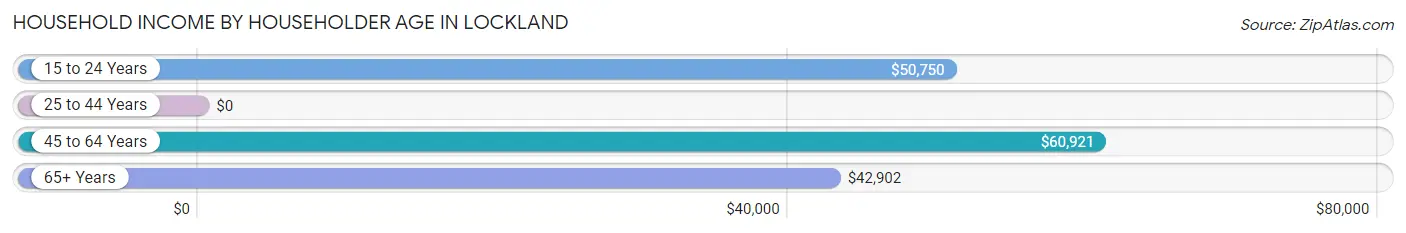
Household Income by Householder Age in Lockland
The median household income in Lockland is $44,770, with the highest median household income of $60,921 found in the 45 to 64 years age bracket for the primary householder. A total of 474 households (31.6%) fall into this category. Meanwhile, the 25 to 44 years age bracket for the primary householder has the lowest median household income of $0, with 439 households (29.3%) in this group.
| Income Bracket | # Households | Median Income |
| 15 to 24 Years | 161 (10.7%) | $50,750 |
| 25 to 44 Years | 439 (29.3%) | $0 |
| 45 to 64 Years | 474 (31.6%) | $60,921 |
| 65+ Years | 425 (28.3%) | $42,902 |
| Total | 1,499 (100.0%) | $44,770 |
Poverty in Lockland
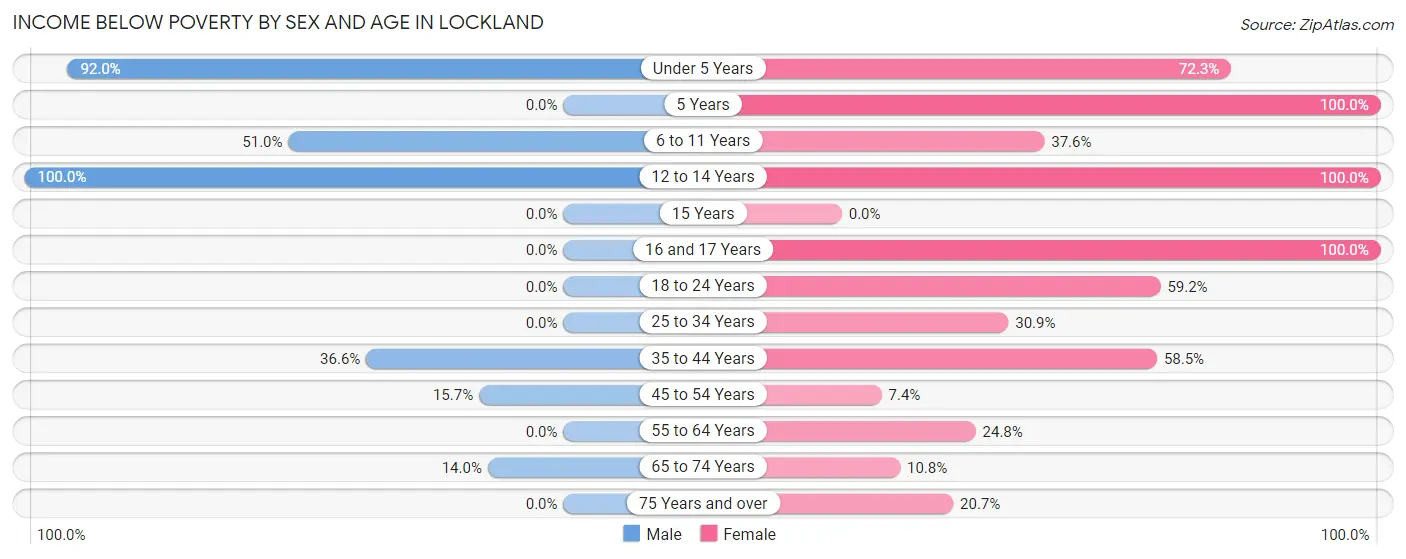
Income Below Poverty by Sex and Age in Lockland
With 18.2% poverty level for males and 38.1% for females among the residents of Lockland, 12 to 14 year old males and 5 year old females are the most vulnerable to poverty, with 23 males (100.0%) and 22 females (100.0%) in their respective age groups living below the poverty level.
| Age Bracket | Male | Female |
| Under 5 Years | 104 (92.0%) | 99 (72.3%) |
| 5 Years | 0 (0.0%) | 22 (100.0%) |
| 6 to 11 Years | 49 (51.0%) | 62 (37.6%) |
| 12 to 14 Years | 23 (100.0%) | 20 (100.0%) |
| 15 Years | 0 (0.0%) | 0 (0.0%) |
| 16 and 17 Years | 0 (0.0%) | 17 (100.0%) |
| 18 to 24 Years | 0 (0.0%) | 223 (59.2%) |
| 25 to 34 Years | 0 (0.0%) | 51 (30.9%) |
| 35 to 44 Years | 71 (36.6%) | 86 (58.5%) |
| 45 to 54 Years | 13 (15.7%) | 13 (7.4%) |
| 55 to 64 Years | 0 (0.0%) | 80 (24.8%) |
| 65 to 74 Years | 24 (14.0%) | 16 (10.8%) |
| 75 Years and over | 0 (0.0%) | 50 (20.7%) |
| Total | 284 (18.2%) | 739 (38.1%) |
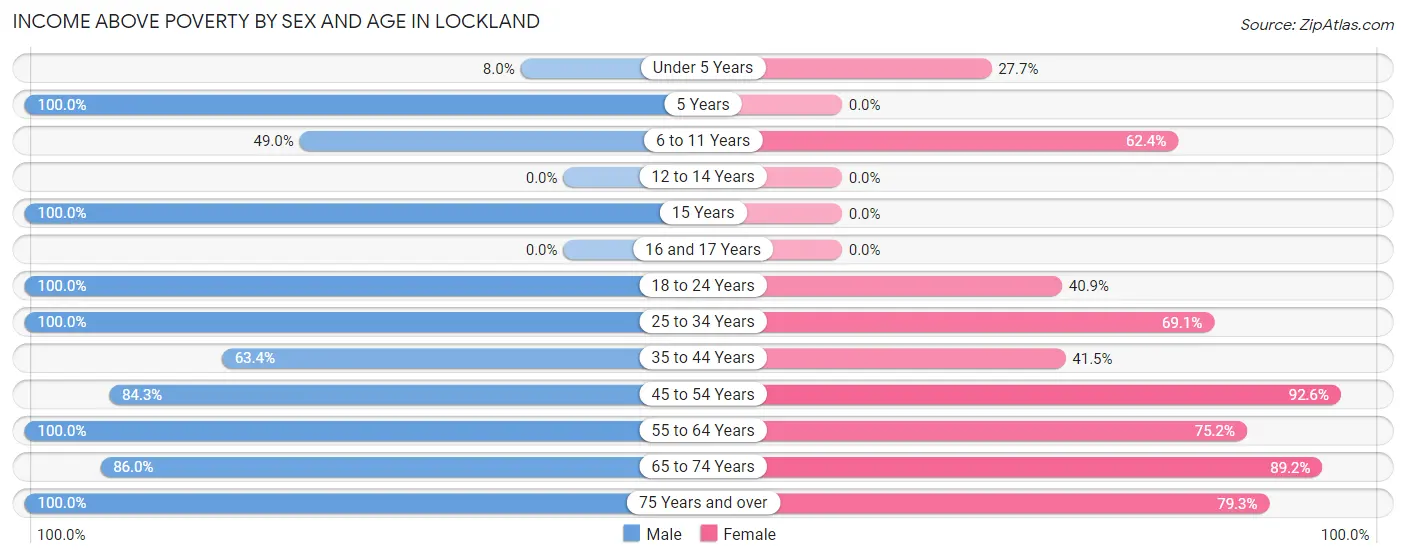
Income Above Poverty by Sex and Age in Lockland
According to the poverty statistics in Lockland, males aged 5 years and females aged 45 to 54 years are the age groups that are most secure financially, with 100.0% of males and 92.6% of females in these age groups living above the poverty line.
| Age Bracket | Male | Female |
| Under 5 Years | 9 (8.0%) | 38 (27.7%) |
| 5 Years | 10 (100.0%) | 0 (0.0%) |
| 6 to 11 Years | 47 (49.0%) | 103 (62.4%) |
| 12 to 14 Years | 0 (0.0%) | 0 (0.0%) |
| 15 Years | 10 (100.0%) | 0 (0.0%) |
| 16 and 17 Years | 0 (0.0%) | 0 (0.0%) |
| 18 to 24 Years | 189 (100.0%) | 154 (40.8%) |
| 25 to 34 Years | 132 (100.0%) | 114 (69.1%) |
| 35 to 44 Years | 123 (63.4%) | 61 (41.5%) |
| 45 to 54 Years | 70 (84.3%) | 163 (92.6%) |
| 55 to 64 Years | 444 (100.0%) | 242 (75.2%) |
| 65 to 74 Years | 147 (86.0%) | 132 (89.2%) |
| 75 Years and over | 94 (100.0%) | 192 (79.3%) |
| Total | 1,275 (81.8%) | 1,199 (61.9%) |
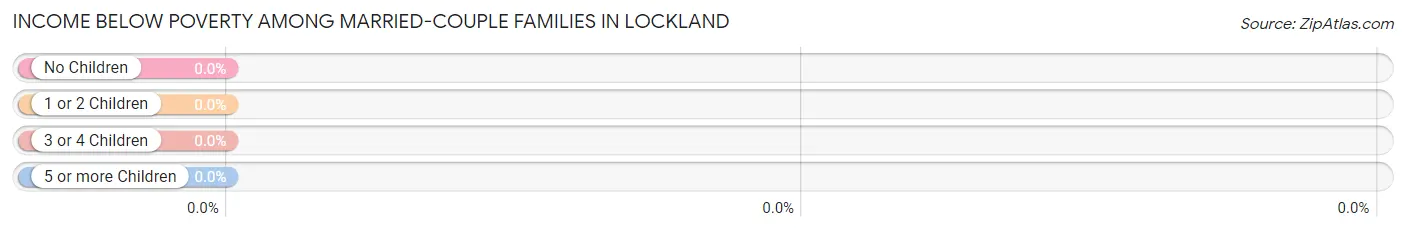
Income Below Poverty Among Married-Couple Families in Lockland
| Children | Above Poverty | Below Poverty |
| No Children | 313 (100.0%) | 0 (0.0%) |
| 1 or 2 Children | 26 (100.0%) | 0 (0.0%) |
| 3 or 4 Children | 19 (100.0%) | 0 (0.0%) |
| 5 or more Children | 0 (0.0%) | 0 (0.0%) |
| Total | 358 (100.0%) | 0 (0.0%) |
Income Below Poverty Among Single-Parent Households in Lockland
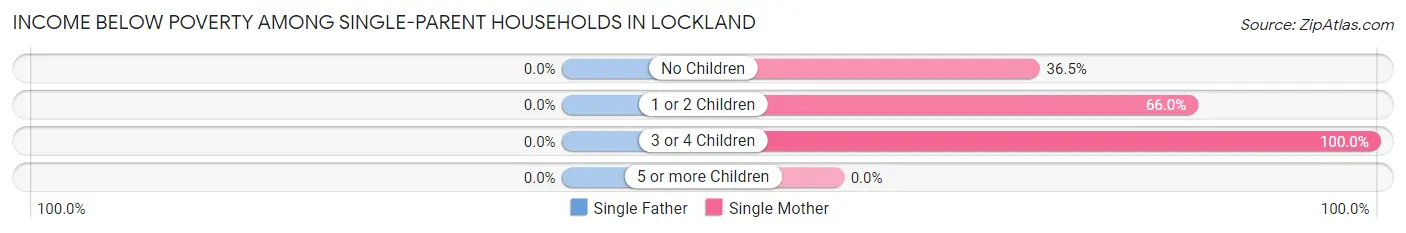
| Children | Single Father | Single Mother |
| No Children | 0 (0.0%) | 50 (36.5%) |
| 1 or 2 Children | 0 (0.0%) | 132 (66.0%) |
| 3 or 4 Children | 0 (0.0%) | 50 (100.0%) |
| 5 or more Children | 0 (0.0%) | 0 (0.0%) |
| Total | 0 (0.0%) | 232 (60.0%) |
Income Below Poverty Among Married-Couple vs Single-Parent Households in Lockland
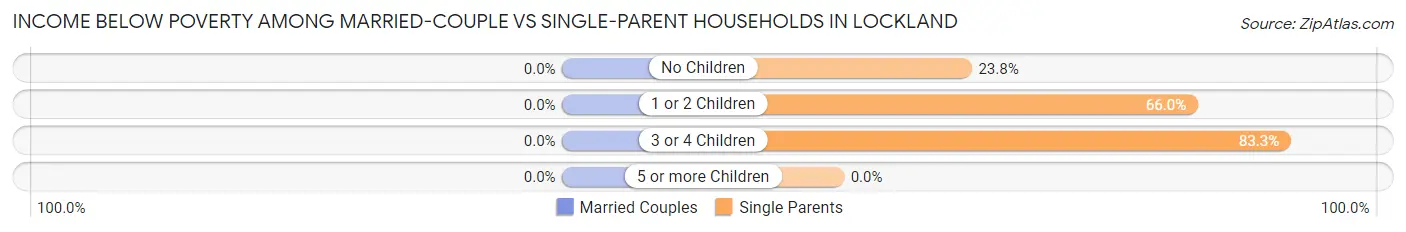
| Children | Married-Couple Families | Single-Parent Households |
| No Children | 0 (0.0%) | 50 (23.8%) |
| 1 or 2 Children | 0 (0.0%) | 132 (66.0%) |
| 3 or 4 Children | 0 (0.0%) | 50 (83.3%) |
| 5 or more Children | 0 (0.0%) | 0 (0.0%) |
| Total | 0 (0.0%) | 232 (49.4%) |
Race in Lockland
The most populous races in Lockland are White / Caucasian (2,143 | 61.3%), Black / African American (1,227 | 35.1%), and Two or more Races (50 | 1.4%).
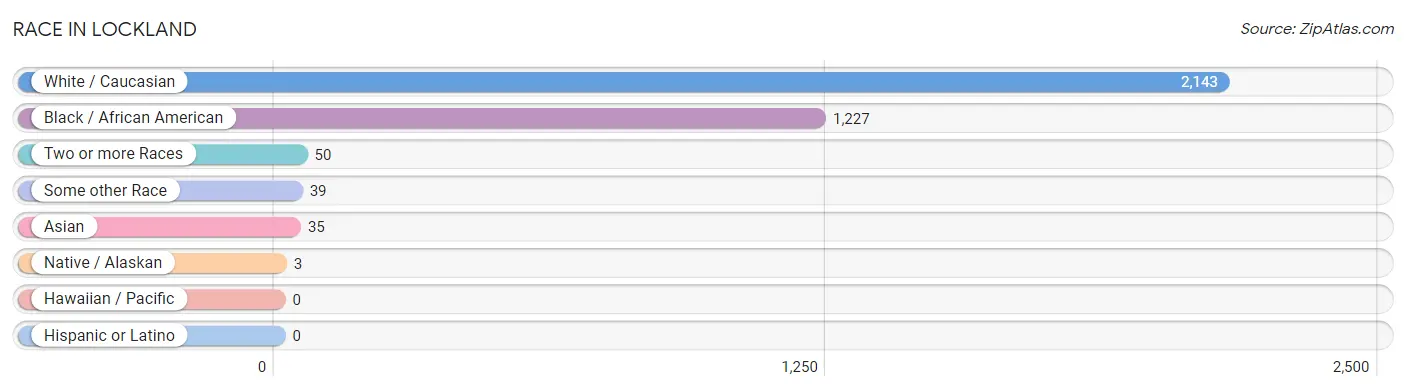
| Race | # Population | % Population |
| Asian | 35 | 1.0% |
| Black / African American | 1,227 | 35.1% |
| Hawaiian / Pacific | 0 | 0.0% |
| Hispanic or Latino | 0 | 0.0% |
| Native / Alaskan | 3 | 0.1% |
| White / Caucasian | 2,143 | 61.3% |
| Two or more Races | 50 | 1.4% |
| Some other Race | 39 | 1.1% |
| Total | 3,497 | 100.0% |
Ancestry in Lockland
The most populous ancestries reported in Lockland are German (488 | 14.0%), English (336 | 9.6%), Irish (281 | 8.0%), Swiss (233 | 6.7%), and Subsaharan African (222 | 6.4%), together accounting for 44.6% of all Lockland residents.
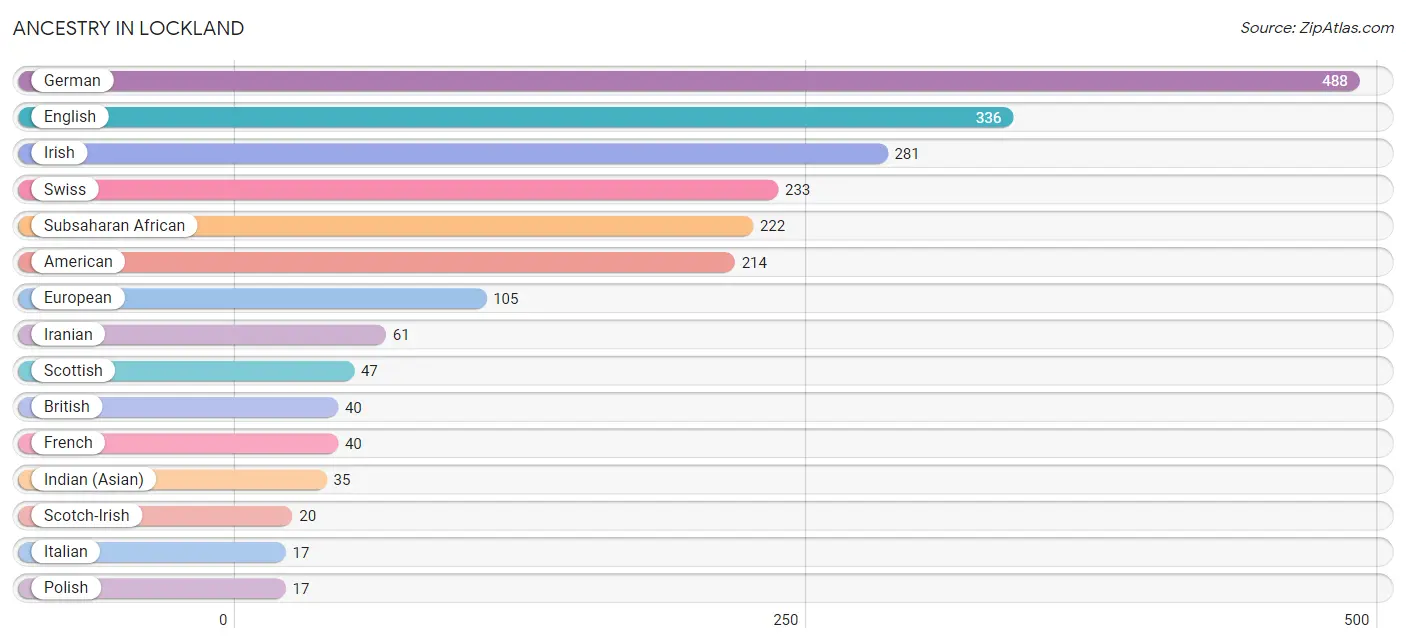
| Ancestry | # Population | % Population |
| African | 8 | 0.2% |
| American | 214 | 6.1% |
| British | 40 | 1.1% |
| Czech | 7 | 0.2% |
| English | 336 | 9.6% |
| European | 105 | 3.0% |
| French | 40 | 1.1% |
| German | 488 | 14.0% |
| Greek | 8 | 0.2% |
| Indian (Asian) | 35 | 1.0% |
| Iranian | 61 | 1.7% |
| Irish | 281 | 8.0% |
| Italian | 17 | 0.5% |
| Lumbee | 3 | 0.1% |
| Norwegian | 6 | 0.2% |
| Polish | 17 | 0.5% |
| Scandinavian | 8 | 0.2% |
| Scotch-Irish | 20 | 0.6% |
| Scottish | 47 | 1.3% |
| Subsaharan African | 222 | 6.4% |
| Swiss | 233 | 6.7% | View All 21 Rows |
Immigrants in Lockland
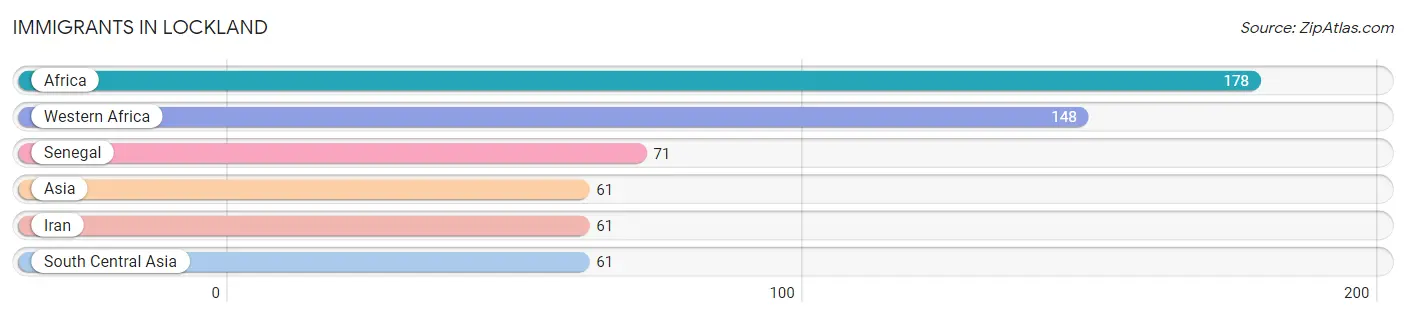
The most numerous immigrant groups reported in Lockland came from Africa (178 | 5.1%), Western Africa (148 | 4.2%), Senegal (71 | 2.0%), Asia (61 | 1.7%), and Iran (61 | 1.7%), together accounting for 14.8% of all Lockland residents.
| Immigration Origin | # Population | % Population |
| Africa | 178 | 5.1% |
| Asia | 61 | 1.7% |
| Iran | 61 | 1.7% |
| Senegal | 71 | 2.0% |
| South Central Asia | 61 | 1.7% |
| Western Africa | 148 | 4.2% | View All 6 Rows |
Sex and Age in Lockland
Sex and Age in Lockland
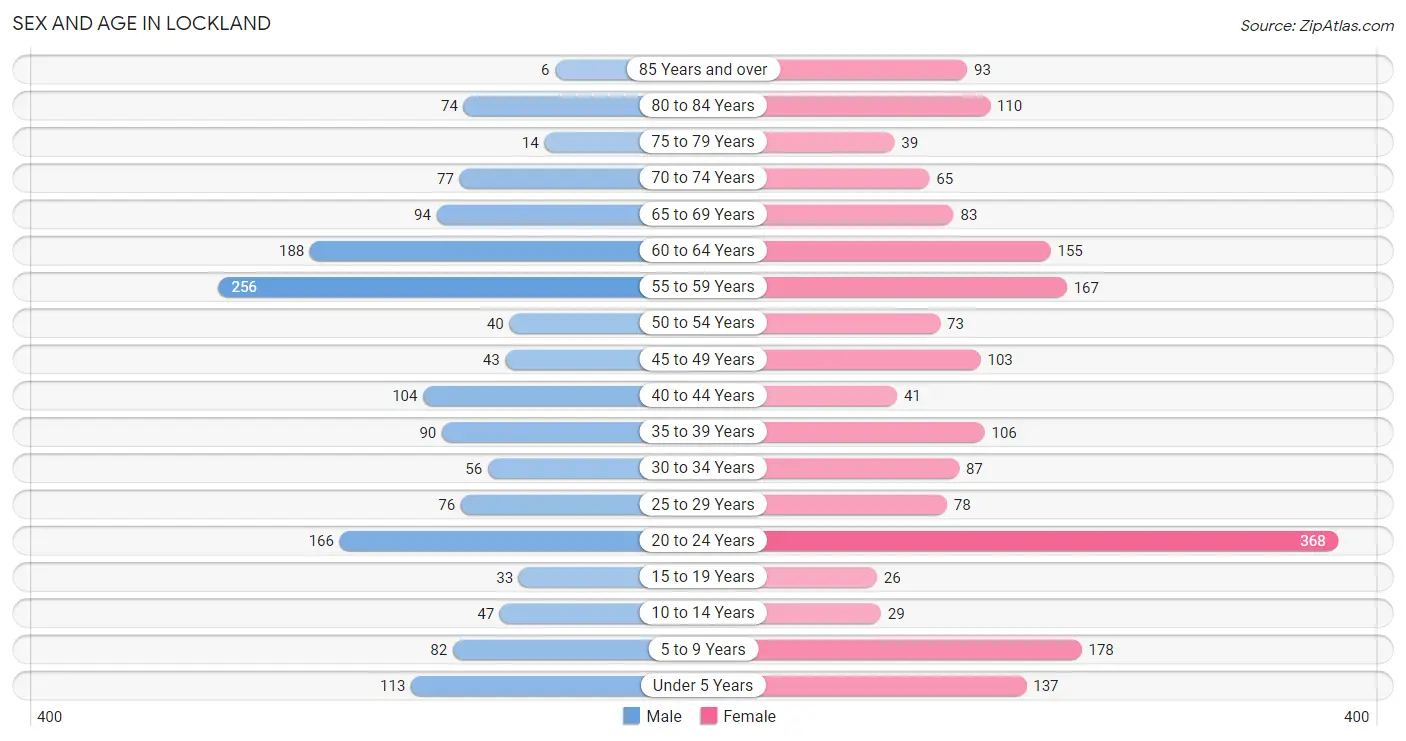
The most populous age groups in Lockland are 55 to 59 Years (256 | 16.4%) for men and 20 to 24 Years (368 | 19.0%) for women.
| Age Bracket | Male | Female |
| Under 5 Years | 113 (7.2%) | 137 (7.1%) |
| 5 to 9 Years | 82 (5.3%) | 178 (9.2%) |
| 10 to 14 Years | 47 (3.0%) | 29 (1.5%) |
| 15 to 19 Years | 33 (2.1%) | 26 (1.3%) |
| 20 to 24 Years | 166 (10.6%) | 368 (19.0%) |
| 25 to 29 Years | 76 (4.9%) | 78 (4.0%) |
| 30 to 34 Years | 56 (3.6%) | 87 (4.5%) |
| 35 to 39 Years | 90 (5.8%) | 106 (5.5%) |
| 40 to 44 Years | 104 (6.7%) | 41 (2.1%) |
| 45 to 49 Years | 43 (2.8%) | 103 (5.3%) |
| 50 to 54 Years | 40 (2.6%) | 73 (3.8%) |
| 55 to 59 Years | 256 (16.4%) | 167 (8.6%) |
| 60 to 64 Years | 188 (12.1%) | 155 (8.0%) |
| 65 to 69 Years | 94 (6.0%) | 83 (4.3%) |
| 70 to 74 Years | 77 (4.9%) | 65 (3.4%) |
| 75 to 79 Years | 14 (0.9%) | 39 (2.0%) |
| 80 to 84 Years | 74 (4.8%) | 110 (5.7%) |
| 85 Years and over | 6 (0.4%) | 93 (4.8%) |
| Total | 1,559 (100.0%) | 1,938 (100.0%) |
Families and Households in Lockland
Median Family Size in Lockland
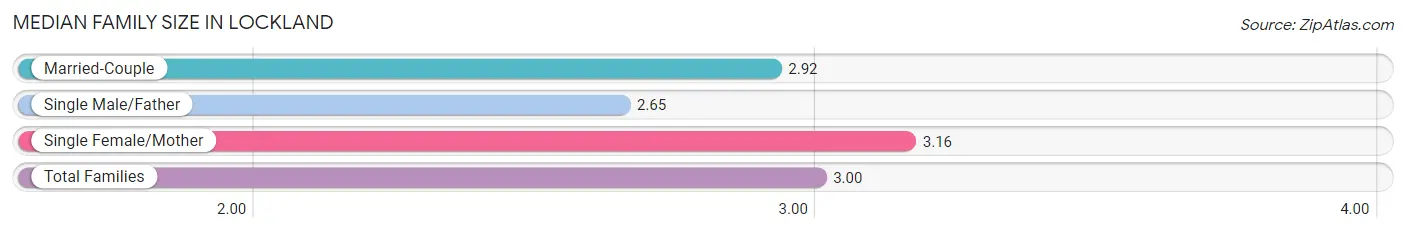
The median family size in Lockland is 3.00 persons per family, with single female/mother families (387 | 46.7%) accounting for the largest median family size of 3.16 persons per family. On the other hand, single male/father families (83 | 10.0%) represent the smallest median family size with 2.65 persons per family.
| Family Type | # Families | Family Size |
| Married-Couple | 358 (43.2%) | 2.92 |
| Single Male/Father | 83 (10.0%) | 2.65 |
| Single Female/Mother | 387 (46.7%) | 3.16 |
| Total Families | 828 (100.0%) | 3.00 |
Median Household Size in Lockland
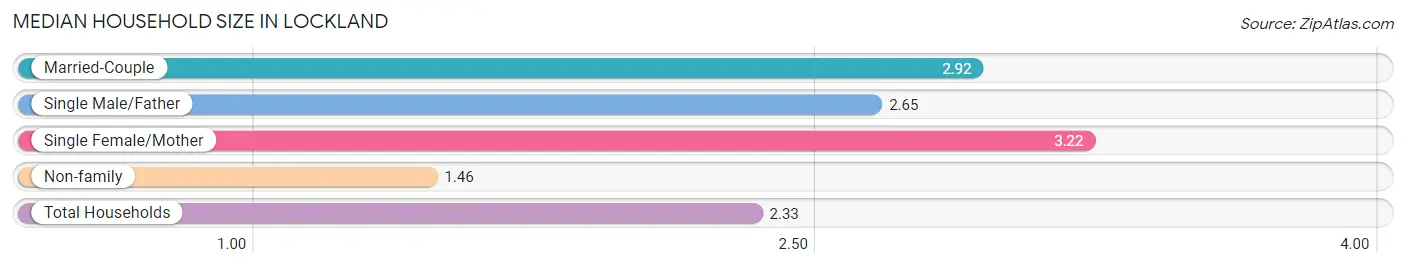
The median household size in Lockland is 2.33 persons per household, with single female/mother households (387 | 25.8%) accounting for the largest median household size of 3.22 persons per household. non-family households (671 | 44.8%) represent the smallest median household size with 1.46 persons per household.
| Household Type | # Households | Household Size |
| Married-Couple | 358 (23.9%) | 2.92 |
| Single Male/Father | 83 (5.5%) | 2.65 |
| Single Female/Mother | 387 (25.8%) | 3.22 |
| Non-family | 671 (44.8%) | 1.46 |
| Total Households | 1,499 (100.0%) | 2.33 |
Household Size by Marriage Status in Lockland
Out of a total of 1,499 households in Lockland, 828 (55.2%) are family households, while 671 (44.8%) are nonfamily households. The most numerous type of family households are 2-person households, comprising 387, and the most common type of nonfamily households are 1-person households, comprising 542.
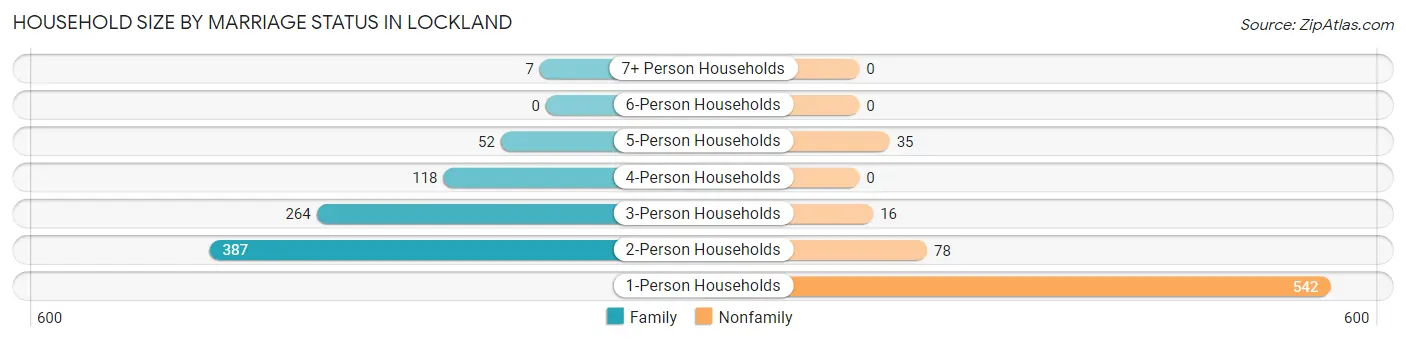
| Household Size | Family Households | Nonfamily Households |
| 1-Person Households | - | 542 (36.2%) |
| 2-Person Households | 387 (25.8%) | 78 (5.2%) |
| 3-Person Households | 264 (17.6%) | 16 (1.1%) |
| 4-Person Households | 118 (7.9%) | 0 (0.0%) |
| 5-Person Households | 52 (3.5%) | 35 (2.3%) |
| 6-Person Households | 0 (0.0%) | 0 (0.0%) |
| 7+ Person Households | 7 (0.5%) | 0 (0.0%) |
| Total | 828 (55.2%) | 671 (44.8%) |
Female Fertility in Lockland
Fertility by Age in Lockland
Average fertility rate in Lockland is 97.0 births per 1,000 women. Women in the age bracket of 35 to 50 years have the highest fertility rate with 263.0 births per 1,000 women. Women in the age bracket of 35 to 50 years acount for 86.1% of all women with births.
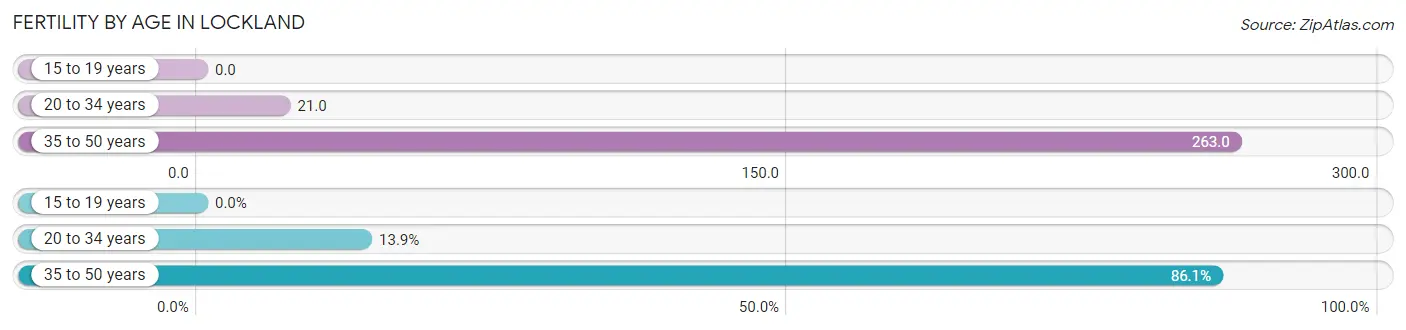
| Age Bracket | Women with Births | Births / 1,000 Women |
| 15 to 19 years | 0 (0.0%) | 0.0 |
| 20 to 34 years | 11 (13.9%) | 21.0 |
| 35 to 50 years | 68 (86.1%) | 263.0 |
| Total | 79 (100.0%) | 97.0 |
Fertility by Age by Marriage Status in Lockland
13.9% of women with births (79) in Lockland are married. The highest percentage of unmarried women with births falls into 35 to 50 years age bracket with 100.0% of them unmarried at the time of birth, while the lowest percentage of unmarried women with births belong to 20 to 34 years age bracket with 0.0% of them unmarried.
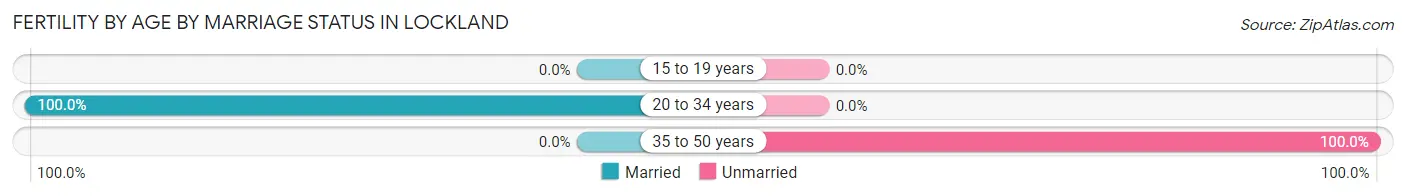
| Age Bracket | Married | Unmarried |
| 15 to 19 years | 0 (0.0%) | 0 (0.0%) |
| 20 to 34 years | 11 (100.0%) | 0 (0.0%) |
| 35 to 50 years | 0 (0.0%) | 68 (100.0%) |
| Total | 11 (13.9%) | 68 (86.1%) |
Fertility by Education in Lockland
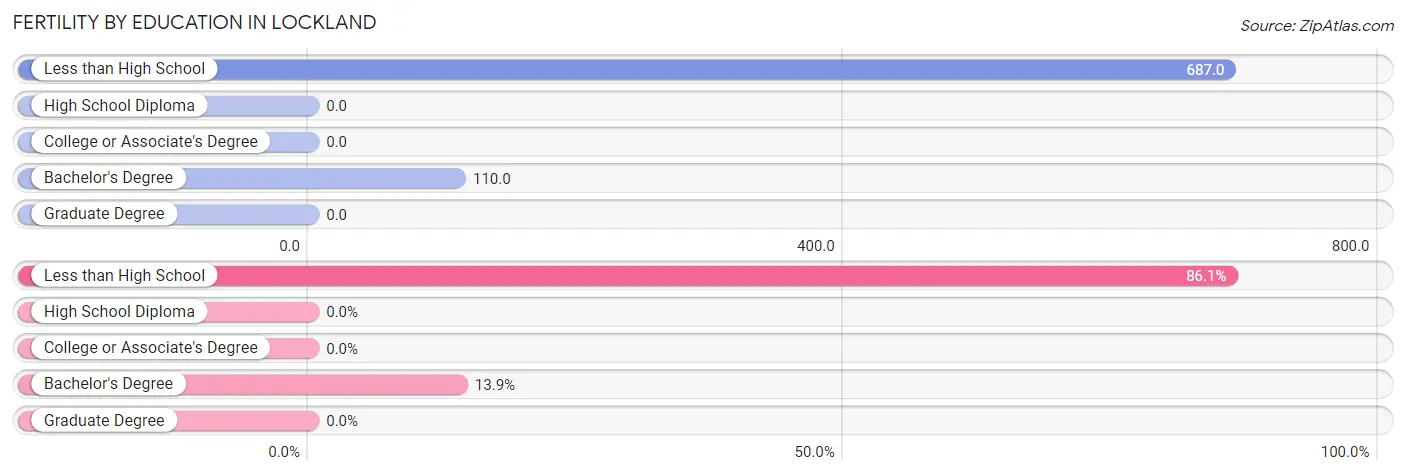
| Educational Attainment | Women with Births | Births / 1,000 Women |
| Less than High School | 68 (86.1%) | 687.0 |
| High School Diploma | 0 (0.0%) | 0.0 |
| College or Associate's Degree | 0 (0.0%) | 0.0 |
| Bachelor's Degree | 11 (13.9%) | 110.0 |
| Graduate Degree | 0 (0.0%) | 0.0 |
| Total | 79 (100.0%) | 97.0 |
Fertility by Education by Marriage Status in Lockland
86.1% of women with births in Lockland are unmarried. Women with the educational attainment of bachelor's degree are most likely to be married with 100.0% of them married at childbirth, while women with the educational attainment of less than high school are least likely to be married with 100.0% of them unmarried at childbirth.
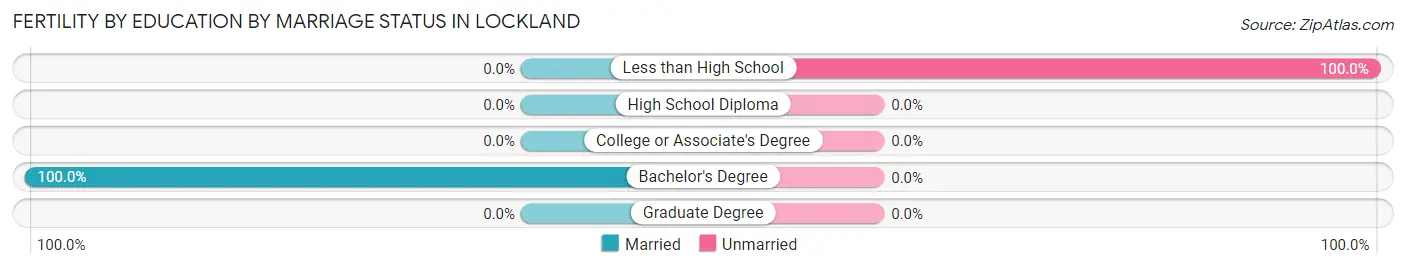
| Educational Attainment | Married | Unmarried |
| Less than High School | 0 (0.0%) | 68 (100.0%) |
| High School Diploma | 0 (0.0%) | 0 (0.0%) |
| College or Associate's Degree | 0 (0.0%) | 0 (0.0%) |
| Bachelor's Degree | 11 (100.0%) | 0 (0.0%) |
| Graduate Degree | 0 (0.0%) | 0 (0.0%) |
| Total | 11 (13.9%) | 68 (86.1%) |
Employment Characteristics in Lockland
Employment by Class of Employer in Lockland
Among the 1,784 employed individuals in Lockland, private company employees (1,276 | 71.5%), local government employees (193 | 10.8%), and not-for-profit organizations (143 | 8.0%) make up the most common classes of employment.
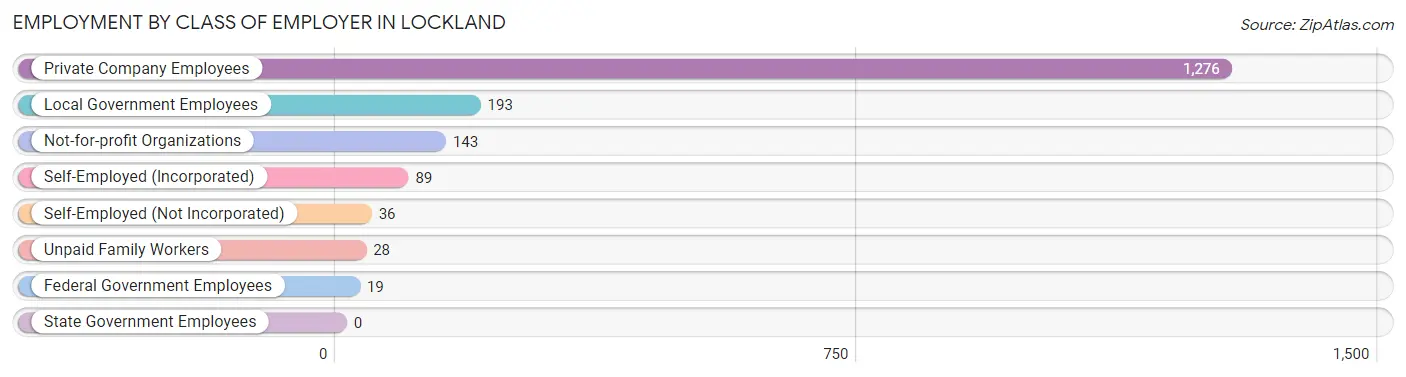
| Employer Class | # Employees | % Employees |
| Private Company Employees | 1,276 | 71.5% |
| Self-Employed (Incorporated) | 89 | 5.0% |
| Self-Employed (Not Incorporated) | 36 | 2.0% |
| Not-for-profit Organizations | 143 | 8.0% |
| Local Government Employees | 193 | 10.8% |
| State Government Employees | 0 | 0.0% |
| Federal Government Employees | 19 | 1.1% |
| Unpaid Family Workers | 28 | 1.6% |
| Total | 1,784 | 100.0% |
Employment Status by Age in Lockland
According to the labor force statistics for Lockland, out of the total population over 16 years of age (2,901), 66.8% or 1,938 individuals are in the labor force, with 7.3% or 141 of them unemployed. The age group with the highest labor force participation rate is 25 to 29 years, with 100.0% or 154 individuals in the labor force. Within the labor force, the 16 to 19 years age range has the highest percentage of unemployed individuals, with 68.8% or 22 of them being unemployed.
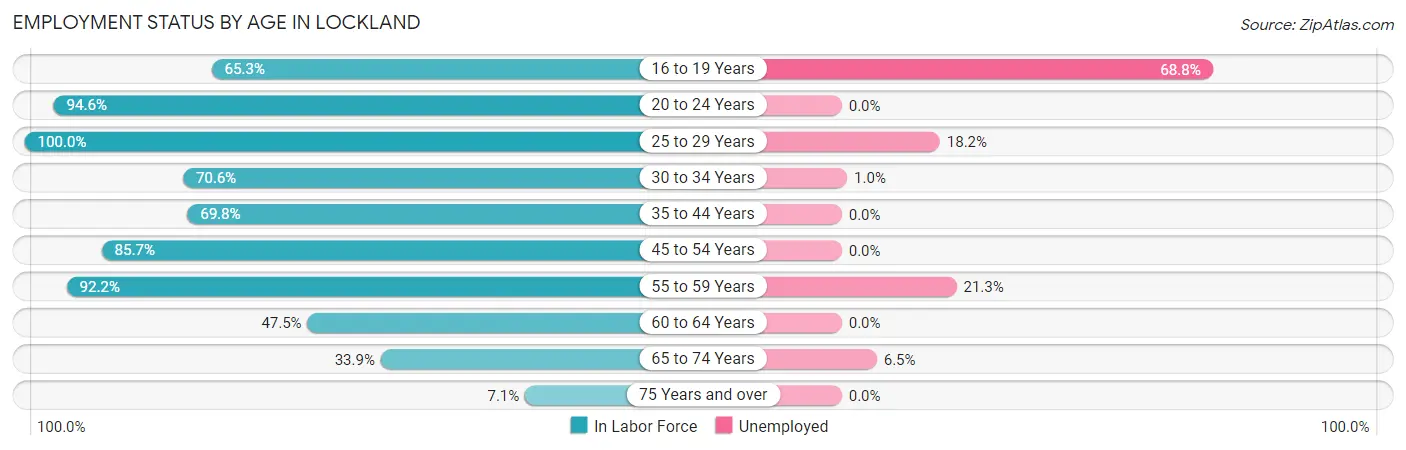
| Age Bracket | In Labor Force | Unemployed |
| 16 to 19 Years | 32 (65.3%) | 22 (68.8%) |
| 20 to 24 Years | 505 (94.6%) | 0 (0.0%) |
| 25 to 29 Years | 154 (100.0%) | 28 (18.2%) |
| 30 to 34 Years | 101 (70.6%) | 1 (1.0%) |
| 35 to 44 Years | 238 (69.8%) | 0 (0.0%) |
| 45 to 54 Years | 222 (85.7%) | 0 (0.0%) |
| 55 to 59 Years | 390 (92.2%) | 83 (21.3%) |
| 60 to 64 Years | 163 (47.5%) | 0 (0.0%) |
| 65 to 74 Years | 108 (33.9%) | 7 (6.5%) |
| 75 Years and over | 24 (7.1%) | 0 (0.0%) |
| Total | 1,938 (66.8%) | 141 (7.3%) |
Employment Status by Educational Attainment in Lockland
According to labor force statistics for Lockland, 76.2% of individuals (1,267) out of the total population between 25 and 64 years of age (1,663) are in the labor force, with 8.8% or 111 of them being unemployed. The group with the highest labor force participation rate are those with the educational attainment of college / associate degree, with 85.8% or 338 individuals in the labor force. Within the labor force, individuals with less than high school education have the highest percentage of unemployment, with 70.9% or 39 of them being unemployed.
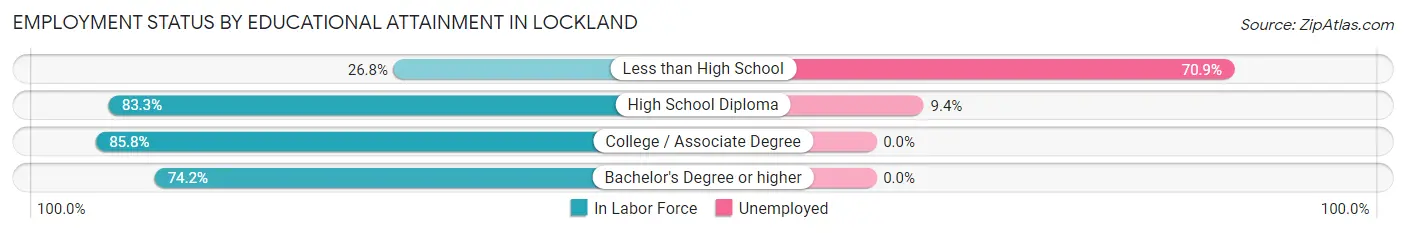
| Educational Attainment | In Labor Force | Unemployed |
| Less than High School | 55 (26.8%) | 145 (70.9%) |
| High School Diploma | 780 (83.3%) | 88 (9.4%) |
| College / Associate Degree | 338 (85.8%) | 0 (0.0%) |
| Bachelor's Degree or higher | 95 (74.2%) | 0 (0.0%) |
| Total | 1,267 (76.2%) | 146 (8.8%) |
Employment Occupations by Sex in Lockland
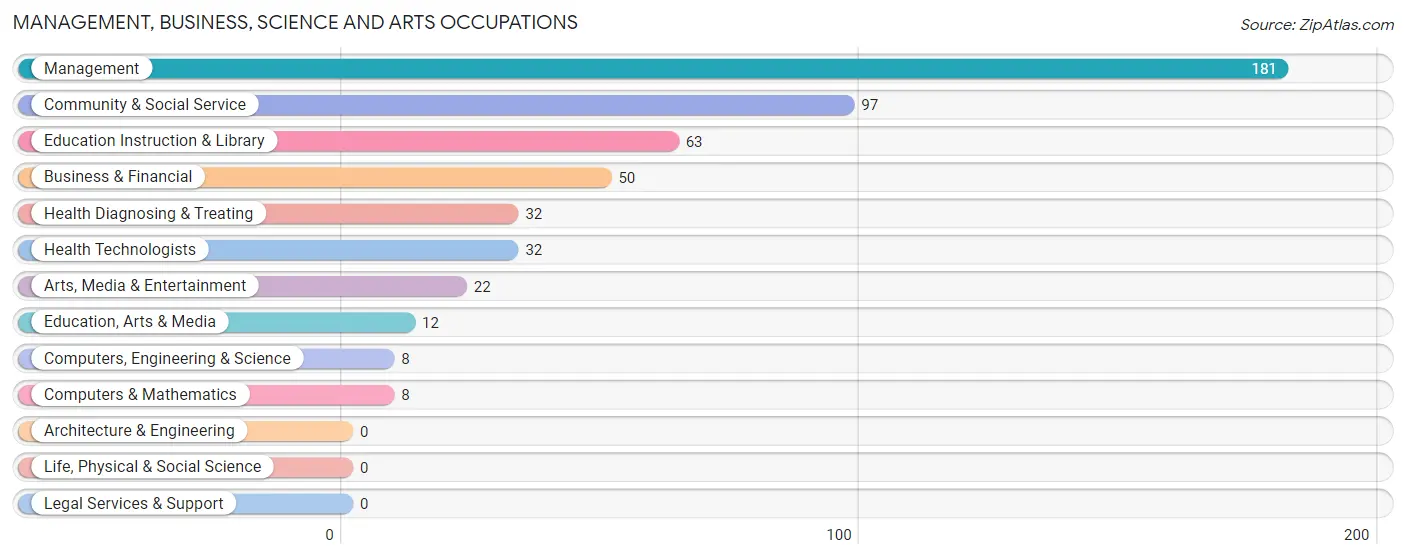
Management, Business, Science and Arts Occupations
The most common Management, Business, Science and Arts occupations in Lockland are Management (181 | 10.1%), Community & Social Service (97 | 5.4%), Education Instruction & Library (63 | 3.5%), Business & Financial (50 | 2.8%), and Health Diagnosing & Treating (32 | 1.8%).
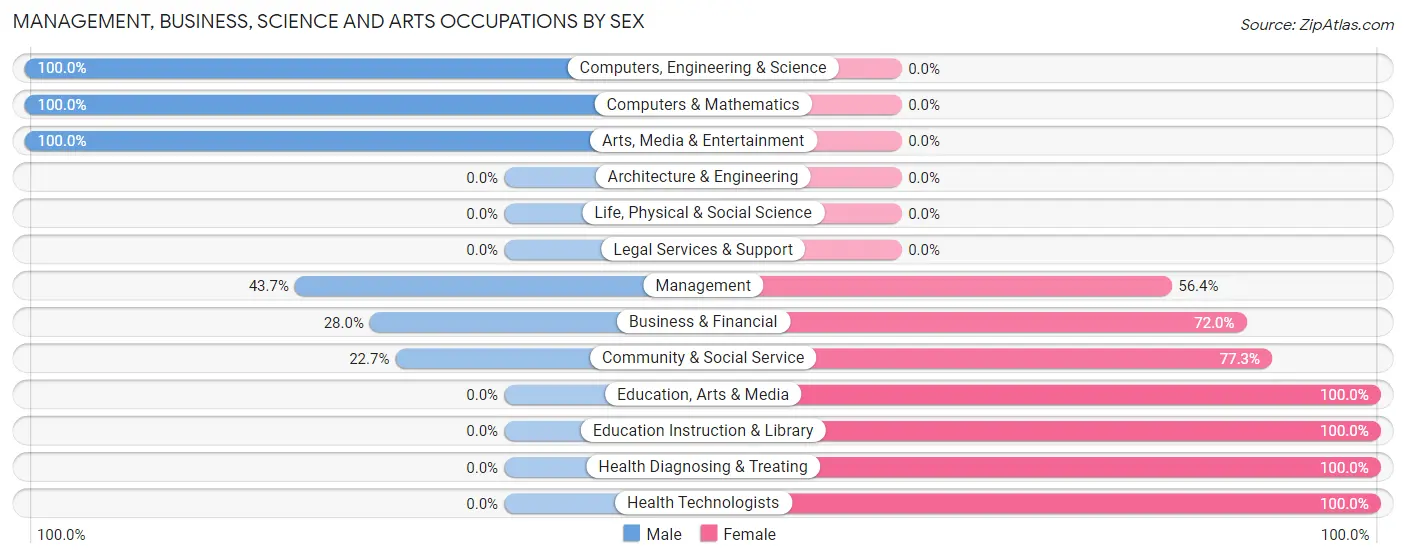
Management, Business, Science and Arts Occupations by Sex
Within the Management, Business, Science and Arts occupations in Lockland, the most male-oriented occupations are Computers, Engineering & Science (100.0%), Computers & Mathematics (100.0%), and Arts, Media & Entertainment (100.0%), while the most female-oriented occupations are Education, Arts & Media (100.0%), Education Instruction & Library (100.0%), and Health Diagnosing & Treating (100.0%).
| Occupation | Male | Female |
| Management | 79 (43.6%) | 102 (56.4%) |
| Business & Financial | 14 (28.0%) | 36 (72.0%) |
| Computers, Engineering & Science | 8 (100.0%) | 0 (0.0%) |
| Computers & Mathematics | 8 (100.0%) | 0 (0.0%) |
| Architecture & Engineering | 0 (0.0%) | 0 (0.0%) |
| Life, Physical & Social Science | 0 (0.0%) | 0 (0.0%) |
| Community & Social Service | 22 (22.7%) | 75 (77.3%) |
| Education, Arts & Media | 0 (0.0%) | 12 (100.0%) |
| Legal Services & Support | 0 (0.0%) | 0 (0.0%) |
| Education Instruction & Library | 0 (0.0%) | 63 (100.0%) |
| Arts, Media & Entertainment | 22 (100.0%) | 0 (0.0%) |
| Health Diagnosing & Treating | 0 (0.0%) | 32 (100.0%) |
| Health Technologists | 0 (0.0%) | 32 (100.0%) |
| Total (Category) | 123 (33.4%) | 245 (66.6%) |
| Total (Overall) | 925 (51.5%) | 871 (48.5%) |
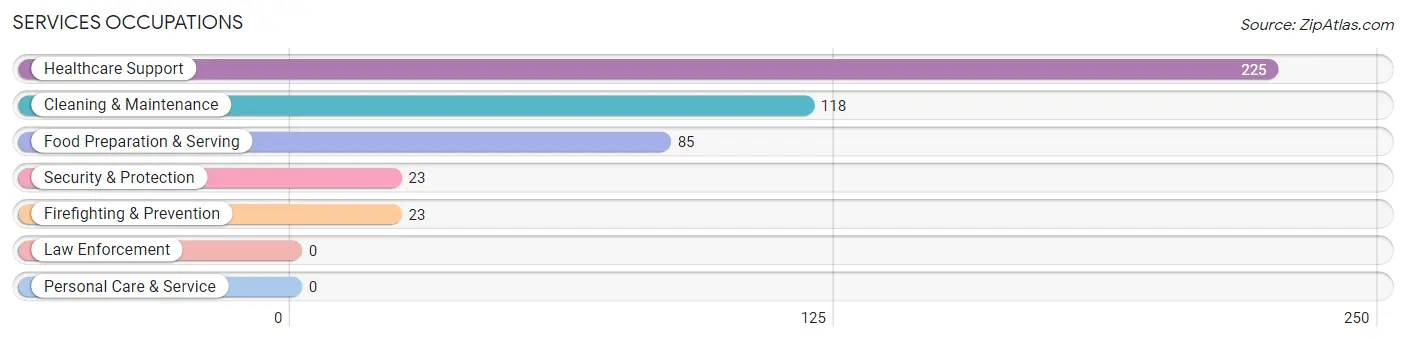
Services Occupations
The most common Services occupations in Lockland are Healthcare Support (225 | 12.5%), Cleaning & Maintenance (118 | 6.6%), Food Preparation & Serving (85 | 4.7%), Security & Protection (23 | 1.3%), and Firefighting & Prevention (23 | 1.3%).
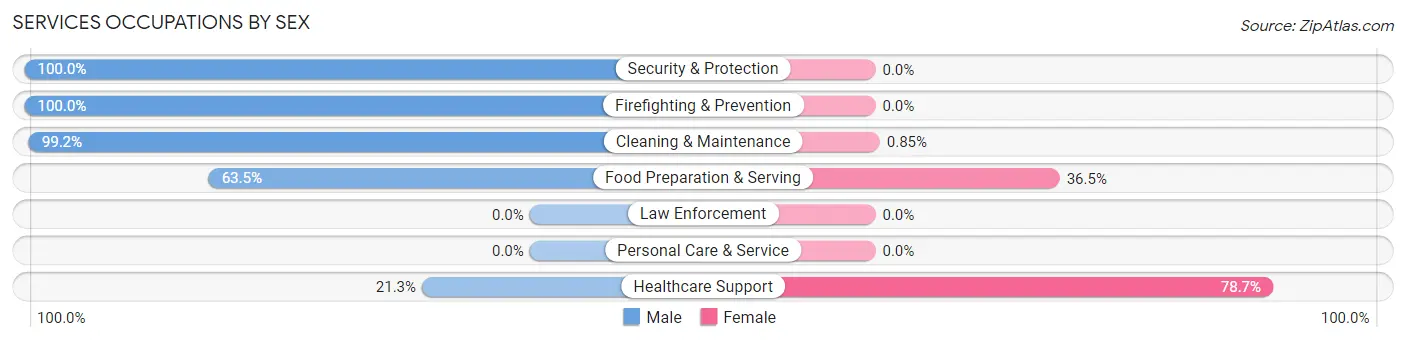
Services Occupations by Sex
Within the Services occupations in Lockland, the most male-oriented occupations are Security & Protection (100.0%), Firefighting & Prevention (100.0%), and Cleaning & Maintenance (99.2%), while the most female-oriented occupations are Healthcare Support (78.7%), Food Preparation & Serving (36.5%), and Cleaning & Maintenance (0.9%).
| Occupation | Male | Female |
| Healthcare Support | 48 (21.3%) | 177 (78.7%) |
| Security & Protection | 23 (100.0%) | 0 (0.0%) |
| Firefighting & Prevention | 23 (100.0%) | 0 (0.0%) |
| Law Enforcement | 0 (0.0%) | 0 (0.0%) |
| Food Preparation & Serving | 54 (63.5%) | 31 (36.5%) |
| Cleaning & Maintenance | 117 (99.2%) | 1 (0.9%) |
| Personal Care & Service | 0 (0.0%) | 0 (0.0%) |
| Total (Category) | 242 (53.7%) | 209 (46.3%) |
| Total (Overall) | 925 (51.5%) | 871 (48.5%) |
Sales and Office Occupations
The most common Sales and Office occupations in Lockland are Office & Administration (247 | 13.8%), and Sales & Related (106 | 5.9%).
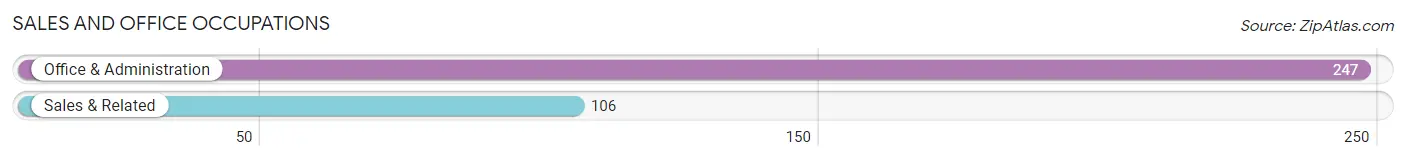
Sales and Office Occupations by Sex

| Occupation | Male | Female |
| Sales & Related | 59 (55.7%) | 47 (44.3%) |
| Office & Administration | 45 (18.2%) | 202 (81.8%) |
| Total (Category) | 104 (29.5%) | 249 (70.5%) |
| Total (Overall) | 925 (51.5%) | 871 (48.5%) |
Natural Resources, Construction and Maintenance Occupations
The most common Natural Resources, Construction and Maintenance occupations in Lockland are Construction & Extraction (74 | 4.1%), and Installation, Maintenance & Repair (28 | 1.6%).
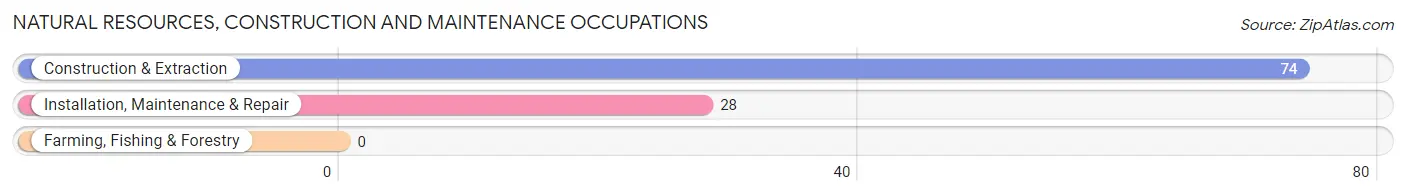
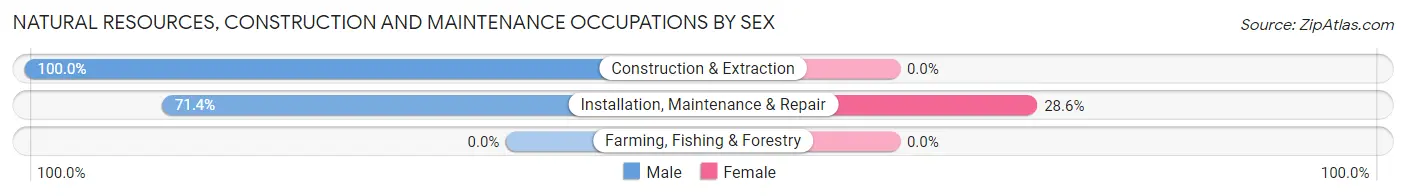
Natural Resources, Construction and Maintenance Occupations by Sex
| Occupation | Male | Female |
| Farming, Fishing & Forestry | 0 (0.0%) | 0 (0.0%) |
| Construction & Extraction | 74 (100.0%) | 0 (0.0%) |
| Installation, Maintenance & Repair | 20 (71.4%) | 8 (28.6%) |
| Total (Category) | 94 (92.2%) | 8 (7.8%) |
| Total (Overall) | 925 (51.5%) | 871 (48.5%) |
Production, Transportation and Moving Occupations
The most common Production, Transportation and Moving occupations in Lockland are Production (325 | 18.1%), Material Moving (191 | 10.6%), and Transportation (6 | 0.3%).
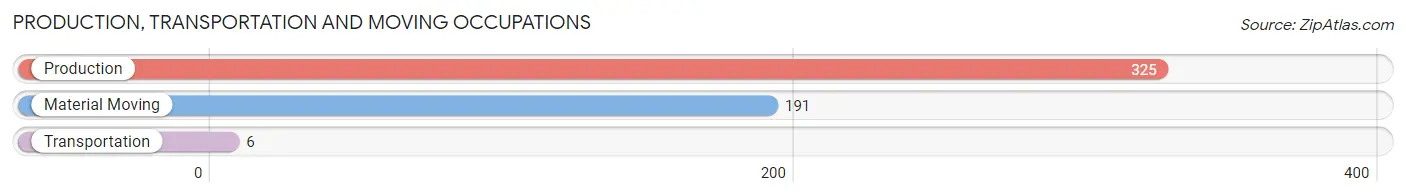
Production, Transportation and Moving Occupations by Sex
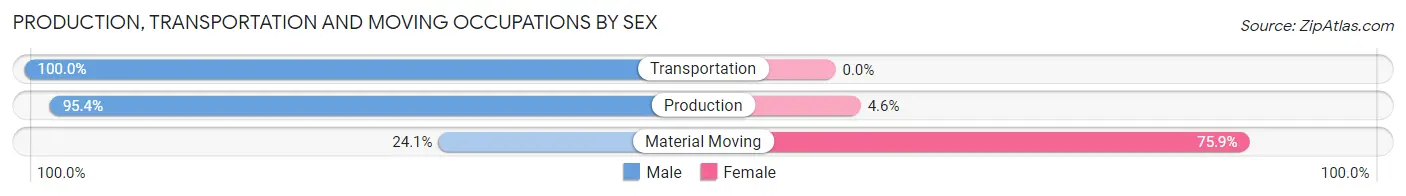
| Occupation | Male | Female |
| Production | 310 (95.4%) | 15 (4.6%) |
| Transportation | 6 (100.0%) | 0 (0.0%) |
| Material Moving | 46 (24.1%) | 145 (75.9%) |
| Total (Category) | 362 (69.4%) | 160 (30.6%) |
| Total (Overall) | 925 (51.5%) | 871 (48.5%) |
Employment Industries by Sex in Lockland
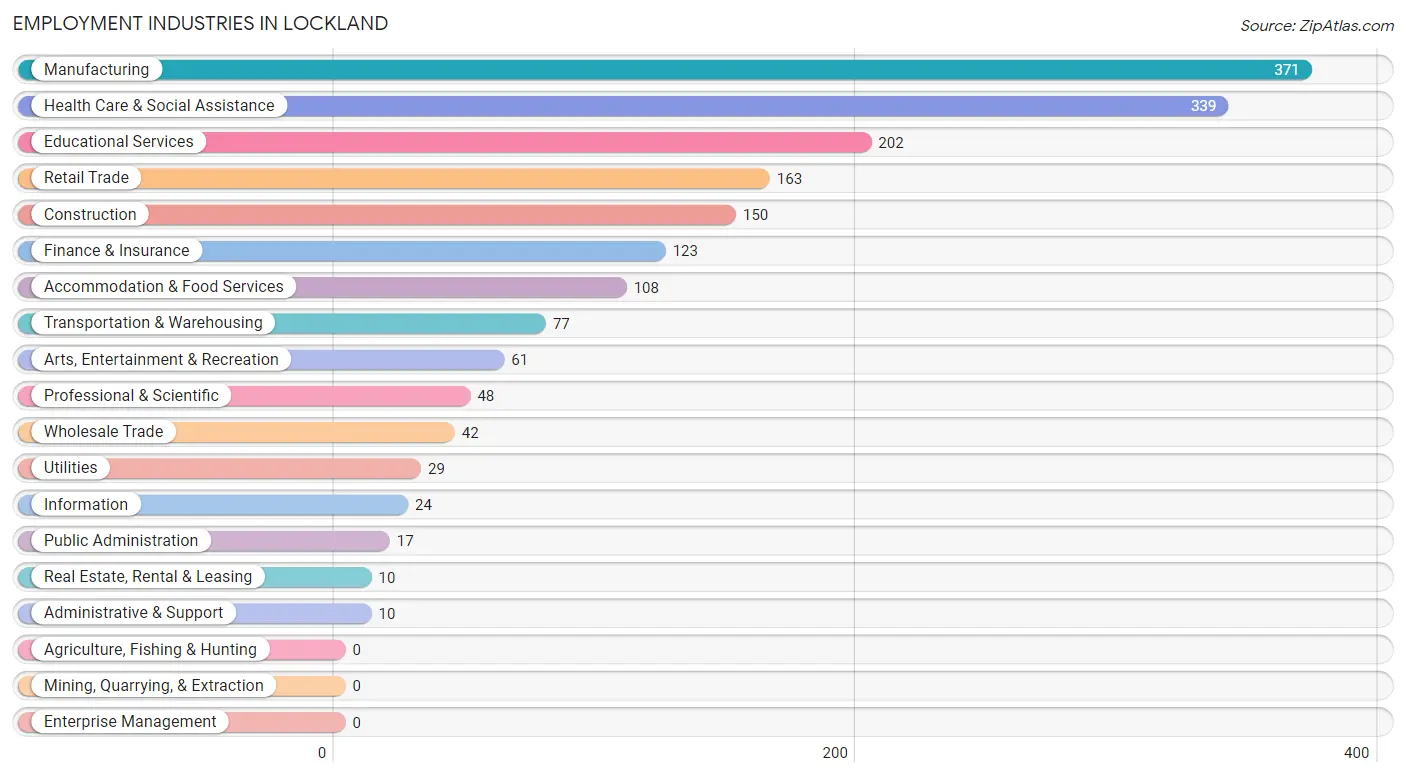
Employment Industries in Lockland
The major employment industries in Lockland include Manufacturing (371 | 20.7%), Health Care & Social Assistance (339 | 18.9%), Educational Services (202 | 11.3%), Retail Trade (163 | 9.1%), and Construction (150 | 8.4%).
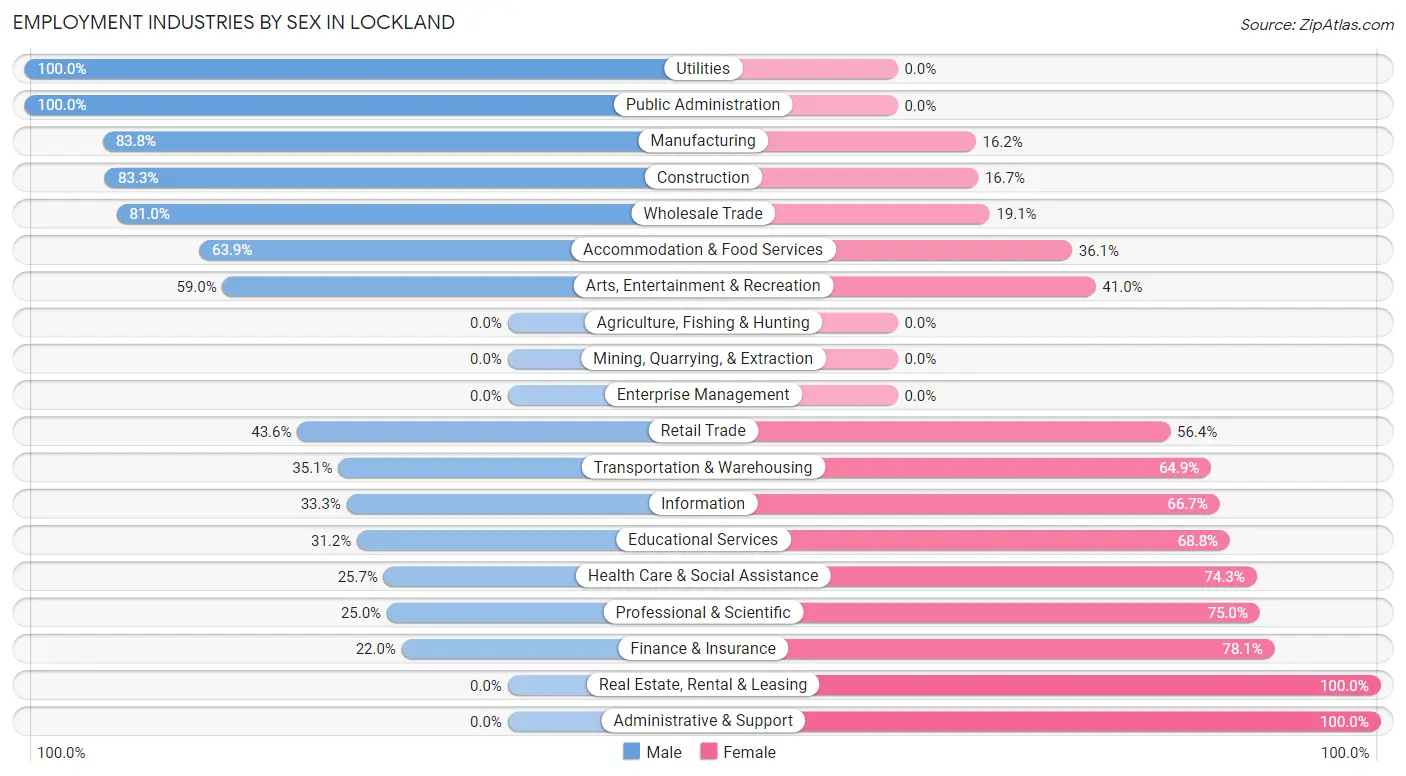
Employment Industries by Sex in Lockland
The Lockland industries that see more men than women are Utilities (100.0%), Public Administration (100.0%), and Manufacturing (83.8%), whereas the industries that tend to have a higher number of women are Real Estate, Rental & Leasing (100.0%), Administrative & Support (100.0%), and Finance & Insurance (78.0%).
| Industry | Male | Female |
| Agriculture, Fishing & Hunting | 0 (0.0%) | 0 (0.0%) |
| Mining, Quarrying, & Extraction | 0 (0.0%) | 0 (0.0%) |
| Construction | 125 (83.3%) | 25 (16.7%) |
| Manufacturing | 311 (83.8%) | 60 (16.2%) |
| Wholesale Trade | 34 (80.9%) | 8 (19.1%) |
| Retail Trade | 71 (43.6%) | 92 (56.4%) |
| Transportation & Warehousing | 27 (35.1%) | 50 (64.9%) |
| Utilities | 29 (100.0%) | 0 (0.0%) |
| Information | 8 (33.3%) | 16 (66.7%) |
| Finance & Insurance | 27 (22.0%) | 96 (78.0%) |
| Real Estate, Rental & Leasing | 0 (0.0%) | 10 (100.0%) |
| Professional & Scientific | 12 (25.0%) | 36 (75.0%) |
| Enterprise Management | 0 (0.0%) | 0 (0.0%) |
| Administrative & Support | 0 (0.0%) | 10 (100.0%) |
| Educational Services | 63 (31.2%) | 139 (68.8%) |
| Health Care & Social Assistance | 87 (25.7%) | 252 (74.3%) |
| Arts, Entertainment & Recreation | 36 (59.0%) | 25 (41.0%) |
| Accommodation & Food Services | 69 (63.9%) | 39 (36.1%) |
| Public Administration | 17 (100.0%) | 0 (0.0%) |
| Total | 925 (51.5%) | 871 (48.5%) |
Education in Lockland
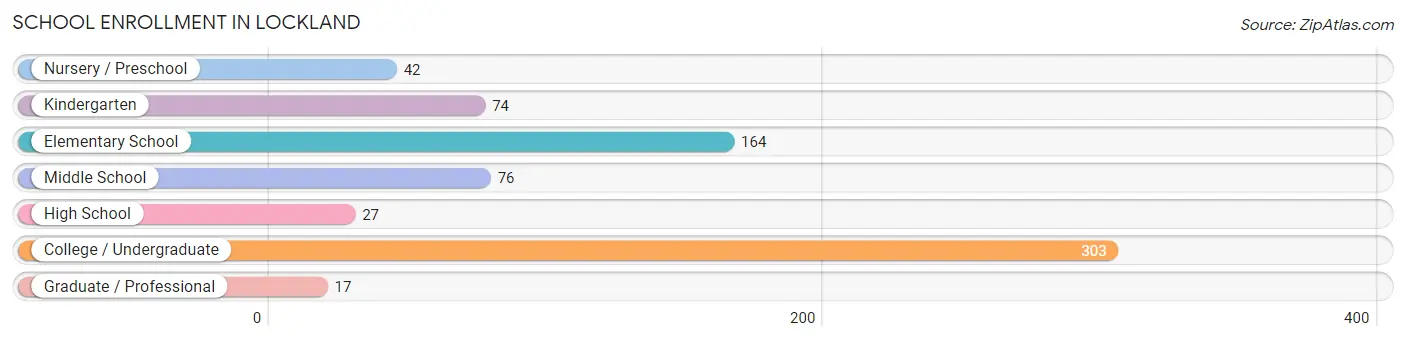
School Enrollment in Lockland
The most common levels of schooling among the 703 students in Lockland are college / undergraduate (303 | 43.1%), elementary school (164 | 23.3%), and middle school (76 | 10.8%).
| School Level | # Students | % Students |
| Nursery / Preschool | 42 | 6.0% |
| Kindergarten | 74 | 10.5% |
| Elementary School | 164 | 23.3% |
| Middle School | 76 | 10.8% |
| High School | 27 | 3.8% |
| College / Undergraduate | 303 | 43.1% |
| Graduate / Professional | 17 | 2.4% |
| Total | 703 | 100.0% |
School Enrollment by Age by Funding Source in Lockland
Out of a total of 703 students who are enrolled in schools in Lockland, 305 (43.4%) attend a private institution, while the remaining 398 (56.6%) are enrolled in public schools. The age group of 3 to 4 year olds has the highest likelihood of being enrolled in private schools, with 20 (100.0% in the age bracket) enrolled. Conversely, the age group of 15 to 17 year olds has the lowest likelihood of being enrolled in a private school, with 27 (100.0% in the age bracket) attending a public institution.
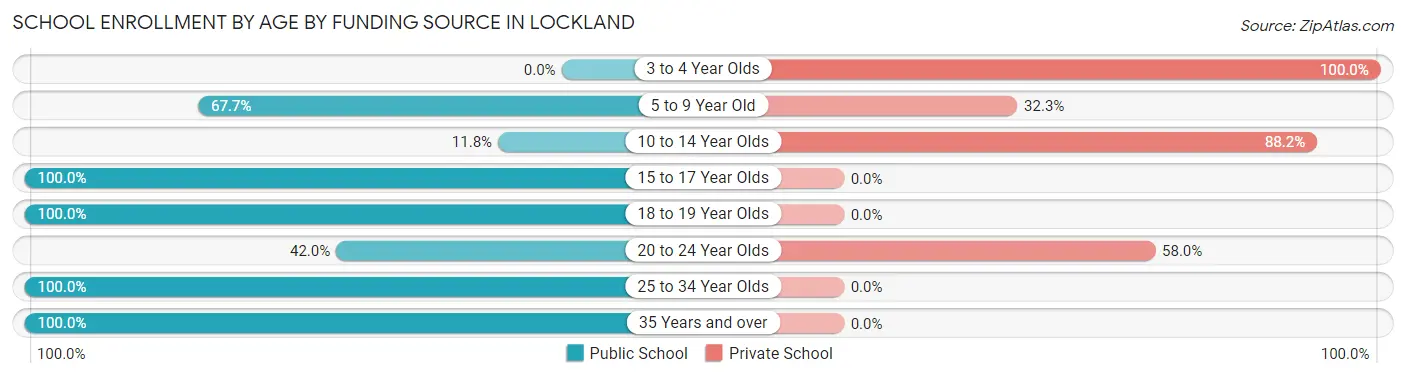
| Age Bracket | Public School | Private School |
| 3 to 4 Year Olds | 0 (0.0%) | 20 (100.0%) |
| 5 to 9 Year Old | 176 (67.7%) | 84 (32.3%) |
| 10 to 14 Year Olds | 9 (11.8%) | 67 (88.2%) |
| 15 to 17 Year Olds | 27 (100.0%) | 0 (0.0%) |
| 18 to 19 Year Olds | 19 (100.0%) | 0 (0.0%) |
| 20 to 24 Year Olds | 97 (42.0%) | 134 (58.0%) |
| 25 to 34 Year Olds | 30 (100.0%) | 0 (0.0%) |
| 35 Years and over | 40 (100.0%) | 0 (0.0%) |
| Total | 398 (56.6%) | 305 (43.4%) |
Educational Attainment by Field of Study in Lockland
Education (53 | 22.8%), social sciences (40 | 17.2%), business (38 | 16.3%), engineering (30 | 12.9%), and liberal arts & history (27 | 11.6%) are the most common fields of study among 233 individuals in Lockland who have obtained a bachelor's degree or higher.
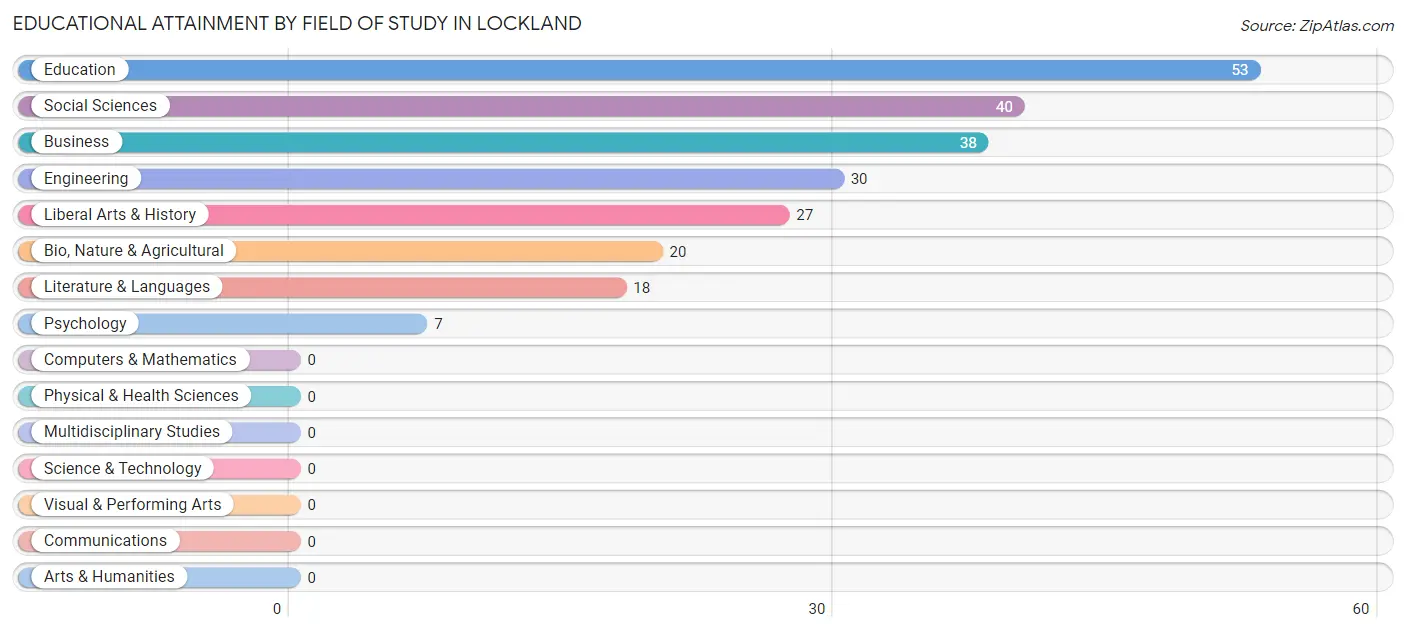
| Field of Study | # Graduates | % Graduates |
| Computers & Mathematics | 0 | 0.0% |
| Bio, Nature & Agricultural | 20 | 8.6% |
| Physical & Health Sciences | 0 | 0.0% |
| Psychology | 7 | 3.0% |
| Social Sciences | 40 | 17.2% |
| Engineering | 30 | 12.9% |
| Multidisciplinary Studies | 0 | 0.0% |
| Science & Technology | 0 | 0.0% |
| Business | 38 | 16.3% |
| Education | 53 | 22.8% |
| Literature & Languages | 18 | 7.7% |
| Liberal Arts & History | 27 | 11.6% |
| Visual & Performing Arts | 0 | 0.0% |
| Communications | 0 | 0.0% |
| Arts & Humanities | 0 | 0.0% |
| Total | 233 | 100.0% |
Transportation & Commute in Lockland
Vehicle Availability by Sex in Lockland
The most prevalent vehicle ownership categories in Lockland are males with 2 vehicles (523, accounting for 56.5%) and females with 2 vehicles (194, making up 61.0%).
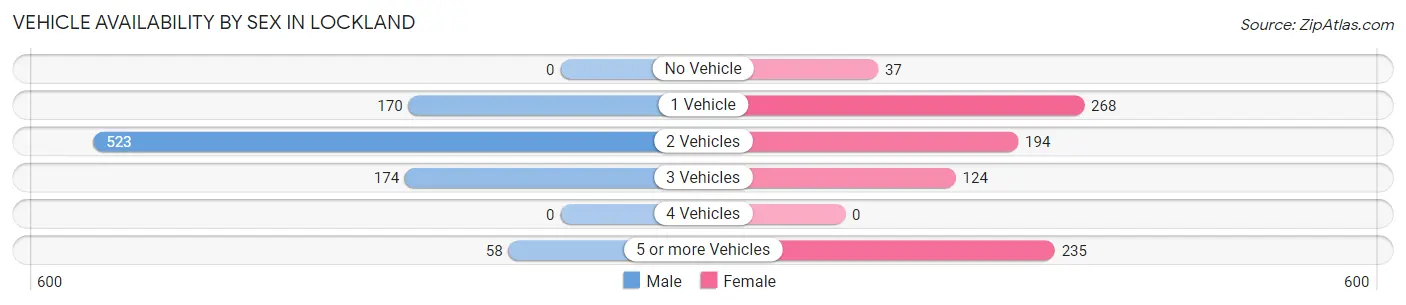
| Vehicles Available | Male | Female |
| No Vehicle | 0 (0.0%) | 37 (4.3%) |
| 1 Vehicle | 170 (18.4%) | 268 (31.2%) |
| 2 Vehicles | 523 (56.5%) | 194 (22.6%) |
| 3 Vehicles | 174 (18.8%) | 124 (14.4%) |
| 4 Vehicles | 0 (0.0%) | 0 (0.0%) |
| 5 or more Vehicles | 58 (6.3%) | 235 (27.4%) |
| Total | 925 (100.0%) | 858 (100.0%) |
Commute Time in Lockland
The most frequently occuring commute durations in Lockland are 20 to 24 minutes (402 commuters, 23.4%), 5 to 9 minutes (392 commuters, 22.8%), and 15 to 19 minutes (272 commuters, 15.8%).
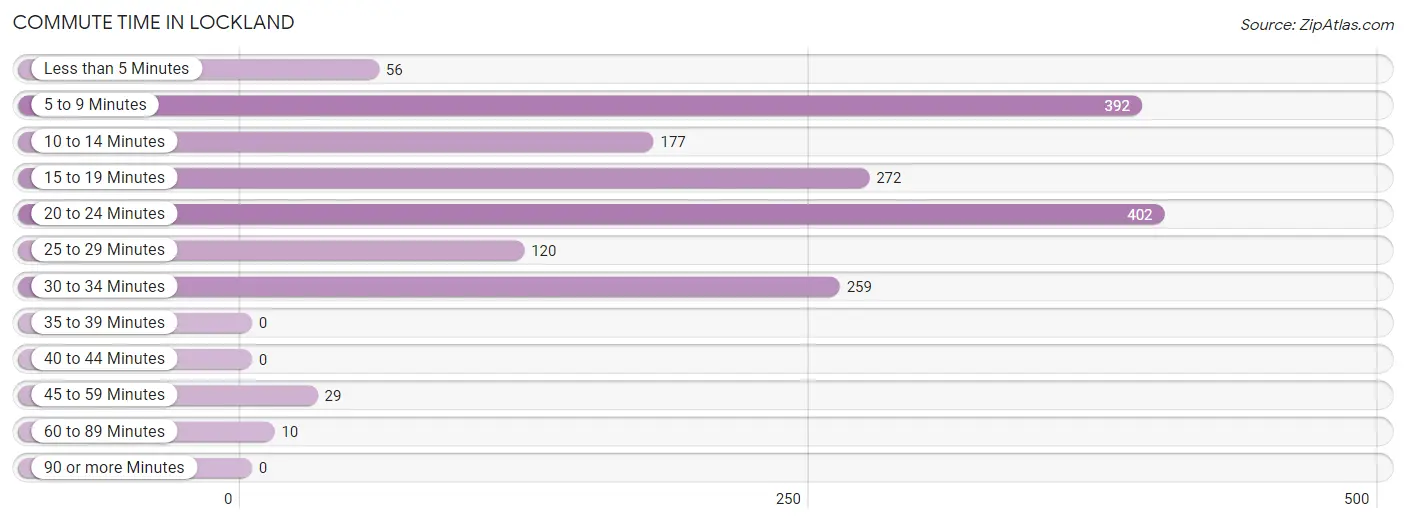
| Commute Time | # Commuters | % Commuters |
| Less than 5 Minutes | 56 | 3.3% |
| 5 to 9 Minutes | 392 | 22.8% |
| 10 to 14 Minutes | 177 | 10.3% |
| 15 to 19 Minutes | 272 | 15.8% |
| 20 to 24 Minutes | 402 | 23.4% |
| 25 to 29 Minutes | 120 | 7.0% |
| 30 to 34 Minutes | 259 | 15.1% |
| 35 to 39 Minutes | 0 | 0.0% |
| 40 to 44 Minutes | 0 | 0.0% |
| 45 to 59 Minutes | 29 | 1.7% |
| 60 to 89 Minutes | 10 | 0.6% |
| 90 or more Minutes | 0 | 0.0% |
Commute Time by Sex in Lockland
The most common commute times in Lockland are 30 to 34 minutes (210 commuters, 23.6%) for males and 5 to 9 minutes (286 commuters, 34.5%) for females.
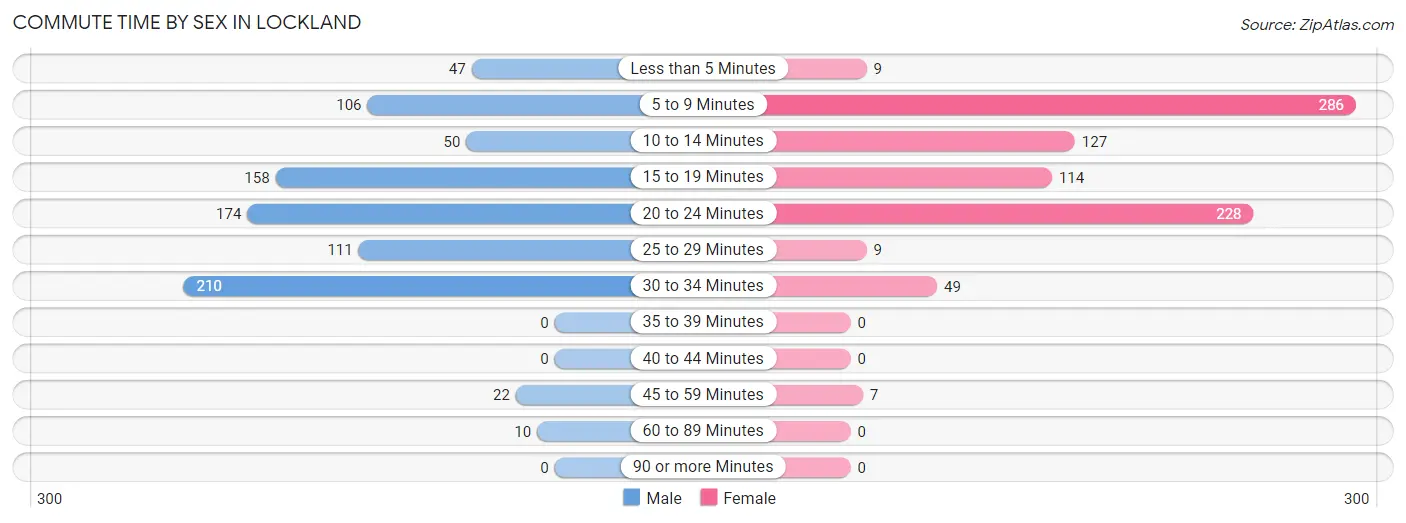
| Commute Time | Male | Female |
| Less than 5 Minutes | 47 (5.3%) | 9 (1.1%) |
| 5 to 9 Minutes | 106 (11.9%) | 286 (34.5%) |
| 10 to 14 Minutes | 50 (5.6%) | 127 (15.3%) |
| 15 to 19 Minutes | 158 (17.8%) | 114 (13.8%) |
| 20 to 24 Minutes | 174 (19.6%) | 228 (27.5%) |
| 25 to 29 Minutes | 111 (12.5%) | 9 (1.1%) |
| 30 to 34 Minutes | 210 (23.6%) | 49 (5.9%) |
| 35 to 39 Minutes | 0 (0.0%) | 0 (0.0%) |
| 40 to 44 Minutes | 0 (0.0%) | 0 (0.0%) |
| 45 to 59 Minutes | 22 (2.5%) | 7 (0.8%) |
| 60 to 89 Minutes | 10 (1.1%) | 0 (0.0%) |
| 90 or more Minutes | 0 (0.0%) | 0 (0.0%) |
Time of Departure to Work by Sex in Lockland
The most frequent times of departure to work in Lockland are 12:00 AM to 4:59 AM (174, 19.6%) for males and 6:00 AM to 6:29 AM (267, 32.2%) for females.
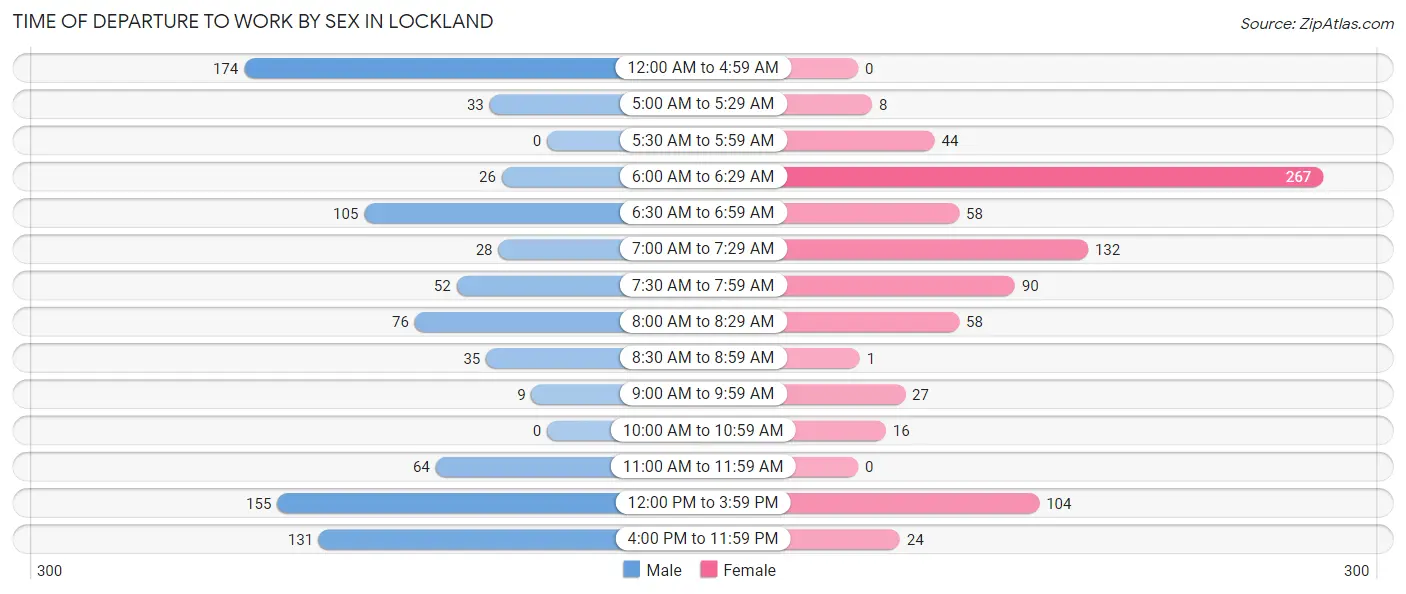
| Time of Departure | Male | Female |
| 12:00 AM to 4:59 AM | 174 (19.6%) | 0 (0.0%) |
| 5:00 AM to 5:29 AM | 33 (3.7%) | 8 (1.0%) |
| 5:30 AM to 5:59 AM | 0 (0.0%) | 44 (5.3%) |
| 6:00 AM to 6:29 AM | 26 (2.9%) | 267 (32.2%) |
| 6:30 AM to 6:59 AM | 105 (11.8%) | 58 (7.0%) |
| 7:00 AM to 7:29 AM | 28 (3.2%) | 132 (15.9%) |
| 7:30 AM to 7:59 AM | 52 (5.9%) | 90 (10.9%) |
| 8:00 AM to 8:29 AM | 76 (8.6%) | 58 (7.0%) |
| 8:30 AM to 8:59 AM | 35 (3.9%) | 1 (0.1%) |
| 9:00 AM to 9:59 AM | 9 (1.0%) | 27 (3.3%) |
| 10:00 AM to 10:59 AM | 0 (0.0%) | 16 (1.9%) |
| 11:00 AM to 11:59 AM | 64 (7.2%) | 0 (0.0%) |
| 12:00 PM to 3:59 PM | 155 (17.4%) | 104 (12.6%) |
| 4:00 PM to 11:59 PM | 131 (14.7%) | 24 (2.9%) |
| Total | 888 (100.0%) | 829 (100.0%) |
Housing Occupancy in Lockland
Occupancy by Ownership in Lockland
Of the total 1,499 dwellings in Lockland, owner-occupied units account for 841 (56.1%), while renter-occupied units make up 658 (43.9%).
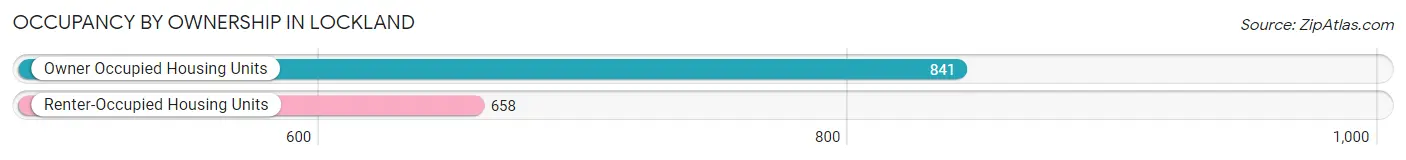
| Occupancy | # Housing Units | % Housing Units |
| Owner Occupied Housing Units | 841 | 56.1% |
| Renter-Occupied Housing Units | 658 | 43.9% |
| Total Occupied Housing Units | 1,499 | 100.0% |
Occupancy by Household Size in Lockland
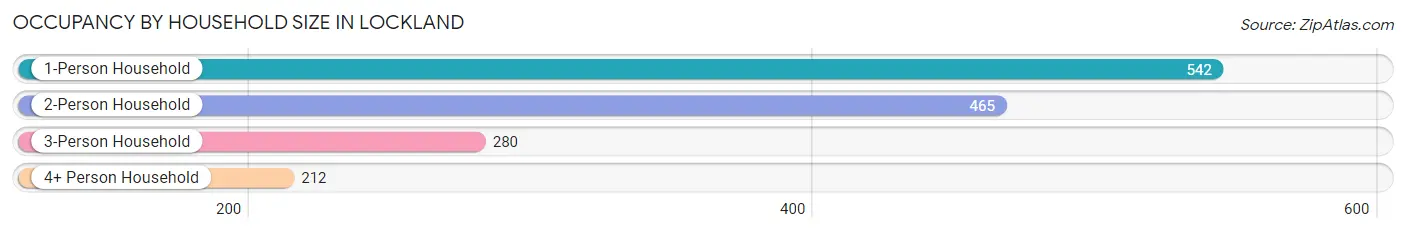
| Household Size | # Housing Units | % Housing Units |
| 1-Person Household | 542 | 36.2% |
| 2-Person Household | 465 | 31.0% |
| 3-Person Household | 280 | 18.7% |
| 4+ Person Household | 212 | 14.1% |
| Total Housing Units | 1,499 | 100.0% |
Occupancy by Ownership by Household Size in Lockland
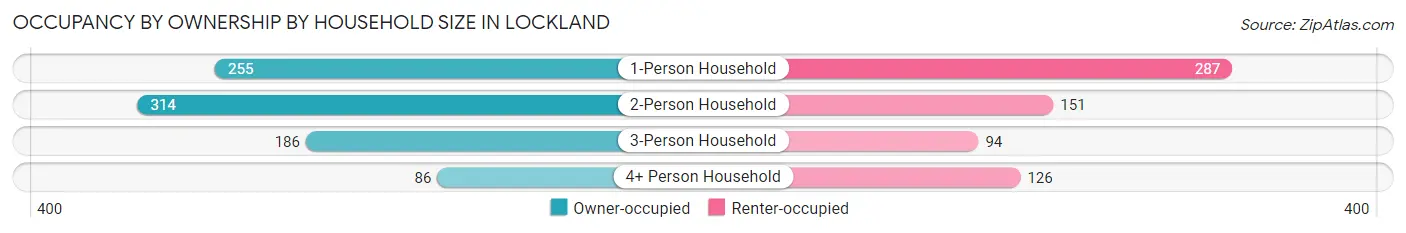
| Household Size | Owner-occupied | Renter-occupied |
| 1-Person Household | 255 (47.0%) | 287 (52.9%) |
| 2-Person Household | 314 (67.5%) | 151 (32.5%) |
| 3-Person Household | 186 (66.4%) | 94 (33.6%) |
| 4+ Person Household | 86 (40.6%) | 126 (59.4%) |
| Total Housing Units | 841 (56.1%) | 658 (43.9%) |
Occupancy by Educational Attainment in Lockland
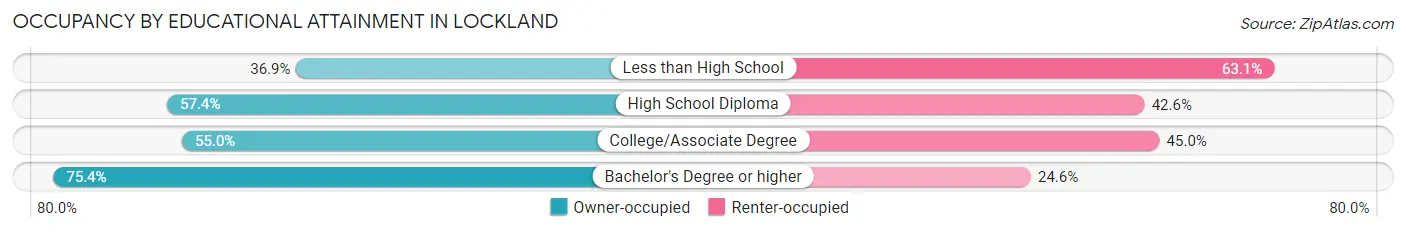
| Household Size | Owner-occupied | Renter-occupied |
| Less than High School | 93 (36.9%) | 159 (63.1%) |
| High School Diploma | 349 (57.4%) | 259 (42.6%) |
| College/Associate Degree | 224 (55.0%) | 183 (45.0%) |
| Bachelor's Degree or higher | 175 (75.4%) | 57 (24.6%) |
Occupancy by Age of Householder in Lockland
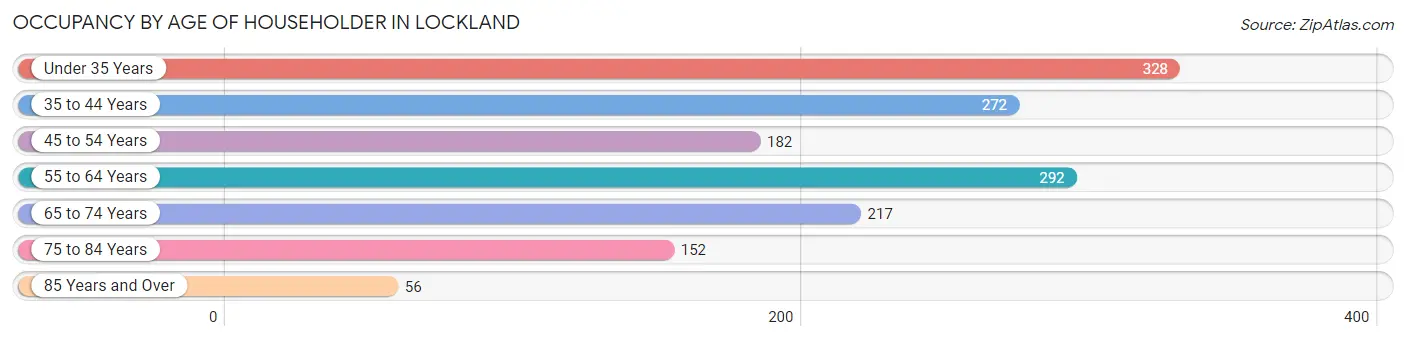
| Age Bracket | # Households | % Households |
| Under 35 Years | 328 | 21.9% |
| 35 to 44 Years | 272 | 18.1% |
| 45 to 54 Years | 182 | 12.1% |
| 55 to 64 Years | 292 | 19.5% |
| 65 to 74 Years | 217 | 14.5% |
| 75 to 84 Years | 152 | 10.1% |
| 85 Years and Over | 56 | 3.7% |
| Total | 1,499 | 100.0% |
Housing Finances in Lockland
Median Income by Occupancy in Lockland
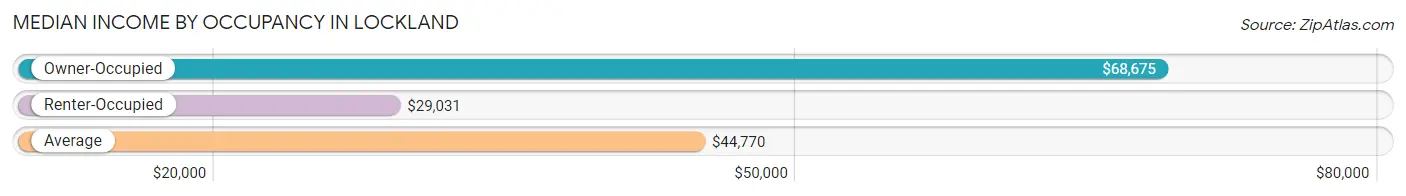
| Occupancy Type | # Households | Median Income |
| Owner-Occupied | 841 (56.1%) | $68,675 |
| Renter-Occupied | 658 (43.9%) | $29,031 |
| Average | 1,499 (100.0%) | $44,770 |
Occupancy by Householder Income Bracket in Lockland
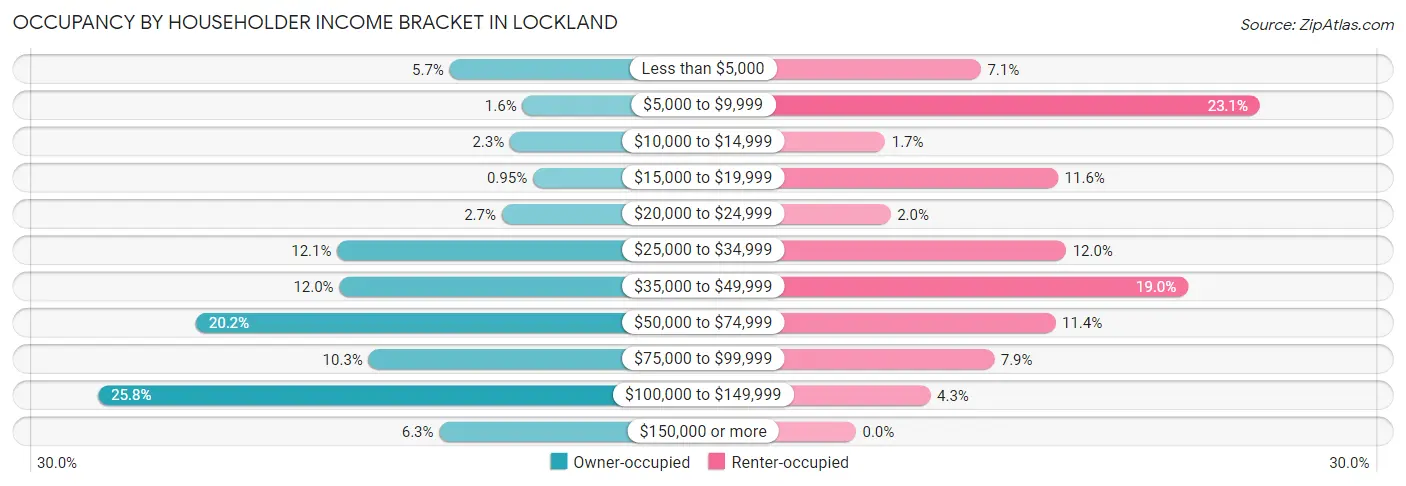
| Income Bracket | Owner-occupied | Renter-occupied |
| Less than $5,000 | 48 (5.7%) | 47 (7.1%) |
| $5,000 to $9,999 | 13 (1.5%) | 152 (23.1%) |
| $10,000 to $14,999 | 19 (2.3%) | 11 (1.7%) |
| $15,000 to $19,999 | 8 (0.9%) | 76 (11.6%) |
| $20,000 to $24,999 | 23 (2.7%) | 13 (2.0%) |
| $25,000 to $34,999 | 102 (12.1%) | 79 (12.0%) |
| $35,000 to $49,999 | 101 (12.0%) | 125 (19.0%) |
| $50,000 to $74,999 | 170 (20.2%) | 75 (11.4%) |
| $75,000 to $99,999 | 87 (10.3%) | 52 (7.9%) |
| $100,000 to $149,999 | 217 (25.8%) | 28 (4.3%) |
| $150,000 or more | 53 (6.3%) | 0 (0.0%) |
| Total | 841 (100.0%) | 658 (100.0%) |
Monthly Housing Cost Tiers in Lockland
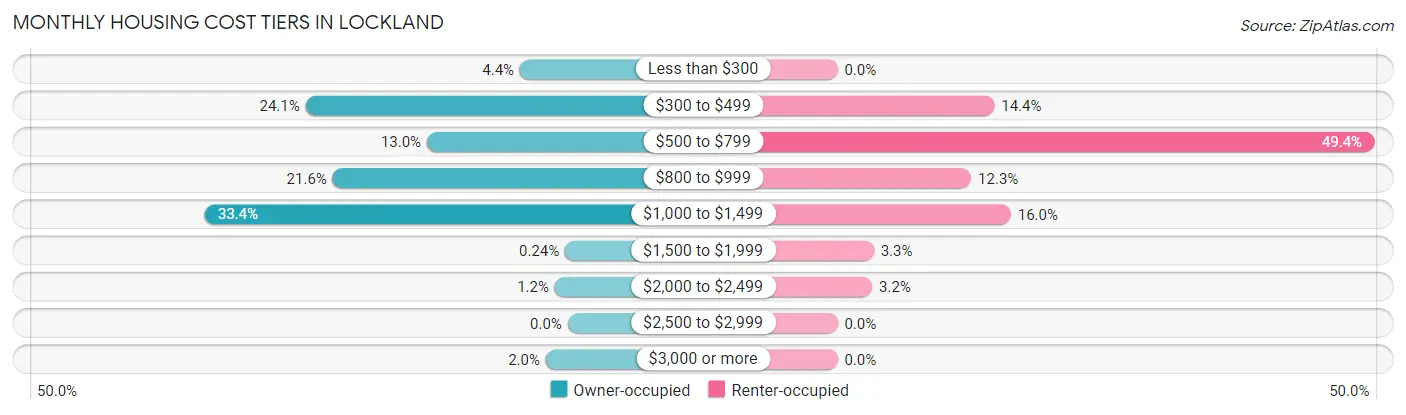
| Monthly Cost | Owner-occupied | Renter-occupied |
| Less than $300 | 37 (4.4%) | 0 (0.0%) |
| $300 to $499 | 203 (24.1%) | 95 (14.4%) |
| $500 to $799 | 109 (13.0%) | 325 (49.4%) |
| $800 to $999 | 182 (21.6%) | 81 (12.3%) |
| $1,000 to $1,499 | 281 (33.4%) | 105 (16.0%) |
| $1,500 to $1,999 | 2 (0.2%) | 22 (3.3%) |
| $2,000 to $2,499 | 10 (1.2%) | 21 (3.2%) |
| $2,500 to $2,999 | 0 (0.0%) | 0 (0.0%) |
| $3,000 or more | 17 (2.0%) | 0 (0.0%) |
| Total | 841 (100.0%) | 658 (100.0%) |
Physical Housing Characteristics in Lockland
Housing Structures in Lockland
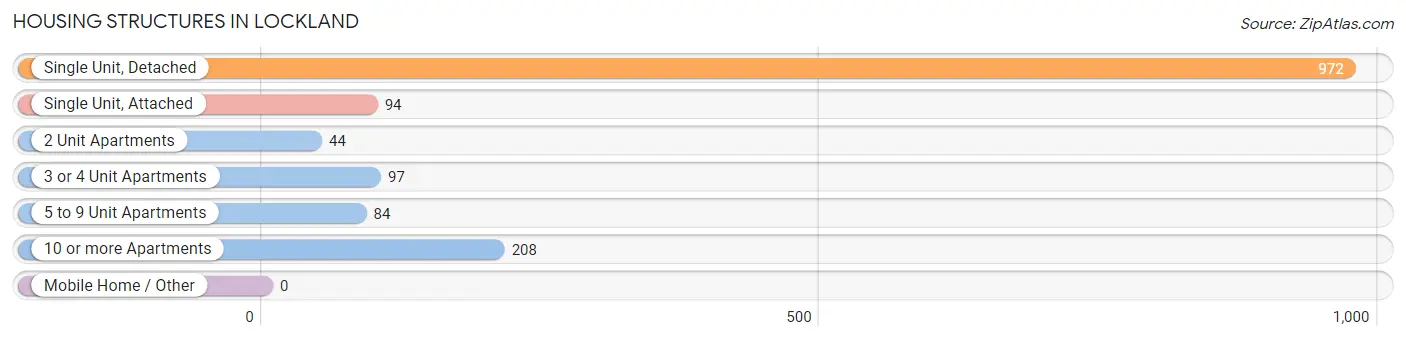
| Structure Type | # Housing Units | % Housing Units |
| Single Unit, Detached | 972 | 64.8% |
| Single Unit, Attached | 94 | 6.3% |
| 2 Unit Apartments | 44 | 2.9% |
| 3 or 4 Unit Apartments | 97 | 6.5% |
| 5 to 9 Unit Apartments | 84 | 5.6% |
| 10 or more Apartments | 208 | 13.9% |
| Mobile Home / Other | 0 | 0.0% |
| Total | 1,499 | 100.0% |
Housing Structures by Occupancy in Lockland
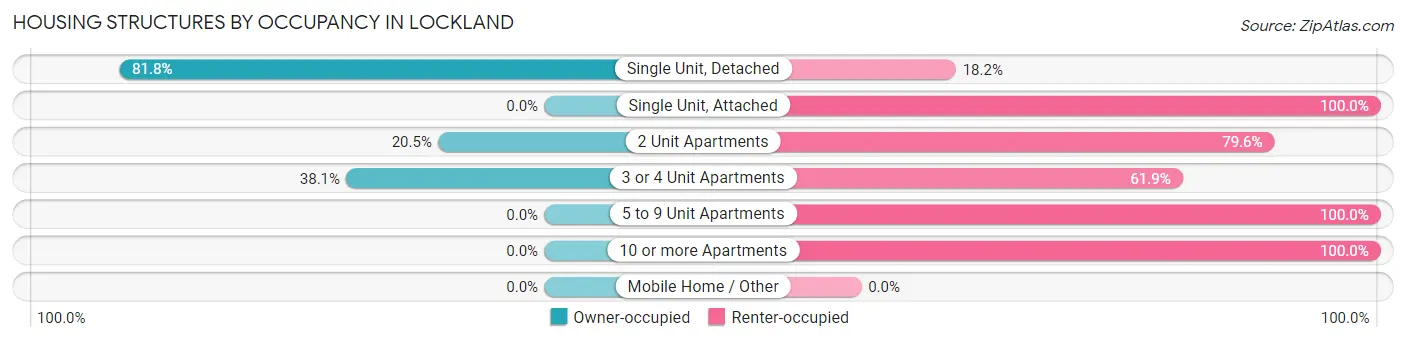
| Structure Type | Owner-occupied | Renter-occupied |
| Single Unit, Detached | 795 (81.8%) | 177 (18.2%) |
| Single Unit, Attached | 0 (0.0%) | 94 (100.0%) |
| 2 Unit Apartments | 9 (20.4%) | 35 (79.5%) |
| 3 or 4 Unit Apartments | 37 (38.1%) | 60 (61.9%) |
| 5 to 9 Unit Apartments | 0 (0.0%) | 84 (100.0%) |
| 10 or more Apartments | 0 (0.0%) | 208 (100.0%) |
| Mobile Home / Other | 0 (0.0%) | 0 (0.0%) |
| Total | 841 (56.1%) | 658 (43.9%) |
Housing Structures by Number of Rooms in Lockland
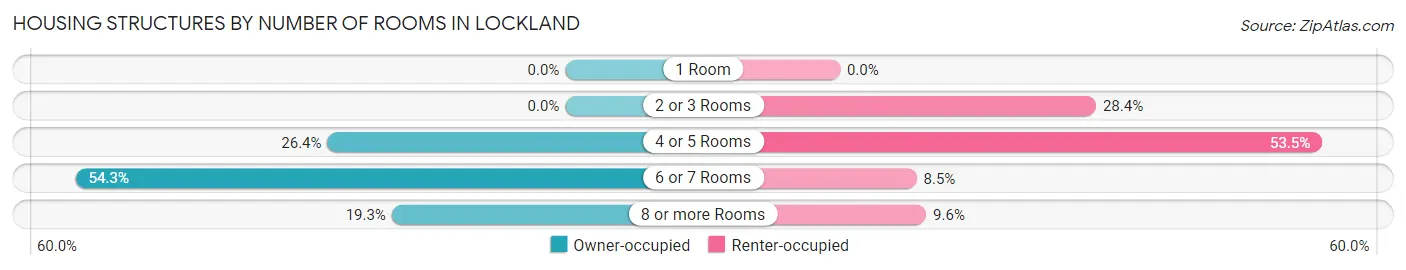
| Number of Rooms | Owner-occupied | Renter-occupied |
| 1 Room | 0 (0.0%) | 0 (0.0%) |
| 2 or 3 Rooms | 0 (0.0%) | 187 (28.4%) |
| 4 or 5 Rooms | 222 (26.4%) | 352 (53.5%) |
| 6 or 7 Rooms | 457 (54.3%) | 56 (8.5%) |
| 8 or more Rooms | 162 (19.3%) | 63 (9.6%) |
| Total | 841 (100.0%) | 658 (100.0%) |
Housing Structure by Heating Type in Lockland
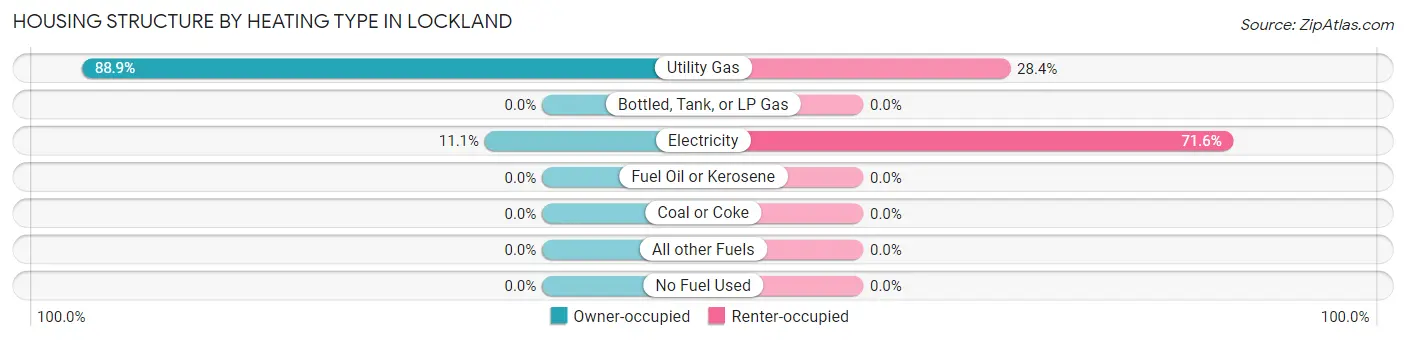
| Heating Type | Owner-occupied | Renter-occupied |
| Utility Gas | 748 (88.9%) | 187 (28.4%) |
| Bottled, Tank, or LP Gas | 0 (0.0%) | 0 (0.0%) |
| Electricity | 93 (11.1%) | 471 (71.6%) |
| Fuel Oil or Kerosene | 0 (0.0%) | 0 (0.0%) |
| Coal or Coke | 0 (0.0%) | 0 (0.0%) |
| All other Fuels | 0 (0.0%) | 0 (0.0%) |
| No Fuel Used | 0 (0.0%) | 0 (0.0%) |
| Total | 841 (100.0%) | 658 (100.0%) |
Household Vehicle Usage in Lockland
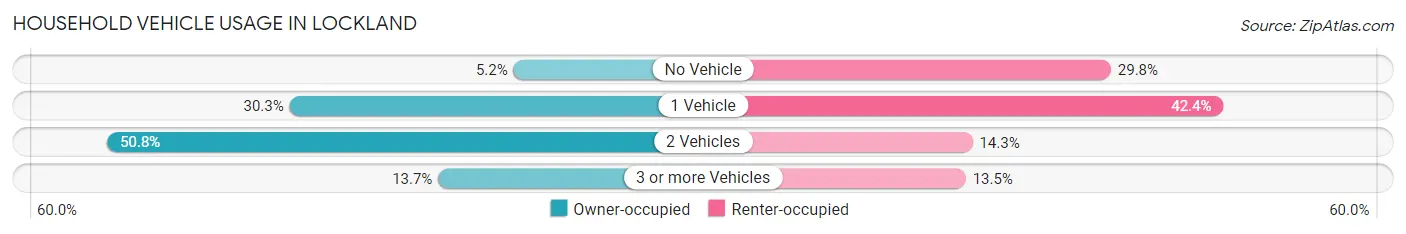
| Vehicles per Household | Owner-occupied | Renter-occupied |
| No Vehicle | 44 (5.2%) | 196 (29.8%) |
| 1 Vehicle | 255 (30.3%) | 279 (42.4%) |
| 2 Vehicles | 427 (50.8%) | 94 (14.3%) |
| 3 or more Vehicles | 115 (13.7%) | 89 (13.5%) |
| Total | 841 (100.0%) | 658 (100.0%) |
Real Estate & Mortgages in Lockland
Real Estate and Mortgage Overview in Lockland
| Characteristic | Without Mortgage | With Mortgage |
| Housing Units | 321 | 520 |
| Median Property Value | $88,100 | $114,800 |
| Median Household Income | $63,750 | $35 |
| Monthly Housing Costs | $463 | $0 |
| Real Estate Taxes | $1,336 | $28 |
Property Value by Mortgage Status in Lockland
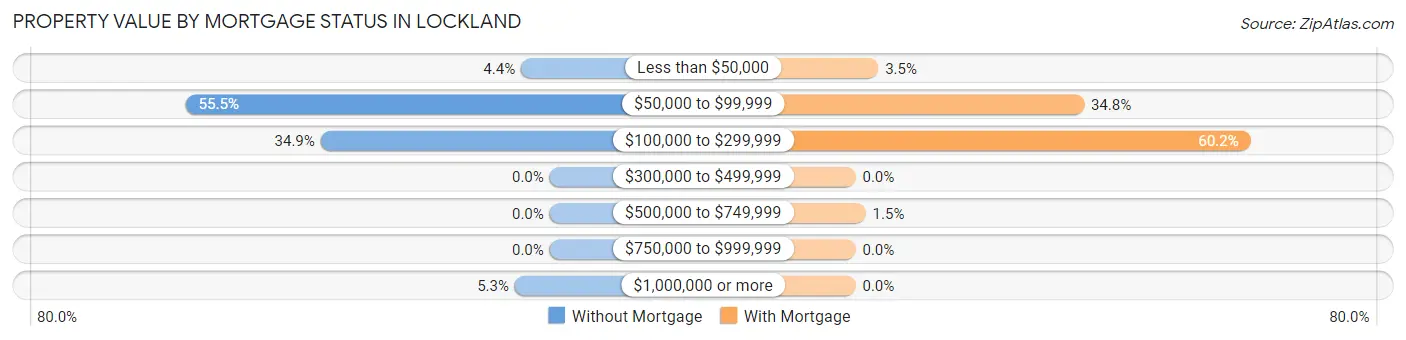
| Property Value | Without Mortgage | With Mortgage |
| Less than $50,000 | 14 (4.4%) | 18 (3.5%) |
| $50,000 to $99,999 | 178 (55.4%) | 181 (34.8%) |
| $100,000 to $299,999 | 112 (34.9%) | 313 (60.2%) |
| $300,000 to $499,999 | 0 (0.0%) | 0 (0.0%) |
| $500,000 to $749,999 | 0 (0.0%) | 8 (1.5%) |
| $750,000 to $999,999 | 0 (0.0%) | 0 (0.0%) |
| $1,000,000 or more | 17 (5.3%) | 0 (0.0%) |
| Total | 321 (100.0%) | 520 (100.0%) |
Household Income by Mortgage Status in Lockland
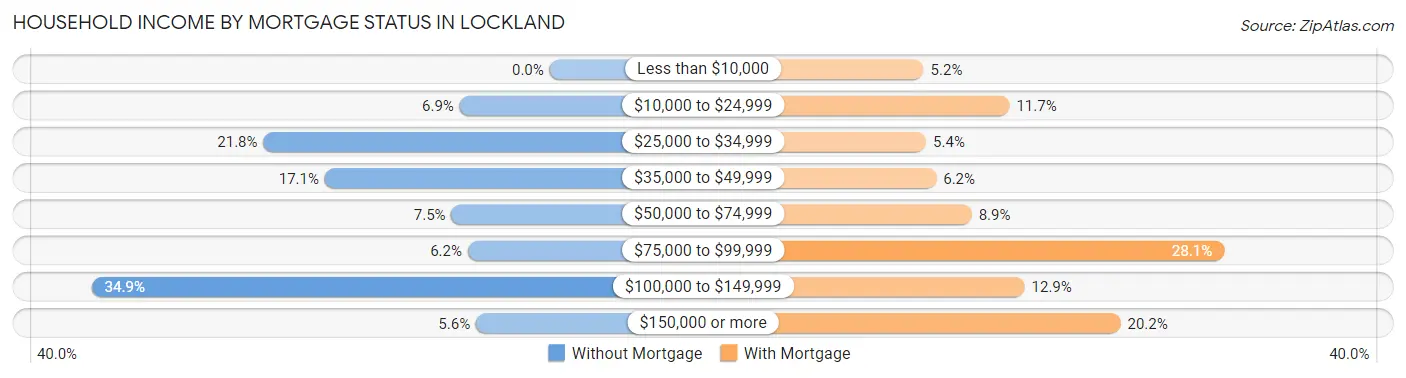
| Household Income | Without Mortgage | With Mortgage |
| Less than $10,000 | 0 (0.0%) | 27 (5.2%) |
| $10,000 to $24,999 | 22 (6.9%) | 61 (11.7%) |
| $25,000 to $34,999 | 70 (21.8%) | 28 (5.4%) |
| $35,000 to $49,999 | 55 (17.1%) | 32 (6.1%) |
| $50,000 to $74,999 | 24 (7.5%) | 46 (8.8%) |
| $75,000 to $99,999 | 20 (6.2%) | 146 (28.1%) |
| $100,000 to $149,999 | 112 (34.9%) | 67 (12.9%) |
| $150,000 or more | 18 (5.6%) | 105 (20.2%) |
| Total | 321 (100.0%) | 520 (100.0%) |
Property Value to Household Income Ratio in Lockland
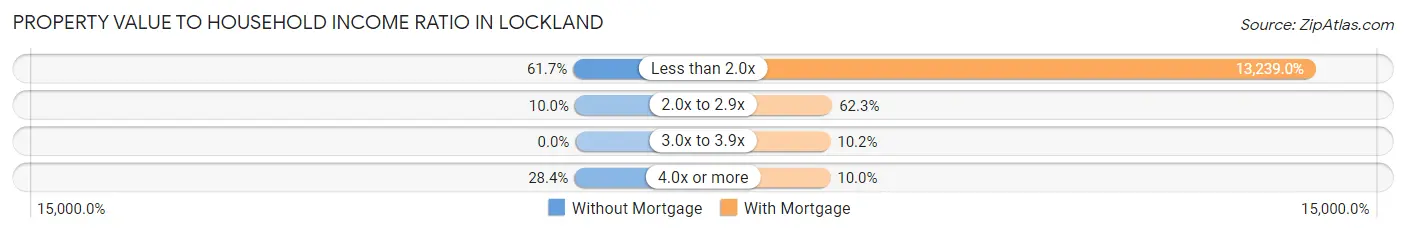
| Value-to-Income Ratio | Without Mortgage | With Mortgage |
| Less than 2.0x | 198 (61.7%) | 68,843 (13,239.0%) |
| 2.0x to 2.9x | 32 (10.0%) | 324 (62.3%) |
| 3.0x to 3.9x | 0 (0.0%) | 53 (10.2%) |
| 4.0x or more | 91 (28.3%) | 52 (10.0%) |
| Total | 321 (100.0%) | 520 (100.0%) |
Real Estate Taxes by Mortgage Status in Lockland
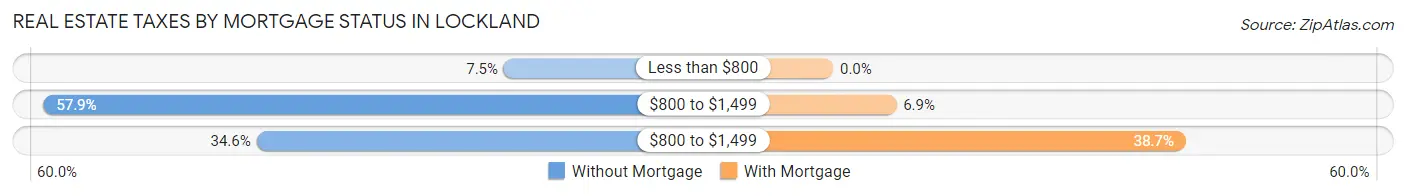
| Property Taxes | Without Mortgage | With Mortgage |
| Less than $800 | 24 (7.5%) | 0 (0.0%) |
| $800 to $1,499 | 186 (57.9%) | 36 (6.9%) |
| $800 to $1,499 | 111 (34.6%) | 201 (38.7%) |
| Total | 321 (100.0%) | 520 (100.0%) |
Health & Disability in Lockland
Health Insurance Coverage by Age in Lockland
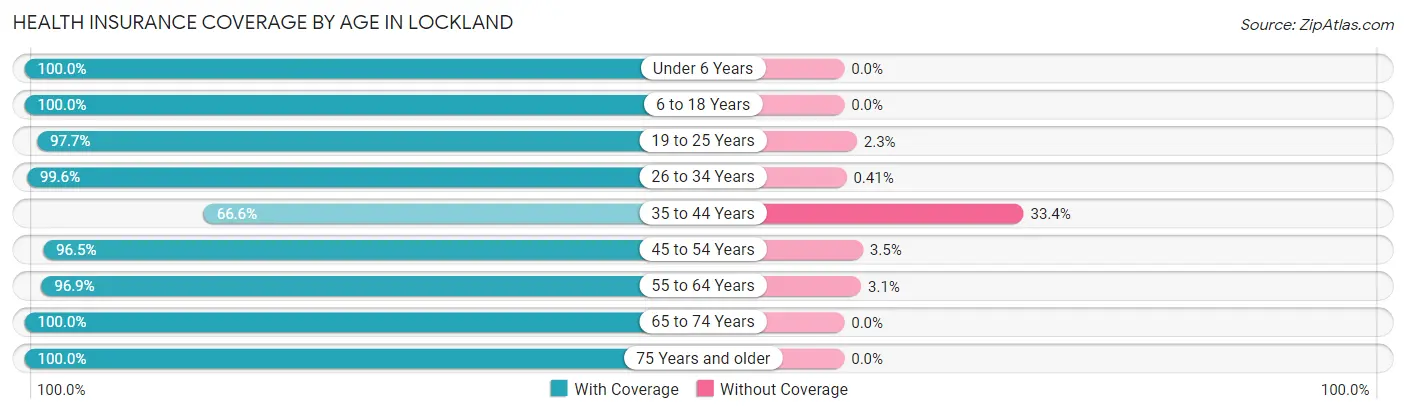
| Age Bracket | With Coverage | Without Coverage |
| Under 6 Years | 282 (100.0%) | 0 (0.0%) |
| 6 to 18 Years | 353 (100.0%) | 0 (0.0%) |
| 19 to 25 Years | 585 (97.7%) | 14 (2.3%) |
| 26 to 34 Years | 241 (99.6%) | 1 (0.4%) |
| 35 to 44 Years | 227 (66.6%) | 114 (33.4%) |
| 45 to 54 Years | 250 (96.5%) | 9 (3.5%) |
| 55 to 64 Years | 742 (96.9%) | 24 (3.1%) |
| 65 to 74 Years | 319 (100.0%) | 0 (0.0%) |
| 75 Years and older | 336 (100.0%) | 0 (0.0%) |
| Total | 3,335 (95.4%) | 162 (4.6%) |
Health Insurance Coverage by Citizenship Status in Lockland
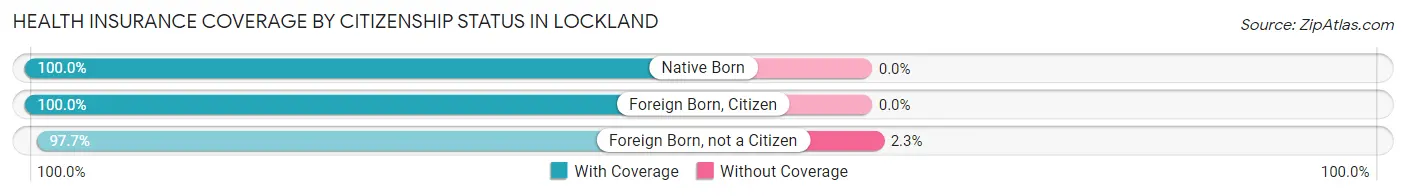
| Citizenship Status | With Coverage | Without Coverage |
| Native Born | 282 (100.0%) | 0 (0.0%) |
| Foreign Born, Citizen | 353 (100.0%) | 0 (0.0%) |
| Foreign Born, not a Citizen | 585 (97.7%) | 14 (2.3%) |
Health Insurance Coverage by Household Income in Lockland
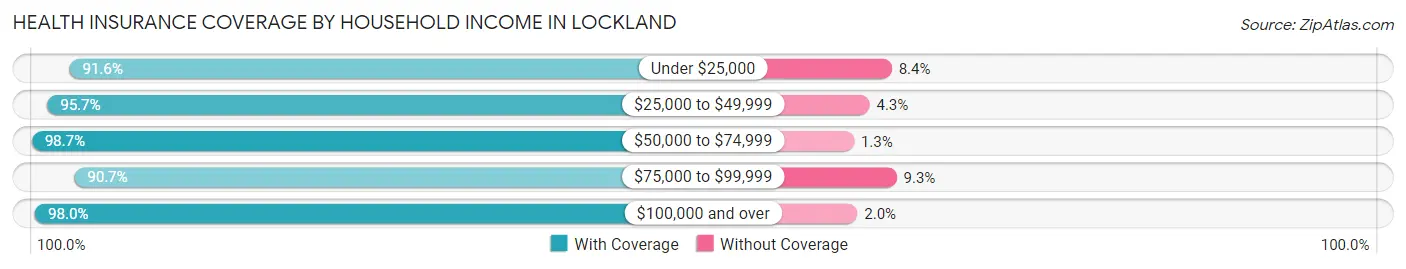
| Household Income | With Coverage | Without Coverage |
| Under $25,000 | 772 (91.6%) | 71 (8.4%) |
| $25,000 to $49,999 | 696 (95.7%) | 31 (4.3%) |
| $50,000 to $74,999 | 661 (98.7%) | 9 (1.3%) |
| $75,000 to $99,999 | 311 (90.7%) | 32 (9.3%) |
| $100,000 and over | 891 (98.0%) | 18 (2.0%) |
Public vs Private Health Insurance Coverage by Age in Lockland
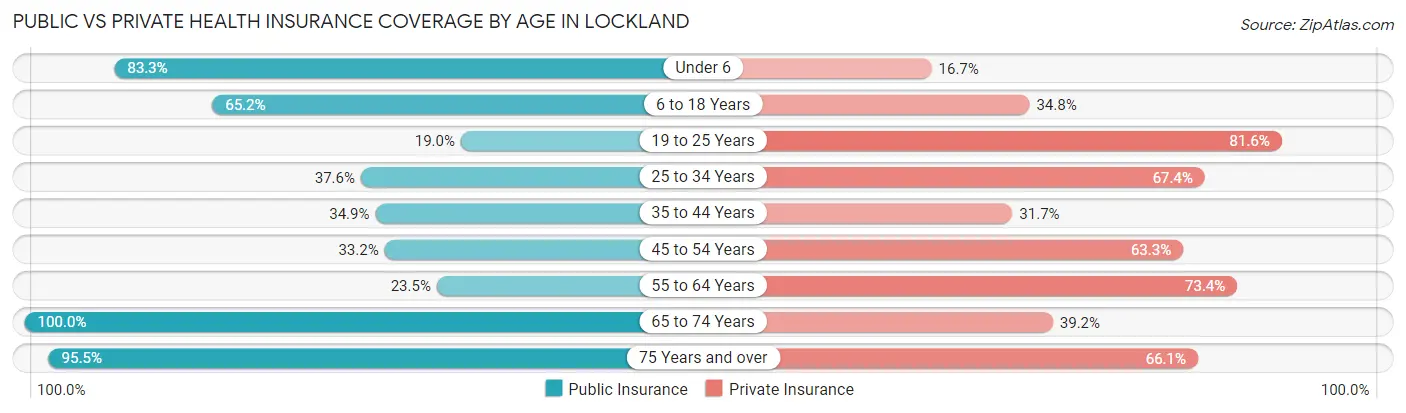
| Age Bracket | Public Insurance | Private Insurance |
| Under 6 | 235 (83.3%) | 47 (16.7%) |
| 6 to 18 Years | 230 (65.2%) | 123 (34.8%) |
| 19 to 25 Years | 114 (19.0%) | 489 (81.6%) |
| 25 to 34 Years | 91 (37.6%) | 163 (67.4%) |
| 35 to 44 Years | 119 (34.9%) | 108 (31.7%) |
| 45 to 54 Years | 86 (33.2%) | 164 (63.3%) |
| 55 to 64 Years | 180 (23.5%) | 562 (73.4%) |
| 65 to 74 Years | 319 (100.0%) | 125 (39.2%) |
| 75 Years and over | 321 (95.5%) | 222 (66.1%) |
| Total | 1,695 (48.5%) | 2,003 (57.3%) |
Disability Status by Sex by Age in Lockland
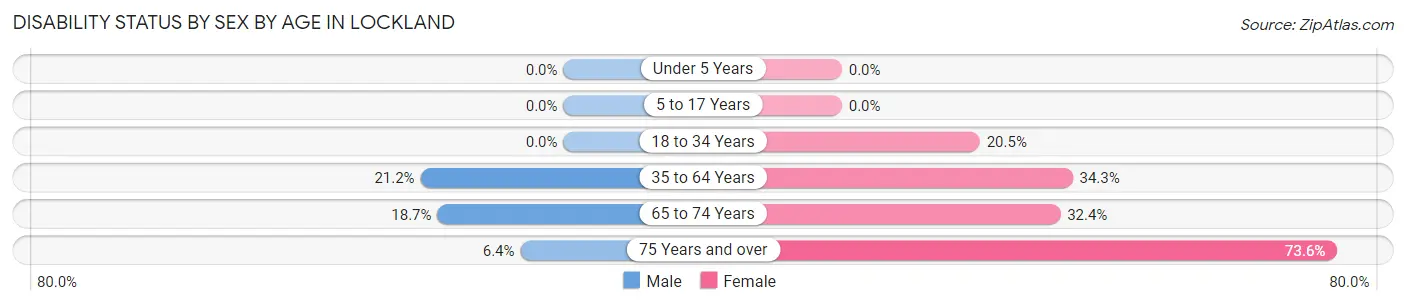
| Age Bracket | Male | Female |
| Under 5 Years | 0 (0.0%) | 0 (0.0%) |
| 5 to 17 Years | 0 (0.0%) | 0 (0.0%) |
| 18 to 34 Years | 0 (0.0%) | 111 (20.5%) |
| 35 to 64 Years | 153 (21.2%) | 221 (34.3%) |
| 65 to 74 Years | 32 (18.7%) | 48 (32.4%) |
| 75 Years and over | 6 (6.4%) | 178 (73.6%) |
Disability Class by Sex by Age in Lockland
Disability Class: Hearing Difficulty
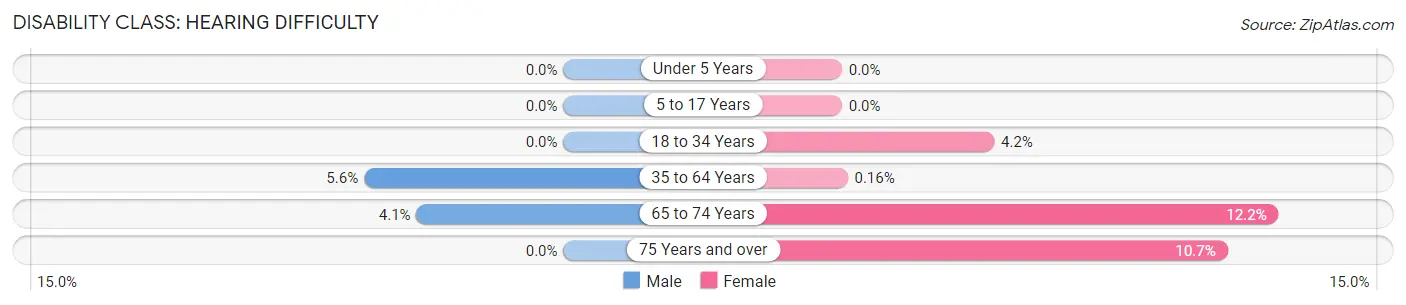
| Age Bracket | Male | Female |
| Under 5 Years | 0 (0.0%) | 0 (0.0%) |
| 5 to 17 Years | 0 (0.0%) | 0 (0.0%) |
| 18 to 34 Years | 0 (0.0%) | 23 (4.2%) |
| 35 to 64 Years | 40 (5.6%) | 1 (0.2%) |
| 65 to 74 Years | 7 (4.1%) | 18 (12.2%) |
| 75 Years and over | 0 (0.0%) | 26 (10.7%) |
Disability Class: Vision Difficulty
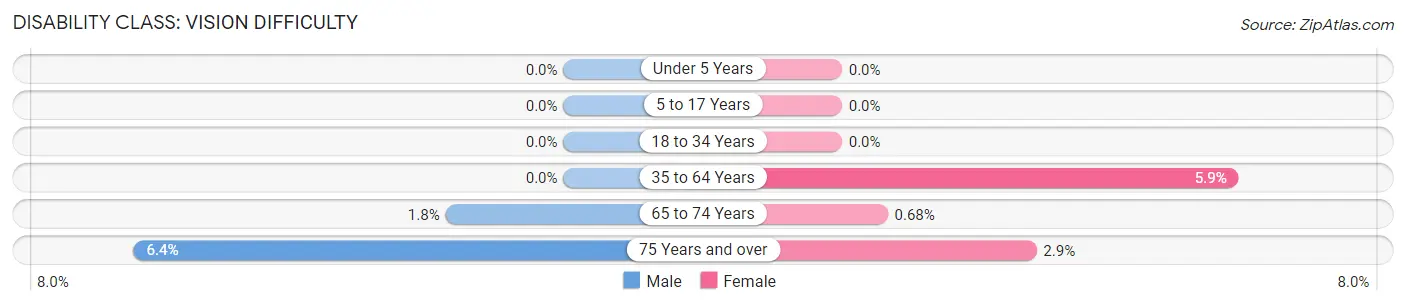
| Age Bracket | Male | Female |
| Under 5 Years | 0 (0.0%) | 0 (0.0%) |
| 5 to 17 Years | 0 (0.0%) | 0 (0.0%) |
| 18 to 34 Years | 0 (0.0%) | 0 (0.0%) |
| 35 to 64 Years | 0 (0.0%) | 38 (5.9%) |
| 65 to 74 Years | 3 (1.8%) | 1 (0.7%) |
| 75 Years and over | 6 (6.4%) | 7 (2.9%) |
Disability Class: Cognitive Difficulty
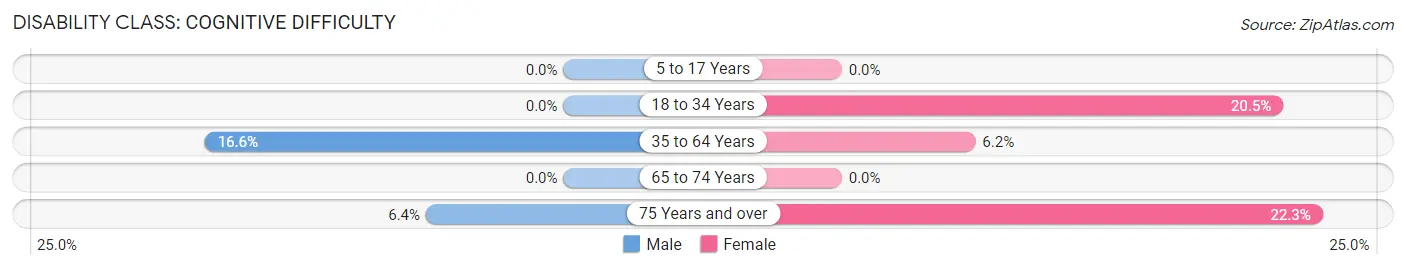
| Age Bracket | Male | Female |
| 5 to 17 Years | 0 (0.0%) | 0 (0.0%) |
| 18 to 34 Years | 0 (0.0%) | 111 (20.5%) |
| 35 to 64 Years | 120 (16.6%) | 40 (6.2%) |
| 65 to 74 Years | 0 (0.0%) | 0 (0.0%) |
| 75 Years and over | 6 (6.4%) | 54 (22.3%) |
Disability Class: Ambulatory Difficulty
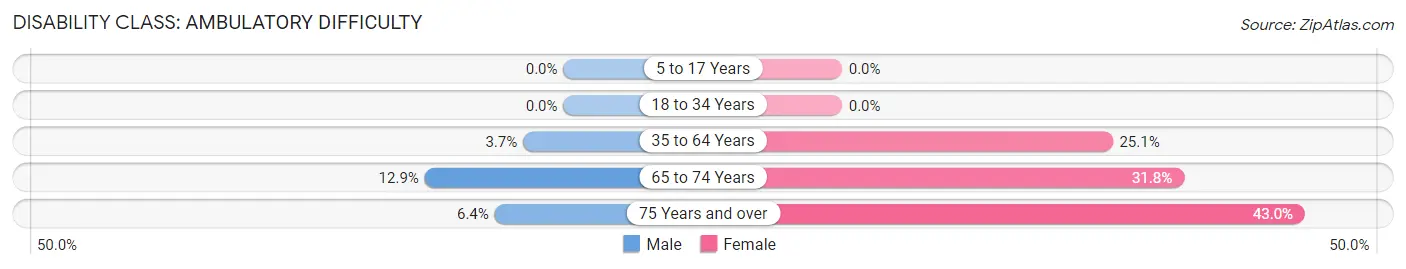
| Age Bracket | Male | Female |
| 5 to 17 Years | 0 (0.0%) | 0 (0.0%) |
| 18 to 34 Years | 0 (0.0%) | 0 (0.0%) |
| 35 to 64 Years | 27 (3.7%) | 162 (25.1%) |
| 65 to 74 Years | 22 (12.9%) | 47 (31.8%) |
| 75 Years and over | 6 (6.4%) | 104 (43.0%) |
Disability Class: Self-Care Difficulty
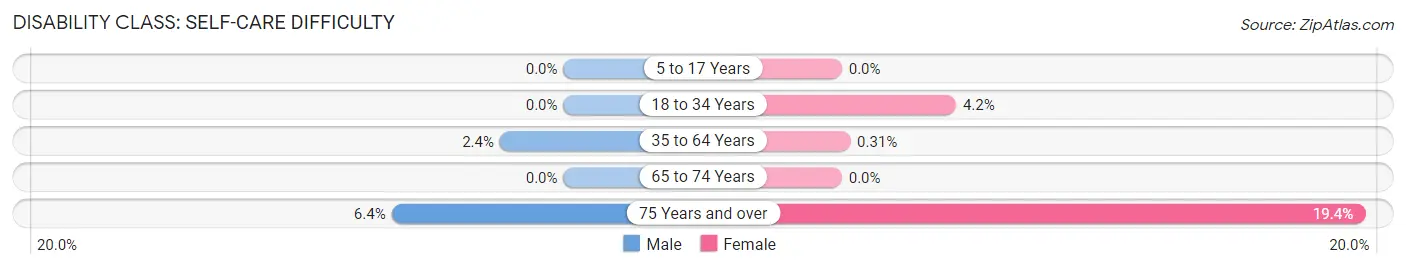
| Age Bracket | Male | Female |
| 5 to 17 Years | 0 (0.0%) | 0 (0.0%) |
| 18 to 34 Years | 0 (0.0%) | 23 (4.2%) |
| 35 to 64 Years | 17 (2.4%) | 2 (0.3%) |
| 65 to 74 Years | 0 (0.0%) | 0 (0.0%) |
| 75 Years and over | 6 (6.4%) | 47 (19.4%) |
Technology Access in Lockland
Computing Device Access in Lockland
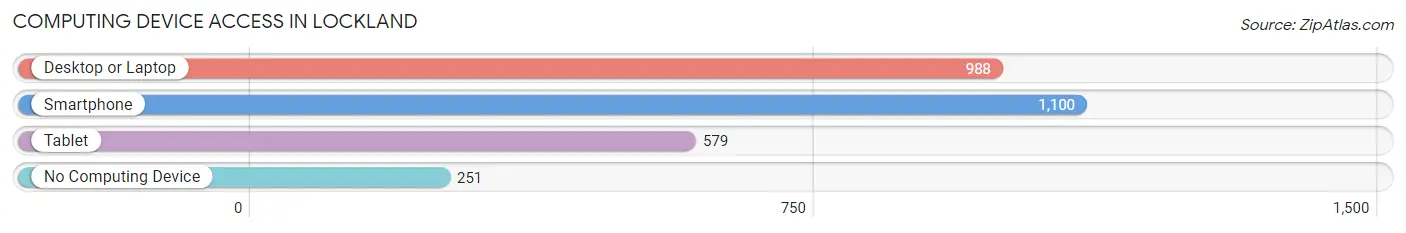
| Device Type | # Households | % Households |
| Desktop or Laptop | 988 | 65.9% |
| Smartphone | 1,100 | 73.4% |
| Tablet | 579 | 38.6% |
| No Computing Device | 251 | 16.7% |
| Total | 1,499 | 100.0% |
Internet Access in Lockland
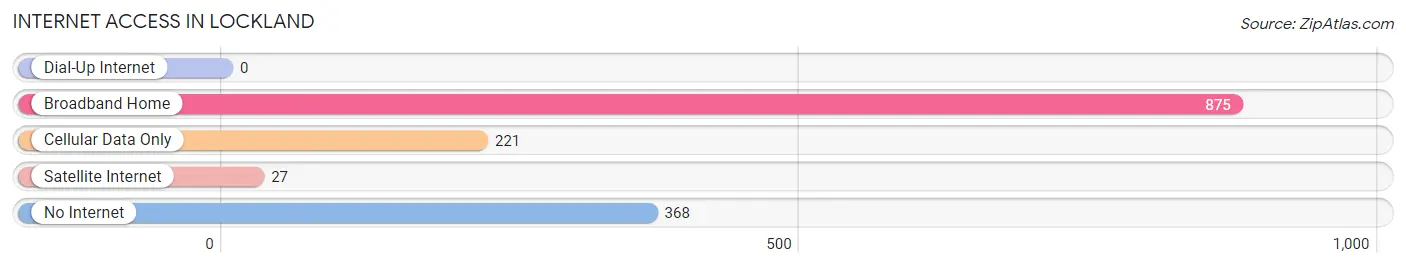
| Internet Type | # Households | % Households |
| Dial-Up Internet | 0 | 0.0% |
| Broadband Home | 875 | 58.4% |
| Cellular Data Only | 221 | 14.7% |
| Satellite Internet | 27 | 1.8% |
| No Internet | 368 | 24.5% |
| Total | 1,499 | 100.0% |
Lockland Summary
Lockland, Ohio is a small village located in Hamilton County, Ohio. It is situated just north of the city of Cincinnati and is part of the Cincinnati metropolitan area. The village has a population of just over 3,000 people and is home to a variety of businesses, including a few small manufacturing companies.
History
The area that is now Lockland was first settled in the early 1800s by a group of German immigrants. The village was originally known as “Lockland” due to the locks that were built along the Miami and Erie Canal, which ran through the area. The locks were used to control the water levels of the canal, allowing boats to travel between Cincinnati and Dayton. The village was officially incorporated in 1867 and was named after the locks.
In the late 1800s, Lockland became a major industrial center, with several factories and mills located in the area. The most prominent of these was the Lockland Iron Works, which produced a variety of products, including stoves, boilers, and other metal products. The company was eventually sold to the American Radiator Company in the early 1900s and the factory was closed in the 1950s.
Geography
Lockland is located in Hamilton County, Ohio, just north of the city of Cincinnati. The village is situated along the Miami and Erie Canal, which runs through the area. The village is bordered by the cities of Reading and Sharonville to the north, and the city of Wyoming to the south. The village is also located near the Great Miami River, which flows through the area.
The village has a total area of 1.2 square miles, all of which is land. The terrain of the area is mostly flat, with some rolling hills in the northern part of the village. The climate of the area is humid continental, with hot summers and cold winters.
Economy
The economy of Lockland is largely based on manufacturing and retail. The village is home to several small manufacturing companies, including a few automotive parts suppliers. The village also has a few retail stores, including a grocery store, a hardware store, and a few restaurants.
The village also has a few small businesses, including a few auto repair shops and a few professional services firms. The village also has a few small office buildings, which are mostly occupied by local businesses.
Demographics
As of the 2010 census, the population of Lockland was 3,092. The racial makeup of the village was 94.3% White, 2.2% African American, 0.3% Native American, 0.7% Asian, 0.1% Pacific Islander, and 2.4% from other races. Hispanic or Latino of any race were 2.7% of the population.
The median household income in Lockland was $41,944, and the median family income was $50,917. The per capita income for the village was $20,845. About 8.3% of families and 10.2% of the population were below the poverty line, including 14.2% of those under age 18 and 6.2% of those age 65 or over.
Lockland is a small village with a rich history and a diverse economy. The village is home to a variety of businesses, including a few small manufacturing companies and a few retail stores. The village also has a few small businesses, including a few auto repair shops and a few professional services firms. The village has a population of just over 3,000 people and is part of the Cincinnati metropolitan area.
Common Questions
What is Per Capita Income in Lockland?
Per Capita income in Lockland is $25,433.
What is the Median Family Income in Lockland?
Median Family Income in Lockland is $62,177.
What is the Median Household income in Lockland?
Median Household Income in Lockland is $44,770.
What is Income or Wage Gap in Lockland?
Income or Wage Gap in Lockland is 29.4%.
Women in Lockland earn 70.6 cents for every dollar earned by a man.
What is Family Income Deficit in Lockland?
Family Income Deficit in Lockland is $12,466.
Families that are below poverty line in Lockland earn $12,466 less on average than the poverty threshold level.
What is Inequality or Gini Index in Lockland?
Inequality or Gini Index in Lockland is 0.42.
What is the Total Population of Lockland?
Total Population of Lockland is 3,497.
What is the Total Male Population of Lockland?
Total Male Population of Lockland is 1,559.
What is the Total Female Population of Lockland?
Total Female Population of Lockland is 1,938.
What is the Ratio of Males per 100 Females in Lockland?
There are 80.44 Males per 100 Females in Lockland.
What is the Ratio of Females per 100 Males in Lockland?
There are 124.31 Females per 100 Males in Lockland.
What is the Median Population Age in Lockland?
Median Population Age in Lockland is 43.7 Years.
What is the Average Family Size in Lockland
Average Family Size in Lockland is 3.0 People.
What is the Average Household Size in Lockland
Average Household Size in Lockland is 2.3 People.
How Large is the Labor Force in Lockland?
There are 1,938 People in the Labor Forcein in Lockland.
What is the Percentage of People in the Labor Force in Lockland?
66.8% of People are in the Labor Force in Lockland.
What is the Unemployment Rate in Lockland?
Unemployment Rate in Lockland is 7.3%.