Northgate, OH Map & Demographics
Northgate Map
Northgate Overview
$40,039
PER CAPITA INCOME
$85,185
AVG FAMILY INCOME
$69,099
AVG HOUSEHOLD INCOME
22.7%
WAGE / INCOME GAP [ % ]
77.3¢/ $1
WAGE / INCOME GAP [ $ ]
0.47
INEQUALITY / GINI INDEX
6,347
TOTAL POPULATION
3,197
MALE POPULATION
3,150
FEMALE POPULATION
101.49
MALES / 100 FEMALES
98.53
FEMALES / 100 MALES
42.8
MEDIAN AGE
2.9
AVG FAMILY SIZE
2.4
AVG HOUSEHOLD SIZE
3,482
LABOR FORCE [ PEOPLE ]
66.7%
PERCENT IN LABOR FORCE
6.3%
UNEMPLOYMENT RATE
Income in Northgate
Income Overview in Northgate
Per Capita Income in Northgate is $40,039, while median incomes of families and households are $85,185 and $69,099 respectively.
| Characteristic | Number | Measure |
| Per Capita Income | 6,347 | $40,039 |
| Median Family Income | 1,766 | $85,185 |
| Mean Family Income | 1,766 | $98,110 |
| Median Household Income | 2,621 | $69,099 |
| Mean Household Income | 2,621 | $96,810 |
| Income Deficit | 1,766 | $0 |
| Wage / Income Gap (%) | 6,347 | 22.74% |
| Wage / Income Gap ($) | 6,347 | 77.26¢ per $1 |
| Gini / Inequality Index | 6,347 | 0.47 |
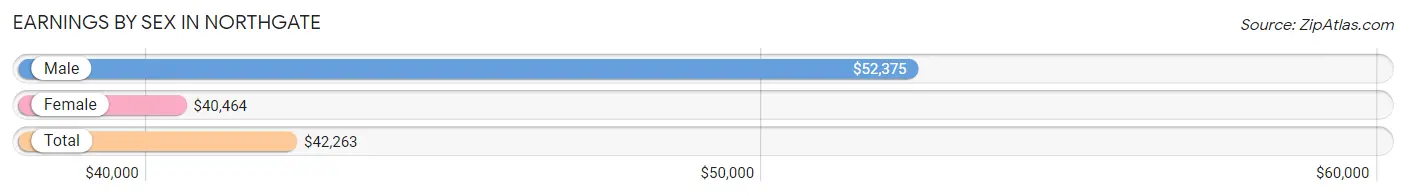
Earnings by Sex in Northgate
Average Earnings in Northgate are $42,263, $52,375 for men and $40,464 for women, a difference of 22.7%.
| Sex | Number | Average Earnings |
| Male | 1,957 (56.6%) | $52,375 |
| Female | 1,502 (43.4%) | $40,464 |
| Total | 3,459 (100.0%) | $42,263 |
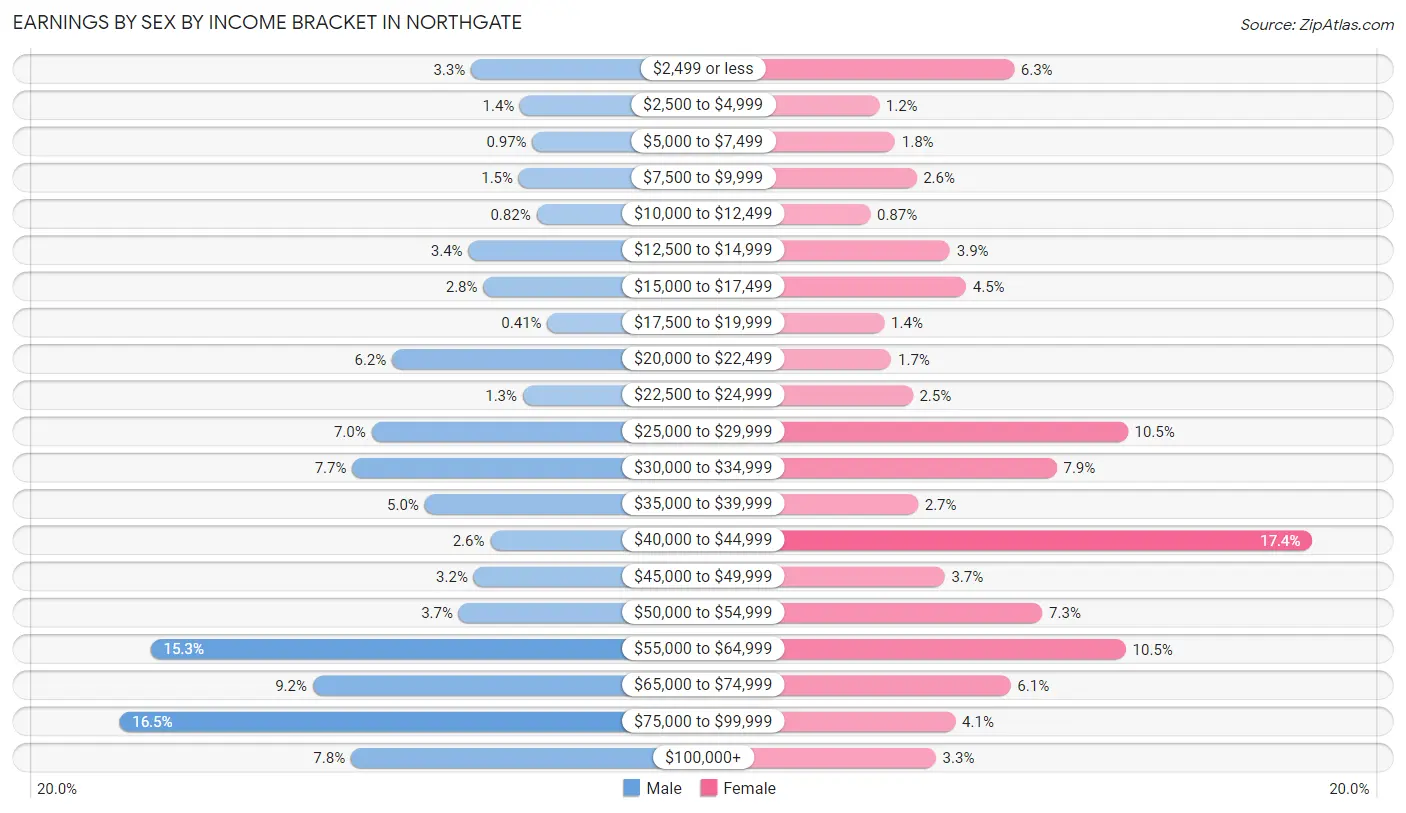
Earnings by Sex by Income Bracket in Northgate
The most common earnings brackets in Northgate are $75,000 to $99,999 for men (322 | 16.5%) and $40,000 to $44,999 for women (262 | 17.4%).
| Income | Male | Female |
| $2,499 or less | 64 (3.3%) | 94 (6.3%) |
| $2,500 to $4,999 | 28 (1.4%) | 18 (1.2%) |
| $5,000 to $7,499 | 19 (1.0%) | 27 (1.8%) |
| $7,500 to $9,999 | 29 (1.5%) | 39 (2.6%) |
| $10,000 to $12,499 | 16 (0.8%) | 13 (0.9%) |
| $12,500 to $14,999 | 66 (3.4%) | 58 (3.9%) |
| $15,000 to $17,499 | 55 (2.8%) | 67 (4.5%) |
| $17,500 to $19,999 | 8 (0.4%) | 21 (1.4%) |
| $20,000 to $22,499 | 122 (6.2%) | 25 (1.7%) |
| $22,500 to $24,999 | 26 (1.3%) | 37 (2.5%) |
| $25,000 to $29,999 | 137 (7.0%) | 158 (10.5%) |
| $30,000 to $34,999 | 151 (7.7%) | 118 (7.9%) |
| $35,000 to $39,999 | 98 (5.0%) | 40 (2.7%) |
| $40,000 to $44,999 | 50 (2.5%) | 262 (17.4%) |
| $45,000 to $49,999 | 62 (3.2%) | 55 (3.7%) |
| $50,000 to $54,999 | 73 (3.7%) | 110 (7.3%) |
| $55,000 to $64,999 | 299 (15.3%) | 157 (10.4%) |
| $65,000 to $74,999 | 180 (9.2%) | 92 (6.1%) |
| $75,000 to $99,999 | 322 (16.5%) | 61 (4.1%) |
| $100,000+ | 152 (7.8%) | 50 (3.3%) |
| Total | 1,957 (100.0%) | 1,502 (100.0%) |
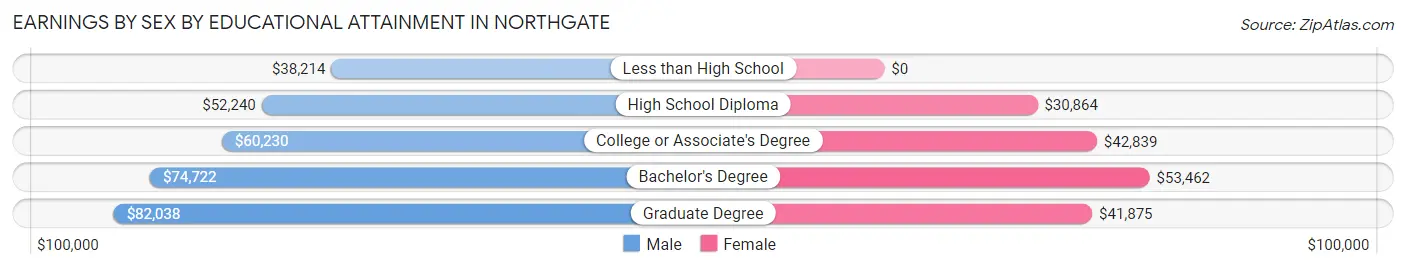
Earnings by Sex by Educational Attainment in Northgate
Average earnings in Northgate are $57,738 for men and $41,128 for women, a difference of 28.8%. Men with an educational attainment of graduate degree enjoy the highest average annual earnings of $82,038, while those with less than high school education earn the least with $38,214. Women with an educational attainment of bachelor's degree earn the most with the average annual earnings of $53,462, while those with high school diploma education have the smallest earnings of $30,864.
| Educational Attainment | Male Income | Female Income |
| Less than High School | $38,214 | $0 |
| High School Diploma | $52,240 | $30,864 |
| College or Associate's Degree | $60,230 | $42,839 |
| Bachelor's Degree | $74,722 | $53,462 |
| Graduate Degree | $82,038 | $41,875 |
| Total | $57,738 | $41,128 |
Family Income in Northgate
Family Income Brackets in Northgate
According to the Northgate family income data, there are 565 families falling into the $100,000 to $149,999 income range, which is the most common income bracket and makes up 32.0% of all families. Conversely, the less than $10,000 income bracket is the least frequent group with only 11 families (0.6%) belonging to this category.
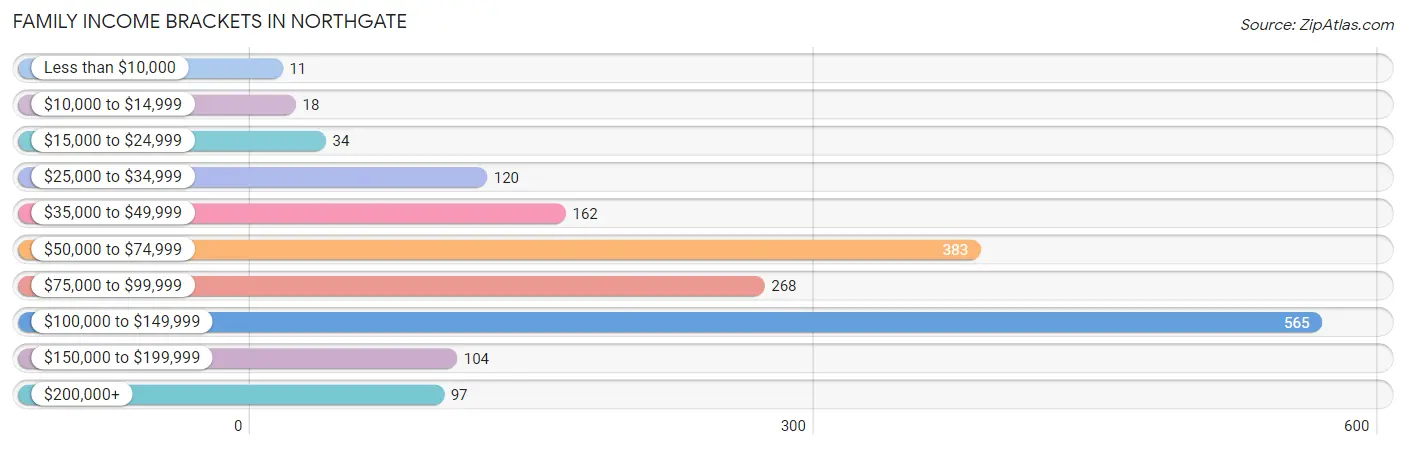
| Income Bracket | # Families | % Families |
| Less than $10,000 | 11 | 0.6% |
| $10,000 to $14,999 | 18 | 1.0% |
| $15,000 to $24,999 | 34 | 1.9% |
| $25,000 to $34,999 | 120 | 6.8% |
| $35,000 to $49,999 | 162 | 9.2% |
| $50,000 to $74,999 | 383 | 21.7% |
| $75,000 to $99,999 | 268 | 15.2% |
| $100,000 to $149,999 | 565 | 32.0% |
| $150,000 to $199,999 | 104 | 5.9% |
| $200,000+ | 97 | 5.5% |
Family Income by Famaliy Size in Northgate
5-person families (87 | 4.9%) account for the highest median family income in Northgate with $126,713 per family, while 2-person families (956 | 54.1%) have the highest median income of $42,500 per family member.
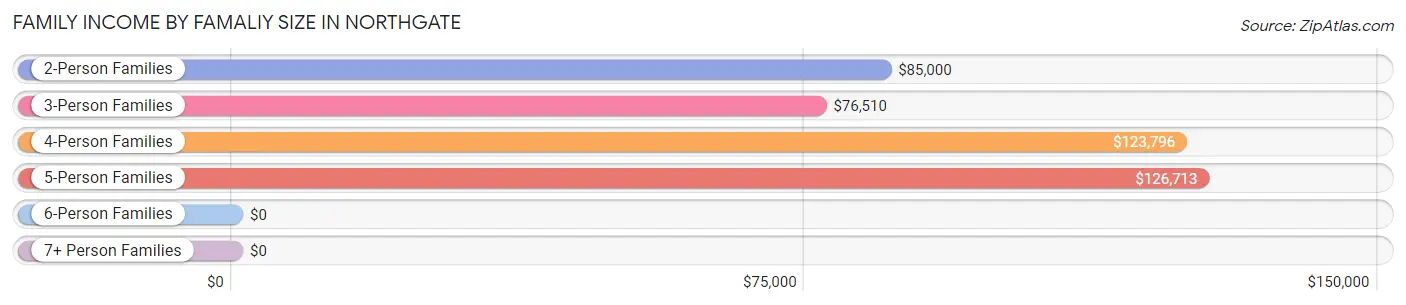
| Income Bracket | # Families | Median Income |
| 2-Person Families | 956 (54.1%) | $85,000 |
| 3-Person Families | 353 (20.0%) | $76,510 |
| 4-Person Families | 358 (20.3%) | $123,796 |
| 5-Person Families | 87 (4.9%) | $126,713 |
| 6-Person Families | 9 (0.5%) | $0 |
| 7+ Person Families | 3 (0.2%) | $0 |
| Total | 1,766 (100.0%) | $85,185 |
Family Income by Number of Earners in Northgate
The median family income in Northgate is $85,185, with families comprising 3+ earners (202) having the highest median family income of $141,932, while families with 1 earner (530) have the lowest median family income of $65,278, accounting for 11.4% and 30.0% of families, respectively.
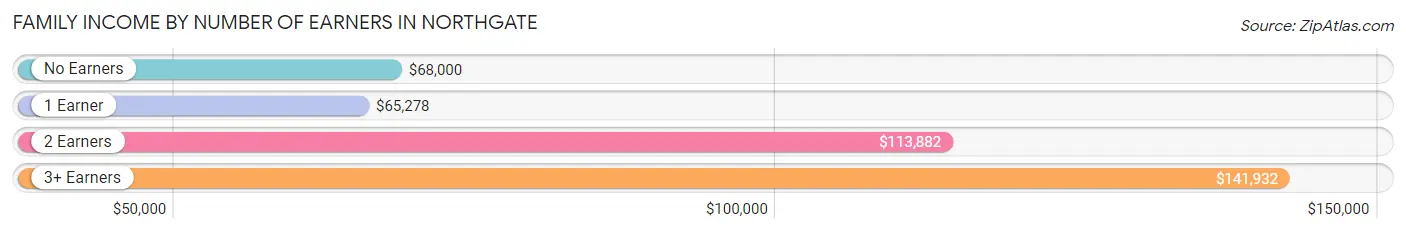
| Number of Earners | # Families | Median Income |
| No Earners | 192 (10.9%) | $68,000 |
| 1 Earner | 530 (30.0%) | $65,278 |
| 2 Earners | 842 (47.7%) | $113,882 |
| 3+ Earners | 202 (11.4%) | $141,932 |
| Total | 1,766 (100.0%) | $85,185 |
Household Income in Northgate
Household Income Brackets in Northgate
With 642 households falling in the category, the $100,000 to $149,999 income range is the most frequent in Northgate, accounting for 24.5% of all households. In contrast, only 58 households (2.2%) fall into the $10,000 to $14,999 income bracket, making it the least populous group.
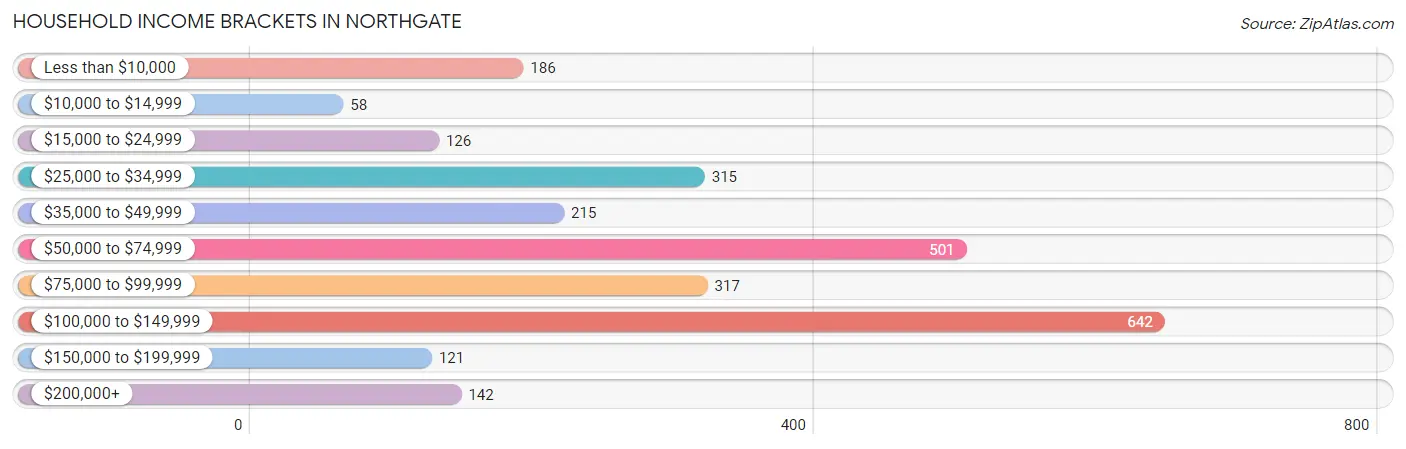
| Income Bracket | # Households | % Households |
| Less than $10,000 | 186 | 7.1% |
| $10,000 to $14,999 | 58 | 2.2% |
| $15,000 to $24,999 | 126 | 4.8% |
| $25,000 to $34,999 | 315 | 12.0% |
| $35,000 to $49,999 | 215 | 8.2% |
| $50,000 to $74,999 | 501 | 19.1% |
| $75,000 to $99,999 | 317 | 12.1% |
| $100,000 to $149,999 | 642 | 24.5% |
| $150,000 to $199,999 | 121 | 4.6% |
| $200,000+ | 142 | 5.4% |
Household Income by Householder Age in Northgate
The median household income in Northgate is $69,099, with the highest median household income of $102,321 found in the 45 to 64 years age bracket for the primary householder. A total of 834 households (31.8%) fall into this category. Meanwhile, the 65+ years age bracket for the primary householder has the lowest median household income of $45,859, with 966 households (36.9%) in this group.
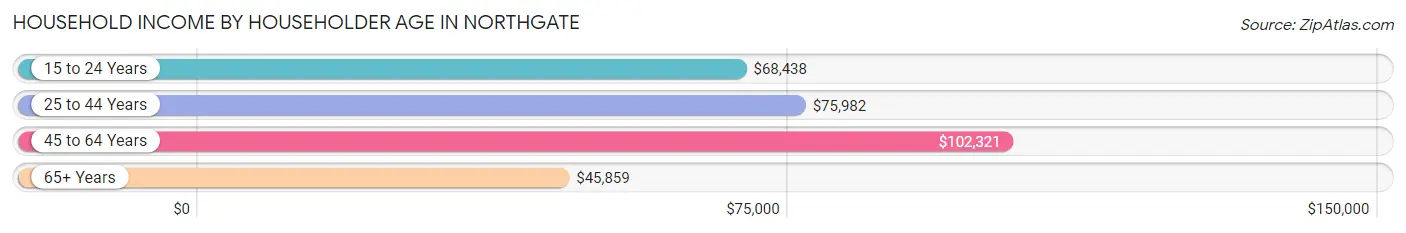
| Income Bracket | # Households | Median Income |
| 15 to 24 Years | 30 (1.1%) | $68,438 |
| 25 to 44 Years | 791 (30.2%) | $75,982 |
| 45 to 64 Years | 834 (31.8%) | $102,321 |
| 65+ Years | 966 (36.9%) | $45,859 |
| Total | 2,621 (100.0%) | $69,099 |
Poverty in Northgate
Income Below Poverty by Sex and Age in Northgate
With 5.7% poverty level for males and 10.9% for females among the residents of Northgate, under 5 year old males and 75 year old and over females are the most vulnerable to poverty, with 25 males (18.7%) and 181 females (52.5%) in their respective age groups living below the poverty level.
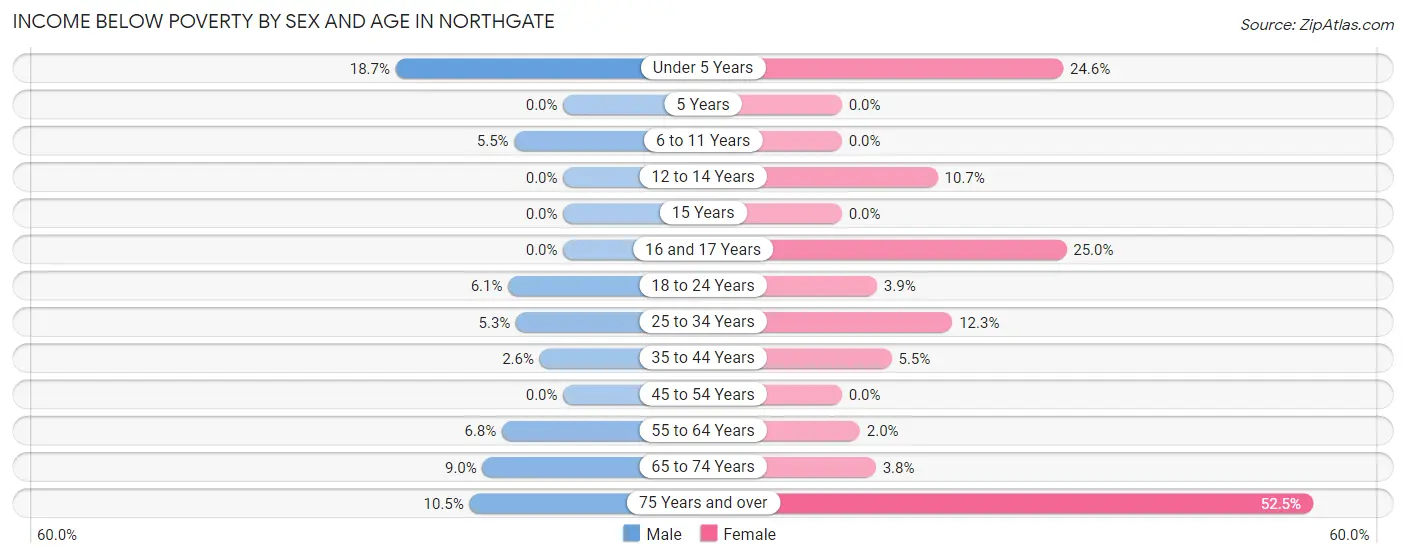
| Age Bracket | Male | Female |
| Under 5 Years | 25 (18.7%) | 17 (24.6%) |
| 5 Years | 0 (0.0%) | 0 (0.0%) |
| 6 to 11 Years | 18 (5.4%) | 0 (0.0%) |
| 12 to 14 Years | 0 (0.0%) | 16 (10.7%) |
| 15 Years | 0 (0.0%) | 0 (0.0%) |
| 16 and 17 Years | 0 (0.0%) | 10 (25.0%) |
| 18 to 24 Years | 16 (6.1%) | 5 (3.9%) |
| 25 to 34 Years | 23 (5.2%) | 54 (12.3%) |
| 35 to 44 Years | 10 (2.6%) | 26 (5.5%) |
| 45 to 54 Years | 0 (0.0%) | 0 (0.0%) |
| 55 to 64 Years | 39 (6.8%) | 9 (2.0%) |
| 65 to 74 Years | 25 (9.0%) | 18 (3.8%) |
| 75 Years and over | 23 (10.4%) | 181 (52.5%) |
| Total | 179 (5.7%) | 336 (10.9%) |
Income Above Poverty by Sex and Age in Northgate
According to the poverty statistics in Northgate, males aged 5 years and females aged 6 to 11 years are the age groups that are most secure financially, with 100.0% of males and 100.0% of females in these age groups living above the poverty line.
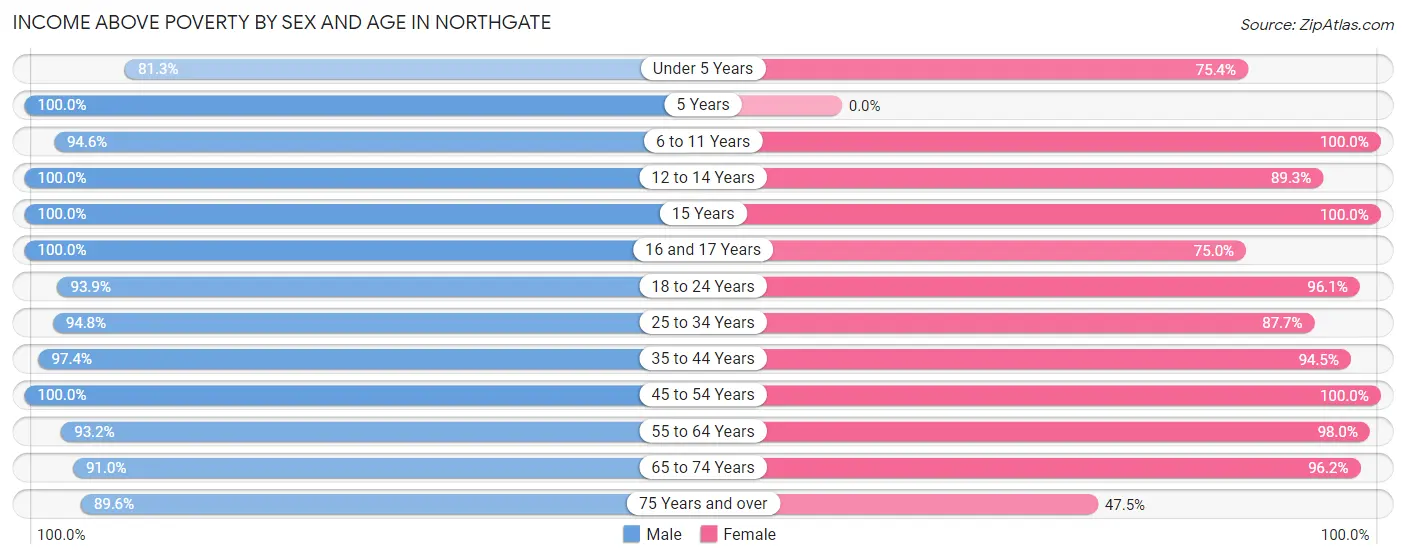
| Age Bracket | Male | Female |
| Under 5 Years | 109 (81.3%) | 52 (75.4%) |
| 5 Years | 48 (100.0%) | 0 (0.0%) |
| 6 to 11 Years | 312 (94.6%) | 186 (100.0%) |
| 12 to 14 Years | 43 (100.0%) | 134 (89.3%) |
| 15 Years | 65 (100.0%) | 46 (100.0%) |
| 16 and 17 Years | 45 (100.0%) | 30 (75.0%) |
| 18 to 24 Years | 245 (93.9%) | 123 (96.1%) |
| 25 to 34 Years | 415 (94.8%) | 385 (87.7%) |
| 35 to 44 Years | 372 (97.4%) | 443 (94.5%) |
| 45 to 54 Years | 305 (100.0%) | 275 (100.0%) |
| 55 to 64 Years | 533 (93.2%) | 439 (98.0%) |
| 65 to 74 Years | 253 (91.0%) | 458 (96.2%) |
| 75 Years and over | 197 (89.5%) | 164 (47.5%) |
| Total | 2,942 (94.3%) | 2,735 (89.1%) |
Income Below Poverty Among Married-Couple Families in Northgate
The poverty statistics for married-couple families in Northgate show that 1.4% or 18 of the total 1,317 families live below the poverty line. Families with no children have the highest poverty rate of 1.9%, comprising of 18 families. On the other hand, families with 1 or 2 children have the lowest poverty rate of 0.0%, which includes 0 families.
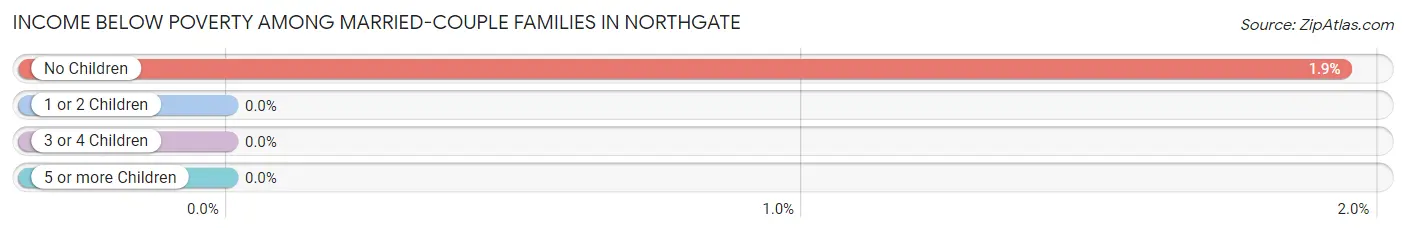
| Children | Above Poverty | Below Poverty |
| No Children | 912 (98.1%) | 18 (1.9%) |
| 1 or 2 Children | 360 (100.0%) | 0 (0.0%) |
| 3 or 4 Children | 27 (100.0%) | 0 (0.0%) |
| 5 or more Children | 0 (0.0%) | 0 (0.0%) |
| Total | 1,299 (98.6%) | 18 (1.4%) |
Income Below Poverty Among Single-Parent Households in Northgate
According to the poverty data in Northgate, 10.8% or 15 single-father households and 7.1% or 22 single-mother households are living below the poverty line. Among single-father households, those with 1 or 2 children have the highest poverty rate, with 9 households (21.4%) experiencing poverty. Likewise, among single-mother households, those with 3 or 4 children have the highest poverty rate, with 17 households (100.0%) falling below the poverty line.
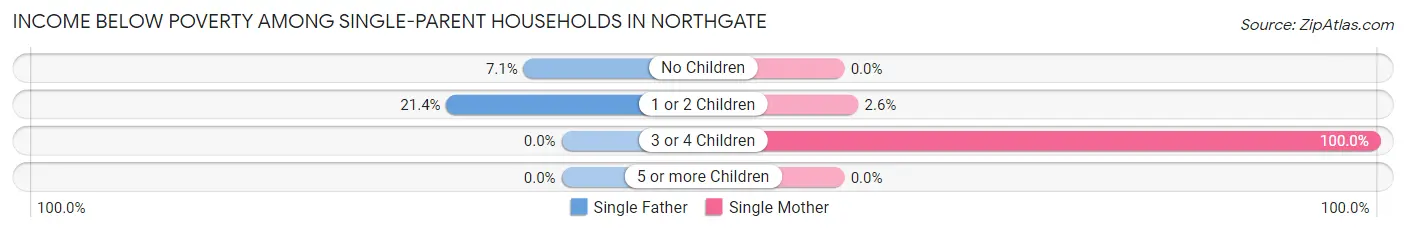
| Children | Single Father | Single Mother |
| No Children | 6 (7.1%) | 0 (0.0%) |
| 1 or 2 Children | 9 (21.4%) | 5 (2.6%) |
| 3 or 4 Children | 0 (0.0%) | 17 (100.0%) |
| 5 or more Children | 0 (0.0%) | 0 (0.0%) |
| Total | 15 (10.8%) | 22 (7.1%) |
Income Below Poverty Among Married-Couple vs Single-Parent Households in Northgate
The poverty data for Northgate shows that 18 of the married-couple family households (1.4%) and 37 of the single-parent households (8.2%) are living below the poverty level. Within the married-couple family households, those with no children have the highest poverty rate, with 18 households (1.9%) falling below the poverty line. Among the single-parent households, those with 3 or 4 children have the highest poverty rate, with 17 household (58.6%) living below poverty.
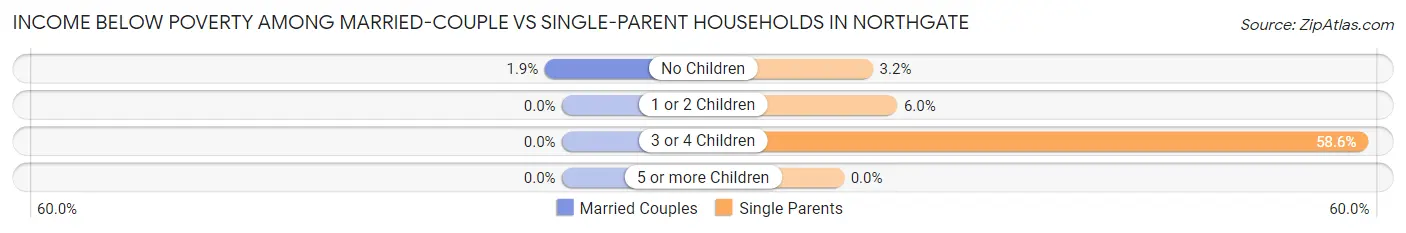
| Children | Married-Couple Families | Single-Parent Households |
| No Children | 18 (1.9%) | 6 (3.2%) |
| 1 or 2 Children | 0 (0.0%) | 14 (6.0%) |
| 3 or 4 Children | 0 (0.0%) | 17 (58.6%) |
| 5 or more Children | 0 (0.0%) | 0 (0.0%) |
| Total | 18 (1.4%) | 37 (8.2%) |
Race in Northgate
The most populous races in Northgate are White / Caucasian (4,423 | 69.7%), Black / African American (1,484 | 23.4%), and Two or more Races (352 | 5.6%).
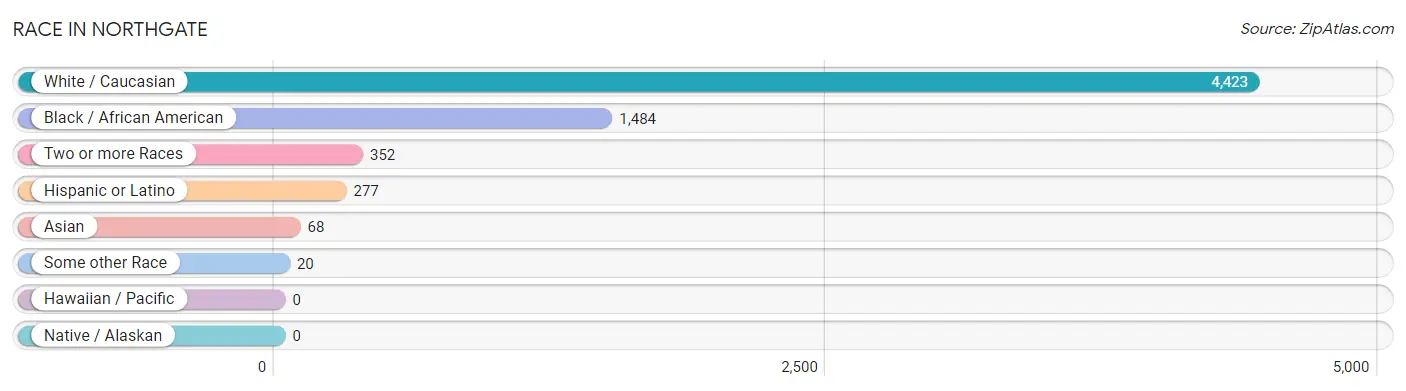
| Race | # Population | % Population |
| Asian | 68 | 1.1% |
| Black / African American | 1,484 | 23.4% |
| Hawaiian / Pacific | 0 | 0.0% |
| Hispanic or Latino | 277 | 4.4% |
| Native / Alaskan | 0 | 0.0% |
| White / Caucasian | 4,423 | 69.7% |
| Two or more Races | 352 | 5.6% |
| Some other Race | 20 | 0.3% |
| Total | 6,347 | 100.0% |
Ancestry in Northgate
The most populous ancestries reported in Northgate are German (1,834 | 28.9%), Irish (805 | 12.7%), English (496 | 7.8%), American (293 | 4.6%), and Central American (132 | 2.1%), together accounting for 56.1% of all Northgate residents.
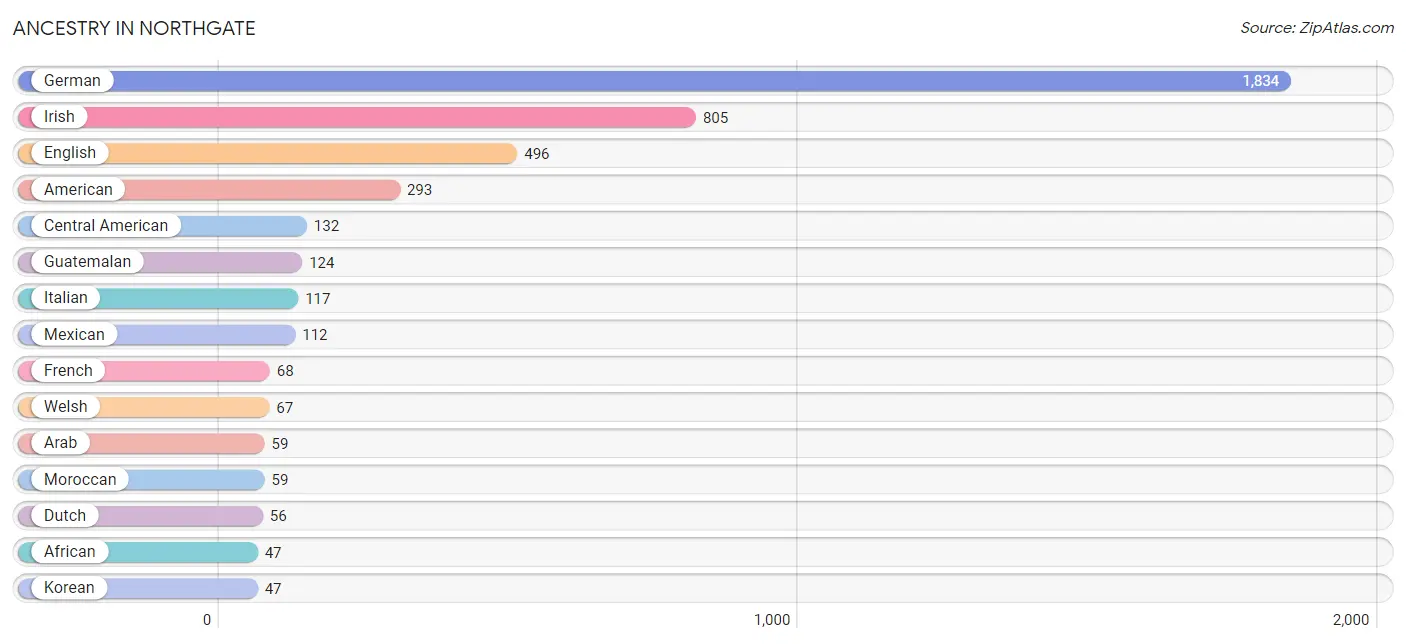
| Ancestry | # Population | % Population |
| African | 47 | 0.7% |
| American | 293 | 4.6% |
| Arab | 59 | 0.9% |
| Austrian | 10 | 0.2% |
| Central American | 132 | 2.1% |
| Cherokee | 17 | 0.3% |
| Dutch | 56 | 0.9% |
| Eastern European | 9 | 0.1% |
| English | 496 | 7.8% |
| European | 23 | 0.4% |
| French | 68 | 1.1% |
| German | 1,834 | 28.9% |
| Greek | 8 | 0.1% |
| Guatemalan | 124 | 1.9% |
| Indian (Asian) | 21 | 0.3% |
| Irish | 805 | 12.7% |
| Italian | 117 | 1.8% |
| Korean | 47 | 0.7% |
| Lithuanian | 32 | 0.5% |
| Mexican | 112 | 1.8% |
| Moroccan | 59 | 0.9% |
| Norwegian | 18 | 0.3% |
| Panamanian | 8 | 0.1% |
| Polish | 34 | 0.5% |
| Puerto Rican | 33 | 0.5% |
| Scandinavian | 24 | 0.4% |
| Scotch-Irish | 43 | 0.7% |
| Scottish | 40 | 0.6% |
| Subsaharan African | 47 | 0.7% |
| Tlingit-Haida | 3 | 0.1% |
| Welsh | 67 | 1.1% | View All 31 Rows |
Immigrants in Northgate
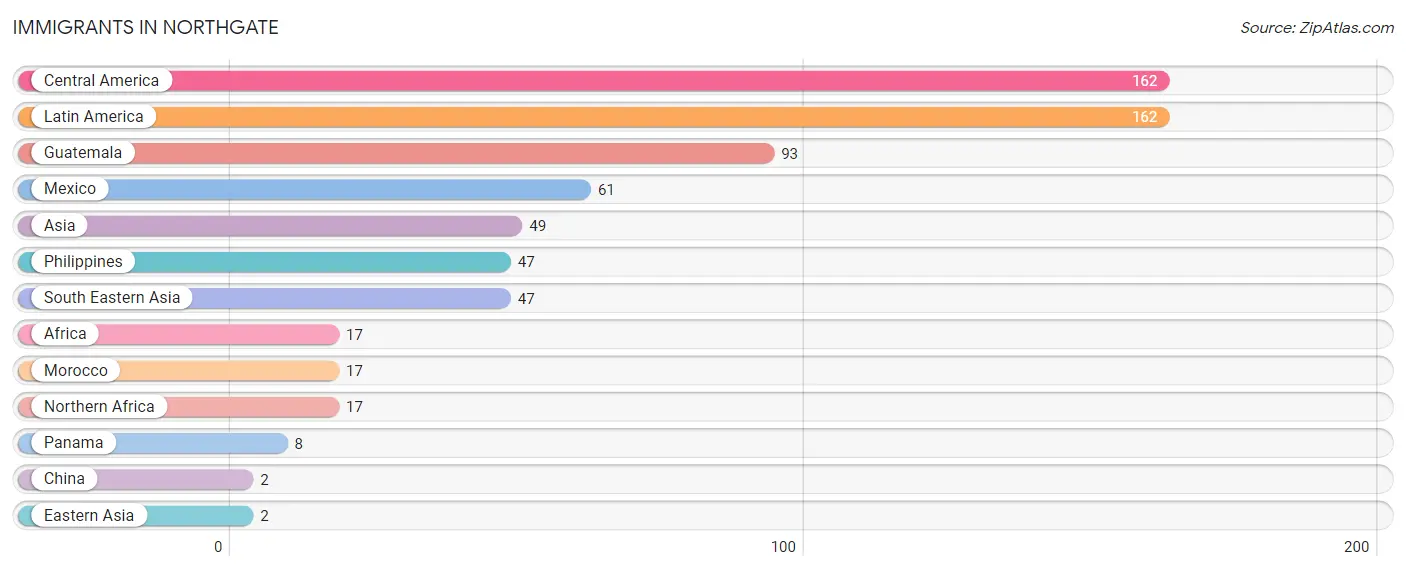
The most numerous immigrant groups reported in Northgate came from Central America (162 | 2.5%), Latin America (162 | 2.5%), Guatemala (93 | 1.5%), Mexico (61 | 1.0%), and Asia (49 | 0.8%), together accounting for 8.3% of all Northgate residents.
| Immigration Origin | # Population | % Population |
| Africa | 17 | 0.3% |
| Asia | 49 | 0.8% |
| Central America | 162 | 2.5% |
| China | 2 | 0.0% |
| Eastern Asia | 2 | 0.0% |
| Guatemala | 93 | 1.5% |
| Latin America | 162 | 2.5% |
| Mexico | 61 | 1.0% |
| Morocco | 17 | 0.3% |
| Northern Africa | 17 | 0.3% |
| Panama | 8 | 0.1% |
| Philippines | 47 | 0.7% |
| South Eastern Asia | 47 | 0.7% | View All 13 Rows |
Sex and Age in Northgate
Sex and Age in Northgate
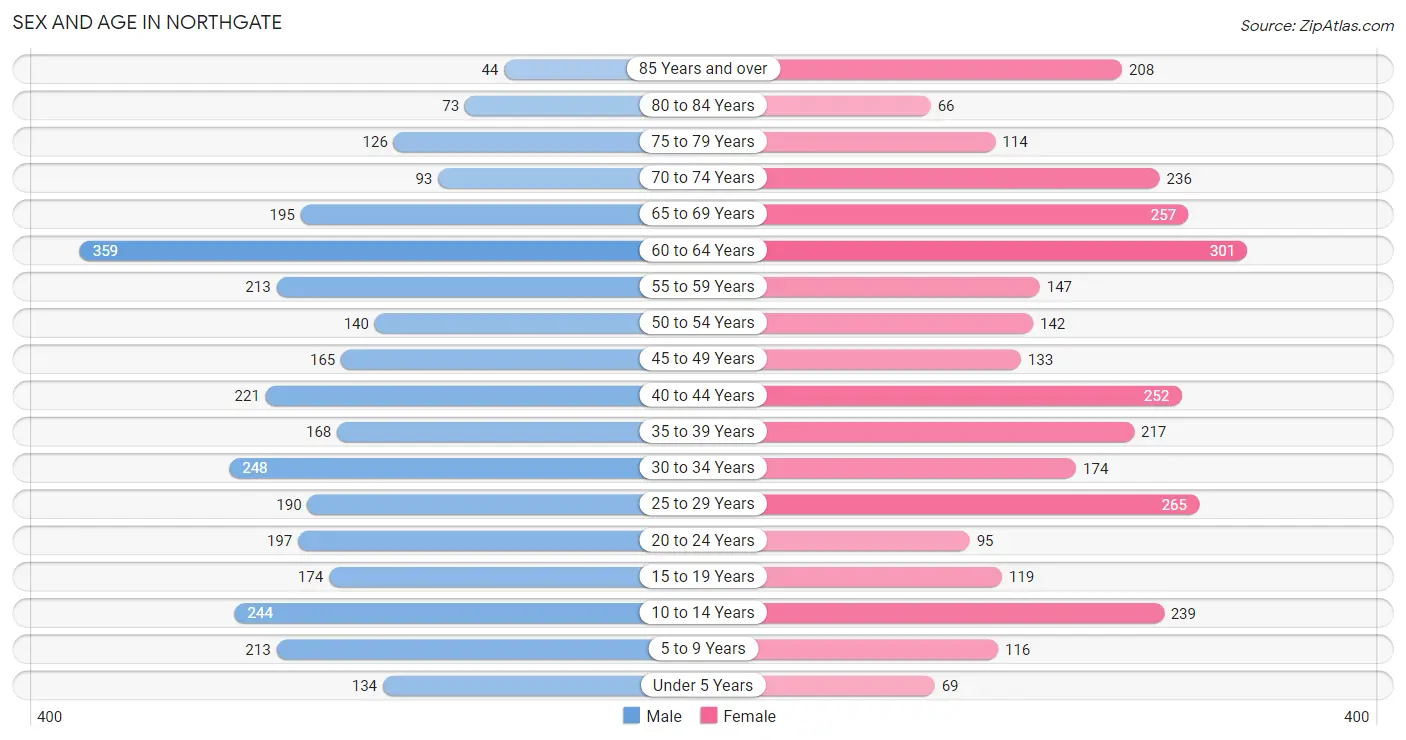
The most populous age groups in Northgate are 60 to 64 Years (359 | 11.2%) for men and 60 to 64 Years (301 | 9.6%) for women.
| Age Bracket | Male | Female |
| Under 5 Years | 134 (4.2%) | 69 (2.2%) |
| 5 to 9 Years | 213 (6.7%) | 116 (3.7%) |
| 10 to 14 Years | 244 (7.6%) | 239 (7.6%) |
| 15 to 19 Years | 174 (5.4%) | 119 (3.8%) |
| 20 to 24 Years | 197 (6.2%) | 95 (3.0%) |
| 25 to 29 Years | 190 (5.9%) | 265 (8.4%) |
| 30 to 34 Years | 248 (7.8%) | 174 (5.5%) |
| 35 to 39 Years | 168 (5.2%) | 217 (6.9%) |
| 40 to 44 Years | 221 (6.9%) | 252 (8.0%) |
| 45 to 49 Years | 165 (5.2%) | 133 (4.2%) |
| 50 to 54 Years | 140 (4.4%) | 142 (4.5%) |
| 55 to 59 Years | 213 (6.7%) | 147 (4.7%) |
| 60 to 64 Years | 359 (11.2%) | 301 (9.6%) |
| 65 to 69 Years | 195 (6.1%) | 257 (8.2%) |
| 70 to 74 Years | 93 (2.9%) | 236 (7.5%) |
| 75 to 79 Years | 126 (3.9%) | 114 (3.6%) |
| 80 to 84 Years | 73 (2.3%) | 66 (2.1%) |
| 85 Years and over | 44 (1.4%) | 208 (6.6%) |
| Total | 3,197 (100.0%) | 3,150 (100.0%) |
Families and Households in Northgate
Median Family Size in Northgate
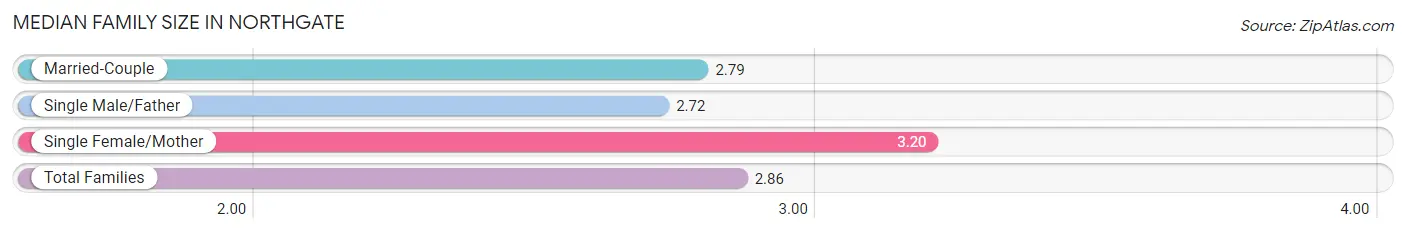
The median family size in Northgate is 2.86 persons per family, with single female/mother families (310 | 17.5%) accounting for the largest median family size of 3.2 persons per family. On the other hand, single male/father families (139 | 7.9%) represent the smallest median family size with 2.72 persons per family.
| Family Type | # Families | Family Size |
| Married-Couple | 1,317 (74.6%) | 2.79 |
| Single Male/Father | 139 (7.9%) | 2.72 |
| Single Female/Mother | 310 (17.5%) | 3.20 |
| Total Families | 1,766 (100.0%) | 2.86 |
Median Household Size in Northgate
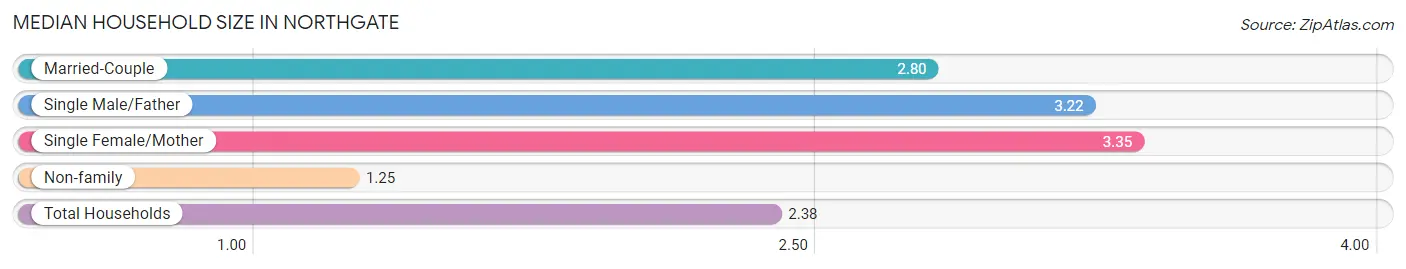
The median household size in Northgate is 2.38 persons per household, with single female/mother households (310 | 11.8%) accounting for the largest median household size of 3.35 persons per household. non-family households (855 | 32.6%) represent the smallest median household size with 1.25 persons per household.
| Household Type | # Households | Household Size |
| Married-Couple | 1,317 (50.2%) | 2.80 |
| Single Male/Father | 139 (5.3%) | 3.22 |
| Single Female/Mother | 310 (11.8%) | 3.35 |
| Non-family | 855 (32.6%) | 1.25 |
| Total Households | 2,621 (100.0%) | 2.38 |
Household Size by Marriage Status in Northgate
Out of a total of 2,621 households in Northgate, 1,766 (67.4%) are family households, while 855 (32.6%) are nonfamily households. The most numerous type of family households are 2-person households, comprising 912, and the most common type of nonfamily households are 1-person households, comprising 688.
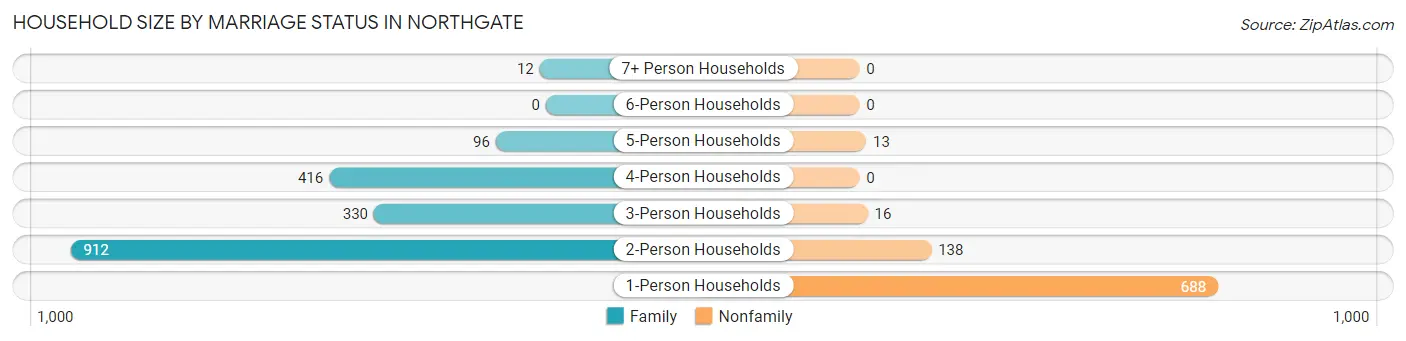
| Household Size | Family Households | Nonfamily Households |
| 1-Person Households | - | 688 (26.3%) |
| 2-Person Households | 912 (34.8%) | 138 (5.3%) |
| 3-Person Households | 330 (12.6%) | 16 (0.6%) |
| 4-Person Households | 416 (15.9%) | 0 (0.0%) |
| 5-Person Households | 96 (3.7%) | 13 (0.5%) |
| 6-Person Households | 0 (0.0%) | 0 (0.0%) |
| 7+ Person Households | 12 (0.5%) | 0 (0.0%) |
| Total | 1,766 (67.4%) | 855 (32.6%) |
Female Fertility in Northgate
Fertility by Age in Northgate
Average fertility rate in Northgate is 60.0 births per 1,000 women. Women in the age bracket of 20 to 34 years have the highest fertility rate with 146.0 births per 1,000 women. Women in the age bracket of 20 to 34 years acount for 100.0% of all women with births.
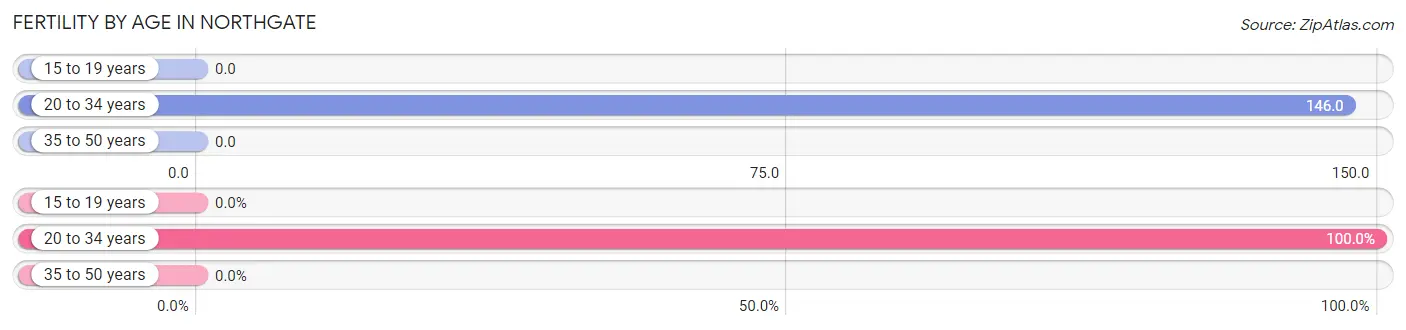
| Age Bracket | Women with Births | Births / 1,000 Women |
| 15 to 19 years | 0 (0.0%) | 0.0 |
| 20 to 34 years | 78 (100.0%) | 146.0 |
| 35 to 50 years | 0 (0.0%) | 0.0 |
| Total | 78 (100.0%) | 60.0 |
Fertility by Age by Marriage Status in Northgate
88.5% of women with births (78) in Northgate are married. The highest percentage of unmarried women with births falls into 20 to 34 years age bracket with 11.5% of them unmarried at the time of birth, while the lowest percentage of unmarried women with births belong to 20 to 34 years age bracket with 11.5% of them unmarried.
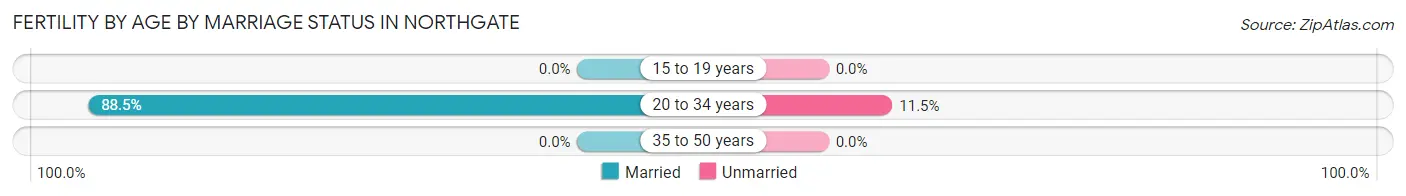
| Age Bracket | Married | Unmarried |
| 15 to 19 years | 0 (0.0%) | 0 (0.0%) |
| 20 to 34 years | 69 (88.5%) | 9 (11.5%) |
| 35 to 50 years | 0 (0.0%) | 0 (0.0%) |
| Total | 69 (88.5%) | 9 (11.5%) |
Fertility by Education in Northgate
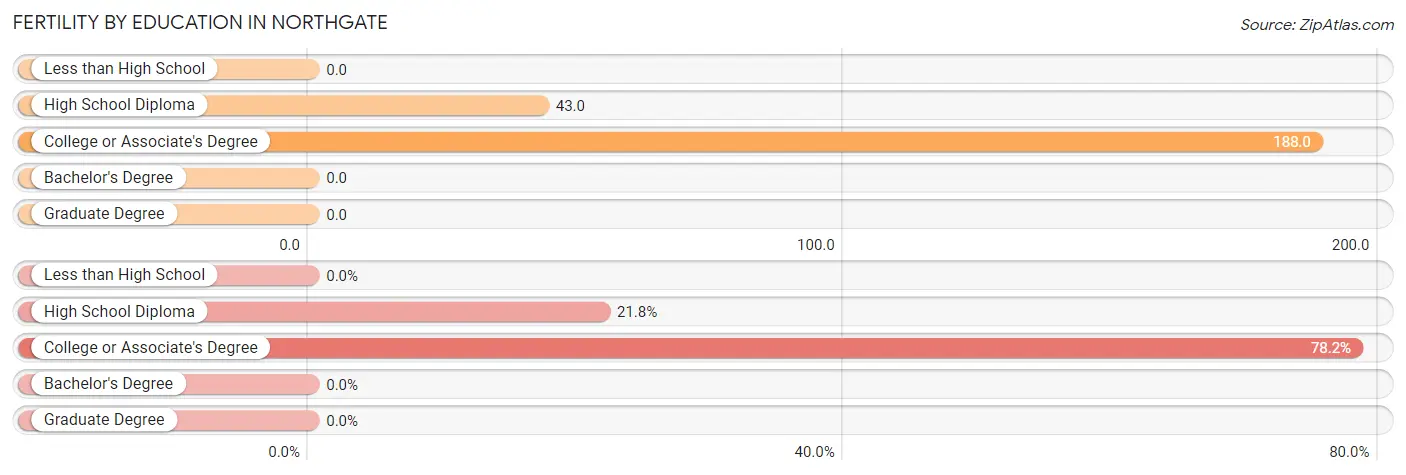
| Educational Attainment | Women with Births | Births / 1,000 Women |
| Less than High School | 0 (0.0%) | 0.0 |
| High School Diploma | 17 (21.8%) | 43.0 |
| College or Associate's Degree | 61 (78.2%) | 188.0 |
| Bachelor's Degree | 0 (0.0%) | 0.0 |
| Graduate Degree | 0 (0.0%) | 0.0 |
| Total | 78 (100.0%) | 60.0 |
Fertility by Education by Marriage Status in Northgate
11.5% of women with births in Northgate are unmarried. Women with the educational attainment of high school diploma are most likely to be married with 100.0% of them married at childbirth, while women with the educational attainment of college or associate's degree are least likely to be married with 14.7% of them unmarried at childbirth.
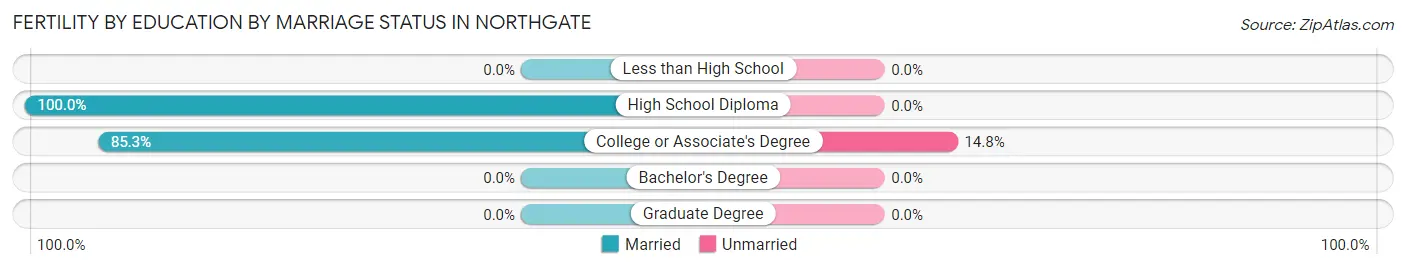
| Educational Attainment | Married | Unmarried |
| Less than High School | 0 (0.0%) | 0 (0.0%) |
| High School Diploma | 17 (100.0%) | 0 (0.0%) |
| College or Associate's Degree | 52 (85.3%) | 9 (14.7%) |
| Bachelor's Degree | 0 (0.0%) | 0 (0.0%) |
| Graduate Degree | 0 (0.0%) | 0 (0.0%) |
| Total | 69 (88.5%) | 9 (11.5%) |
Employment Characteristics in Northgate
Employment by Class of Employer in Northgate
Among the 3,215 employed individuals in Northgate, private company employees (2,361 | 73.4%), not-for-profit organizations (428 | 13.3%), and self-employed (not incorporated) (164 | 5.1%) make up the most common classes of employment.
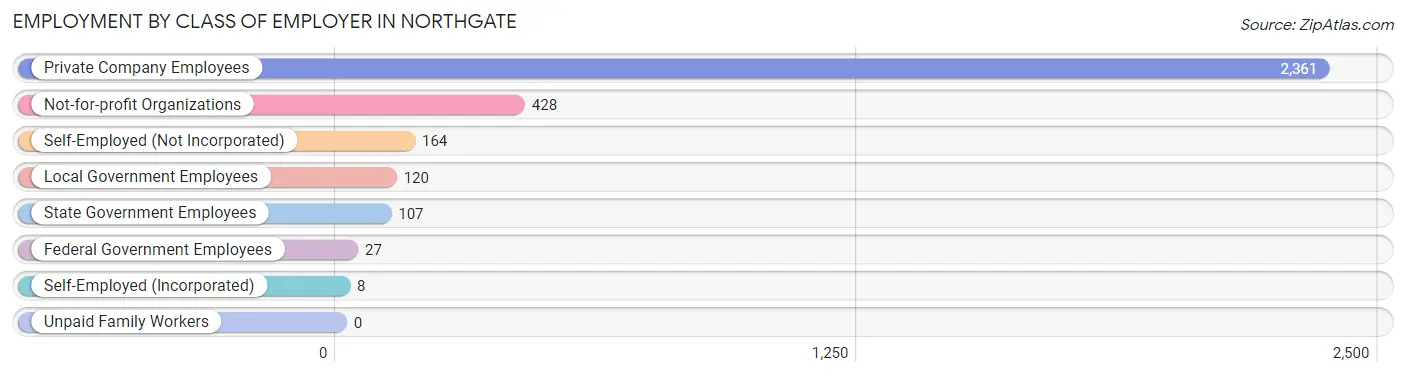
| Employer Class | # Employees | % Employees |
| Private Company Employees | 2,361 | 73.4% |
| Self-Employed (Incorporated) | 8 | 0.3% |
| Self-Employed (Not Incorporated) | 164 | 5.1% |
| Not-for-profit Organizations | 428 | 13.3% |
| Local Government Employees | 120 | 3.7% |
| State Government Employees | 107 | 3.3% |
| Federal Government Employees | 27 | 0.8% |
| Unpaid Family Workers | 0 | 0.0% |
| Total | 3,215 | 100.0% |
Employment Status by Age in Northgate
According to the labor force statistics for Northgate, out of the total population over 16 years of age (5,221), 66.7% or 3,482 individuals are in the labor force, with 6.3% or 219 of them unemployed. The age group with the highest labor force participation rate is 45 to 54 years, with 94.1% or 546 individuals in the labor force. Within the labor force, the 16 to 19 years age range has the highest percentage of unemployed individuals, with 37.0% or 54 of them being unemployed.
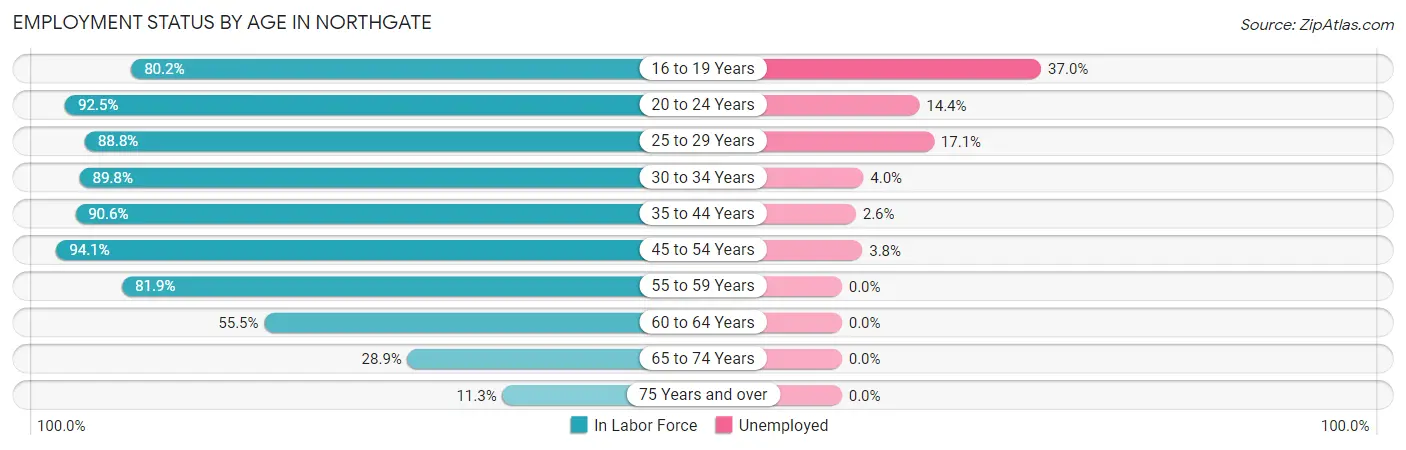
| Age Bracket | In Labor Force | Unemployed |
| 16 to 19 Years | 146 (80.2%) | 54 (37.0%) |
| 20 to 24 Years | 270 (92.5%) | 39 (14.4%) |
| 25 to 29 Years | 404 (88.8%) | 69 (17.1%) |
| 30 to 34 Years | 379 (89.8%) | 15 (4.0%) |
| 35 to 44 Years | 777 (90.6%) | 20 (2.6%) |
| 45 to 54 Years | 546 (94.1%) | 21 (3.8%) |
| 55 to 59 Years | 295 (81.9%) | 0 (0.0%) |
| 60 to 64 Years | 366 (55.5%) | 0 (0.0%) |
| 65 to 74 Years | 226 (28.9%) | 0 (0.0%) |
| 75 Years and over | 71 (11.3%) | 0 (0.0%) |
| Total | 3,482 (66.7%) | 219 (6.3%) |
Employment Status by Educational Attainment in Northgate
According to labor force statistics for Northgate, 83.0% of individuals (2,768) out of the total population between 25 and 64 years of age (3,335) are in the labor force, with 4.5% or 125 of them being unemployed. The group with the highest labor force participation rate are those with the educational attainment of bachelor's degree or higher, with 93.6% or 731 individuals in the labor force. Within the labor force, individuals with less than high school education have the highest percentage of unemployment, with 9.2% or 17 of them being unemployed.
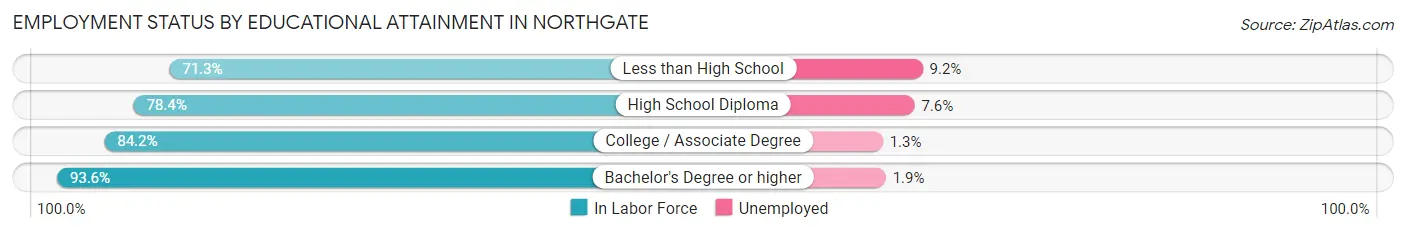
| Educational Attainment | In Labor Force | Unemployed |
| Less than High School | 184 (71.3%) | 24 (9.2%) |
| High School Diploma | 1,102 (78.4%) | 107 (7.6%) |
| College / Associate Degree | 750 (84.2%) | 12 (1.3%) |
| Bachelor's Degree or higher | 731 (93.6%) | 15 (1.9%) |
| Total | 2,768 (83.0%) | 150 (4.5%) |
Employment Occupations by Sex in Northgate
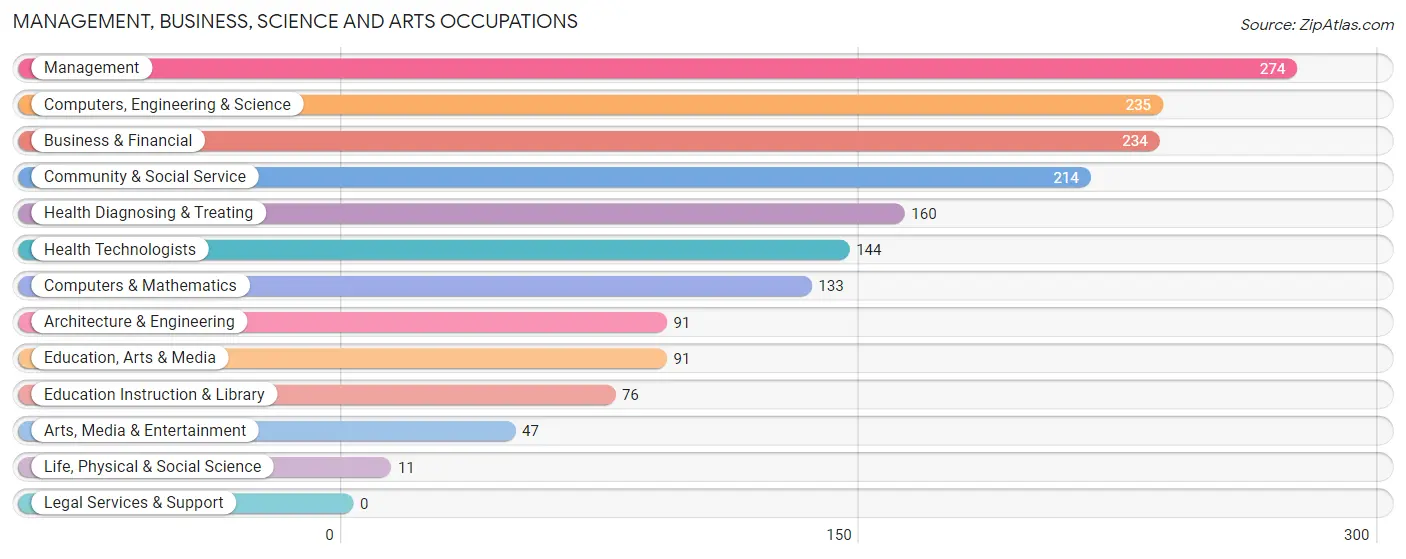
Management, Business, Science and Arts Occupations
The most common Management, Business, Science and Arts occupations in Northgate are Management (274 | 8.4%), Computers, Engineering & Science (235 | 7.2%), Business & Financial (234 | 7.2%), Community & Social Service (214 | 6.6%), and Health Diagnosing & Treating (160 | 4.9%).
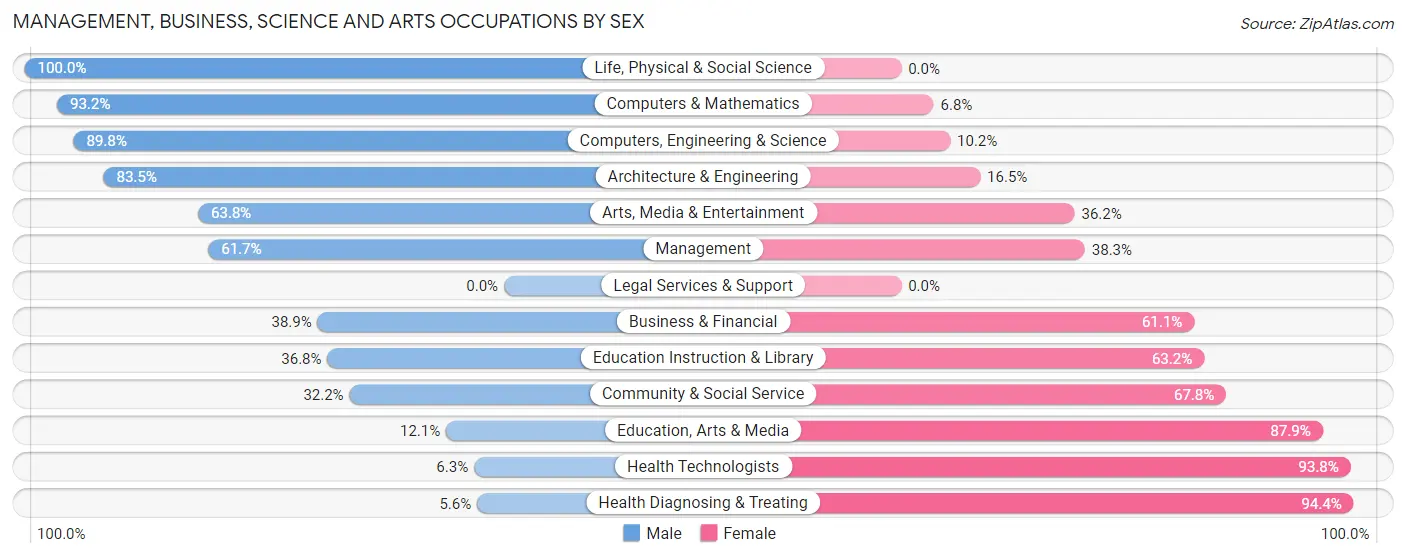
Management, Business, Science and Arts Occupations by Sex
Within the Management, Business, Science and Arts occupations in Northgate, the most male-oriented occupations are Life, Physical & Social Science (100.0%), Computers & Mathematics (93.2%), and Computers, Engineering & Science (89.8%), while the most female-oriented occupations are Health Diagnosing & Treating (94.4%), Health Technologists (93.8%), and Education, Arts & Media (87.9%).
| Occupation | Male | Female |
| Management | 169 (61.7%) | 105 (38.3%) |
| Business & Financial | 91 (38.9%) | 143 (61.1%) |
| Computers, Engineering & Science | 211 (89.8%) | 24 (10.2%) |
| Computers & Mathematics | 124 (93.2%) | 9 (6.8%) |
| Architecture & Engineering | 76 (83.5%) | 15 (16.5%) |
| Life, Physical & Social Science | 11 (100.0%) | 0 (0.0%) |
| Community & Social Service | 69 (32.2%) | 145 (67.8%) |
| Education, Arts & Media | 11 (12.1%) | 80 (87.9%) |
| Legal Services & Support | 0 (0.0%) | 0 (0.0%) |
| Education Instruction & Library | 28 (36.8%) | 48 (63.2%) |
| Arts, Media & Entertainment | 30 (63.8%) | 17 (36.2%) |
| Health Diagnosing & Treating | 9 (5.6%) | 151 (94.4%) |
| Health Technologists | 9 (6.2%) | 135 (93.8%) |
| Total (Category) | 549 (49.1%) | 568 (50.8%) |
| Total (Overall) | 1,875 (57.5%) | 1,387 (42.5%) |
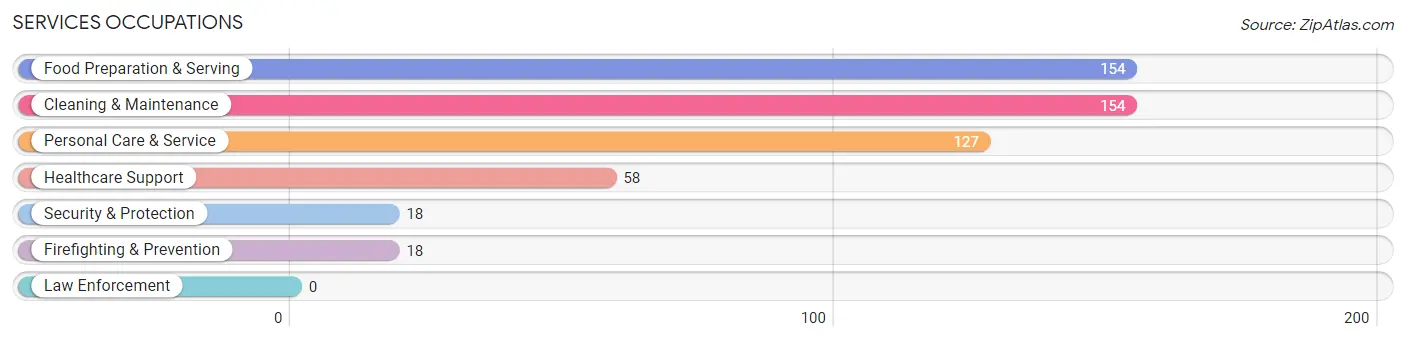
Services Occupations
The most common Services occupations in Northgate are Food Preparation & Serving (154 | 4.7%), Cleaning & Maintenance (154 | 4.7%), Personal Care & Service (127 | 3.9%), Healthcare Support (58 | 1.8%), and Security & Protection (18 | 0.5%).
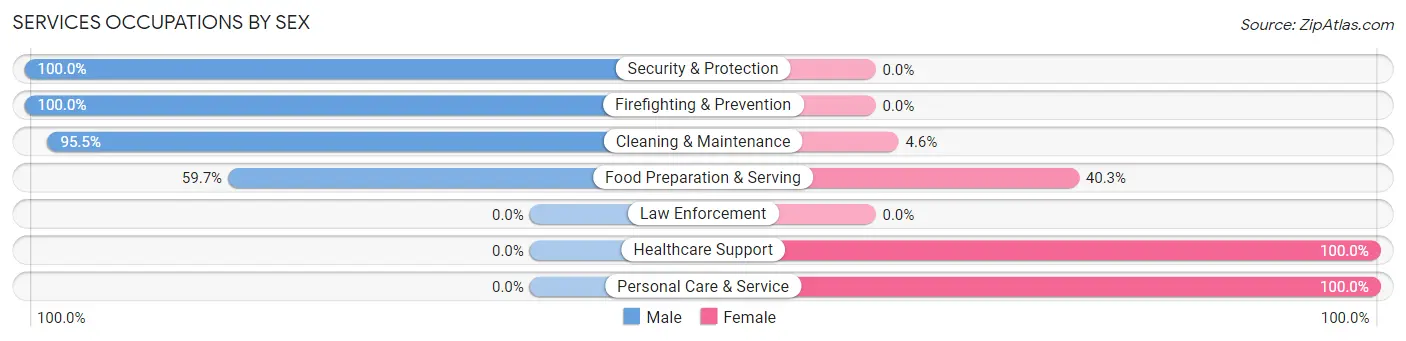
Services Occupations by Sex
Within the Services occupations in Northgate, the most male-oriented occupations are Security & Protection (100.0%), Firefighting & Prevention (100.0%), and Cleaning & Maintenance (95.5%), while the most female-oriented occupations are Healthcare Support (100.0%), Personal Care & Service (100.0%), and Food Preparation & Serving (40.3%).
| Occupation | Male | Female |
| Healthcare Support | 0 (0.0%) | 58 (100.0%) |
| Security & Protection | 18 (100.0%) | 0 (0.0%) |
| Firefighting & Prevention | 18 (100.0%) | 0 (0.0%) |
| Law Enforcement | 0 (0.0%) | 0 (0.0%) |
| Food Preparation & Serving | 92 (59.7%) | 62 (40.3%) |
| Cleaning & Maintenance | 147 (95.5%) | 7 (4.5%) |
| Personal Care & Service | 0 (0.0%) | 127 (100.0%) |
| Total (Category) | 257 (50.3%) | 254 (49.7%) |
| Total (Overall) | 1,875 (57.5%) | 1,387 (42.5%) |
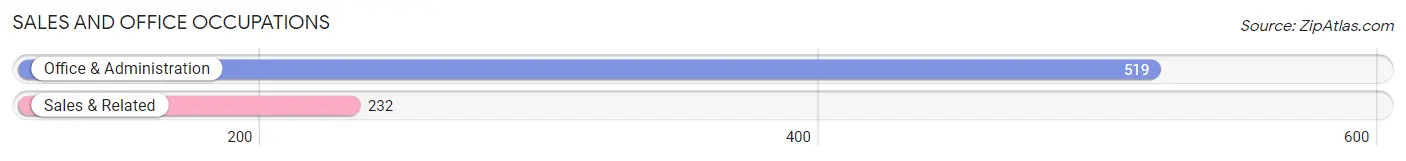
Sales and Office Occupations
The most common Sales and Office occupations in Northgate are Office & Administration (519 | 15.9%), and Sales & Related (232 | 7.1%).
Sales and Office Occupations by Sex
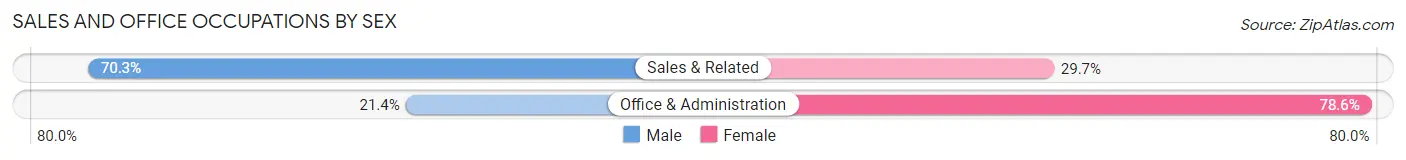
| Occupation | Male | Female |
| Sales & Related | 163 (70.3%) | 69 (29.7%) |
| Office & Administration | 111 (21.4%) | 408 (78.6%) |
| Total (Category) | 274 (36.5%) | 477 (63.5%) |
| Total (Overall) | 1,875 (57.5%) | 1,387 (42.5%) |
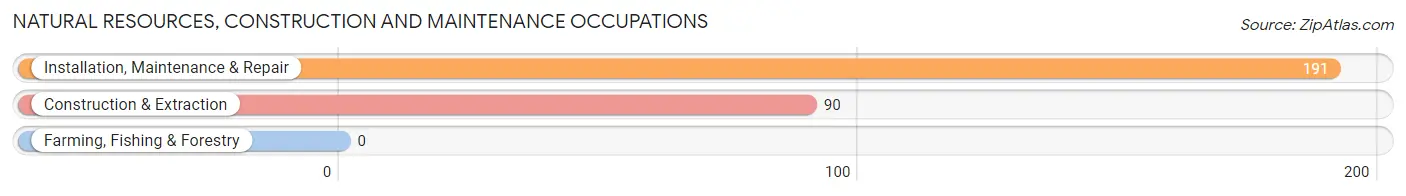
Natural Resources, Construction and Maintenance Occupations
The most common Natural Resources, Construction and Maintenance occupations in Northgate are Installation, Maintenance & Repair (191 | 5.9%), and Construction & Extraction (90 | 2.8%).
Natural Resources, Construction and Maintenance Occupations by Sex
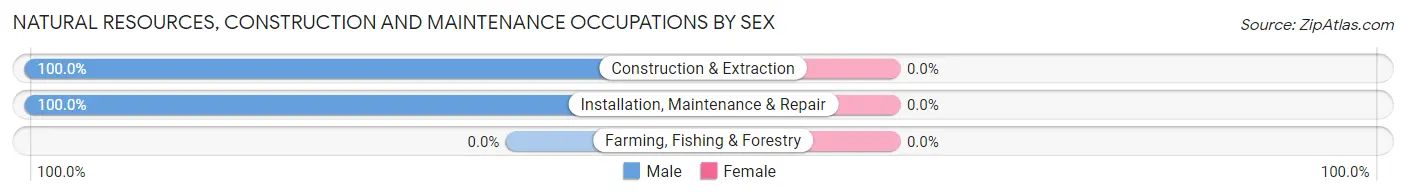
| Occupation | Male | Female |
| Farming, Fishing & Forestry | 0 (0.0%) | 0 (0.0%) |
| Construction & Extraction | 90 (100.0%) | 0 (0.0%) |
| Installation, Maintenance & Repair | 191 (100.0%) | 0 (0.0%) |
| Total (Category) | 281 (100.0%) | 0 (0.0%) |
| Total (Overall) | 1,875 (57.5%) | 1,387 (42.5%) |
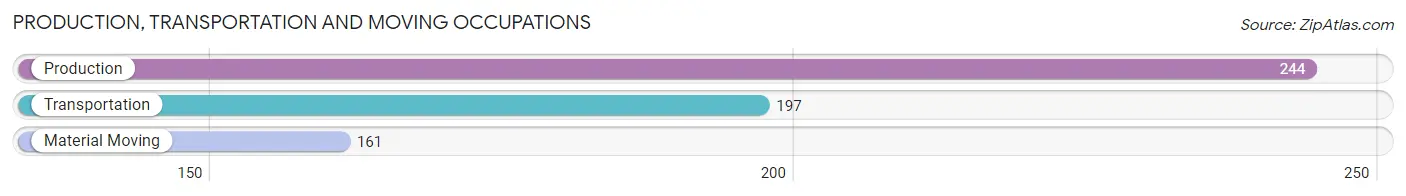
Production, Transportation and Moving Occupations
The most common Production, Transportation and Moving occupations in Northgate are Production (244 | 7.5%), Transportation (197 | 6.0%), and Material Moving (161 | 4.9%).
Production, Transportation and Moving Occupations by Sex
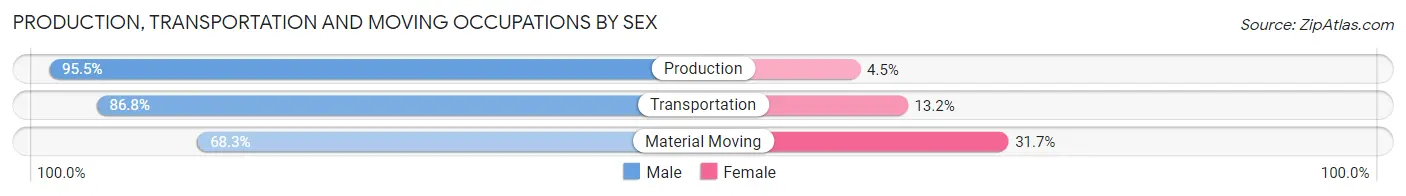
| Occupation | Male | Female |
| Production | 233 (95.5%) | 11 (4.5%) |
| Transportation | 171 (86.8%) | 26 (13.2%) |
| Material Moving | 110 (68.3%) | 51 (31.7%) |
| Total (Category) | 514 (85.4%) | 88 (14.6%) |
| Total (Overall) | 1,875 (57.5%) | 1,387 (42.5%) |
Employment Industries by Sex in Northgate
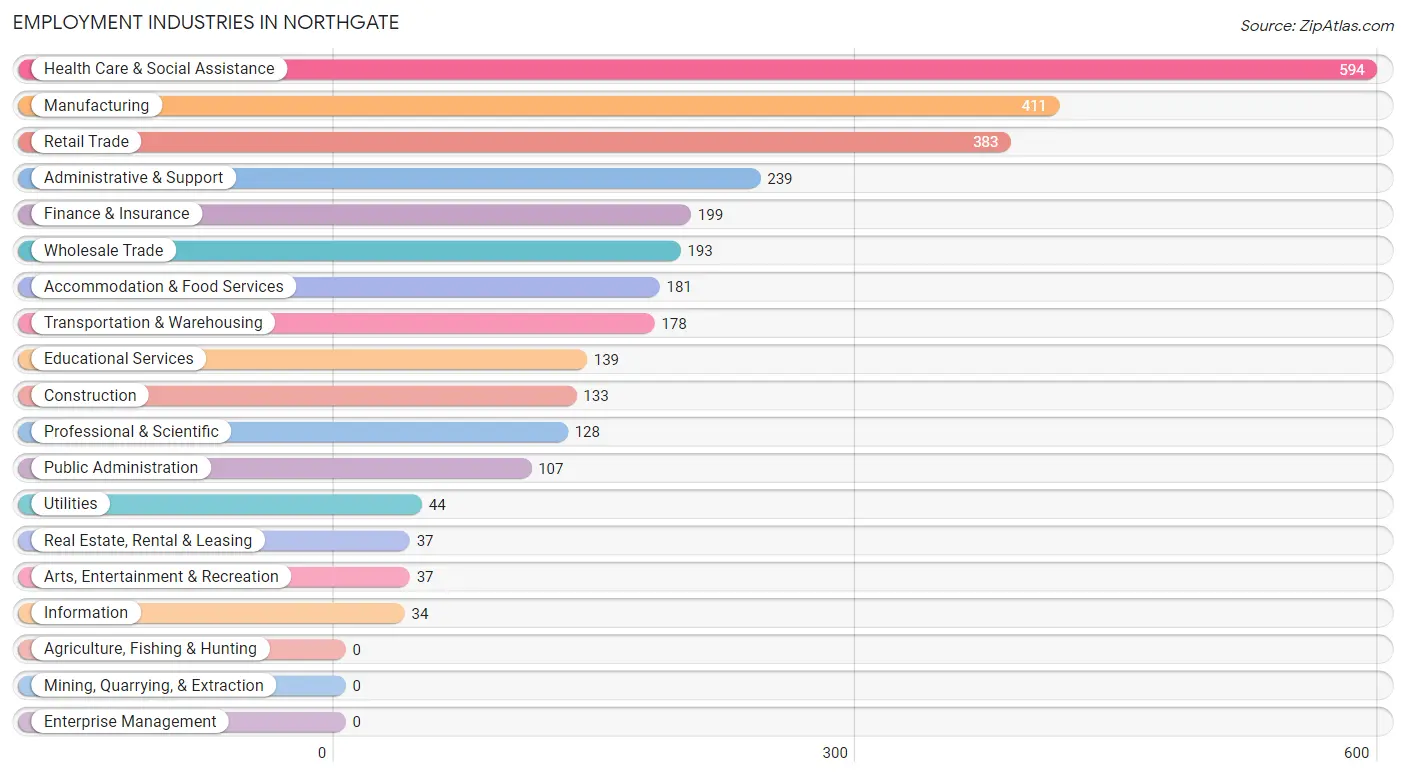
Employment Industries in Northgate
The major employment industries in Northgate include Health Care & Social Assistance (594 | 18.2%), Manufacturing (411 | 12.6%), Retail Trade (383 | 11.7%), Administrative & Support (239 | 7.3%), and Finance & Insurance (199 | 6.1%).
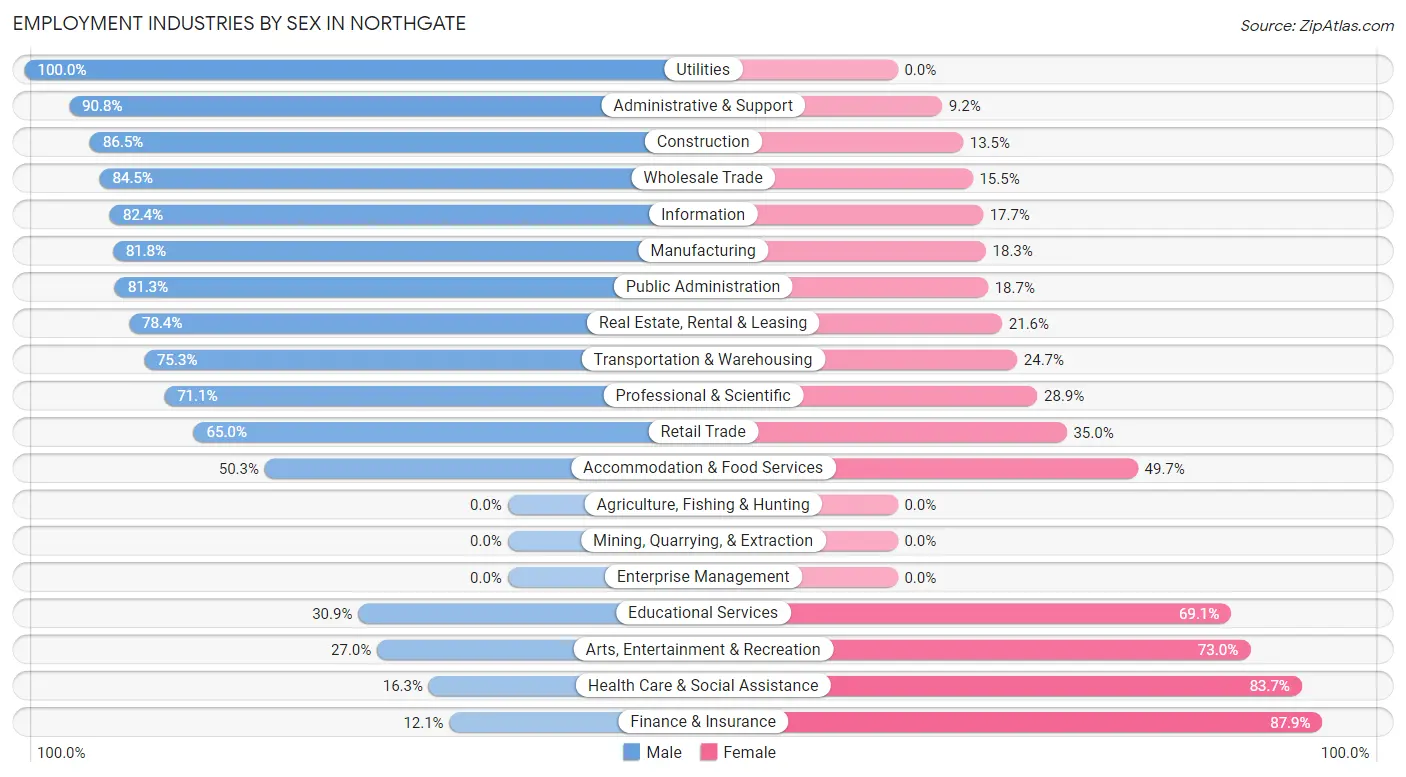
Employment Industries by Sex in Northgate
The Northgate industries that see more men than women are Utilities (100.0%), Administrative & Support (90.8%), and Construction (86.5%), whereas the industries that tend to have a higher number of women are Finance & Insurance (87.9%), Health Care & Social Assistance (83.7%), and Arts, Entertainment & Recreation (73.0%).
| Industry | Male | Female |
| Agriculture, Fishing & Hunting | 0 (0.0%) | 0 (0.0%) |
| Mining, Quarrying, & Extraction | 0 (0.0%) | 0 (0.0%) |
| Construction | 115 (86.5%) | 18 (13.5%) |
| Manufacturing | 336 (81.8%) | 75 (18.2%) |
| Wholesale Trade | 163 (84.5%) | 30 (15.5%) |
| Retail Trade | 249 (65.0%) | 134 (35.0%) |
| Transportation & Warehousing | 134 (75.3%) | 44 (24.7%) |
| Utilities | 44 (100.0%) | 0 (0.0%) |
| Information | 28 (82.4%) | 6 (17.6%) |
| Finance & Insurance | 24 (12.1%) | 175 (87.9%) |
| Real Estate, Rental & Leasing | 29 (78.4%) | 8 (21.6%) |
| Professional & Scientific | 91 (71.1%) | 37 (28.9%) |
| Enterprise Management | 0 (0.0%) | 0 (0.0%) |
| Administrative & Support | 217 (90.8%) | 22 (9.2%) |
| Educational Services | 43 (30.9%) | 96 (69.1%) |
| Health Care & Social Assistance | 97 (16.3%) | 497 (83.7%) |
| Arts, Entertainment & Recreation | 10 (27.0%) | 27 (73.0%) |
| Accommodation & Food Services | 91 (50.3%) | 90 (49.7%) |
| Public Administration | 87 (81.3%) | 20 (18.7%) |
| Total | 1,875 (57.5%) | 1,387 (42.5%) |
Education in Northgate
School Enrollment in Northgate
The most common levels of schooling among the 1,386 students in Northgate are elementary school (382 | 27.6%), middle school (324 | 23.4%), and high school (251 | 18.1%).
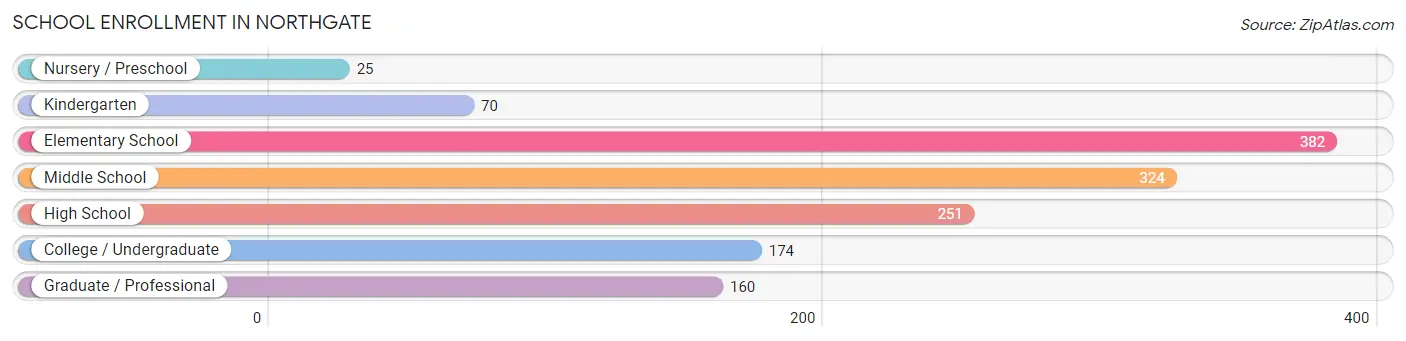
| School Level | # Students | % Students |
| Nursery / Preschool | 25 | 1.8% |
| Kindergarten | 70 | 5.1% |
| Elementary School | 382 | 27.6% |
| Middle School | 324 | 23.4% |
| High School | 251 | 18.1% |
| College / Undergraduate | 174 | 12.6% |
| Graduate / Professional | 160 | 11.5% |
| Total | 1,386 | 100.0% |
School Enrollment by Age by Funding Source in Northgate
Out of a total of 1,386 students who are enrolled in schools in Northgate, 315 (22.7%) attend a private institution, while the remaining 1,071 (77.3%) are enrolled in public schools. The age group of 3 to 4 year olds has the highest likelihood of being enrolled in private schools, with 25 (100.0% in the age bracket) enrolled. Conversely, the age group of 18 to 19 year olds has the lowest likelihood of being enrolled in a private school, with 97 (100.0% in the age bracket) attending a public institution.
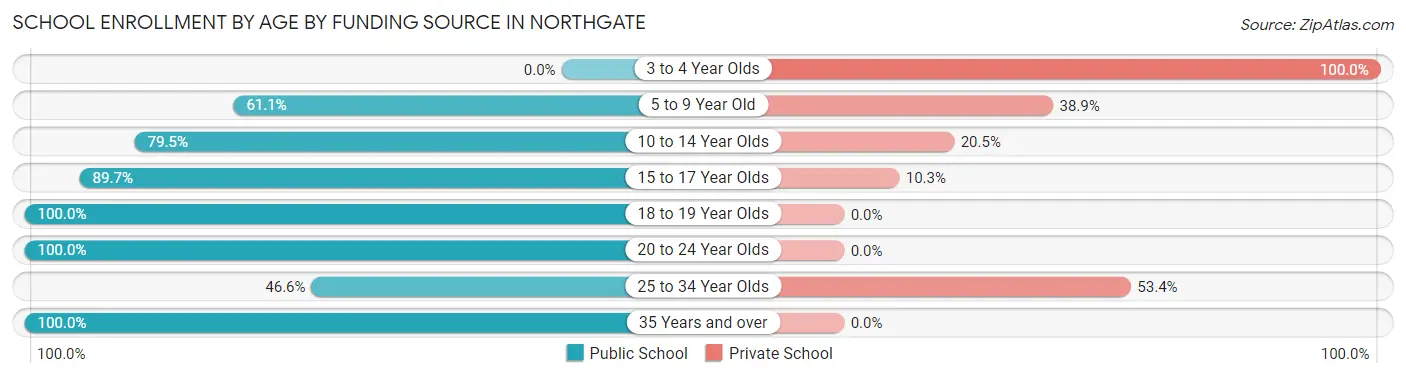
| Age Bracket | Public School | Private School |
| 3 to 4 Year Olds | 0 (0.0%) | 25 (100.0%) |
| 5 to 9 Year Old | 201 (61.1%) | 128 (38.9%) |
| 10 to 14 Year Olds | 384 (79.5%) | 99 (20.5%) |
| 15 to 17 Year Olds | 140 (89.7%) | 16 (10.3%) |
| 18 to 19 Year Olds | 97 (100.0%) | 0 (0.0%) |
| 20 to 24 Year Olds | 75 (100.0%) | 0 (0.0%) |
| 25 to 34 Year Olds | 41 (46.6%) | 47 (53.4%) |
| 35 Years and over | 133 (100.0%) | 0 (0.0%) |
| Total | 1,071 (77.3%) | 315 (22.7%) |
Educational Attainment by Field of Study in Northgate
Business (213 | 22.6%), arts & humanities (170 | 18.1%), science & technology (141 | 15.0%), engineering (75 | 8.0%), and education (69 | 7.3%) are the most common fields of study among 941 individuals in Northgate who have obtained a bachelor's degree or higher.
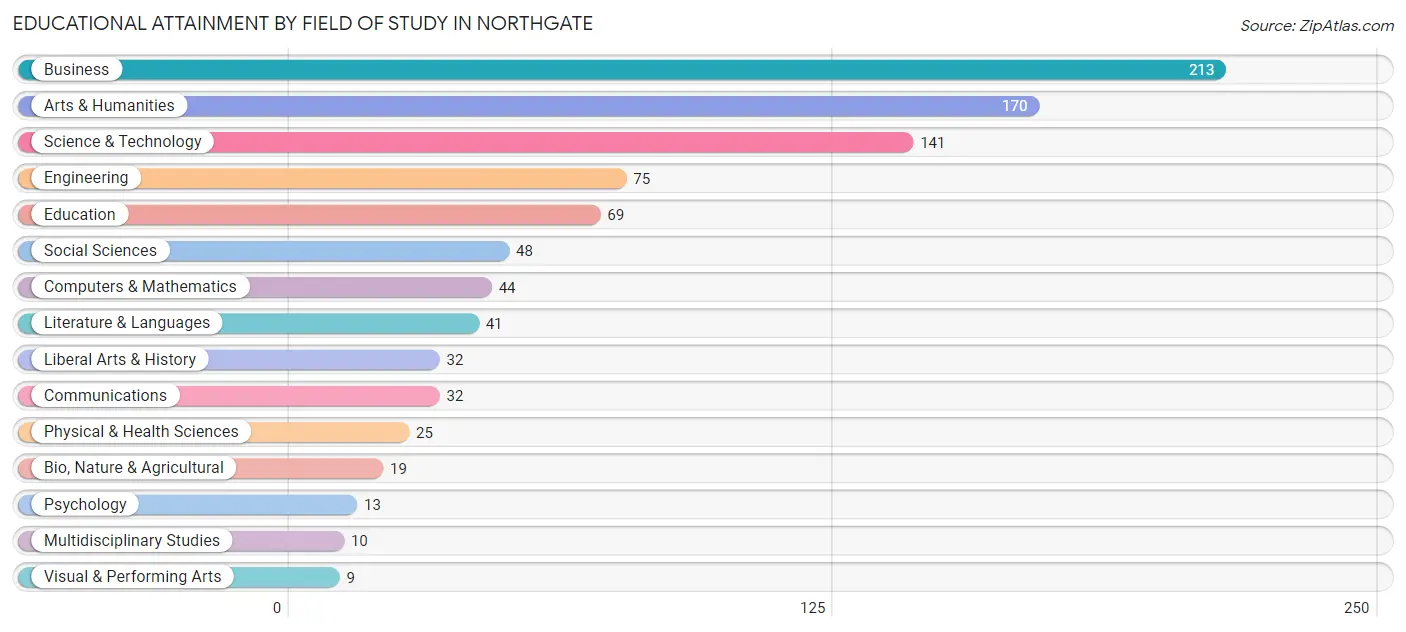
| Field of Study | # Graduates | % Graduates |
| Computers & Mathematics | 44 | 4.7% |
| Bio, Nature & Agricultural | 19 | 2.0% |
| Physical & Health Sciences | 25 | 2.7% |
| Psychology | 13 | 1.4% |
| Social Sciences | 48 | 5.1% |
| Engineering | 75 | 8.0% |
| Multidisciplinary Studies | 10 | 1.1% |
| Science & Technology | 141 | 15.0% |
| Business | 213 | 22.6% |
| Education | 69 | 7.3% |
| Literature & Languages | 41 | 4.4% |
| Liberal Arts & History | 32 | 3.4% |
| Visual & Performing Arts | 9 | 1.0% |
| Communications | 32 | 3.4% |
| Arts & Humanities | 170 | 18.1% |
| Total | 941 | 100.0% |
Transportation & Commute in Northgate
Vehicle Availability by Sex in Northgate
The most prevalent vehicle ownership categories in Northgate are males with 2 vehicles (1,033, accounting for 56.2%) and females with 2 vehicles (738, making up 75.0%).
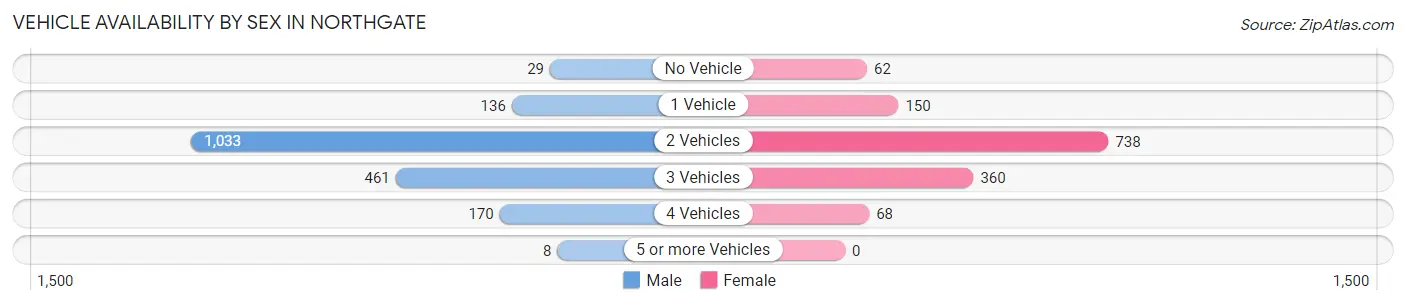
| Vehicles Available | Male | Female |
| No Vehicle | 29 (1.6%) | 62 (4.5%) |
| 1 Vehicle | 136 (7.4%) | 150 (10.9%) |
| 2 Vehicles | 1,033 (56.2%) | 738 (53.6%) |
| 3 Vehicles | 461 (25.1%) | 360 (26.1%) |
| 4 Vehicles | 170 (9.2%) | 68 (4.9%) |
| 5 or more Vehicles | 8 (0.4%) | 0 (0.0%) |
| Total | 1,837 (100.0%) | 1,378 (100.0%) |
Commute Time in Northgate
The most frequently occuring commute durations in Northgate are 30 to 34 minutes (572 commuters, 19.6%), 20 to 24 minutes (545 commuters, 18.7%), and 25 to 29 minutes (517 commuters, 17.7%).
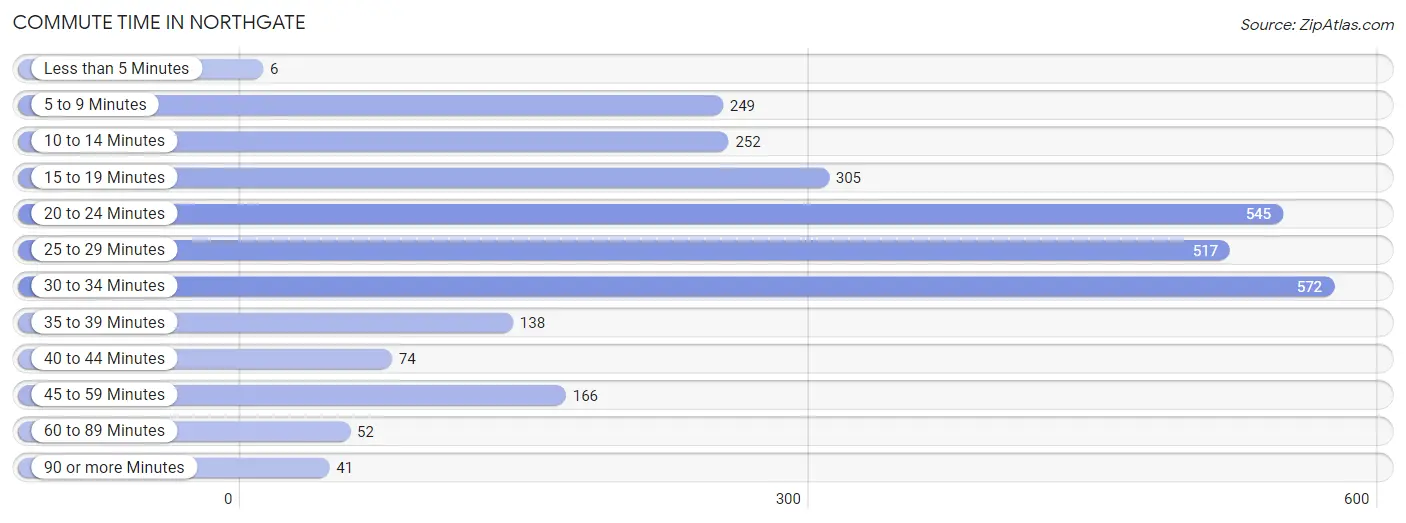
| Commute Time | # Commuters | % Commuters |
| Less than 5 Minutes | 6 | 0.2% |
| 5 to 9 Minutes | 249 | 8.5% |
| 10 to 14 Minutes | 252 | 8.6% |
| 15 to 19 Minutes | 305 | 10.5% |
| 20 to 24 Minutes | 545 | 18.7% |
| 25 to 29 Minutes | 517 | 17.7% |
| 30 to 34 Minutes | 572 | 19.6% |
| 35 to 39 Minutes | 138 | 4.7% |
| 40 to 44 Minutes | 74 | 2.5% |
| 45 to 59 Minutes | 166 | 5.7% |
| 60 to 89 Minutes | 52 | 1.8% |
| 90 or more Minutes | 41 | 1.4% |
Commute Time by Sex in Northgate
The most common commute times in Northgate are 25 to 29 minutes (372 commuters, 22.0%) for males and 20 to 24 minutes (297 commuters, 24.2%) for females.
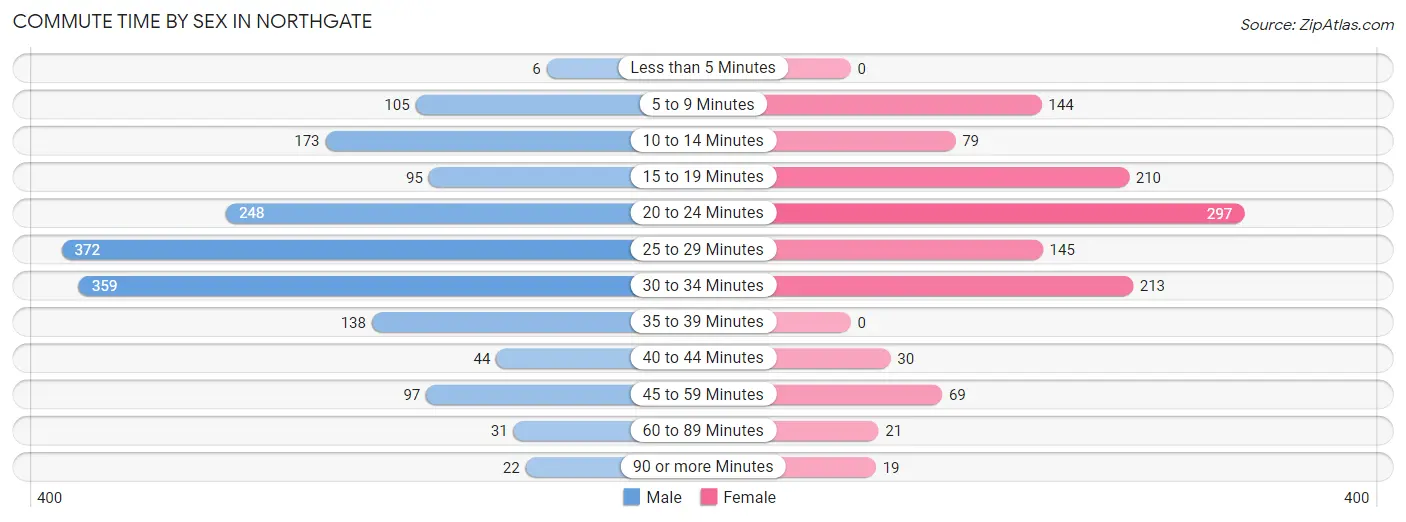
| Commute Time | Male | Female |
| Less than 5 Minutes | 6 (0.4%) | 0 (0.0%) |
| 5 to 9 Minutes | 105 (6.2%) | 144 (11.7%) |
| 10 to 14 Minutes | 173 (10.2%) | 79 (6.4%) |
| 15 to 19 Minutes | 95 (5.6%) | 210 (17.1%) |
| 20 to 24 Minutes | 248 (14.7%) | 297 (24.2%) |
| 25 to 29 Minutes | 372 (22.0%) | 145 (11.8%) |
| 30 to 34 Minutes | 359 (21.2%) | 213 (17.4%) |
| 35 to 39 Minutes | 138 (8.2%) | 0 (0.0%) |
| 40 to 44 Minutes | 44 (2.6%) | 30 (2.4%) |
| 45 to 59 Minutes | 97 (5.7%) | 69 (5.6%) |
| 60 to 89 Minutes | 31 (1.8%) | 21 (1.7%) |
| 90 or more Minutes | 22 (1.3%) | 19 (1.5%) |
Time of Departure to Work by Sex in Northgate
The most frequent times of departure to work in Northgate are 12:00 AM to 4:59 AM (280, 16.6%) for males and 7:00 AM to 7:29 AM (223, 18.2%) for females.
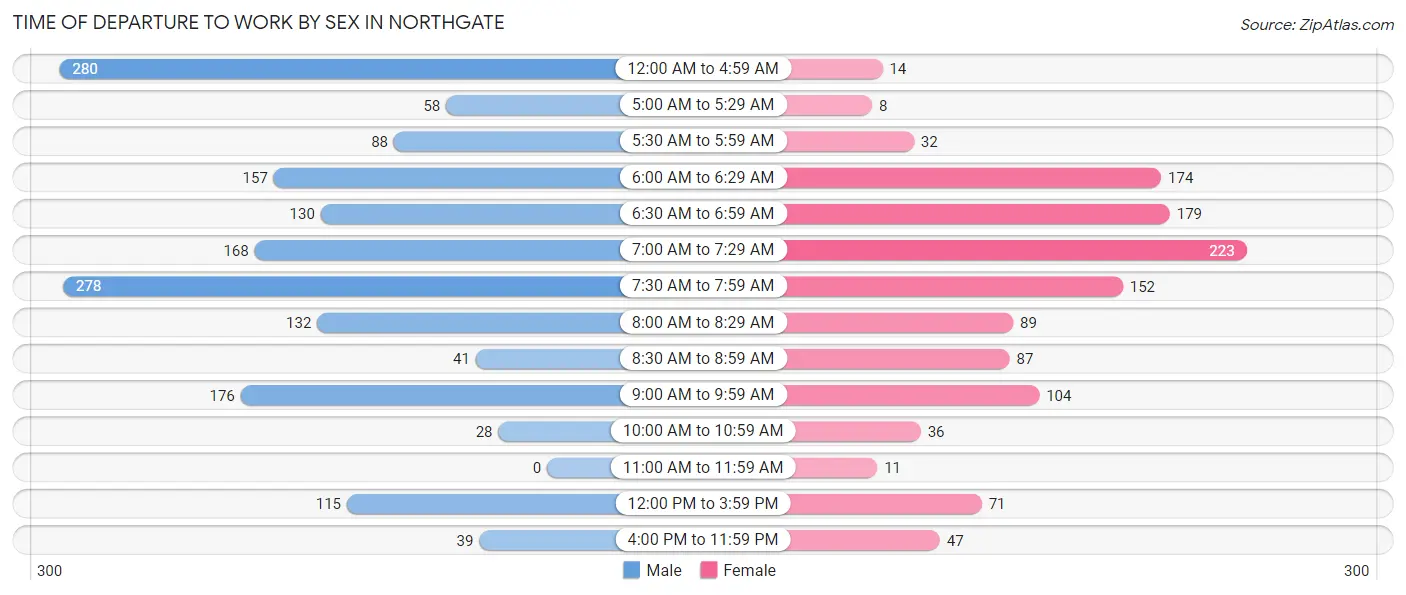
| Time of Departure | Male | Female |
| 12:00 AM to 4:59 AM | 280 (16.6%) | 14 (1.1%) |
| 5:00 AM to 5:29 AM | 58 (3.4%) | 8 (0.6%) |
| 5:30 AM to 5:59 AM | 88 (5.2%) | 32 (2.6%) |
| 6:00 AM to 6:29 AM | 157 (9.3%) | 174 (14.2%) |
| 6:30 AM to 6:59 AM | 130 (7.7%) | 179 (14.6%) |
| 7:00 AM to 7:29 AM | 168 (9.9%) | 223 (18.2%) |
| 7:30 AM to 7:59 AM | 278 (16.5%) | 152 (12.4%) |
| 8:00 AM to 8:29 AM | 132 (7.8%) | 89 (7.2%) |
| 8:30 AM to 8:59 AM | 41 (2.4%) | 87 (7.1%) |
| 9:00 AM to 9:59 AM | 176 (10.4%) | 104 (8.5%) |
| 10:00 AM to 10:59 AM | 28 (1.7%) | 36 (2.9%) |
| 11:00 AM to 11:59 AM | 0 (0.0%) | 11 (0.9%) |
| 12:00 PM to 3:59 PM | 115 (6.8%) | 71 (5.8%) |
| 4:00 PM to 11:59 PM | 39 (2.3%) | 47 (3.8%) |
| Total | 1,690 (100.0%) | 1,227 (100.0%) |
Housing Occupancy in Northgate
Occupancy by Ownership in Northgate
Of the total 2,621 dwellings in Northgate, owner-occupied units account for 2,048 (78.1%), while renter-occupied units make up 573 (21.9%).
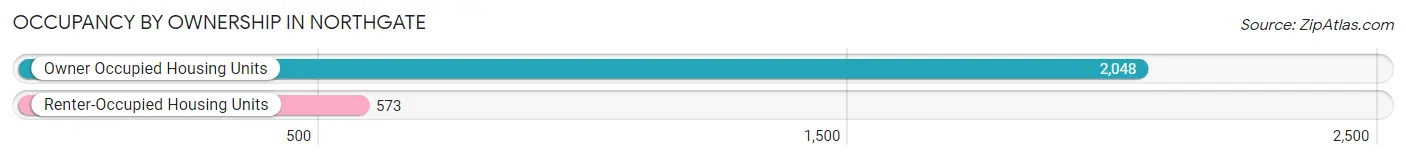
| Occupancy | # Housing Units | % Housing Units |
| Owner Occupied Housing Units | 2,048 | 78.1% |
| Renter-Occupied Housing Units | 573 | 21.9% |
| Total Occupied Housing Units | 2,621 | 100.0% |
Occupancy by Household Size in Northgate
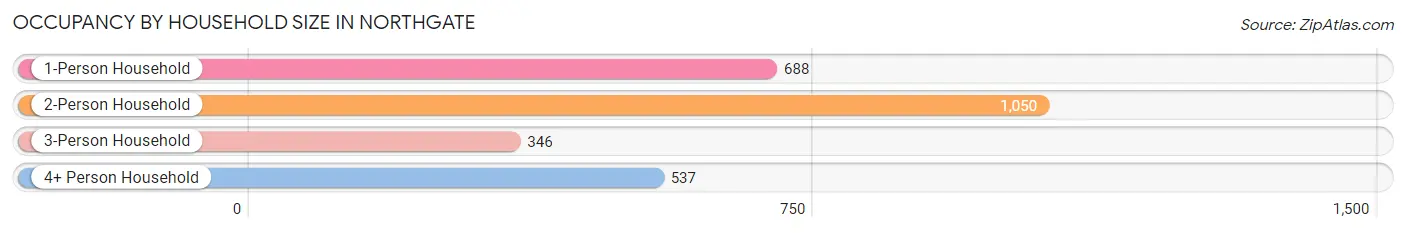
| Household Size | # Housing Units | % Housing Units |
| 1-Person Household | 688 | 26.3% |
| 2-Person Household | 1,050 | 40.1% |
| 3-Person Household | 346 | 13.2% |
| 4+ Person Household | 537 | 20.5% |
| Total Housing Units | 2,621 | 100.0% |
Occupancy by Ownership by Household Size in Northgate
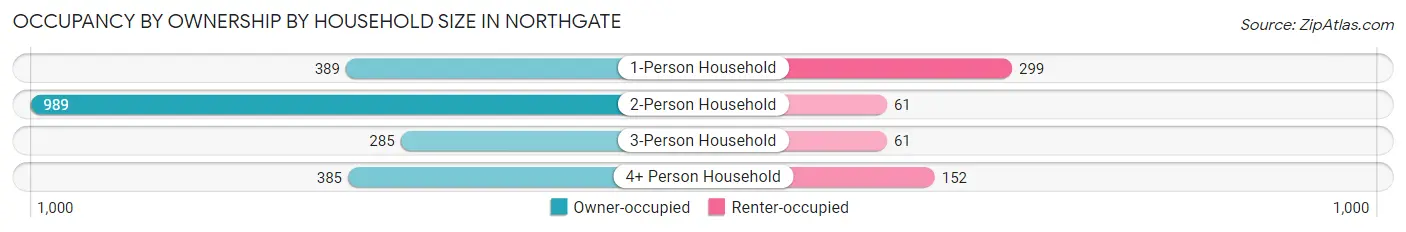
| Household Size | Owner-occupied | Renter-occupied |
| 1-Person Household | 389 (56.5%) | 299 (43.5%) |
| 2-Person Household | 989 (94.2%) | 61 (5.8%) |
| 3-Person Household | 285 (82.4%) | 61 (17.6%) |
| 4+ Person Household | 385 (71.7%) | 152 (28.3%) |
| Total Housing Units | 2,048 (78.1%) | 573 (21.9%) |
Occupancy by Educational Attainment in Northgate
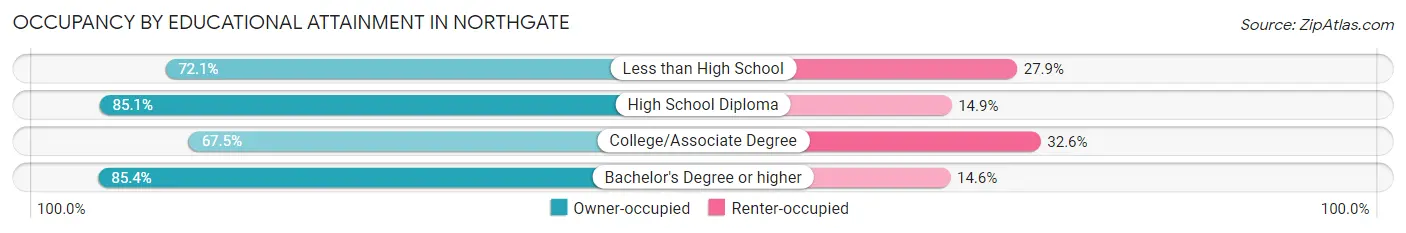
| Household Size | Owner-occupied | Renter-occupied |
| Less than High School | 150 (72.1%) | 58 (27.9%) |
| High School Diploma | 778 (85.1%) | 136 (14.9%) |
| College/Associate Degree | 601 (67.4%) | 290 (32.6%) |
| Bachelor's Degree or higher | 519 (85.4%) | 89 (14.6%) |
Occupancy by Age of Householder in Northgate
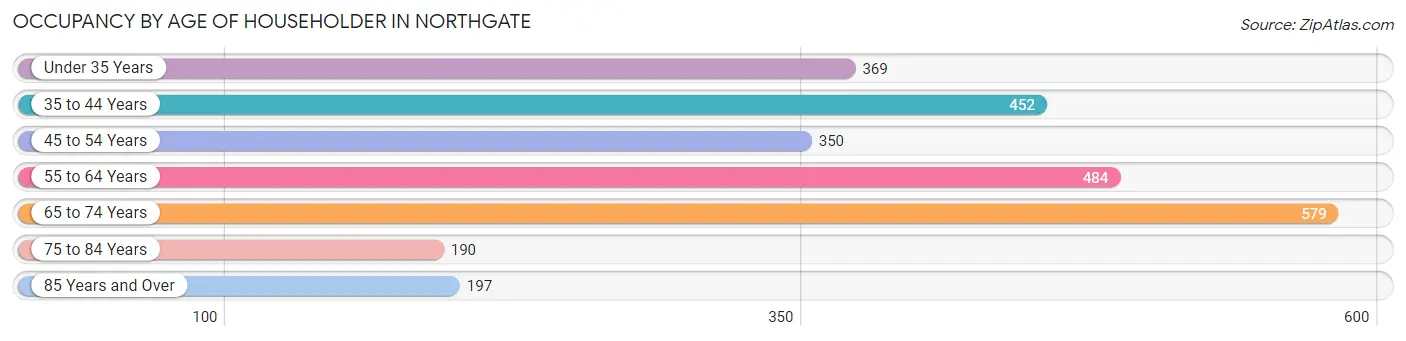
| Age Bracket | # Households | % Households |
| Under 35 Years | 369 | 14.1% |
| 35 to 44 Years | 452 | 17.2% |
| 45 to 54 Years | 350 | 13.4% |
| 55 to 64 Years | 484 | 18.5% |
| 65 to 74 Years | 579 | 22.1% |
| 75 to 84 Years | 190 | 7.2% |
| 85 Years and Over | 197 | 7.5% |
| Total | 2,621 | 100.0% |
Housing Finances in Northgate
Median Income by Occupancy in Northgate
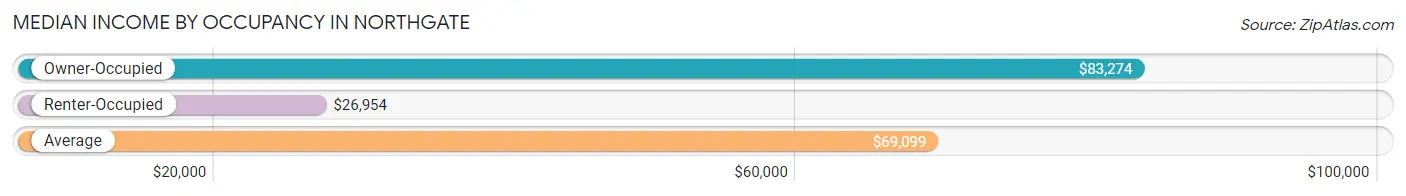
| Occupancy Type | # Households | Median Income |
| Owner-Occupied | 2,048 (78.1%) | $83,274 |
| Renter-Occupied | 573 (21.9%) | $26,954 |
| Average | 2,621 (100.0%) | $69,099 |
Occupancy by Householder Income Bracket in Northgate
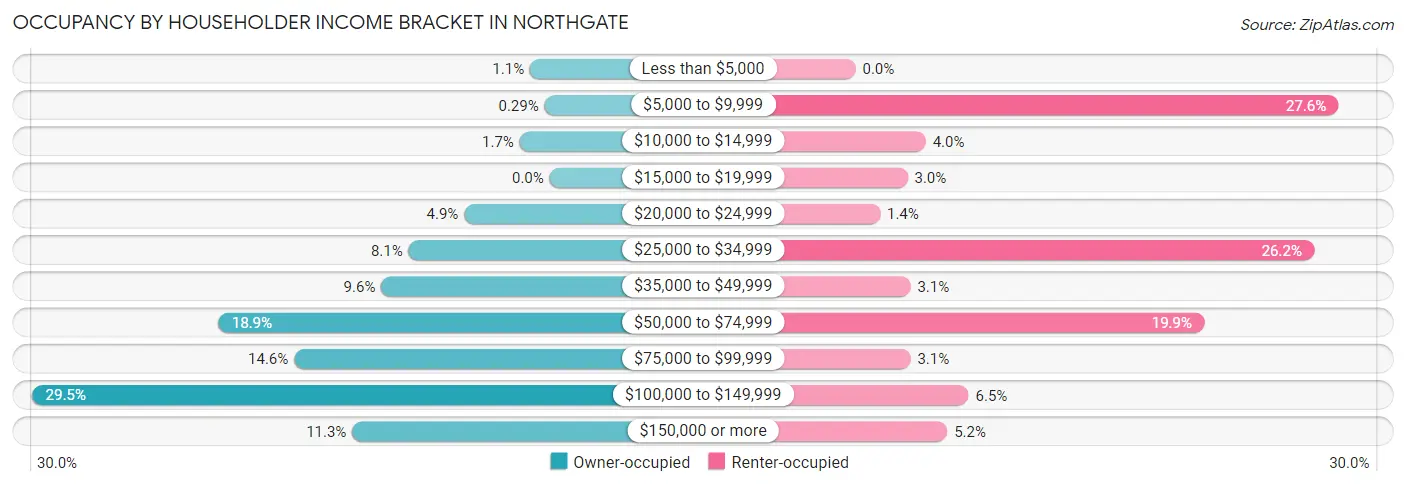
| Income Bracket | Owner-occupied | Renter-occupied |
| Less than $5,000 | 23 (1.1%) | 0 (0.0%) |
| $5,000 to $9,999 | 6 (0.3%) | 158 (27.6%) |
| $10,000 to $14,999 | 35 (1.7%) | 23 (4.0%) |
| $15,000 to $19,999 | 0 (0.0%) | 17 (3.0%) |
| $20,000 to $24,999 | 100 (4.9%) | 8 (1.4%) |
| $25,000 to $34,999 | 165 (8.1%) | 150 (26.2%) |
| $35,000 to $49,999 | 197 (9.6%) | 18 (3.1%) |
| $50,000 to $74,999 | 387 (18.9%) | 114 (19.9%) |
| $75,000 to $99,999 | 299 (14.6%) | 18 (3.1%) |
| $100,000 to $149,999 | 605 (29.5%) | 37 (6.5%) |
| $150,000 or more | 231 (11.3%) | 30 (5.2%) |
| Total | 2,048 (100.0%) | 573 (100.0%) |
Monthly Housing Cost Tiers in Northgate
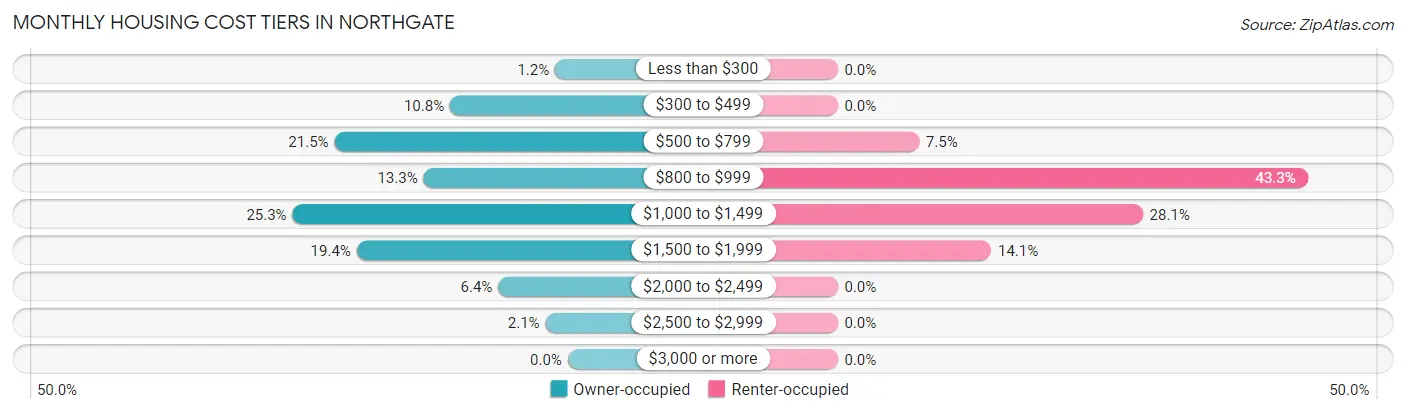
| Monthly Cost | Owner-occupied | Renter-occupied |
| Less than $300 | 24 (1.2%) | 0 (0.0%) |
| $300 to $499 | 222 (10.8%) | 0 (0.0%) |
| $500 to $799 | 440 (21.5%) | 43 (7.5%) |
| $800 to $999 | 272 (13.3%) | 248 (43.3%) |
| $1,000 to $1,499 | 519 (25.3%) | 161 (28.1%) |
| $1,500 to $1,999 | 398 (19.4%) | 81 (14.1%) |
| $2,000 to $2,499 | 131 (6.4%) | 0 (0.0%) |
| $2,500 to $2,999 | 42 (2.1%) | 0 (0.0%) |
| $3,000 or more | 0 (0.0%) | 0 (0.0%) |
| Total | 2,048 (100.0%) | 573 (100.0%) |
Physical Housing Characteristics in Northgate
Housing Structures in Northgate
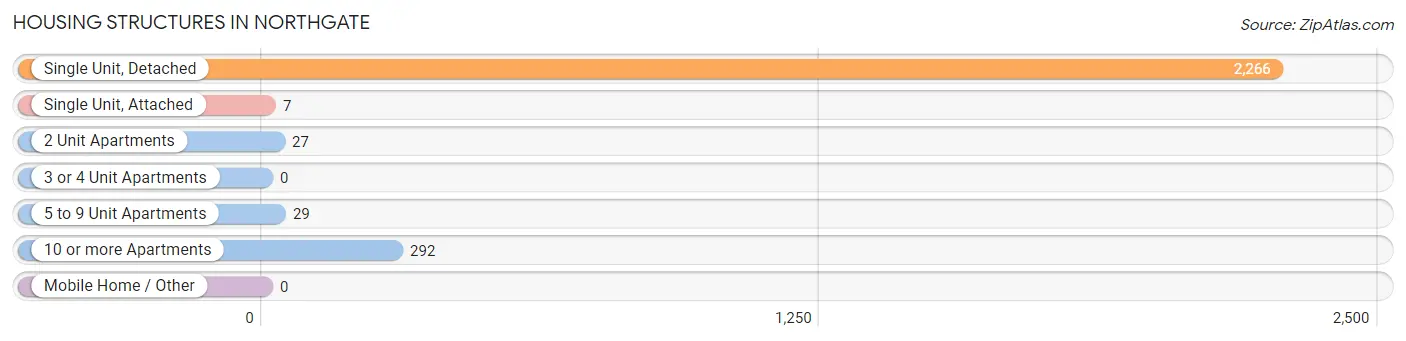
| Structure Type | # Housing Units | % Housing Units |
| Single Unit, Detached | 2,266 | 86.5% |
| Single Unit, Attached | 7 | 0.3% |
| 2 Unit Apartments | 27 | 1.0% |
| 3 or 4 Unit Apartments | 0 | 0.0% |
| 5 to 9 Unit Apartments | 29 | 1.1% |
| 10 or more Apartments | 292 | 11.1% |
| Mobile Home / Other | 0 | 0.0% |
| Total | 2,621 | 100.0% |
Housing Structures by Occupancy in Northgate
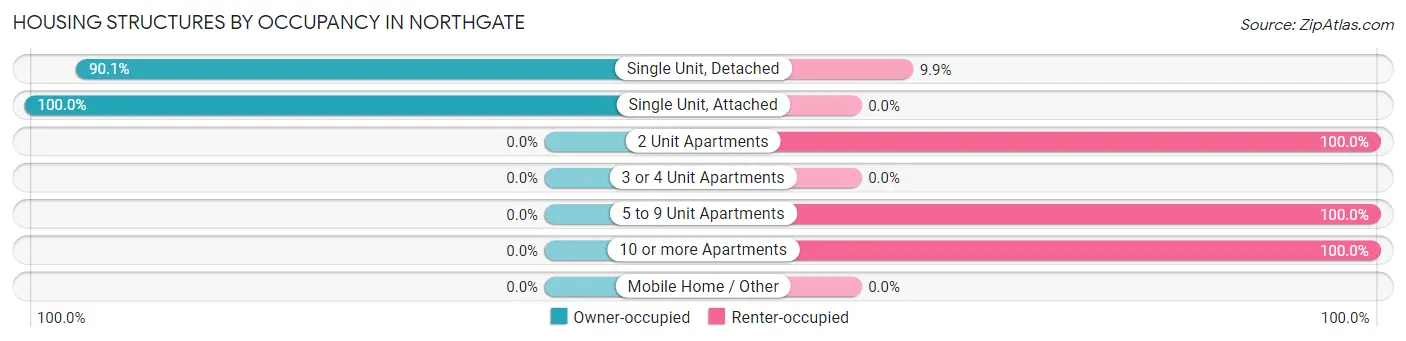
| Structure Type | Owner-occupied | Renter-occupied |
| Single Unit, Detached | 2,041 (90.1%) | 225 (9.9%) |
| Single Unit, Attached | 7 (100.0%) | 0 (0.0%) |
| 2 Unit Apartments | 0 (0.0%) | 27 (100.0%) |
| 3 or 4 Unit Apartments | 0 (0.0%) | 0 (0.0%) |
| 5 to 9 Unit Apartments | 0 (0.0%) | 29 (100.0%) |
| 10 or more Apartments | 0 (0.0%) | 292 (100.0%) |
| Mobile Home / Other | 0 (0.0%) | 0 (0.0%) |
| Total | 2,048 (78.1%) | 573 (21.9%) |
Housing Structures by Number of Rooms in Northgate
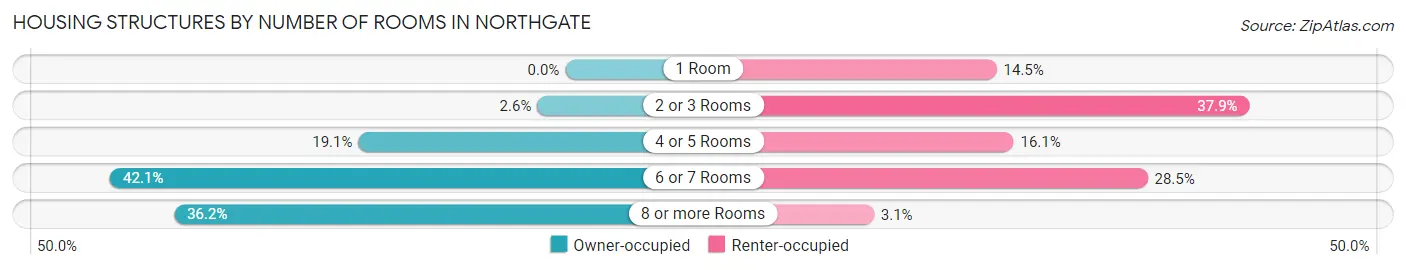
| Number of Rooms | Owner-occupied | Renter-occupied |
| 1 Room | 0 (0.0%) | 83 (14.5%) |
| 2 or 3 Rooms | 53 (2.6%) | 217 (37.9%) |
| 4 or 5 Rooms | 392 (19.1%) | 92 (16.1%) |
| 6 or 7 Rooms | 862 (42.1%) | 163 (28.4%) |
| 8 or more Rooms | 741 (36.2%) | 18 (3.1%) |
| Total | 2,048 (100.0%) | 573 (100.0%) |
Housing Structure by Heating Type in Northgate
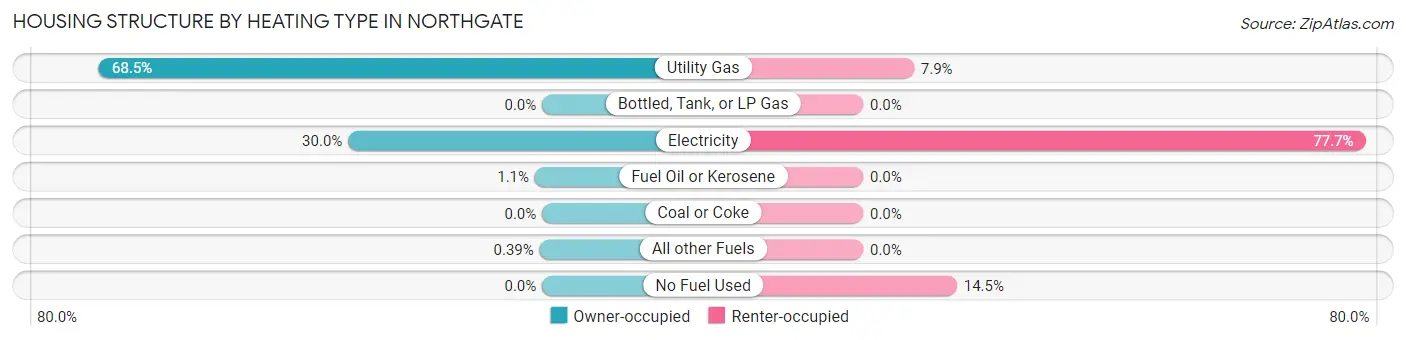
| Heating Type | Owner-occupied | Renter-occupied |
| Utility Gas | 1,403 (68.5%) | 45 (7.9%) |
| Bottled, Tank, or LP Gas | 0 (0.0%) | 0 (0.0%) |
| Electricity | 614 (30.0%) | 445 (77.7%) |
| Fuel Oil or Kerosene | 23 (1.1%) | 0 (0.0%) |
| Coal or Coke | 0 (0.0%) | 0 (0.0%) |
| All other Fuels | 8 (0.4%) | 0 (0.0%) |
| No Fuel Used | 0 (0.0%) | 83 (14.5%) |
| Total | 2,048 (100.0%) | 573 (100.0%) |
Household Vehicle Usage in Northgate
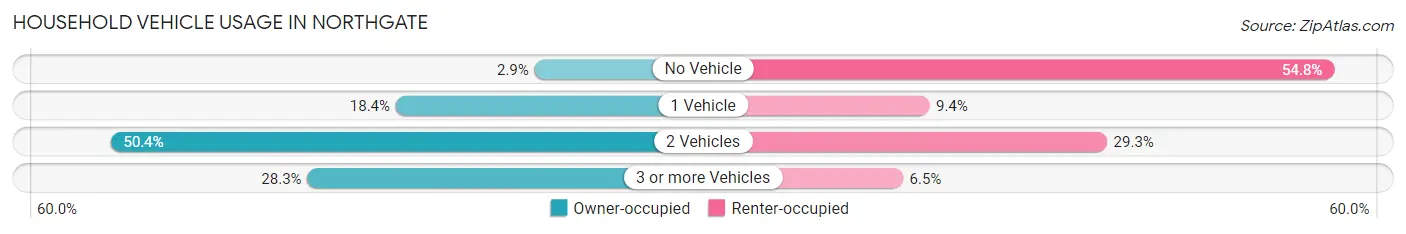
| Vehicles per Household | Owner-occupied | Renter-occupied |
| No Vehicle | 59 (2.9%) | 314 (54.8%) |
| 1 Vehicle | 377 (18.4%) | 54 (9.4%) |
| 2 Vehicles | 1,032 (50.4%) | 168 (29.3%) |
| 3 or more Vehicles | 580 (28.3%) | 37 (6.5%) |
| Total | 2,048 (100.0%) | 573 (100.0%) |
Real Estate & Mortgages in Northgate
Real Estate and Mortgage Overview in Northgate
| Characteristic | Without Mortgage | With Mortgage |
| Housing Units | 753 | 1,295 |
| Median Property Value | $161,000 | $164,600 |
| Median Household Income | $69,044 | $129 |
| Monthly Housing Costs | $563 | $0 |
| Real Estate Taxes | $2,304 | $16 |
Property Value by Mortgage Status in Northgate
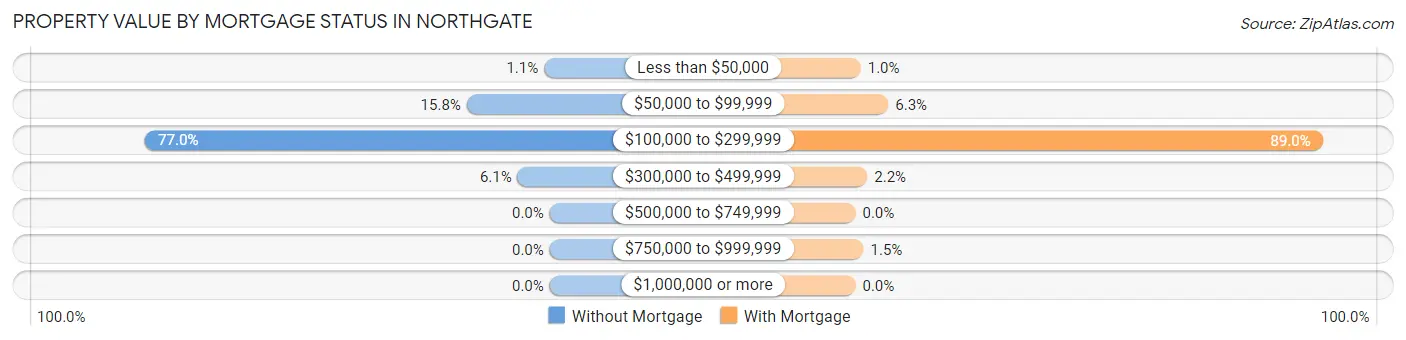
| Property Value | Without Mortgage | With Mortgage |
| Less than $50,000 | 8 (1.1%) | 13 (1.0%) |
| $50,000 to $99,999 | 119 (15.8%) | 81 (6.2%) |
| $100,000 to $299,999 | 580 (77.0%) | 1,152 (89.0%) |
| $300,000 to $499,999 | 46 (6.1%) | 29 (2.2%) |
| $500,000 to $749,999 | 0 (0.0%) | 0 (0.0%) |
| $750,000 to $999,999 | 0 (0.0%) | 20 (1.5%) |
| $1,000,000 or more | 0 (0.0%) | 0 (0.0%) |
| Total | 753 (100.0%) | 1,295 (100.0%) |
Household Income by Mortgage Status in Northgate
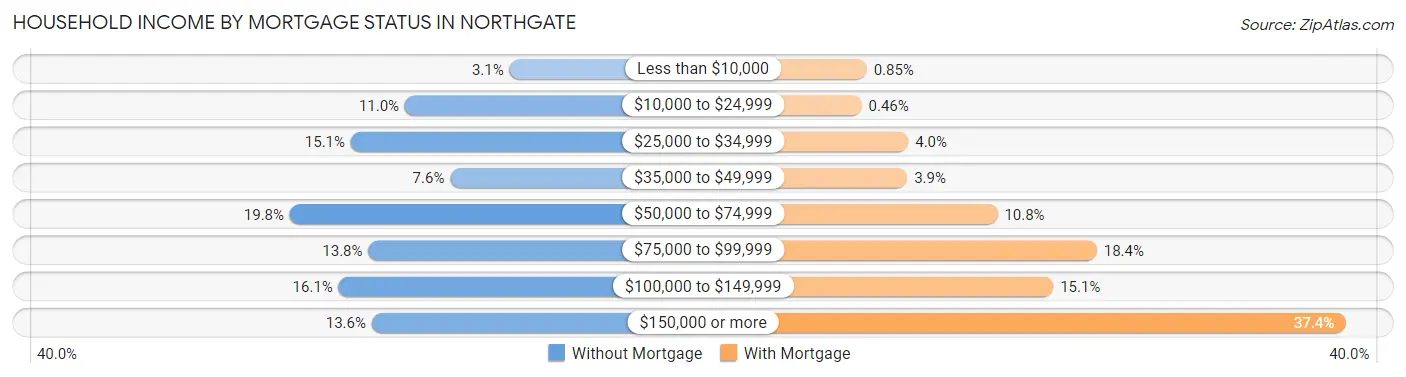
| Household Income | Without Mortgage | With Mortgage |
| Less than $10,000 | 23 (3.0%) | 11 (0.9%) |
| $10,000 to $24,999 | 83 (11.0%) | 6 (0.5%) |
| $25,000 to $34,999 | 114 (15.1%) | 52 (4.0%) |
| $35,000 to $49,999 | 57 (7.6%) | 51 (3.9%) |
| $50,000 to $74,999 | 149 (19.8%) | 140 (10.8%) |
| $75,000 to $99,999 | 104 (13.8%) | 238 (18.4%) |
| $100,000 to $149,999 | 121 (16.1%) | 195 (15.1%) |
| $150,000 or more | 102 (13.6%) | 484 (37.4%) |
| Total | 753 (100.0%) | 1,295 (100.0%) |
Property Value to Household Income Ratio in Northgate
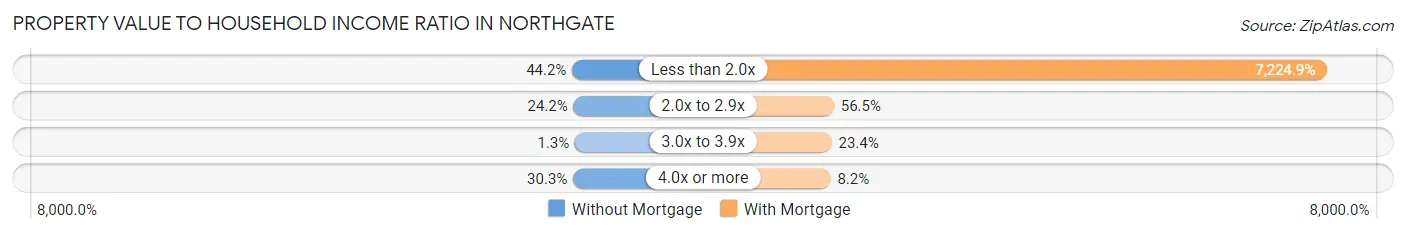
| Value-to-Income Ratio | Without Mortgage | With Mortgage |
| Less than 2.0x | 333 (44.2%) | 93,563 (7,224.9%) |
| 2.0x to 2.9x | 182 (24.2%) | 731 (56.5%) |
| 3.0x to 3.9x | 10 (1.3%) | 303 (23.4%) |
| 4.0x or more | 228 (30.3%) | 106 (8.2%) |
| Total | 753 (100.0%) | 1,295 (100.0%) |
Real Estate Taxes by Mortgage Status in Northgate
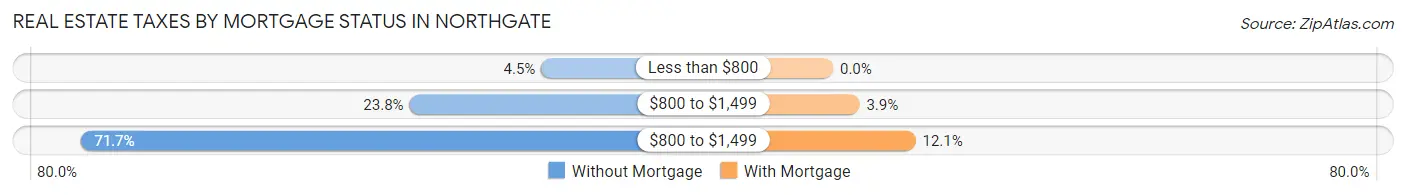
| Property Taxes | Without Mortgage | With Mortgage |
| Less than $800 | 34 (4.5%) | 0 (0.0%) |
| $800 to $1,499 | 179 (23.8%) | 50 (3.9%) |
| $800 to $1,499 | 540 (71.7%) | 156 (12.0%) |
| Total | 753 (100.0%) | 1,295 (100.0%) |
Health & Disability in Northgate
Health Insurance Coverage by Age in Northgate
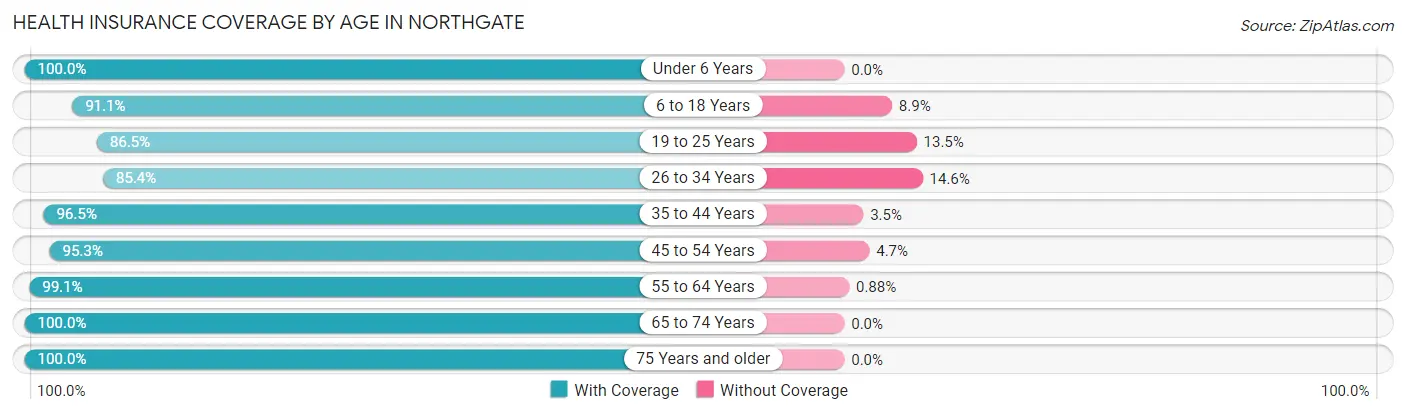
| Age Bracket | With Coverage | Without Coverage |
| Under 6 Years | 251 (100.0%) | 0 (0.0%) |
| 6 to 18 Years | 924 (91.1%) | 90 (8.9%) |
| 19 to 25 Years | 308 (86.5%) | 48 (13.5%) |
| 26 to 34 Years | 731 (85.4%) | 125 (14.6%) |
| 35 to 44 Years | 821 (96.5%) | 30 (3.5%) |
| 45 to 54 Years | 553 (95.3%) | 27 (4.7%) |
| 55 to 64 Years | 1,011 (99.1%) | 9 (0.9%) |
| 65 to 74 Years | 754 (100.0%) | 0 (0.0%) |
| 75 Years and older | 565 (100.0%) | 0 (0.0%) |
| Total | 5,918 (94.7%) | 329 (5.3%) |
Health Insurance Coverage by Citizenship Status in Northgate
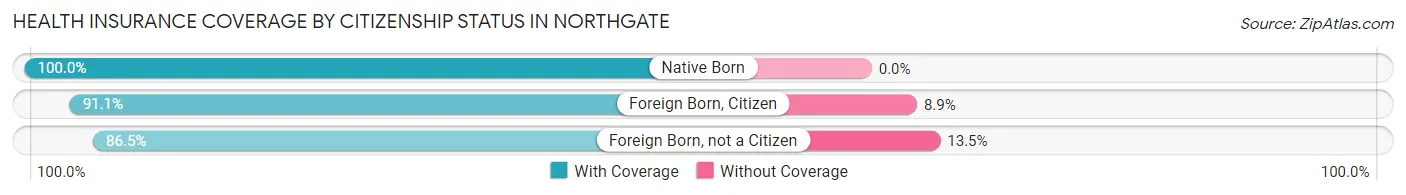
| Citizenship Status | With Coverage | Without Coverage |
| Native Born | 251 (100.0%) | 0 (0.0%) |
| Foreign Born, Citizen | 924 (91.1%) | 90 (8.9%) |
| Foreign Born, not a Citizen | 308 (86.5%) | 48 (13.5%) |
Health Insurance Coverage by Household Income in Northgate
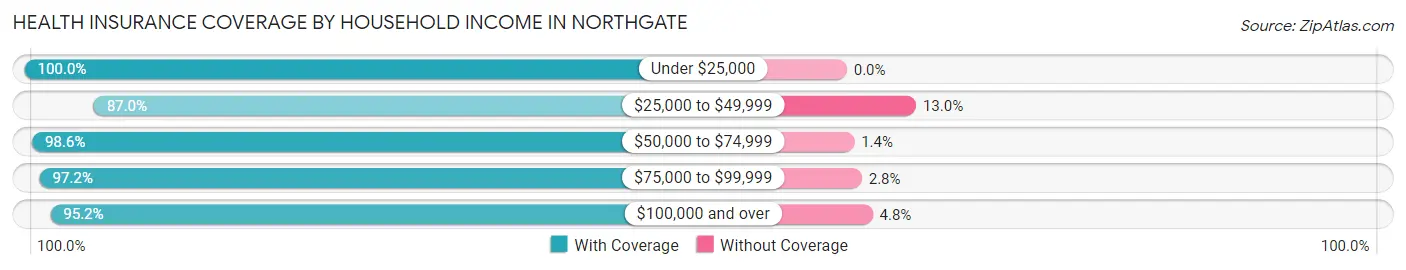
| Household Income | With Coverage | Without Coverage |
| Under $25,000 | 479 (100.0%) | 0 (0.0%) |
| $25,000 to $49,999 | 1,142 (87.0%) | 170 (13.0%) |
| $50,000 to $74,999 | 1,137 (98.6%) | 16 (1.4%) |
| $75,000 to $99,999 | 796 (97.2%) | 23 (2.8%) |
| $100,000 and over | 2,364 (95.2%) | 120 (4.8%) |
Public vs Private Health Insurance Coverage by Age in Northgate
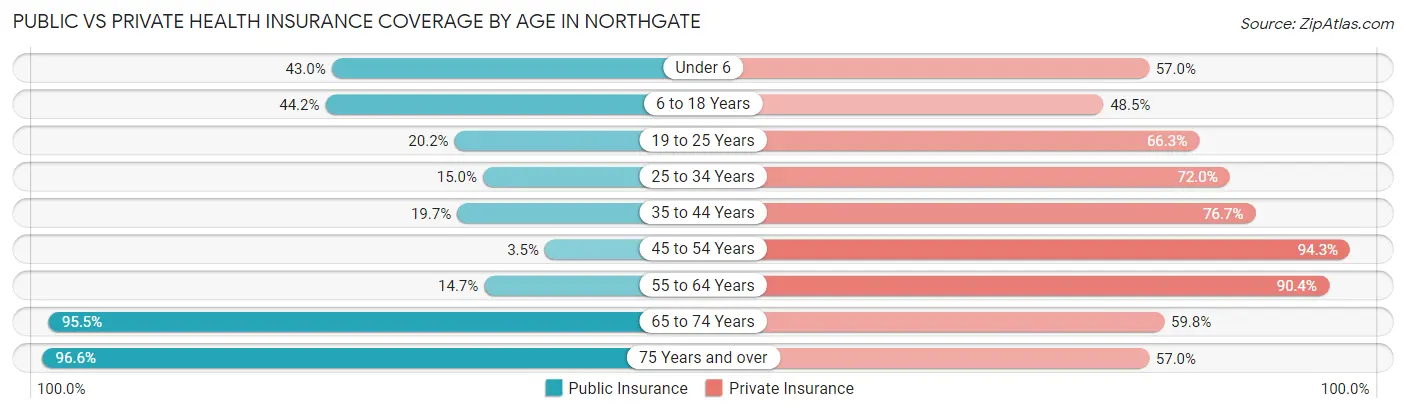
| Age Bracket | Public Insurance | Private Insurance |
| Under 6 | 108 (43.0%) | 143 (57.0%) |
| 6 to 18 Years | 448 (44.2%) | 492 (48.5%) |
| 19 to 25 Years | 72 (20.2%) | 236 (66.3%) |
| 25 to 34 Years | 128 (14.9%) | 616 (72.0%) |
| 35 to 44 Years | 168 (19.7%) | 653 (76.7%) |
| 45 to 54 Years | 20 (3.5%) | 547 (94.3%) |
| 55 to 64 Years | 150 (14.7%) | 922 (90.4%) |
| 65 to 74 Years | 720 (95.5%) | 451 (59.8%) |
| 75 Years and over | 546 (96.6%) | 322 (57.0%) |
| Total | 2,360 (37.8%) | 4,382 (70.2%) |
Disability Status by Sex by Age in Northgate
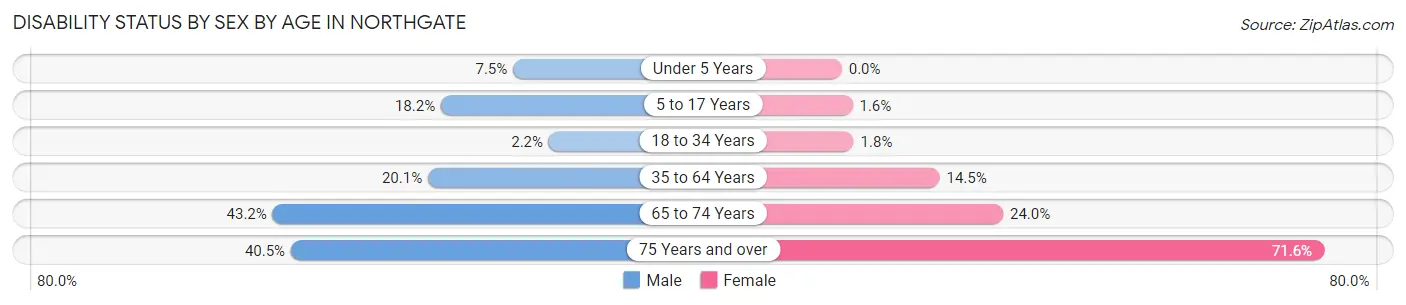
| Age Bracket | Male | Female |
| Under 5 Years | 10 (7.5%) | 0 (0.0%) |
| 5 to 17 Years | 103 (18.2%) | 7 (1.6%) |
| 18 to 34 Years | 15 (2.1%) | 10 (1.8%) |
| 35 to 64 Years | 253 (20.1%) | 173 (14.5%) |
| 65 to 74 Years | 120 (43.2%) | 114 (23.9%) |
| 75 Years and over | 89 (40.5%) | 247 (71.6%) |
Disability Class by Sex by Age in Northgate
Disability Class: Hearing Difficulty
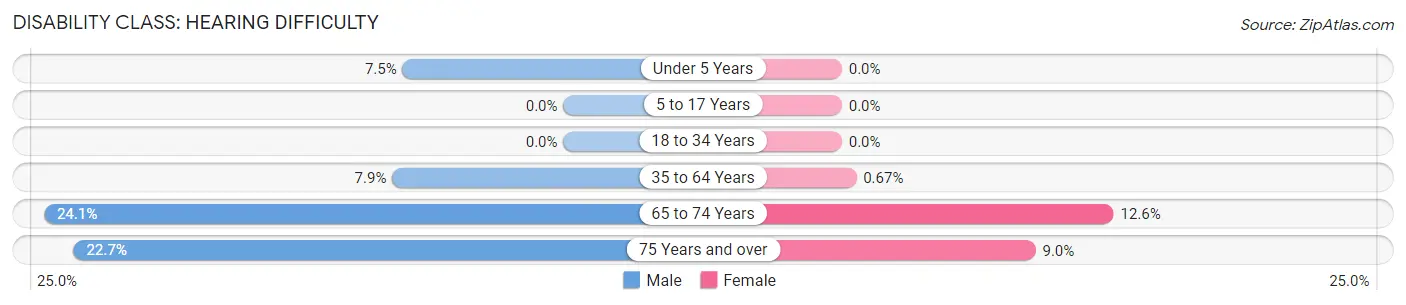
| Age Bracket | Male | Female |
| Under 5 Years | 10 (7.5%) | 0 (0.0%) |
| 5 to 17 Years | 0 (0.0%) | 0 (0.0%) |
| 18 to 34 Years | 0 (0.0%) | 0 (0.0%) |
| 35 to 64 Years | 100 (7.9%) | 8 (0.7%) |
| 65 to 74 Years | 67 (24.1%) | 60 (12.6%) |
| 75 Years and over | 50 (22.7%) | 31 (9.0%) |
Disability Class: Vision Difficulty
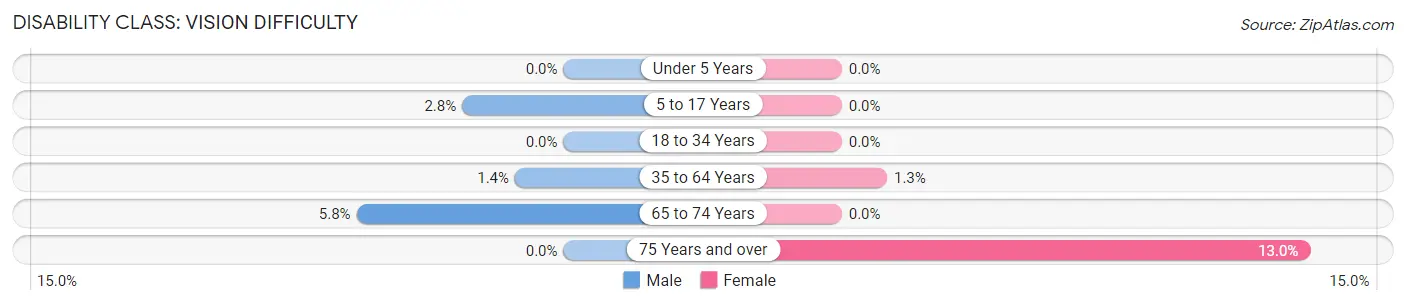
| Age Bracket | Male | Female |
| Under 5 Years | 0 (0.0%) | 0 (0.0%) |
| 5 to 17 Years | 16 (2.8%) | 0 (0.0%) |
| 18 to 34 Years | 0 (0.0%) | 0 (0.0%) |
| 35 to 64 Years | 17 (1.3%) | 15 (1.3%) |
| 65 to 74 Years | 16 (5.8%) | 0 (0.0%) |
| 75 Years and over | 0 (0.0%) | 45 (13.0%) |
Disability Class: Cognitive Difficulty
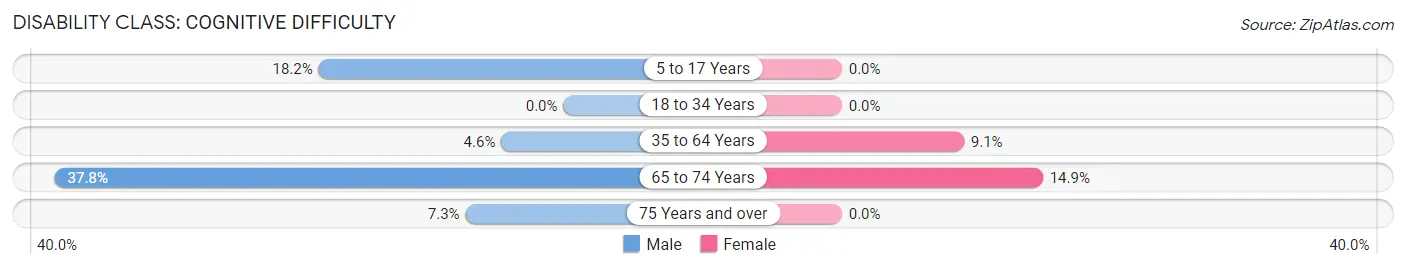
| Age Bracket | Male | Female |
| 5 to 17 Years | 103 (18.2%) | 0 (0.0%) |
| 18 to 34 Years | 0 (0.0%) | 0 (0.0%) |
| 35 to 64 Years | 58 (4.6%) | 108 (9.1%) |
| 65 to 74 Years | 105 (37.8%) | 71 (14.9%) |
| 75 Years and over | 16 (7.3%) | 0 (0.0%) |
Disability Class: Ambulatory Difficulty
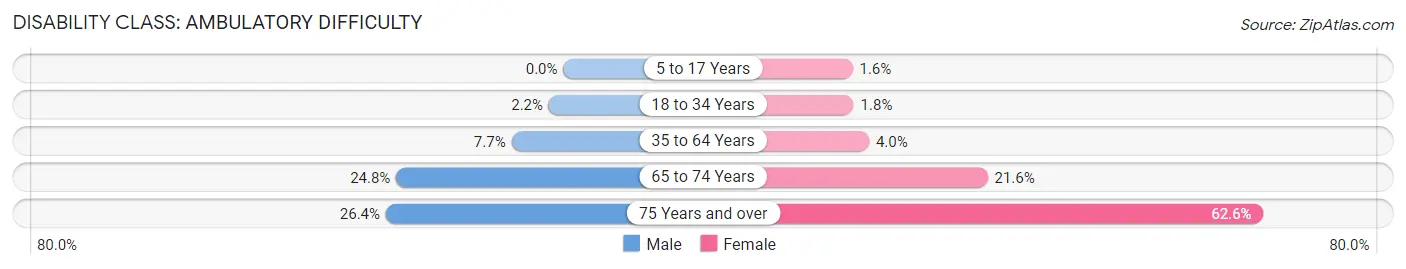
| Age Bracket | Male | Female |
| 5 to 17 Years | 0 (0.0%) | 7 (1.6%) |
| 18 to 34 Years | 15 (2.1%) | 10 (1.8%) |
| 35 to 64 Years | 97 (7.7%) | 48 (4.0%) |
| 65 to 74 Years | 69 (24.8%) | 103 (21.6%) |
| 75 Years and over | 58 (26.4%) | 216 (62.6%) |
Disability Class: Self-Care Difficulty
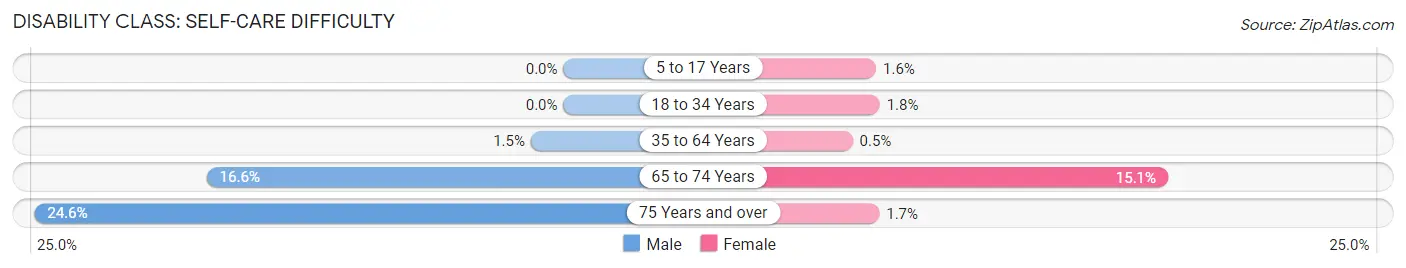
| Age Bracket | Male | Female |
| 5 to 17 Years | 0 (0.0%) | 7 (1.6%) |
| 18 to 34 Years | 0 (0.0%) | 10 (1.8%) |
| 35 to 64 Years | 19 (1.5%) | 6 (0.5%) |
| 65 to 74 Years | 46 (16.6%) | 72 (15.1%) |
| 75 Years and over | 54 (24.5%) | 6 (1.7%) |
Technology Access in Northgate
Computing Device Access in Northgate
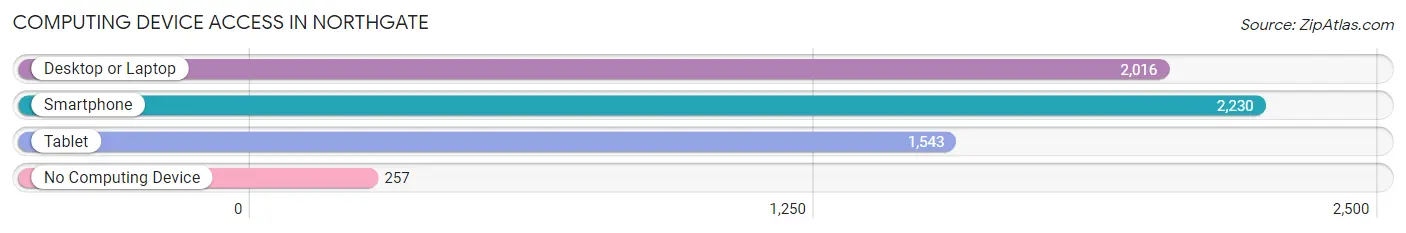
| Device Type | # Households | % Households |
| Desktop or Laptop | 2,016 | 76.9% |
| Smartphone | 2,230 | 85.1% |
| Tablet | 1,543 | 58.9% |
| No Computing Device | 257 | 9.8% |
| Total | 2,621 | 100.0% |
Internet Access in Northgate
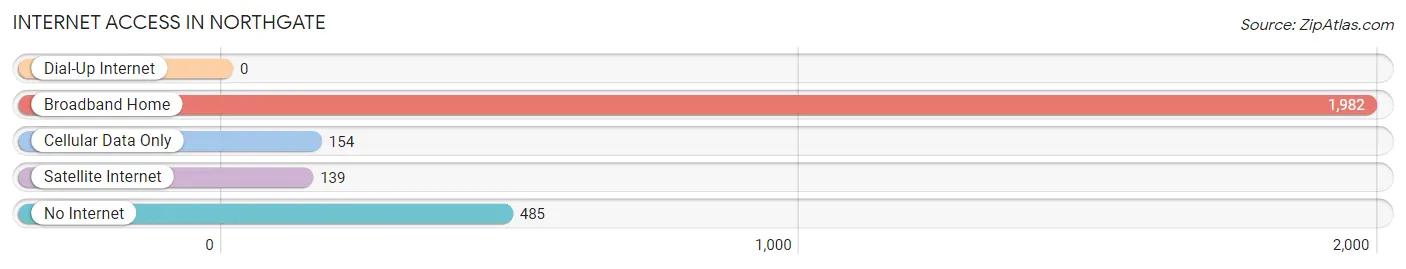
| Internet Type | # Households | % Households |
| Dial-Up Internet | 0 | 0.0% |
| Broadband Home | 1,982 | 75.6% |
| Cellular Data Only | 154 | 5.9% |
| Satellite Internet | 139 | 5.3% |
| No Internet | 485 | 18.5% |
| Total | 2,621 | 100.0% |
Northgate Summary
History
Northgate is a small village located in Hamilton County, Ohio. It is situated just north of the city of Cincinnati and is part of the Cincinnati metropolitan area. The village was founded in 1845 by a group of settlers from North Carolina. The settlers named the village after the North Gate of the city of Cincinnati, which was located nearby.
The village was originally a farming community, but it soon developed into a small industrial center. The first industry to locate in Northgate was a paper mill, which was established in 1848. This was followed by a number of other industries, including a brickyard, a sawmill, a gristmill, and a distillery.
The village grew steadily throughout the 19th century, and by the early 20th century, it had become a thriving community. The village was incorporated in 1921, and it has remained a small but vibrant community ever since.
Geography
Northgate is located in Hamilton County, Ohio, just north of the city of Cincinnati. It is situated on the banks of the Little Miami River, and it is bordered by the cities of Sharonville and Forest Park to the north, and by the city of Cincinnati to the south.
The village covers an area of 1.3 square miles, and it has a population of approximately 4,000 people. The terrain is mostly flat, with some rolling hills in the northern part of the village. The climate is humid continental, with hot summers and cold winters.
Economy
Northgate’s economy is largely based on small businesses and services. The village is home to a number of small retail stores, restaurants, and other businesses. The village also has a number of industrial businesses, including a paper mill, a brickyard, and a sawmill.
The village is also home to a number of educational institutions, including Northgate High School, Northgate Middle School, and Northgate Elementary School. The village is served by the Cincinnati Metro bus system, and it is also served by the Cincinnati/Northern Kentucky International Airport.
Demographics
As of the 2010 census, the population of Northgate was 4,039. The racial makeup of the village was 87.3% White, 8.2% African American, 0.4% Native American, 0.7% Asian, 0.1% Pacific Islander, and 2.3% from other races. Hispanic or Latino of any race were 2.7% of the population.
The median household income in Northgate was $45,938, and the median family income was $54,844. The per capita income was $21,945. About 8.2% of families and 10.2% of the population were below the poverty line, including 14.2% of those under age 18 and 6.2% of those age 65 or over.
Northgate is a small but vibrant community with a rich history and a diverse population. The village is home to a number of small businesses and services, and it is served by the Cincinnati Metro bus system and the Cincinnati/Northern Kentucky International Airport. The village is also home to a number of educational institutions, and it has a median household income that is slightly higher than the national average.
Common Questions
What is Per Capita Income in Northgate?
Per Capita income in Northgate is $40,039.
What is the Median Family Income in Northgate?
Median Family Income in Northgate is $85,185.
What is the Median Household income in Northgate?
Median Household Income in Northgate is $69,099.
What is Income or Wage Gap in Northgate?
Income or Wage Gap in Northgate is 22.7%.
Women in Northgate earn 77.3 cents for every dollar earned by a man.
What is Inequality or Gini Index in Northgate?
Inequality or Gini Index in Northgate is 0.47.
What is the Total Population of Northgate?
Total Population of Northgate is 6,347.
What is the Total Male Population of Northgate?
Total Male Population of Northgate is 3,197.
What is the Total Female Population of Northgate?
Total Female Population of Northgate is 3,150.
What is the Ratio of Males per 100 Females in Northgate?
There are 101.49 Males per 100 Females in Northgate.
What is the Ratio of Females per 100 Males in Northgate?
There are 98.53 Females per 100 Males in Northgate.
What is the Median Population Age in Northgate?
Median Population Age in Northgate is 42.8 Years.
What is the Average Family Size in Northgate
Average Family Size in Northgate is 2.9 People.
What is the Average Household Size in Northgate
Average Household Size in Northgate is 2.4 People.
How Large is the Labor Force in Northgate?
There are 3,482 People in the Labor Forcein in Northgate.
What is the Percentage of People in the Labor Force in Northgate?
66.7% of People are in the Labor Force in Northgate.
What is the Unemployment Rate in Northgate?
Unemployment Rate in Northgate is 6.3%.