Mansfield, OH Map & Demographics
Mansfield Map
Mansfield Overview
$24,483
PER CAPITA INCOME
$52,252
AVG FAMILY INCOME
$40,996
AVG HOUSEHOLD INCOME
13.4%
WAGE / INCOME GAP [ % ]
86.6¢/ $1
WAGE / INCOME GAP [ $ ]
$10,381
FAMILY INCOME DEFICIT
0.49
INEQUALITY / GINI INDEX
47,630
TOTAL POPULATION
25,539
MALE POPULATION
22,091
FEMALE POPULATION
115.61
MALES / 100 FEMALES
86.50
FEMALES / 100 MALES
38.9
MEDIAN AGE
3.1
AVG FAMILY SIZE
2.2
AVG HOUSEHOLD SIZE
19,492
LABOR FORCE [ PEOPLE ]
49.2%
PERCENT IN LABOR FORCE
7.8%
UNEMPLOYMENT RATE
Income in Mansfield
Income Overview in Mansfield
Per Capita Income in Mansfield is $24,483, while median incomes of families and households are $52,252 and $40,996 respectively.
| Characteristic | Number | Measure |
| Per Capita Income | 47,630 | $24,483 |
| Median Family Income | 9,229 | $52,252 |
| Mean Family Income | 9,229 | $73,347 |
| Median Household Income | 18,899 | $40,996 |
| Mean Household Income | 18,899 | $58,276 |
| Income Deficit | 9,229 | $10,381 |
| Wage / Income Gap (%) | 47,630 | 13.38% |
| Wage / Income Gap ($) | 47,630 | 86.62¢ per $1 |
| Gini / Inequality Index | 47,630 | 0.49 |
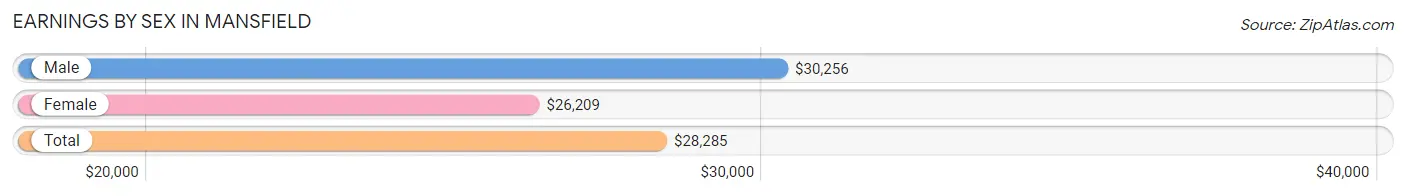
Earnings by Sex in Mansfield
Average Earnings in Mansfield are $28,285, $30,256 for men and $26,209 for women, a difference of 13.4%.
| Sex | Number | Average Earnings |
| Male | 11,594 (53.7%) | $30,256 |
| Female | 9,990 (46.3%) | $26,209 |
| Total | 21,584 (100.0%) | $28,285 |
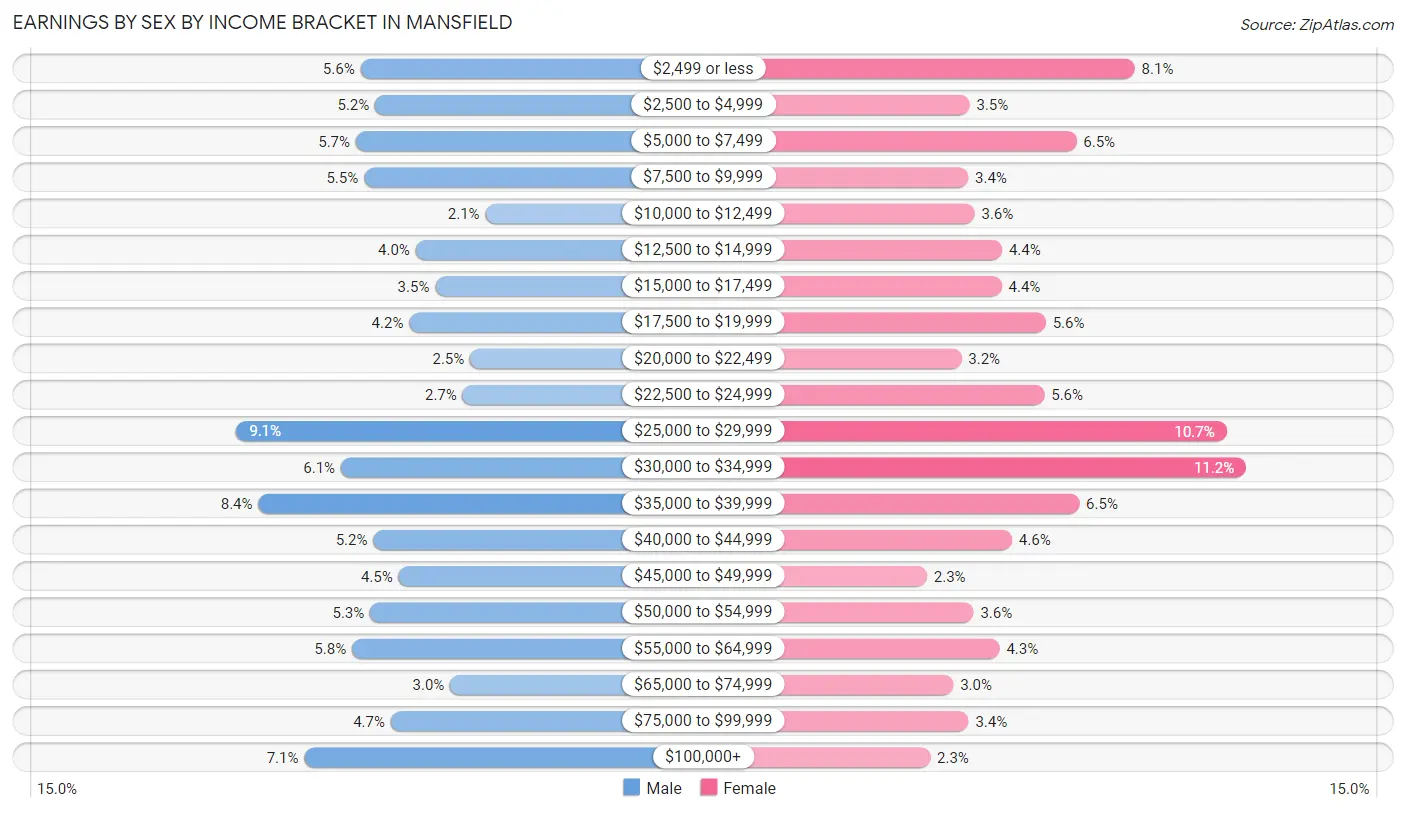
Earnings by Sex by Income Bracket in Mansfield
The most common earnings brackets in Mansfield are $25,000 to $29,999 for men (1,049 | 9.0%) and $30,000 to $34,999 for women (1,121 | 11.2%).
| Income | Male | Female |
| $2,499 or less | 645 (5.6%) | 808 (8.1%) |
| $2,500 to $4,999 | 597 (5.1%) | 345 (3.5%) |
| $5,000 to $7,499 | 660 (5.7%) | 644 (6.5%) |
| $7,500 to $9,999 | 633 (5.5%) | 341 (3.4%) |
| $10,000 to $12,499 | 238 (2.1%) | 359 (3.6%) |
| $12,500 to $14,999 | 465 (4.0%) | 436 (4.4%) |
| $15,000 to $17,499 | 401 (3.5%) | 435 (4.3%) |
| $17,500 to $19,999 | 486 (4.2%) | 558 (5.6%) |
| $20,000 to $22,499 | 288 (2.5%) | 322 (3.2%) |
| $22,500 to $24,999 | 312 (2.7%) | 554 (5.6%) |
| $25,000 to $29,999 | 1,049 (9.0%) | 1,066 (10.7%) |
| $30,000 to $34,999 | 708 (6.1%) | 1,121 (11.2%) |
| $35,000 to $39,999 | 977 (8.4%) | 652 (6.5%) |
| $40,000 to $44,999 | 603 (5.2%) | 464 (4.6%) |
| $45,000 to $49,999 | 521 (4.5%) | 225 (2.2%) |
| $50,000 to $54,999 | 613 (5.3%) | 356 (3.6%) |
| $55,000 to $64,999 | 672 (5.8%) | 429 (4.3%) |
| $65,000 to $74,999 | 352 (3.0%) | 299 (3.0%) |
| $75,000 to $99,999 | 546 (4.7%) | 342 (3.4%) |
| $100,000+ | 828 (7.1%) | 234 (2.3%) |
| Total | 11,594 (100.0%) | 9,990 (100.0%) |
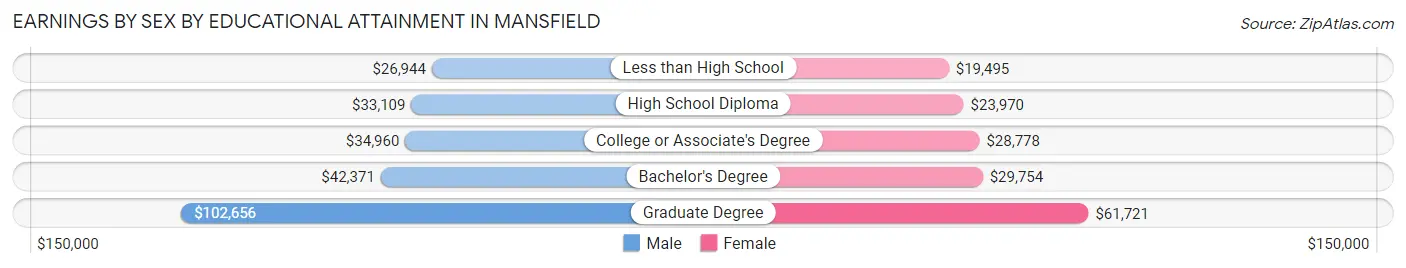
Earnings by Sex by Educational Attainment in Mansfield
Average earnings in Mansfield are $36,401 for men and $28,717 for women, a difference of 21.1%. Men with an educational attainment of graduate degree enjoy the highest average annual earnings of $102,656, while those with less than high school education earn the least with $26,944. Women with an educational attainment of graduate degree earn the most with the average annual earnings of $61,721, while those with less than high school education have the smallest earnings of $19,495.
| Educational Attainment | Male Income | Female Income |
| Less than High School | $26,944 | $19,495 |
| High School Diploma | $33,109 | $23,970 |
| College or Associate's Degree | $34,960 | $28,778 |
| Bachelor's Degree | $42,371 | $29,754 |
| Graduate Degree | $102,656 | $61,721 |
| Total | $36,401 | $28,717 |
Family Income in Mansfield
Family Income Brackets in Mansfield
According to the Mansfield family income data, there are 1,873 families falling into the $50,000 to $74,999 income range, which is the most common income bracket and makes up 20.3% of all families. Conversely, the $200,000+ income bracket is the least frequent group with only 295 families (3.2%) belonging to this category.
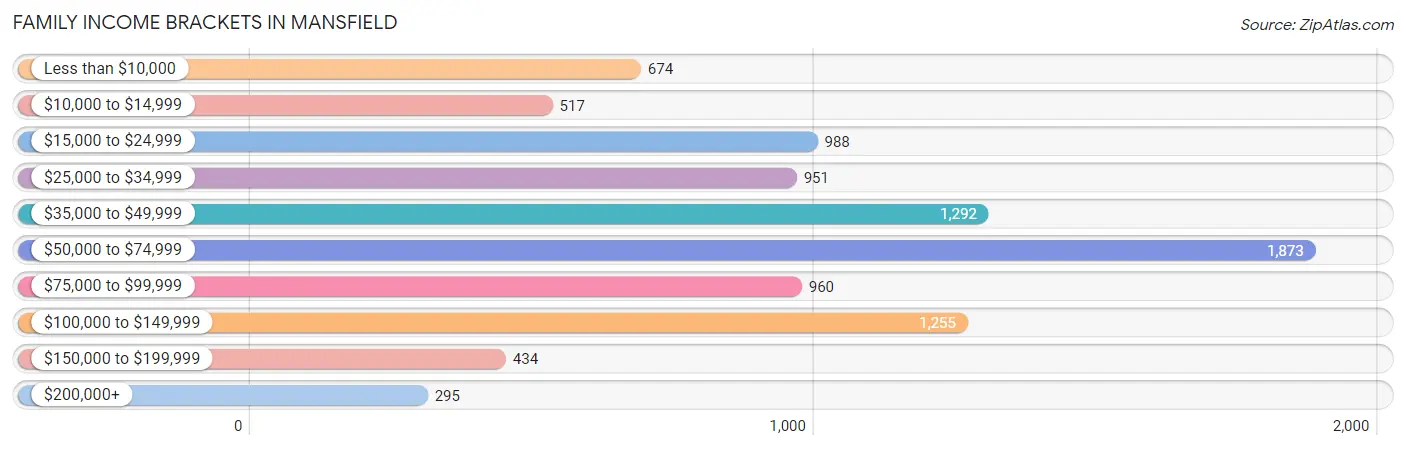
| Income Bracket | # Families | % Families |
| Less than $10,000 | 674 | 7.3% |
| $10,000 to $14,999 | 517 | 5.6% |
| $15,000 to $24,999 | 988 | 10.7% |
| $25,000 to $34,999 | 951 | 10.3% |
| $35,000 to $49,999 | 1,292 | 14.0% |
| $50,000 to $74,999 | 1,873 | 20.3% |
| $75,000 to $99,999 | 960 | 10.4% |
| $100,000 to $149,999 | 1,255 | 13.6% |
| $150,000 to $199,999 | 434 | 4.7% |
| $200,000+ | 295 | 3.2% |
Family Income by Famaliy Size in Mansfield
4-person families (1,327 | 14.4%) account for the highest median family income in Mansfield with $62,957 per family, while 2-person families (5,029 | 54.5%) have the highest median income of $24,827 per family member.
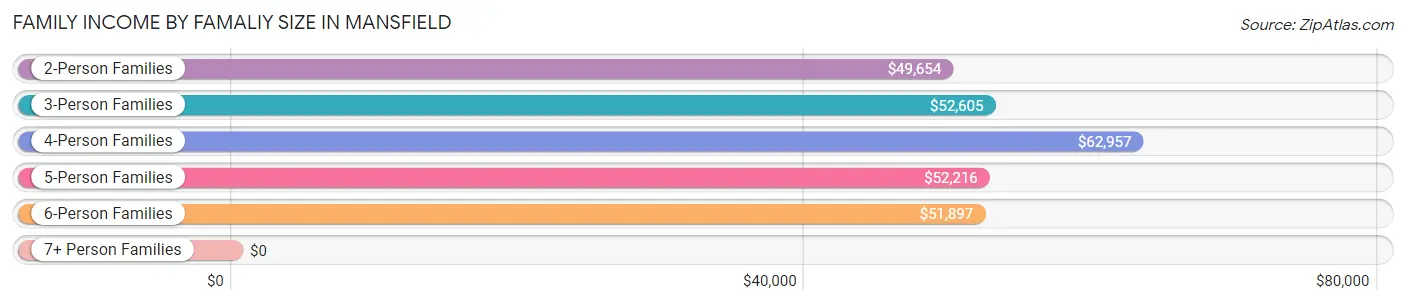
| Income Bracket | # Families | Median Income |
| 2-Person Families | 5,029 (54.5%) | $49,654 |
| 3-Person Families | 1,933 (20.9%) | $52,605 |
| 4-Person Families | 1,327 (14.4%) | $62,957 |
| 5-Person Families | 491 (5.3%) | $52,216 |
| 6-Person Families | 258 (2.8%) | $51,897 |
| 7+ Person Families | 191 (2.1%) | $0 |
| Total | 9,229 (100.0%) | $52,252 |
Family Income by Number of Earners in Mansfield
The median family income in Mansfield is $52,252, with families comprising 3+ earners (938) having the highest median family income of $101,415, while families with no earners (1,991) have the lowest median family income of $31,004, accounting for 10.2% and 21.6% of families, respectively.
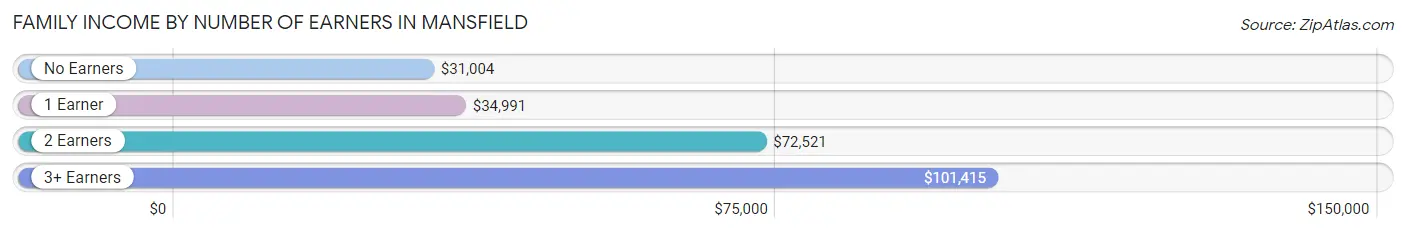
| Number of Earners | # Families | Median Income |
| No Earners | 1,991 (21.6%) | $31,004 |
| 1 Earner | 3,347 (36.3%) | $34,991 |
| 2 Earners | 2,953 (32.0%) | $72,521 |
| 3+ Earners | 938 (10.2%) | $101,415 |
| Total | 9,229 (100.0%) | $52,252 |
Household Income in Mansfield
Household Income Brackets in Mansfield
With 3,515 households falling in the category, the $50,000 to $74,999 income range is the most frequent in Mansfield, accounting for 18.6% of all households. In contrast, only 454 households (2.4%) fall into the $150,000 to $199,999 income bracket, making it the least populous group.
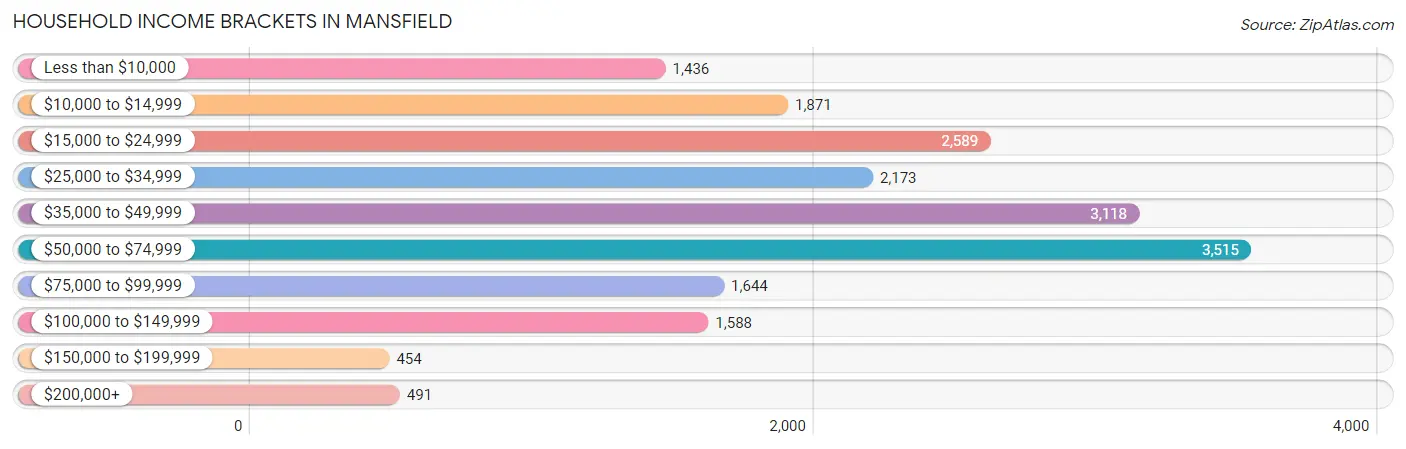
| Income Bracket | # Households | % Households |
| Less than $10,000 | 1,436 | 7.6% |
| $10,000 to $14,999 | 1,871 | 9.9% |
| $15,000 to $24,999 | 2,589 | 13.7% |
| $25,000 to $34,999 | 2,173 | 11.5% |
| $35,000 to $49,999 | 3,118 | 16.5% |
| $50,000 to $74,999 | 3,515 | 18.6% |
| $75,000 to $99,999 | 1,644 | 8.7% |
| $100,000 to $149,999 | 1,588 | 8.4% |
| $150,000 to $199,999 | 454 | 2.4% |
| $200,000+ | 491 | 2.6% |
Household Income by Householder Age in Mansfield
The median household income in Mansfield is $40,996, with the highest median household income of $47,847 found in the 45 to 64 years age bracket for the primary householder. A total of 6,112 households (32.3%) fall into this category. Meanwhile, the 15 to 24 years age bracket for the primary householder has the lowest median household income of $0, with 1,352 households (7.1%) in this group.
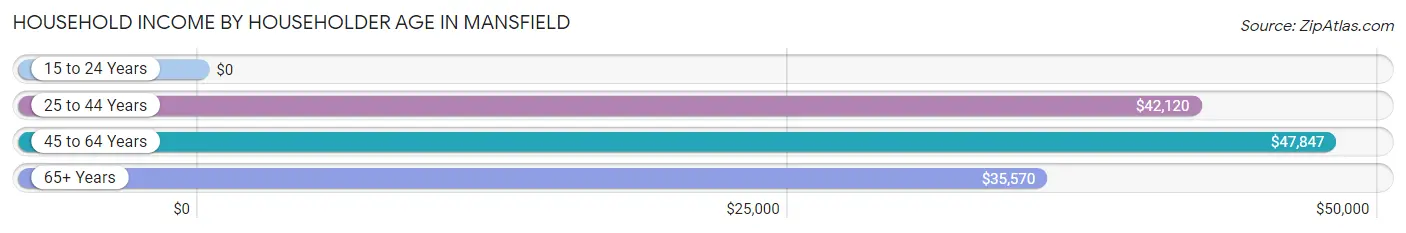
| Income Bracket | # Households | Median Income |
| 15 to 24 Years | 1,352 (7.1%) | $0 |
| 25 to 44 Years | 5,652 (29.9%) | $42,120 |
| 45 to 64 Years | 6,112 (32.3%) | $47,847 |
| 65+ Years | 5,783 (30.6%) | $35,570 |
| Total | 18,899 (100.0%) | $40,996 |
Poverty in Mansfield
Income Below Poverty by Sex and Age in Mansfield
With 23.0% poverty level for males and 27.0% for females among the residents of Mansfield, under 5 year old males and under 5 year old females are the most vulnerable to poverty, with 638 males (52.7%) and 752 females (54.3%) in their respective age groups living below the poverty level.
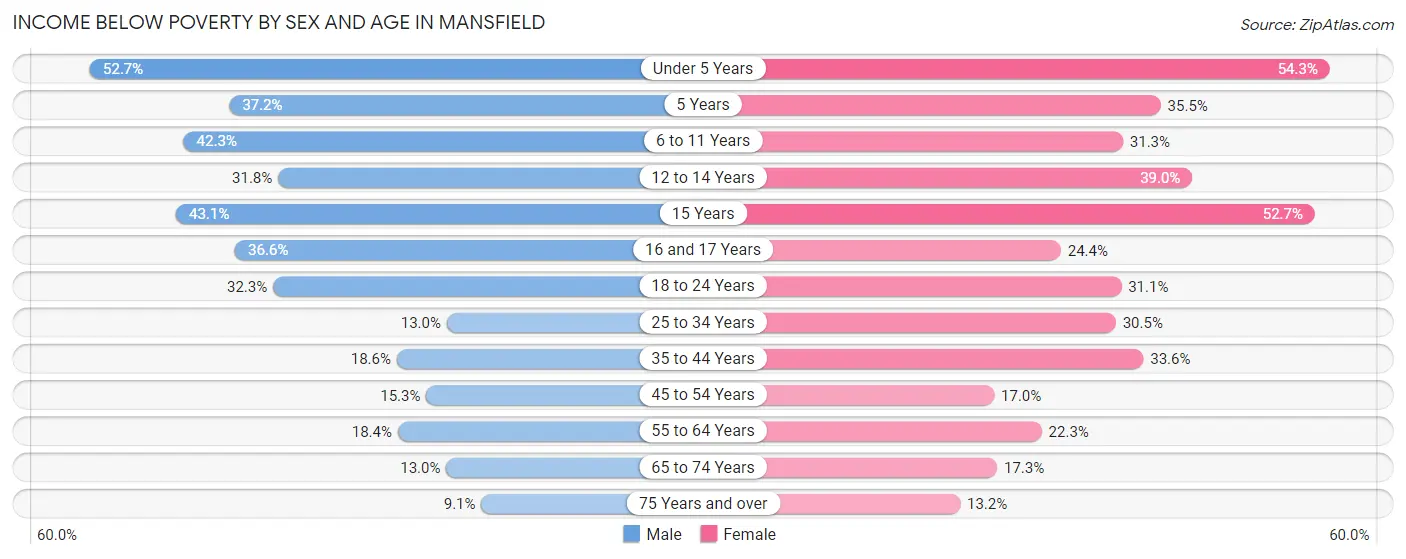
| Age Bracket | Male | Female |
| Under 5 Years | 638 (52.7%) | 752 (54.3%) |
| 5 Years | 32 (37.2%) | 114 (35.5%) |
| 6 to 11 Years | 583 (42.3%) | 425 (31.3%) |
| 12 to 14 Years | 258 (31.8%) | 270 (39.0%) |
| 15 Years | 91 (43.1%) | 148 (52.7%) |
| 16 and 17 Years | 197 (36.5%) | 141 (24.4%) |
| 18 to 24 Years | 766 (32.3%) | 540 (31.1%) |
| 25 to 34 Years | 358 (13.0%) | 865 (30.5%) |
| 35 to 44 Years | 562 (18.5%) | 819 (33.6%) |
| 45 to 54 Years | 328 (15.3%) | 423 (17.0%) |
| 55 to 64 Years | 451 (18.4%) | 549 (22.3%) |
| 65 to 74 Years | 277 (13.0%) | 462 (17.3%) |
| 75 Years and over | 102 (9.1%) | 293 (13.2%) |
| Total | 4,643 (23.0%) | 5,801 (27.0%) |
Income Above Poverty by Sex and Age in Mansfield
According to the poverty statistics in Mansfield, males aged 75 years and over and females aged 75 years and over are the age groups that are most secure financially, with 90.9% of males and 86.8% of females in these age groups living above the poverty line.
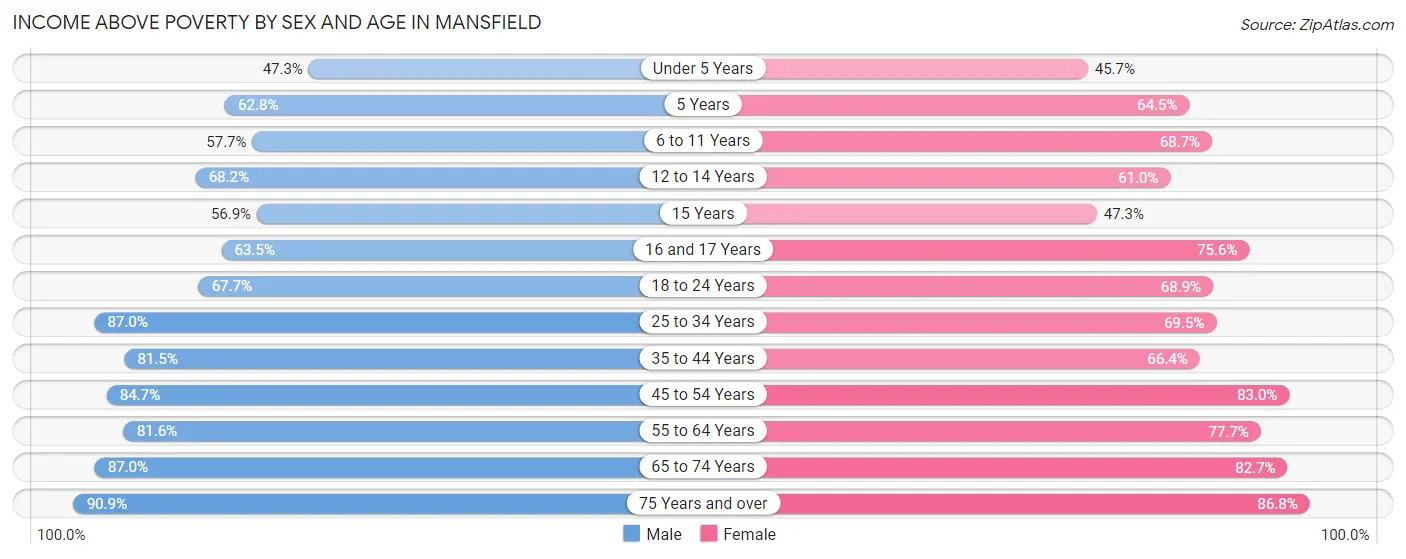
| Age Bracket | Male | Female |
| Under 5 Years | 572 (47.3%) | 632 (45.7%) |
| 5 Years | 54 (62.8%) | 207 (64.5%) |
| 6 to 11 Years | 796 (57.7%) | 933 (68.7%) |
| 12 to 14 Years | 554 (68.2%) | 422 (61.0%) |
| 15 Years | 120 (56.9%) | 133 (47.3%) |
| 16 and 17 Years | 342 (63.4%) | 437 (75.6%) |
| 18 to 24 Years | 1,603 (67.7%) | 1,195 (68.9%) |
| 25 to 34 Years | 2,401 (87.0%) | 1,970 (69.5%) |
| 35 to 44 Years | 2,467 (81.5%) | 1,620 (66.4%) |
| 45 to 54 Years | 1,822 (84.7%) | 2,071 (83.0%) |
| 55 to 64 Years | 1,995 (81.6%) | 1,917 (77.7%) |
| 65 to 74 Years | 1,848 (87.0%) | 2,210 (82.7%) |
| 75 Years and over | 1,015 (90.9%) | 1,931 (86.8%) |
| Total | 15,589 (77.0%) | 15,678 (73.0%) |
Income Below Poverty Among Married-Couple Families in Mansfield
The poverty statistics for married-couple families in Mansfield show that 5.7% or 298 of the total 5,264 families live below the poverty line. Families with 5 or more children have the highest poverty rate of 37.7%, comprising of 32 families. On the other hand, families with no children have the lowest poverty rate of 4.1%, which includes 152 families.
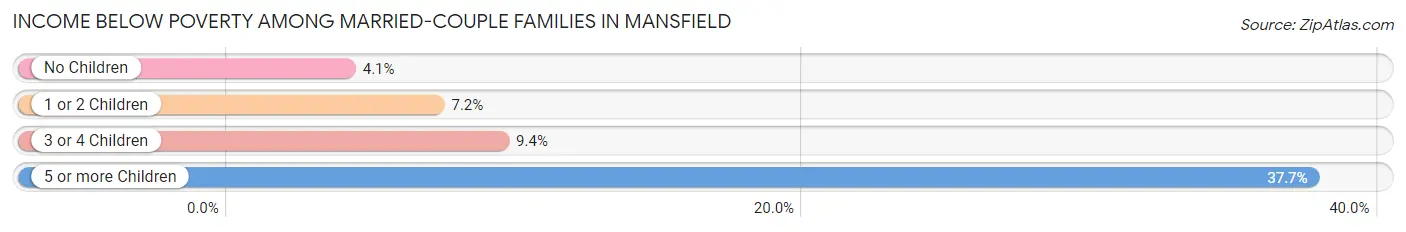
| Children | Above Poverty | Below Poverty |
| No Children | 3,554 (95.9%) | 152 (4.1%) |
| 1 or 2 Children | 1,033 (92.8%) | 80 (7.2%) |
| 3 or 4 Children | 326 (90.6%) | 34 (9.4%) |
| 5 or more Children | 53 (62.4%) | 32 (37.7%) |
| Total | 4,966 (94.3%) | 298 (5.7%) |
Income Below Poverty Among Single-Parent Households in Mansfield
According to the poverty data in Mansfield, 30.9% or 225 single-father households and 45.2% or 1,462 single-mother households are living below the poverty line. Among single-father households, those with 3 or 4 children have the highest poverty rate, with 28 households (39.4%) experiencing poverty. Likewise, among single-mother households, those with 5 or more children have the highest poverty rate, with 56 households (100.0%) falling below the poverty line.
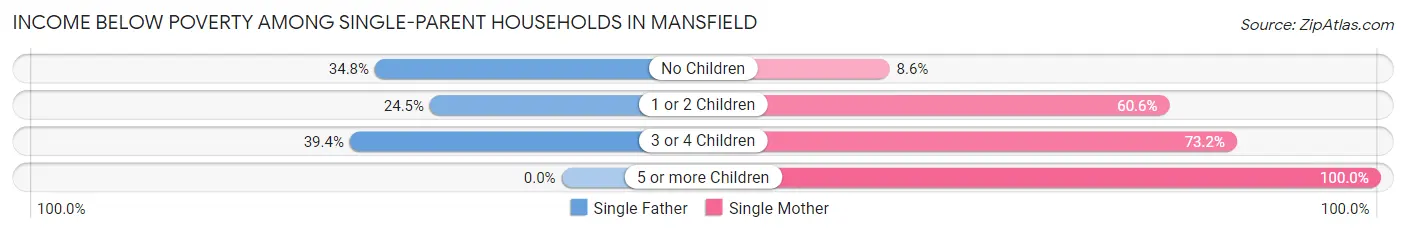
| Children | Single Father | Single Mother |
| No Children | 122 (34.8%) | 96 (8.6%) |
| 1 or 2 Children | 75 (24.5%) | 952 (60.6%) |
| 3 or 4 Children | 28 (39.4%) | 358 (73.2%) |
| 5 or more Children | 0 (0.0%) | 56 (100.0%) |
| Total | 225 (30.9%) | 1,462 (45.2%) |
Income Below Poverty Among Married-Couple vs Single-Parent Households in Mansfield
The poverty data for Mansfield shows that 298 of the married-couple family households (5.7%) and 1,687 of the single-parent households (42.5%) are living below the poverty level. Within the married-couple family households, those with 5 or more children have the highest poverty rate, with 32 households (37.7%) falling below the poverty line. Among the single-parent households, those with 5 or more children have the highest poverty rate, with 56 household (100.0%) living below poverty.
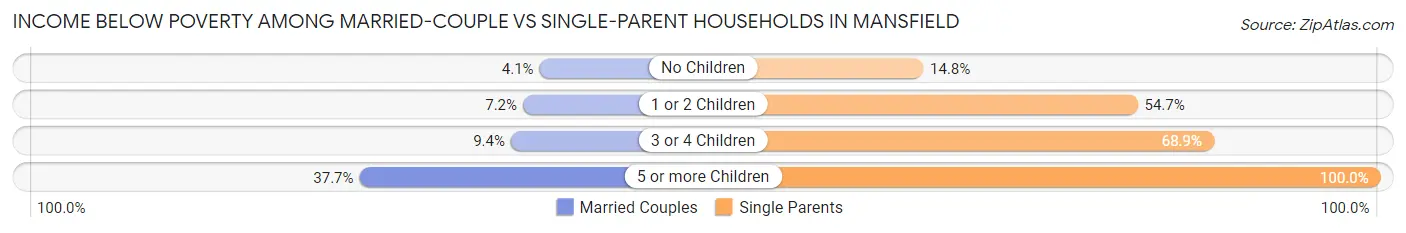
| Children | Married-Couple Families | Single-Parent Households |
| No Children | 152 (4.1%) | 218 (14.8%) |
| 1 or 2 Children | 80 (7.2%) | 1,027 (54.7%) |
| 3 or 4 Children | 34 (9.4%) | 386 (68.9%) |
| 5 or more Children | 32 (37.7%) | 56 (100.0%) |
| Total | 298 (5.7%) | 1,687 (42.5%) |
Race in Mansfield
The most populous races in Mansfield are White / Caucasian (33,398 | 70.1%), Black / African American (9,236 | 19.4%), and Two or more Races (3,741 | 7.9%).
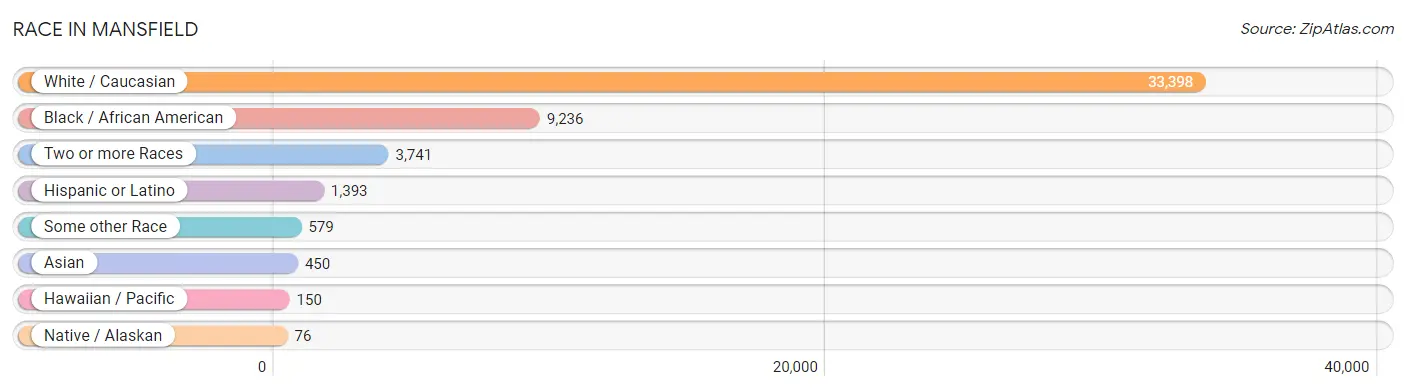
| Race | # Population | % Population |
| Asian | 450 | 0.9% |
| Black / African American | 9,236 | 19.4% |
| Hawaiian / Pacific | 150 | 0.3% |
| Hispanic or Latino | 1,393 | 2.9% |
| Native / Alaskan | 76 | 0.2% |
| White / Caucasian | 33,398 | 70.1% |
| Two or more Races | 3,741 | 7.9% |
| Some other Race | 579 | 1.2% |
| Total | 47,630 | 100.0% |
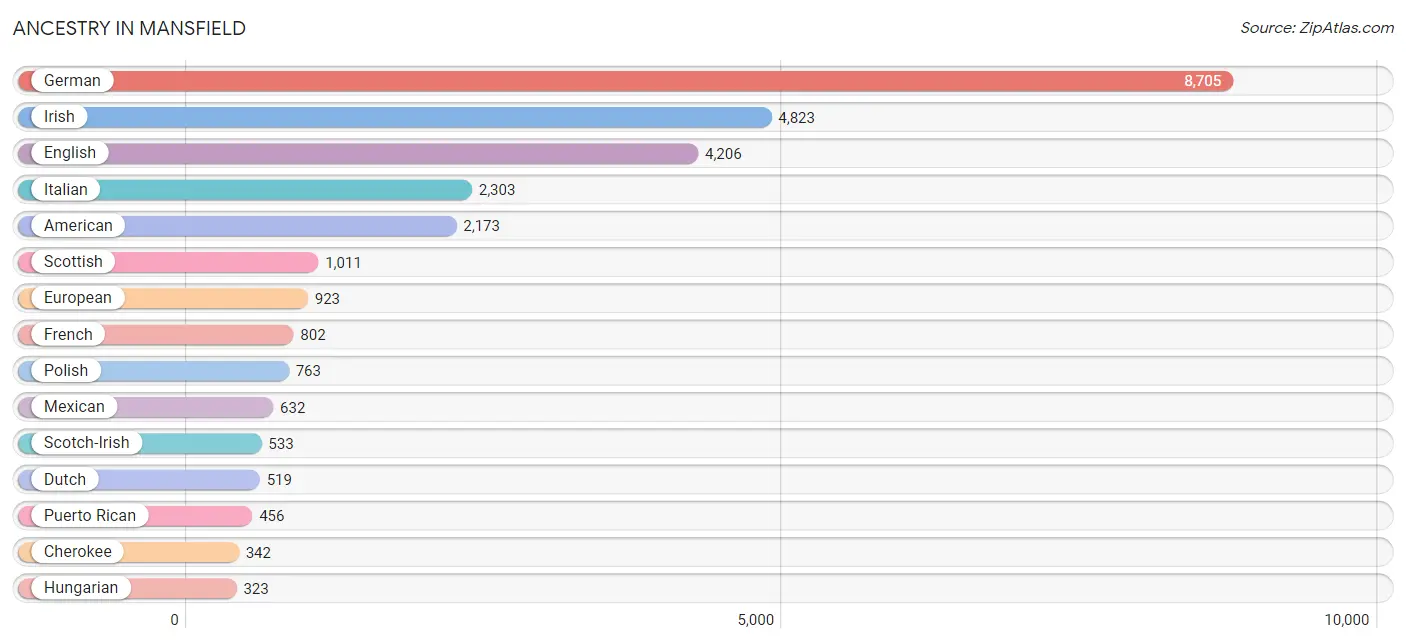
Ancestry in Mansfield
The most populous ancestries reported in Mansfield are German (8,705 | 18.3%), Irish (4,823 | 10.1%), English (4,206 | 8.8%), Italian (2,303 | 4.8%), and American (2,173 | 4.6%), together accounting for 46.6% of all Mansfield residents.
| Ancestry | # Population | % Population |
| African | 204 | 0.4% |
| American | 2,173 | 4.6% |
| Apache | 11 | 0.0% |
| Arab | 132 | 0.3% |
| Austrian | 104 | 0.2% |
| Belgian | 8 | 0.0% |
| Bhutanese | 34 | 0.1% |
| Blackfeet | 110 | 0.2% |
| British | 307 | 0.6% |
| Burmese | 114 | 0.2% |
| Cajun | 9 | 0.0% |
| Celtic | 73 | 0.2% |
| Central American | 52 | 0.1% |
| Central American Indian | 4 | 0.0% |
| Cherokee | 342 | 0.7% |
| Cheyenne | 19 | 0.0% |
| Chilean | 35 | 0.1% |
| Croatian | 37 | 0.1% |
| Crow | 5 | 0.0% |
| Cuban | 58 | 0.1% |
| Czech | 183 | 0.4% |
| Czechoslovakian | 154 | 0.3% |
| Danish | 11 | 0.0% |
| Delaware | 3 | 0.0% |
| Dutch | 519 | 1.1% |
| Eastern European | 48 | 0.1% |
| Ecuadorian | 25 | 0.1% |
| Egyptian | 5 | 0.0% |
| English | 4,206 | 8.8% |
| European | 923 | 1.9% |
| Finnish | 32 | 0.1% |
| French | 802 | 1.7% |
| French Canadian | 251 | 0.5% |
| German | 8,705 | 18.3% |
| Greek | 196 | 0.4% |
| Haitian | 7 | 0.0% |
| Honduran | 6 | 0.0% |
| Hungarian | 323 | 0.7% |
| Indian (Asian) | 117 | 0.3% |
| Irish | 4,823 | 10.1% |
| Iroquois | 3 | 0.0% |
| Italian | 2,303 | 4.8% |
| Jamaican | 106 | 0.2% |
| Korean | 179 | 0.4% |
| Latvian | 31 | 0.1% |
| Lebanese | 86 | 0.2% |
| Lithuanian | 25 | 0.1% |
| Macedonian | 144 | 0.3% |
| Mexican | 632 | 1.3% |
| Mexican American Indian | 7 | 0.0% |
| Native Hawaiian | 45 | 0.1% |
| Navajo | 34 | 0.1% |
| Nigerian | 15 | 0.0% |
| Northern European | 24 | 0.1% |
| Norwegian | 37 | 0.1% |
| Panamanian | 28 | 0.1% |
| Pennsylvania German | 14 | 0.0% |
| Polish | 763 | 1.6% |
| Portuguese | 49 | 0.1% |
| Puerto Rican | 456 | 1.0% |
| Romanian | 118 | 0.3% |
| Russian | 223 | 0.5% |
| Salvadoran | 18 | 0.0% |
| Samoan | 13 | 0.0% |
| Scandinavian | 67 | 0.1% |
| Scotch-Irish | 533 | 1.1% |
| Scottish | 1,011 | 2.1% |
| Seminole | 8 | 0.0% |
| Serbian | 78 | 0.2% |
| Sioux | 33 | 0.1% |
| Slovak | 145 | 0.3% |
| Slovene | 14 | 0.0% |
| South American | 60 | 0.1% |
| Spaniard | 25 | 0.1% |
| Spanish | 15 | 0.0% |
| Sri Lankan | 52 | 0.1% |
| Subsaharan African | 224 | 0.5% |
| Swedish | 111 | 0.2% |
| Swiss | 154 | 0.3% |
| Syrian | 11 | 0.0% |
| Thai | 137 | 0.3% |
| Ukrainian | 93 | 0.2% |
| Welsh | 314 | 0.7% |
| West Indian | 11 | 0.0% |
| Yugoslavian | 101 | 0.2% | View All 85 Rows |
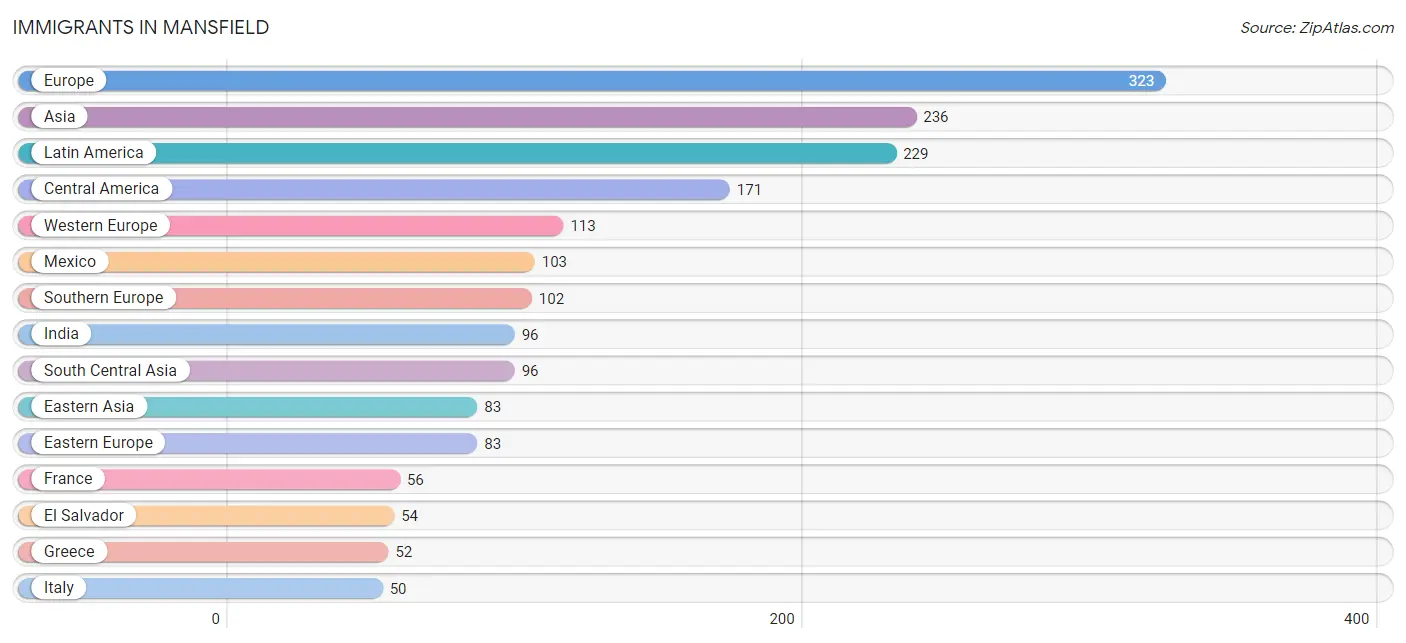
Immigrants in Mansfield
The most numerous immigrant groups reported in Mansfield came from Europe (323 | 0.7%), Asia (236 | 0.5%), Latin America (229 | 0.5%), Central America (171 | 0.4%), and Western Europe (113 | 0.2%), together accounting for 2.3% of all Mansfield residents.
| Immigration Origin | # Population | % Population |
| Africa | 40 | 0.1% |
| Asia | 236 | 0.5% |
| Austria | 16 | 0.0% |
| Bosnia and Herzegovina | 12 | 0.0% |
| Brazil | 46 | 0.1% |
| Bulgaria | 1 | 0.0% |
| Canada | 11 | 0.0% |
| Caribbean | 12 | 0.0% |
| Central America | 171 | 0.4% |
| China | 32 | 0.1% |
| Croatia | 13 | 0.0% |
| Dominican Republic | 4 | 0.0% |
| Eastern Asia | 83 | 0.2% |
| Eastern Europe | 83 | 0.2% |
| Egypt | 5 | 0.0% |
| El Salvador | 54 | 0.1% |
| England | 17 | 0.0% |
| Europe | 323 | 0.7% |
| France | 56 | 0.1% |
| Germany | 41 | 0.1% |
| Greece | 52 | 0.1% |
| India | 96 | 0.2% |
| Iraq | 5 | 0.0% |
| Israel | 26 | 0.1% |
| Italy | 50 | 0.1% |
| Jamaica | 8 | 0.0% |
| Japan | 25 | 0.1% |
| Korea | 26 | 0.1% |
| Latin America | 229 | 0.5% |
| Mexico | 103 | 0.2% |
| North Macedonia | 13 | 0.0% |
| Northern Africa | 5 | 0.0% |
| Northern Europe | 25 | 0.1% |
| Panama | 14 | 0.0% |
| Philippines | 26 | 0.1% |
| South Africa | 35 | 0.1% |
| South America | 46 | 0.1% |
| South Central Asia | 96 | 0.2% |
| South Eastern Asia | 26 | 0.1% |
| Southern Europe | 102 | 0.2% |
| Ukraine | 7 | 0.0% |
| Western Asia | 31 | 0.1% |
| Western Europe | 113 | 0.2% | View All 43 Rows |
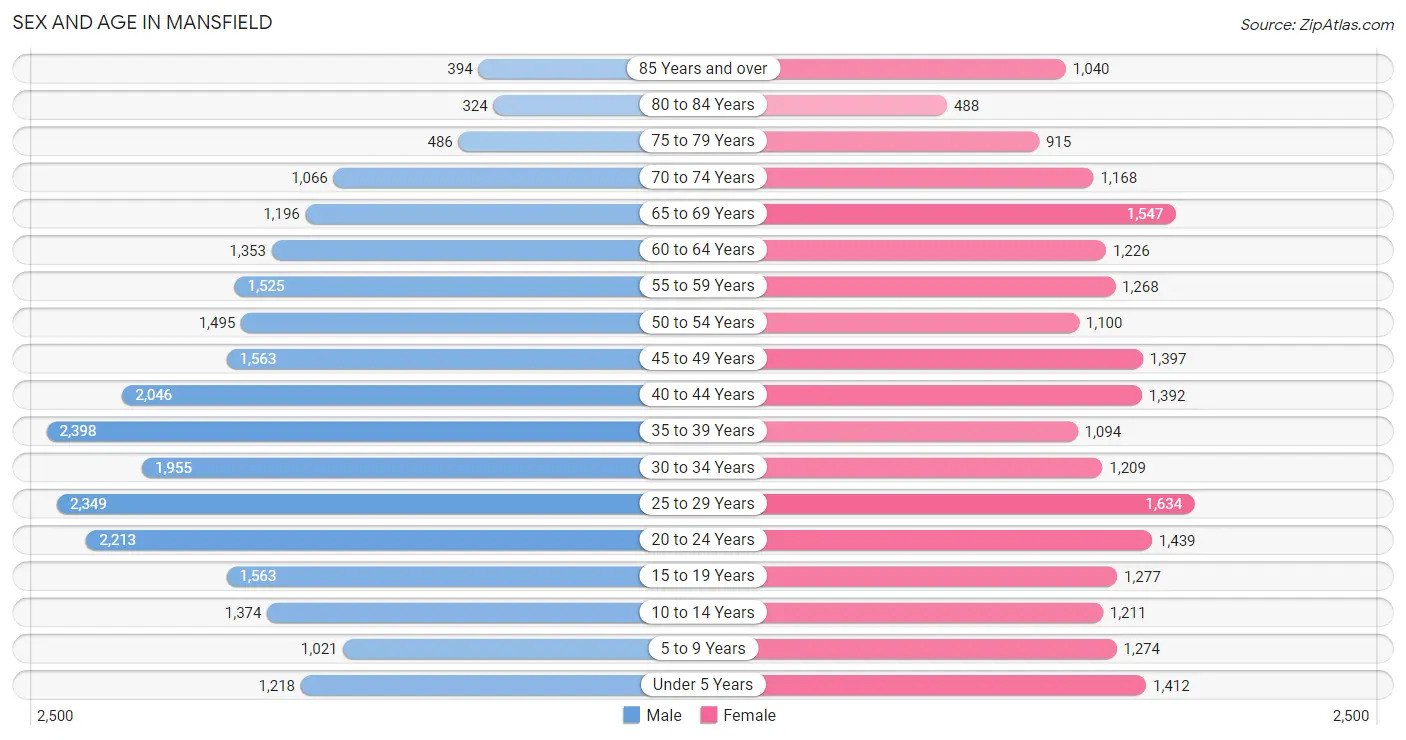
Sex and Age in Mansfield
Sex and Age in Mansfield
The most populous age groups in Mansfield are 35 to 39 Years (2,398 | 9.4%) for men and 25 to 29 Years (1,634 | 7.4%) for women.
| Age Bracket | Male | Female |
| Under 5 Years | 1,218 (4.8%) | 1,412 (6.4%) |
| 5 to 9 Years | 1,021 (4.0%) | 1,274 (5.8%) |
| 10 to 14 Years | 1,374 (5.4%) | 1,211 (5.5%) |
| 15 to 19 Years | 1,563 (6.1%) | 1,277 (5.8%) |
| 20 to 24 Years | 2,213 (8.7%) | 1,439 (6.5%) |
| 25 to 29 Years | 2,349 (9.2%) | 1,634 (7.4%) |
| 30 to 34 Years | 1,955 (7.6%) | 1,209 (5.5%) |
| 35 to 39 Years | 2,398 (9.4%) | 1,094 (5.0%) |
| 40 to 44 Years | 2,046 (8.0%) | 1,392 (6.3%) |
| 45 to 49 Years | 1,563 (6.1%) | 1,397 (6.3%) |
| 50 to 54 Years | 1,495 (5.9%) | 1,100 (5.0%) |
| 55 to 59 Years | 1,525 (6.0%) | 1,268 (5.7%) |
| 60 to 64 Years | 1,353 (5.3%) | 1,226 (5.6%) |
| 65 to 69 Years | 1,196 (4.7%) | 1,547 (7.0%) |
| 70 to 74 Years | 1,066 (4.2%) | 1,168 (5.3%) |
| 75 to 79 Years | 486 (1.9%) | 915 (4.1%) |
| 80 to 84 Years | 324 (1.3%) | 488 (2.2%) |
| 85 Years and over | 394 (1.5%) | 1,040 (4.7%) |
| Total | 25,539 (100.0%) | 22,091 (100.0%) |
Families and Households in Mansfield
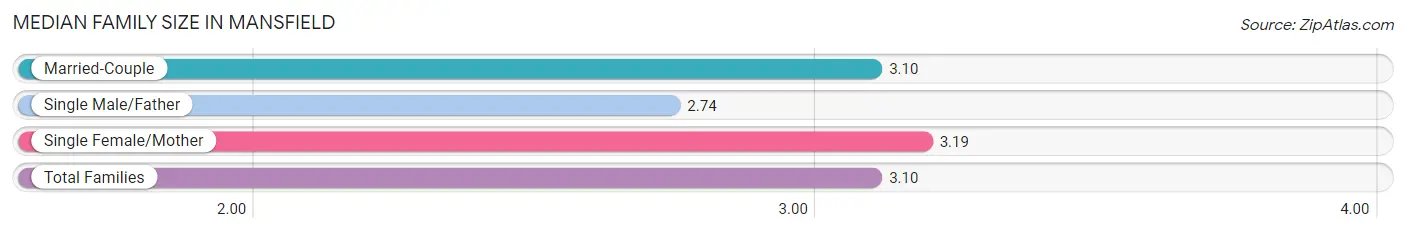
Median Family Size in Mansfield
The median family size in Mansfield is 3.10 persons per family, with single female/mother families (3,237 | 35.1%) accounting for the largest median family size of 3.19 persons per family. On the other hand, single male/father families (728 | 7.9%) represent the smallest median family size with 2.74 persons per family.
| Family Type | # Families | Family Size |
| Married-Couple | 5,264 (57.0%) | 3.10 |
| Single Male/Father | 728 (7.9%) | 2.74 |
| Single Female/Mother | 3,237 (35.1%) | 3.19 |
| Total Families | 9,229 (100.0%) | 3.10 |
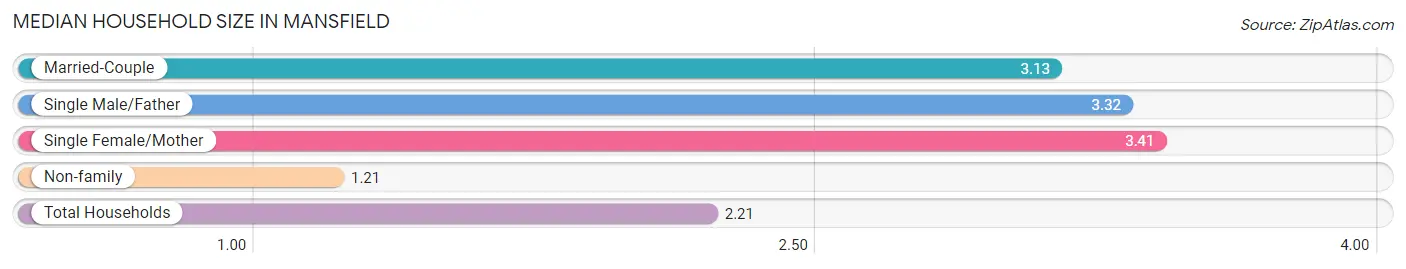
Median Household Size in Mansfield
The median household size in Mansfield is 2.21 persons per household, with single female/mother households (3,237 | 17.1%) accounting for the largest median household size of 3.41 persons per household. non-family households (9,670 | 51.2%) represent the smallest median household size with 1.21 persons per household.
| Household Type | # Households | Household Size |
| Married-Couple | 5,264 (27.9%) | 3.13 |
| Single Male/Father | 728 (3.8%) | 3.32 |
| Single Female/Mother | 3,237 (17.1%) | 3.41 |
| Non-family | 9,670 (51.2%) | 1.21 |
| Total Households | 18,899 (100.0%) | 2.21 |
Household Size by Marriage Status in Mansfield
Out of a total of 18,899 households in Mansfield, 9,229 (48.8%) are family households, while 9,670 (51.2%) are nonfamily households. The most numerous type of family households are 2-person households, comprising 4,645, and the most common type of nonfamily households are 1-person households, comprising 7,693.
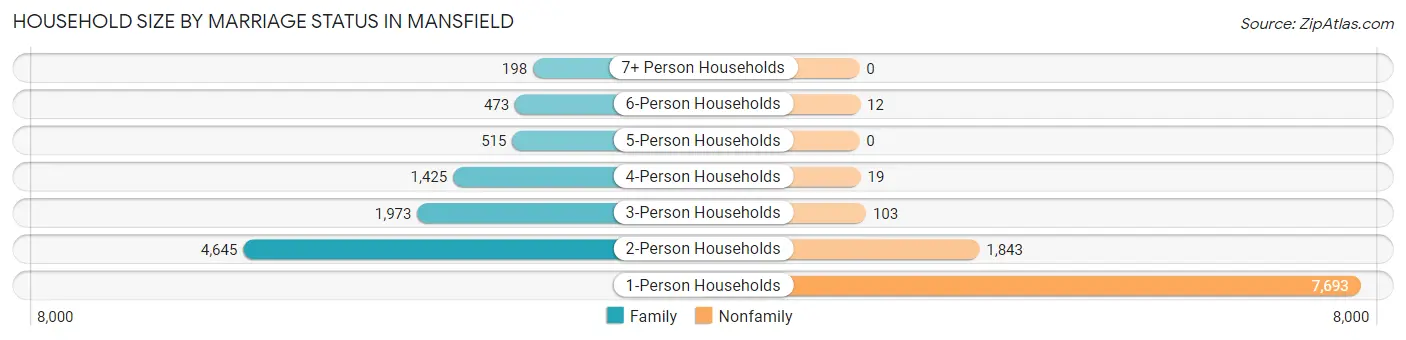
| Household Size | Family Households | Nonfamily Households |
| 1-Person Households | - | 7,693 (40.7%) |
| 2-Person Households | 4,645 (24.6%) | 1,843 (9.8%) |
| 3-Person Households | 1,973 (10.4%) | 103 (0.5%) |
| 4-Person Households | 1,425 (7.5%) | 19 (0.1%) |
| 5-Person Households | 515 (2.7%) | 0 (0.0%) |
| 6-Person Households | 473 (2.5%) | 12 (0.1%) |
| 7+ Person Households | 198 (1.1%) | 0 (0.0%) |
| Total | 9,229 (48.8%) | 9,670 (51.2%) |
Female Fertility in Mansfield
Fertility by Age in Mansfield
Average fertility rate in Mansfield is 63.0 births per 1,000 women. Women in the age bracket of 20 to 34 years have the highest fertility rate with 105.0 births per 1,000 women. Women in the age bracket of 20 to 34 years acount for 74.3% of all women with births.
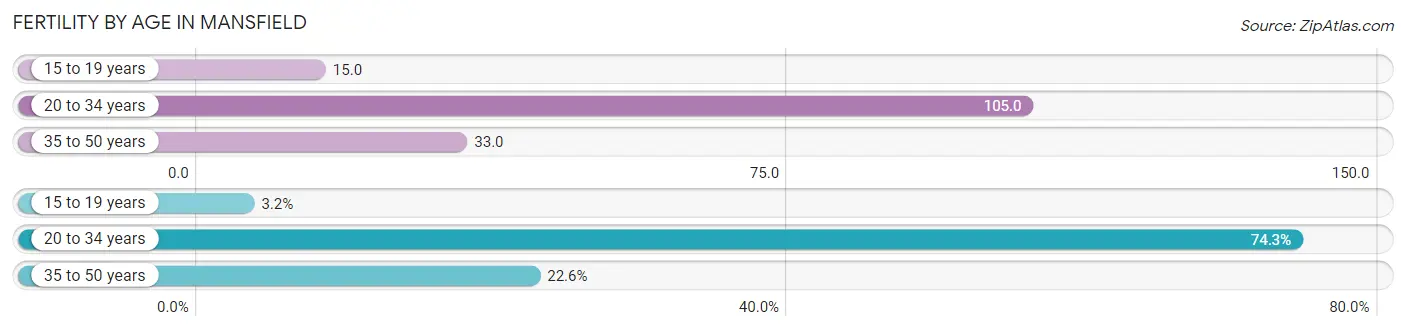
| Age Bracket | Women with Births | Births / 1,000 Women |
| 15 to 19 years | 19 (3.2%) | 15.0 |
| 20 to 34 years | 448 (74.3%) | 105.0 |
| 35 to 50 years | 136 (22.6%) | 33.0 |
| Total | 603 (100.0%) | 63.0 |
Fertility by Age by Marriage Status in Mansfield
30.8% of women with births (603) in Mansfield are married. The highest percentage of unmarried women with births falls into 15 to 19 years age bracket with 100.0% of them unmarried at the time of birth, while the lowest percentage of unmarried women with births belong to 35 to 50 years age bracket with 38.2% of them unmarried.
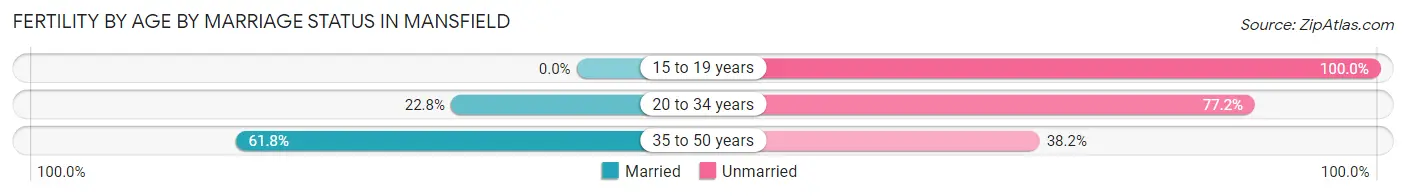
| Age Bracket | Married | Unmarried |
| 15 to 19 years | 0 (0.0%) | 19 (100.0%) |
| 20 to 34 years | 102 (22.8%) | 346 (77.2%) |
| 35 to 50 years | 84 (61.8%) | 52 (38.2%) |
| Total | 186 (30.8%) | 417 (69.2%) |
Fertility by Education in Mansfield
Average fertility rate in Mansfield is 63.0 births per 1,000 women. Women with the education attainment of less than high school have the highest fertility rate of 66.0 births per 1,000 women, while women with the education attainment of graduate degree have the lowest fertility at 27.0 births per 1,000 women. Women with the education attainment of college or associate's degree represent 37.5% of all women with births.
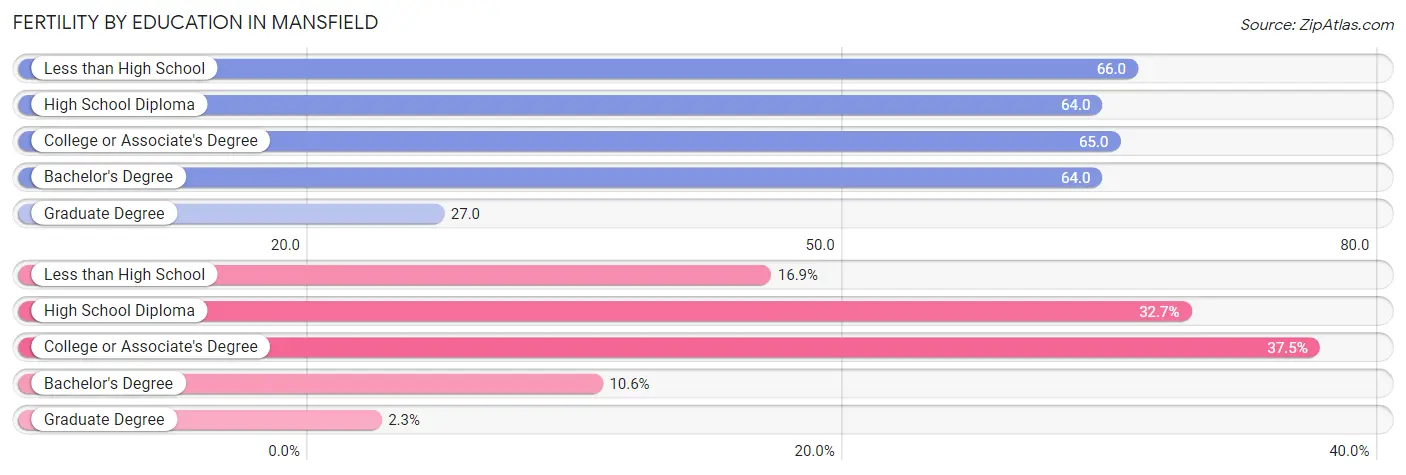
| Educational Attainment | Women with Births | Births / 1,000 Women |
| Less than High School | 102 (16.9%) | 66.0 |
| High School Diploma | 197 (32.7%) | 64.0 |
| College or Associate's Degree | 226 (37.5%) | 65.0 |
| Bachelor's Degree | 64 (10.6%) | 64.0 |
| Graduate Degree | 14 (2.3%) | 27.0 |
| Total | 603 (100.0%) | 63.0 |
Fertility by Education by Marriage Status in Mansfield
69.2% of women with births in Mansfield are unmarried. Women with the educational attainment of bachelor's degree are most likely to be married with 60.9% of them married at childbirth, while women with the educational attainment of less than high school are least likely to be married with 100.0% of them unmarried at childbirth.
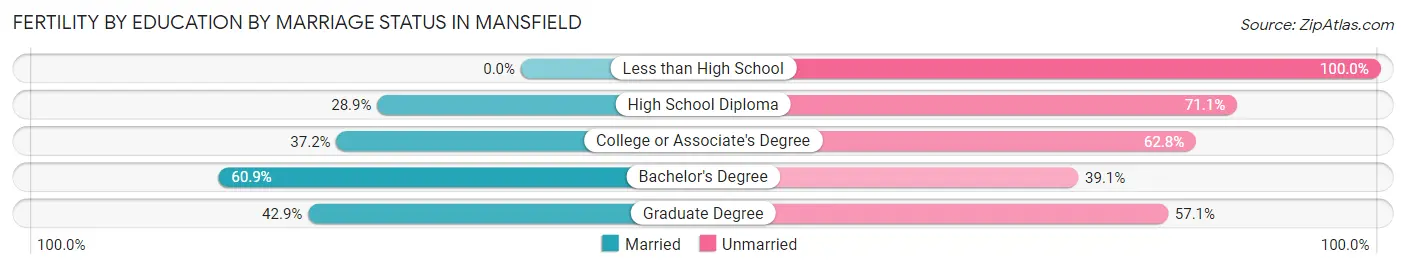
| Educational Attainment | Married | Unmarried |
| Less than High School | 0 (0.0%) | 102 (100.0%) |
| High School Diploma | 57 (28.9%) | 140 (71.1%) |
| College or Associate's Degree | 84 (37.2%) | 142 (62.8%) |
| Bachelor's Degree | 39 (60.9%) | 25 (39.1%) |
| Graduate Degree | 6 (42.9%) | 8 (57.1%) |
| Total | 186 (30.8%) | 417 (69.2%) |
Employment Characteristics in Mansfield
Employment by Class of Employer in Mansfield
Among the 17,390 employed individuals in Mansfield, private company employees (12,802 | 73.6%), not-for-profit organizations (1,716 | 9.9%), and local government employees (1,257 | 7.2%) make up the most common classes of employment.
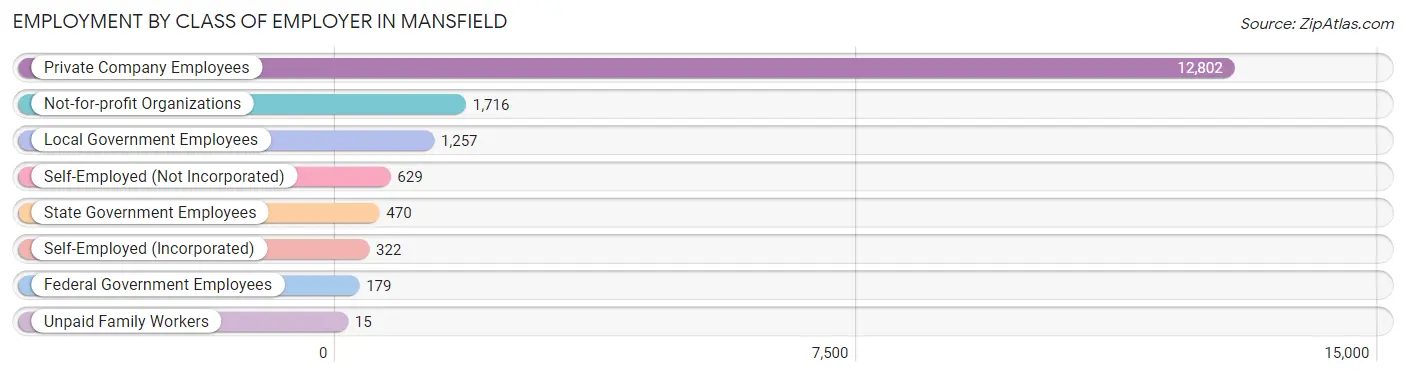
| Employer Class | # Employees | % Employees |
| Private Company Employees | 12,802 | 73.6% |
| Self-Employed (Incorporated) | 322 | 1.8% |
| Self-Employed (Not Incorporated) | 629 | 3.6% |
| Not-for-profit Organizations | 1,716 | 9.9% |
| Local Government Employees | 1,257 | 7.2% |
| State Government Employees | 470 | 2.7% |
| Federal Government Employees | 179 | 1.0% |
| Unpaid Family Workers | 15 | 0.1% |
| Total | 17,390 | 100.0% |
Employment Status by Age in Mansfield
According to the labor force statistics for Mansfield, out of the total population over 16 years of age (39,617), 49.2% or 19,492 individuals are in the labor force, with 7.8% or 1,520 of them unemployed. The age group with the highest labor force participation rate is 20 to 24 years, with 66.0% or 2,410 individuals in the labor force. Within the labor force, the 25 to 29 years age range has the highest percentage of unemployed individuals, with 15.4% or 394 of them being unemployed.
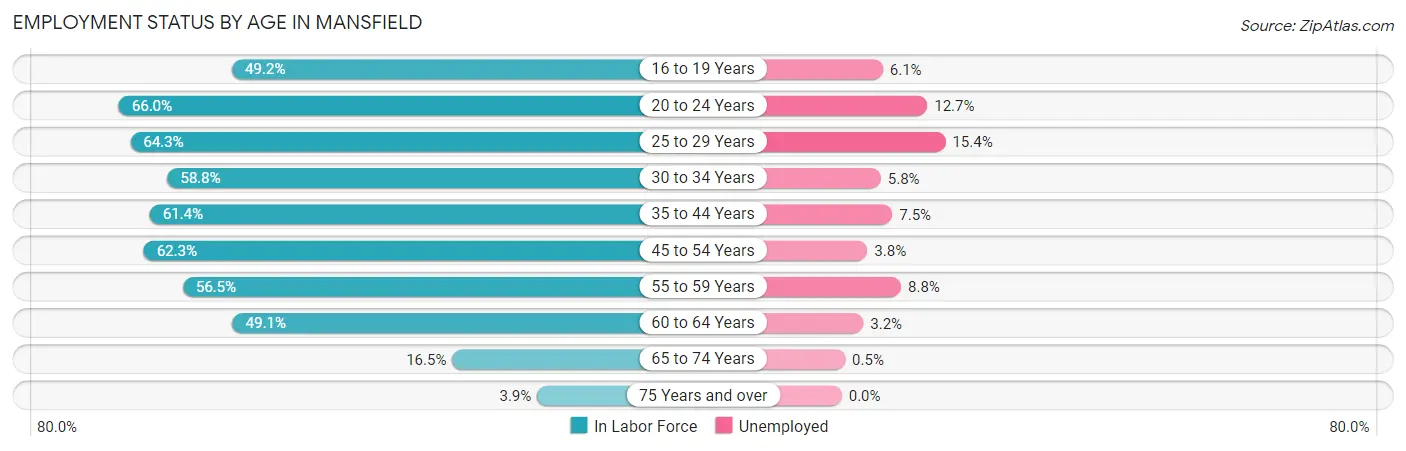
| Age Bracket | In Labor Force | Unemployed |
| 16 to 19 Years | 1,150 (49.2%) | 70 (6.1%) |
| 20 to 24 Years | 2,410 (66.0%) | 306 (12.7%) |
| 25 to 29 Years | 2,561 (64.3%) | 394 (15.4%) |
| 30 to 34 Years | 1,860 (58.8%) | 108 (5.8%) |
| 35 to 44 Years | 4,255 (61.4%) | 319 (7.5%) |
| 45 to 54 Years | 3,461 (62.3%) | 132 (3.8%) |
| 55 to 59 Years | 1,578 (56.5%) | 139 (8.8%) |
| 60 to 64 Years | 1,266 (49.1%) | 41 (3.2%) |
| 65 to 74 Years | 821 (16.5%) | 4 (0.5%) |
| 75 Years and over | 142 (3.9%) | 0 (0.0%) |
| Total | 19,492 (49.2%) | 1,520 (7.8%) |
Employment Status by Educational Attainment in Mansfield
According to labor force statistics for Mansfield, 59.9% of individuals (14,977) out of the total population between 25 and 64 years of age (25,004) are in the labor force, with 7.6% or 1,138 of them being unemployed. The group with the highest labor force participation rate are those with the educational attainment of bachelor's degree or higher, with 77.8% or 2,871 individuals in the labor force. Within the labor force, individuals with less than high school education have the highest percentage of unemployment, with 13.1% or 99 of them being unemployed.
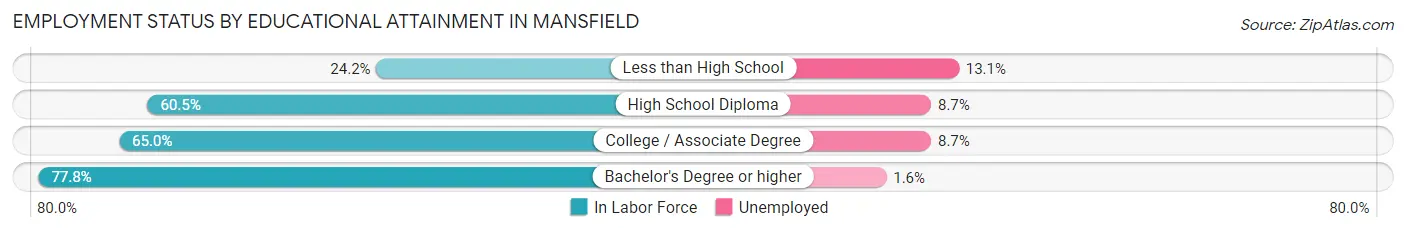
| Educational Attainment | In Labor Force | Unemployed |
| Less than High School | 755 (24.2%) | 409 (13.1%) |
| High School Diploma | 6,314 (60.5%) | 908 (8.7%) |
| College / Associate Degree | 5,043 (65.0%) | 675 (8.7%) |
| Bachelor's Degree or higher | 2,871 (77.8%) | 59 (1.6%) |
| Total | 14,977 (59.9%) | 1,900 (7.6%) |
Employment Occupations by Sex in Mansfield
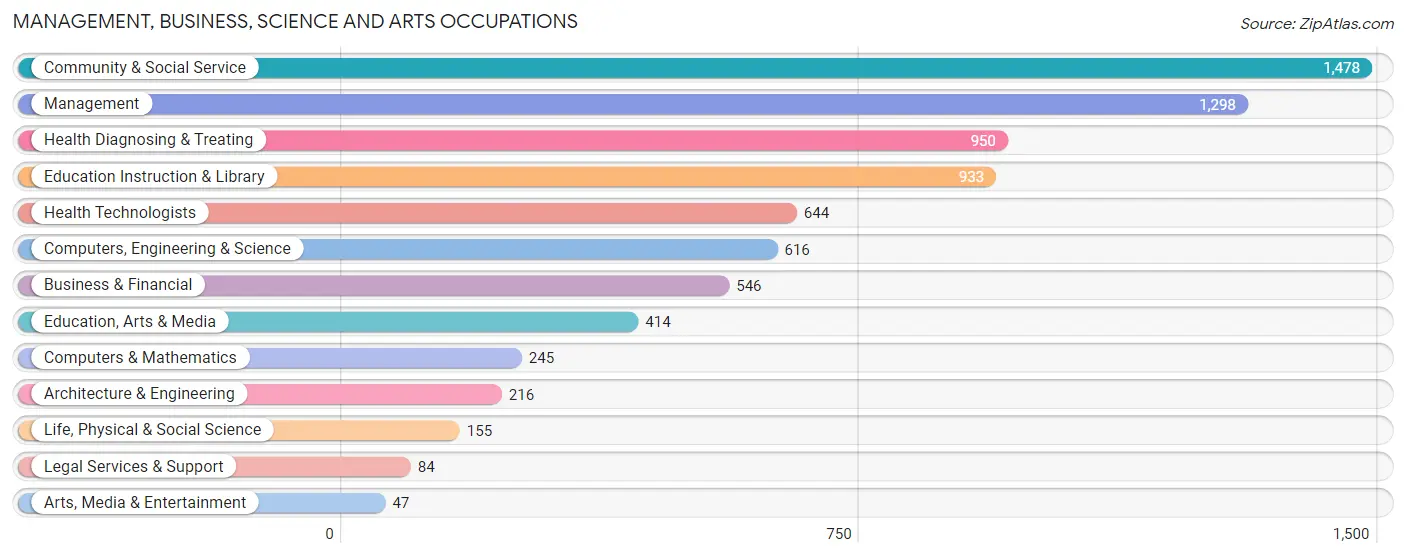
Management, Business, Science and Arts Occupations
The most common Management, Business, Science and Arts occupations in Mansfield are Community & Social Service (1,478 | 8.2%), Management (1,298 | 7.2%), Health Diagnosing & Treating (950 | 5.3%), Education Instruction & Library (933 | 5.2%), and Health Technologists (644 | 3.6%).
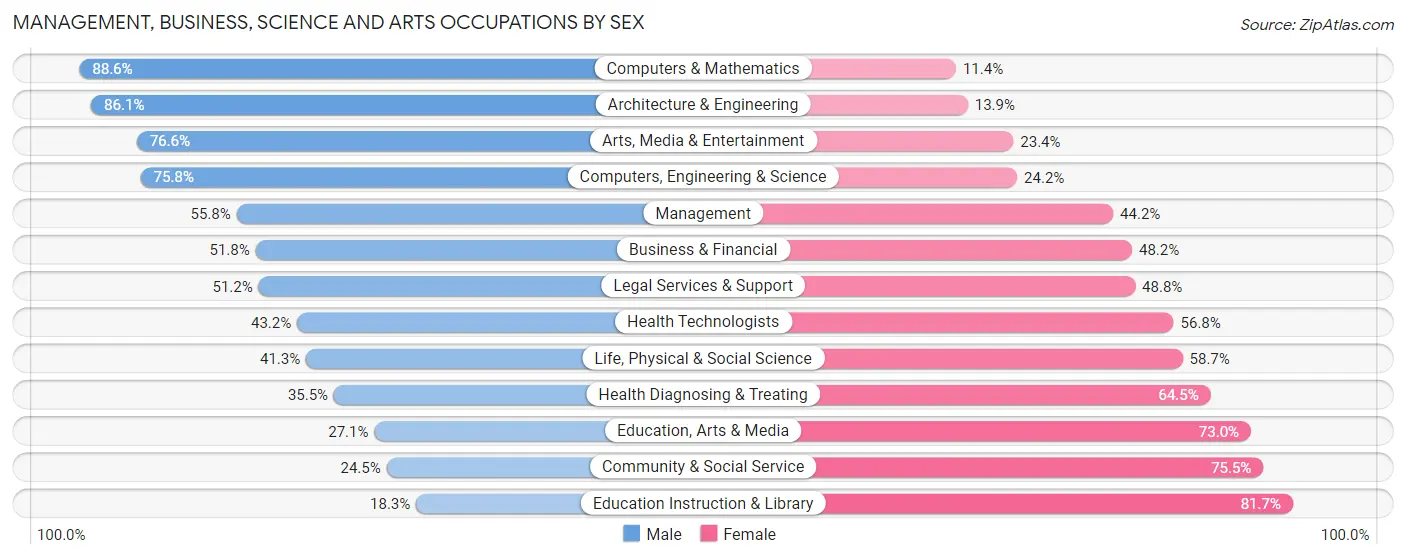
Management, Business, Science and Arts Occupations by Sex
Within the Management, Business, Science and Arts occupations in Mansfield, the most male-oriented occupations are Computers & Mathematics (88.6%), Architecture & Engineering (86.1%), and Arts, Media & Entertainment (76.6%), while the most female-oriented occupations are Education Instruction & Library (81.7%), Community & Social Service (75.5%), and Education, Arts & Media (73.0%).
| Occupation | Male | Female |
| Management | 724 (55.8%) | 574 (44.2%) |
| Business & Financial | 283 (51.8%) | 263 (48.2%) |
| Computers, Engineering & Science | 467 (75.8%) | 149 (24.2%) |
| Computers & Mathematics | 217 (88.6%) | 28 (11.4%) |
| Architecture & Engineering | 186 (86.1%) | 30 (13.9%) |
| Life, Physical & Social Science | 64 (41.3%) | 91 (58.7%) |
| Community & Social Service | 362 (24.5%) | 1,116 (75.5%) |
| Education, Arts & Media | 112 (27.1%) | 302 (73.0%) |
| Legal Services & Support | 43 (51.2%) | 41 (48.8%) |
| Education Instruction & Library | 171 (18.3%) | 762 (81.7%) |
| Arts, Media & Entertainment | 36 (76.6%) | 11 (23.4%) |
| Health Diagnosing & Treating | 337 (35.5%) | 613 (64.5%) |
| Health Technologists | 278 (43.2%) | 366 (56.8%) |
| Total (Category) | 2,173 (44.5%) | 2,715 (55.5%) |
| Total (Overall) | 9,374 (52.1%) | 8,615 (47.9%) |
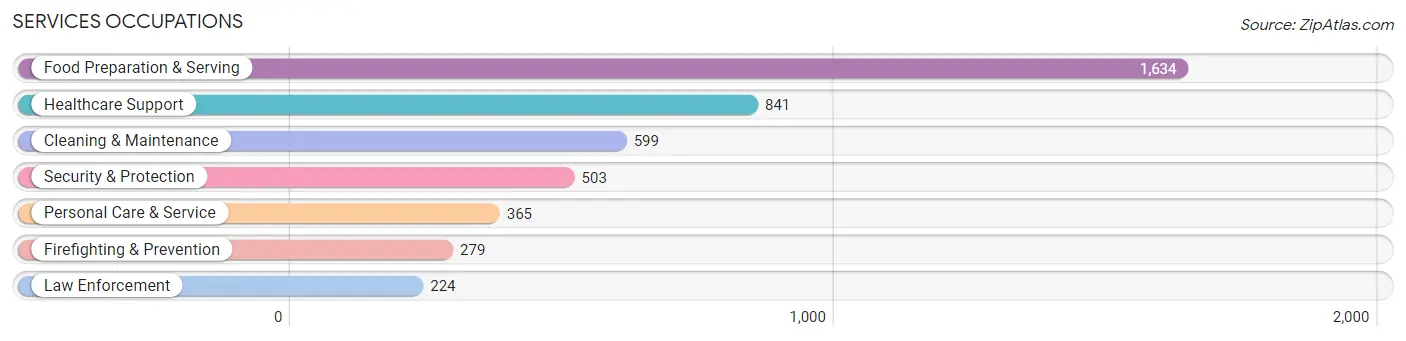
Services Occupations
The most common Services occupations in Mansfield are Food Preparation & Serving (1,634 | 9.1%), Healthcare Support (841 | 4.7%), Cleaning & Maintenance (599 | 3.3%), Security & Protection (503 | 2.8%), and Personal Care & Service (365 | 2.0%).
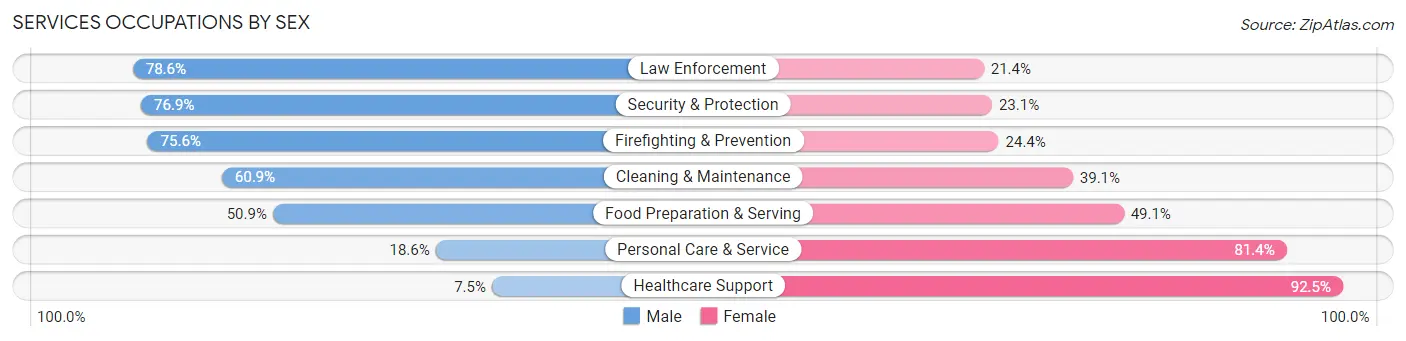
Services Occupations by Sex
Within the Services occupations in Mansfield, the most male-oriented occupations are Law Enforcement (78.6%), Security & Protection (76.9%), and Firefighting & Prevention (75.6%), while the most female-oriented occupations are Healthcare Support (92.5%), Personal Care & Service (81.4%), and Food Preparation & Serving (49.1%).
| Occupation | Male | Female |
| Healthcare Support | 63 (7.5%) | 778 (92.5%) |
| Security & Protection | 387 (76.9%) | 116 (23.1%) |
| Firefighting & Prevention | 211 (75.6%) | 68 (24.4%) |
| Law Enforcement | 176 (78.6%) | 48 (21.4%) |
| Food Preparation & Serving | 831 (50.9%) | 803 (49.1%) |
| Cleaning & Maintenance | 365 (60.9%) | 234 (39.1%) |
| Personal Care & Service | 68 (18.6%) | 297 (81.4%) |
| Total (Category) | 1,714 (43.5%) | 2,228 (56.5%) |
| Total (Overall) | 9,374 (52.1%) | 8,615 (47.9%) |
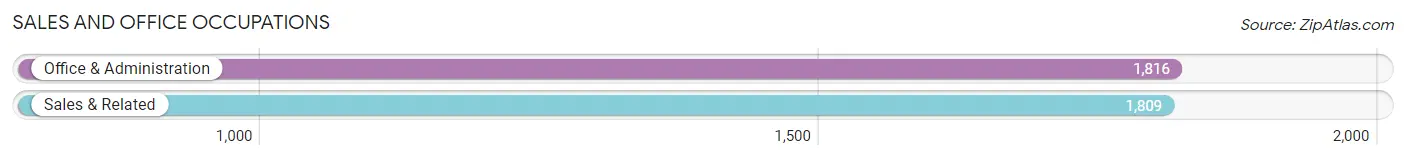
Sales and Office Occupations
The most common Sales and Office occupations in Mansfield are Office & Administration (1,816 | 10.1%), and Sales & Related (1,809 | 10.1%).
Sales and Office Occupations by Sex
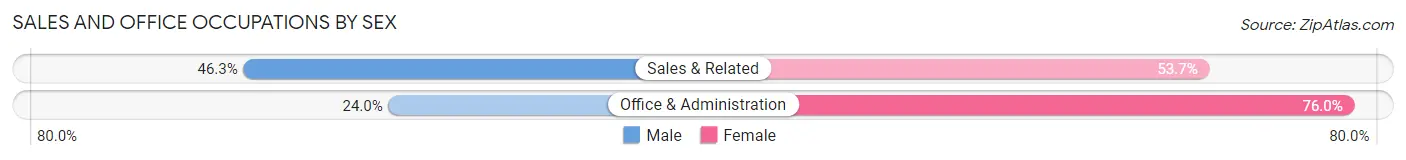
| Occupation | Male | Female |
| Sales & Related | 838 (46.3%) | 971 (53.7%) |
| Office & Administration | 436 (24.0%) | 1,380 (76.0%) |
| Total (Category) | 1,274 (35.1%) | 2,351 (64.9%) |
| Total (Overall) | 9,374 (52.1%) | 8,615 (47.9%) |
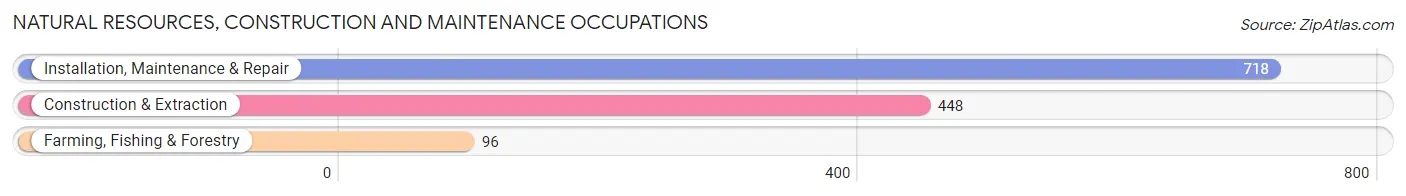
Natural Resources, Construction and Maintenance Occupations
The most common Natural Resources, Construction and Maintenance occupations in Mansfield are Installation, Maintenance & Repair (718 | 4.0%), Construction & Extraction (448 | 2.5%), and Farming, Fishing & Forestry (96 | 0.5%).
Natural Resources, Construction and Maintenance Occupations by Sex
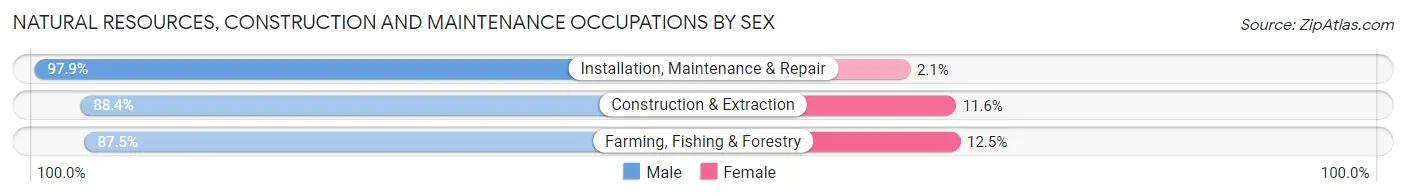
| Occupation | Male | Female |
| Farming, Fishing & Forestry | 84 (87.5%) | 12 (12.5%) |
| Construction & Extraction | 396 (88.4%) | 52 (11.6%) |
| Installation, Maintenance & Repair | 703 (97.9%) | 15 (2.1%) |
| Total (Category) | 1,183 (93.7%) | 79 (6.3%) |
| Total (Overall) | 9,374 (52.1%) | 8,615 (47.9%) |
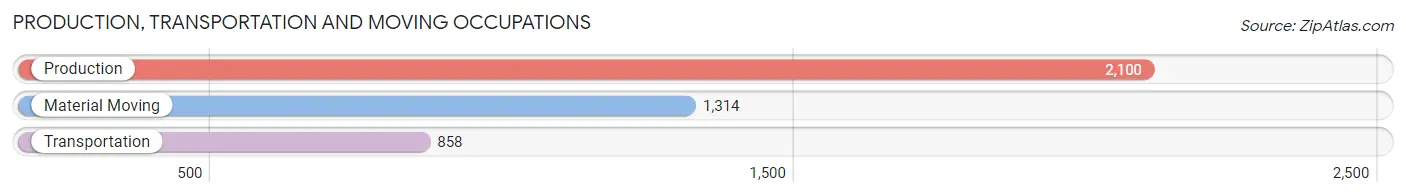
Production, Transportation and Moving Occupations
The most common Production, Transportation and Moving occupations in Mansfield are Production (2,100 | 11.7%), Material Moving (1,314 | 7.3%), and Transportation (858 | 4.8%).
Production, Transportation and Moving Occupations by Sex
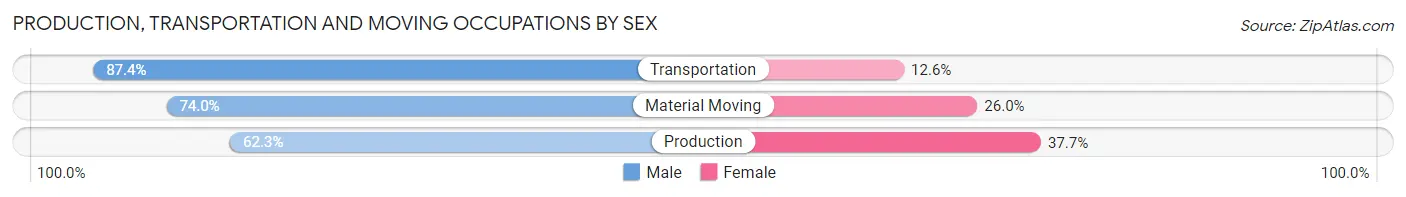
| Occupation | Male | Female |
| Production | 1,308 (62.3%) | 792 (37.7%) |
| Transportation | 750 (87.4%) | 108 (12.6%) |
| Material Moving | 972 (74.0%) | 342 (26.0%) |
| Total (Category) | 3,030 (70.9%) | 1,242 (29.1%) |
| Total (Overall) | 9,374 (52.1%) | 8,615 (47.9%) |
Employment Industries by Sex in Mansfield
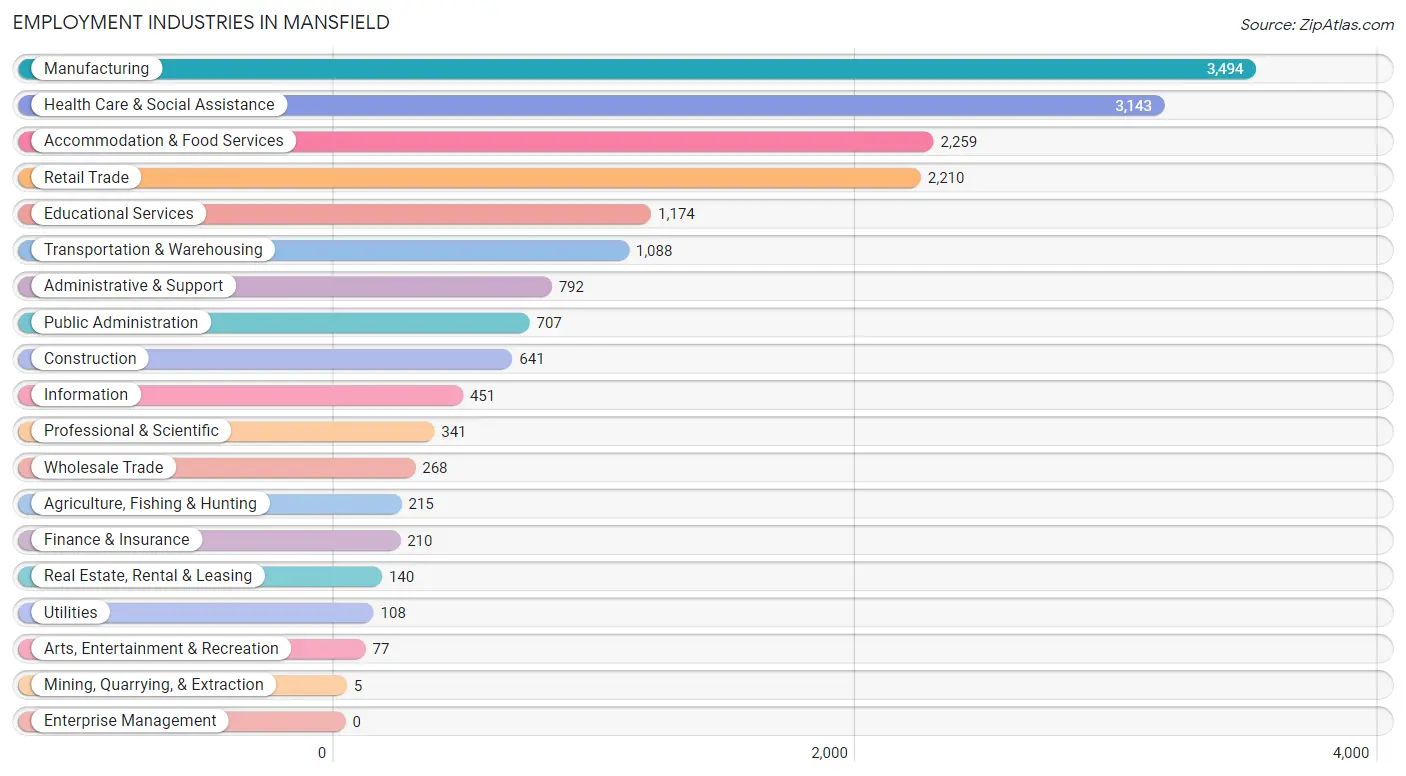
Employment Industries in Mansfield
The major employment industries in Mansfield include Manufacturing (3,494 | 19.4%), Health Care & Social Assistance (3,143 | 17.5%), Accommodation & Food Services (2,259 | 12.6%), Retail Trade (2,210 | 12.3%), and Educational Services (1,174 | 6.5%).
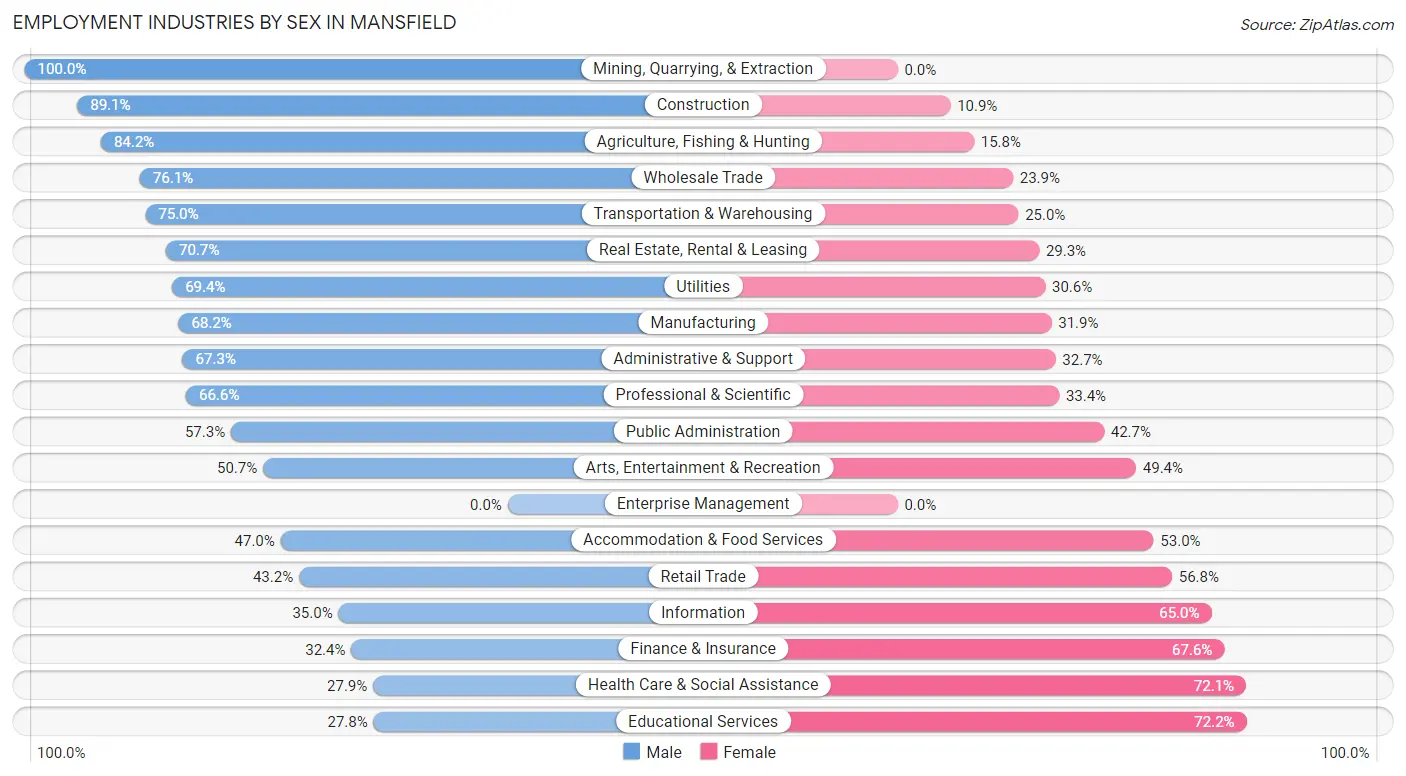
Employment Industries by Sex in Mansfield
The Mansfield industries that see more men than women are Mining, Quarrying, & Extraction (100.0%), Construction (89.1%), and Agriculture, Fishing & Hunting (84.2%), whereas the industries that tend to have a higher number of women are Educational Services (72.2%), Health Care & Social Assistance (72.1%), and Finance & Insurance (67.6%).
| Industry | Male | Female |
| Agriculture, Fishing & Hunting | 181 (84.2%) | 34 (15.8%) |
| Mining, Quarrying, & Extraction | 5 (100.0%) | 0 (0.0%) |
| Construction | 571 (89.1%) | 70 (10.9%) |
| Manufacturing | 2,381 (68.1%) | 1,113 (31.9%) |
| Wholesale Trade | 204 (76.1%) | 64 (23.9%) |
| Retail Trade | 955 (43.2%) | 1,255 (56.8%) |
| Transportation & Warehousing | 816 (75.0%) | 272 (25.0%) |
| Utilities | 75 (69.4%) | 33 (30.6%) |
| Information | 158 (35.0%) | 293 (65.0%) |
| Finance & Insurance | 68 (32.4%) | 142 (67.6%) |
| Real Estate, Rental & Leasing | 99 (70.7%) | 41 (29.3%) |
| Professional & Scientific | 227 (66.6%) | 114 (33.4%) |
| Enterprise Management | 0 (0.0%) | 0 (0.0%) |
| Administrative & Support | 533 (67.3%) | 259 (32.7%) |
| Educational Services | 326 (27.8%) | 848 (72.2%) |
| Health Care & Social Assistance | 876 (27.9%) | 2,267 (72.1%) |
| Arts, Entertainment & Recreation | 39 (50.6%) | 38 (49.3%) |
| Accommodation & Food Services | 1,062 (47.0%) | 1,197 (53.0%) |
| Public Administration | 405 (57.3%) | 302 (42.7%) |
| Total | 9,374 (52.1%) | 8,615 (47.9%) |
Education in Mansfield
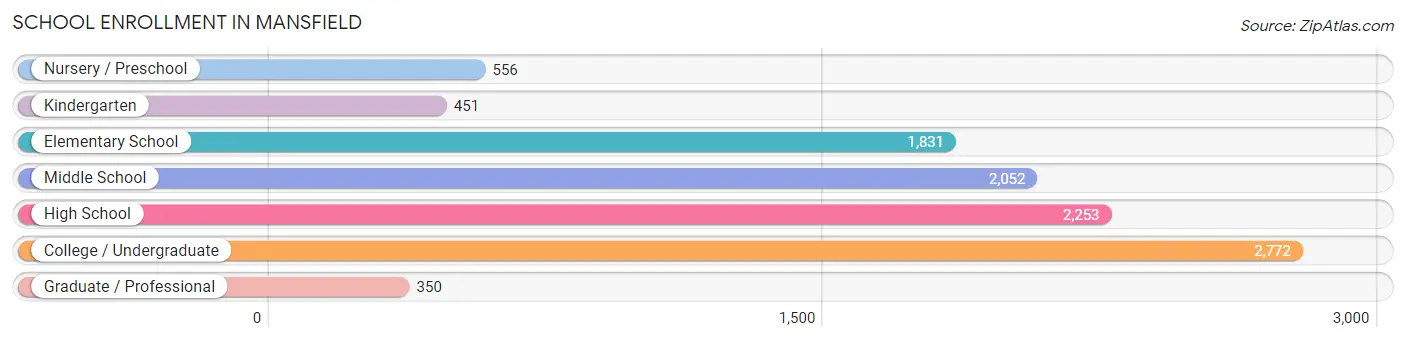
School Enrollment in Mansfield
The most common levels of schooling among the 10,265 students in Mansfield are college / undergraduate (2,772 | 27.0%), high school (2,253 | 22.0%), and middle school (2,052 | 20.0%).
| School Level | # Students | % Students |
| Nursery / Preschool | 556 | 5.4% |
| Kindergarten | 451 | 4.4% |
| Elementary School | 1,831 | 17.8% |
| Middle School | 2,052 | 20.0% |
| High School | 2,253 | 22.0% |
| College / Undergraduate | 2,772 | 27.0% |
| Graduate / Professional | 350 | 3.4% |
| Total | 10,265 | 100.0% |
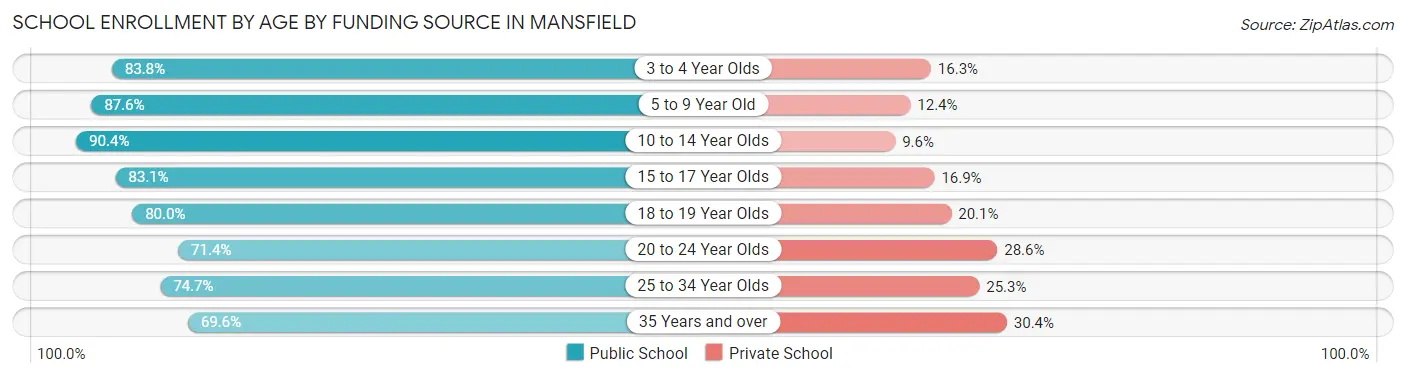
School Enrollment by Age by Funding Source in Mansfield
Out of a total of 10,265 students who are enrolled in schools in Mansfield, 1,817 (17.7%) attend a private institution, while the remaining 8,448 (82.3%) are enrolled in public schools. The age group of 35 years and over has the highest likelihood of being enrolled in private schools, with 273 (30.4% in the age bracket) enrolled. Conversely, the age group of 10 to 14 year olds has the lowest likelihood of being enrolled in a private school, with 2,278 (90.4% in the age bracket) attending a public institution.
| Age Bracket | Public School | Private School |
| 3 to 4 Year Olds | 304 (83.8%) | 59 (16.3%) |
| 5 to 9 Year Old | 1,911 (87.6%) | 271 (12.4%) |
| 10 to 14 Year Olds | 2,278 (90.4%) | 242 (9.6%) |
| 15 to 17 Year Olds | 1,155 (83.1%) | 235 (16.9%) |
| 18 to 19 Year Olds | 650 (79.9%) | 163 (20.1%) |
| 20 to 24 Year Olds | 871 (71.4%) | 349 (28.6%) |
| 25 to 34 Year Olds | 657 (74.7%) | 222 (25.3%) |
| 35 Years and over | 625 (69.6%) | 273 (30.4%) |
| Total | 8,448 (82.3%) | 1,817 (17.7%) |
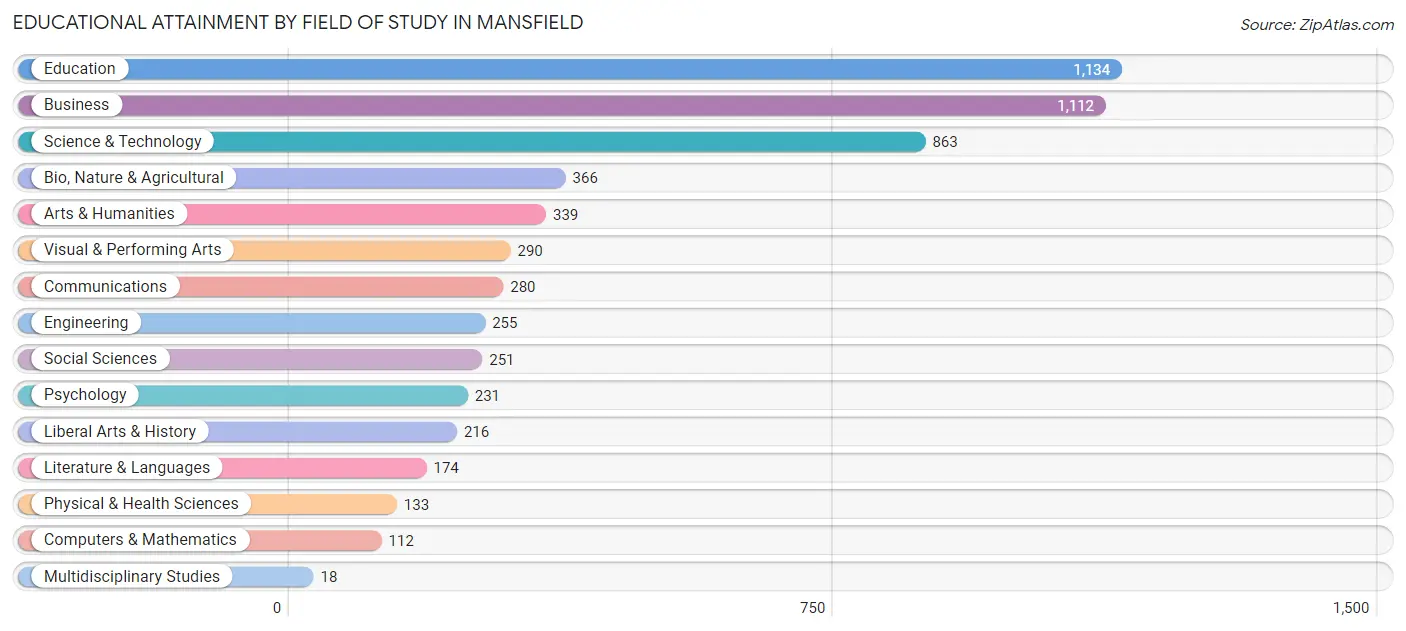
Educational Attainment by Field of Study in Mansfield
Education (1,134 | 19.6%), business (1,112 | 19.3%), science & technology (863 | 14.9%), bio, nature & agricultural (366 | 6.3%), and arts & humanities (339 | 5.9%) are the most common fields of study among 5,774 individuals in Mansfield who have obtained a bachelor's degree or higher.
| Field of Study | # Graduates | % Graduates |
| Computers & Mathematics | 112 | 1.9% |
| Bio, Nature & Agricultural | 366 | 6.3% |
| Physical & Health Sciences | 133 | 2.3% |
| Psychology | 231 | 4.0% |
| Social Sciences | 251 | 4.3% |
| Engineering | 255 | 4.4% |
| Multidisciplinary Studies | 18 | 0.3% |
| Science & Technology | 863 | 14.9% |
| Business | 1,112 | 19.3% |
| Education | 1,134 | 19.6% |
| Literature & Languages | 174 | 3.0% |
| Liberal Arts & History | 216 | 3.7% |
| Visual & Performing Arts | 290 | 5.0% |
| Communications | 280 | 4.9% |
| Arts & Humanities | 339 | 5.9% |
| Total | 5,774 | 100.0% |
Transportation & Commute in Mansfield
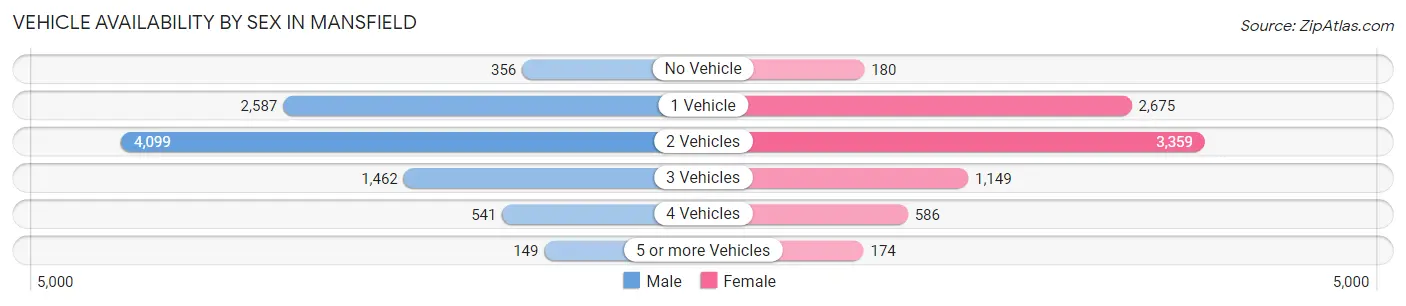
Vehicle Availability by Sex in Mansfield
The most prevalent vehicle ownership categories in Mansfield are males with 2 vehicles (4,099, accounting for 44.6%) and females with 2 vehicles (3,359, making up 50.5%).
| Vehicles Available | Male | Female |
| No Vehicle | 356 (3.9%) | 180 (2.2%) |
| 1 Vehicle | 2,587 (28.1%) | 2,675 (32.9%) |
| 2 Vehicles | 4,099 (44.6%) | 3,359 (41.3%) |
| 3 Vehicles | 1,462 (15.9%) | 1,149 (14.1%) |
| 4 Vehicles | 541 (5.9%) | 586 (7.2%) |
| 5 or more Vehicles | 149 (1.6%) | 174 (2.1%) |
| Total | 9,194 (100.0%) | 8,123 (100.0%) |
Commute Time in Mansfield
The most frequently occuring commute durations in Mansfield are 10 to 14 minutes (3,934 commuters, 23.6%), 15 to 19 minutes (3,261 commuters, 19.6%), and 5 to 9 minutes (2,899 commuters, 17.4%).
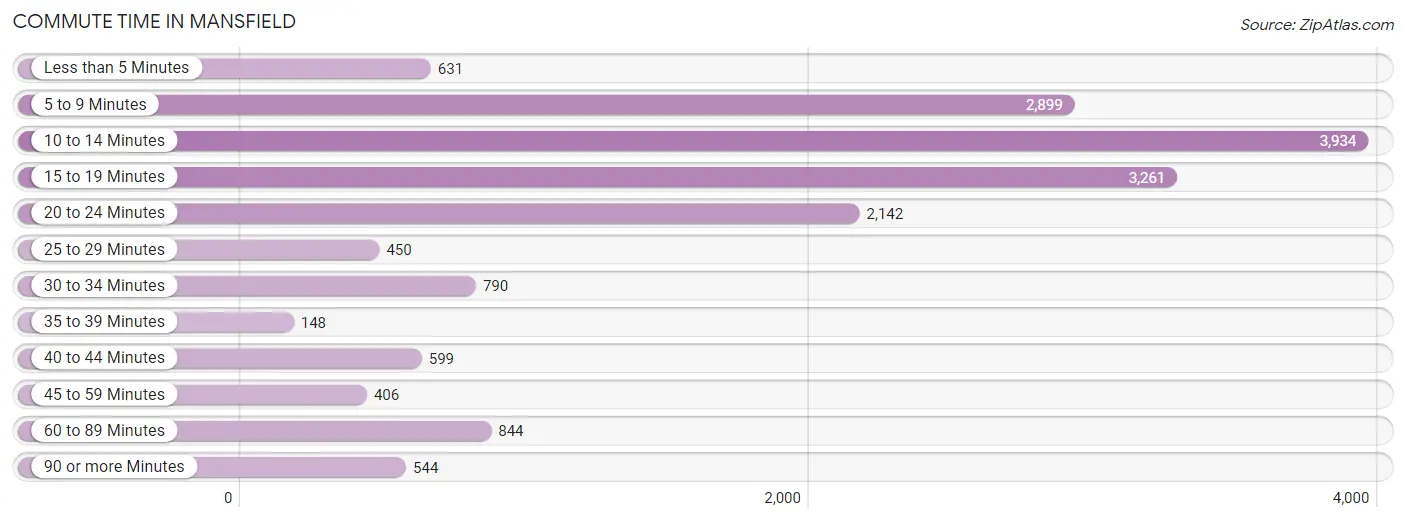
| Commute Time | # Commuters | % Commuters |
| Less than 5 Minutes | 631 | 3.8% |
| 5 to 9 Minutes | 2,899 | 17.4% |
| 10 to 14 Minutes | 3,934 | 23.6% |
| 15 to 19 Minutes | 3,261 | 19.6% |
| 20 to 24 Minutes | 2,142 | 12.9% |
| 25 to 29 Minutes | 450 | 2.7% |
| 30 to 34 Minutes | 790 | 4.8% |
| 35 to 39 Minutes | 148 | 0.9% |
| 40 to 44 Minutes | 599 | 3.6% |
| 45 to 59 Minutes | 406 | 2.4% |
| 60 to 89 Minutes | 844 | 5.1% |
| 90 or more Minutes | 544 | 3.3% |
Commute Time by Sex in Mansfield
The most common commute times in Mansfield are 10 to 14 minutes (1,836 commuters, 20.7%) for males and 10 to 14 minutes (2,098 commuters, 27.0%) for females.
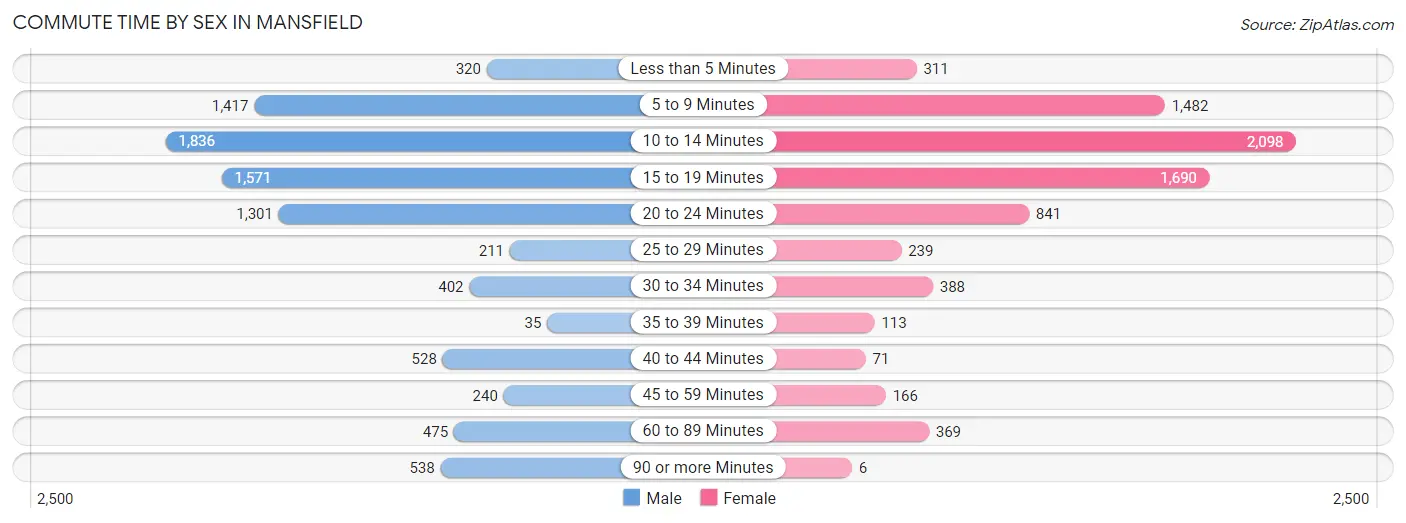
| Commute Time | Male | Female |
| Less than 5 Minutes | 320 (3.6%) | 311 (4.0%) |
| 5 to 9 Minutes | 1,417 (16.0%) | 1,482 (19.1%) |
| 10 to 14 Minutes | 1,836 (20.7%) | 2,098 (27.0%) |
| 15 to 19 Minutes | 1,571 (17.7%) | 1,690 (21.7%) |
| 20 to 24 Minutes | 1,301 (14.7%) | 841 (10.8%) |
| 25 to 29 Minutes | 211 (2.4%) | 239 (3.1%) |
| 30 to 34 Minutes | 402 (4.5%) | 388 (5.0%) |
| 35 to 39 Minutes | 35 (0.4%) | 113 (1.5%) |
| 40 to 44 Minutes | 528 (5.9%) | 71 (0.9%) |
| 45 to 59 Minutes | 240 (2.7%) | 166 (2.1%) |
| 60 to 89 Minutes | 475 (5.3%) | 369 (4.8%) |
| 90 or more Minutes | 538 (6.1%) | 6 (0.1%) |
Time of Departure to Work by Sex in Mansfield
The most frequent times of departure to work in Mansfield are 12:00 PM to 3:59 PM (1,313, 14.8%) for males and 7:30 AM to 7:59 AM (1,265, 16.3%) for females.
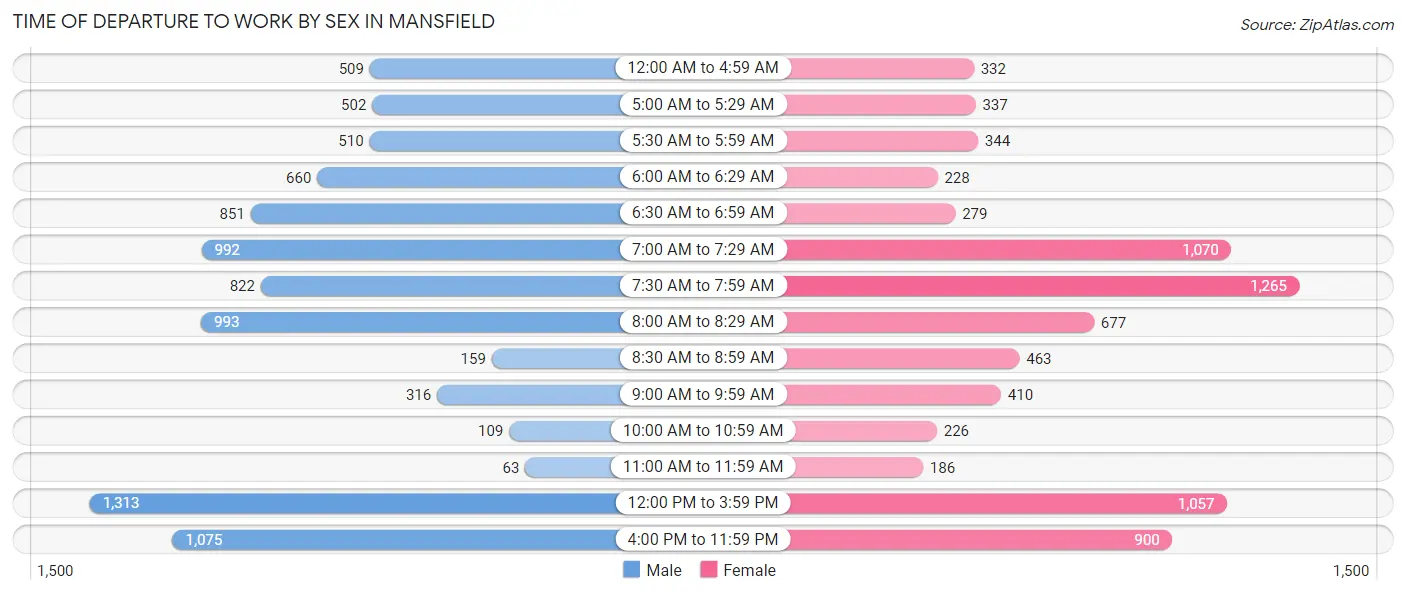
| Time of Departure | Male | Female |
| 12:00 AM to 4:59 AM | 509 (5.7%) | 332 (4.3%) |
| 5:00 AM to 5:29 AM | 502 (5.7%) | 337 (4.3%) |
| 5:30 AM to 5:59 AM | 510 (5.8%) | 344 (4.4%) |
| 6:00 AM to 6:29 AM | 660 (7.4%) | 228 (2.9%) |
| 6:30 AM to 6:59 AM | 851 (9.6%) | 279 (3.6%) |
| 7:00 AM to 7:29 AM | 992 (11.2%) | 1,070 (13.8%) |
| 7:30 AM to 7:59 AM | 822 (9.3%) | 1,265 (16.3%) |
| 8:00 AM to 8:29 AM | 993 (11.2%) | 677 (8.7%) |
| 8:30 AM to 8:59 AM | 159 (1.8%) | 463 (6.0%) |
| 9:00 AM to 9:59 AM | 316 (3.6%) | 410 (5.3%) |
| 10:00 AM to 10:59 AM | 109 (1.2%) | 226 (2.9%) |
| 11:00 AM to 11:59 AM | 63 (0.7%) | 186 (2.4%) |
| 12:00 PM to 3:59 PM | 1,313 (14.8%) | 1,057 (13.6%) |
| 4:00 PM to 11:59 PM | 1,075 (12.1%) | 900 (11.6%) |
| Total | 8,874 (100.0%) | 7,774 (100.0%) |
Housing Occupancy in Mansfield
Occupancy by Ownership in Mansfield
Of the total 18,899 dwellings in Mansfield, owner-occupied units account for 9,479 (50.2%), while renter-occupied units make up 9,420 (49.8%).
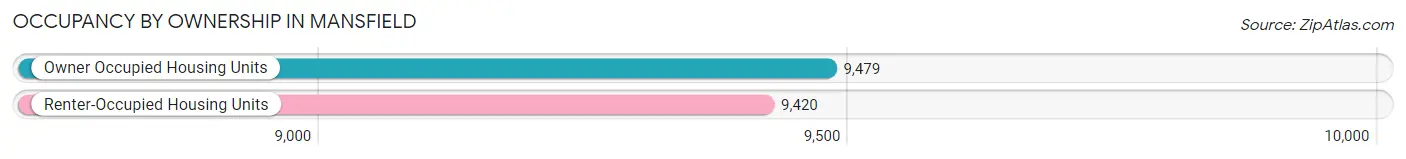
| Occupancy | # Housing Units | % Housing Units |
| Owner Occupied Housing Units | 9,479 | 50.2% |
| Renter-Occupied Housing Units | 9,420 | 49.8% |
| Total Occupied Housing Units | 18,899 | 100.0% |
Occupancy by Household Size in Mansfield
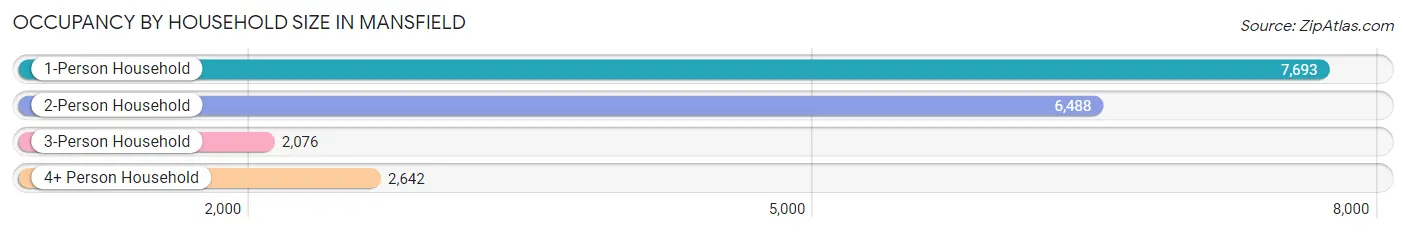
| Household Size | # Housing Units | % Housing Units |
| 1-Person Household | 7,693 | 40.7% |
| 2-Person Household | 6,488 | 34.3% |
| 3-Person Household | 2,076 | 11.0% |
| 4+ Person Household | 2,642 | 14.0% |
| Total Housing Units | 18,899 | 100.0% |
Occupancy by Ownership by Household Size in Mansfield
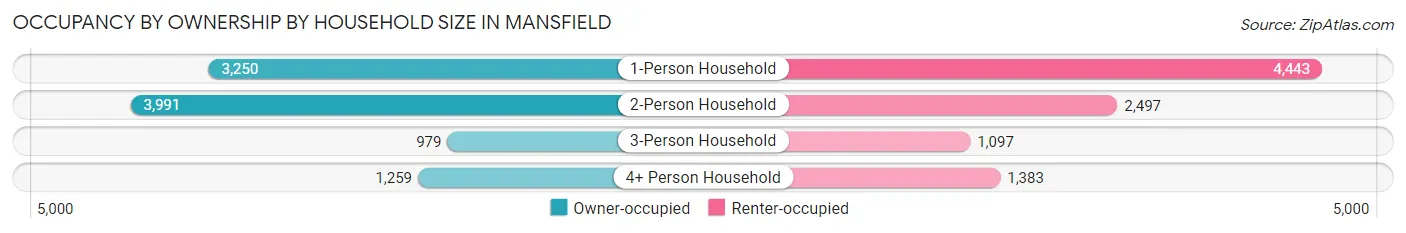
| Household Size | Owner-occupied | Renter-occupied |
| 1-Person Household | 3,250 (42.2%) | 4,443 (57.8%) |
| 2-Person Household | 3,991 (61.5%) | 2,497 (38.5%) |
| 3-Person Household | 979 (47.2%) | 1,097 (52.8%) |
| 4+ Person Household | 1,259 (47.6%) | 1,383 (52.3%) |
| Total Housing Units | 9,479 (50.2%) | 9,420 (49.8%) |
Occupancy by Educational Attainment in Mansfield
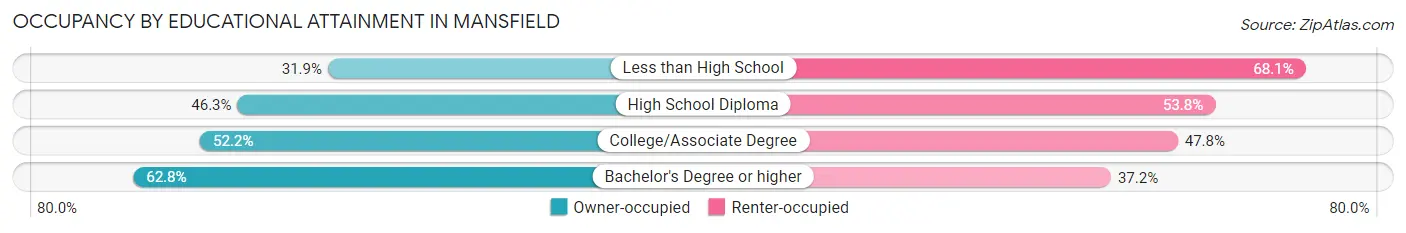
| Household Size | Owner-occupied | Renter-occupied |
| Less than High School | 574 (31.9%) | 1,225 (68.1%) |
| High School Diploma | 3,313 (46.3%) | 3,851 (53.7%) |
| College/Associate Degree | 3,169 (52.2%) | 2,906 (47.8%) |
| Bachelor's Degree or higher | 2,423 (62.8%) | 1,438 (37.2%) |
Occupancy by Age of Householder in Mansfield
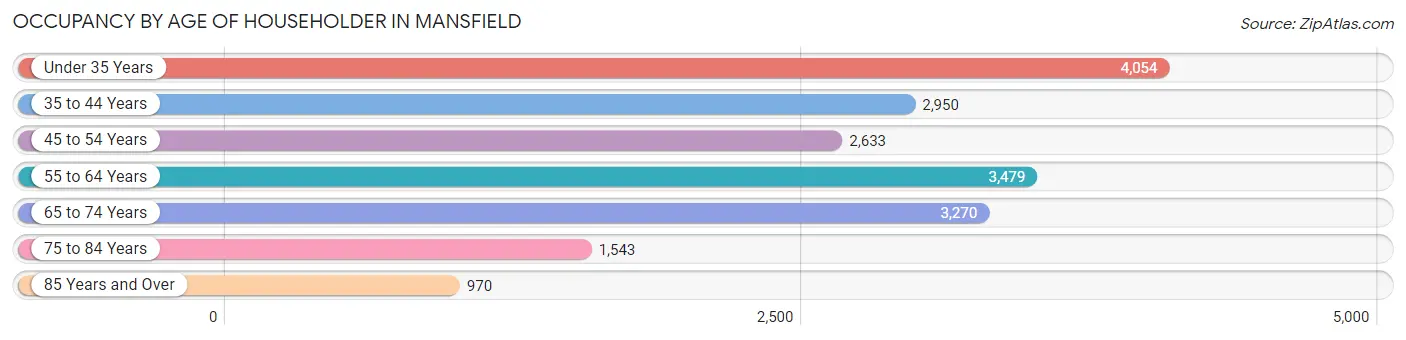
| Age Bracket | # Households | % Households |
| Under 35 Years | 4,054 | 21.4% |
| 35 to 44 Years | 2,950 | 15.6% |
| 45 to 54 Years | 2,633 | 13.9% |
| 55 to 64 Years | 3,479 | 18.4% |
| 65 to 74 Years | 3,270 | 17.3% |
| 75 to 84 Years | 1,543 | 8.2% |
| 85 Years and Over | 970 | 5.1% |
| Total | 18,899 | 100.0% |
Housing Finances in Mansfield
Median Income by Occupancy in Mansfield
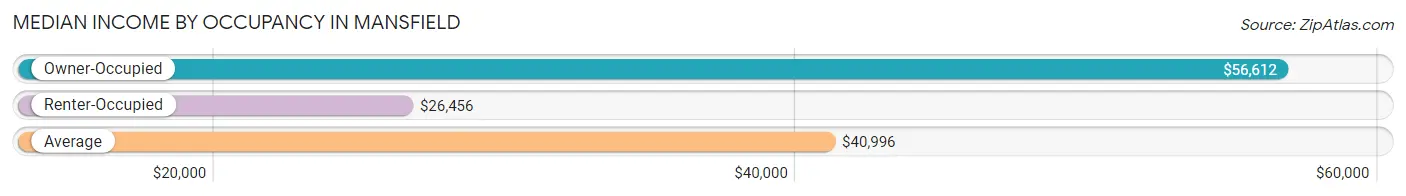
| Occupancy Type | # Households | Median Income |
| Owner-Occupied | 9,479 (50.2%) | $56,612 |
| Renter-Occupied | 9,420 (49.8%) | $26,456 |
| Average | 18,899 (100.0%) | $40,996 |
Occupancy by Householder Income Bracket in Mansfield
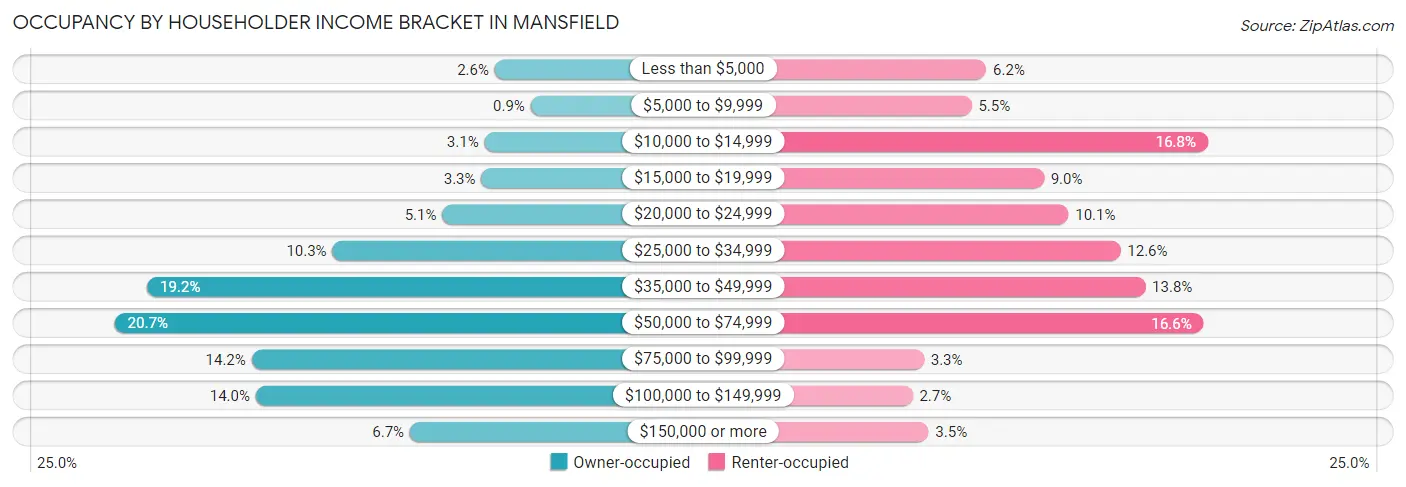
| Income Bracket | Owner-occupied | Renter-occupied |
| Less than $5,000 | 247 (2.6%) | 586 (6.2%) |
| $5,000 to $9,999 | 85 (0.9%) | 520 (5.5%) |
| $10,000 to $14,999 | 294 (3.1%) | 1,580 (16.8%) |
| $15,000 to $19,999 | 308 (3.3%) | 844 (9.0%) |
| $20,000 to $24,999 | 484 (5.1%) | 954 (10.1%) |
| $25,000 to $34,999 | 980 (10.3%) | 1,188 (12.6%) |
| $35,000 to $49,999 | 1,817 (19.2%) | 1,299 (13.8%) |
| $50,000 to $74,999 | 1,963 (20.7%) | 1,561 (16.6%) |
| $75,000 to $99,999 | 1,345 (14.2%) | 306 (3.3%) |
| $100,000 to $149,999 | 1,326 (14.0%) | 255 (2.7%) |
| $150,000 or more | 630 (6.7%) | 327 (3.5%) |
| Total | 9,479 (100.0%) | 9,420 (100.0%) |
Monthly Housing Cost Tiers in Mansfield
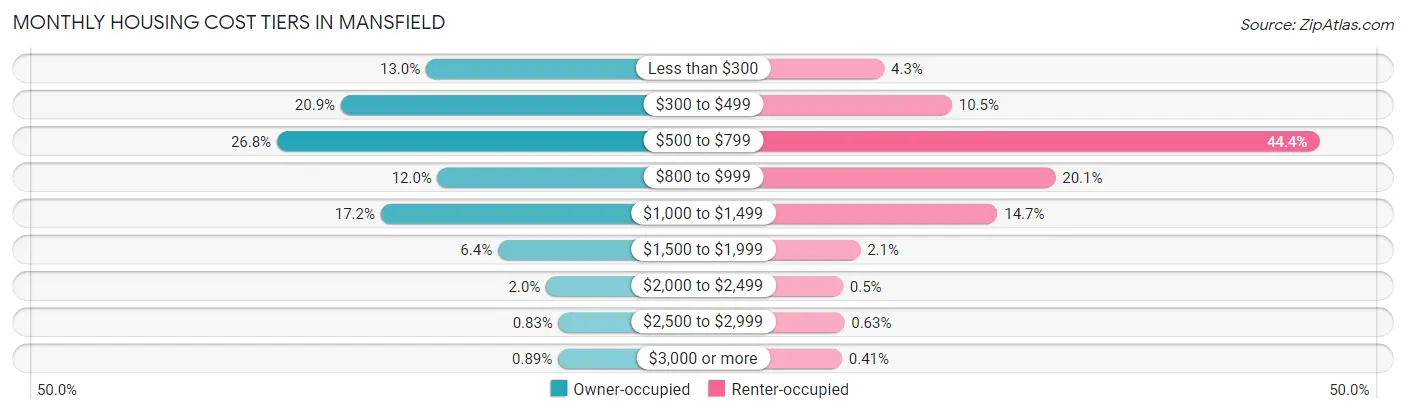
| Monthly Cost | Owner-occupied | Renter-occupied |
| Less than $300 | 1,236 (13.0%) | 405 (4.3%) |
| $300 to $499 | 1,979 (20.9%) | 992 (10.5%) |
| $500 to $799 | 2,538 (26.8%) | 4,178 (44.4%) |
| $800 to $999 | 1,135 (12.0%) | 1,890 (20.1%) |
| $1,000 to $1,499 | 1,631 (17.2%) | 1,387 (14.7%) |
| $1,500 to $1,999 | 609 (6.4%) | 198 (2.1%) |
| $2,000 to $2,499 | 188 (2.0%) | 47 (0.5%) |
| $2,500 to $2,999 | 79 (0.8%) | 59 (0.6%) |
| $3,000 or more | 84 (0.9%) | 39 (0.4%) |
| Total | 9,479 (100.0%) | 9,420 (100.0%) |
Physical Housing Characteristics in Mansfield
Housing Structures in Mansfield
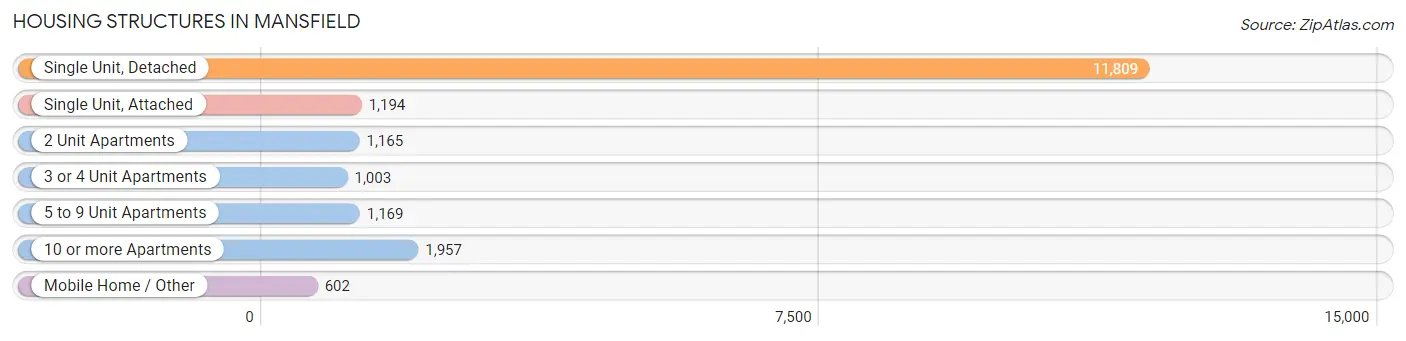
| Structure Type | # Housing Units | % Housing Units |
| Single Unit, Detached | 11,809 | 62.5% |
| Single Unit, Attached | 1,194 | 6.3% |
| 2 Unit Apartments | 1,165 | 6.2% |
| 3 or 4 Unit Apartments | 1,003 | 5.3% |
| 5 to 9 Unit Apartments | 1,169 | 6.2% |
| 10 or more Apartments | 1,957 | 10.4% |
| Mobile Home / Other | 602 | 3.2% |
| Total | 18,899 | 100.0% |
Housing Structures by Occupancy in Mansfield
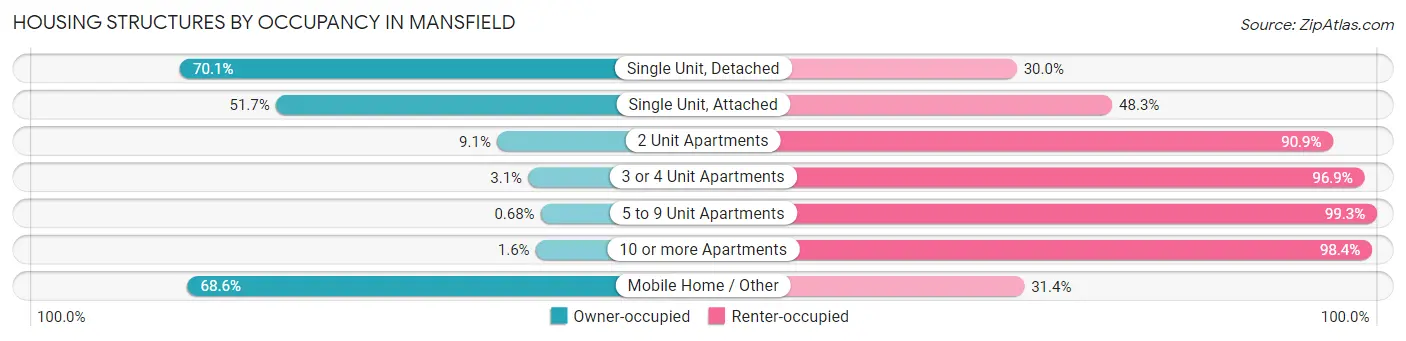
| Structure Type | Owner-occupied | Renter-occupied |
| Single Unit, Detached | 8,272 (70.1%) | 3,537 (29.9%) |
| Single Unit, Attached | 617 (51.7%) | 577 (48.3%) |
| 2 Unit Apartments | 106 (9.1%) | 1,059 (90.9%) |
| 3 or 4 Unit Apartments | 31 (3.1%) | 972 (96.9%) |
| 5 to 9 Unit Apartments | 8 (0.7%) | 1,161 (99.3%) |
| 10 or more Apartments | 32 (1.6%) | 1,925 (98.4%) |
| Mobile Home / Other | 413 (68.6%) | 189 (31.4%) |
| Total | 9,479 (50.2%) | 9,420 (49.8%) |
Housing Structures by Number of Rooms in Mansfield
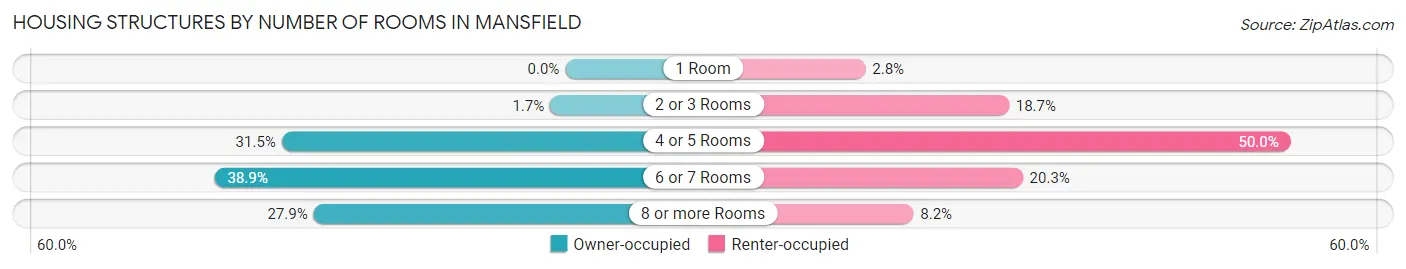
| Number of Rooms | Owner-occupied | Renter-occupied |
| 1 Room | 0 (0.0%) | 266 (2.8%) |
| 2 or 3 Rooms | 159 (1.7%) | 1,765 (18.7%) |
| 4 or 5 Rooms | 2,983 (31.5%) | 4,711 (50.0%) |
| 6 or 7 Rooms | 3,689 (38.9%) | 1,910 (20.3%) |
| 8 or more Rooms | 2,648 (27.9%) | 768 (8.2%) |
| Total | 9,479 (100.0%) | 9,420 (100.0%) |
Housing Structure by Heating Type in Mansfield
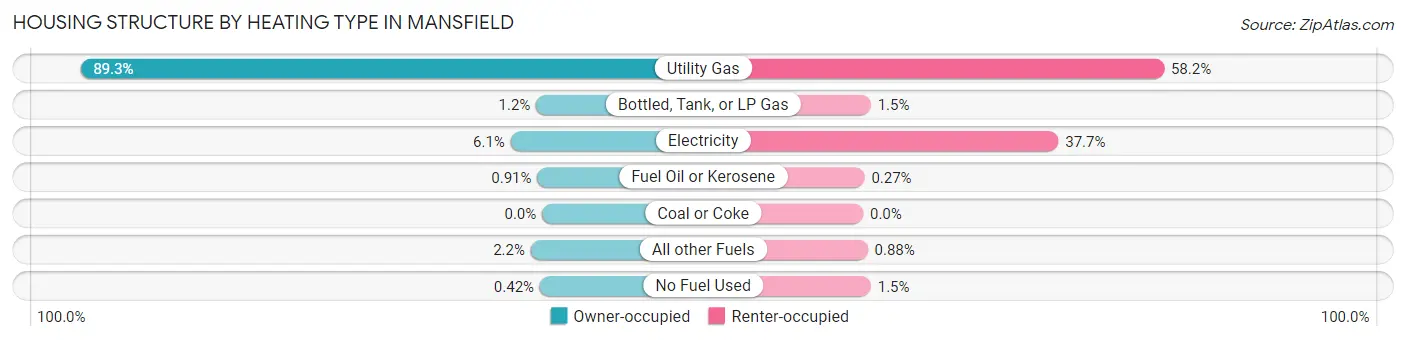
| Heating Type | Owner-occupied | Renter-occupied |
| Utility Gas | 8,460 (89.2%) | 5,478 (58.2%) |
| Bottled, Tank, or LP Gas | 109 (1.1%) | 139 (1.5%) |
| Electricity | 576 (6.1%) | 3,554 (37.7%) |
| Fuel Oil or Kerosene | 86 (0.9%) | 25 (0.3%) |
| Coal or Coke | 0 (0.0%) | 0 (0.0%) |
| All other Fuels | 208 (2.2%) | 83 (0.9%) |
| No Fuel Used | 40 (0.4%) | 141 (1.5%) |
| Total | 9,479 (100.0%) | 9,420 (100.0%) |
Household Vehicle Usage in Mansfield
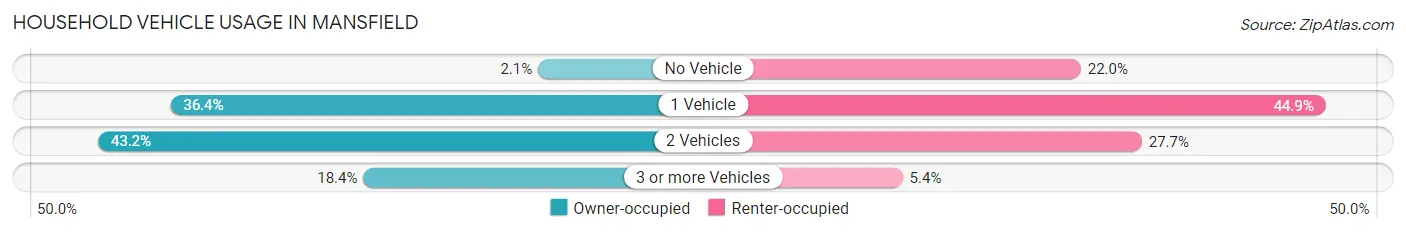
| Vehicles per Household | Owner-occupied | Renter-occupied |
| No Vehicle | 196 (2.1%) | 2,074 (22.0%) |
| 1 Vehicle | 3,450 (36.4%) | 4,228 (44.9%) |
| 2 Vehicles | 4,091 (43.2%) | 2,610 (27.7%) |
| 3 or more Vehicles | 1,742 (18.4%) | 508 (5.4%) |
| Total | 9,479 (100.0%) | 9,420 (100.0%) |
Real Estate & Mortgages in Mansfield
Real Estate and Mortgage Overview in Mansfield
| Characteristic | Without Mortgage | With Mortgage |
| Housing Units | 4,412 | 5,067 |
| Median Property Value | $85,500 | $104,100 |
| Median Household Income | $46,199 | $393 |
| Monthly Housing Costs | $406 | $84 |
| Real Estate Taxes | $1,330 | $77 |
Property Value by Mortgage Status in Mansfield
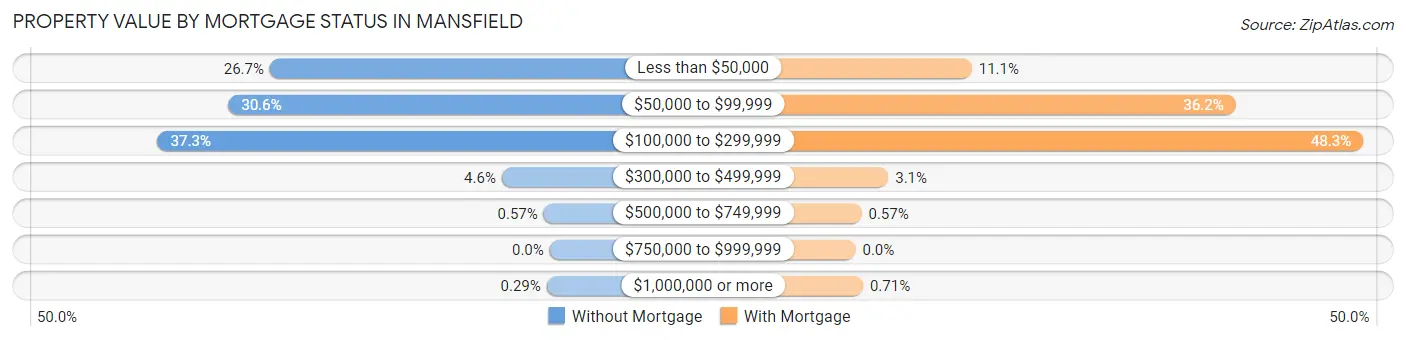
| Property Value | Without Mortgage | With Mortgage |
| Less than $50,000 | 1,176 (26.7%) | 561 (11.1%) |
| $50,000 to $99,999 | 1,350 (30.6%) | 1,834 (36.2%) |
| $100,000 to $299,999 | 1,647 (37.3%) | 2,449 (48.3%) |
| $300,000 to $499,999 | 201 (4.6%) | 158 (3.1%) |
| $500,000 to $749,999 | 25 (0.6%) | 29 (0.6%) |
| $750,000 to $999,999 | 0 (0.0%) | 0 (0.0%) |
| $1,000,000 or more | 13 (0.3%) | 36 (0.7%) |
| Total | 4,412 (100.0%) | 5,067 (100.0%) |
Household Income by Mortgage Status in Mansfield
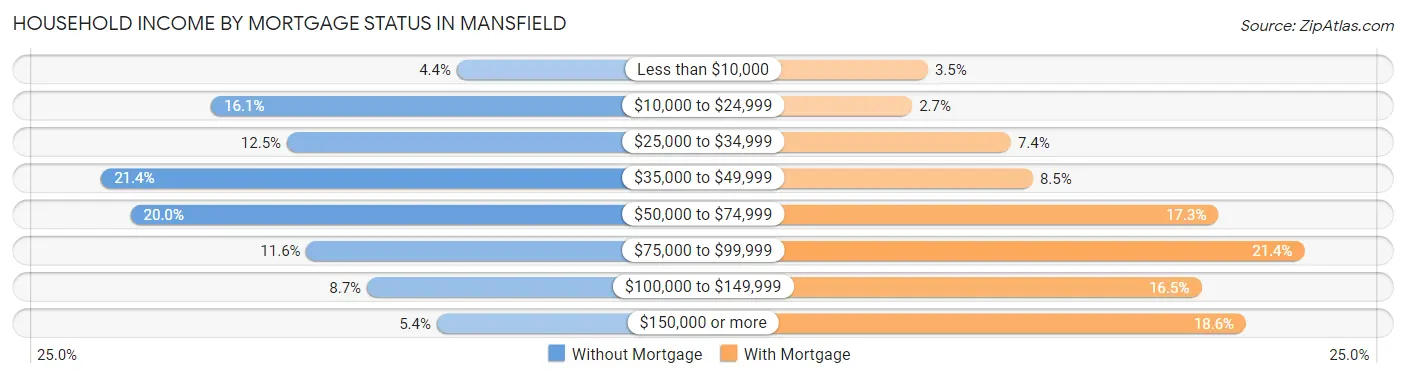
| Household Income | Without Mortgage | With Mortgage |
| Less than $10,000 | 195 (4.4%) | 175 (3.5%) |
| $10,000 to $24,999 | 711 (16.1%) | 137 (2.7%) |
| $25,000 to $34,999 | 552 (12.5%) | 375 (7.4%) |
| $35,000 to $49,999 | 942 (21.3%) | 428 (8.5%) |
| $50,000 to $74,999 | 880 (20.0%) | 875 (17.3%) |
| $75,000 to $99,999 | 511 (11.6%) | 1,083 (21.4%) |
| $100,000 to $149,999 | 384 (8.7%) | 834 (16.5%) |
| $150,000 or more | 237 (5.4%) | 942 (18.6%) |
| Total | 4,412 (100.0%) | 5,067 (100.0%) |
Property Value to Household Income Ratio in Mansfield
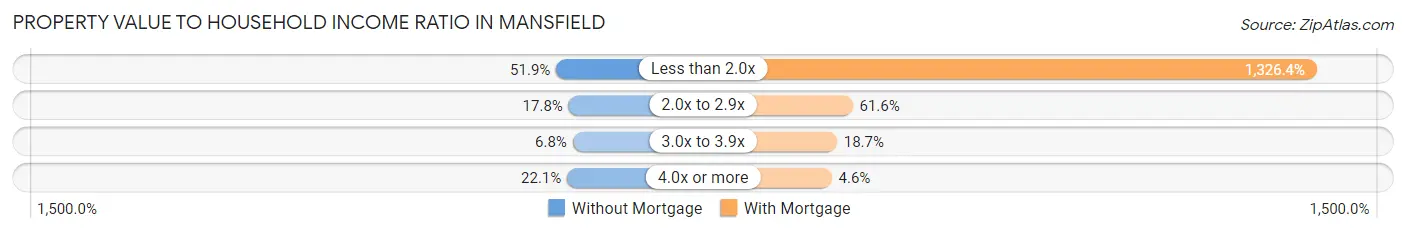
| Value-to-Income Ratio | Without Mortgage | With Mortgage |
| Less than 2.0x | 2,290 (51.9%) | 67,208 (1,326.4%) |
| 2.0x to 2.9x | 787 (17.8%) | 3,120 (61.6%) |
| 3.0x to 3.9x | 301 (6.8%) | 949 (18.7%) |
| 4.0x or more | 974 (22.1%) | 235 (4.6%) |
| Total | 4,412 (100.0%) | 5,067 (100.0%) |
Real Estate Taxes by Mortgage Status in Mansfield
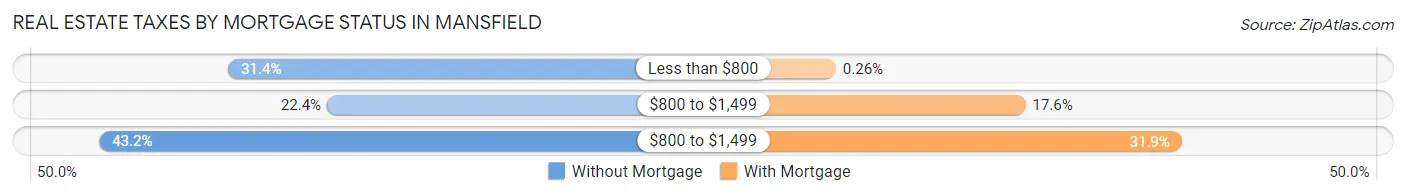
| Property Taxes | Without Mortgage | With Mortgage |
| Less than $800 | 1,386 (31.4%) | 13 (0.3%) |
| $800 to $1,499 | 988 (22.4%) | 891 (17.6%) |
| $800 to $1,499 | 1,905 (43.2%) | 1,614 (31.9%) |
| Total | 4,412 (100.0%) | 5,067 (100.0%) |
Health & Disability in Mansfield
Health Insurance Coverage by Age in Mansfield
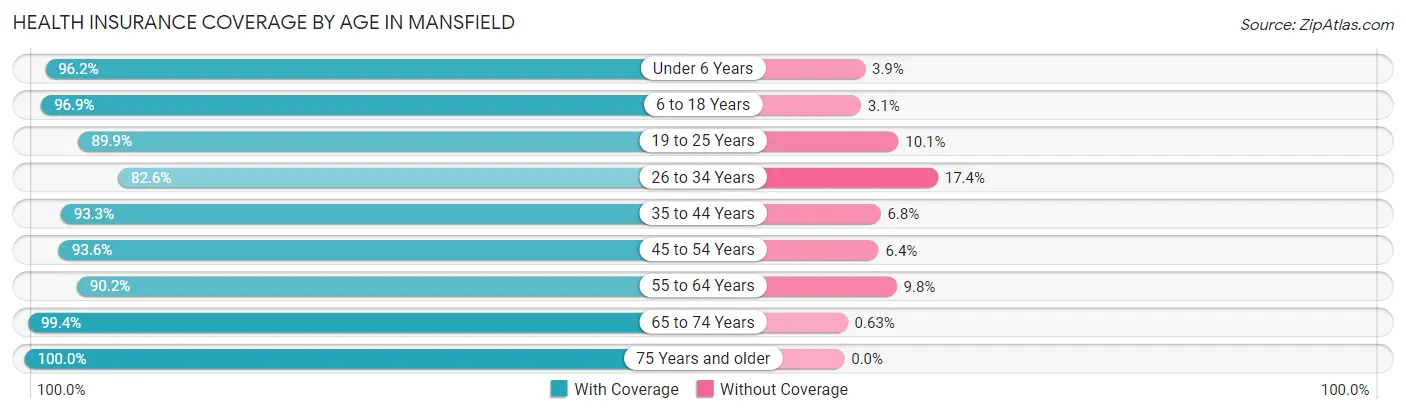
| Age Bracket | With Coverage | Without Coverage |
| Under 6 Years | 2,920 (96.2%) | 117 (3.8%) |
| 6 to 18 Years | 6,435 (96.9%) | 206 (3.1%) |
| 19 to 25 Years | 3,953 (89.9%) | 443 (10.1%) |
| 26 to 34 Years | 4,043 (82.6%) | 854 (17.4%) |
| 35 to 44 Years | 5,099 (93.2%) | 369 (6.8%) |
| 45 to 54 Years | 4,347 (93.6%) | 297 (6.4%) |
| 55 to 64 Years | 4,429 (90.2%) | 479 (9.8%) |
| 65 to 74 Years | 4,767 (99.4%) | 30 (0.6%) |
| 75 Years and older | 3,341 (100.0%) | 0 (0.0%) |
| Total | 39,334 (93.4%) | 2,795 (6.6%) |
Health Insurance Coverage by Citizenship Status in Mansfield
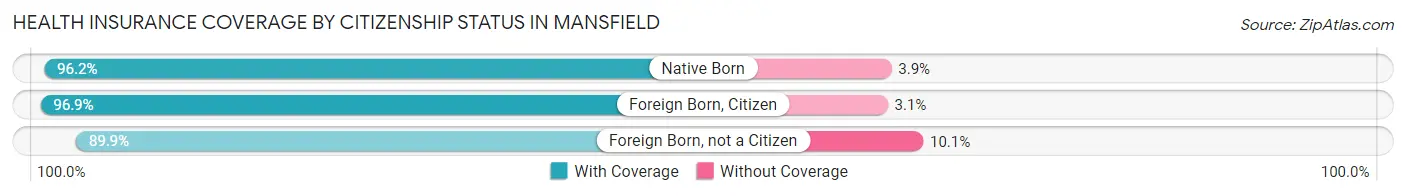
| Citizenship Status | With Coverage | Without Coverage |
| Native Born | 2,920 (96.2%) | 117 (3.8%) |
| Foreign Born, Citizen | 6,435 (96.9%) | 206 (3.1%) |
| Foreign Born, not a Citizen | 3,953 (89.9%) | 443 (10.1%) |
Health Insurance Coverage by Household Income in Mansfield
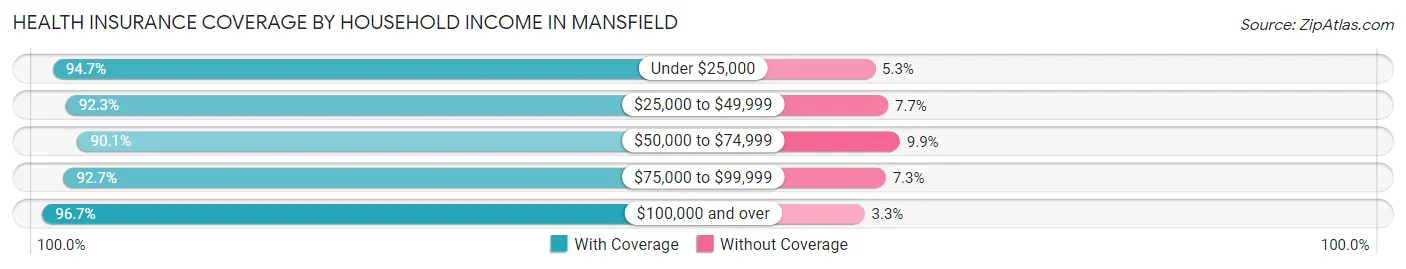
| Household Income | With Coverage | Without Coverage |
| Under $25,000 | 9,534 (94.7%) | 534 (5.3%) |
| $25,000 to $49,999 | 9,660 (92.3%) | 810 (7.7%) |
| $50,000 to $74,999 | 7,843 (90.1%) | 866 (9.9%) |
| $75,000 to $99,999 | 3,851 (92.7%) | 303 (7.3%) |
| $100,000 and over | 8,001 (96.7%) | 276 (3.3%) |
Public vs Private Health Insurance Coverage by Age in Mansfield
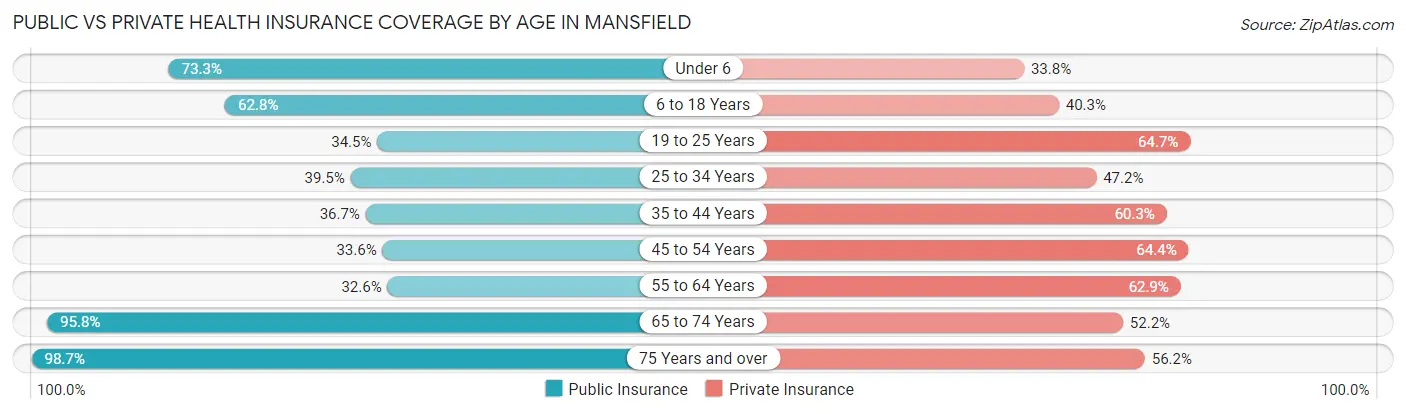
| Age Bracket | Public Insurance | Private Insurance |
| Under 6 | 2,225 (73.3%) | 1,027 (33.8%) |
| 6 to 18 Years | 4,169 (62.8%) | 2,674 (40.3%) |
| 19 to 25 Years | 1,518 (34.5%) | 2,842 (64.6%) |
| 25 to 34 Years | 1,934 (39.5%) | 2,313 (47.2%) |
| 35 to 44 Years | 2,006 (36.7%) | 3,297 (60.3%) |
| 45 to 54 Years | 1,559 (33.6%) | 2,989 (64.4%) |
| 55 to 64 Years | 1,602 (32.6%) | 3,087 (62.9%) |
| 65 to 74 Years | 4,597 (95.8%) | 2,503 (52.2%) |
| 75 Years and over | 3,298 (98.7%) | 1,879 (56.2%) |
| Total | 22,908 (54.4%) | 22,611 (53.7%) |
Disability Status by Sex by Age in Mansfield
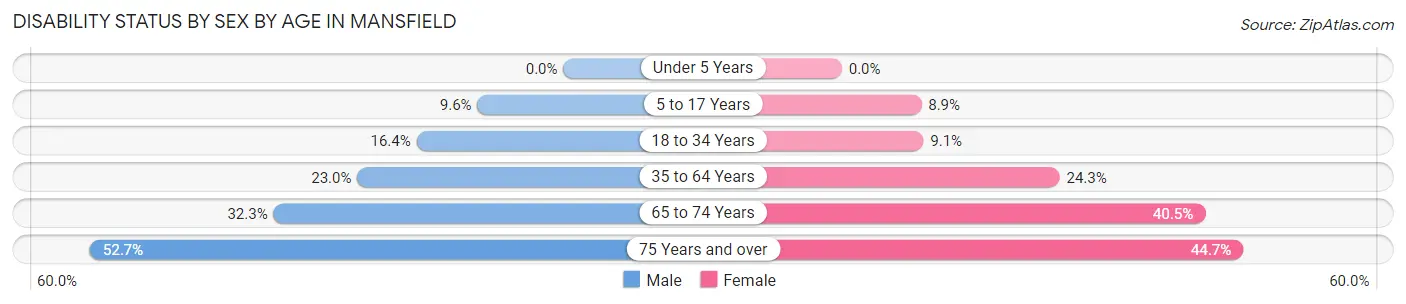
| Age Bracket | Male | Female |
| Under 5 Years | 0 (0.0%) | 0 (0.0%) |
| 5 to 17 Years | 301 (9.6%) | 296 (8.8%) |
| 18 to 34 Years | 844 (16.4%) | 426 (9.1%) |
| 35 to 64 Years | 1,749 (23.0%) | 1,794 (24.2%) |
| 65 to 74 Years | 686 (32.3%) | 1,081 (40.5%) |
| 75 Years and over | 589 (52.7%) | 994 (44.7%) |
Disability Class by Sex by Age in Mansfield
Disability Class: Hearing Difficulty
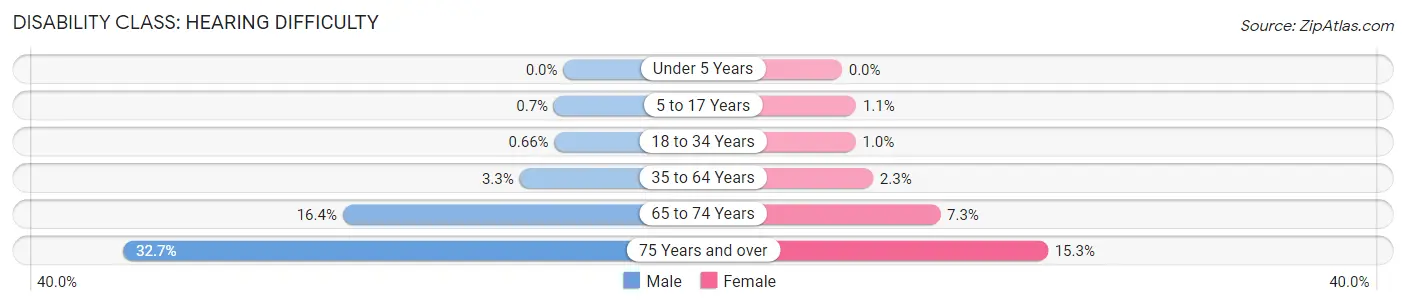
| Age Bracket | Male | Female |
| Under 5 Years | 0 (0.0%) | 0 (0.0%) |
| 5 to 17 Years | 22 (0.7%) | 35 (1.1%) |
| 18 to 34 Years | 34 (0.7%) | 48 (1.0%) |
| 35 to 64 Years | 248 (3.3%) | 171 (2.3%) |
| 65 to 74 Years | 348 (16.4%) | 195 (7.3%) |
| 75 Years and over | 365 (32.7%) | 340 (15.3%) |
Disability Class: Vision Difficulty
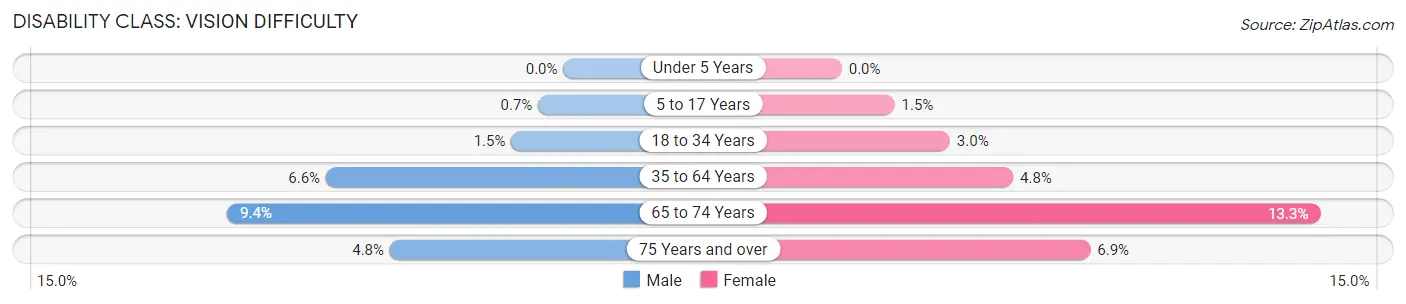
| Age Bracket | Male | Female |
| Under 5 Years | 0 (0.0%) | 0 (0.0%) |
| 5 to 17 Years | 22 (0.7%) | 49 (1.5%) |
| 18 to 34 Years | 75 (1.5%) | 141 (3.0%) |
| 35 to 64 Years | 504 (6.6%) | 353 (4.8%) |
| 65 to 74 Years | 199 (9.4%) | 356 (13.3%) |
| 75 Years and over | 54 (4.8%) | 154 (6.9%) |
Disability Class: Cognitive Difficulty
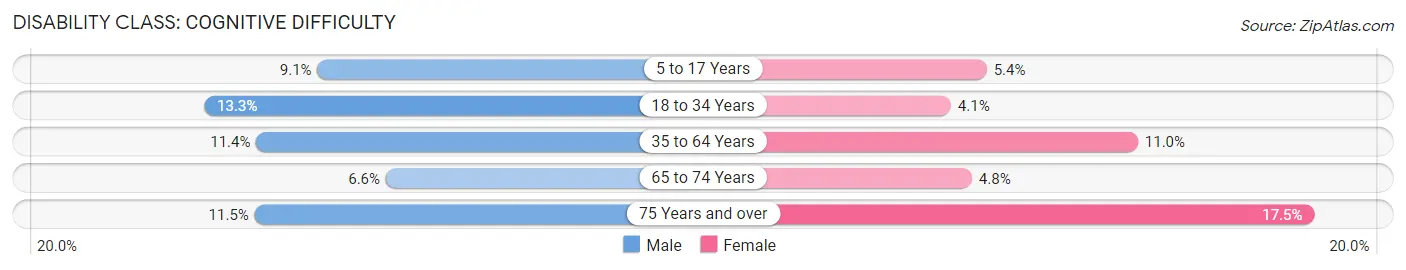
| Age Bracket | Male | Female |
| 5 to 17 Years | 287 (9.1%) | 180 (5.4%) |
| 18 to 34 Years | 689 (13.3%) | 190 (4.1%) |
| 35 to 64 Years | 869 (11.4%) | 813 (11.0%) |
| 65 to 74 Years | 140 (6.6%) | 129 (4.8%) |
| 75 Years and over | 128 (11.5%) | 390 (17.5%) |
Disability Class: Ambulatory Difficulty
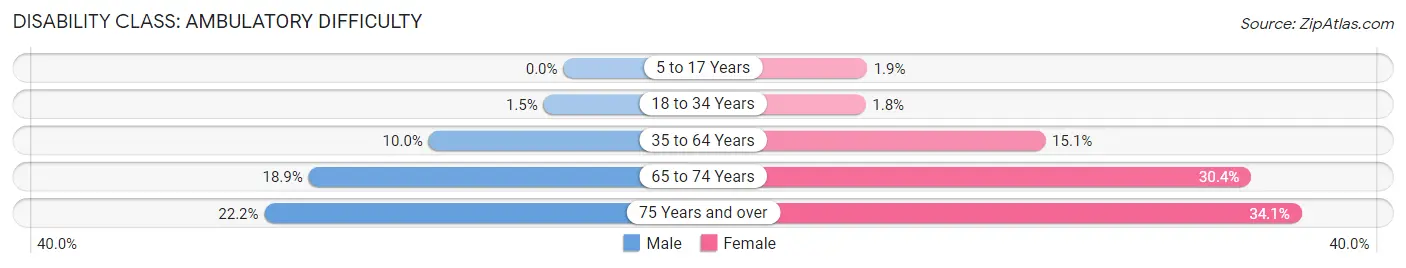
| Age Bracket | Male | Female |
| 5 to 17 Years | 0 (0.0%) | 62 (1.8%) |
| 18 to 34 Years | 76 (1.5%) | 82 (1.8%) |
| 35 to 64 Years | 762 (10.0%) | 1,117 (15.1%) |
| 65 to 74 Years | 402 (18.9%) | 812 (30.4%) |
| 75 Years and over | 248 (22.2%) | 759 (34.1%) |
Disability Class: Self-Care Difficulty
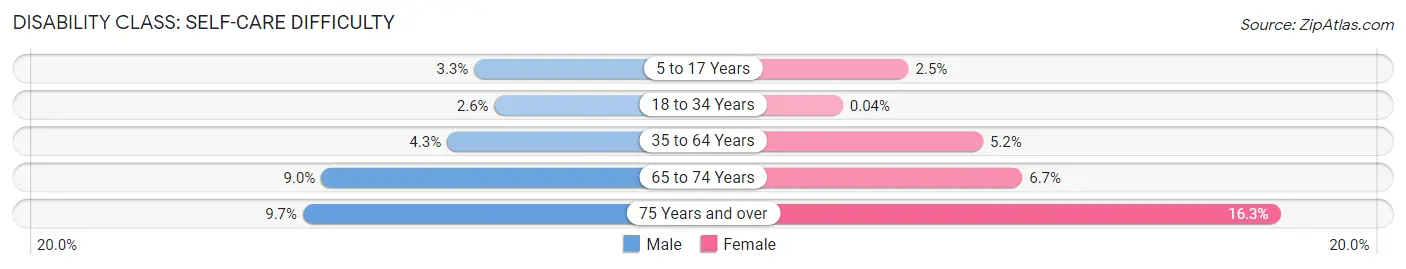
| Age Bracket | Male | Female |
| 5 to 17 Years | 104 (3.3%) | 83 (2.5%) |
| 18 to 34 Years | 132 (2.6%) | 2 (0.0%) |
| 35 to 64 Years | 329 (4.3%) | 388 (5.2%) |
| 65 to 74 Years | 191 (9.0%) | 179 (6.7%) |
| 75 Years and over | 108 (9.7%) | 362 (16.3%) |
Technology Access in Mansfield
Computing Device Access in Mansfield
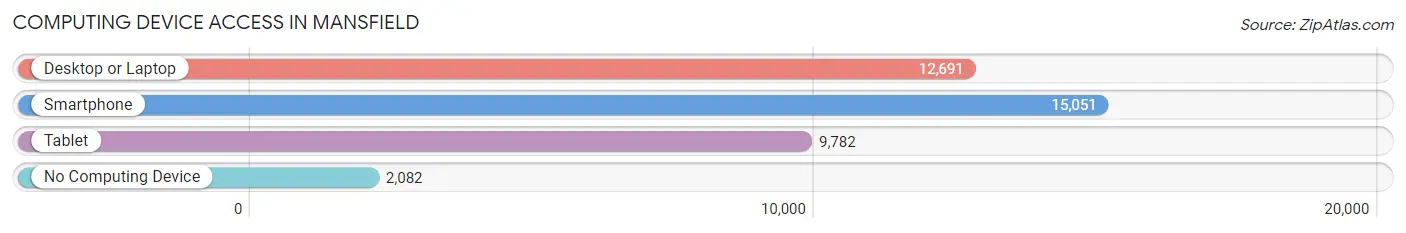
| Device Type | # Households | % Households |
| Desktop or Laptop | 12,691 | 67.1% |
| Smartphone | 15,051 | 79.6% |
| Tablet | 9,782 | 51.8% |
| No Computing Device | 2,082 | 11.0% |
| Total | 18,899 | 100.0% |
Internet Access in Mansfield
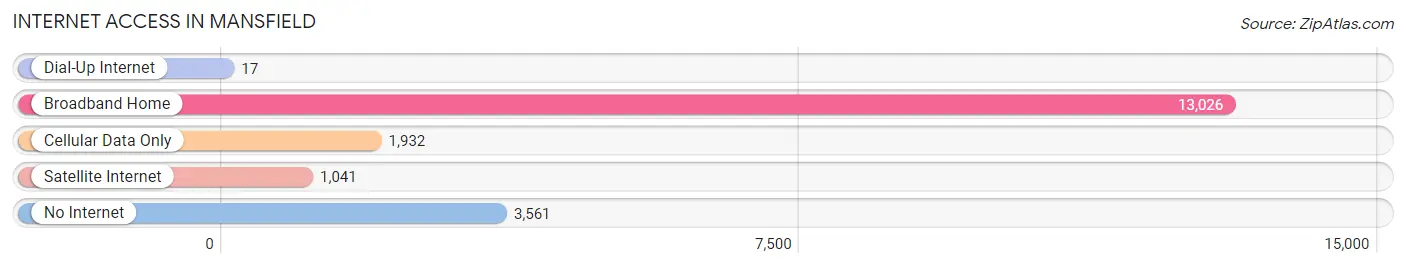
| Internet Type | # Households | % Households |
| Dial-Up Internet | 17 | 0.1% |
| Broadband Home | 13,026 | 68.9% |
| Cellular Data Only | 1,932 | 10.2% |
| Satellite Internet | 1,041 | 5.5% |
| No Internet | 3,561 | 18.8% |
| Total | 18,899 | 100.0% |
Mansfield Summary
Mansfield, Ohio is a city located in Richland County in the north-central part of the state. It is the county seat and the largest city in the county. The city is situated in the foothills of the Appalachian Mountains and is located approximately halfway between Cleveland and Columbus. The city has a population of approximately 47,000 people and is part of the Mansfield-Ashland Metropolitan Statistical Area.
History
Mansfield was founded in 1808 by James Hedges, a Revolutionary War veteran. The city was named after Jared Mansfield, the Surveyor General of the United States at the time. The city was incorporated in 1828 and quickly became a center for manufacturing and industry. The city was home to several factories, including the Mansfield Iron Works, which produced iron products for the Union Army during the Civil War.
The city experienced a period of growth and prosperity in the late 19th and early 20th centuries. The city was home to several large companies, including the Mansfield Tire and Rubber Company, which was founded in 1916 and was the largest tire manufacturer in the world at the time. The city also had a thriving downtown area, which included several theaters, department stores, and other businesses.
The city experienced a period of decline in the mid-20th century, as many of the factories and businesses closed or moved away. The city has since experienced a resurgence, with several new businesses and industries moving into the area.
Geography
Mansfield is located in north-central Ohio, approximately halfway between Cleveland and Columbus. The city is situated in the foothills of the Appalachian Mountains and is located in the western part of Richland County. The city is bordered by the cities of Ashland to the north, Shelby to the east, and Lexington to the south. The city is located at the intersection of Interstate 71 and U.S. Route 30.
The city has a total area of 16.3 square miles, of which 16.2 square miles is land and 0.1 square miles is water. The city is located in the watershed of the Mohican River, which flows through the city. The city is located in a humid continental climate zone, with hot summers and cold winters.
Economy
Mansfield has a diverse economy, with several major industries located in the city. The city is home to several large companies, including the Mansfield Tire and Rubber Company, which is the largest tire manufacturer in the world. The city is also home to several other manufacturing companies, including the Ohio Brass Company, which produces electrical components, and the Ohio Steel Foundry, which produces steel products.
The city is also home to several healthcare providers, including OhioHealth Mansfield Hospital and Avita Health System. The city is also home to several educational institutions, including The Ohio State University at Mansfield and North Central State College.
Demographics
As of the 2010 census, the city had a population of 47,821 people. The racial makeup of the city was 84.3% White, 10.3% African American, 0.4% Native American, 1.2% Asian, 0.1% Pacific Islander, 1.3% from other races, and 2.4% from two or more races. Hispanic or Latino of any race were 3.3% of the population.
The median household income in the city was $35,945, and the median family income was $45,945. The per capita income in the city was $20,845. About 17.3% of the population was below the poverty line.
Mansfield is a diverse city, with a variety of cultures and backgrounds represented in the population. The city is home to several churches, including the First Presbyterian Church, the First United Methodist Church, and the Church of the Nazarene. The city is also home to several cultural institutions, including the Mansfield Art Center and the Mansfield Symphony Orchestra.
Common Questions
What is Per Capita Income in Mansfield?
Per Capita income in Mansfield is $24,483.
What is the Median Family Income in Mansfield?
Median Family Income in Mansfield is $52,252.
What is the Median Household income in Mansfield?
Median Household Income in Mansfield is $40,996.
What is Income or Wage Gap in Mansfield?
Income or Wage Gap in Mansfield is 13.4%.
Women in Mansfield earn 86.6 cents for every dollar earned by a man.
What is Family Income Deficit in Mansfield?
Family Income Deficit in Mansfield is $10,381.
Families that are below poverty line in Mansfield earn $10,381 less on average than the poverty threshold level.
What is Inequality or Gini Index in Mansfield?
Inequality or Gini Index in Mansfield is 0.49.
What is the Total Population of Mansfield?
Total Population of Mansfield is 47,630.
What is the Total Male Population of Mansfield?
Total Male Population of Mansfield is 25,539.
What is the Total Female Population of Mansfield?
Total Female Population of Mansfield is 22,091.
What is the Ratio of Males per 100 Females in Mansfield?
There are 115.61 Males per 100 Females in Mansfield.
What is the Ratio of Females per 100 Males in Mansfield?
There are 86.50 Females per 100 Males in Mansfield.
What is the Median Population Age in Mansfield?
Median Population Age in Mansfield is 38.9 Years.
What is the Average Family Size in Mansfield
Average Family Size in Mansfield is 3.1 People.
What is the Average Household Size in Mansfield
Average Household Size in Mansfield is 2.2 People.
How Large is the Labor Force in Mansfield?
There are 19,492 People in the Labor Forcein in Mansfield.
What is the Percentage of People in the Labor Force in Mansfield?
49.2% of People are in the Labor Force in Mansfield.
What is the Unemployment Rate in Mansfield?
Unemployment Rate in Mansfield is 7.8%.