Greenhills, OH Map & Demographics
Greenhills Map
Greenhills Overview
$31,923
PER CAPITA INCOME
$79,502
AVG FAMILY INCOME
$71,979
AVG HOUSEHOLD INCOME
54.8%
WAGE / INCOME GAP [ % ]
45.2¢/ $1
WAGE / INCOME GAP [ $ ]
0.37
INEQUALITY / GINI INDEX
3,703
TOTAL POPULATION
1,872
MALE POPULATION
1,831
FEMALE POPULATION
102.24
MALES / 100 FEMALES
97.81
FEMALES / 100 MALES
38.4
MEDIAN AGE
3.1
AVG FAMILY SIZE
2.4
AVG HOUSEHOLD SIZE
1,836
LABOR FORCE [ PEOPLE ]
63.0%
PERCENT IN LABOR FORCE
2.0%
UNEMPLOYMENT RATE
Income in Greenhills
Income Overview in Greenhills
Per Capita Income in Greenhills is $31,923, while median incomes of families and households are $79,502 and $71,979 respectively.
| Characteristic | Number | Measure |
| Per Capita Income | 3,703 | $31,923 |
| Median Family Income | 903 | $79,502 |
| Mean Family Income | 903 | $87,595 |
| Median Household Income | 1,491 | $71,979 |
| Mean Household Income | 1,491 | $78,510 |
| Income Deficit | 903 | $0 |
| Wage / Income Gap (%) | 3,703 | 54.80% |
| Wage / Income Gap ($) | 3,703 | 45.20¢ per $1 |
| Gini / Inequality Index | 3,703 | 0.37 |
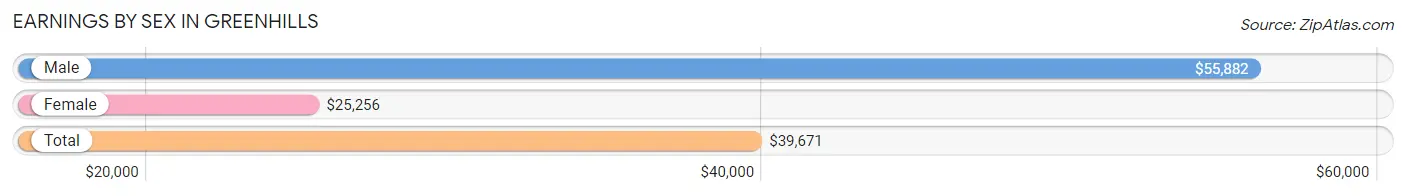
Earnings by Sex in Greenhills
Average Earnings in Greenhills are $39,671, $55,882 for men and $25,256 for women, a difference of 54.8%.
| Sex | Number | Average Earnings |
| Male | 1,018 (51.8%) | $55,882 |
| Female | 946 (48.2%) | $25,256 |
| Total | 1,964 (100.0%) | $39,671 |
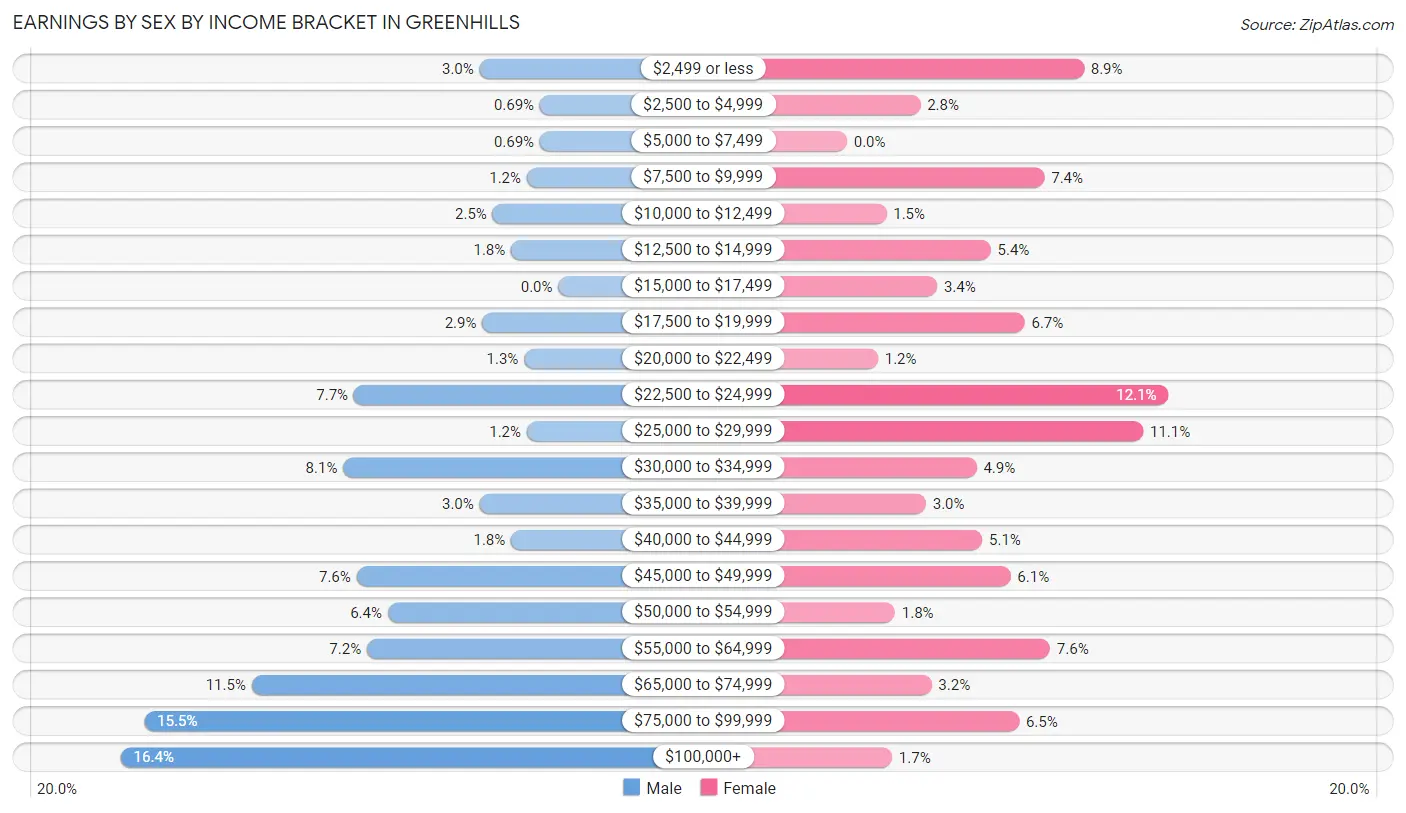
Earnings by Sex by Income Bracket in Greenhills
The most common earnings brackets in Greenhills are $100,000+ for men (167 | 16.4%) and $22,500 to $24,999 for women (114 | 12.0%).
| Income | Male | Female |
| $2,499 or less | 30 (2.9%) | 84 (8.9%) |
| $2,500 to $4,999 | 7 (0.7%) | 26 (2.8%) |
| $5,000 to $7,499 | 7 (0.7%) | 0 (0.0%) |
| $7,500 to $9,999 | 12 (1.2%) | 70 (7.4%) |
| $10,000 to $12,499 | 25 (2.5%) | 14 (1.5%) |
| $12,500 to $14,999 | 18 (1.8%) | 51 (5.4%) |
| $15,000 to $17,499 | 0 (0.0%) | 32 (3.4%) |
| $17,500 to $19,999 | 29 (2.9%) | 63 (6.7%) |
| $20,000 to $22,499 | 13 (1.3%) | 11 (1.2%) |
| $22,500 to $24,999 | 78 (7.7%) | 114 (12.0%) |
| $25,000 to $29,999 | 12 (1.2%) | 105 (11.1%) |
| $30,000 to $34,999 | 82 (8.1%) | 46 (4.9%) |
| $35,000 to $39,999 | 30 (2.9%) | 28 (3.0%) |
| $40,000 to $44,999 | 18 (1.8%) | 48 (5.1%) |
| $45,000 to $49,999 | 77 (7.6%) | 58 (6.1%) |
| $50,000 to $54,999 | 65 (6.4%) | 17 (1.8%) |
| $55,000 to $64,999 | 73 (7.2%) | 72 (7.6%) |
| $65,000 to $74,999 | 117 (11.5%) | 30 (3.2%) |
| $75,000 to $99,999 | 158 (15.5%) | 61 (6.5%) |
| $100,000+ | 167 (16.4%) | 16 (1.7%) |
| Total | 1,018 (100.0%) | 946 (100.0%) |
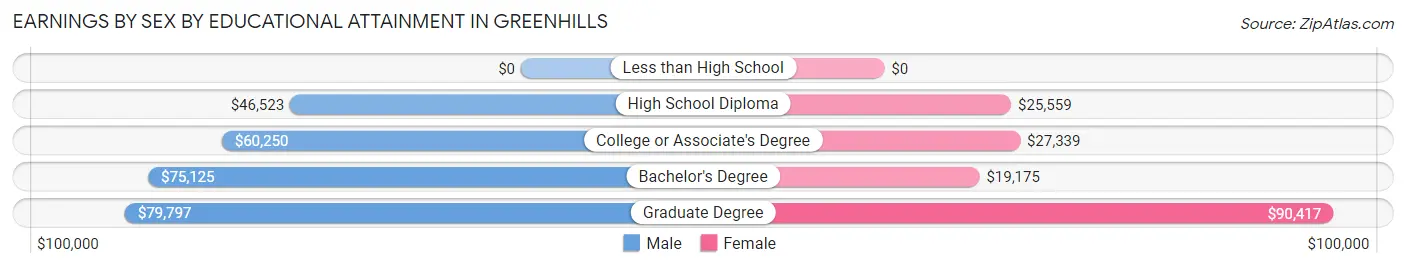
Earnings by Sex by Educational Attainment in Greenhills
Average earnings in Greenhills are $67,500 for men and $26,843 for women, a difference of 60.2%. Men with an educational attainment of graduate degree enjoy the highest average annual earnings of $79,797, while those with high school diploma education earn the least with $46,523. Women with an educational attainment of graduate degree earn the most with the average annual earnings of $90,417, while those with bachelor's degree education have the smallest earnings of $19,175.
| Educational Attainment | Male Income | Female Income |
| Less than High School | - | - |
| High School Diploma | $46,523 | $25,559 |
| College or Associate's Degree | $60,250 | $27,339 |
| Bachelor's Degree | $75,125 | $19,175 |
| Graduate Degree | $79,797 | $90,417 |
| Total | $67,500 | $26,843 |
Family Income in Greenhills
Family Income Brackets in Greenhills
According to the Greenhills family income data, there are 231 families falling into the $75,000 to $99,999 income range, which is the most common income bracket and makes up 25.6% of all families.
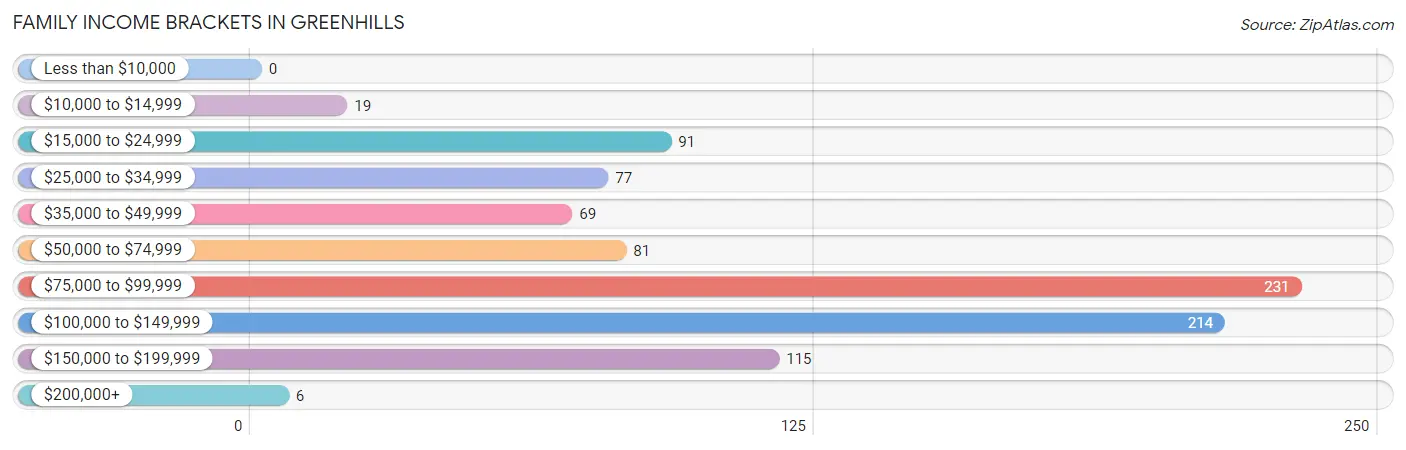
| Income Bracket | # Families | % Families |
| Less than $10,000 | 0 | 0.0% |
| $10,000 to $14,999 | 19 | 2.1% |
| $15,000 to $24,999 | 91 | 10.1% |
| $25,000 to $34,999 | 77 | 8.5% |
| $35,000 to $49,999 | 69 | 7.6% |
| $50,000 to $74,999 | 81 | 9.0% |
| $75,000 to $99,999 | 231 | 25.6% |
| $100,000 to $149,999 | 214 | 23.7% |
| $150,000 to $199,999 | 115 | 12.7% |
| $200,000+ | 6 | 0.7% |
Family Income by Famaliy Size in Greenhills
5-person families (58 | 6.4%) account for the highest median family income in Greenhills with $105,227 per family, while 2-person families (449 | 49.7%) have the highest median income of $39,186 per family member.
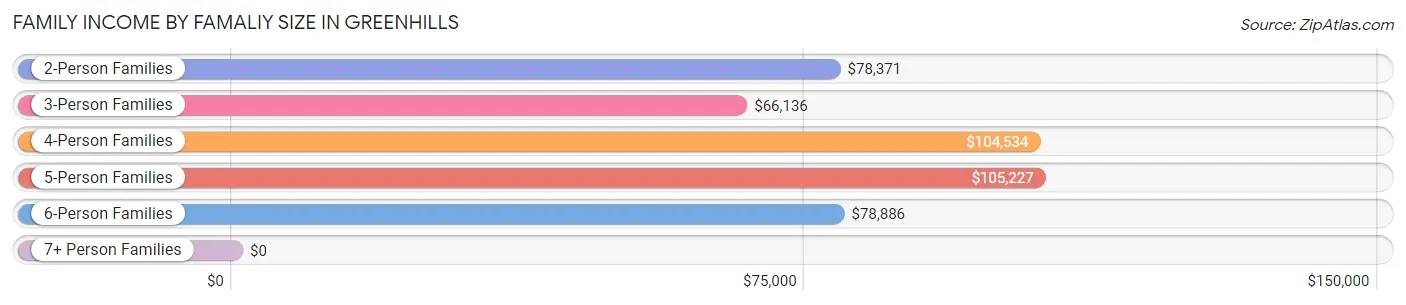
| Income Bracket | # Families | Median Income |
| 2-Person Families | 449 (49.7%) | $78,371 |
| 3-Person Families | 232 (25.7%) | $66,136 |
| 4-Person Families | 101 (11.2%) | $104,534 |
| 5-Person Families | 58 (6.4%) | $105,227 |
| 6-Person Families | 63 (7.0%) | $78,886 |
| 7+ Person Families | 0 (0.0%) | $0 |
| Total | 903 (100.0%) | $79,502 |
Family Income by Number of Earners in Greenhills
The median family income in Greenhills is $79,502, with families comprising 3+ earners (152) having the highest median family income of $114,286, while families with 1 earner (394) have the lowest median family income of $46,042, accounting for 16.8% and 43.6% of families, respectively.
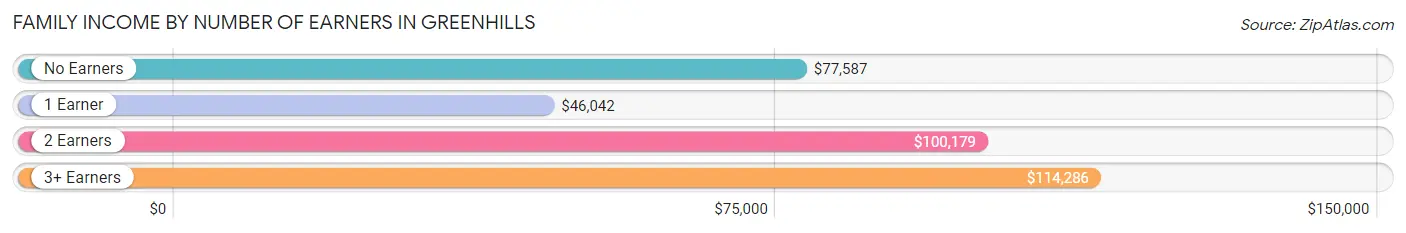
| Number of Earners | # Families | Median Income |
| No Earners | 95 (10.5%) | $77,587 |
| 1 Earner | 394 (43.6%) | $46,042 |
| 2 Earners | 262 (29.0%) | $100,179 |
| 3+ Earners | 152 (16.8%) | $114,286 |
| Total | 903 (100.0%) | $79,502 |
Household Income in Greenhills
Household Income Brackets in Greenhills
With 321 households falling in the category, the $75,000 to $99,999 income range is the most frequent in Greenhills, accounting for 21.5% of all households. In contrast, only 27 households (1.8%) fall into the $10,000 to $14,999 income bracket, making it the least populous group.
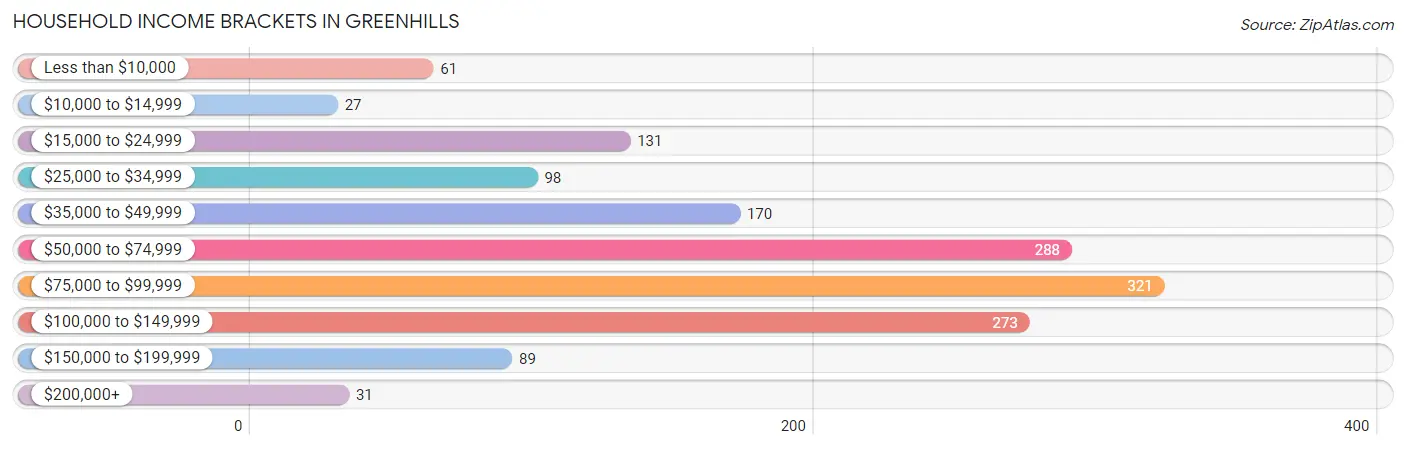
| Income Bracket | # Households | % Households |
| Less than $10,000 | 61 | 4.1% |
| $10,000 to $14,999 | 27 | 1.8% |
| $15,000 to $24,999 | 131 | 8.8% |
| $25,000 to $34,999 | 98 | 6.6% |
| $35,000 to $49,999 | 170 | 11.4% |
| $50,000 to $74,999 | 288 | 19.3% |
| $75,000 to $99,999 | 321 | 21.5% |
| $100,000 to $149,999 | 273 | 18.3% |
| $150,000 to $199,999 | 89 | 6.0% |
| $200,000+ | 31 | 2.1% |
Household Income by Householder Age in Greenhills
The median household income in Greenhills is $71,979, with the highest median household income of $85,670 found in the 15 to 24 years age bracket for the primary householder. A total of 41 households (2.8%) fall into this category. Meanwhile, the 65+ years age bracket for the primary householder has the lowest median household income of $49,571, with 356 households (23.9%) in this group.
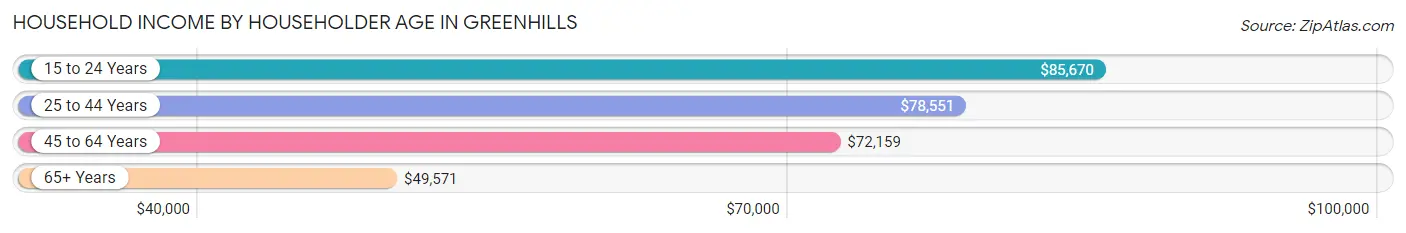
| Income Bracket | # Households | Median Income |
| 15 to 24 Years | 41 (2.8%) | $85,670 |
| 25 to 44 Years | 508 (34.1%) | $78,551 |
| 45 to 64 Years | 586 (39.3%) | $72,159 |
| 65+ Years | 356 (23.9%) | $49,571 |
| Total | 1,491 (100.0%) | $71,979 |
Poverty in Greenhills
Income Below Poverty by Sex and Age in Greenhills
With 9.9% poverty level for males and 10.3% for females among the residents of Greenhills, 15 year old males and 6 to 11 year old females are the most vulnerable to poverty, with 7 males (100.0%) and 43 females (29.4%) in their respective age groups living below the poverty level.
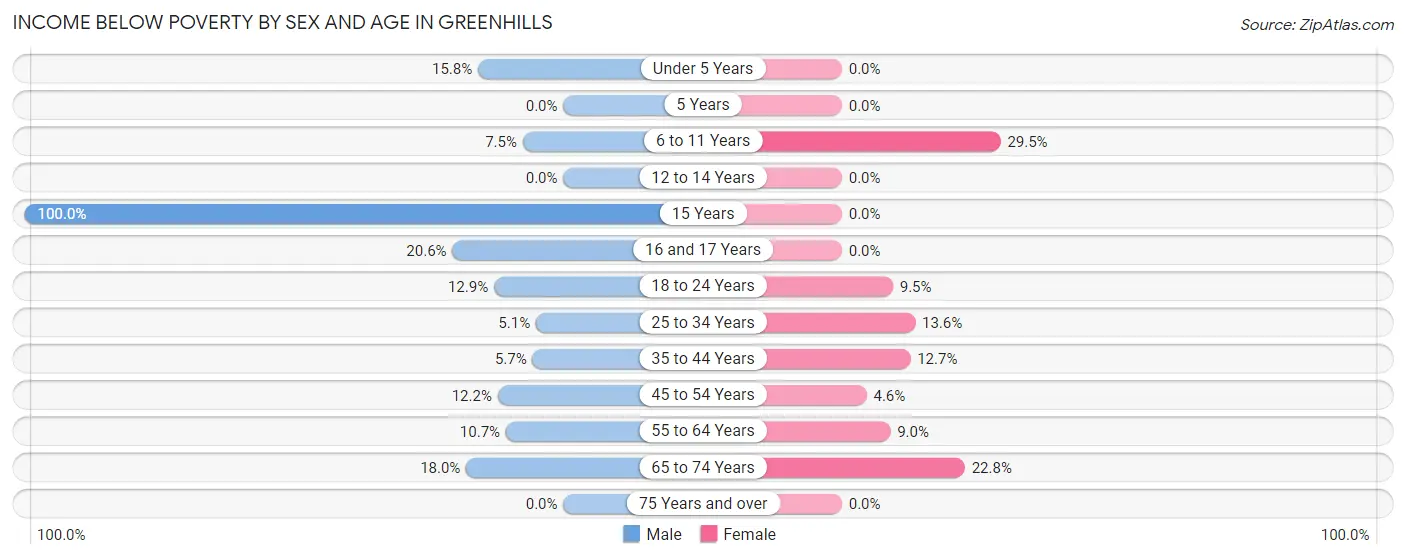
| Age Bracket | Male | Female |
| Under 5 Years | 22 (15.8%) | 0 (0.0%) |
| 5 Years | 0 (0.0%) | 0 (0.0%) |
| 6 to 11 Years | 18 (7.5%) | 43 (29.4%) |
| 12 to 14 Years | 0 (0.0%) | 0 (0.0%) |
| 15 Years | 7 (100.0%) | 0 (0.0%) |
| 16 and 17 Years | 7 (20.6%) | 0 (0.0%) |
| 18 to 24 Years | 34 (12.9%) | 7 (9.5%) |
| 25 to 34 Years | 10 (5.1%) | 34 (13.6%) |
| 35 to 44 Years | 16 (5.7%) | 32 (12.7%) |
| 45 to 54 Years | 19 (12.2%) | 9 (4.6%) |
| 55 to 64 Years | 29 (10.7%) | 23 (9.0%) |
| 65 to 74 Years | 22 (18.0%) | 34 (22.8%) |
| 75 Years and over | 0 (0.0%) | 0 (0.0%) |
| Total | 184 (9.9%) | 182 (10.3%) |
Income Above Poverty by Sex and Age in Greenhills
According to the poverty statistics in Greenhills, males aged 5 years and females aged under 5 years are the age groups that are most secure financially, with 100.0% of males and 100.0% of females in these age groups living above the poverty line.
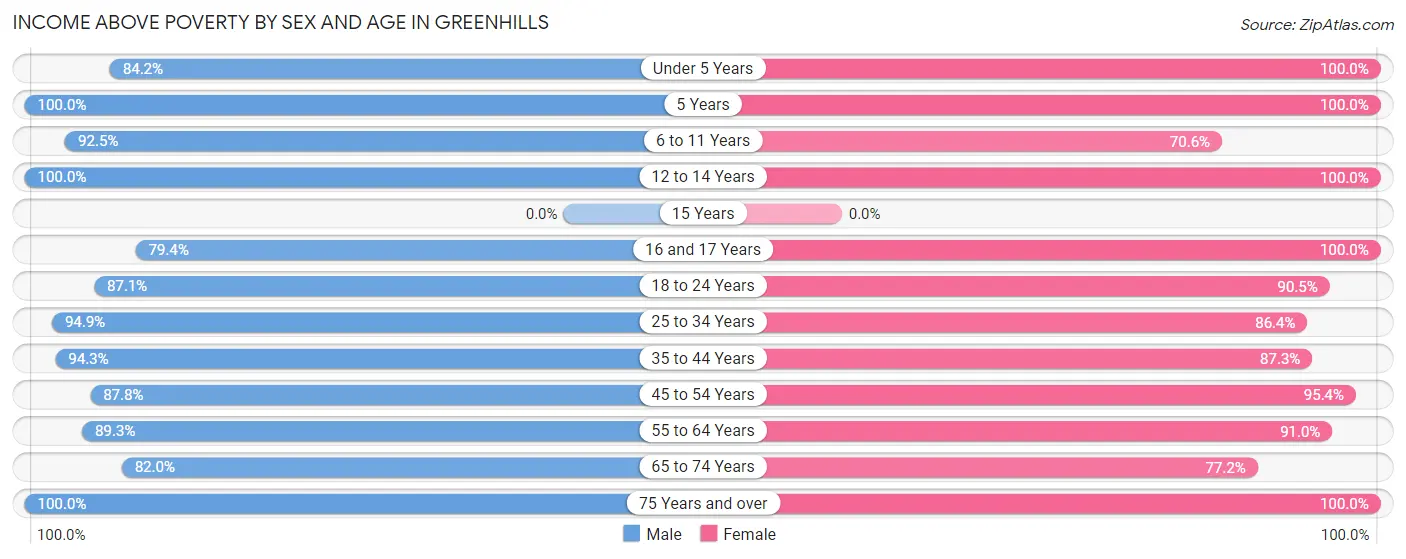
| Age Bracket | Male | Female |
| Under 5 Years | 117 (84.2%) | 89 (100.0%) |
| 5 Years | 56 (100.0%) | 10 (100.0%) |
| 6 to 11 Years | 221 (92.5%) | 103 (70.6%) |
| 12 to 14 Years | 25 (100.0%) | 67 (100.0%) |
| 15 Years | 0 (0.0%) | 0 (0.0%) |
| 16 and 17 Years | 27 (79.4%) | 78 (100.0%) |
| 18 to 24 Years | 230 (87.1%) | 67 (90.5%) |
| 25 to 34 Years | 187 (94.9%) | 216 (86.4%) |
| 35 to 44 Years | 264 (94.3%) | 220 (87.3%) |
| 45 to 54 Years | 137 (87.8%) | 187 (95.4%) |
| 55 to 64 Years | 243 (89.3%) | 233 (91.0%) |
| 65 to 74 Years | 100 (82.0%) | 115 (77.2%) |
| 75 Years and over | 62 (100.0%) | 204 (100.0%) |
| Total | 1,669 (90.1%) | 1,589 (89.7%) |
Income Below Poverty Among Married-Couple Families in Greenhills
The poverty statistics for married-couple families in Greenhills show that 2.1% or 11 of the total 532 families live below the poverty line. Families with 3 or 4 children have the highest poverty rate of 7.7%, comprising of 6 families. On the other hand, families with 1 or 2 children have the lowest poverty rate of 0.0%, which includes 0 families.
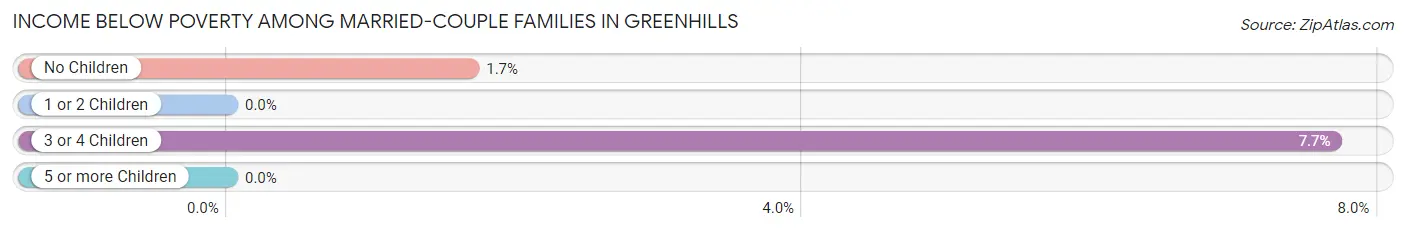
| Children | Above Poverty | Below Poverty |
| No Children | 292 (98.3%) | 5 (1.7%) |
| 1 or 2 Children | 157 (100.0%) | 0 (0.0%) |
| 3 or 4 Children | 72 (92.3%) | 6 (7.7%) |
| 5 or more Children | 0 (0.0%) | 0 (0.0%) |
| Total | 521 (97.9%) | 11 (2.1%) |
Income Below Poverty Among Single-Parent Households in Greenhills
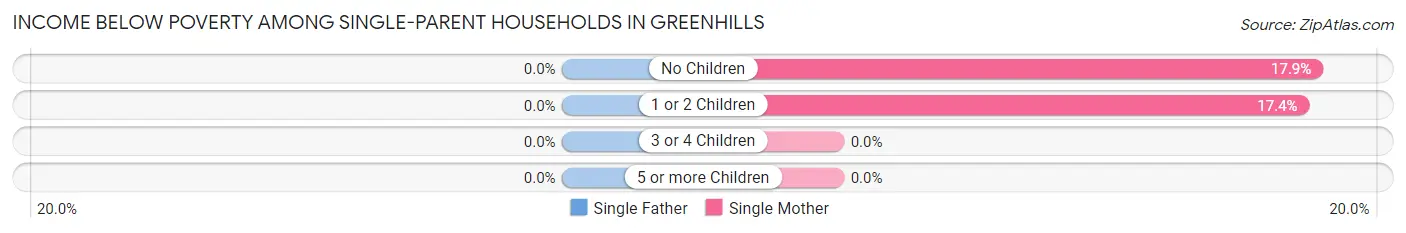
| Children | Single Father | Single Mother |
| No Children | 0 (0.0%) | 25 (17.9%) |
| 1 or 2 Children | 0 (0.0%) | 34 (17.3%) |
| 3 or 4 Children | 0 (0.0%) | 0 (0.0%) |
| 5 or more Children | 0 (0.0%) | 0 (0.0%) |
| Total | 0 (0.0%) | 59 (17.2%) |
Income Below Poverty Among Married-Couple vs Single-Parent Households in Greenhills
The poverty data for Greenhills shows that 11 of the married-couple family households (2.1%) and 59 of the single-parent households (15.9%) are living below the poverty level. Within the married-couple family households, those with 3 or 4 children have the highest poverty rate, with 6 households (7.7%) falling below the poverty line. Among the single-parent households, those with 1 or 2 children have the highest poverty rate, with 34 household (16.5%) living below poverty.
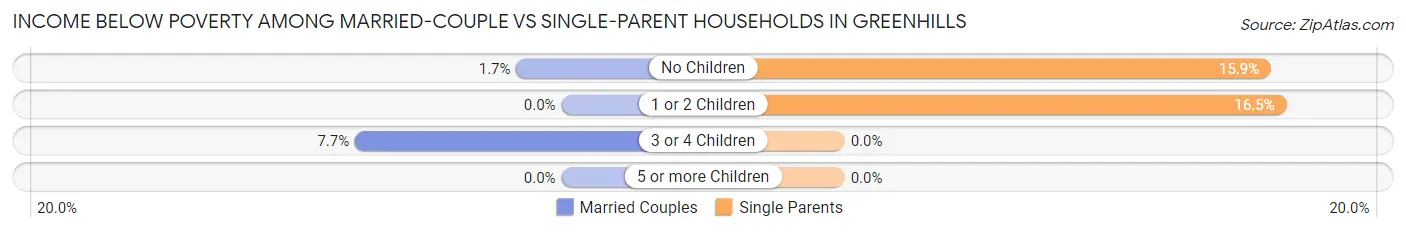
| Children | Married-Couple Families | Single-Parent Households |
| No Children | 5 (1.7%) | 25 (15.9%) |
| 1 or 2 Children | 0 (0.0%) | 34 (16.5%) |
| 3 or 4 Children | 6 (7.7%) | 0 (0.0%) |
| 5 or more Children | 0 (0.0%) | 0 (0.0%) |
| Total | 11 (2.1%) | 59 (15.9%) |
Race in Greenhills
The most populous races in Greenhills are White / Caucasian (2,737 | 73.9%), Black / African American (602 | 16.3%), and Two or more Races (316 | 8.5%).
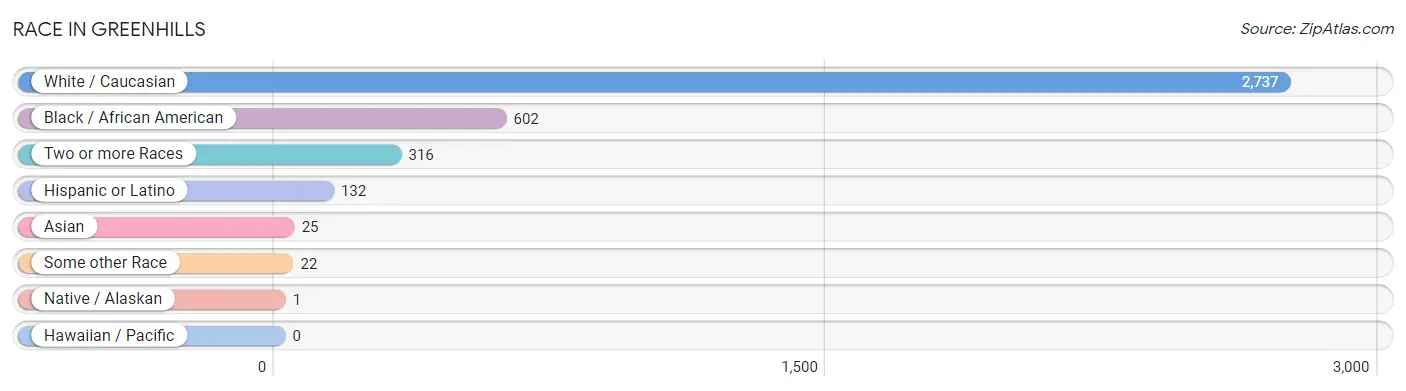
| Race | # Population | % Population |
| Asian | 25 | 0.7% |
| Black / African American | 602 | 16.3% |
| Hawaiian / Pacific | 0 | 0.0% |
| Hispanic or Latino | 132 | 3.6% |
| Native / Alaskan | 1 | 0.0% |
| White / Caucasian | 2,737 | 73.9% |
| Two or more Races | 316 | 8.5% |
| Some other Race | 22 | 0.6% |
| Total | 3,703 | 100.0% |
Ancestry in Greenhills
The most populous ancestries reported in Greenhills are German (1,298 | 35.0%), English (673 | 18.2%), Irish (485 | 13.1%), American (177 | 4.8%), and Italian (140 | 3.8%), together accounting for 74.9% of all Greenhills residents.
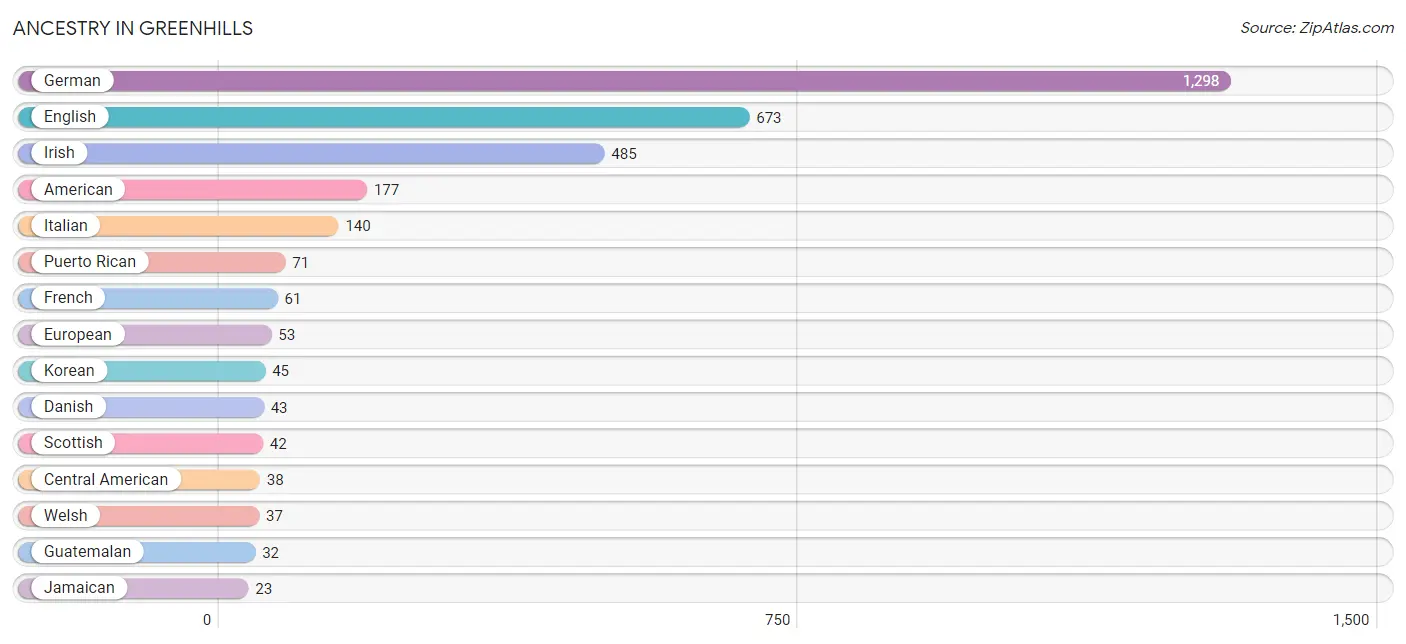
| Ancestry | # Population | % Population |
| African | 13 | 0.4% |
| American | 177 | 4.8% |
| Arab | 5 | 0.1% |
| Austrian | 7 | 0.2% |
| Central American | 38 | 1.0% |
| Colombian | 13 | 0.4% |
| Danish | 43 | 1.2% |
| Dutch | 19 | 0.5% |
| Eastern European | 7 | 0.2% |
| English | 673 | 18.2% |
| European | 53 | 1.4% |
| French | 61 | 1.7% |
| German | 1,298 | 35.0% |
| Guatemalan | 32 | 0.9% |
| Indian (Asian) | 8 | 0.2% |
| Irish | 485 | 13.1% |
| Italian | 140 | 3.8% |
| Jamaican | 23 | 0.6% |
| Jordanian | 5 | 0.1% |
| Korean | 45 | 1.2% |
| Mexican | 10 | 0.3% |
| Norwegian | 21 | 0.6% |
| Panamanian | 6 | 0.2% |
| Polish | 17 | 0.5% |
| Puerto Rican | 71 | 1.9% |
| Scotch-Irish | 22 | 0.6% |
| Scottish | 42 | 1.1% |
| Slovak | 8 | 0.2% |
| South American | 13 | 0.4% |
| Subsaharan African | 13 | 0.4% |
| Swedish | 15 | 0.4% |
| Swiss | 23 | 0.6% |
| Ukrainian | 5 | 0.1% |
| Welsh | 37 | 1.0% | View All 34 Rows |
Immigrants in Greenhills
The most numerous immigrant groups reported in Greenhills came from Latin America (84 | 2.3%), South America (36 | 1.0%), Asia (33 | 0.9%), Caribbean (26 | 0.7%), and South Eastern Asia (25 | 0.7%), together accounting for 5.5% of all Greenhills residents.
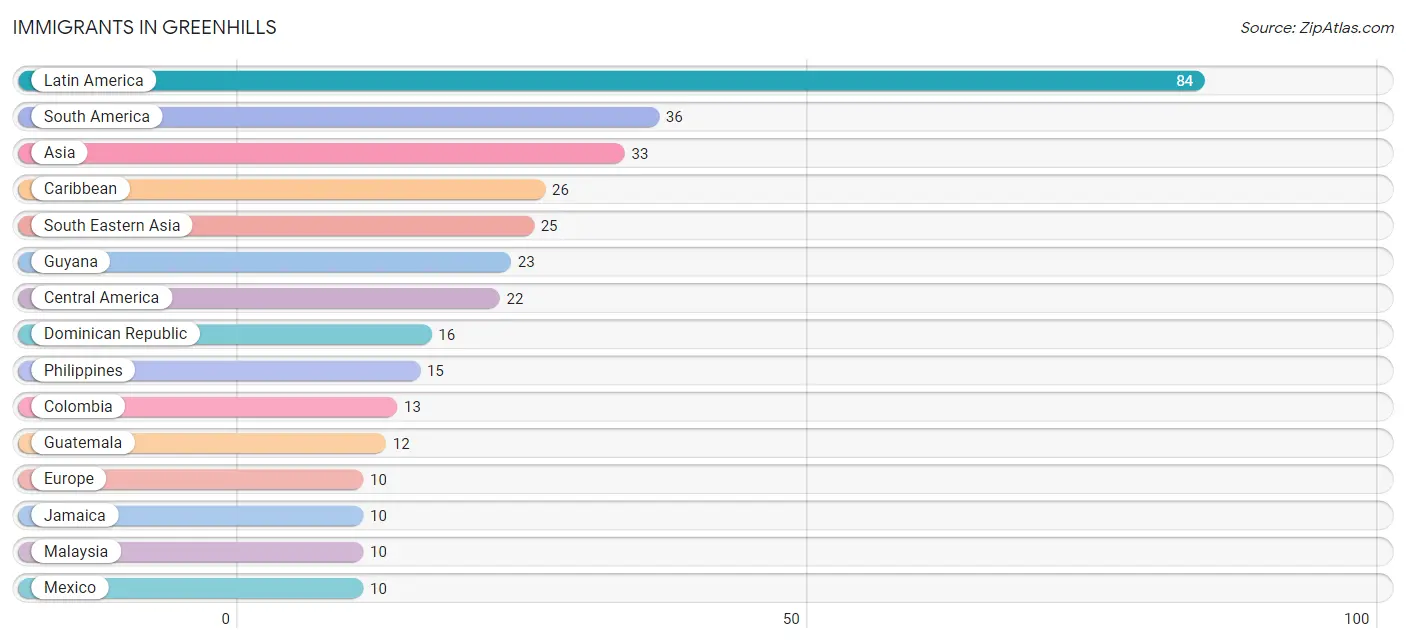
| Immigration Origin | # Population | % Population |
| Asia | 33 | 0.9% |
| Caribbean | 26 | 0.7% |
| Central America | 22 | 0.6% |
| China | 8 | 0.2% |
| Colombia | 13 | 0.4% |
| Dominican Republic | 16 | 0.4% |
| Eastern Asia | 8 | 0.2% |
| Europe | 10 | 0.3% |
| Guatemala | 12 | 0.3% |
| Guyana | 23 | 0.6% |
| Italy | 7 | 0.2% |
| Jamaica | 10 | 0.3% |
| Latin America | 84 | 2.3% |
| Malaysia | 10 | 0.3% |
| Mexico | 10 | 0.3% |
| Philippines | 15 | 0.4% |
| South America | 36 | 1.0% |
| South Eastern Asia | 25 | 0.7% |
| Southern Europe | 7 | 0.2% |
| Switzerland | 3 | 0.1% |
| Taiwan | 8 | 0.2% |
| Western Europe | 3 | 0.1% | View All 22 Rows |
Sex and Age in Greenhills
Sex and Age in Greenhills
The most populous age groups in Greenhills are 20 to 24 Years (230 | 12.3%) for men and 30 to 34 Years (181 | 9.9%) for women.
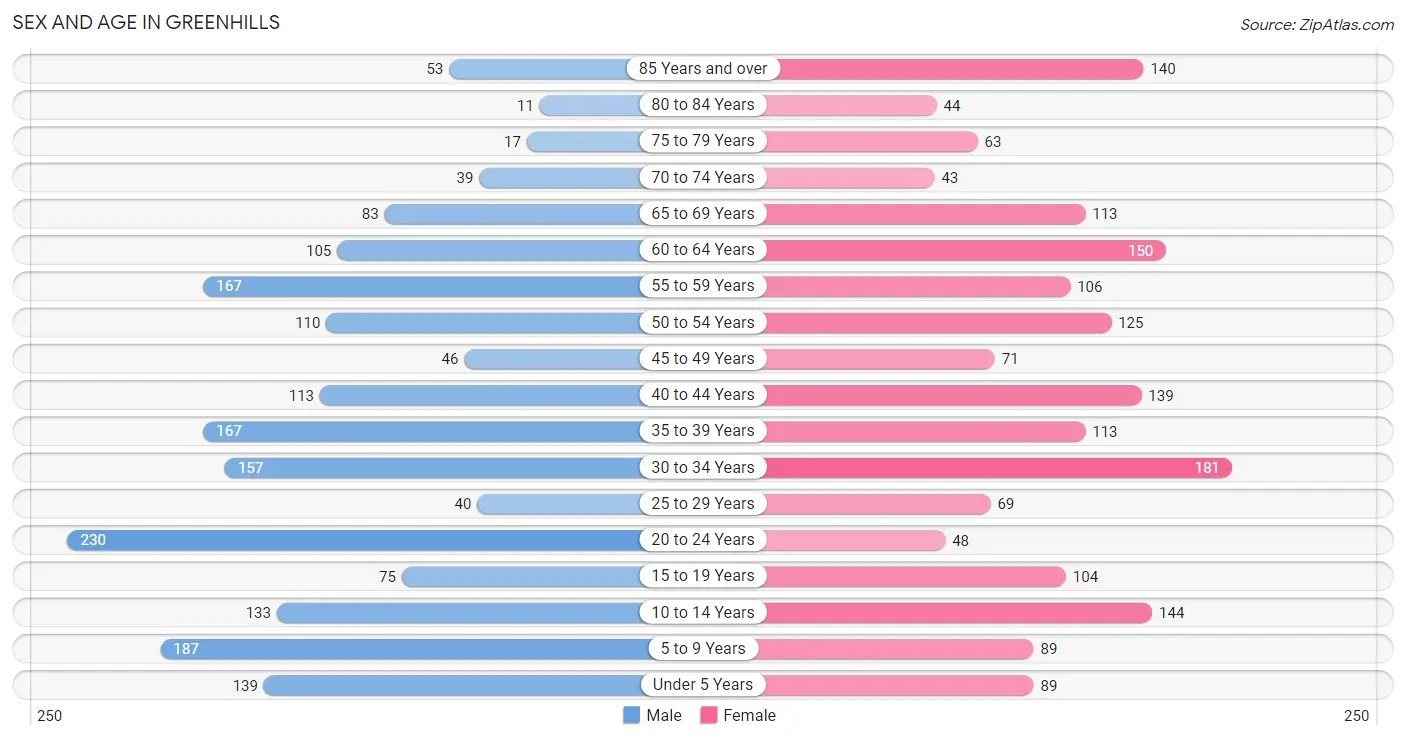
| Age Bracket | Male | Female |
| Under 5 Years | 139 (7.4%) | 89 (4.9%) |
| 5 to 9 Years | 187 (10.0%) | 89 (4.9%) |
| 10 to 14 Years | 133 (7.1%) | 144 (7.9%) |
| 15 to 19 Years | 75 (4.0%) | 104 (5.7%) |
| 20 to 24 Years | 230 (12.3%) | 48 (2.6%) |
| 25 to 29 Years | 40 (2.1%) | 69 (3.8%) |
| 30 to 34 Years | 157 (8.4%) | 181 (9.9%) |
| 35 to 39 Years | 167 (8.9%) | 113 (6.2%) |
| 40 to 44 Years | 113 (6.0%) | 139 (7.6%) |
| 45 to 49 Years | 46 (2.5%) | 71 (3.9%) |
| 50 to 54 Years | 110 (5.9%) | 125 (6.8%) |
| 55 to 59 Years | 167 (8.9%) | 106 (5.8%) |
| 60 to 64 Years | 105 (5.6%) | 150 (8.2%) |
| 65 to 69 Years | 83 (4.4%) | 113 (6.2%) |
| 70 to 74 Years | 39 (2.1%) | 43 (2.4%) |
| 75 to 79 Years | 17 (0.9%) | 63 (3.4%) |
| 80 to 84 Years | 11 (0.6%) | 44 (2.4%) |
| 85 Years and over | 53 (2.8%) | 140 (7.6%) |
| Total | 1,872 (100.0%) | 1,831 (100.0%) |
Families and Households in Greenhills
Median Family Size in Greenhills
The median family size in Greenhills is 3.07 persons per family, with married-couple families (532 | 58.9%) accounting for the largest median family size of 3.1 persons per family. On the other hand, single male/father families (27 | 3.0%) represent the smallest median family size with 2.41 persons per family.
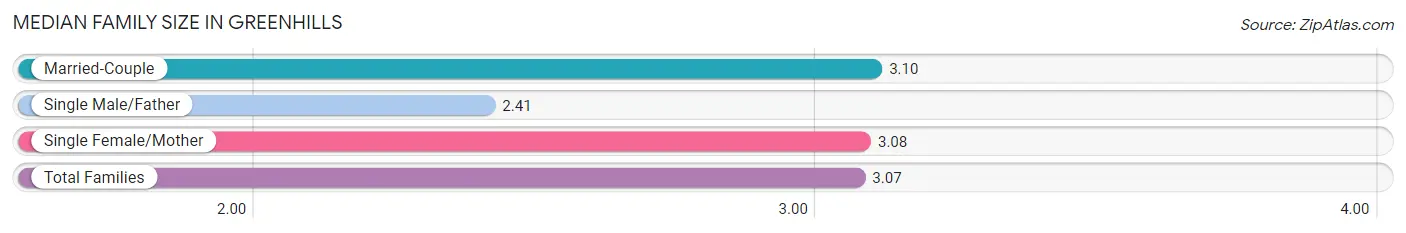
| Family Type | # Families | Family Size |
| Married-Couple | 532 (58.9%) | 3.10 |
| Single Male/Father | 27 (3.0%) | 2.41 |
| Single Female/Mother | 344 (38.1%) | 3.08 |
| Total Families | 903 (100.0%) | 3.07 |
Median Household Size in Greenhills
The median household size in Greenhills is 2.43 persons per household, with single female/mother households (344 | 23.1%) accounting for the largest median household size of 3.31 persons per household. non-family households (588 | 39.4%) represent the smallest median household size with 1.27 persons per household.
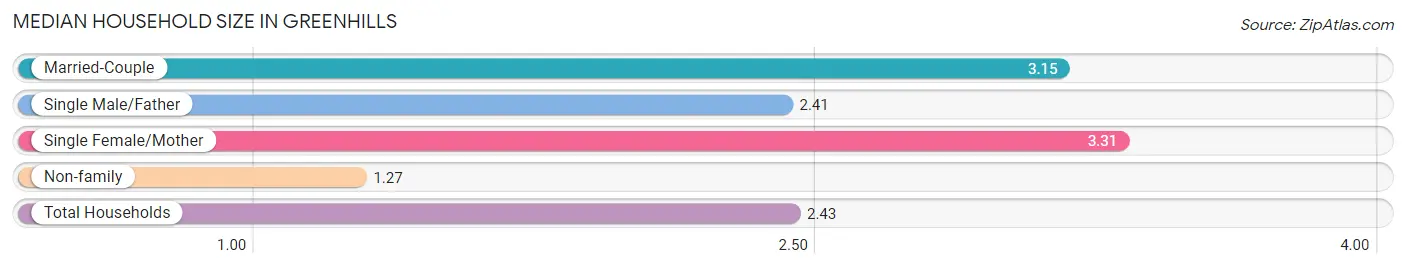
| Household Type | # Households | Household Size |
| Married-Couple | 532 (35.7%) | 3.15 |
| Single Male/Father | 27 (1.8%) | 2.41 |
| Single Female/Mother | 344 (23.1%) | 3.31 |
| Non-family | 588 (39.4%) | 1.27 |
| Total Households | 1,491 (100.0%) | 2.43 |
Household Size by Marriage Status in Greenhills
Out of a total of 1,491 households in Greenhills, 903 (60.6%) are family households, while 588 (39.4%) are nonfamily households. The most numerous type of family households are 2-person households, comprising 435, and the most common type of nonfamily households are 1-person households, comprising 426.
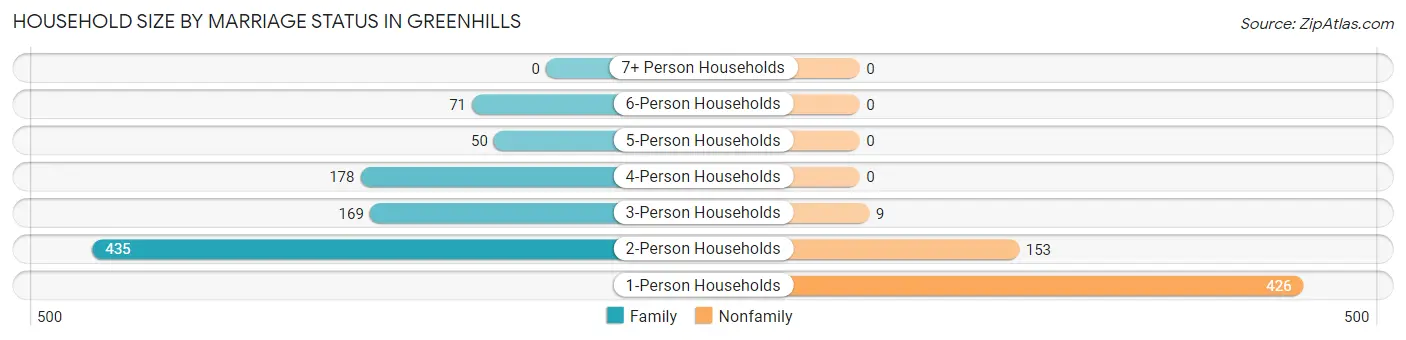
| Household Size | Family Households | Nonfamily Households |
| 1-Person Households | - | 426 (28.6%) |
| 2-Person Households | 435 (29.2%) | 153 (10.3%) |
| 3-Person Households | 169 (11.3%) | 9 (0.6%) |
| 4-Person Households | 178 (11.9%) | 0 (0.0%) |
| 5-Person Households | 50 (3.4%) | 0 (0.0%) |
| 6-Person Households | 71 (4.8%) | 0 (0.0%) |
| 7+ Person Households | 0 (0.0%) | 0 (0.0%) |
| Total | 903 (60.6%) | 588 (39.4%) |
Female Fertility in Greenhills
Fertility by Age in Greenhills
Average fertility rate in Greenhills is 28.0 births per 1,000 women. Women in the age bracket of 20 to 34 years have the highest fertility rate with 37.0 births per 1,000 women. Women in the age bracket of 20 to 34 years acount for 52.4% of all women with births.
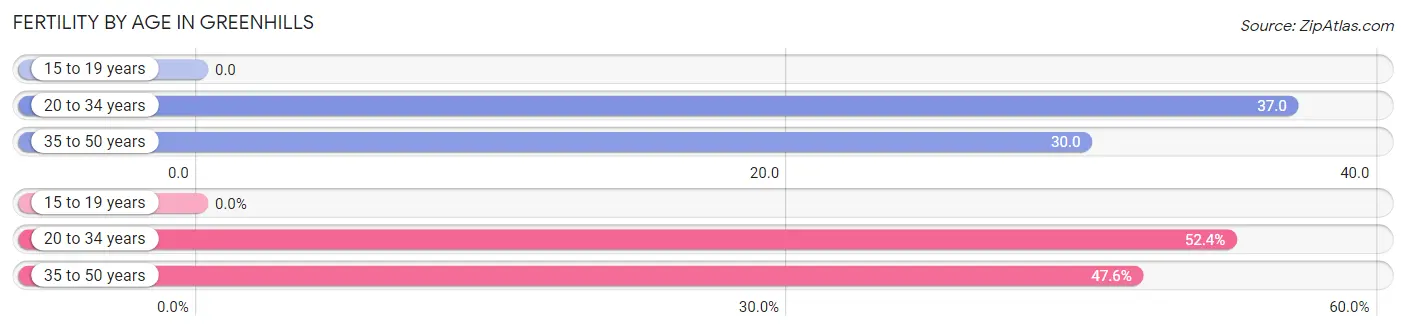
| Age Bracket | Women with Births | Births / 1,000 Women |
| 15 to 19 years | 0 (0.0%) | 0.0 |
| 20 to 34 years | 11 (52.4%) | 37.0 |
| 35 to 50 years | 10 (47.6%) | 30.0 |
| Total | 21 (100.0%) | 28.0 |
Fertility by Age by Marriage Status in Greenhills
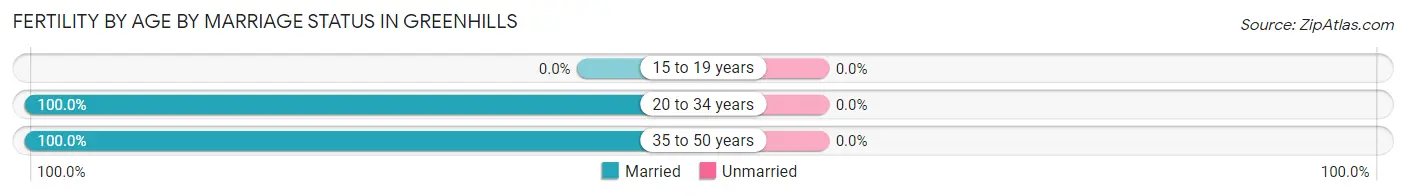
| Age Bracket | Married | Unmarried |
| 15 to 19 years | 0 (0.0%) | 0 (0.0%) |
| 20 to 34 years | 11 (100.0%) | 0 (0.0%) |
| 35 to 50 years | 10 (100.0%) | 0 (0.0%) |
| Total | 21 (100.0%) | 0 (0.0%) |
Fertility by Education in Greenhills
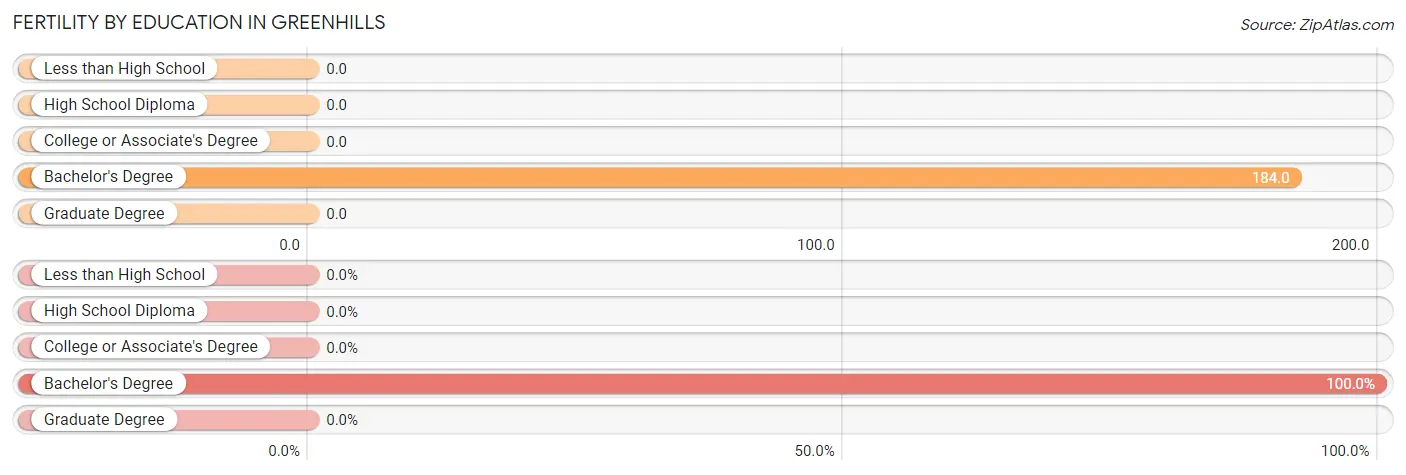
| Educational Attainment | Women with Births | Births / 1,000 Women |
| Less than High School | 0 (0.0%) | 0.0 |
| High School Diploma | 0 (0.0%) | 0.0 |
| College or Associate's Degree | 0 (0.0%) | 0.0 |
| Bachelor's Degree | 21 (100.0%) | 184.0 |
| Graduate Degree | 0 (0.0%) | 0.0 |
| Total | 21 (100.0%) | 28.0 |
Fertility by Education by Marriage Status in Greenhills
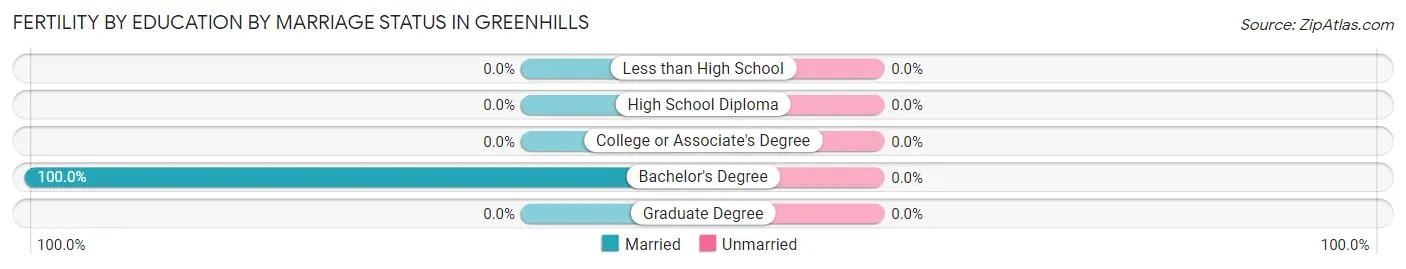
| Educational Attainment | Married | Unmarried |
| Less than High School | 0 (0.0%) | 0 (0.0%) |
| High School Diploma | 0 (0.0%) | 0 (0.0%) |
| College or Associate's Degree | 0 (0.0%) | 0 (0.0%) |
| Bachelor's Degree | 21 (100.0%) | 0 (0.0%) |
| Graduate Degree | 0 (0.0%) | 0 (0.0%) |
| Total | 21 (100.0%) | 0 (0.0%) |
Employment Characteristics in Greenhills
Employment by Class of Employer in Greenhills
Among the 1,778 employed individuals in Greenhills, private company employees (1,239 | 69.7%), not-for-profit organizations (163 | 9.2%), and local government employees (109 | 6.1%) make up the most common classes of employment.
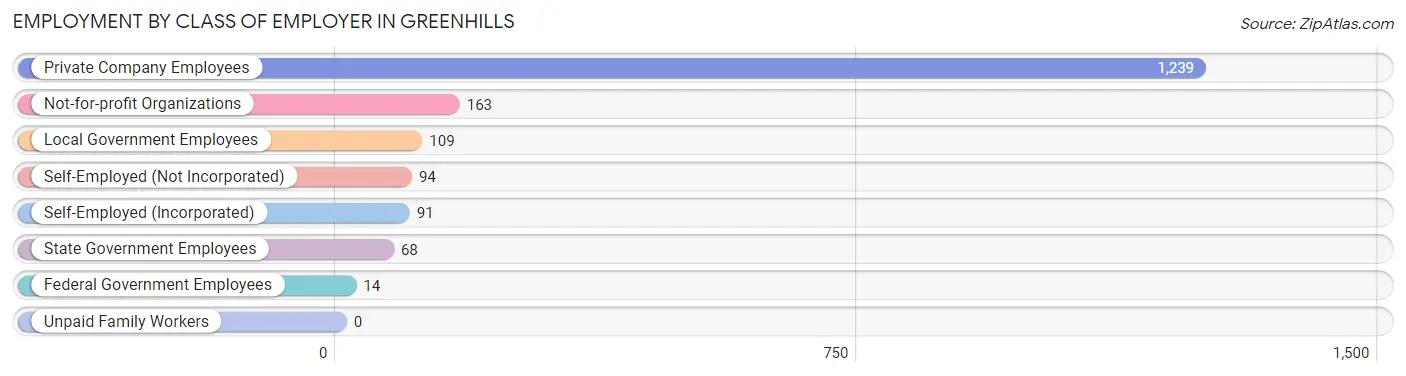
| Employer Class | # Employees | % Employees |
| Private Company Employees | 1,239 | 69.7% |
| Self-Employed (Incorporated) | 91 | 5.1% |
| Self-Employed (Not Incorporated) | 94 | 5.3% |
| Not-for-profit Organizations | 163 | 9.2% |
| Local Government Employees | 109 | 6.1% |
| State Government Employees | 68 | 3.8% |
| Federal Government Employees | 14 | 0.8% |
| Unpaid Family Workers | 0 | 0.0% |
| Total | 1,778 | 100.0% |
Employment Status by Age in Greenhills
According to the labor force statistics for Greenhills, out of the total population over 16 years of age (2,915), 63.0% or 1,836 individuals are in the labor force, with 2.0% or 37 of them unemployed. The age group with the highest labor force participation rate is 25 to 29 years, with 100.0% or 109 individuals in the labor force. Within the labor force, the 55 to 59 years age range has the highest percentage of unemployed individuals, with 4.5% or 12 of them being unemployed.
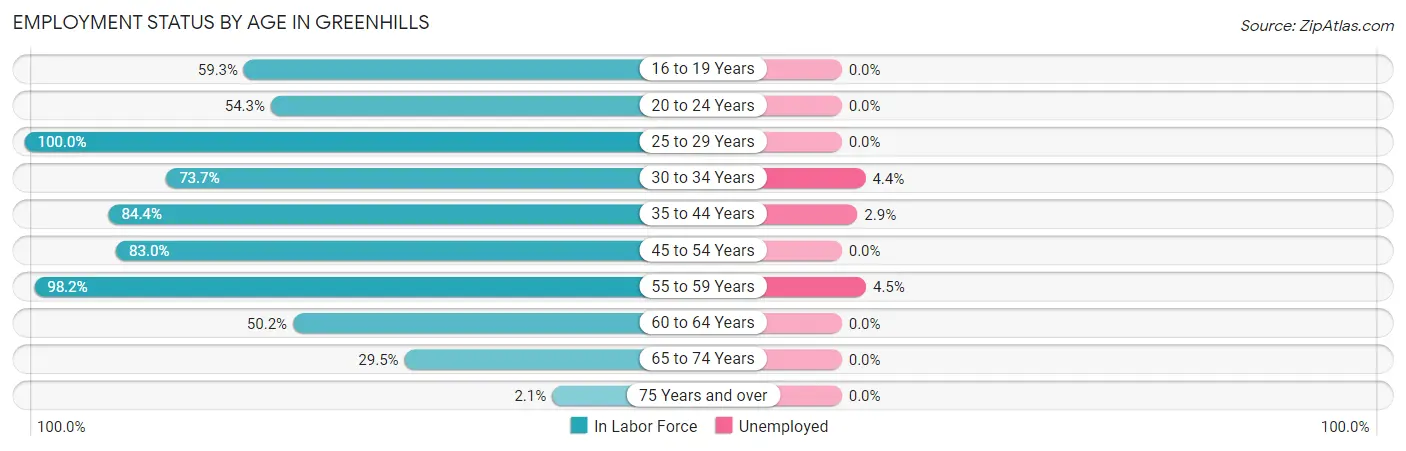
| Age Bracket | In Labor Force | Unemployed |
| 16 to 19 Years | 102 (59.3%) | 0 (0.0%) |
| 20 to 24 Years | 151 (54.3%) | 0 (0.0%) |
| 25 to 29 Years | 109 (100.0%) | 0 (0.0%) |
| 30 to 34 Years | 249 (73.7%) | 11 (4.4%) |
| 35 to 44 Years | 449 (84.4%) | 13 (2.9%) |
| 45 to 54 Years | 292 (83.0%) | 0 (0.0%) |
| 55 to 59 Years | 268 (98.2%) | 12 (4.5%) |
| 60 to 64 Years | 128 (50.2%) | 0 (0.0%) |
| 65 to 74 Years | 82 (29.5%) | 0 (0.0%) |
| 75 Years and over | 7 (2.1%) | 0 (0.0%) |
| Total | 1,836 (63.0%) | 37 (2.0%) |
Employment Status by Educational Attainment in Greenhills
According to labor force statistics for Greenhills, 80.4% of individuals (1,495) out of the total population between 25 and 64 years of age (1,859) are in the labor force, with 2.4% or 36 of them being unemployed. The group with the highest labor force participation rate are those with the educational attainment of high school diploma, with 86.4% or 535 individuals in the labor force. Within the labor force, individuals with less than high school education have the highest percentage of unemployment, with 100.0% or 11 of them being unemployed.
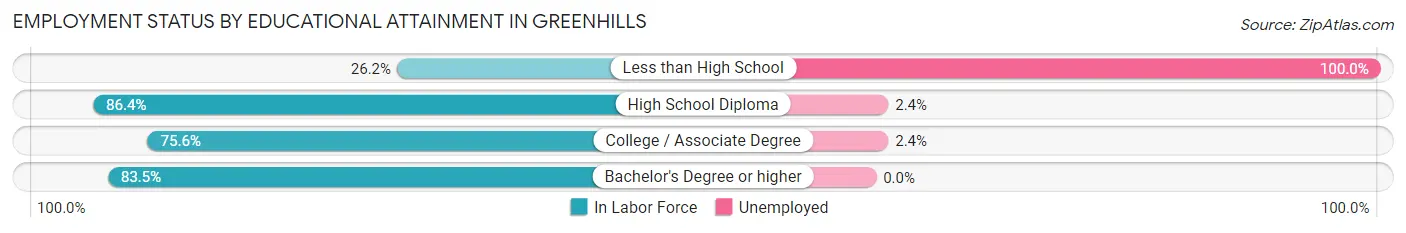
| Educational Attainment | In Labor Force | Unemployed |
| Less than High School | 11 (26.2%) | 42 (100.0%) |
| High School Diploma | 535 (86.4%) | 15 (2.4%) |
| College / Associate Degree | 497 (75.6%) | 16 (2.4%) |
| Bachelor's Degree or higher | 452 (83.5%) | 0 (0.0%) |
| Total | 1,495 (80.4%) | 45 (2.4%) |
Employment Occupations by Sex in Greenhills
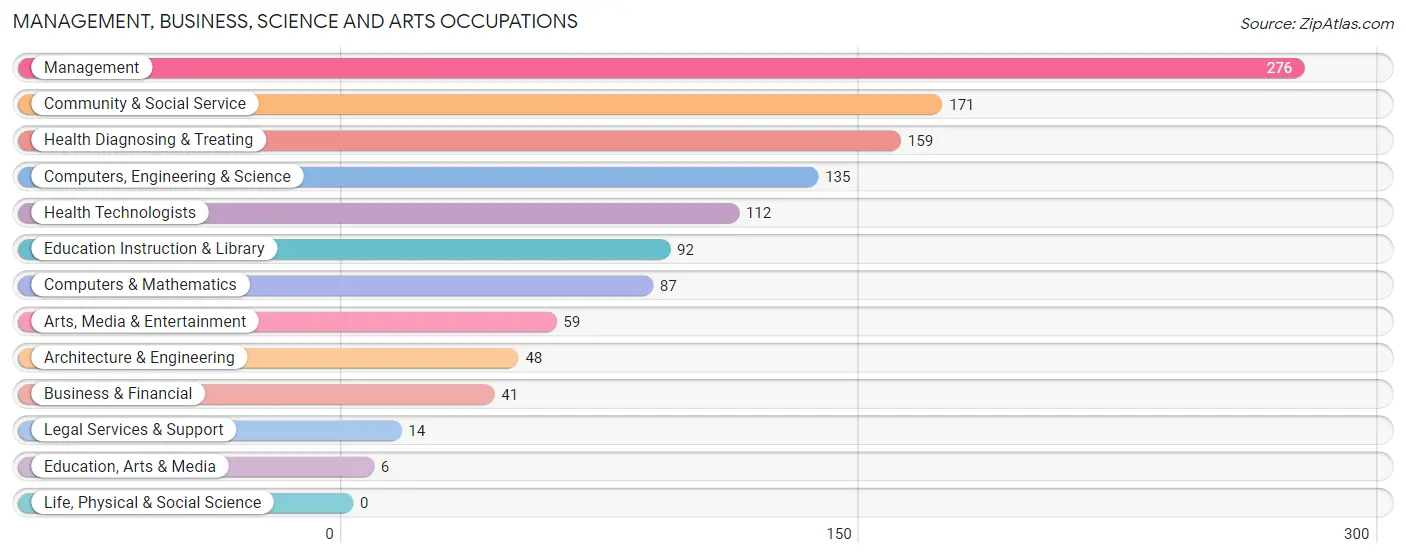
Management, Business, Science and Arts Occupations
The most common Management, Business, Science and Arts occupations in Greenhills are Management (276 | 15.3%), Community & Social Service (171 | 9.5%), Health Diagnosing & Treating (159 | 8.8%), Computers, Engineering & Science (135 | 7.5%), and Health Technologists (112 | 6.2%).
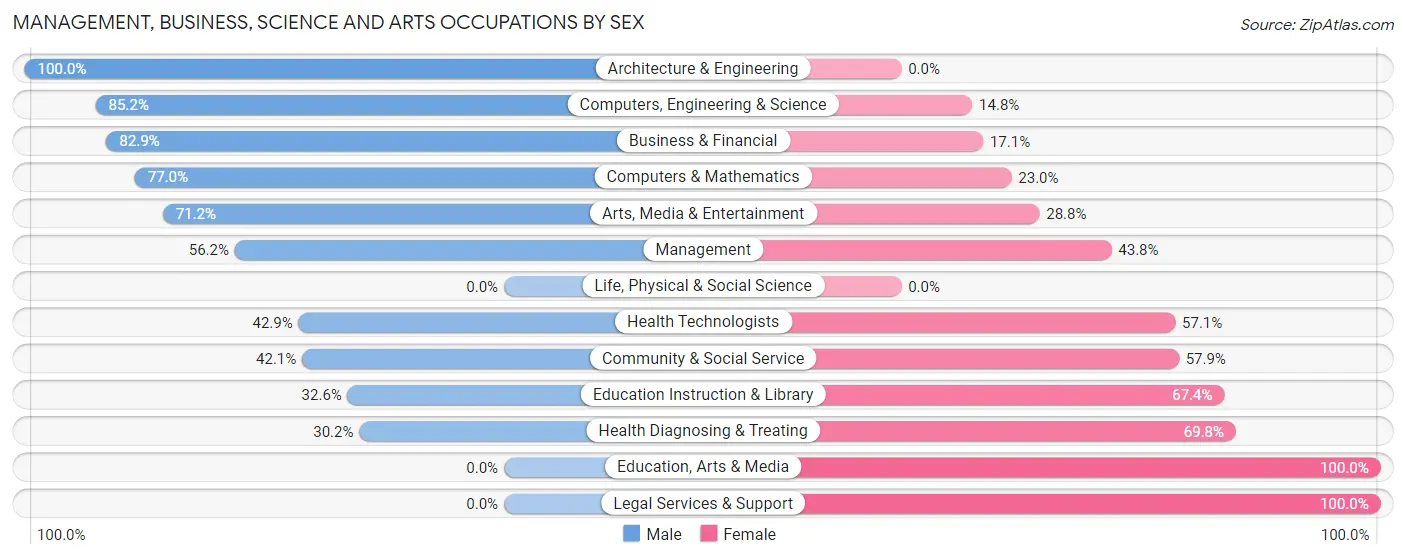
Management, Business, Science and Arts Occupations by Sex
Within the Management, Business, Science and Arts occupations in Greenhills, the most male-oriented occupations are Architecture & Engineering (100.0%), Computers, Engineering & Science (85.2%), and Business & Financial (82.9%), while the most female-oriented occupations are Education, Arts & Media (100.0%), Legal Services & Support (100.0%), and Health Diagnosing & Treating (69.8%).
| Occupation | Male | Female |
| Management | 155 (56.2%) | 121 (43.8%) |
| Business & Financial | 34 (82.9%) | 7 (17.1%) |
| Computers, Engineering & Science | 115 (85.2%) | 20 (14.8%) |
| Computers & Mathematics | 67 (77.0%) | 20 (23.0%) |
| Architecture & Engineering | 48 (100.0%) | 0 (0.0%) |
| Life, Physical & Social Science | 0 (0.0%) | 0 (0.0%) |
| Community & Social Service | 72 (42.1%) | 99 (57.9%) |
| Education, Arts & Media | 0 (0.0%) | 6 (100.0%) |
| Legal Services & Support | 0 (0.0%) | 14 (100.0%) |
| Education Instruction & Library | 30 (32.6%) | 62 (67.4%) |
| Arts, Media & Entertainment | 42 (71.2%) | 17 (28.8%) |
| Health Diagnosing & Treating | 48 (30.2%) | 111 (69.8%) |
| Health Technologists | 48 (42.9%) | 64 (57.1%) |
| Total (Category) | 424 (54.2%) | 358 (45.8%) |
| Total (Overall) | 961 (53.4%) | 840 (46.6%) |
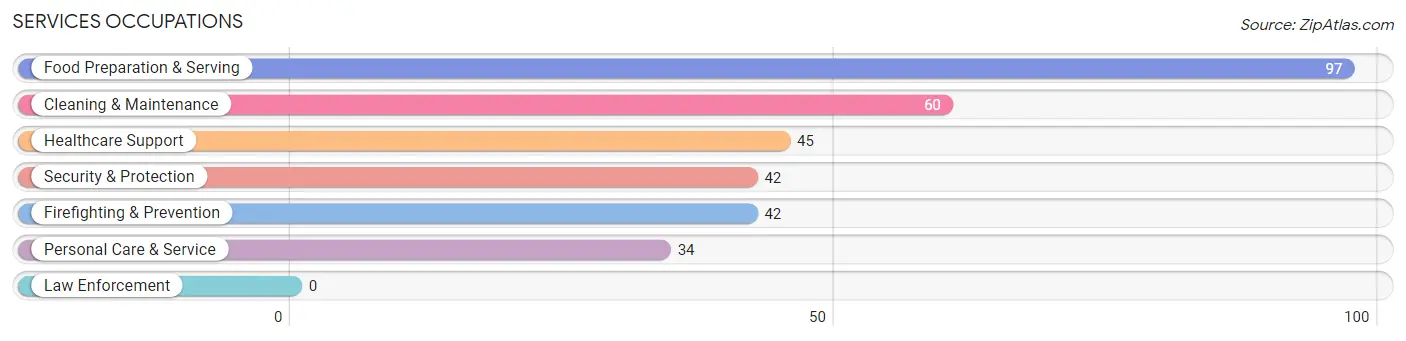
Services Occupations
The most common Services occupations in Greenhills are Food Preparation & Serving (97 | 5.4%), Cleaning & Maintenance (60 | 3.3%), Healthcare Support (45 | 2.5%), Security & Protection (42 | 2.3%), and Firefighting & Prevention (42 | 2.3%).
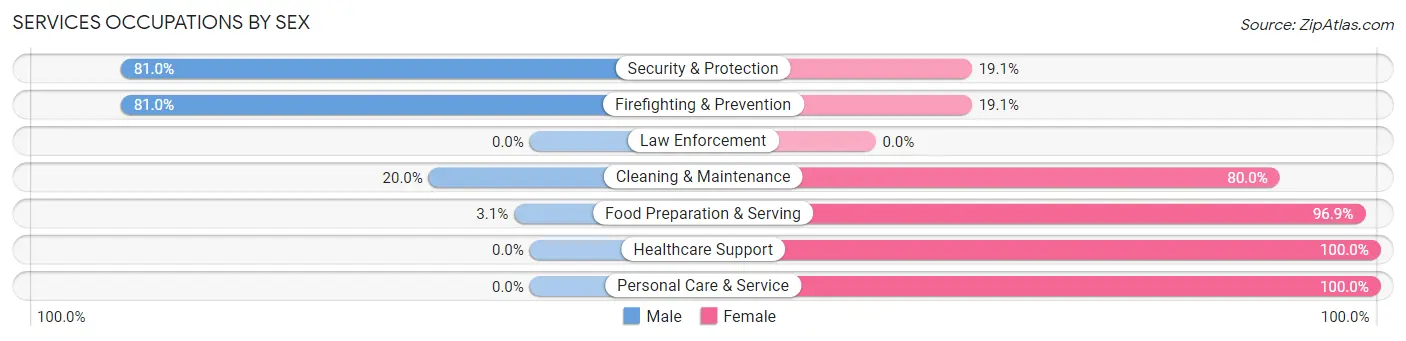
Services Occupations by Sex
Within the Services occupations in Greenhills, the most male-oriented occupations are Security & Protection (80.9%), Firefighting & Prevention (80.9%), and Cleaning & Maintenance (20.0%), while the most female-oriented occupations are Healthcare Support (100.0%), Personal Care & Service (100.0%), and Food Preparation & Serving (96.9%).
| Occupation | Male | Female |
| Healthcare Support | 0 (0.0%) | 45 (100.0%) |
| Security & Protection | 34 (80.9%) | 8 (19.1%) |
| Firefighting & Prevention | 34 (80.9%) | 8 (19.1%) |
| Law Enforcement | 0 (0.0%) | 0 (0.0%) |
| Food Preparation & Serving | 3 (3.1%) | 94 (96.9%) |
| Cleaning & Maintenance | 12 (20.0%) | 48 (80.0%) |
| Personal Care & Service | 0 (0.0%) | 34 (100.0%) |
| Total (Category) | 49 (17.6%) | 229 (82.4%) |
| Total (Overall) | 961 (53.4%) | 840 (46.6%) |
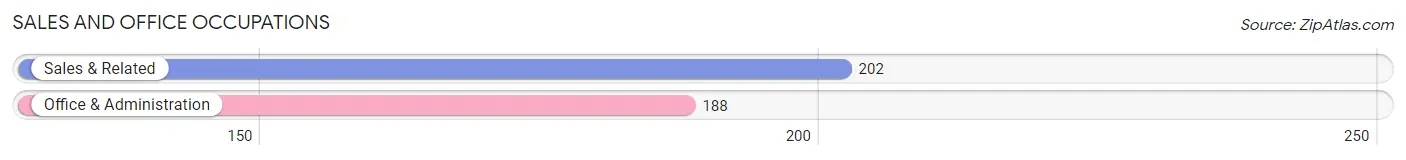
Sales and Office Occupations
The most common Sales and Office occupations in Greenhills are Sales & Related (202 | 11.2%), and Office & Administration (188 | 10.4%).
Sales and Office Occupations by Sex
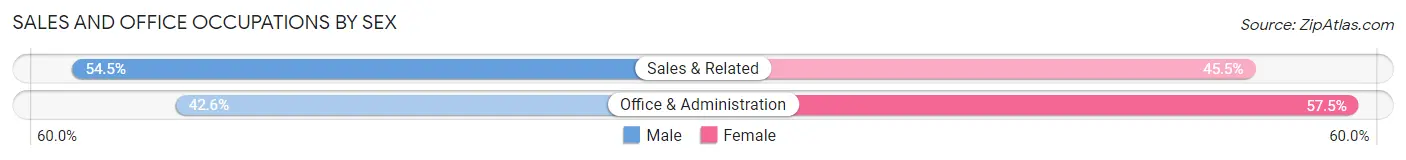
| Occupation | Male | Female |
| Sales & Related | 110 (54.5%) | 92 (45.5%) |
| Office & Administration | 80 (42.5%) | 108 (57.5%) |
| Total (Category) | 190 (48.7%) | 200 (51.3%) |
| Total (Overall) | 961 (53.4%) | 840 (46.6%) |
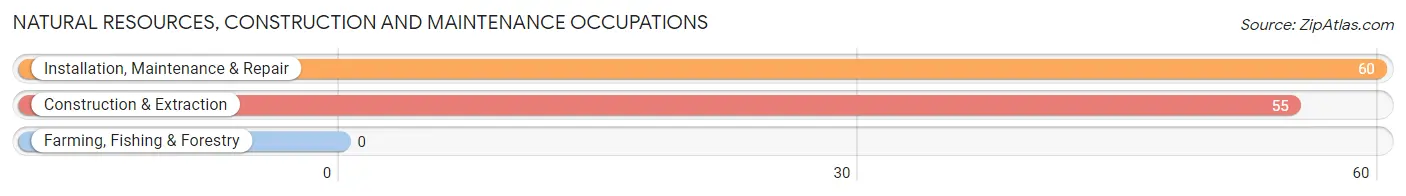
Natural Resources, Construction and Maintenance Occupations
The most common Natural Resources, Construction and Maintenance occupations in Greenhills are Installation, Maintenance & Repair (60 | 3.3%), and Construction & Extraction (55 | 3.0%).
Natural Resources, Construction and Maintenance Occupations by Sex
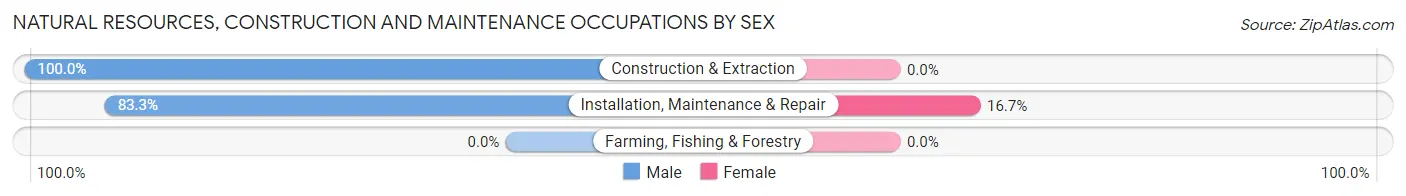
| Occupation | Male | Female |
| Farming, Fishing & Forestry | 0 (0.0%) | 0 (0.0%) |
| Construction & Extraction | 55 (100.0%) | 0 (0.0%) |
| Installation, Maintenance & Repair | 50 (83.3%) | 10 (16.7%) |
| Total (Category) | 105 (91.3%) | 10 (8.7%) |
| Total (Overall) | 961 (53.4%) | 840 (46.6%) |
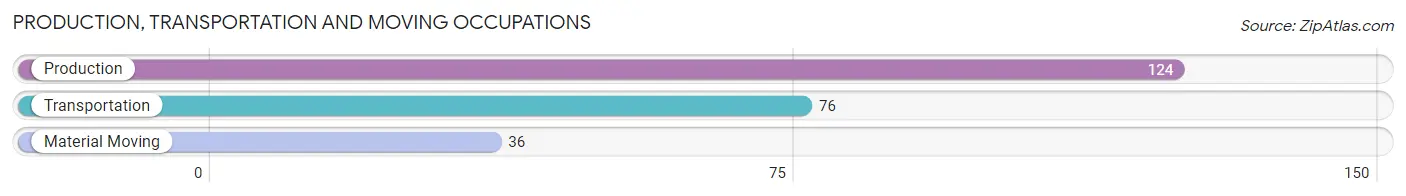
Production, Transportation and Moving Occupations
The most common Production, Transportation and Moving occupations in Greenhills are Production (124 | 6.9%), Transportation (76 | 4.2%), and Material Moving (36 | 2.0%).
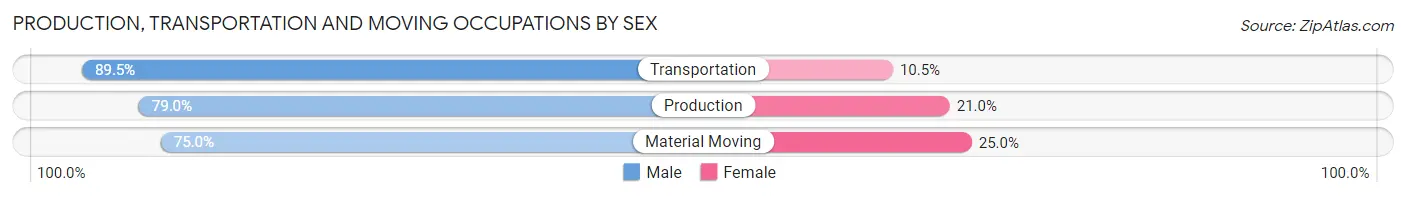
Production, Transportation and Moving Occupations by Sex
| Occupation | Male | Female |
| Production | 98 (79.0%) | 26 (21.0%) |
| Transportation | 68 (89.5%) | 8 (10.5%) |
| Material Moving | 27 (75.0%) | 9 (25.0%) |
| Total (Category) | 193 (81.8%) | 43 (18.2%) |
| Total (Overall) | 961 (53.4%) | 840 (46.6%) |
Employment Industries by Sex in Greenhills
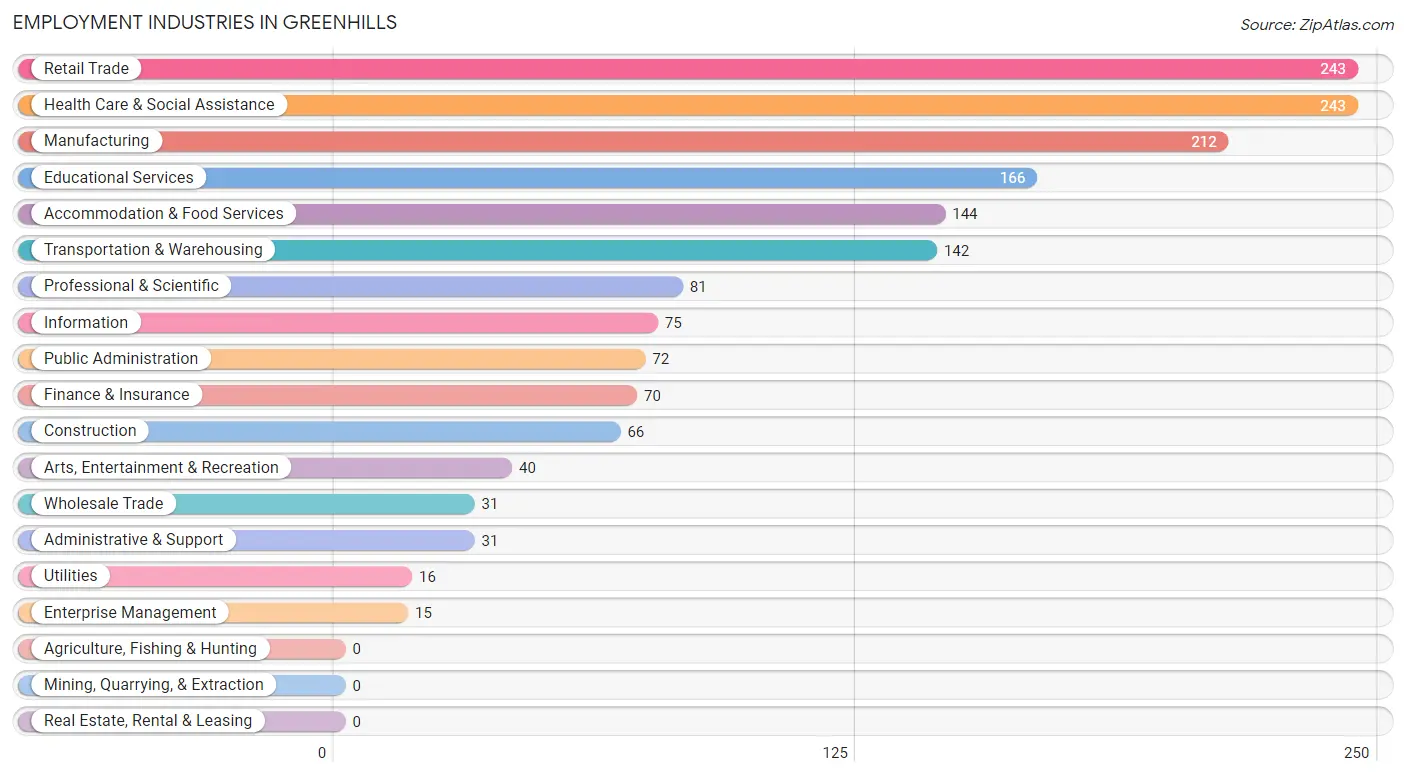
Employment Industries in Greenhills
The major employment industries in Greenhills include Retail Trade (243 | 13.5%), Health Care & Social Assistance (243 | 13.5%), Manufacturing (212 | 11.8%), Educational Services (166 | 9.2%), and Accommodation & Food Services (144 | 8.0%).
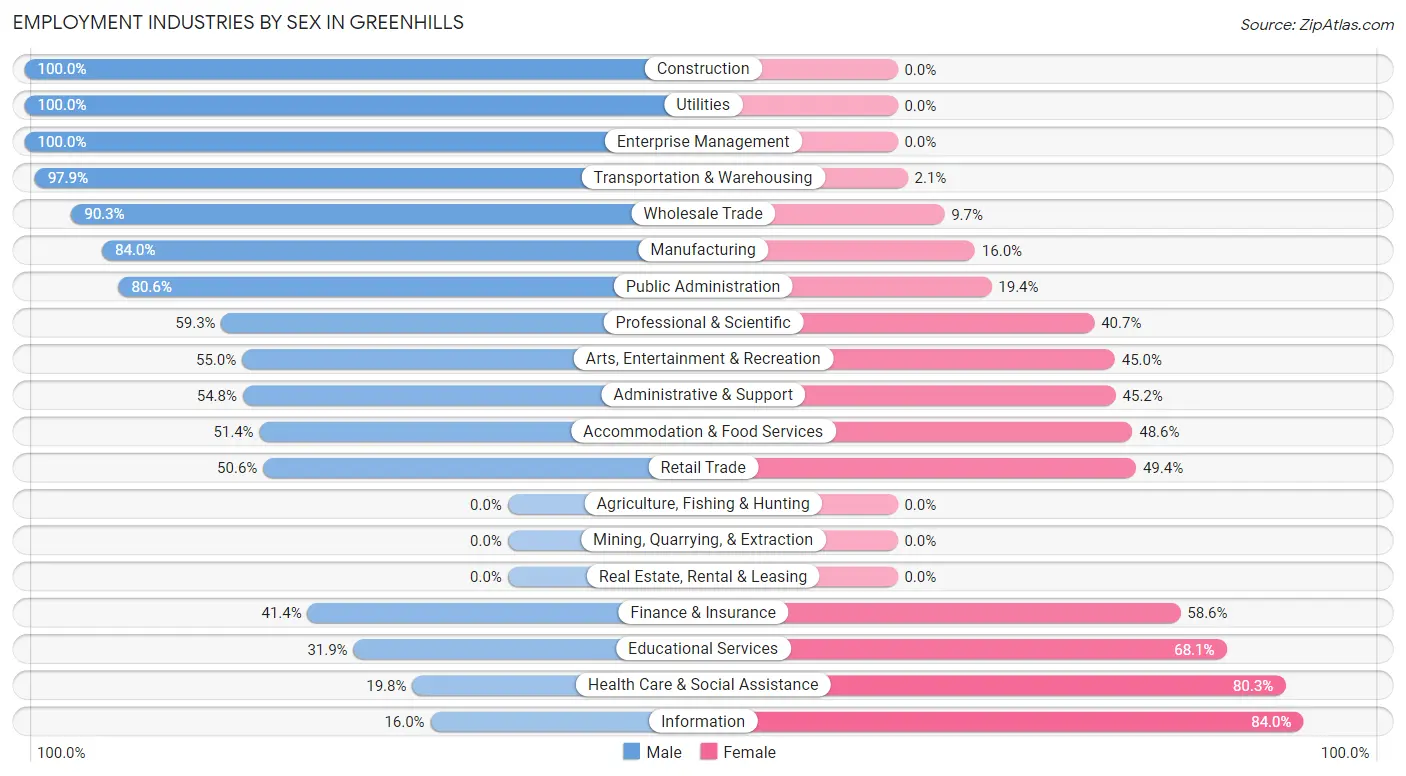
Employment Industries by Sex in Greenhills
The Greenhills industries that see more men than women are Construction (100.0%), Utilities (100.0%), and Enterprise Management (100.0%), whereas the industries that tend to have a higher number of women are Information (84.0%), Health Care & Social Assistance (80.2%), and Educational Services (68.1%).
| Industry | Male | Female |
| Agriculture, Fishing & Hunting | 0 (0.0%) | 0 (0.0%) |
| Mining, Quarrying, & Extraction | 0 (0.0%) | 0 (0.0%) |
| Construction | 66 (100.0%) | 0 (0.0%) |
| Manufacturing | 178 (84.0%) | 34 (16.0%) |
| Wholesale Trade | 28 (90.3%) | 3 (9.7%) |
| Retail Trade | 123 (50.6%) | 120 (49.4%) |
| Transportation & Warehousing | 139 (97.9%) | 3 (2.1%) |
| Utilities | 16 (100.0%) | 0 (0.0%) |
| Information | 12 (16.0%) | 63 (84.0%) |
| Finance & Insurance | 29 (41.4%) | 41 (58.6%) |
| Real Estate, Rental & Leasing | 0 (0.0%) | 0 (0.0%) |
| Professional & Scientific | 48 (59.3%) | 33 (40.7%) |
| Enterprise Management | 15 (100.0%) | 0 (0.0%) |
| Administrative & Support | 17 (54.8%) | 14 (45.2%) |
| Educational Services | 53 (31.9%) | 113 (68.1%) |
| Health Care & Social Assistance | 48 (19.8%) | 195 (80.2%) |
| Arts, Entertainment & Recreation | 22 (55.0%) | 18 (45.0%) |
| Accommodation & Food Services | 74 (51.4%) | 70 (48.6%) |
| Public Administration | 58 (80.6%) | 14 (19.4%) |
| Total | 961 (53.4%) | 840 (46.6%) |
Education in Greenhills
School Enrollment in Greenhills
The most common levels of schooling among the 942 students in Greenhills are elementary school (215 | 22.8%), middle school (199 | 21.1%), and high school (173 | 18.4%).
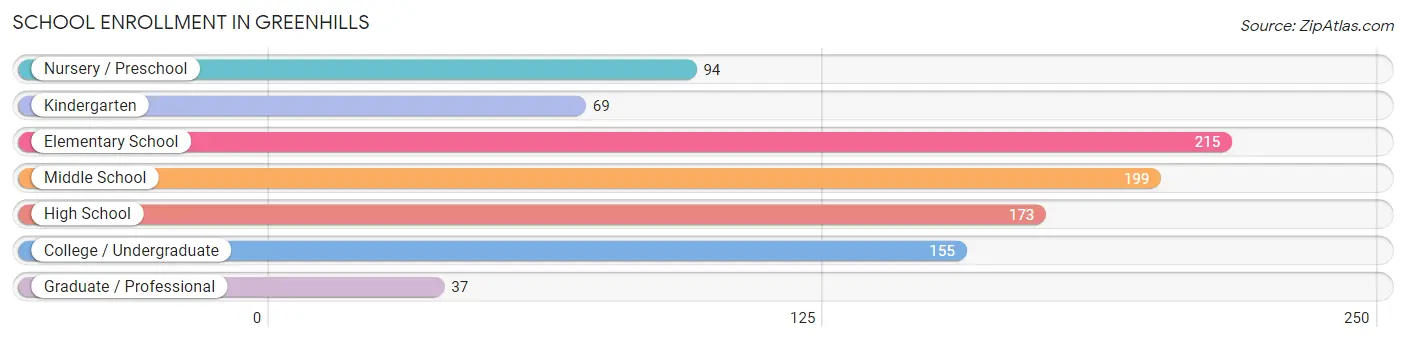
| School Level | # Students | % Students |
| Nursery / Preschool | 94 | 10.0% |
| Kindergarten | 69 | 7.3% |
| Elementary School | 215 | 22.8% |
| Middle School | 199 | 21.1% |
| High School | 173 | 18.4% |
| College / Undergraduate | 155 | 16.5% |
| Graduate / Professional | 37 | 3.9% |
| Total | 942 | 100.0% |
School Enrollment by Age by Funding Source in Greenhills
Out of a total of 942 students who are enrolled in schools in Greenhills, 361 (38.3%) attend a private institution, while the remaining 581 (61.7%) are enrolled in public schools. The age group of 3 to 4 year olds has the highest likelihood of being enrolled in private schools, with 42 (48.8% in the age bracket) enrolled. Conversely, the age group of 20 to 24 year olds has the lowest likelihood of being enrolled in a private school, with 120 (90.2% in the age bracket) attending a public institution.
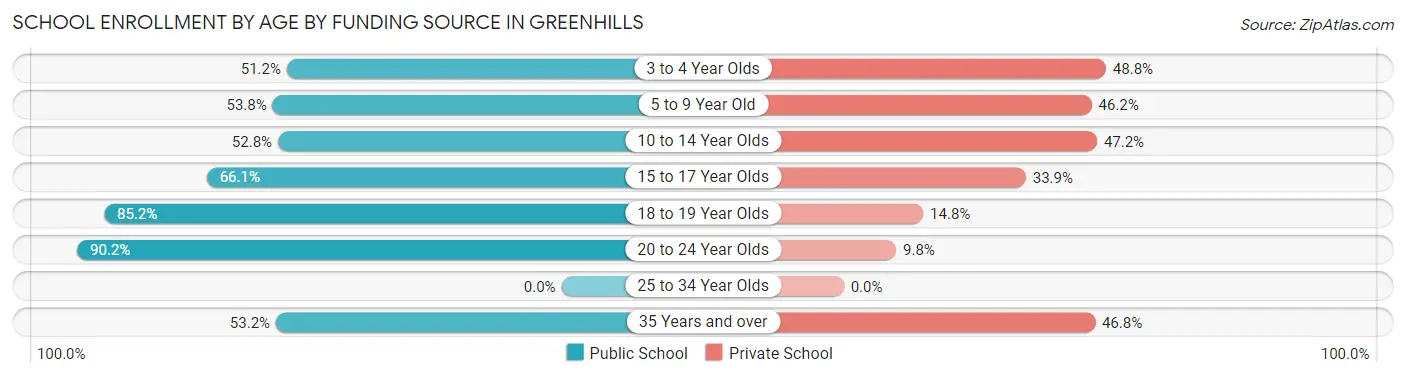
| Age Bracket | Public School | Private School |
| 3 to 4 Year Olds | 44 (51.2%) | 42 (48.8%) |
| 5 to 9 Year Old | 141 (53.8%) | 121 (46.2%) |
| 10 to 14 Year Olds | 131 (52.8%) | 117 (47.2%) |
| 15 to 17 Year Olds | 74 (66.1%) | 38 (33.9%) |
| 18 to 19 Year Olds | 46 (85.2%) | 8 (14.8%) |
| 20 to 24 Year Olds | 120 (90.2%) | 13 (9.8%) |
| 25 to 34 Year Olds | 0 (0.0%) | 0 (0.0%) |
| 35 Years and over | 25 (53.2%) | 22 (46.8%) |
| Total | 581 (61.7%) | 361 (38.3%) |
Educational Attainment by Field of Study in Greenhills
Education (147 | 20.4%), science & technology (137 | 19.0%), business (122 | 16.9%), computers & mathematics (61 | 8.5%), and engineering (45 | 6.2%) are the most common fields of study among 720 individuals in Greenhills who have obtained a bachelor's degree or higher.
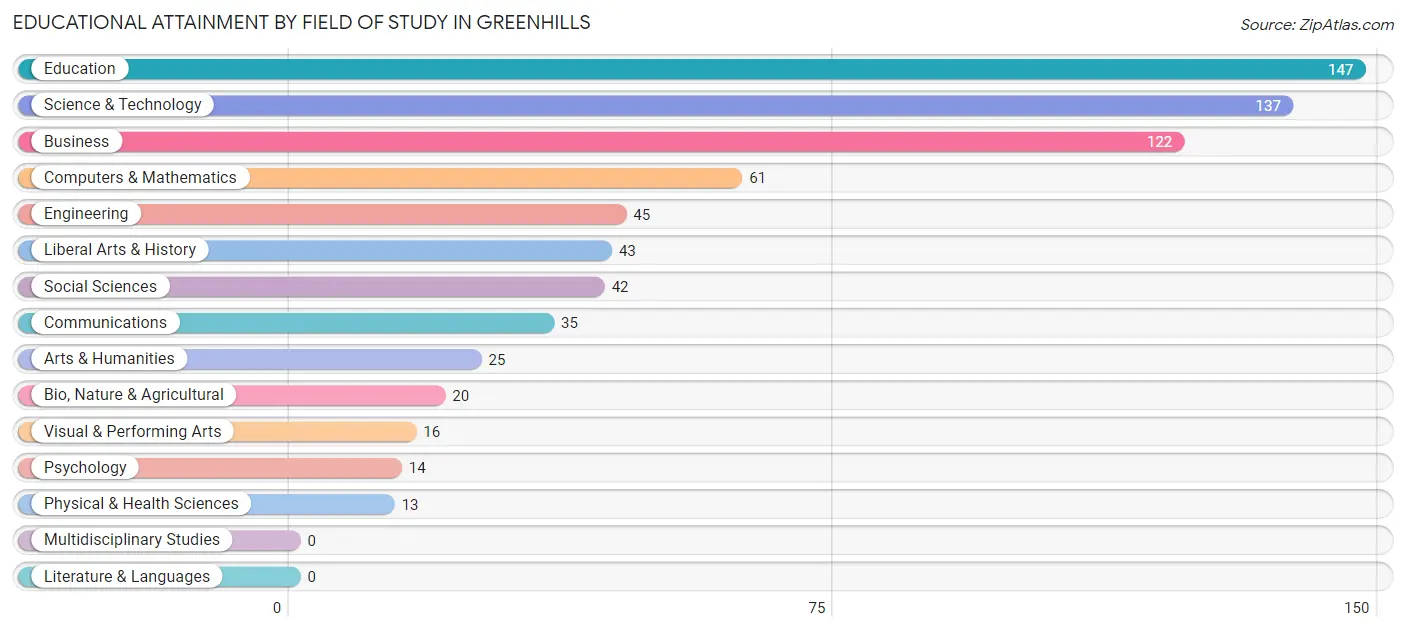
| Field of Study | # Graduates | % Graduates |
| Computers & Mathematics | 61 | 8.5% |
| Bio, Nature & Agricultural | 20 | 2.8% |
| Physical & Health Sciences | 13 | 1.8% |
| Psychology | 14 | 1.9% |
| Social Sciences | 42 | 5.8% |
| Engineering | 45 | 6.2% |
| Multidisciplinary Studies | 0 | 0.0% |
| Science & Technology | 137 | 19.0% |
| Business | 122 | 16.9% |
| Education | 147 | 20.4% |
| Literature & Languages | 0 | 0.0% |
| Liberal Arts & History | 43 | 6.0% |
| Visual & Performing Arts | 16 | 2.2% |
| Communications | 35 | 4.9% |
| Arts & Humanities | 25 | 3.5% |
| Total | 720 | 100.0% |
Transportation & Commute in Greenhills
Vehicle Availability by Sex in Greenhills
The most prevalent vehicle ownership categories in Greenhills are males with 2 vehicles (550, accounting for 58.3%) and females with 2 vehicles (384, making up 66.1%).
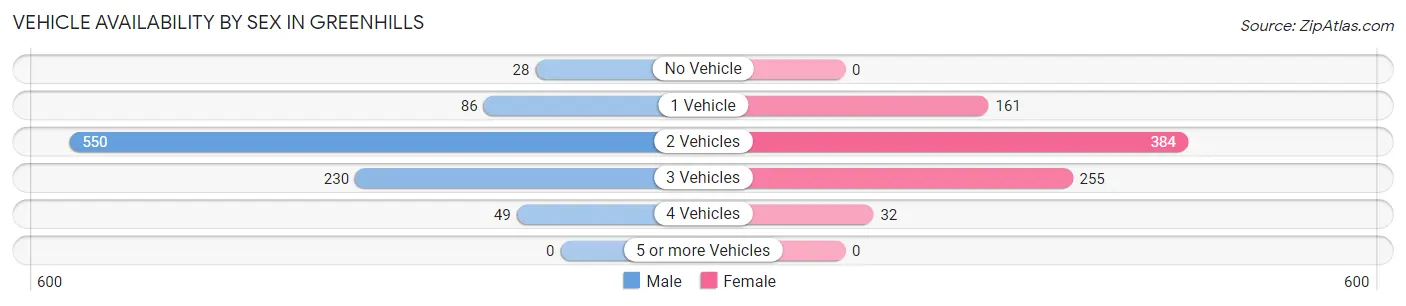
| Vehicles Available | Male | Female |
| No Vehicle | 28 (3.0%) | 0 (0.0%) |
| 1 Vehicle | 86 (9.1%) | 161 (19.4%) |
| 2 Vehicles | 550 (58.3%) | 384 (46.2%) |
| 3 Vehicles | 230 (24.4%) | 255 (30.6%) |
| 4 Vehicles | 49 (5.2%) | 32 (3.8%) |
| 5 or more Vehicles | 0 (0.0%) | 0 (0.0%) |
| Total | 943 (100.0%) | 832 (100.0%) |
Commute Time in Greenhills
The most frequently occuring commute durations in Greenhills are 30 to 34 minutes (287 commuters, 18.0%), 10 to 14 minutes (279 commuters, 17.5%), and 15 to 19 minutes (276 commuters, 17.3%).
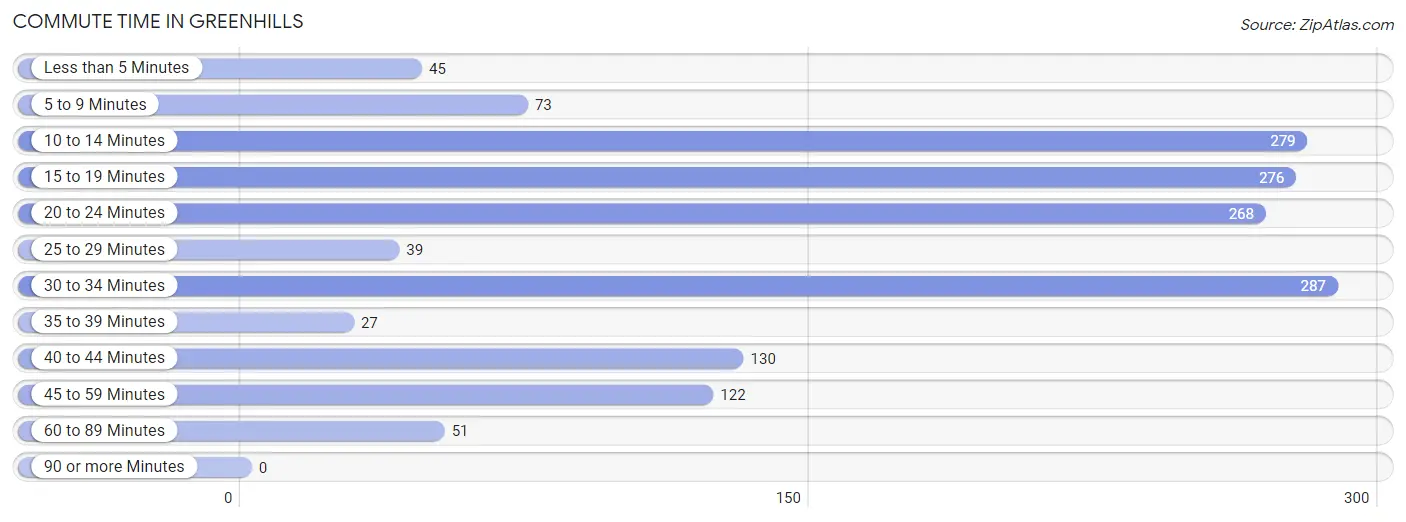
| Commute Time | # Commuters | % Commuters |
| Less than 5 Minutes | 45 | 2.8% |
| 5 to 9 Minutes | 73 | 4.6% |
| 10 to 14 Minutes | 279 | 17.5% |
| 15 to 19 Minutes | 276 | 17.3% |
| 20 to 24 Minutes | 268 | 16.8% |
| 25 to 29 Minutes | 39 | 2.4% |
| 30 to 34 Minutes | 287 | 18.0% |
| 35 to 39 Minutes | 27 | 1.7% |
| 40 to 44 Minutes | 130 | 8.1% |
| 45 to 59 Minutes | 122 | 7.6% |
| 60 to 89 Minutes | 51 | 3.2% |
| 90 or more Minutes | 0 | 0.0% |
Commute Time by Sex in Greenhills
The most common commute times in Greenhills are 20 to 24 minutes (184 commuters, 20.6%) for males and 15 to 19 minutes (181 commuters, 25.7%) for females.
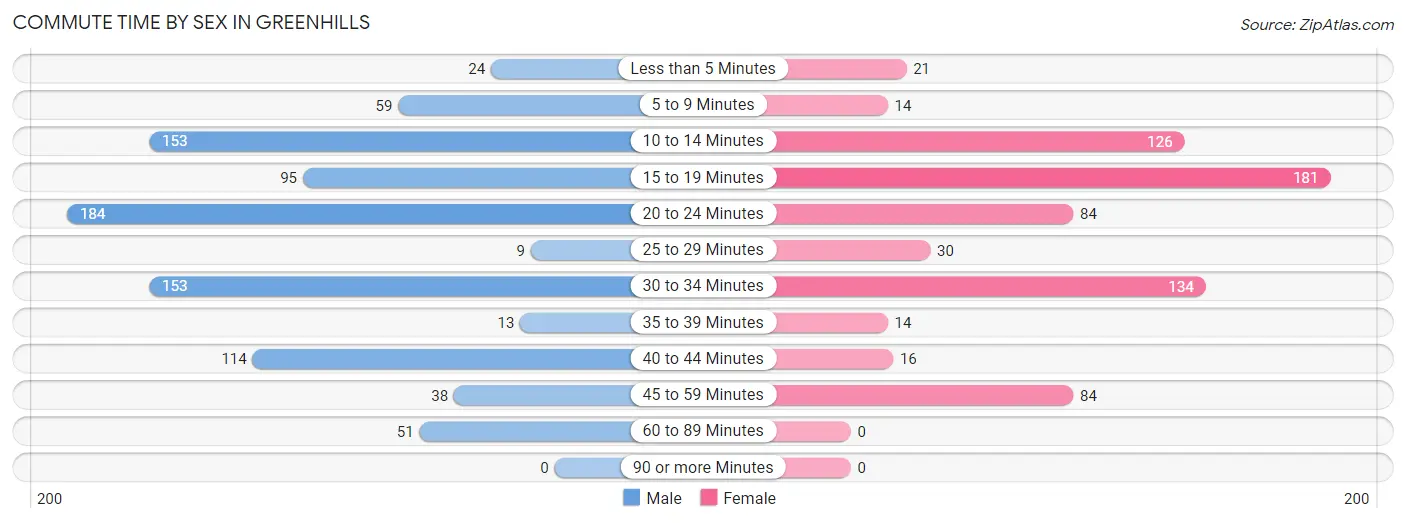
| Commute Time | Male | Female |
| Less than 5 Minutes | 24 (2.7%) | 21 (3.0%) |
| 5 to 9 Minutes | 59 (6.6%) | 14 (2.0%) |
| 10 to 14 Minutes | 153 (17.1%) | 126 (17.9%) |
| 15 to 19 Minutes | 95 (10.6%) | 181 (25.7%) |
| 20 to 24 Minutes | 184 (20.6%) | 84 (11.9%) |
| 25 to 29 Minutes | 9 (1.0%) | 30 (4.3%) |
| 30 to 34 Minutes | 153 (17.1%) | 134 (19.0%) |
| 35 to 39 Minutes | 13 (1.5%) | 14 (2.0%) |
| 40 to 44 Minutes | 114 (12.8%) | 16 (2.3%) |
| 45 to 59 Minutes | 38 (4.3%) | 84 (11.9%) |
| 60 to 89 Minutes | 51 (5.7%) | 0 (0.0%) |
| 90 or more Minutes | 0 (0.0%) | 0 (0.0%) |
Time of Departure to Work by Sex in Greenhills
The most frequent times of departure to work in Greenhills are 12:00 PM to 3:59 PM (187, 20.9%) for males and 7:00 AM to 7:29 AM (90, 12.8%) for females.
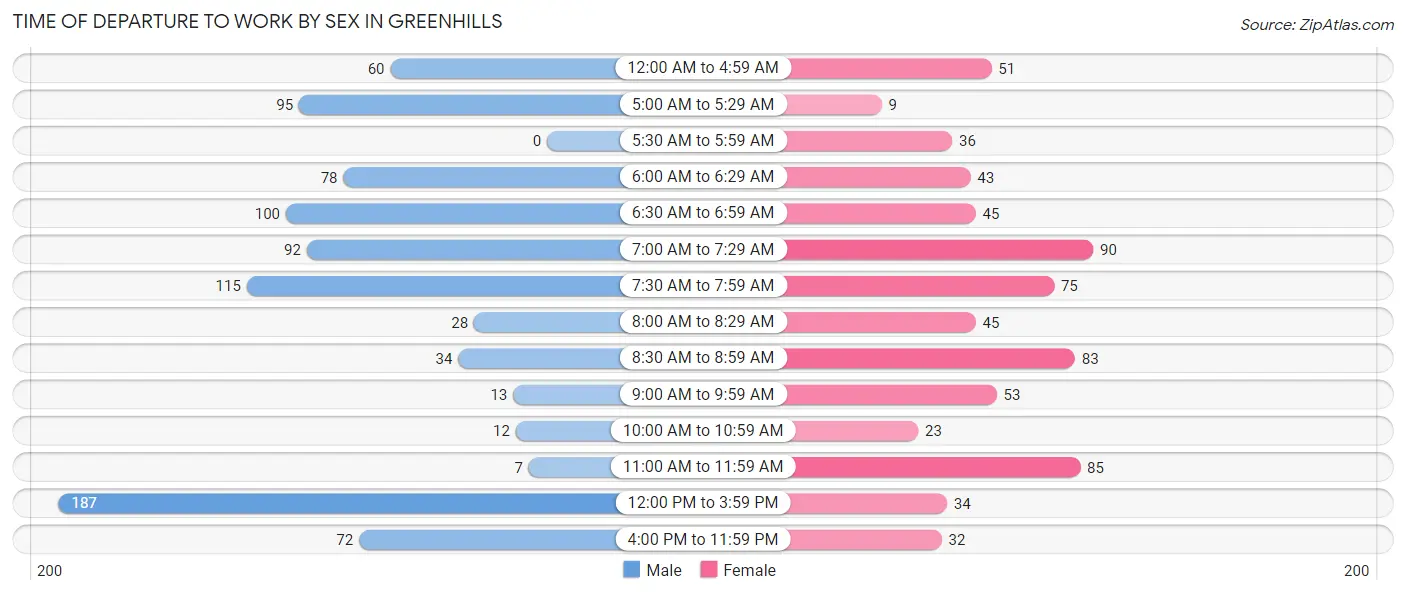
| Time of Departure | Male | Female |
| 12:00 AM to 4:59 AM | 60 (6.7%) | 51 (7.2%) |
| 5:00 AM to 5:29 AM | 95 (10.6%) | 9 (1.3%) |
| 5:30 AM to 5:59 AM | 0 (0.0%) | 36 (5.1%) |
| 6:00 AM to 6:29 AM | 78 (8.7%) | 43 (6.1%) |
| 6:30 AM to 6:59 AM | 100 (11.2%) | 45 (6.4%) |
| 7:00 AM to 7:29 AM | 92 (10.3%) | 90 (12.8%) |
| 7:30 AM to 7:59 AM | 115 (12.9%) | 75 (10.6%) |
| 8:00 AM to 8:29 AM | 28 (3.1%) | 45 (6.4%) |
| 8:30 AM to 8:59 AM | 34 (3.8%) | 83 (11.8%) |
| 9:00 AM to 9:59 AM | 13 (1.5%) | 53 (7.5%) |
| 10:00 AM to 10:59 AM | 12 (1.3%) | 23 (3.3%) |
| 11:00 AM to 11:59 AM | 7 (0.8%) | 85 (12.1%) |
| 12:00 PM to 3:59 PM | 187 (20.9%) | 34 (4.8%) |
| 4:00 PM to 11:59 PM | 72 (8.1%) | 32 (4.5%) |
| Total | 893 (100.0%) | 704 (100.0%) |
Housing Occupancy in Greenhills
Occupancy by Ownership in Greenhills
Of the total 1,491 dwellings in Greenhills, owner-occupied units account for 896 (60.1%), while renter-occupied units make up 595 (39.9%).
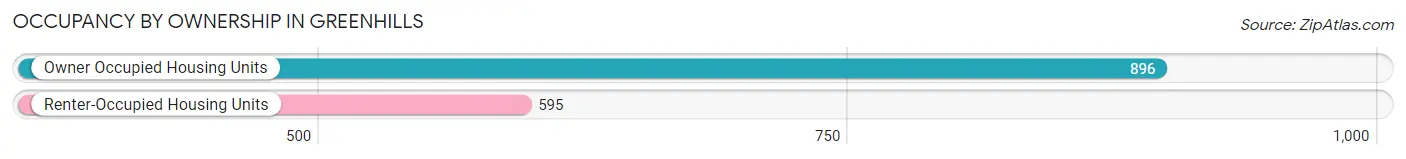
| Occupancy | # Housing Units | % Housing Units |
| Owner Occupied Housing Units | 896 | 60.1% |
| Renter-Occupied Housing Units | 595 | 39.9% |
| Total Occupied Housing Units | 1,491 | 100.0% |
Occupancy by Household Size in Greenhills
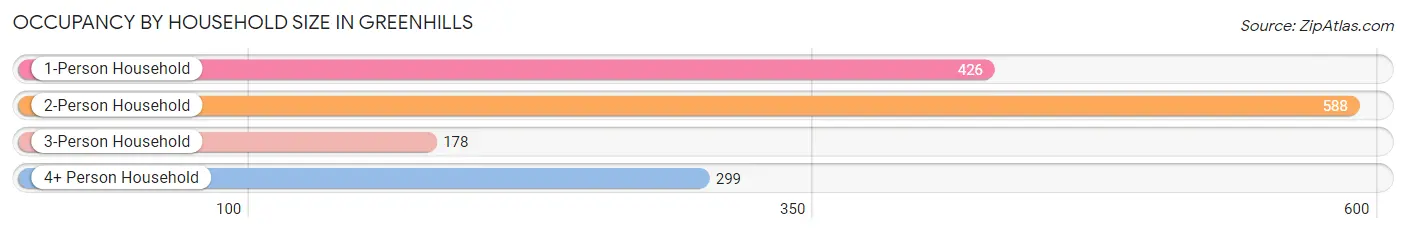
| Household Size | # Housing Units | % Housing Units |
| 1-Person Household | 426 | 28.6% |
| 2-Person Household | 588 | 39.4% |
| 3-Person Household | 178 | 11.9% |
| 4+ Person Household | 299 | 20.1% |
| Total Housing Units | 1,491 | 100.0% |
Occupancy by Ownership by Household Size in Greenhills
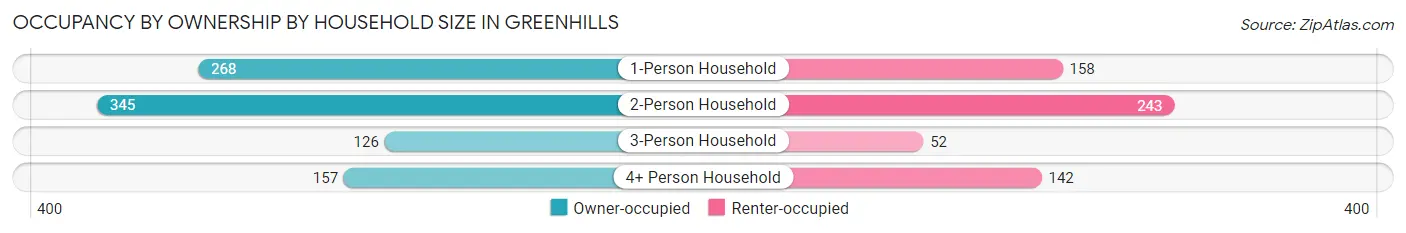
| Household Size | Owner-occupied | Renter-occupied |
| 1-Person Household | 268 (62.9%) | 158 (37.1%) |
| 2-Person Household | 345 (58.7%) | 243 (41.3%) |
| 3-Person Household | 126 (70.8%) | 52 (29.2%) |
| 4+ Person Household | 157 (52.5%) | 142 (47.5%) |
| Total Housing Units | 896 (60.1%) | 595 (39.9%) |
Occupancy by Educational Attainment in Greenhills
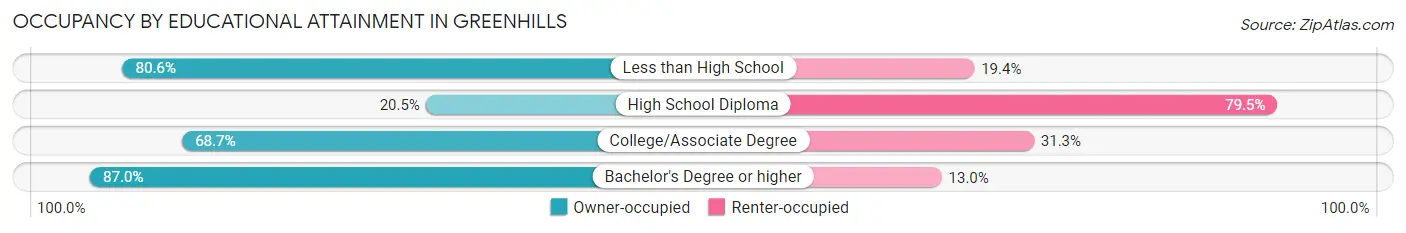
| Household Size | Owner-occupied | Renter-occupied |
| Less than High School | 29 (80.6%) | 7 (19.4%) |
| High School Diploma | 93 (20.5%) | 361 (79.5%) |
| College/Associate Degree | 365 (68.7%) | 166 (31.3%) |
| Bachelor's Degree or higher | 409 (87.0%) | 61 (13.0%) |
Occupancy by Age of Householder in Greenhills
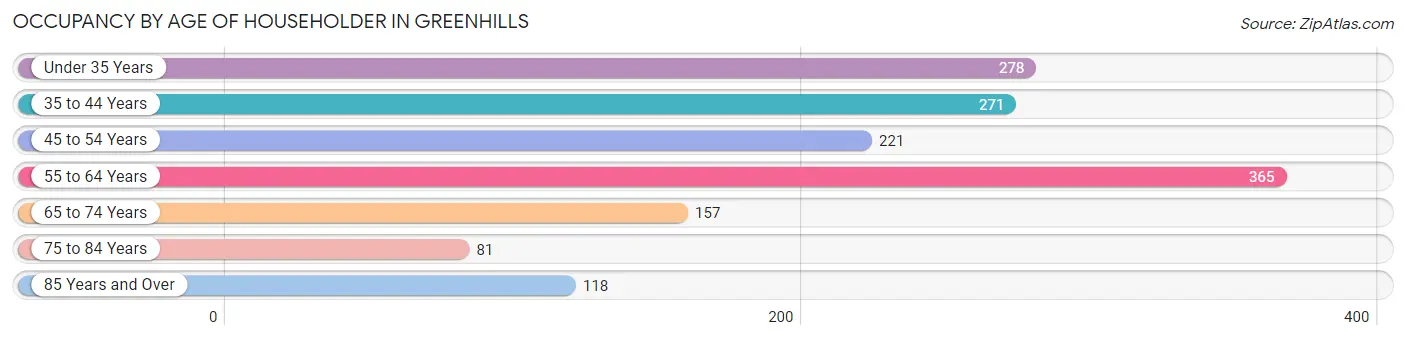
| Age Bracket | # Households | % Households |
| Under 35 Years | 278 | 18.6% |
| 35 to 44 Years | 271 | 18.2% |
| 45 to 54 Years | 221 | 14.8% |
| 55 to 64 Years | 365 | 24.5% |
| 65 to 74 Years | 157 | 10.5% |
| 75 to 84 Years | 81 | 5.4% |
| 85 Years and Over | 118 | 7.9% |
| Total | 1,491 | 100.0% |
Housing Finances in Greenhills
Median Income by Occupancy in Greenhills
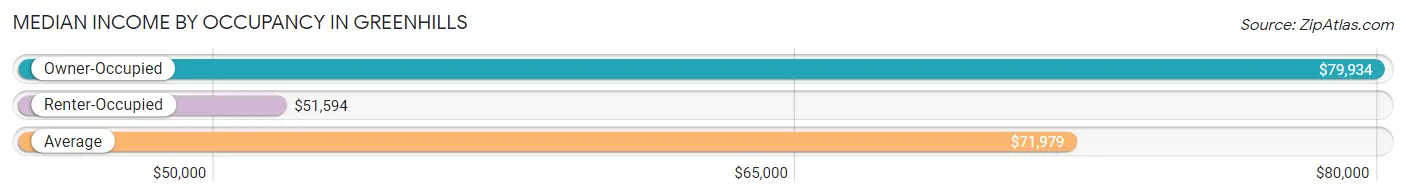
| Occupancy Type | # Households | Median Income |
| Owner-Occupied | 896 (60.1%) | $79,934 |
| Renter-Occupied | 595 (39.9%) | $51,594 |
| Average | 1,491 (100.0%) | $71,979 |
Occupancy by Householder Income Bracket in Greenhills
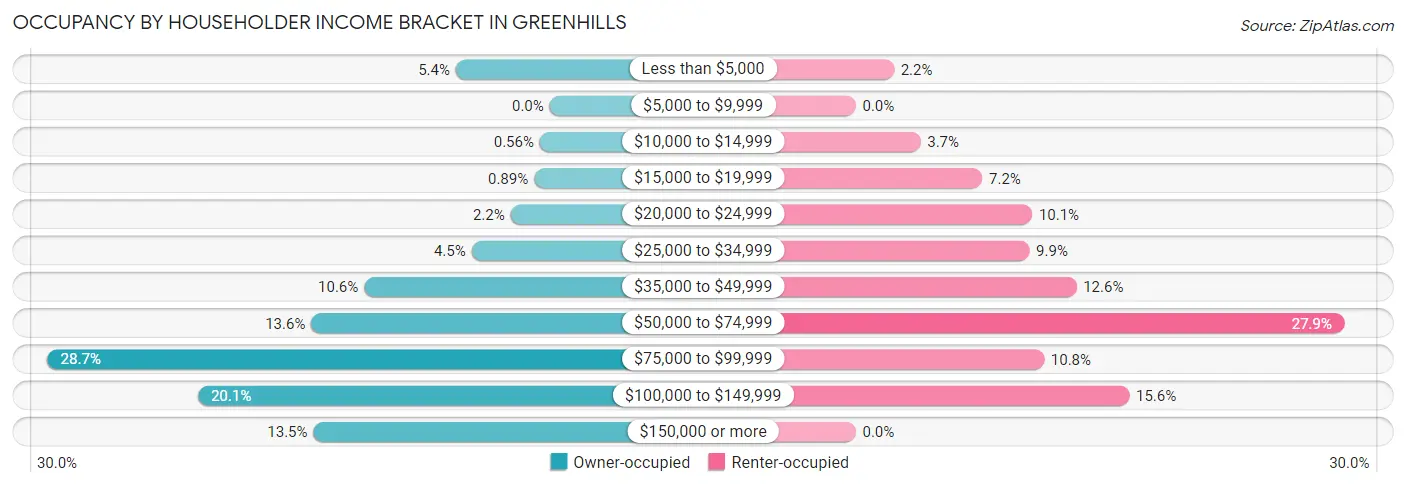
| Income Bracket | Owner-occupied | Renter-occupied |
| Less than $5,000 | 48 (5.4%) | 13 (2.2%) |
| $5,000 to $9,999 | 0 (0.0%) | 0 (0.0%) |
| $10,000 to $14,999 | 5 (0.6%) | 22 (3.7%) |
| $15,000 to $19,999 | 8 (0.9%) | 43 (7.2%) |
| $20,000 to $24,999 | 20 (2.2%) | 60 (10.1%) |
| $25,000 to $34,999 | 40 (4.5%) | 59 (9.9%) |
| $35,000 to $49,999 | 95 (10.6%) | 75 (12.6%) |
| $50,000 to $74,999 | 122 (13.6%) | 166 (27.9%) |
| $75,000 to $99,999 | 257 (28.7%) | 64 (10.8%) |
| $100,000 to $149,999 | 180 (20.1%) | 93 (15.6%) |
| $150,000 or more | 121 (13.5%) | 0 (0.0%) |
| Total | 896 (100.0%) | 595 (100.0%) |
Monthly Housing Cost Tiers in Greenhills
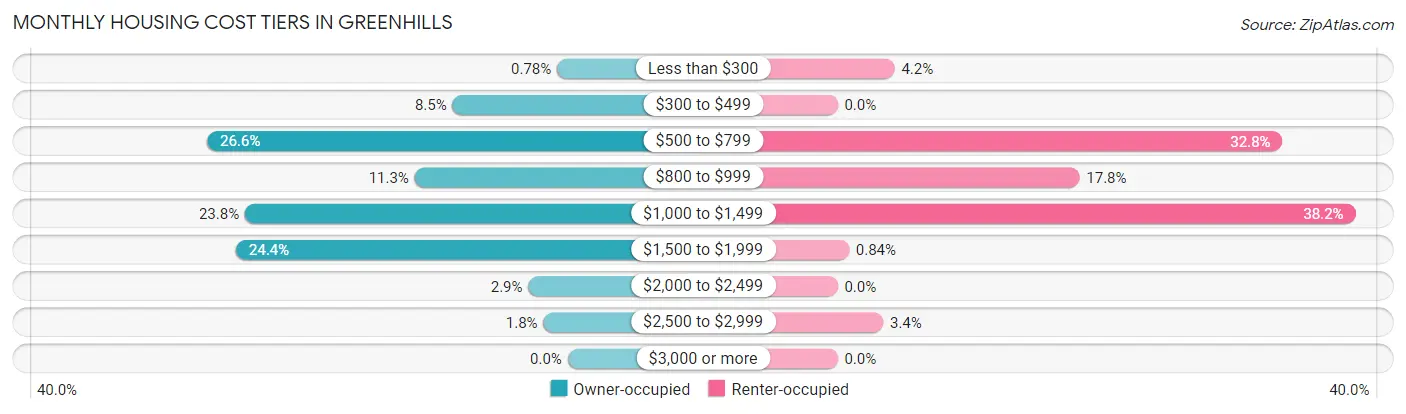
| Monthly Cost | Owner-occupied | Renter-occupied |
| Less than $300 | 7 (0.8%) | 25 (4.2%) |
| $300 to $499 | 76 (8.5%) | 0 (0.0%) |
| $500 to $799 | 238 (26.6%) | 195 (32.8%) |
| $800 to $999 | 101 (11.3%) | 106 (17.8%) |
| $1,000 to $1,499 | 213 (23.8%) | 227 (38.2%) |
| $1,500 to $1,999 | 219 (24.4%) | 5 (0.8%) |
| $2,000 to $2,499 | 26 (2.9%) | 0 (0.0%) |
| $2,500 to $2,999 | 16 (1.8%) | 20 (3.4%) |
| $3,000 or more | 0 (0.0%) | 0 (0.0%) |
| Total | 896 (100.0%) | 595 (100.0%) |
Physical Housing Characteristics in Greenhills
Housing Structures in Greenhills
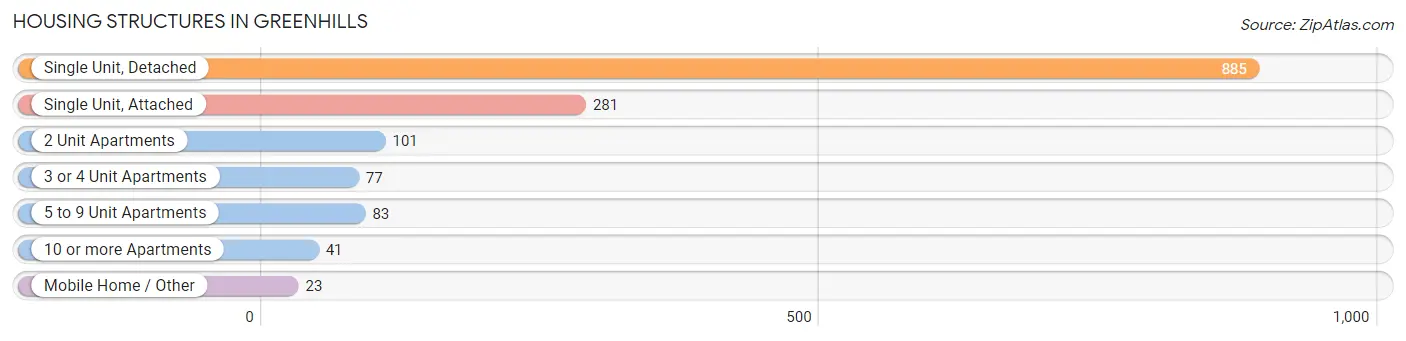
| Structure Type | # Housing Units | % Housing Units |
| Single Unit, Detached | 885 | 59.4% |
| Single Unit, Attached | 281 | 18.9% |
| 2 Unit Apartments | 101 | 6.8% |
| 3 or 4 Unit Apartments | 77 | 5.2% |
| 5 to 9 Unit Apartments | 83 | 5.6% |
| 10 or more Apartments | 41 | 2.8% |
| Mobile Home / Other | 23 | 1.5% |
| Total | 1,491 | 100.0% |
Housing Structures by Occupancy in Greenhills
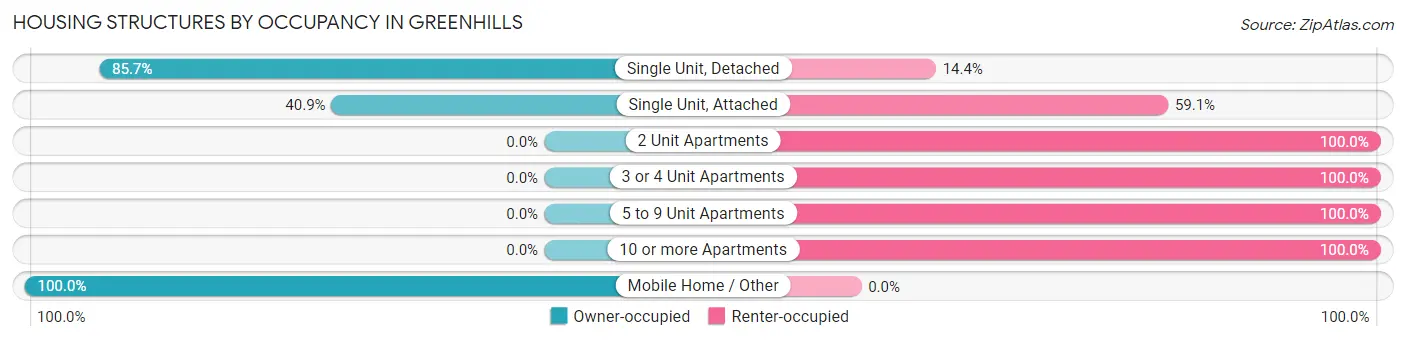
| Structure Type | Owner-occupied | Renter-occupied |
| Single Unit, Detached | 758 (85.7%) | 127 (14.3%) |
| Single Unit, Attached | 115 (40.9%) | 166 (59.1%) |
| 2 Unit Apartments | 0 (0.0%) | 101 (100.0%) |
| 3 or 4 Unit Apartments | 0 (0.0%) | 77 (100.0%) |
| 5 to 9 Unit Apartments | 0 (0.0%) | 83 (100.0%) |
| 10 or more Apartments | 0 (0.0%) | 41 (100.0%) |
| Mobile Home / Other | 23 (100.0%) | 0 (0.0%) |
| Total | 896 (60.1%) | 595 (39.9%) |
Housing Structures by Number of Rooms in Greenhills
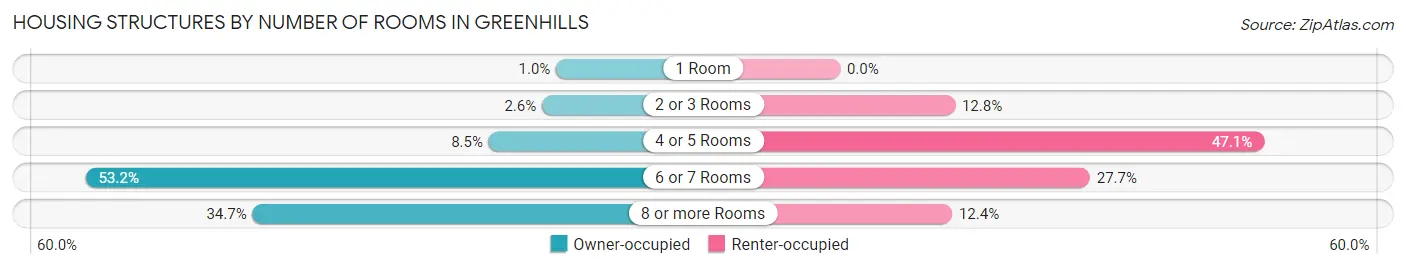
| Number of Rooms | Owner-occupied | Renter-occupied |
| 1 Room | 9 (1.0%) | 0 (0.0%) |
| 2 or 3 Rooms | 23 (2.6%) | 76 (12.8%) |
| 4 or 5 Rooms | 76 (8.5%) | 280 (47.1%) |
| 6 or 7 Rooms | 477 (53.2%) | 165 (27.7%) |
| 8 or more Rooms | 311 (34.7%) | 74 (12.4%) |
| Total | 896 (100.0%) | 595 (100.0%) |
Housing Structure by Heating Type in Greenhills
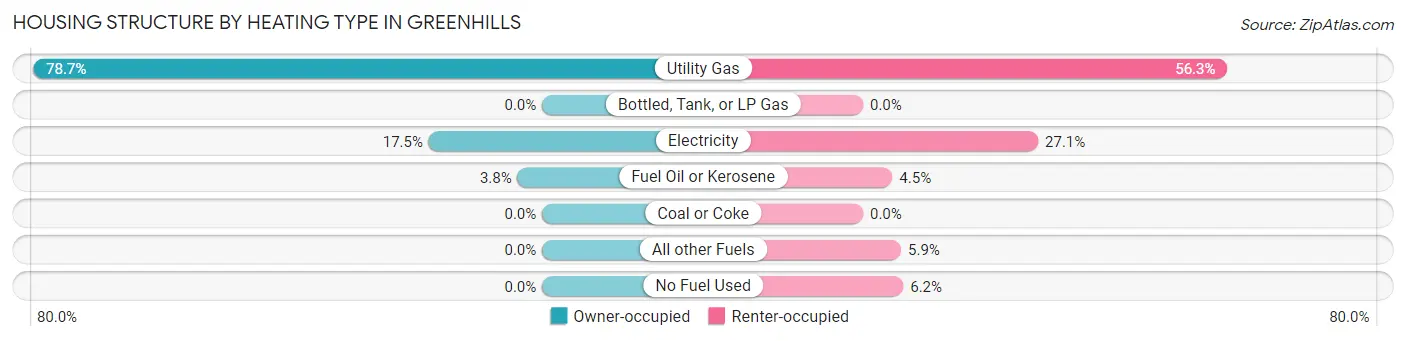
| Heating Type | Owner-occupied | Renter-occupied |
| Utility Gas | 705 (78.7%) | 335 (56.3%) |
| Bottled, Tank, or LP Gas | 0 (0.0%) | 0 (0.0%) |
| Electricity | 157 (17.5%) | 161 (27.1%) |
| Fuel Oil or Kerosene | 34 (3.8%) | 27 (4.5%) |
| Coal or Coke | 0 (0.0%) | 0 (0.0%) |
| All other Fuels | 0 (0.0%) | 35 (5.9%) |
| No Fuel Used | 0 (0.0%) | 37 (6.2%) |
| Total | 896 (100.0%) | 595 (100.0%) |
Household Vehicle Usage in Greenhills
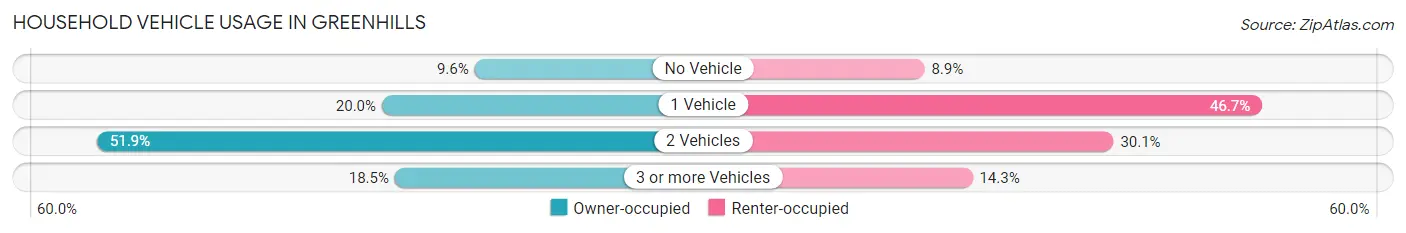
| Vehicles per Household | Owner-occupied | Renter-occupied |
| No Vehicle | 86 (9.6%) | 53 (8.9%) |
| 1 Vehicle | 179 (20.0%) | 278 (46.7%) |
| 2 Vehicles | 465 (51.9%) | 179 (30.1%) |
| 3 or more Vehicles | 166 (18.5%) | 85 (14.3%) |
| Total | 896 (100.0%) | 595 (100.0%) |
Real Estate & Mortgages in Greenhills
Real Estate and Mortgage Overview in Greenhills
| Characteristic | Without Mortgage | With Mortgage |
| Housing Units | 352 | 544 |
| Median Property Value | $140,400 | $158,400 |
| Median Household Income | $71,705 | $95 |
| Monthly Housing Costs | $629 | $0 |
| Real Estate Taxes | $3,463 | $16 |
Property Value by Mortgage Status in Greenhills
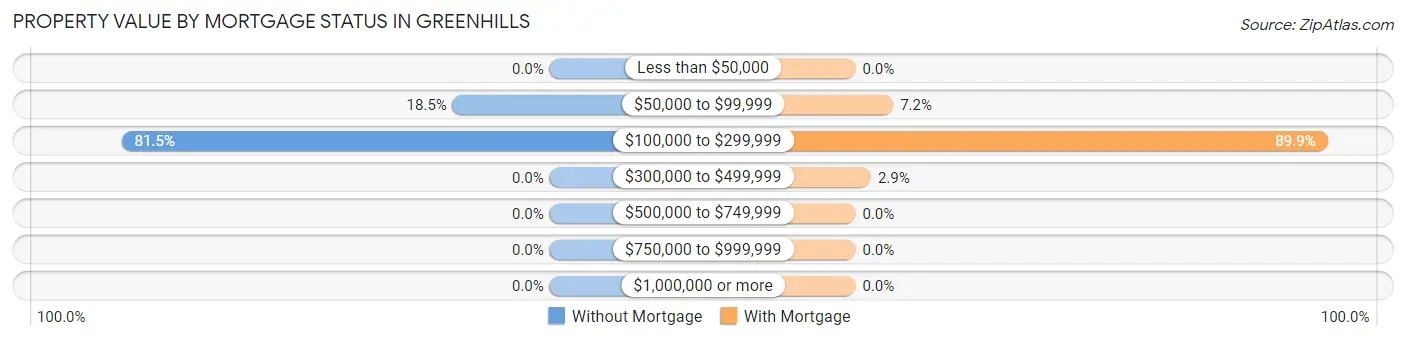
| Property Value | Without Mortgage | With Mortgage |
| Less than $50,000 | 0 (0.0%) | 0 (0.0%) |
| $50,000 to $99,999 | 65 (18.5%) | 39 (7.2%) |
| $100,000 to $299,999 | 287 (81.5%) | 489 (89.9%) |
| $300,000 to $499,999 | 0 (0.0%) | 16 (2.9%) |
| $500,000 to $749,999 | 0 (0.0%) | 0 (0.0%) |
| $750,000 to $999,999 | 0 (0.0%) | 0 (0.0%) |
| $1,000,000 or more | 0 (0.0%) | 0 (0.0%) |
| Total | 352 (100.0%) | 544 (100.0%) |
Household Income by Mortgage Status in Greenhills
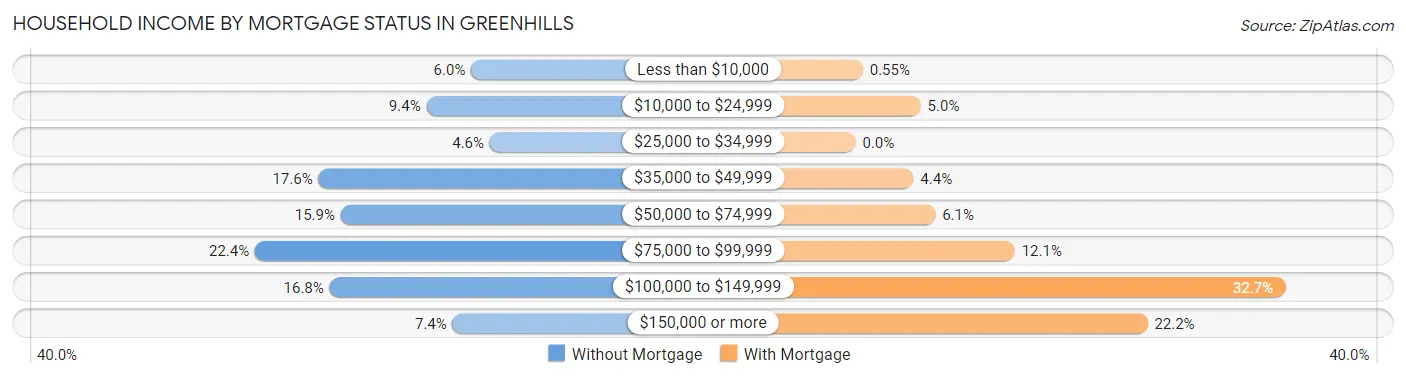
| Household Income | Without Mortgage | With Mortgage |
| Less than $10,000 | 21 (6.0%) | 3 (0.5%) |
| $10,000 to $24,999 | 33 (9.4%) | 27 (5.0%) |
| $25,000 to $34,999 | 16 (4.5%) | 0 (0.0%) |
| $35,000 to $49,999 | 62 (17.6%) | 24 (4.4%) |
| $50,000 to $74,999 | 56 (15.9%) | 33 (6.1%) |
| $75,000 to $99,999 | 79 (22.4%) | 66 (12.1%) |
| $100,000 to $149,999 | 59 (16.8%) | 178 (32.7%) |
| $150,000 or more | 26 (7.4%) | 121 (22.2%) |
| Total | 352 (100.0%) | 544 (100.0%) |
Property Value to Household Income Ratio in Greenhills
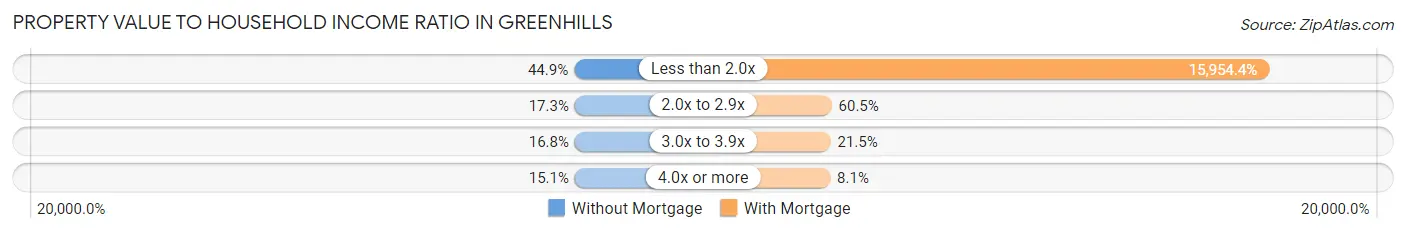
| Value-to-Income Ratio | Without Mortgage | With Mortgage |
| Less than 2.0x | 158 (44.9%) | 86,792 (15,954.4%) |
| 2.0x to 2.9x | 61 (17.3%) | 329 (60.5%) |
| 3.0x to 3.9x | 59 (16.8%) | 117 (21.5%) |
| 4.0x or more | 53 (15.1%) | 44 (8.1%) |
| Total | 352 (100.0%) | 544 (100.0%) |
Real Estate Taxes by Mortgage Status in Greenhills
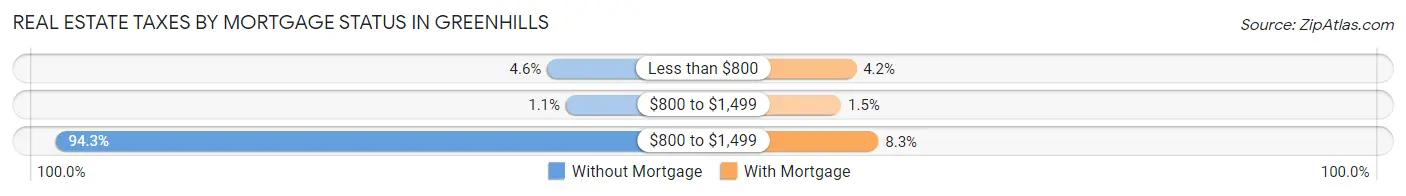
| Property Taxes | Without Mortgage | With Mortgage |
| Less than $800 | 16 (4.5%) | 23 (4.2%) |
| $800 to $1,499 | 4 (1.1%) | 8 (1.5%) |
| $800 to $1,499 | 332 (94.3%) | 45 (8.3%) |
| Total | 352 (100.0%) | 544 (100.0%) |
Health & Disability in Greenhills
Health Insurance Coverage by Age in Greenhills
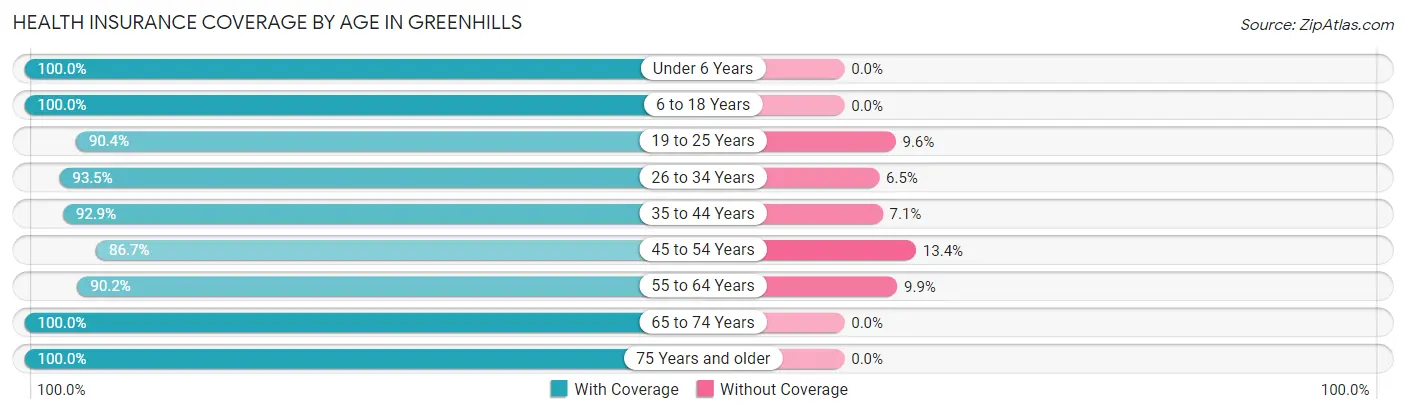
| Age Bracket | With Coverage | Without Coverage |
| Under 6 Years | 294 (100.0%) | 0 (0.0%) |
| 6 to 18 Years | 651 (100.0%) | 0 (0.0%) |
| 19 to 25 Years | 265 (90.4%) | 28 (9.6%) |
| 26 to 34 Years | 418 (93.5%) | 29 (6.5%) |
| 35 to 44 Years | 494 (92.9%) | 38 (7.1%) |
| 45 to 54 Years | 305 (86.7%) | 47 (13.4%) |
| 55 to 64 Years | 476 (90.1%) | 52 (9.9%) |
| 65 to 74 Years | 271 (100.0%) | 0 (0.0%) |
| 75 Years and older | 266 (100.0%) | 0 (0.0%) |
| Total | 3,440 (94.7%) | 194 (5.3%) |
Health Insurance Coverage by Citizenship Status in Greenhills
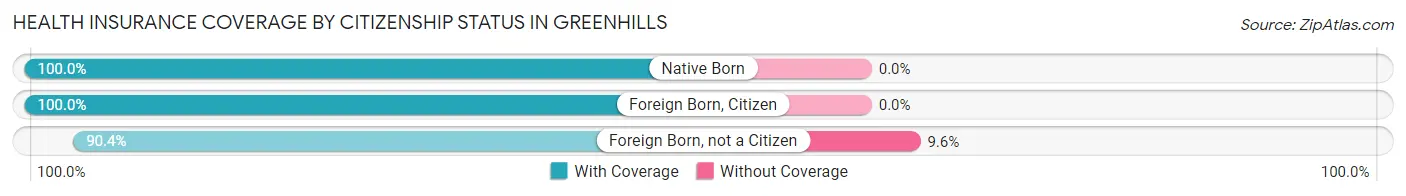
| Citizenship Status | With Coverage | Without Coverage |
| Native Born | 294 (100.0%) | 0 (0.0%) |
| Foreign Born, Citizen | 651 (100.0%) | 0 (0.0%) |
| Foreign Born, not a Citizen | 265 (90.4%) | 28 (9.6%) |
Health Insurance Coverage by Household Income in Greenhills
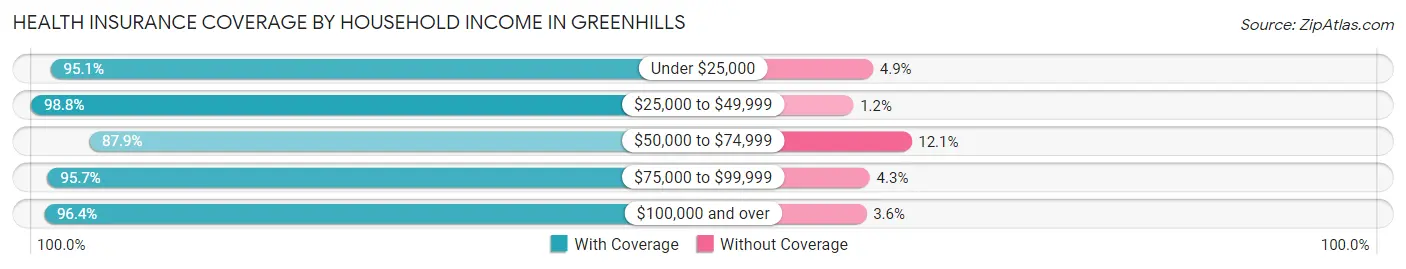
| Household Income | With Coverage | Without Coverage |
| Under $25,000 | 351 (95.1%) | 18 (4.9%) |
| $25,000 to $49,999 | 488 (98.8%) | 6 (1.2%) |
| $50,000 to $74,999 | 633 (87.9%) | 87 (12.1%) |
| $75,000 to $99,999 | 873 (95.7%) | 39 (4.3%) |
| $100,000 and over | 1,088 (96.4%) | 41 (3.6%) |
Public vs Private Health Insurance Coverage by Age in Greenhills
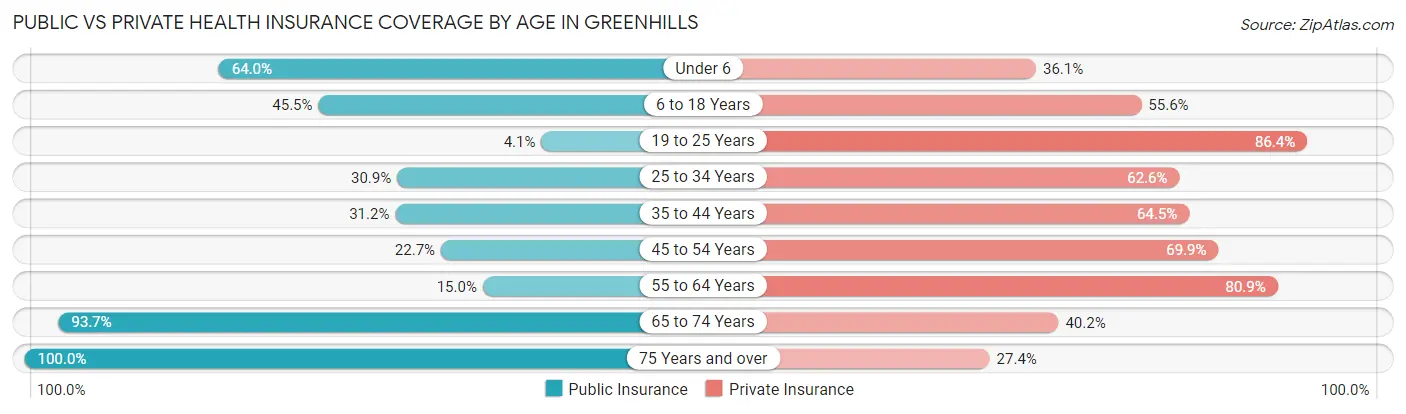
| Age Bracket | Public Insurance | Private Insurance |
| Under 6 | 188 (63.9%) | 106 (36.0%) |
| 6 to 18 Years | 296 (45.5%) | 362 (55.6%) |
| 19 to 25 Years | 12 (4.1%) | 253 (86.4%) |
| 25 to 34 Years | 138 (30.9%) | 280 (62.6%) |
| 35 to 44 Years | 166 (31.2%) | 343 (64.5%) |
| 45 to 54 Years | 80 (22.7%) | 246 (69.9%) |
| 55 to 64 Years | 79 (15.0%) | 427 (80.9%) |
| 65 to 74 Years | 254 (93.7%) | 109 (40.2%) |
| 75 Years and over | 266 (100.0%) | 73 (27.4%) |
| Total | 1,479 (40.7%) | 2,199 (60.5%) |
Disability Status by Sex by Age in Greenhills
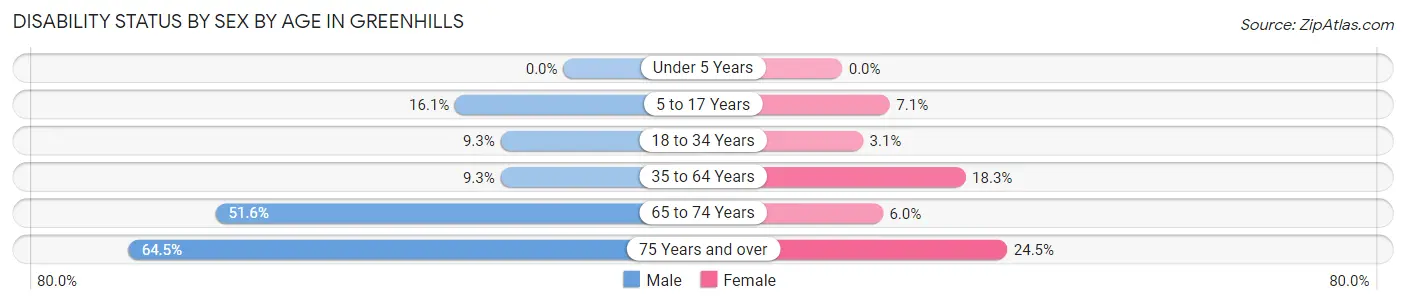
| Age Bracket | Male | Female |
| Under 5 Years | 0 (0.0%) | 0 (0.0%) |
| 5 to 17 Years | 58 (16.1%) | 22 (7.1%) |
| 18 to 34 Years | 43 (9.3%) | 10 (3.1%) |
| 35 to 64 Years | 66 (9.3%) | 129 (18.3%) |
| 65 to 74 Years | 63 (51.6%) | 9 (6.0%) |
| 75 Years and over | 40 (64.5%) | 50 (24.5%) |
Disability Class by Sex by Age in Greenhills
Disability Class: Hearing Difficulty
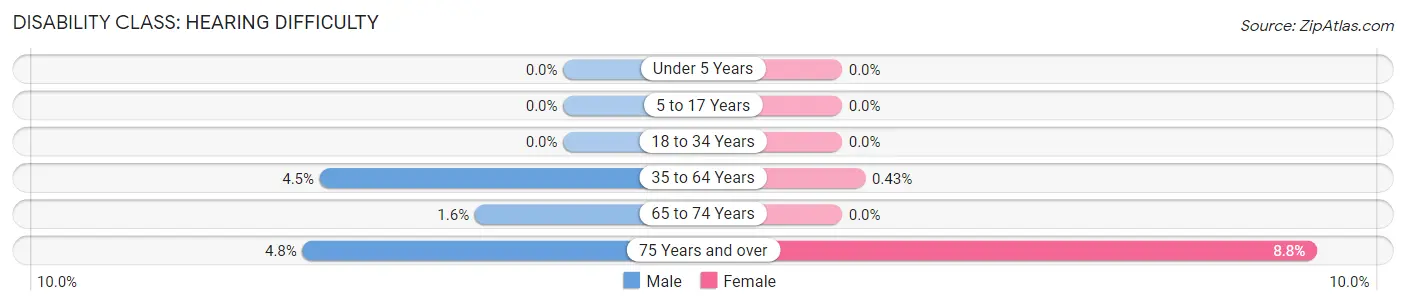
| Age Bracket | Male | Female |
| Under 5 Years | 0 (0.0%) | 0 (0.0%) |
| 5 to 17 Years | 0 (0.0%) | 0 (0.0%) |
| 18 to 34 Years | 0 (0.0%) | 0 (0.0%) |
| 35 to 64 Years | 32 (4.5%) | 3 (0.4%) |
| 65 to 74 Years | 2 (1.6%) | 0 (0.0%) |
| 75 Years and over | 3 (4.8%) | 18 (8.8%) |
Disability Class: Vision Difficulty
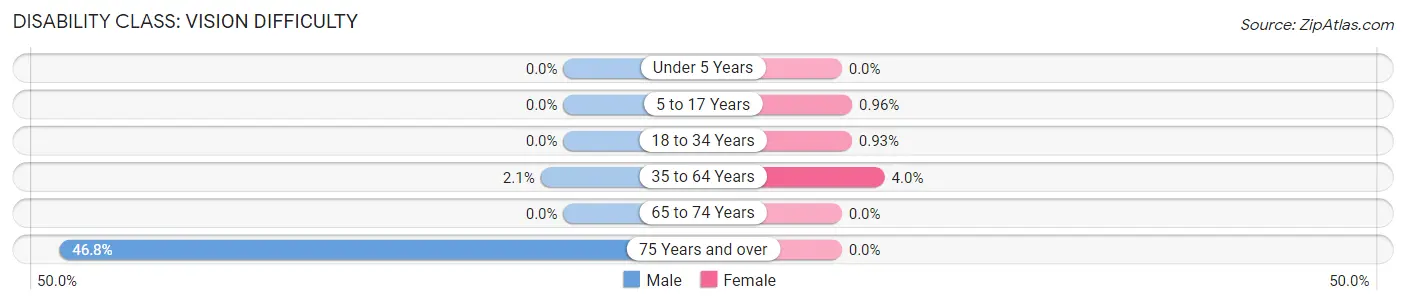
| Age Bracket | Male | Female |
| Under 5 Years | 0 (0.0%) | 0 (0.0%) |
| 5 to 17 Years | 0 (0.0%) | 3 (1.0%) |
| 18 to 34 Years | 0 (0.0%) | 3 (0.9%) |
| 35 to 64 Years | 15 (2.1%) | 28 (4.0%) |
| 65 to 74 Years | 0 (0.0%) | 0 (0.0%) |
| 75 Years and over | 29 (46.8%) | 0 (0.0%) |
Disability Class: Cognitive Difficulty
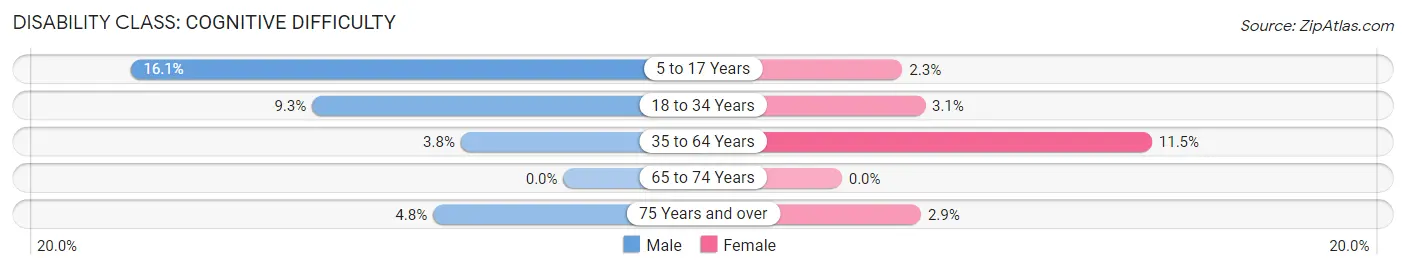
| Age Bracket | Male | Female |
| 5 to 17 Years | 58 (16.1%) | 7 (2.2%) |
| 18 to 34 Years | 43 (9.3%) | 10 (3.1%) |
| 35 to 64 Years | 27 (3.8%) | 81 (11.5%) |
| 65 to 74 Years | 0 (0.0%) | 0 (0.0%) |
| 75 Years and over | 3 (4.8%) | 6 (2.9%) |
Disability Class: Ambulatory Difficulty
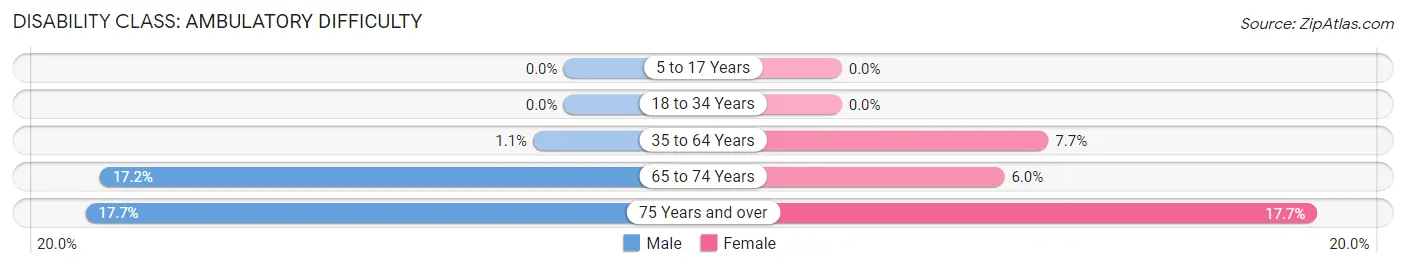
| Age Bracket | Male | Female |
| 5 to 17 Years | 0 (0.0%) | 0 (0.0%) |
| 18 to 34 Years | 0 (0.0%) | 0 (0.0%) |
| 35 to 64 Years | 8 (1.1%) | 54 (7.7%) |
| 65 to 74 Years | 21 (17.2%) | 9 (6.0%) |
| 75 Years and over | 11 (17.7%) | 36 (17.6%) |
Disability Class: Self-Care Difficulty
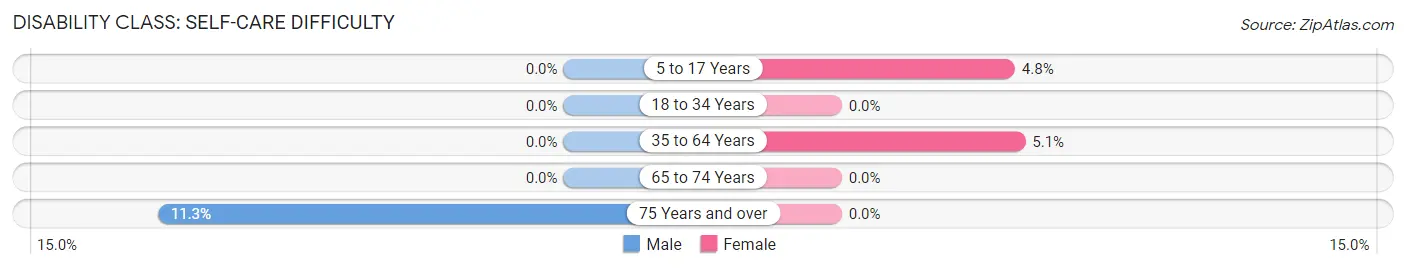
| Age Bracket | Male | Female |
| 5 to 17 Years | 0 (0.0%) | 15 (4.8%) |
| 18 to 34 Years | 0 (0.0%) | 0 (0.0%) |
| 35 to 64 Years | 0 (0.0%) | 36 (5.1%) |
| 65 to 74 Years | 0 (0.0%) | 0 (0.0%) |
| 75 Years and over | 7 (11.3%) | 0 (0.0%) |
Technology Access in Greenhills
Computing Device Access in Greenhills
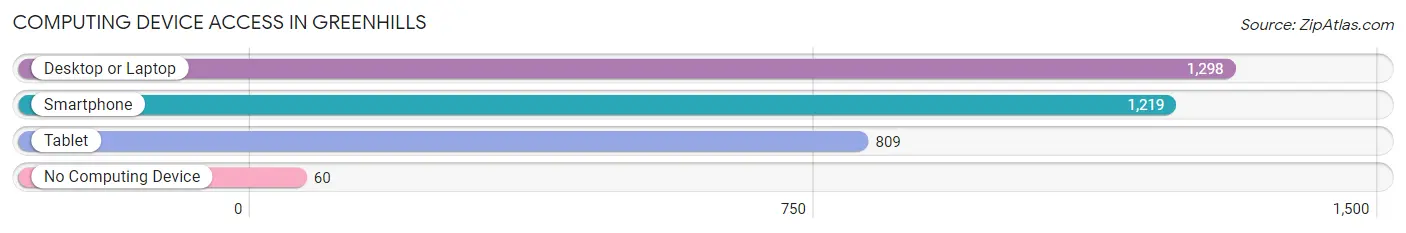
| Device Type | # Households | % Households |
| Desktop or Laptop | 1,298 | 87.1% |
| Smartphone | 1,219 | 81.8% |
| Tablet | 809 | 54.3% |
| No Computing Device | 60 | 4.0% |
| Total | 1,491 | 100.0% |
Internet Access in Greenhills
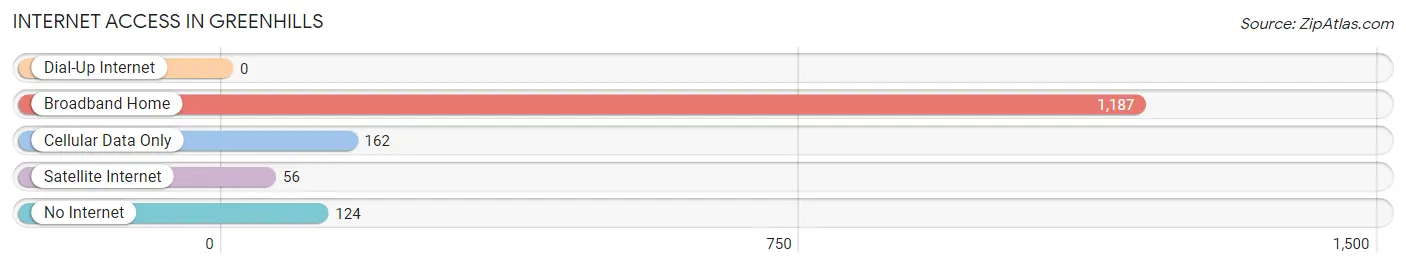
| Internet Type | # Households | % Households |
| Dial-Up Internet | 0 | 0.0% |
| Broadband Home | 1,187 | 79.6% |
| Cellular Data Only | 162 | 10.9% |
| Satellite Internet | 56 | 3.8% |
| No Internet | 124 | 8.3% |
| Total | 1,491 | 100.0% |
Greenhills Summary
Greenhills, Ohio is a small village located in Hamilton County, Ohio. It is situated approximately 10 miles north of Cincinnati and is part of the Cincinnati metropolitan area. The village has a population of approximately 3,000 people and covers an area of 1.2 square miles.
History
Greenhills was founded in the early 1800s by a group of settlers from Pennsylvania. The village was originally known as “Green Hill” and was named after the nearby hills. The village was incorporated in 1848 and was originally a farming community. In the late 1800s, the village began to grow and develop as a residential community.
In the early 1900s, the village was home to a number of small businesses, including a general store, a blacksmith shop, and a post office. The village also had a number of churches, including the Greenhills United Methodist Church, which was founded in 1883.
In the 1920s, the village began to experience a period of growth and development. The village was home to a number of new businesses, including a movie theater, a bowling alley, and a grocery store. The village also had a number of new homes built during this time.
In the 1950s, the village experienced a period of decline as many of the businesses and homes closed. The village was also affected by the construction of Interstate 75, which cut through the village and caused a number of homes and businesses to be demolished.
In the late 1970s, the village began to experience a period of revitalization. The village was home to a number of new businesses, including a shopping center, a library, and a community center. The village also had a number of new homes built during this time.
Geography
Greenhills is located in Hamilton County, Ohio. The village is situated approximately 10 miles north of Cincinnati and is part of the Cincinnati metropolitan area. The village is located on the banks of the Little Miami River and is surrounded by rolling hills. The village has a total area of 1.2 square miles, all of which is land.
Economy
Greenhills is primarily a residential community. The village is home to a number of small businesses, including restaurants, retail stores, and professional services. The village is also home to a number of manufacturing companies, including a plastics manufacturer and a metal fabrication company.
Demographics
As of the 2010 census, the village had a population of 3,000 people. The racial makeup of the village was 94.3% White, 2.3% African American, 0.3% Native American, 0.7% Asian, 0.7% from other races, and 1.9% from two or more races. Hispanic or Latino of any race were 1.7% of the population.
The median income for a household in the village was $50,000 and the median income for a family was $60,000. The per capita income for the village was $25,000. About 4.3% of families and 5.7% of the population were below the poverty line, including 8.3% of those under age 18 and 4.3% of those age 65 or over.
Common Questions
What is Per Capita Income in Greenhills?
Per Capita income in Greenhills is $31,923.
What is the Median Family Income in Greenhills?
Median Family Income in Greenhills is $79,502.
What is the Median Household income in Greenhills?
Median Household Income in Greenhills is $71,979.
What is Income or Wage Gap in Greenhills?
Income or Wage Gap in Greenhills is 54.8%.
Women in Greenhills earn 45.2 cents for every dollar earned by a man.
What is Inequality or Gini Index in Greenhills?
Inequality or Gini Index in Greenhills is 0.37.
What is the Total Population of Greenhills?
Total Population of Greenhills is 3,703.
What is the Total Male Population of Greenhills?
Total Male Population of Greenhills is 1,872.
What is the Total Female Population of Greenhills?
Total Female Population of Greenhills is 1,831.
What is the Ratio of Males per 100 Females in Greenhills?
There are 102.24 Males per 100 Females in Greenhills.
What is the Ratio of Females per 100 Males in Greenhills?
There are 97.81 Females per 100 Males in Greenhills.
What is the Median Population Age in Greenhills?
Median Population Age in Greenhills is 38.4 Years.
What is the Average Family Size in Greenhills
Average Family Size in Greenhills is 3.1 People.
What is the Average Household Size in Greenhills
Average Household Size in Greenhills is 2.4 People.
How Large is the Labor Force in Greenhills?
There are 1,836 People in the Labor Forcein in Greenhills.
What is the Percentage of People in the Labor Force in Greenhills?
63.0% of People are in the Labor Force in Greenhills.
What is the Unemployment Rate in Greenhills?
Unemployment Rate in Greenhills is 2.0%.