Toledo, OH Map & Demographics
Toledo Map
Toledo Overview
$25,860
PER CAPITA INCOME
$56,943
AVG FAMILY INCOME
$45,405
AVG HOUSEHOLD INCOME
18.3%
WAGE / INCOME GAP [ % ]
81.7¢/ $1
WAGE / INCOME GAP [ $ ]
$12,522
FAMILY INCOME DEFICIT
0.45
INEQUALITY / GINI INDEX
269,962
TOTAL POPULATION
132,343
MALE POPULATION
137,619
FEMALE POPULATION
96.17
MALES / 100 FEMALES
103.99
FEMALES / 100 MALES
35.4
MEDIAN AGE
3.0
AVG FAMILY SIZE
2.2
AVG HOUSEHOLD SIZE
132,865
LABOR FORCE [ PEOPLE ]
61.9%
PERCENT IN LABOR FORCE
8.2%
UNEMPLOYMENT RATE
Toledo Zip Codes
Income in Toledo
Income Overview in Toledo
Per Capita Income in Toledo is $25,860, while median incomes of families and households are $56,943 and $45,405 respectively.
| Characteristic | Number | Measure |
| Per Capita Income | 269,962 | $25,860 |
| Median Family Income | 61,588 | $56,943 |
| Mean Family Income | 61,588 | $69,606 |
| Median Household Income | 117,618 | $45,405 |
| Mean Household Income | 117,618 | $58,034 |
| Income Deficit | 61,588 | $12,522 |
| Wage / Income Gap (%) | 269,962 | 18.27% |
| Wage / Income Gap ($) | 269,962 | 81.73¢ per $1 |
| Gini / Inequality Index | 269,962 | 0.45 |
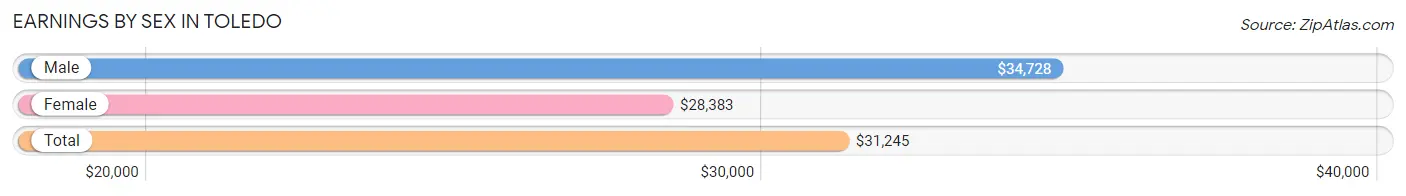
Earnings by Sex in Toledo
Average Earnings in Toledo are $31,245, $34,728 for men and $28,383 for women, a difference of 18.3%.
| Sex | Number | Average Earnings |
| Male | 70,465 (50.6%) | $34,728 |
| Female | 68,670 (49.3%) | $28,383 |
| Total | 139,135 (100.0%) | $31,245 |
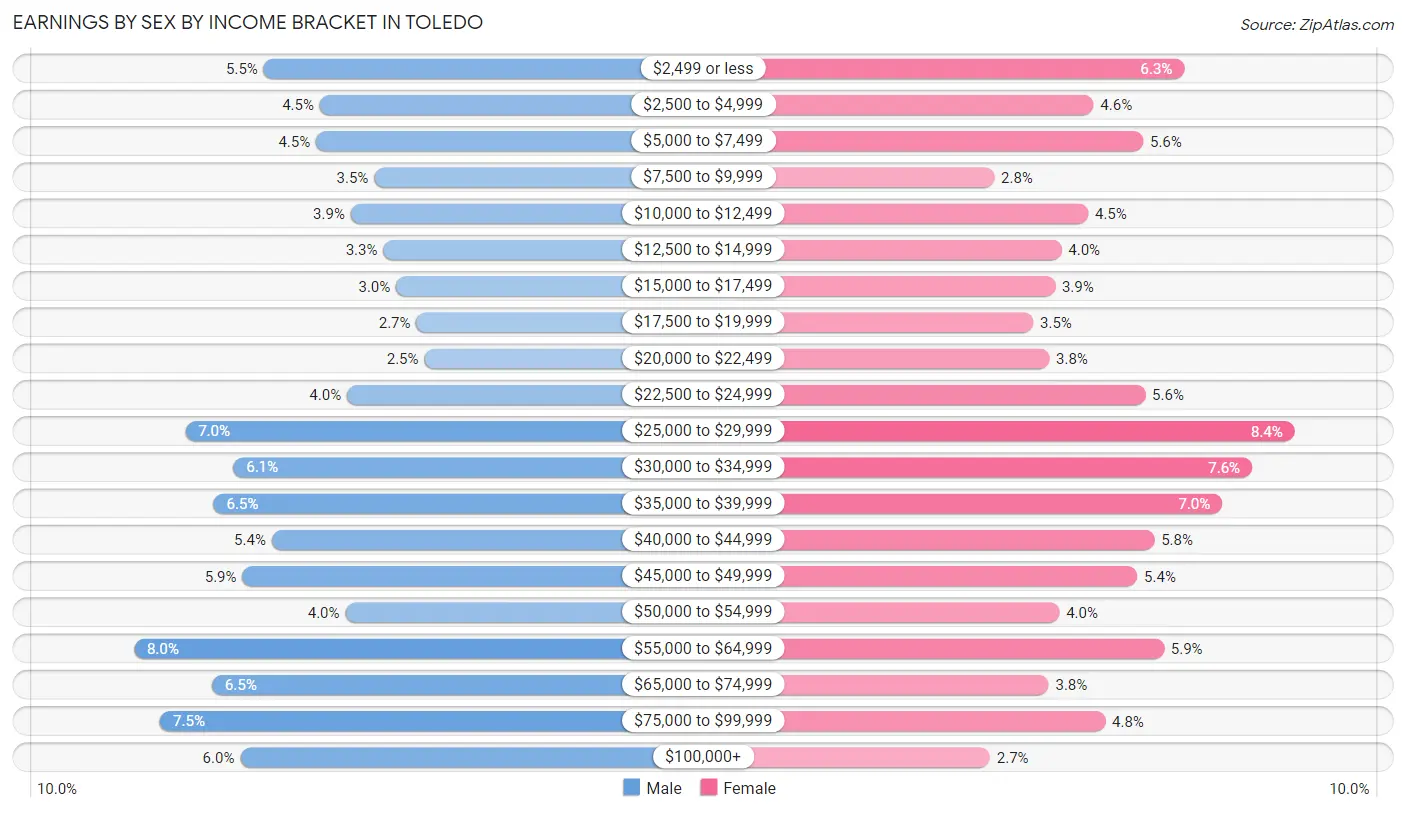
Earnings by Sex by Income Bracket in Toledo
The most common earnings brackets in Toledo are $55,000 to $64,999 for men (5,605 | 8.0%) and $25,000 to $29,999 for women (5,758 | 8.4%).
| Income | Male | Female |
| $2,499 or less | 3,887 (5.5%) | 4,340 (6.3%) |
| $2,500 to $4,999 | 3,150 (4.5%) | 3,172 (4.6%) |
| $5,000 to $7,499 | 3,197 (4.5%) | 3,813 (5.6%) |
| $7,500 to $9,999 | 2,430 (3.5%) | 1,894 (2.8%) |
| $10,000 to $12,499 | 2,741 (3.9%) | 3,106 (4.5%) |
| $12,500 to $14,999 | 2,311 (3.3%) | 2,760 (4.0%) |
| $15,000 to $17,499 | 2,144 (3.0%) | 2,678 (3.9%) |
| $17,500 to $19,999 | 1,871 (2.7%) | 2,400 (3.5%) |
| $20,000 to $22,499 | 1,772 (2.5%) | 2,604 (3.8%) |
| $22,500 to $24,999 | 2,791 (4.0%) | 3,841 (5.6%) |
| $25,000 to $29,999 | 4,922 (7.0%) | 5,758 (8.4%) |
| $30,000 to $34,999 | 4,293 (6.1%) | 5,211 (7.6%) |
| $35,000 to $39,999 | 4,555 (6.5%) | 4,827 (7.0%) |
| $40,000 to $44,999 | 3,786 (5.4%) | 3,953 (5.8%) |
| $45,000 to $49,999 | 4,172 (5.9%) | 3,739 (5.4%) |
| $50,000 to $54,999 | 2,811 (4.0%) | 2,733 (4.0%) |
| $55,000 to $64,999 | 5,605 (8.0%) | 4,079 (5.9%) |
| $65,000 to $74,999 | 4,574 (6.5%) | 2,598 (3.8%) |
| $75,000 to $99,999 | 5,256 (7.5%) | 3,325 (4.8%) |
| $100,000+ | 4,197 (6.0%) | 1,839 (2.7%) |
| Total | 70,465 (100.0%) | 68,670 (100.0%) |
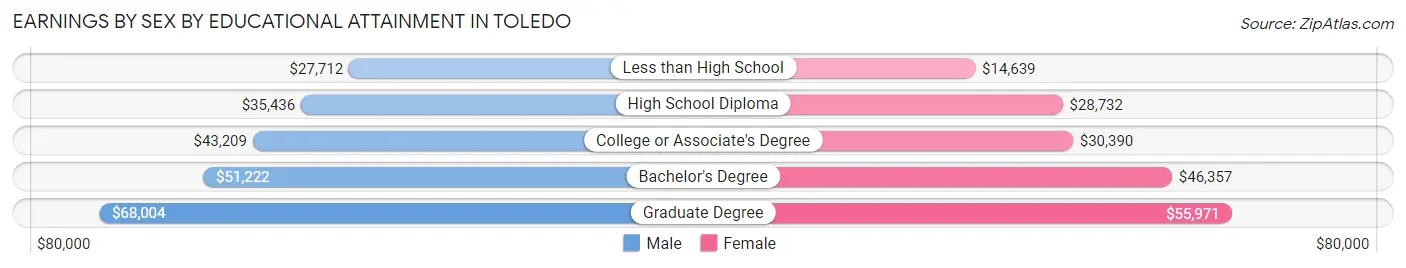
Earnings by Sex by Educational Attainment in Toledo
Average earnings in Toledo are $40,726 for men and $32,888 for women, a difference of 19.3%. Men with an educational attainment of graduate degree enjoy the highest average annual earnings of $68,004, while those with less than high school education earn the least with $27,712. Women with an educational attainment of graduate degree earn the most with the average annual earnings of $55,971, while those with less than high school education have the smallest earnings of $14,639.
| Educational Attainment | Male Income | Female Income |
| Less than High School | $27,712 | $14,639 |
| High School Diploma | $35,436 | $28,732 |
| College or Associate's Degree | $43,209 | $30,390 |
| Bachelor's Degree | $51,222 | $46,357 |
| Graduate Degree | $68,004 | $55,971 |
| Total | $40,726 | $32,888 |
Family Income in Toledo
Family Income Brackets in Toledo
According to the Toledo family income data, there are 12,010 families falling into the $50,000 to $74,999 income range, which is the most common income bracket and makes up 19.5% of all families. Conversely, the $200,000+ income bracket is the least frequent group with only 1,417 families (2.3%) belonging to this category.
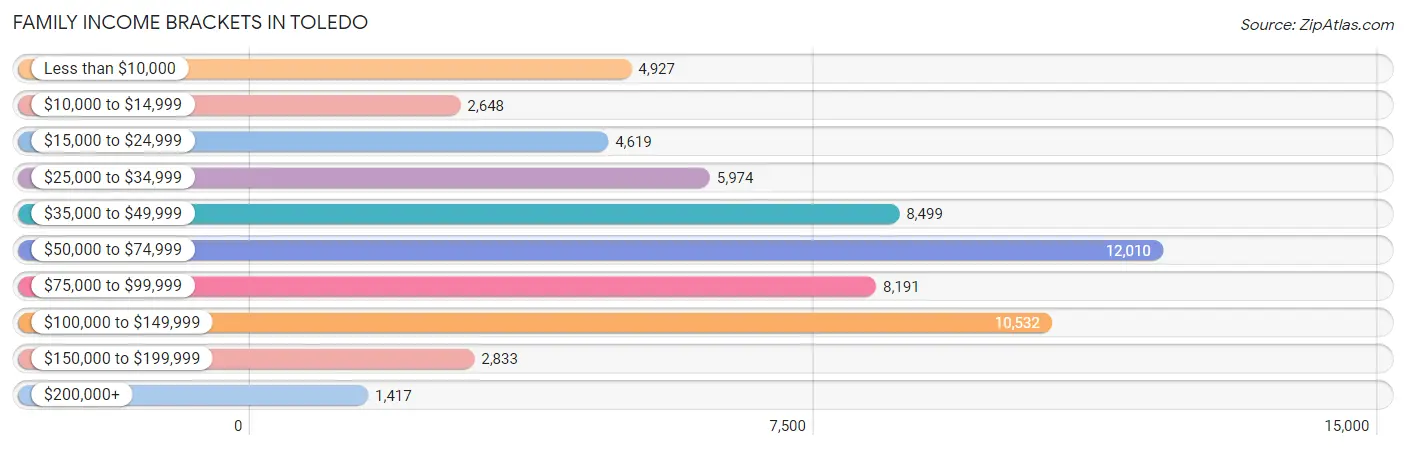
| Income Bracket | # Families | % Families |
| Less than $10,000 | 4,927 | 8.0% |
| $10,000 to $14,999 | 2,648 | 4.3% |
| $15,000 to $24,999 | 4,619 | 7.5% |
| $25,000 to $34,999 | 5,974 | 9.7% |
| $35,000 to $49,999 | 8,499 | 13.8% |
| $50,000 to $74,999 | 12,010 | 19.5% |
| $75,000 to $99,999 | 8,191 | 13.3% |
| $100,000 to $149,999 | 10,532 | 17.1% |
| $150,000 to $199,999 | 2,833 | 4.6% |
| $200,000+ | 1,417 | 2.3% |
Family Income by Famaliy Size in Toledo
7+ person families (997 | 1.6%) account for the highest median family income in Toledo with $73,713 per family, while 2-person families (31,796 | 51.6%) have the highest median income of $27,655 per family member.
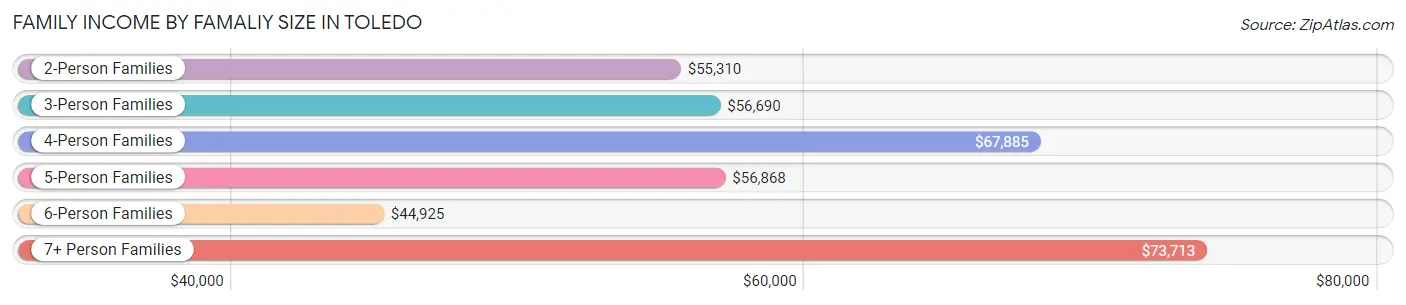
| Income Bracket | # Families | Median Income |
| 2-Person Families | 31,796 (51.6%) | $55,310 |
| 3-Person Families | 14,208 (23.1%) | $56,690 |
| 4-Person Families | 8,411 (13.7%) | $67,885 |
| 5-Person Families | 4,668 (7.6%) | $56,868 |
| 6-Person Families | 1,508 (2.5%) | $44,925 |
| 7+ Person Families | 997 (1.6%) | $73,713 |
| Total | 61,588 (100.0%) | $56,943 |
Family Income by Number of Earners in Toledo
The median family income in Toledo is $56,943, with families comprising 3+ earners (5,166) having the highest median family income of $122,247, while families with no earners (10,341) have the lowest median family income of $30,169, accounting for 8.4% and 16.8% of families, respectively.
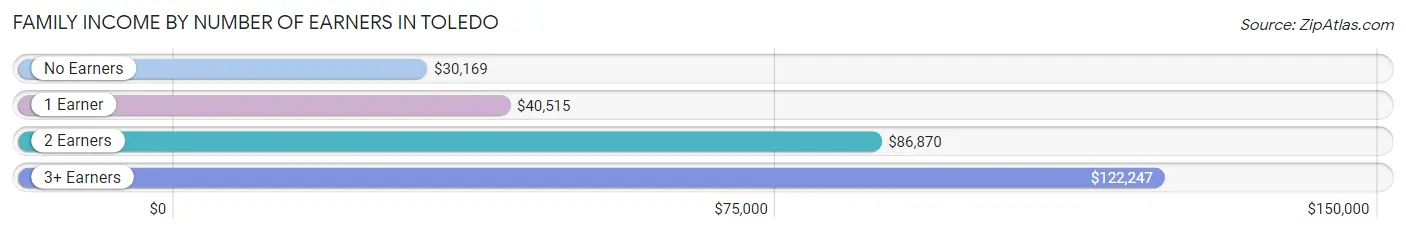
| Number of Earners | # Families | Median Income |
| No Earners | 10,341 (16.8%) | $30,169 |
| 1 Earner | 25,385 (41.2%) | $40,515 |
| 2 Earners | 20,696 (33.6%) | $86,870 |
| 3+ Earners | 5,166 (8.4%) | $122,247 |
| Total | 61,588 (100.0%) | $56,943 |
Household Income in Toledo
Household Income Brackets in Toledo
With 20,701 households falling in the category, the $50,000 to $74,999 income range is the most frequent in Toledo, accounting for 17.6% of all households. In contrast, only 1,882 households (1.6%) fall into the $200,000+ income bracket, making it the least populous group.
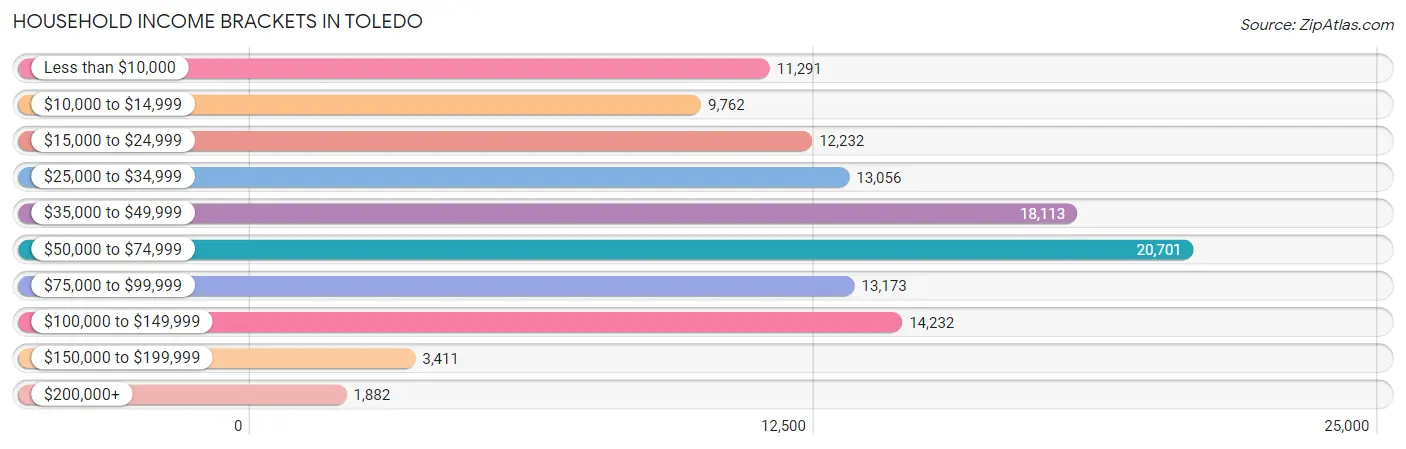
| Income Bracket | # Households | % Households |
| Less than $10,000 | 11,291 | 9.6% |
| $10,000 to $14,999 | 9,762 | 8.3% |
| $15,000 to $24,999 | 12,232 | 10.4% |
| $25,000 to $34,999 | 13,056 | 11.1% |
| $35,000 to $49,999 | 18,113 | 15.4% |
| $50,000 to $74,999 | 20,701 | 17.6% |
| $75,000 to $99,999 | 13,173 | 11.2% |
| $100,000 to $149,999 | 14,232 | 12.1% |
| $150,000 to $199,999 | 3,411 | 2.9% |
| $200,000+ | 1,882 | 1.6% |
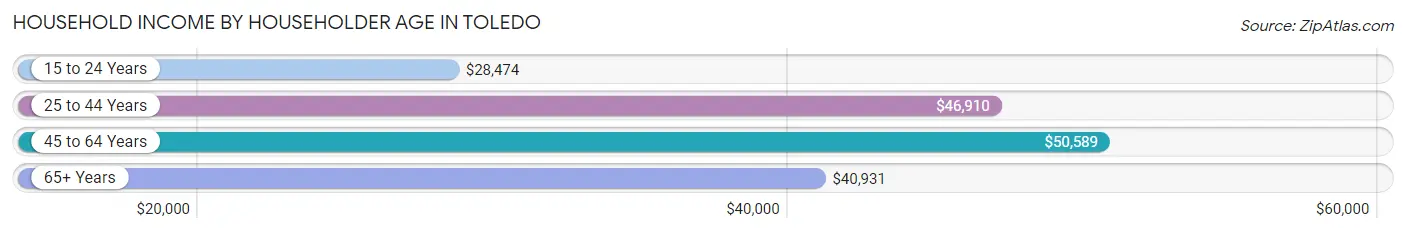
Household Income by Householder Age in Toledo
The median household income in Toledo is $45,405, with the highest median household income of $50,589 found in the 45 to 64 years age bracket for the primary householder. A total of 40,981 households (34.8%) fall into this category. Meanwhile, the 15 to 24 years age bracket for the primary householder has the lowest median household income of $28,474, with 7,249 households (6.2%) in this group.
| Income Bracket | # Households | Median Income |
| 15 to 24 Years | 7,249 (6.2%) | $28,474 |
| 25 to 44 Years | 41,318 (35.1%) | $46,910 |
| 45 to 64 Years | 40,981 (34.8%) | $50,589 |
| 65+ Years | 28,070 (23.9%) | $40,931 |
| Total | 117,618 (100.0%) | $45,405 |
Poverty in Toledo
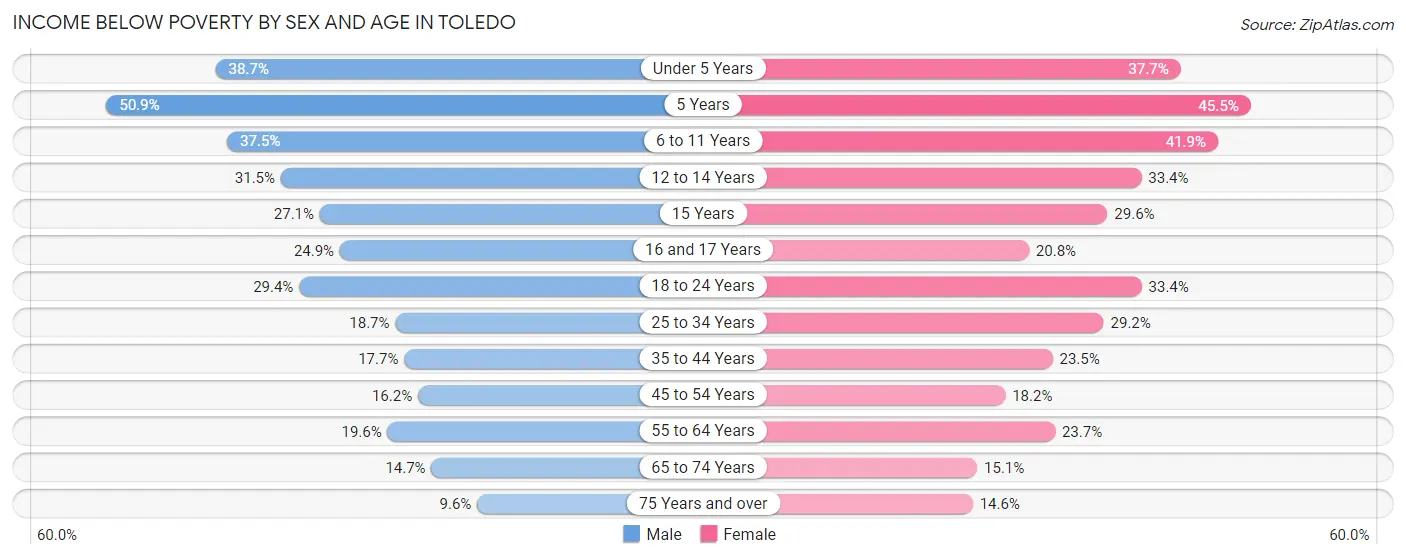
Income Below Poverty by Sex and Age in Toledo
With 22.9% poverty level for males and 26.2% for females among the residents of Toledo, 5 year old males and 5 year old females are the most vulnerable to poverty, with 987 males (50.9%) and 902 females (45.5%) in their respective age groups living below the poverty level.
| Age Bracket | Male | Female |
| Under 5 Years | 3,239 (38.7%) | 3,172 (37.7%) |
| 5 Years | 987 (50.9%) | 902 (45.5%) |
| 6 to 11 Years | 3,846 (37.4%) | 3,862 (41.9%) |
| 12 to 14 Years | 1,712 (31.5%) | 1,771 (33.4%) |
| 15 Years | 438 (27.1%) | 433 (29.6%) |
| 16 and 17 Years | 843 (24.9%) | 678 (20.8%) |
| 18 to 24 Years | 3,949 (29.4%) | 4,170 (33.4%) |
| 25 to 34 Years | 3,797 (18.7%) | 6,347 (29.2%) |
| 35 to 44 Years | 2,767 (17.7%) | 3,752 (23.5%) |
| 45 to 54 Years | 2,422 (16.2%) | 2,849 (18.2%) |
| 55 to 64 Years | 3,201 (19.6%) | 4,087 (23.7%) |
| 65 to 74 Years | 1,668 (14.7%) | 1,932 (15.1%) |
| 75 Years and over | 543 (9.6%) | 1,338 (14.6%) |
| Total | 29,412 (22.9%) | 35,293 (26.2%) |
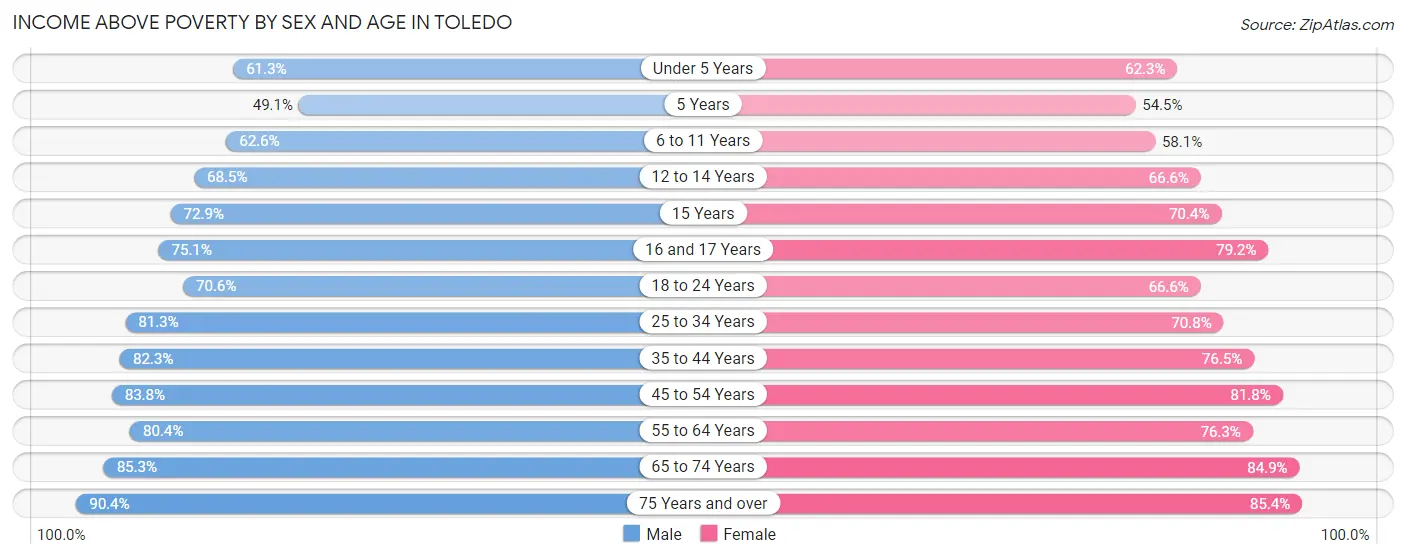
Income Above Poverty by Sex and Age in Toledo
According to the poverty statistics in Toledo, males aged 75 years and over and females aged 75 years and over are the age groups that are most secure financially, with 90.4% of males and 85.4% of females in these age groups living above the poverty line.
| Age Bracket | Male | Female |
| Under 5 Years | 5,123 (61.3%) | 5,235 (62.3%) |
| 5 Years | 952 (49.1%) | 1,079 (54.5%) |
| 6 to 11 Years | 6,425 (62.5%) | 5,362 (58.1%) |
| 12 to 14 Years | 3,730 (68.5%) | 3,537 (66.6%) |
| 15 Years | 1,177 (72.9%) | 1,031 (70.4%) |
| 16 and 17 Years | 2,545 (75.1%) | 2,575 (79.2%) |
| 18 to 24 Years | 9,476 (70.6%) | 8,318 (66.6%) |
| 25 to 34 Years | 16,501 (81.3%) | 15,420 (70.8%) |
| 35 to 44 Years | 12,850 (82.3%) | 12,232 (76.5%) |
| 45 to 54 Years | 12,542 (83.8%) | 12,804 (81.8%) |
| 55 to 64 Years | 13,147 (80.4%) | 13,132 (76.3%) |
| 65 to 74 Years | 9,687 (85.3%) | 10,889 (84.9%) |
| 75 Years and over | 5,112 (90.4%) | 7,836 (85.4%) |
| Total | 99,267 (77.1%) | 99,450 (73.8%) |
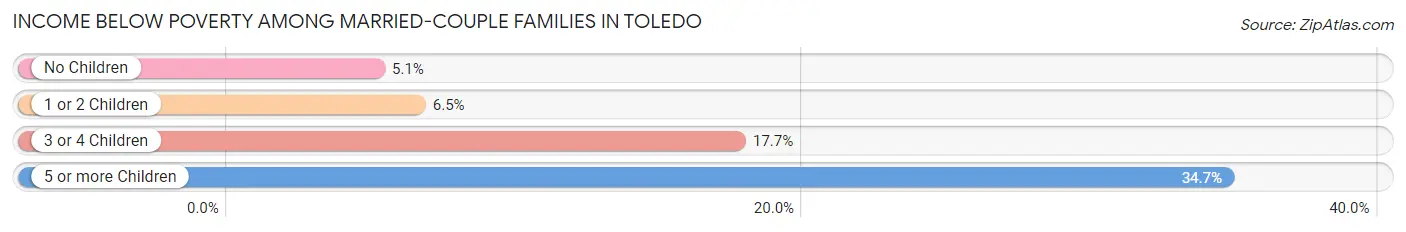
Income Below Poverty Among Married-Couple Families in Toledo
The poverty statistics for married-couple families in Toledo show that 6.9% or 2,285 of the total 33,261 families live below the poverty line. Families with 5 or more children have the highest poverty rate of 34.7%, comprising of 138 families. On the other hand, families with no children have the lowest poverty rate of 5.1%, which includes 1,091 families.
| Children | Above Poverty | Below Poverty |
| No Children | 20,237 (94.9%) | 1,091 (5.1%) |
| 1 or 2 Children | 8,251 (93.5%) | 577 (6.5%) |
| 3 or 4 Children | 2,228 (82.3%) | 479 (17.7%) |
| 5 or more Children | 260 (65.3%) | 138 (34.7%) |
| Total | 30,976 (93.1%) | 2,285 (6.9%) |
Income Below Poverty Among Single-Parent Households in Toledo
According to the poverty data in Toledo, 15.9% or 1,068 single-father households and 37.3% or 8,074 single-mother households are living below the poverty line. Among single-father households, those with 5 or more children have the highest poverty rate, with 75 households (69.4%) experiencing poverty. Likewise, among single-mother households, those with 5 or more children have the highest poverty rate, with 377 households (82.9%) falling below the poverty line.
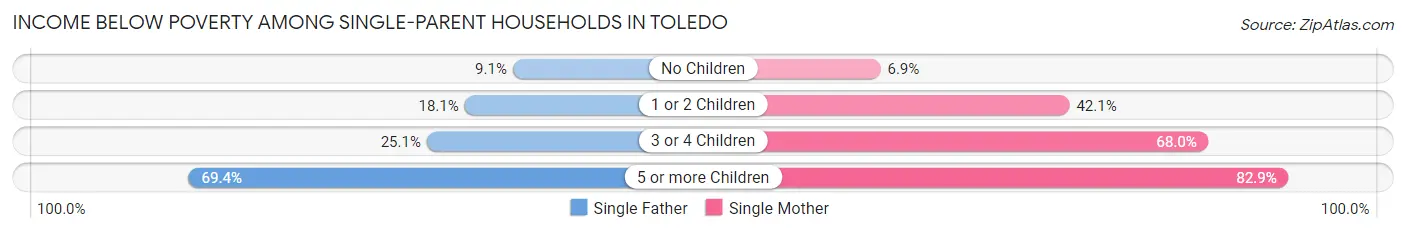
| Children | Single Father | Single Mother |
| No Children | 238 (9.1%) | 393 (6.9%) |
| 1 or 2 Children | 626 (18.0%) | 5,177 (42.1%) |
| 3 or 4 Children | 129 (25.1%) | 2,127 (68.0%) |
| 5 or more Children | 75 (69.4%) | 377 (82.9%) |
| Total | 1,068 (15.9%) | 8,074 (37.3%) |
Income Below Poverty Among Married-Couple vs Single-Parent Households in Toledo
The poverty data for Toledo shows that 2,285 of the married-couple family households (6.9%) and 9,142 of the single-parent households (32.3%) are living below the poverty level. Within the married-couple family households, those with 5 or more children have the highest poverty rate, with 138 households (34.7%) falling below the poverty line. Among the single-parent households, those with 5 or more children have the highest poverty rate, with 452 household (80.3%) living below poverty.
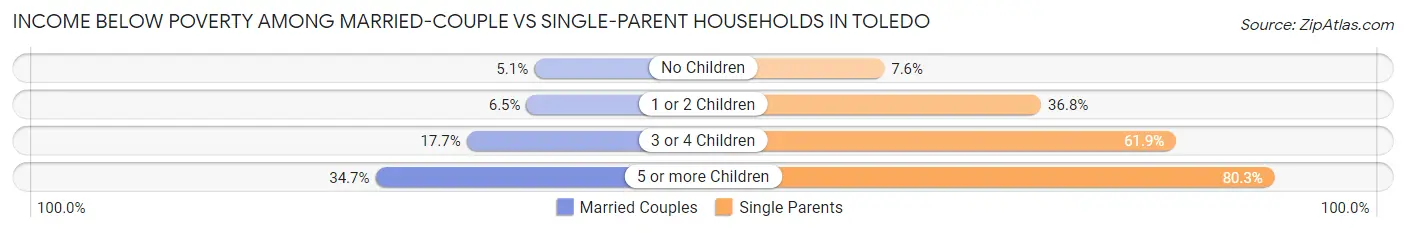
| Children | Married-Couple Families | Single-Parent Households |
| No Children | 1,091 (5.1%) | 631 (7.6%) |
| 1 or 2 Children | 577 (6.5%) | 5,803 (36.8%) |
| 3 or 4 Children | 479 (17.7%) | 2,256 (61.9%) |
| 5 or more Children | 138 (34.7%) | 452 (80.3%) |
| Total | 2,285 (6.9%) | 9,142 (32.3%) |
Race in Toledo
The most populous races in Toledo are White / Caucasian (160,924 | 59.6%), Black / African American (75,862 | 28.1%), and Hispanic or Latino (24,076 | 8.9%).
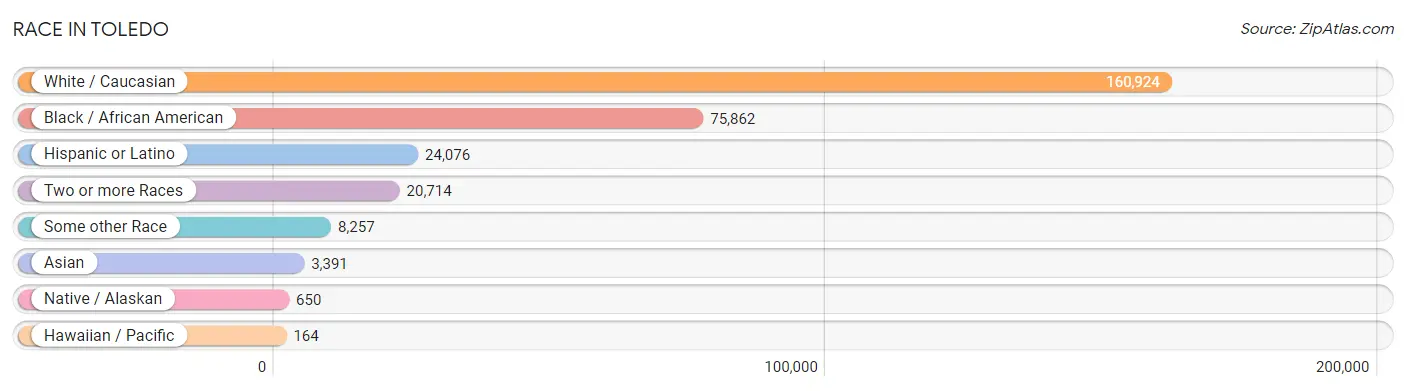
| Race | # Population | % Population |
| Asian | 3,391 | 1.3% |
| Black / African American | 75,862 | 28.1% |
| Hawaiian / Pacific | 164 | 0.1% |
| Hispanic or Latino | 24,076 | 8.9% |
| Native / Alaskan | 650 | 0.2% |
| White / Caucasian | 160,924 | 59.6% |
| Two or more Races | 20,714 | 7.7% |
| Some other Race | 8,257 | 3.1% |
| Total | 269,962 | 100.0% |
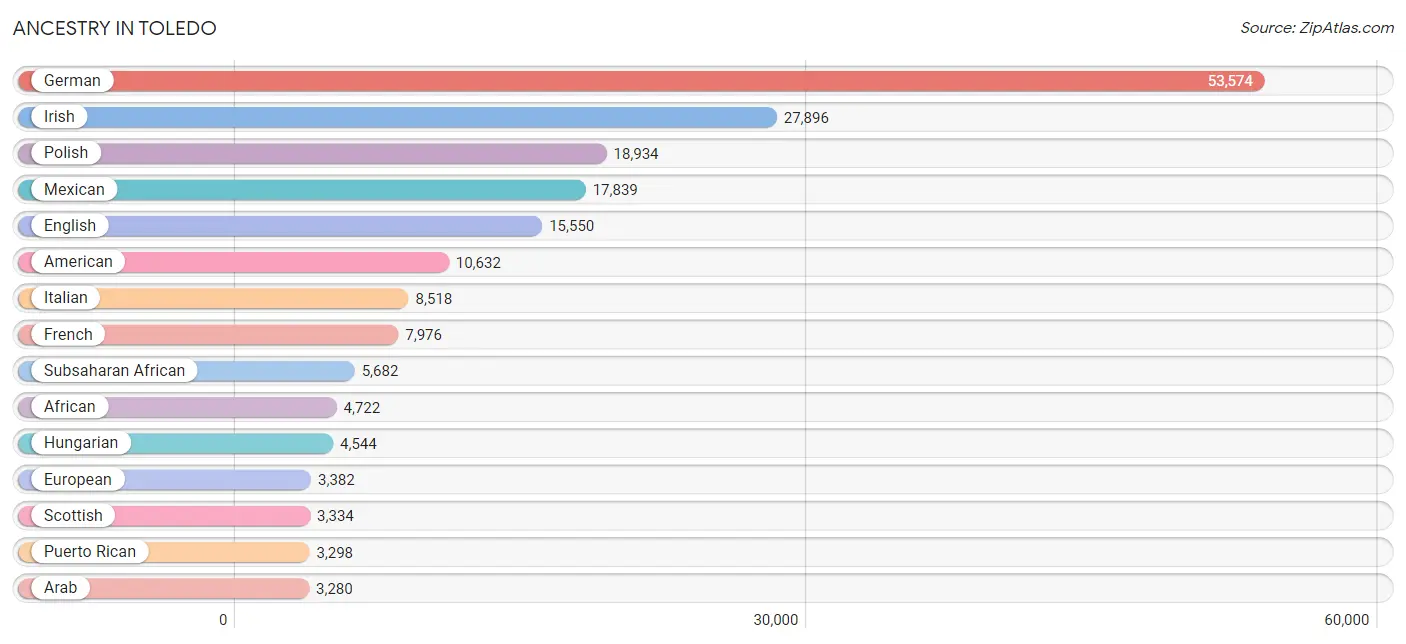
Ancestry in Toledo
The most populous ancestries reported in Toledo are German (53,574 | 19.9%), Irish (27,896 | 10.3%), Polish (18,934 | 7.0%), Mexican (17,839 | 6.6%), and English (15,550 | 5.8%), together accounting for 49.6% of all Toledo residents.
| Ancestry | # Population | % Population |
| Afghan | 116 | 0.0% |
| African | 4,722 | 1.8% |
| Alaska Native | 20 | 0.0% |
| Albanian | 22 | 0.0% |
| Alsatian | 21 | 0.0% |
| American | 10,632 | 3.9% |
| Apache | 62 | 0.0% |
| Arab | 3,280 | 1.2% |
| Argentinean | 32 | 0.0% |
| Armenian | 61 | 0.0% |
| Assyrian / Chaldean / Syriac | 14 | 0.0% |
| Australian | 10 | 0.0% |
| Austrian | 162 | 0.1% |
| Bahamian | 19 | 0.0% |
| Belgian | 305 | 0.1% |
| Belizean | 98 | 0.0% |
| Bhutanese | 379 | 0.1% |
| Blackfeet | 567 | 0.2% |
| Brazilian | 68 | 0.0% |
| British | 880 | 0.3% |
| British West Indian | 18 | 0.0% |
| Bulgarian | 90 | 0.0% |
| Burmese | 514 | 0.2% |
| Cambodian | 6 | 0.0% |
| Canadian | 571 | 0.2% |
| Celtic | 240 | 0.1% |
| Central American | 253 | 0.1% |
| Central American Indian | 16 | 0.0% |
| Cherokee | 797 | 0.3% |
| Cheyenne | 7 | 0.0% |
| Chickasaw | 15 | 0.0% |
| Chilean | 19 | 0.0% |
| Chippewa | 128 | 0.1% |
| Choctaw | 14 | 0.0% |
| Colombian | 199 | 0.1% |
| Comanche | 71 | 0.0% |
| Costa Rican | 48 | 0.0% |
| Creek | 9 | 0.0% |
| Croatian | 59 | 0.0% |
| Cuban | 291 | 0.1% |
| Cypriot | 5 | 0.0% |
| Czech | 757 | 0.3% |
| Czechoslovakian | 232 | 0.1% |
| Danish | 320 | 0.1% |
| Delaware | 57 | 0.0% |
| Dominican | 154 | 0.1% |
| Dutch | 1,945 | 0.7% |
| Eastern European | 534 | 0.2% |
| Ecuadorian | 175 | 0.1% |
| Egyptian | 392 | 0.2% |
| English | 15,550 | 5.8% |
| Estonian | 9 | 0.0% |
| Ethiopian | 13 | 0.0% |
| European | 3,382 | 1.3% |
| Filipino | 29 | 0.0% |
| Finnish | 407 | 0.2% |
| French | 7,976 | 2.9% |
| French American Indian | 80 | 0.0% |
| French Canadian | 1,790 | 0.7% |
| German | 53,574 | 19.9% |
| German Russian | 29 | 0.0% |
| Ghanaian | 168 | 0.1% |
| Greek | 835 | 0.3% |
| Guamanian / Chamorro | 121 | 0.0% |
| Guyanese | 415 | 0.2% |
| Haitian | 92 | 0.0% |
| Honduran | 21 | 0.0% |
| Hungarian | 4,544 | 1.7% |
| Icelander | 5 | 0.0% |
| Indian (Asian) | 1,343 | 0.5% |
| Iranian | 95 | 0.0% |
| Iraqi | 84 | 0.0% |
| Irish | 27,896 | 10.3% |
| Iroquois | 18 | 0.0% |
| Israeli | 34 | 0.0% |
| Italian | 8,518 | 3.2% |
| Jamaican | 490 | 0.2% |
| Japanese | 26 | 0.0% |
| Jordanian | 243 | 0.1% |
| Kenyan | 35 | 0.0% |
| Korean | 795 | 0.3% |
| Laotian | 13 | 0.0% |
| Latvian | 25 | 0.0% |
| Lebanese | 1,470 | 0.5% |
| Liberian | 195 | 0.1% |
| Lithuanian | 126 | 0.1% |
| Luxembourger | 6 | 0.0% |
| Macedonian | 36 | 0.0% |
| Malaysian | 96 | 0.0% |
| Maltese | 6 | 0.0% |
| Mexican | 17,839 | 6.6% |
| Mexican American Indian | 172 | 0.1% |
| Native Hawaiian | 81 | 0.0% |
| Navajo | 26 | 0.0% |
| Nicaraguan | 19 | 0.0% |
| Nigerian | 281 | 0.1% |
| Northern European | 113 | 0.0% |
| Norwegian | 1,171 | 0.4% |
| Ottawa | 18 | 0.0% |
| Pakistani | 253 | 0.1% |
| Palestinian | 154 | 0.1% |
| Panamanian | 26 | 0.0% |
| Paraguayan | 163 | 0.1% |
| Pennsylvania German | 109 | 0.0% |
| Peruvian | 152 | 0.1% |
| Polish | 18,934 | 7.0% |
| Portuguese | 143 | 0.1% |
| Potawatomi | 11 | 0.0% |
| Pueblo | 15 | 0.0% |
| Puerto Rican | 3,298 | 1.2% |
| Romanian | 284 | 0.1% |
| Russian | 865 | 0.3% |
| Salvadoran | 139 | 0.1% |
| Samoan | 17 | 0.0% |
| Scandinavian | 433 | 0.2% |
| Scotch-Irish | 1,280 | 0.5% |
| Scottish | 3,334 | 1.2% |
| Seminole | 11 | 0.0% |
| Senegalese | 8 | 0.0% |
| Serbian | 56 | 0.0% |
| Shoshone | 19 | 0.0% |
| Sierra Leonean | 47 | 0.0% |
| Sioux | 9 | 0.0% |
| Slavic | 42 | 0.0% |
| Slovak | 979 | 0.4% |
| Slovene | 92 | 0.0% |
| Somali | 30 | 0.0% |
| South African | 12 | 0.0% |
| South American | 917 | 0.3% |
| Soviet Union | 28 | 0.0% |
| Spaniard | 271 | 0.1% |
| Spanish | 235 | 0.1% |
| Sri Lankan | 269 | 0.1% |
| Subsaharan African | 5,682 | 2.1% |
| Sudanese | 18 | 0.0% |
| Swedish | 1,224 | 0.4% |
| Swiss | 557 | 0.2% |
| Syrian | 175 | 0.1% |
| Thai | 662 | 0.3% |
| Trinidadian and Tobagonian | 64 | 0.0% |
| Turkish | 48 | 0.0% |
| Ukrainian | 285 | 0.1% |
| Venezuelan | 177 | 0.1% |
| Vietnamese | 7 | 0.0% |
| Welsh | 1,226 | 0.4% |
| West Indian | 201 | 0.1% |
| Yaqui | 27 | 0.0% |
| Yugoslavian | 73 | 0.0% |
| Zimbabwean | 47 | 0.0% | View All 149 Rows |
Immigrants in Toledo
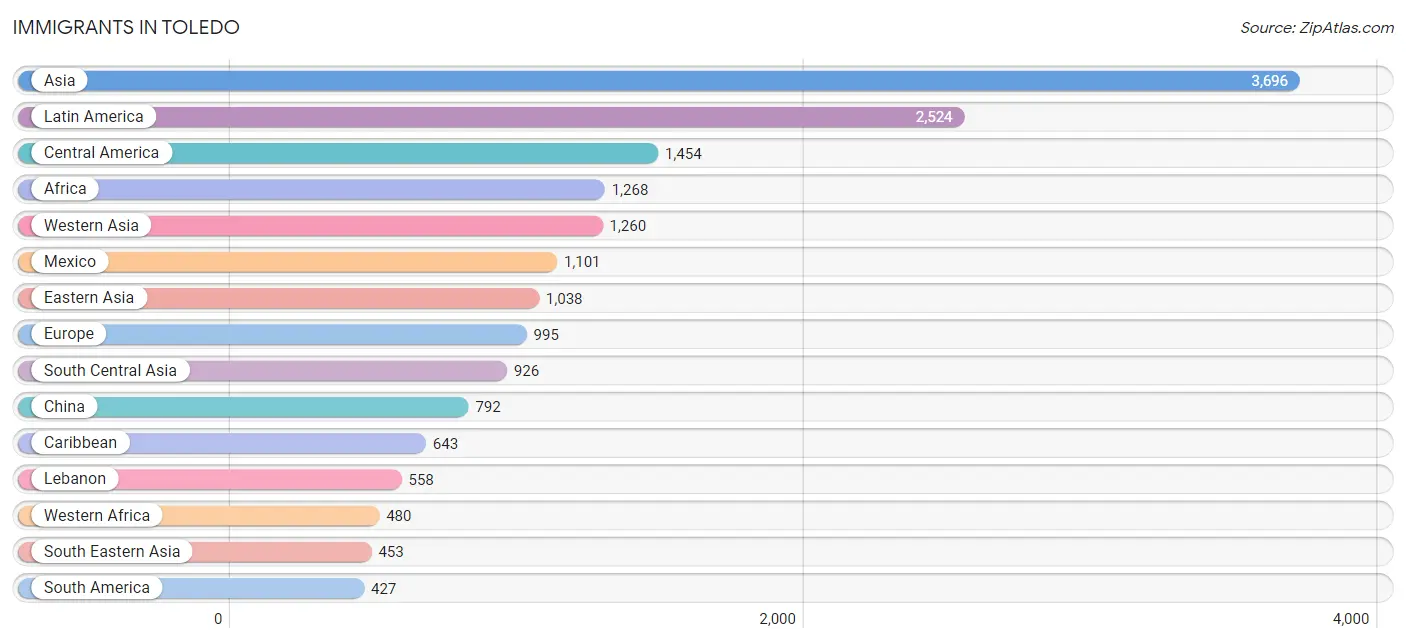
The most numerous immigrant groups reported in Toledo came from Asia (3,696 | 1.4%), Latin America (2,524 | 0.9%), Central America (1,454 | 0.5%), Africa (1,268 | 0.5%), and Western Asia (1,260 | 0.5%), together accounting for 3.8% of all Toledo residents.
| Immigration Origin | # Population | % Population |
| Afghanistan | 102 | 0.0% |
| Africa | 1,268 | 0.5% |
| Argentina | 11 | 0.0% |
| Asia | 3,696 | 1.4% |
| Australia | 19 | 0.0% |
| Bahamas | 33 | 0.0% |
| Bangladesh | 7 | 0.0% |
| Bosnia and Herzegovina | 17 | 0.0% |
| Brazil | 61 | 0.0% |
| Cambodia | 20 | 0.0% |
| Cameroon | 154 | 0.1% |
| Canada | 291 | 0.1% |
| Caribbean | 643 | 0.2% |
| Central America | 1,454 | 0.5% |
| Chile | 19 | 0.0% |
| China | 792 | 0.3% |
| Colombia | 12 | 0.0% |
| Congo | 26 | 0.0% |
| Costa Rica | 48 | 0.0% |
| Cuba | 73 | 0.0% |
| Czechoslovakia | 10 | 0.0% |
| Dominican Republic | 150 | 0.1% |
| Eastern Africa | 199 | 0.1% |
| Eastern Asia | 1,038 | 0.4% |
| Eastern Europe | 344 | 0.1% |
| Ecuador | 89 | 0.0% |
| Egypt | 173 | 0.1% |
| El Salvador | 84 | 0.0% |
| England | 127 | 0.1% |
| Europe | 995 | 0.4% |
| Fiji | 12 | 0.0% |
| France | 5 | 0.0% |
| Germany | 307 | 0.1% |
| Ghana | 150 | 0.1% |
| Greece | 21 | 0.0% |
| Guatemala | 191 | 0.1% |
| Guyana | 124 | 0.1% |
| Haiti | 39 | 0.0% |
| Honduras | 8 | 0.0% |
| Hong Kong | 46 | 0.0% |
| Hungary | 19 | 0.0% |
| India | 409 | 0.2% |
| Indonesia | 26 | 0.0% |
| Iran | 61 | 0.0% |
| Iraq | 129 | 0.1% |
| Ireland | 62 | 0.0% |
| Israel | 40 | 0.0% |
| Italy | 57 | 0.0% |
| Jamaica | 218 | 0.1% |
| Japan | 16 | 0.0% |
| Jordan | 155 | 0.1% |
| Kenya | 67 | 0.0% |
| Korea | 230 | 0.1% |
| Kuwait | 73 | 0.0% |
| Laos | 12 | 0.0% |
| Latin America | 2,524 | 0.9% |
| Lebanon | 558 | 0.2% |
| Liberia | 128 | 0.1% |
| Malaysia | 19 | 0.0% |
| Mexico | 1,101 | 0.4% |
| Middle Africa | 180 | 0.1% |
| Nepal | 72 | 0.0% |
| Nicaragua | 19 | 0.0% |
| Nigeria | 147 | 0.1% |
| Northern Africa | 341 | 0.1% |
| Northern Europe | 241 | 0.1% |
| Norway | 5 | 0.0% |
| Oceania | 46 | 0.0% |
| Pakistan | 103 | 0.0% |
| Panama | 3 | 0.0% |
| Peru | 59 | 0.0% |
| Philippines | 188 | 0.1% |
| Poland | 70 | 0.0% |
| Romania | 111 | 0.0% |
| Russia | 27 | 0.0% |
| Saudi Arabia | 178 | 0.1% |
| Serbia | 27 | 0.0% |
| Sierra Leone | 47 | 0.0% |
| Somalia | 30 | 0.0% |
| South Africa | 32 | 0.0% |
| South America | 427 | 0.2% |
| South Central Asia | 926 | 0.3% |
| South Eastern Asia | 453 | 0.2% |
| Southern Europe | 98 | 0.0% |
| Spain | 20 | 0.0% |
| Sri Lanka | 126 | 0.1% |
| Sudan | 161 | 0.1% |
| Sweden | 14 | 0.0% |
| Syria | 75 | 0.0% |
| Taiwan | 126 | 0.1% |
| Thailand | 124 | 0.1% |
| Trinidad and Tobago | 11 | 0.0% |
| Turkey | 26 | 0.0% |
| Ukraine | 35 | 0.0% |
| Uzbekistan | 12 | 0.0% |
| Venezuela | 38 | 0.0% |
| Vietnam | 64 | 0.0% |
| Western Africa | 480 | 0.2% |
| Western Asia | 1,260 | 0.5% |
| Western Europe | 312 | 0.1% |
| Zimbabwe | 53 | 0.0% | View All 101 Rows |
Sex and Age in Toledo
Sex and Age in Toledo
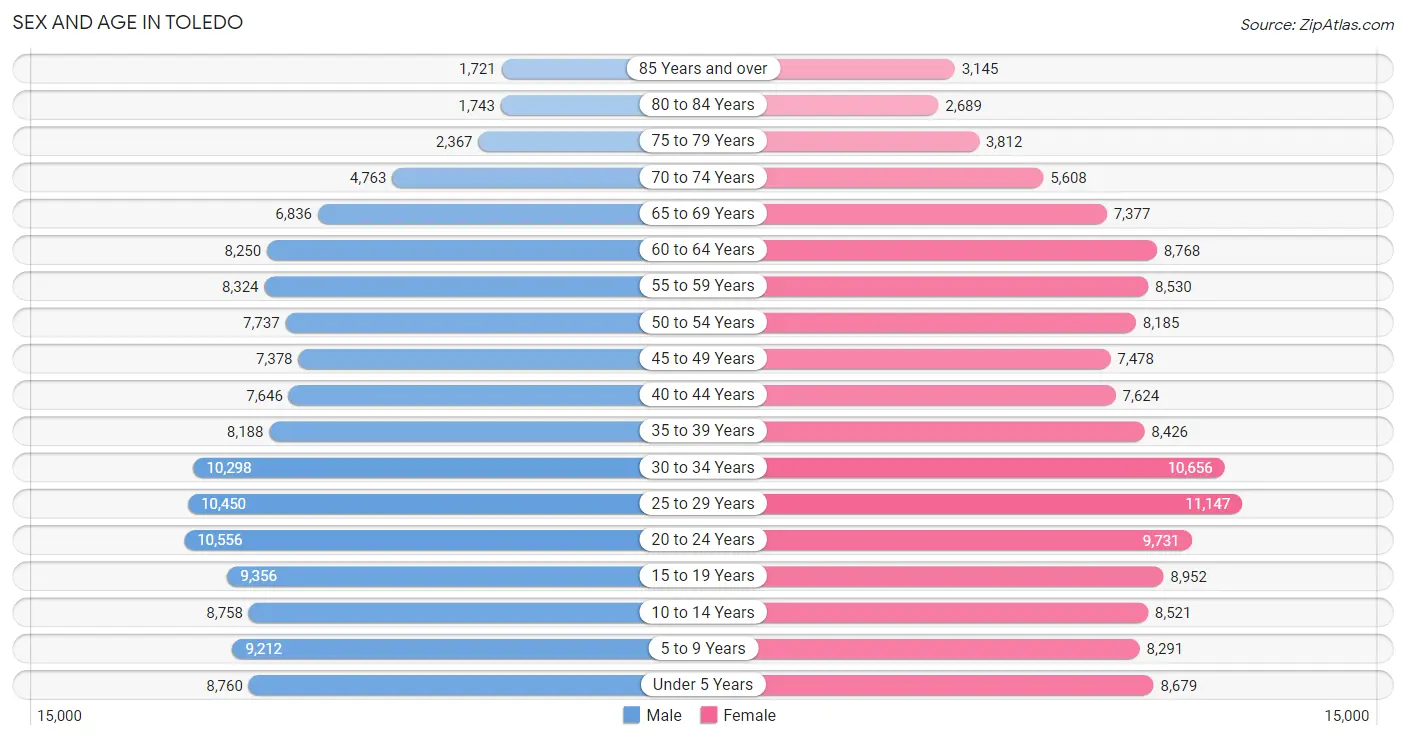
The most populous age groups in Toledo are 20 to 24 Years (10,556 | 8.0%) for men and 25 to 29 Years (11,147 | 8.1%) for women.
| Age Bracket | Male | Female |
| Under 5 Years | 8,760 (6.6%) | 8,679 (6.3%) |
| 5 to 9 Years | 9,212 (7.0%) | 8,291 (6.0%) |
| 10 to 14 Years | 8,758 (6.6%) | 8,521 (6.2%) |
| 15 to 19 Years | 9,356 (7.1%) | 8,952 (6.5%) |
| 20 to 24 Years | 10,556 (8.0%) | 9,731 (7.1%) |
| 25 to 29 Years | 10,450 (7.9%) | 11,147 (8.1%) |
| 30 to 34 Years | 10,298 (7.8%) | 10,656 (7.7%) |
| 35 to 39 Years | 8,188 (6.2%) | 8,426 (6.1%) |
| 40 to 44 Years | 7,646 (5.8%) | 7,624 (5.5%) |
| 45 to 49 Years | 7,378 (5.6%) | 7,478 (5.4%) |
| 50 to 54 Years | 7,737 (5.9%) | 8,185 (5.9%) |
| 55 to 59 Years | 8,324 (6.3%) | 8,530 (6.2%) |
| 60 to 64 Years | 8,250 (6.2%) | 8,768 (6.4%) |
| 65 to 69 Years | 6,836 (5.2%) | 7,377 (5.4%) |
| 70 to 74 Years | 4,763 (3.6%) | 5,608 (4.1%) |
| 75 to 79 Years | 2,367 (1.8%) | 3,812 (2.8%) |
| 80 to 84 Years | 1,743 (1.3%) | 2,689 (1.9%) |
| 85 Years and over | 1,721 (1.3%) | 3,145 (2.3%) |
| Total | 132,343 (100.0%) | 137,619 (100.0%) |
Families and Households in Toledo
Median Family Size in Toledo
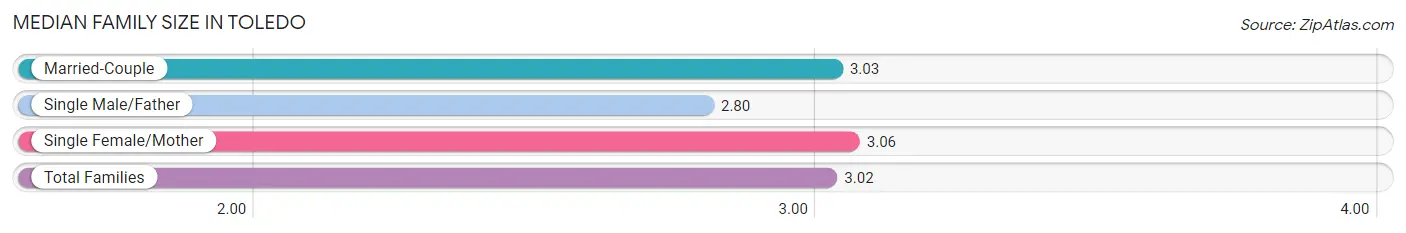
The median family size in Toledo is 3.02 persons per family, with single female/mother families (21,616 | 35.1%) accounting for the largest median family size of 3.06 persons per family. On the other hand, single male/father families (6,711 | 10.9%) represent the smallest median family size with 2.80 persons per family.
| Family Type | # Families | Family Size |
| Married-Couple | 33,261 (54.0%) | 3.03 |
| Single Male/Father | 6,711 (10.9%) | 2.80 |
| Single Female/Mother | 21,616 (35.1%) | 3.06 |
| Total Families | 61,588 (100.0%) | 3.02 |
Median Household Size in Toledo
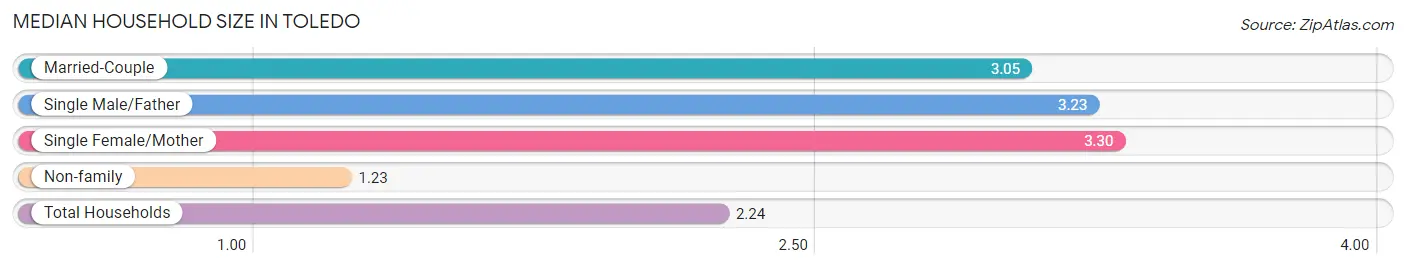
The median household size in Toledo is 2.24 persons per household, with single female/mother households (21,616 | 18.4%) accounting for the largest median household size of 3.3 persons per household. non-family households (56,030 | 47.6%) represent the smallest median household size with 1.23 persons per household.
| Household Type | # Households | Household Size |
| Married-Couple | 33,261 (28.3%) | 3.05 |
| Single Male/Father | 6,711 (5.7%) | 3.23 |
| Single Female/Mother | 21,616 (18.4%) | 3.30 |
| Non-family | 56,030 (47.6%) | 1.23 |
| Total Households | 117,618 (100.0%) | 2.24 |
Household Size by Marriage Status in Toledo
Out of a total of 117,618 households in Toledo, 61,588 (52.4%) are family households, while 56,030 (47.6%) are nonfamily households. The most numerous type of family households are 2-person households, comprising 28,768, and the most common type of nonfamily households are 1-person households, comprising 45,964.
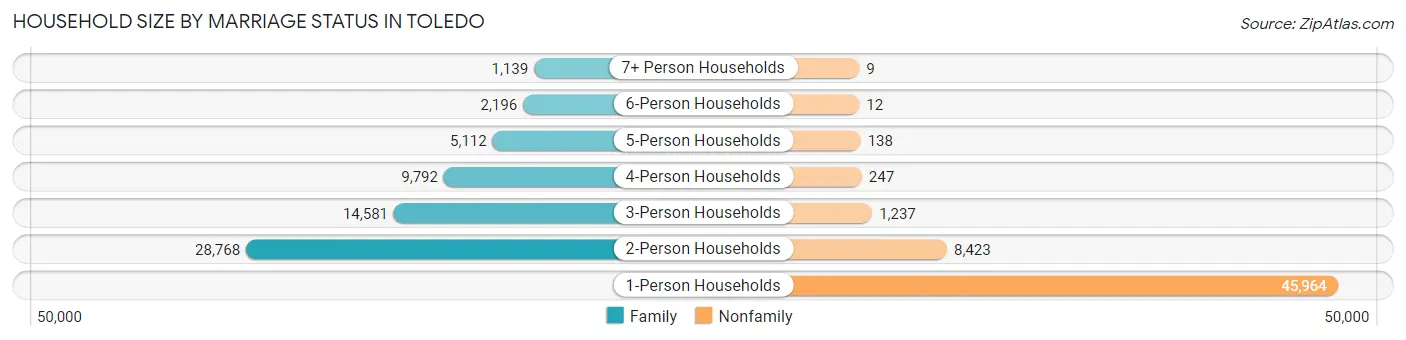
| Household Size | Family Households | Nonfamily Households |
| 1-Person Households | - | 45,964 (39.1%) |
| 2-Person Households | 28,768 (24.5%) | 8,423 (7.2%) |
| 3-Person Households | 14,581 (12.4%) | 1,237 (1.1%) |
| 4-Person Households | 9,792 (8.3%) | 247 (0.2%) |
| 5-Person Households | 5,112 (4.3%) | 138 (0.1%) |
| 6-Person Households | 2,196 (1.9%) | 12 (0.0%) |
| 7+ Person Households | 1,139 (1.0%) | 9 (0.0%) |
| Total | 61,588 (52.4%) | 56,030 (47.6%) |
Female Fertility in Toledo
Fertility by Age in Toledo
Average fertility rate in Toledo is 60.0 births per 1,000 women. Women in the age bracket of 20 to 34 years have the highest fertility rate with 94.0 births per 1,000 women. Women in the age bracket of 20 to 34 years acount for 75.8% of all women with births.
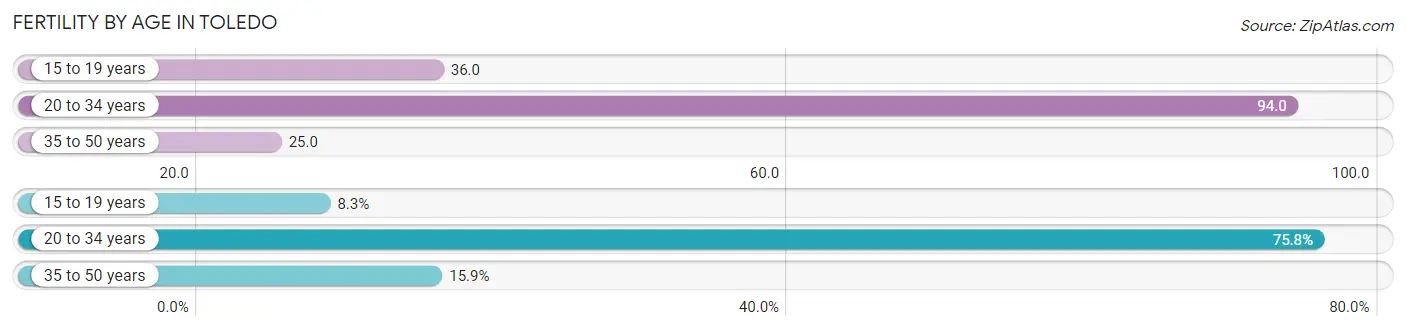
| Age Bracket | Women with Births | Births / 1,000 Women |
| 15 to 19 years | 325 (8.3%) | 36.0 |
| 20 to 34 years | 2,964 (75.8%) | 94.0 |
| 35 to 50 years | 622 (15.9%) | 25.0 |
| Total | 3,911 (100.0%) | 60.0 |
Fertility by Age by Marriage Status in Toledo
38.7% of women with births (3,911) in Toledo are married. The highest percentage of unmarried women with births falls into 15 to 19 years age bracket with 100.0% of them unmarried at the time of birth, while the lowest percentage of unmarried women with births belong to 35 to 50 years age bracket with 29.3% of them unmarried.
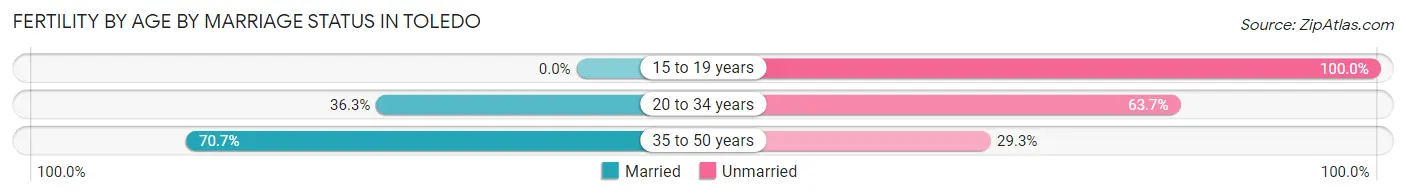
| Age Bracket | Married | Unmarried |
| 15 to 19 years | 0 (0.0%) | 325 (100.0%) |
| 20 to 34 years | 1,076 (36.3%) | 1,888 (63.7%) |
| 35 to 50 years | 440 (70.7%) | 182 (29.3%) |
| Total | 1,514 (38.7%) | 2,397 (61.3%) |
Fertility by Education in Toledo
Average fertility rate in Toledo is 60.0 births per 1,000 women. Women with the education attainment of graduate degree have the highest fertility rate of 82.0 births per 1,000 women, while women with the education attainment of college or associate's degree have the lowest fertility at 50.0 births per 1,000 women. Women with the education attainment of college or associate's degree represent 32.2% of all women with births.
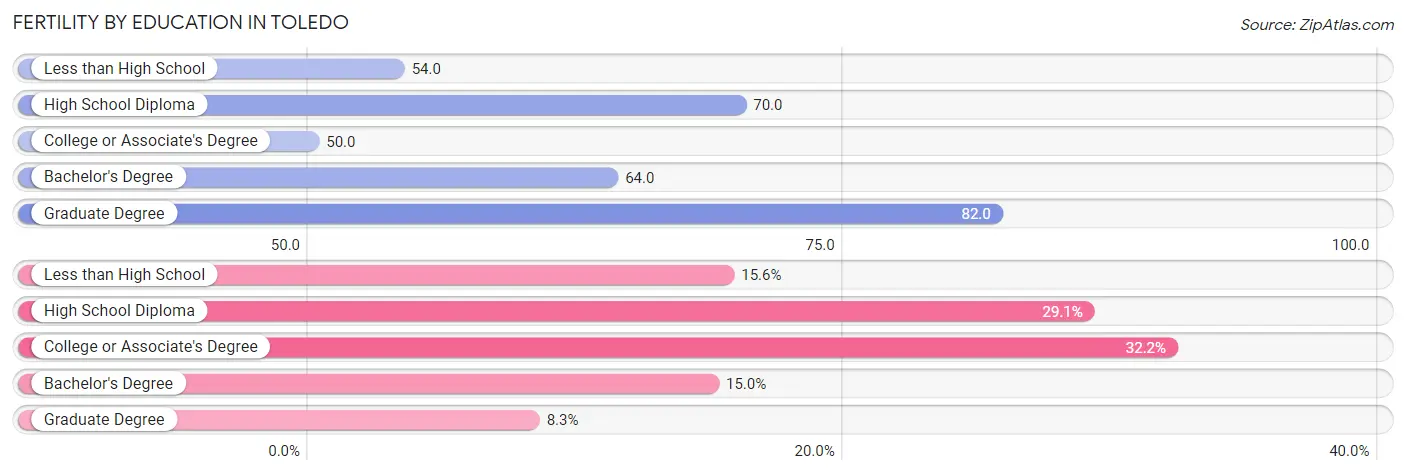
| Educational Attainment | Women with Births | Births / 1,000 Women |
| Less than High School | 608 (15.5%) | 54.0 |
| High School Diploma | 1,136 (29.0%) | 70.0 |
| College or Associate's Degree | 1,258 (32.2%) | 50.0 |
| Bachelor's Degree | 586 (15.0%) | 64.0 |
| Graduate Degree | 323 (8.3%) | 82.0 |
| Total | 3,911 (100.0%) | 60.0 |
Fertility by Education by Marriage Status in Toledo
61.3% of women with births in Toledo are unmarried. Women with the educational attainment of graduate degree are most likely to be married with 85.8% of them married at childbirth, while women with the educational attainment of less than high school are least likely to be married with 94.1% of them unmarried at childbirth.
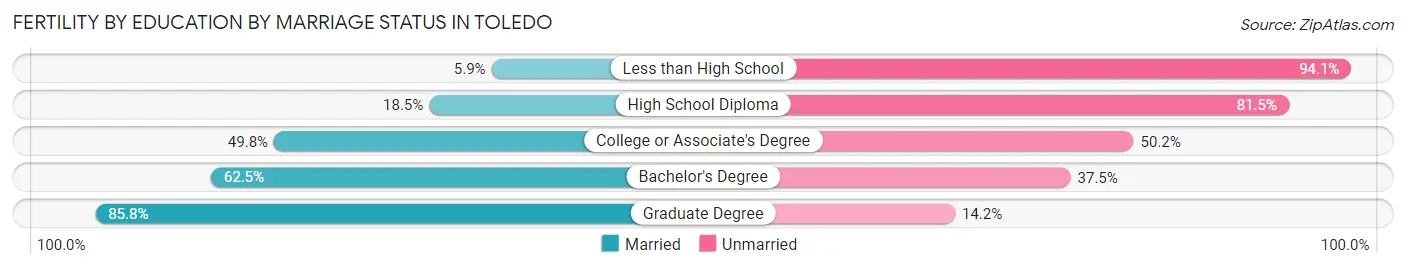
| Educational Attainment | Married | Unmarried |
| Less than High School | 36 (5.9%) | 572 (94.1%) |
| High School Diploma | 210 (18.5%) | 926 (81.5%) |
| College or Associate's Degree | 626 (49.8%) | 632 (50.2%) |
| Bachelor's Degree | 366 (62.5%) | 220 (37.5%) |
| Graduate Degree | 277 (85.8%) | 46 (14.2%) |
| Total | 1,514 (38.7%) | 2,397 (61.3%) |
Employment Characteristics in Toledo
Employment by Class of Employer in Toledo
Among the 118,024 employed individuals in Toledo, private company employees (84,972 | 72.0%), not-for-profit organizations (13,200 | 11.2%), and local government employees (7,875 | 6.7%) make up the most common classes of employment.
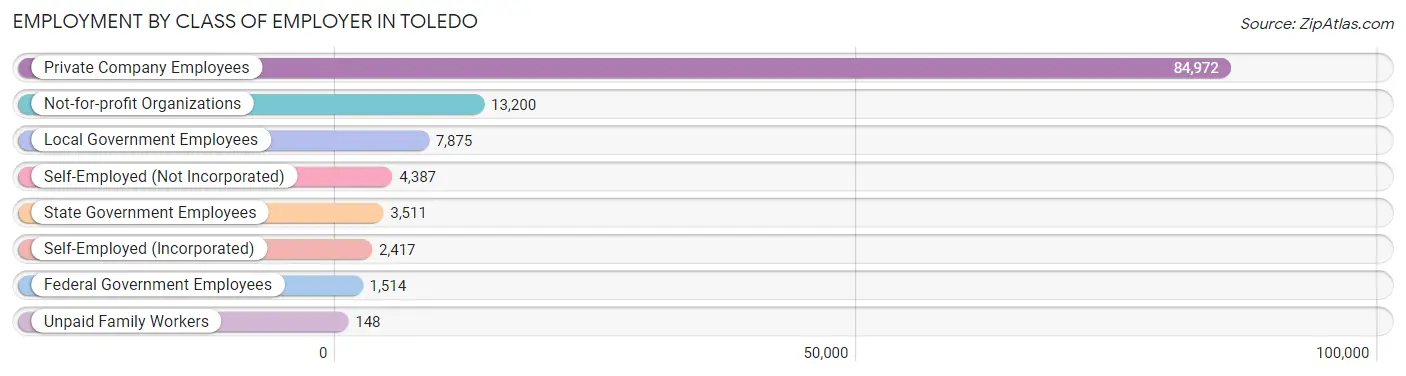
| Employer Class | # Employees | % Employees |
| Private Company Employees | 84,972 | 72.0% |
| Self-Employed (Incorporated) | 2,417 | 2.1% |
| Self-Employed (Not Incorporated) | 4,387 | 3.7% |
| Not-for-profit Organizations | 13,200 | 11.2% |
| Local Government Employees | 7,875 | 6.7% |
| State Government Employees | 3,511 | 3.0% |
| Federal Government Employees | 1,514 | 1.3% |
| Unpaid Family Workers | 148 | 0.1% |
| Total | 118,024 | 100.0% |
Employment Status by Age in Toledo
According to the labor force statistics for Toledo, out of the total population over 16 years of age (214,645), 61.9% or 132,865 individuals are in the labor force, with 8.2% or 10,895 of them unemployed. The age group with the highest labor force participation rate is 35 to 44 years, with 82.5% or 26,304 individuals in the labor force. Within the labor force, the 16 to 19 years age range has the highest percentage of unemployed individuals, with 21.9% or 1,586 of them being unemployed.
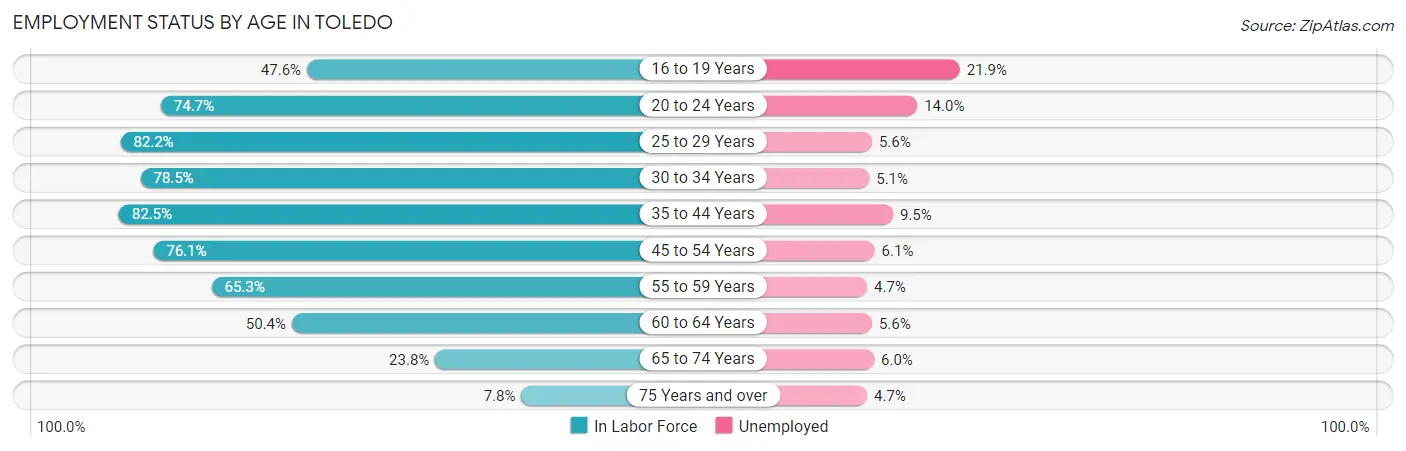
| Age Bracket | In Labor Force | Unemployed |
| 16 to 19 Years | 7,241 (47.6%) | 1,586 (21.9%) |
| 20 to 24 Years | 15,154 (74.7%) | 2,122 (14.0%) |
| 25 to 29 Years | 17,753 (82.2%) | 994 (5.6%) |
| 30 to 34 Years | 16,449 (78.5%) | 839 (5.1%) |
| 35 to 44 Years | 26,304 (82.5%) | 2,499 (9.5%) |
| 45 to 54 Years | 23,422 (76.1%) | 1,429 (6.1%) |
| 55 to 59 Years | 11,006 (65.3%) | 517 (4.7%) |
| 60 to 64 Years | 8,577 (50.4%) | 480 (5.6%) |
| 65 to 74 Years | 5,851 (23.8%) | 351 (6.0%) |
| 75 Years and over | 1,207 (7.8%) | 57 (4.7%) |
| Total | 132,865 (61.9%) | 10,895 (8.2%) |
Employment Status by Educational Attainment in Toledo
According to labor force statistics for Toledo, 74.4% of individuals (103,479) out of the total population between 25 and 64 years of age (139,085) are in the labor force, with 6.5% or 6,726 of them being unemployed. The group with the highest labor force participation rate are those with the educational attainment of bachelor's degree or higher, with 87.2% or 24,668 individuals in the labor force. Within the labor force, individuals with less than high school education have the highest percentage of unemployment, with 16.7% or 1,388 of them being unemployed.

| Educational Attainment | In Labor Force | Unemployed |
| Less than High School | 8,314 (53.7%) | 2,585 (16.7%) |
| High School Diploma | 31,358 (69.9%) | 3,275 (7.3%) |
| College / Associate Degree | 39,152 (77.6%) | 3,078 (6.1%) |
| Bachelor's Degree or higher | 24,668 (87.2%) | 792 (2.8%) |
| Total | 103,479 (74.4%) | 9,041 (6.5%) |
Employment Occupations by Sex in Toledo
Management, Business, Science and Arts Occupations
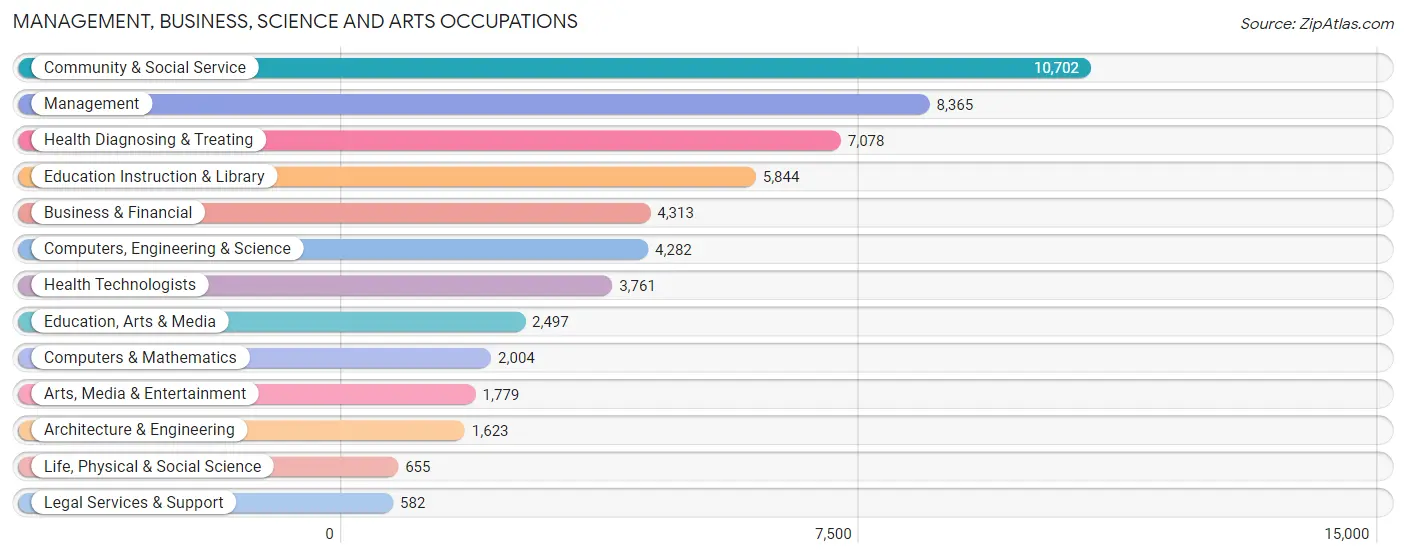
The most common Management, Business, Science and Arts occupations in Toledo are Community & Social Service (10,702 | 8.8%), Management (8,365 | 6.9%), Health Diagnosing & Treating (7,078 | 5.8%), Education Instruction & Library (5,844 | 4.8%), and Business & Financial (4,313 | 3.5%).
Management, Business, Science and Arts Occupations by Sex
Within the Management, Business, Science and Arts occupations in Toledo, the most male-oriented occupations are Architecture & Engineering (83.9%), Computers, Engineering & Science (72.2%), and Computers & Mathematics (72.0%), while the most female-oriented occupations are Health Diagnosing & Treating (82.7%), Health Technologists (81.4%), and Education Instruction & Library (72.2%).
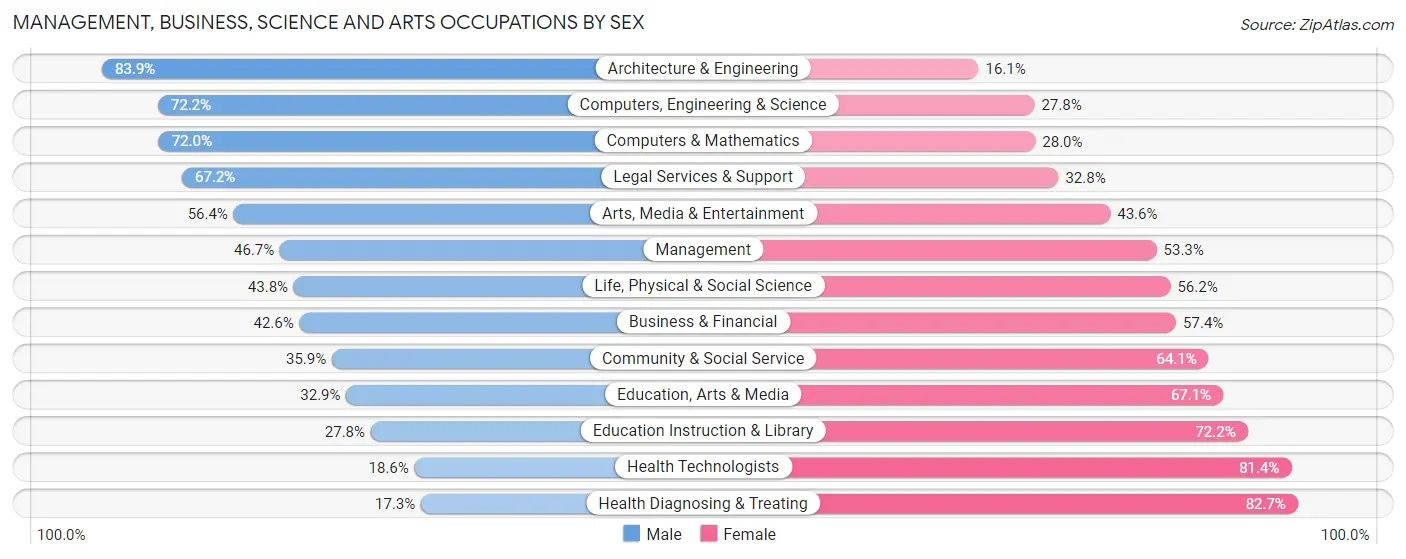
| Occupation | Male | Female |
| Management | 3,907 (46.7%) | 4,458 (53.3%) |
| Business & Financial | 1,839 (42.6%) | 2,474 (57.4%) |
| Computers, Engineering & Science | 3,091 (72.2%) | 1,191 (27.8%) |
| Computers & Mathematics | 1,443 (72.0%) | 561 (28.0%) |
| Architecture & Engineering | 1,361 (83.9%) | 262 (16.1%) |
| Life, Physical & Social Science | 287 (43.8%) | 368 (56.2%) |
| Community & Social Service | 3,838 (35.9%) | 6,864 (64.1%) |
| Education, Arts & Media | 821 (32.9%) | 1,676 (67.1%) |
| Legal Services & Support | 391 (67.2%) | 191 (32.8%) |
| Education Instruction & Library | 1,623 (27.8%) | 4,221 (72.2%) |
| Arts, Media & Entertainment | 1,003 (56.4%) | 776 (43.6%) |
| Health Diagnosing & Treating | 1,224 (17.3%) | 5,854 (82.7%) |
| Health Technologists | 701 (18.6%) | 3,060 (81.4%) |
| Total (Category) | 13,899 (40.0%) | 20,841 (60.0%) |
| Total (Overall) | 61,490 (50.5%) | 60,344 (49.5%) |
Services Occupations
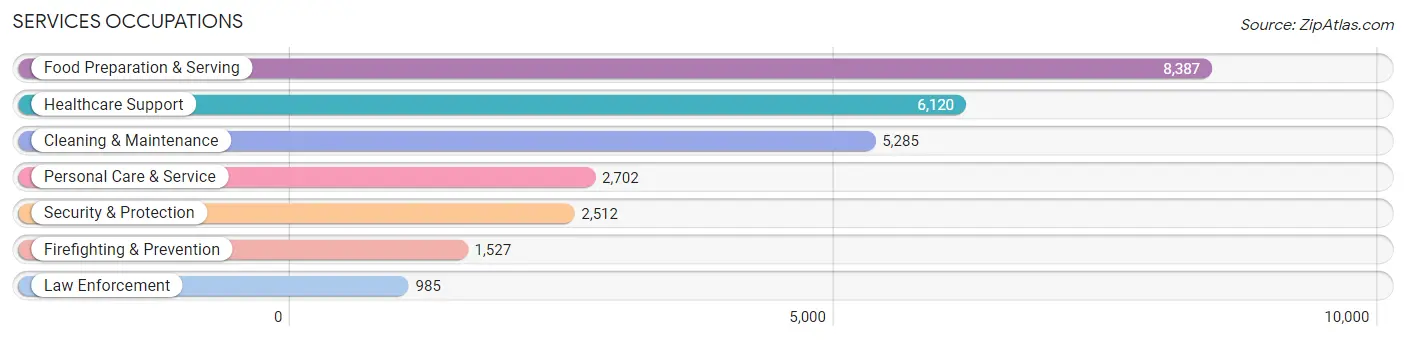
The most common Services occupations in Toledo are Food Preparation & Serving (8,387 | 6.9%), Healthcare Support (6,120 | 5.0%), Cleaning & Maintenance (5,285 | 4.3%), Personal Care & Service (2,702 | 2.2%), and Security & Protection (2,512 | 2.1%).
Services Occupations by Sex
Within the Services occupations in Toledo, the most male-oriented occupations are Law Enforcement (78.6%), Security & Protection (76.3%), and Firefighting & Prevention (74.9%), while the most female-oriented occupations are Healthcare Support (90.5%), Personal Care & Service (73.1%), and Food Preparation & Serving (55.1%).
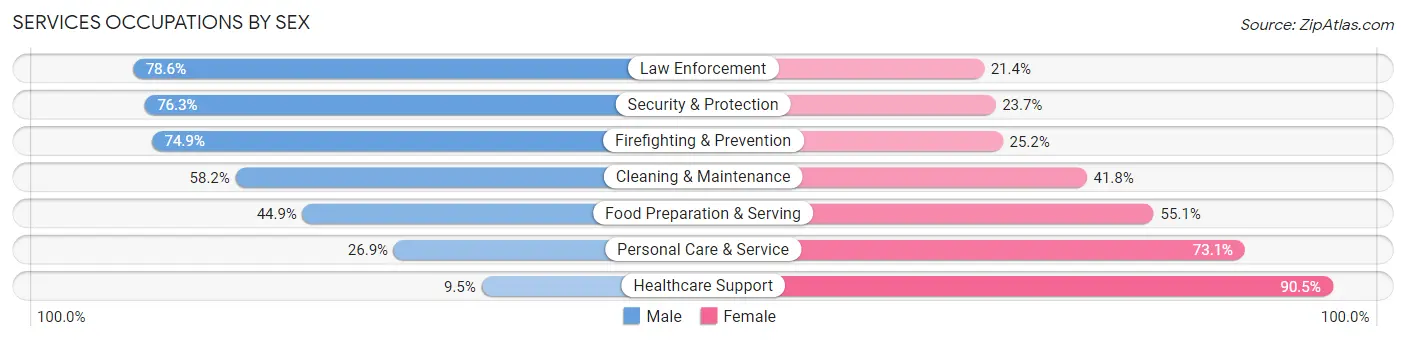
| Occupation | Male | Female |
| Healthcare Support | 582 (9.5%) | 5,538 (90.5%) |
| Security & Protection | 1,917 (76.3%) | 595 (23.7%) |
| Firefighting & Prevention | 1,143 (74.9%) | 384 (25.2%) |
| Law Enforcement | 774 (78.6%) | 211 (21.4%) |
| Food Preparation & Serving | 3,768 (44.9%) | 4,619 (55.1%) |
| Cleaning & Maintenance | 3,077 (58.2%) | 2,208 (41.8%) |
| Personal Care & Service | 726 (26.9%) | 1,976 (73.1%) |
| Total (Category) | 10,070 (40.3%) | 14,936 (59.7%) |
| Total (Overall) | 61,490 (50.5%) | 60,344 (49.5%) |
Sales and Office Occupations
The most common Sales and Office occupations in Toledo are Office & Administration (14,009 | 11.5%), and Sales & Related (11,658 | 9.6%).

Sales and Office Occupations by Sex

| Occupation | Male | Female |
| Sales & Related | 5,577 (47.8%) | 6,081 (52.2%) |
| Office & Administration | 3,493 (24.9%) | 10,516 (75.1%) |
| Total (Category) | 9,070 (35.3%) | 16,597 (64.7%) |
| Total (Overall) | 61,490 (50.5%) | 60,344 (49.5%) |
Natural Resources, Construction and Maintenance Occupations
The most common Natural Resources, Construction and Maintenance occupations in Toledo are Construction & Extraction (5,068 | 4.2%), Installation, Maintenance & Repair (3,447 | 2.8%), and Farming, Fishing & Forestry (159 | 0.1%).

Natural Resources, Construction and Maintenance Occupations by Sex
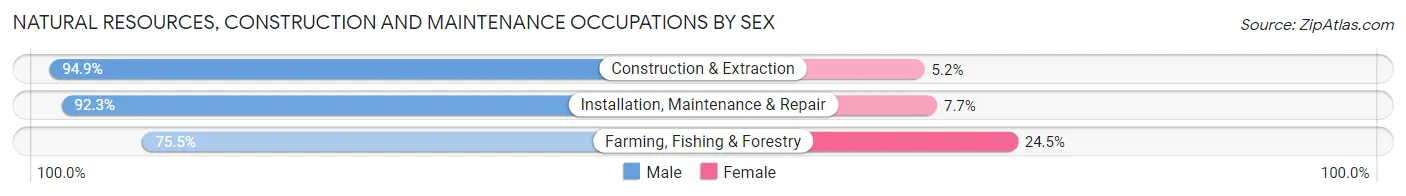
| Occupation | Male | Female |
| Farming, Fishing & Forestry | 120 (75.5%) | 39 (24.5%) |
| Construction & Extraction | 4,807 (94.9%) | 261 (5.1%) |
| Installation, Maintenance & Repair | 3,181 (92.3%) | 266 (7.7%) |
| Total (Category) | 8,108 (93.5%) | 566 (6.5%) |
| Total (Overall) | 61,490 (50.5%) | 60,344 (49.5%) |
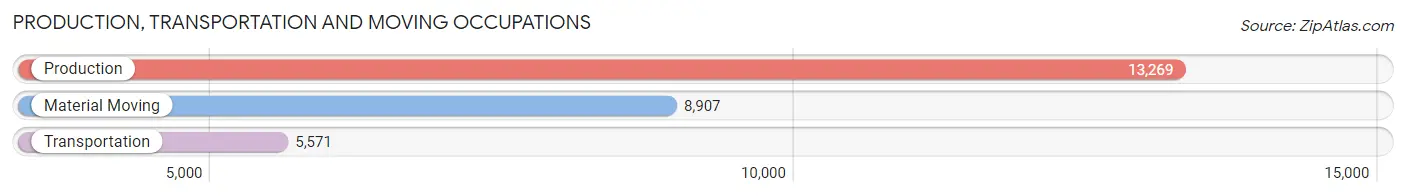
Production, Transportation and Moving Occupations
The most common Production, Transportation and Moving occupations in Toledo are Production (13,269 | 10.9%), Material Moving (8,907 | 7.3%), and Transportation (5,571 | 4.6%).
Production, Transportation and Moving Occupations by Sex
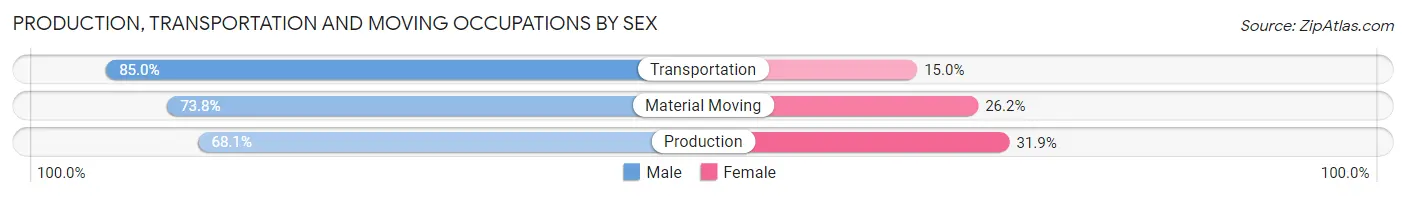
| Occupation | Male | Female |
| Production | 9,032 (68.1%) | 4,237 (31.9%) |
| Transportation | 4,736 (85.0%) | 835 (15.0%) |
| Material Moving | 6,575 (73.8%) | 2,332 (26.2%) |
| Total (Category) | 20,343 (73.3%) | 7,404 (26.7%) |
| Total (Overall) | 61,490 (50.5%) | 60,344 (49.5%) |
Employment Industries by Sex in Toledo
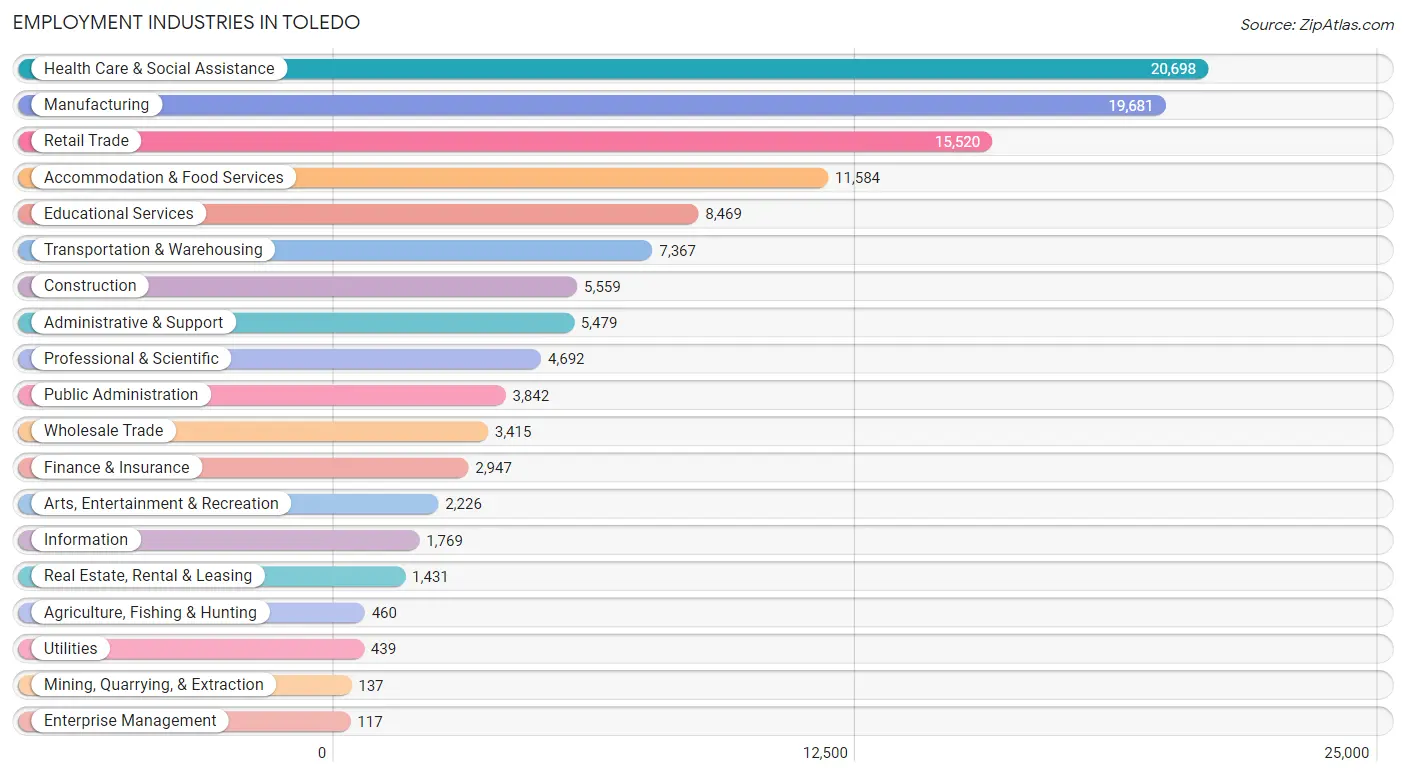
Employment Industries in Toledo
The major employment industries in Toledo include Health Care & Social Assistance (20,698 | 17.0%), Manufacturing (19,681 | 16.2%), Retail Trade (15,520 | 12.7%), Accommodation & Food Services (11,584 | 9.5%), and Educational Services (8,469 | 7.0%).
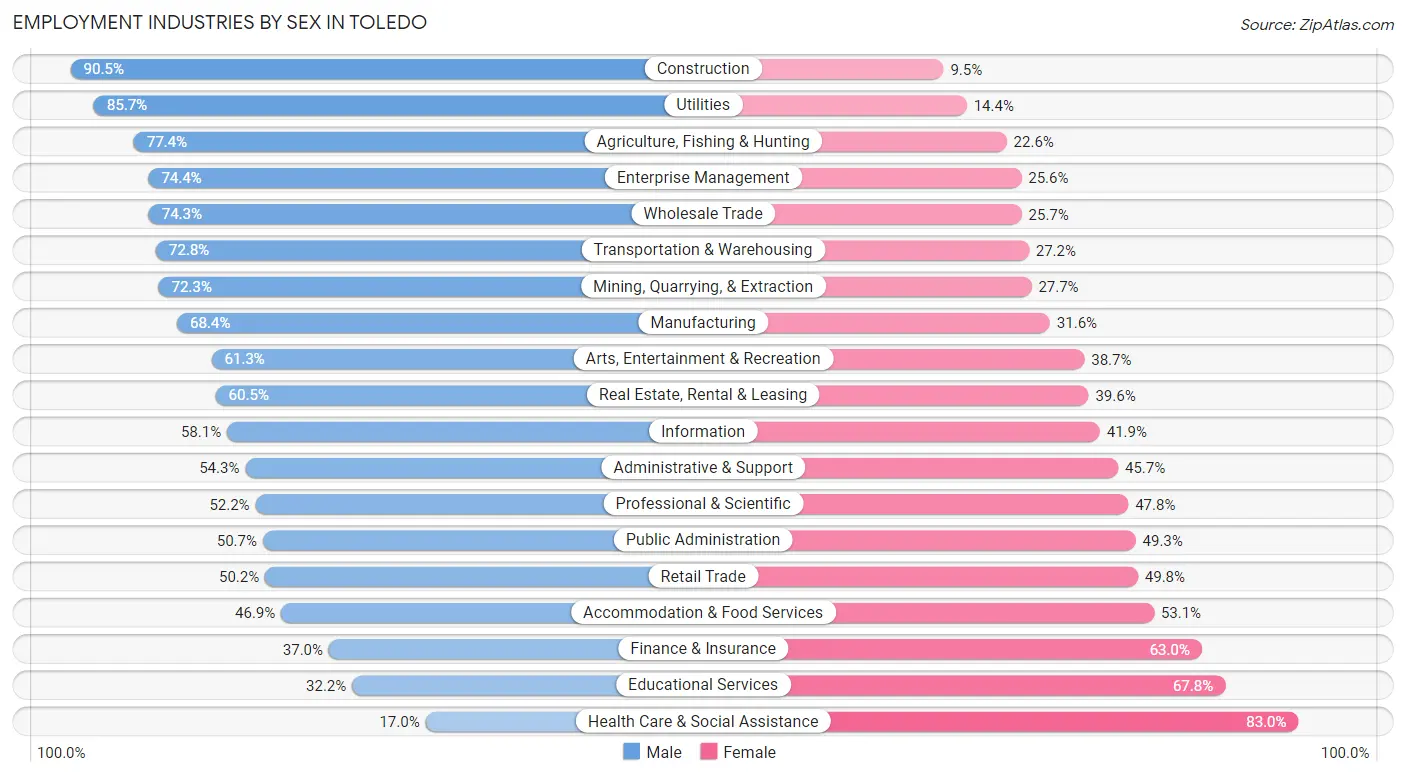
Employment Industries by Sex in Toledo
The Toledo industries that see more men than women are Construction (90.5%), Utilities (85.7%), and Agriculture, Fishing & Hunting (77.4%), whereas the industries that tend to have a higher number of women are Health Care & Social Assistance (83.0%), Educational Services (67.8%), and Finance & Insurance (63.0%).
| Industry | Male | Female |
| Agriculture, Fishing & Hunting | 356 (77.4%) | 104 (22.6%) |
| Mining, Quarrying, & Extraction | 99 (72.3%) | 38 (27.7%) |
| Construction | 5,029 (90.5%) | 530 (9.5%) |
| Manufacturing | 13,469 (68.4%) | 6,212 (31.6%) |
| Wholesale Trade | 2,537 (74.3%) | 878 (25.7%) |
| Retail Trade | 7,796 (50.2%) | 7,724 (49.8%) |
| Transportation & Warehousing | 5,364 (72.8%) | 2,003 (27.2%) |
| Utilities | 376 (85.7%) | 63 (14.3%) |
| Information | 1,028 (58.1%) | 741 (41.9%) |
| Finance & Insurance | 1,091 (37.0%) | 1,856 (63.0%) |
| Real Estate, Rental & Leasing | 865 (60.5%) | 566 (39.6%) |
| Professional & Scientific | 2,450 (52.2%) | 2,242 (47.8%) |
| Enterprise Management | 87 (74.4%) | 30 (25.6%) |
| Administrative & Support | 2,977 (54.3%) | 2,502 (45.7%) |
| Educational Services | 2,728 (32.2%) | 5,741 (67.8%) |
| Health Care & Social Assistance | 3,523 (17.0%) | 17,175 (83.0%) |
| Arts, Entertainment & Recreation | 1,365 (61.3%) | 861 (38.7%) |
| Accommodation & Food Services | 5,433 (46.9%) | 6,151 (53.1%) |
| Public Administration | 1,948 (50.7%) | 1,894 (49.3%) |
| Total | 61,490 (50.5%) | 60,344 (49.5%) |
Education in Toledo
School Enrollment in Toledo
The most common levels of schooling among the 66,697 students in Toledo are college / undergraduate (15,418 | 23.1%), high school (13,946 | 20.9%), and middle school (13,714 | 20.6%).
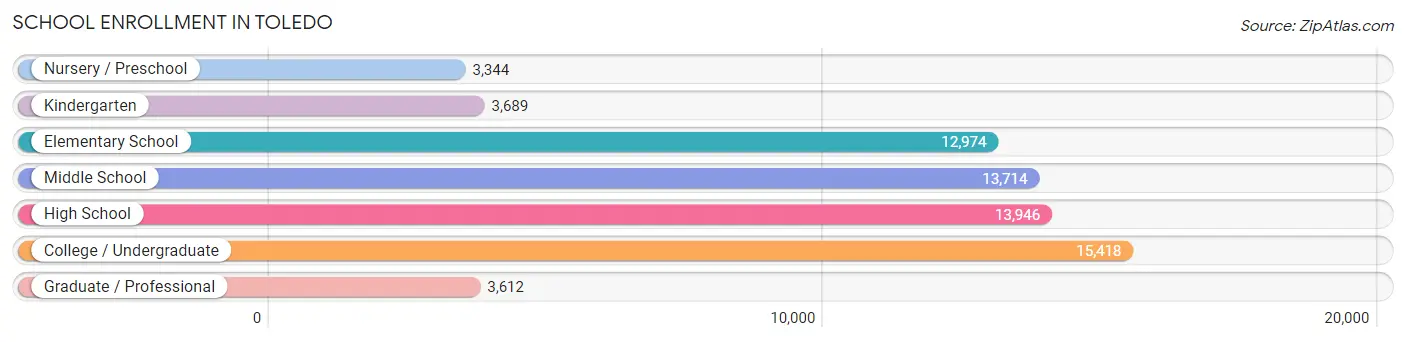
| School Level | # Students | % Students |
| Nursery / Preschool | 3,344 | 5.0% |
| Kindergarten | 3,689 | 5.5% |
| Elementary School | 12,974 | 19.5% |
| Middle School | 13,714 | 20.6% |
| High School | 13,946 | 20.9% |
| College / Undergraduate | 15,418 | 23.1% |
| Graduate / Professional | 3,612 | 5.4% |
| Total | 66,697 | 100.0% |
School Enrollment by Age by Funding Source in Toledo
Out of a total of 66,697 students who are enrolled in schools in Toledo, 10,205 (15.3%) attend a private institution, while the remaining 56,492 (84.7%) are enrolled in public schools. The age group of 3 to 4 year olds has the highest likelihood of being enrolled in private schools, with 818 (35.0% in the age bracket) enrolled. Conversely, the age group of 18 to 19 year olds has the lowest likelihood of being enrolled in a private school, with 5,188 (93.8% in the age bracket) attending a public institution.
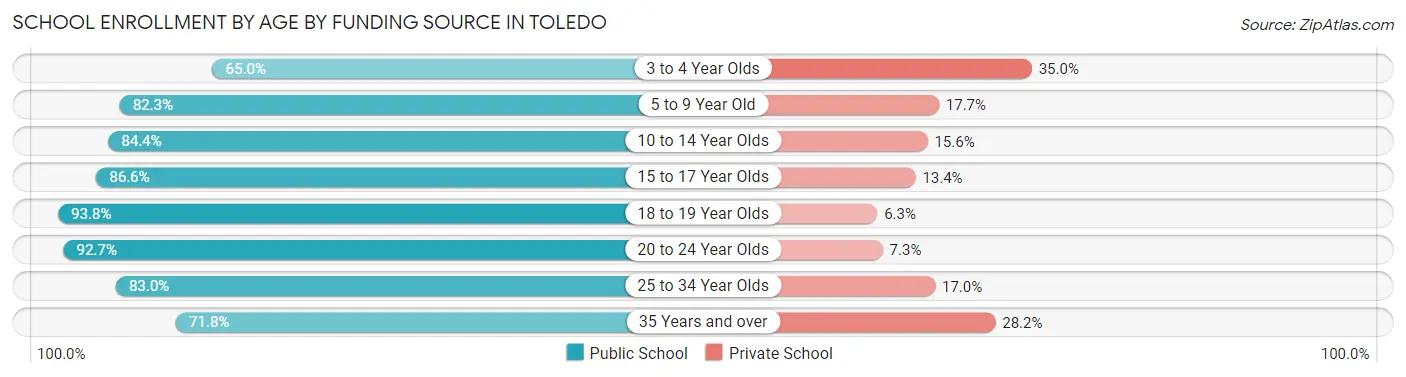
| Age Bracket | Public School | Private School |
| 3 to 4 Year Olds | 1,517 (65.0%) | 818 (35.0%) |
| 5 to 9 Year Old | 13,129 (82.3%) | 2,829 (17.7%) |
| 10 to 14 Year Olds | 14,200 (84.4%) | 2,626 (15.6%) |
| 15 to 17 Year Olds | 8,229 (86.6%) | 1,270 (13.4%) |
| 18 to 19 Year Olds | 5,188 (93.8%) | 346 (6.2%) |
| 20 to 24 Year Olds | 7,937 (92.7%) | 621 (7.3%) |
| 25 to 34 Year Olds | 4,071 (83.0%) | 835 (17.0%) |
| 35 Years and over | 2,211 (71.8%) | 870 (28.2%) |
| Total | 56,492 (84.7%) | 10,205 (15.3%) |
Educational Attainment by Field of Study in Toledo
Business (6,687 | 16.9%), education (5,656 | 14.3%), science & technology (5,645 | 14.2%), arts & humanities (3,146 | 7.9%), and liberal arts & history (2,292 | 5.8%) are the most common fields of study among 39,666 individuals in Toledo who have obtained a bachelor's degree or higher.
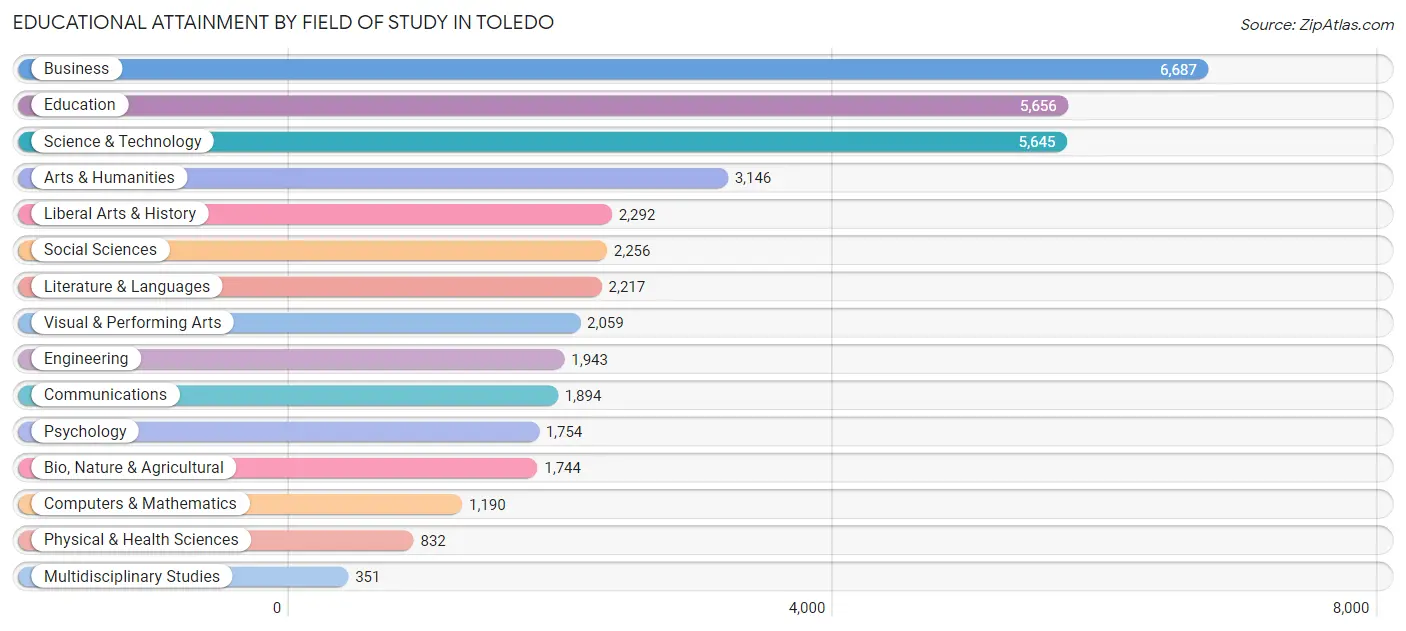
| Field of Study | # Graduates | % Graduates |
| Computers & Mathematics | 1,190 | 3.0% |
| Bio, Nature & Agricultural | 1,744 | 4.4% |
| Physical & Health Sciences | 832 | 2.1% |
| Psychology | 1,754 | 4.4% |
| Social Sciences | 2,256 | 5.7% |
| Engineering | 1,943 | 4.9% |
| Multidisciplinary Studies | 351 | 0.9% |
| Science & Technology | 5,645 | 14.2% |
| Business | 6,687 | 16.9% |
| Education | 5,656 | 14.3% |
| Literature & Languages | 2,217 | 5.6% |
| Liberal Arts & History | 2,292 | 5.8% |
| Visual & Performing Arts | 2,059 | 5.2% |
| Communications | 1,894 | 4.8% |
| Arts & Humanities | 3,146 | 7.9% |
| Total | 39,666 | 100.0% |
Transportation & Commute in Toledo
Vehicle Availability by Sex in Toledo
The most prevalent vehicle ownership categories in Toledo are males with 2 vehicles (26,252, accounting for 43.9%) and females with 2 vehicles (24,001, making up 45.9%).
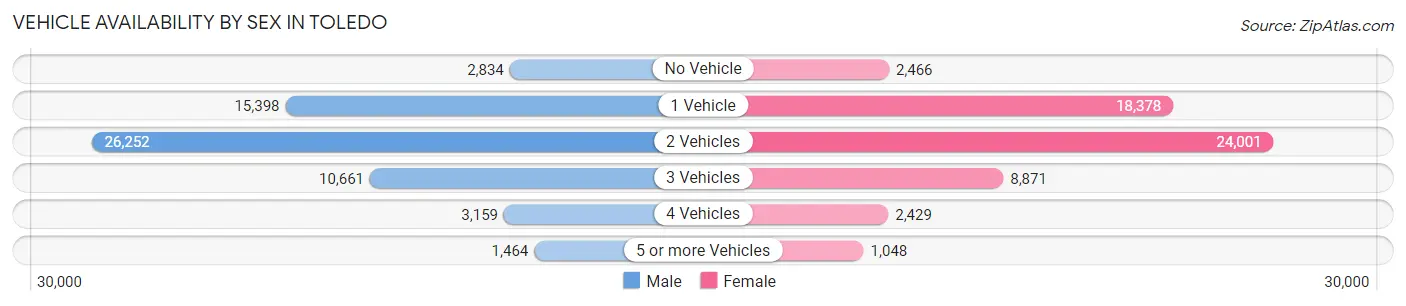
| Vehicles Available | Male | Female |
| No Vehicle | 2,834 (4.7%) | 2,466 (4.3%) |
| 1 Vehicle | 15,398 (25.8%) | 18,378 (32.1%) |
| 2 Vehicles | 26,252 (43.9%) | 24,001 (42.0%) |
| 3 Vehicles | 10,661 (17.8%) | 8,871 (15.5%) |
| 4 Vehicles | 3,159 (5.3%) | 2,429 (4.3%) |
| 5 or more Vehicles | 1,464 (2.5%) | 1,048 (1.8%) |
| Total | 59,768 (100.0%) | 57,193 (100.0%) |
Commute Time in Toledo
The most frequently occuring commute durations in Toledo are 15 to 19 minutes (25,279 commuters, 22.5%), 20 to 24 minutes (22,353 commuters, 19.9%), and 10 to 14 minutes (21,418 commuters, 19.0%).
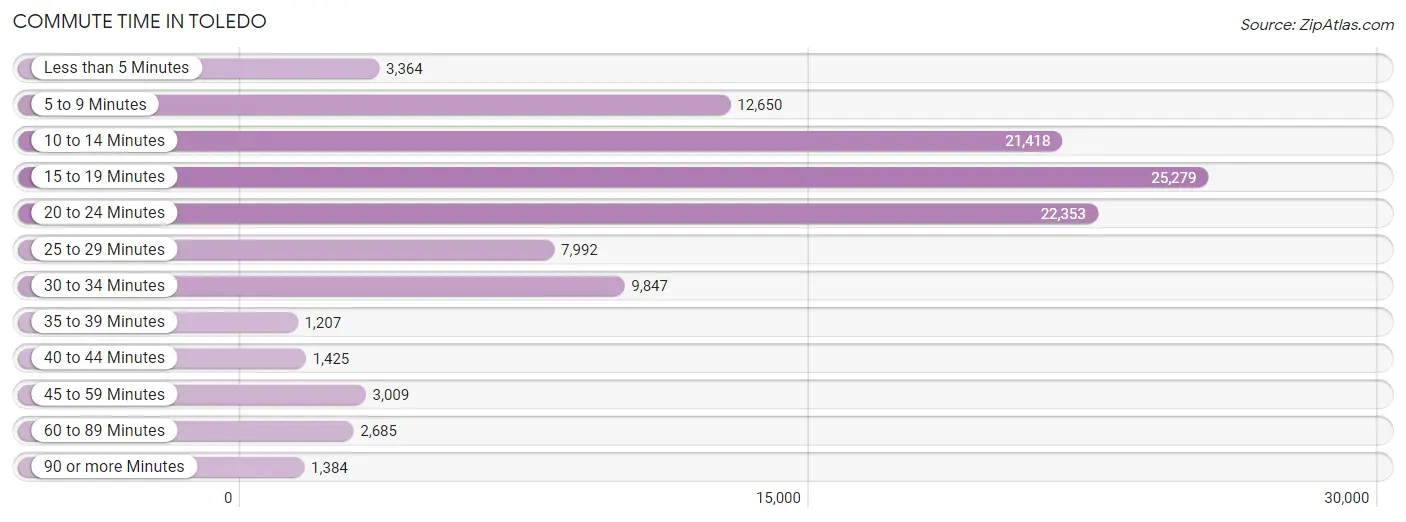
| Commute Time | # Commuters | % Commuters |
| Less than 5 Minutes | 3,364 | 3.0% |
| 5 to 9 Minutes | 12,650 | 11.2% |
| 10 to 14 Minutes | 21,418 | 19.0% |
| 15 to 19 Minutes | 25,279 | 22.5% |
| 20 to 24 Minutes | 22,353 | 19.9% |
| 25 to 29 Minutes | 7,992 | 7.1% |
| 30 to 34 Minutes | 9,847 | 8.7% |
| 35 to 39 Minutes | 1,207 | 1.1% |
| 40 to 44 Minutes | 1,425 | 1.3% |
| 45 to 59 Minutes | 3,009 | 2.7% |
| 60 to 89 Minutes | 2,685 | 2.4% |
| 90 or more Minutes | 1,384 | 1.2% |
Commute Time by Sex in Toledo
The most common commute times in Toledo are 15 to 19 minutes (12,907 commuters, 22.4%) for males and 15 to 19 minutes (12,372 commuters, 22.5%) for females.
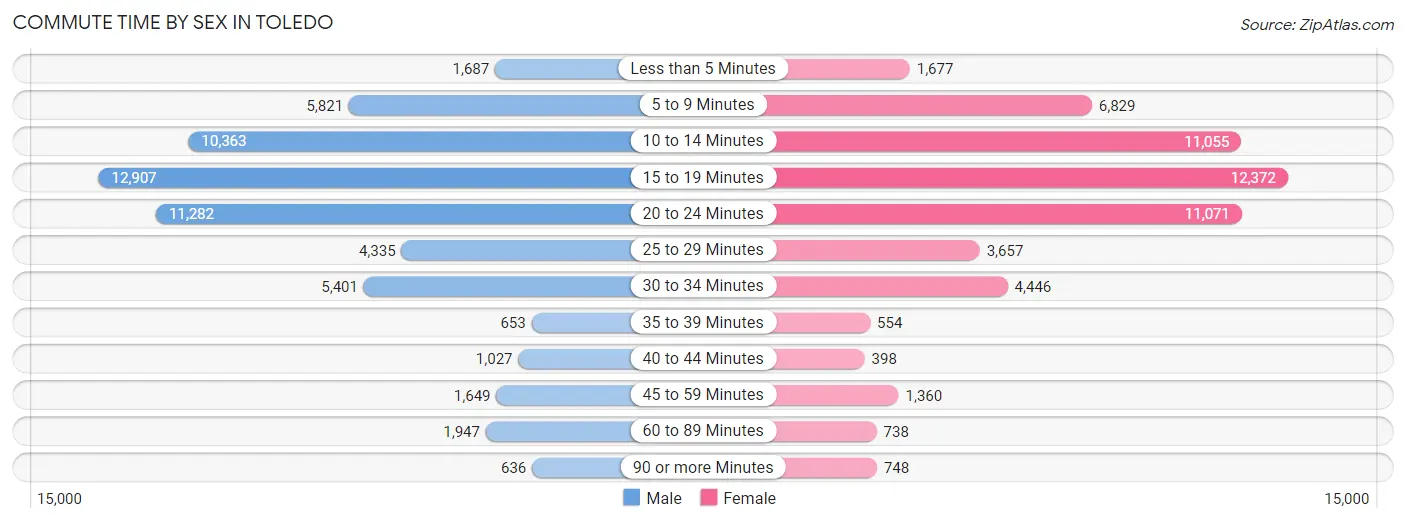
| Commute Time | Male | Female |
| Less than 5 Minutes | 1,687 (2.9%) | 1,677 (3.0%) |
| 5 to 9 Minutes | 5,821 (10.1%) | 6,829 (12.4%) |
| 10 to 14 Minutes | 10,363 (18.0%) | 11,055 (20.1%) |
| 15 to 19 Minutes | 12,907 (22.4%) | 12,372 (22.5%) |
| 20 to 24 Minutes | 11,282 (19.6%) | 11,071 (20.2%) |
| 25 to 29 Minutes | 4,335 (7.5%) | 3,657 (6.7%) |
| 30 to 34 Minutes | 5,401 (9.4%) | 4,446 (8.1%) |
| 35 to 39 Minutes | 653 (1.1%) | 554 (1.0%) |
| 40 to 44 Minutes | 1,027 (1.8%) | 398 (0.7%) |
| 45 to 59 Minutes | 1,649 (2.9%) | 1,360 (2.5%) |
| 60 to 89 Minutes | 1,947 (3.4%) | 738 (1.3%) |
| 90 or more Minutes | 636 (1.1%) | 748 (1.4%) |
Time of Departure to Work by Sex in Toledo
The most frequent times of departure to work in Toledo are 4:00 PM to 11:59 PM (7,884, 13.7%) for males and 4:00 PM to 11:59 PM (7,189, 13.1%) for females.
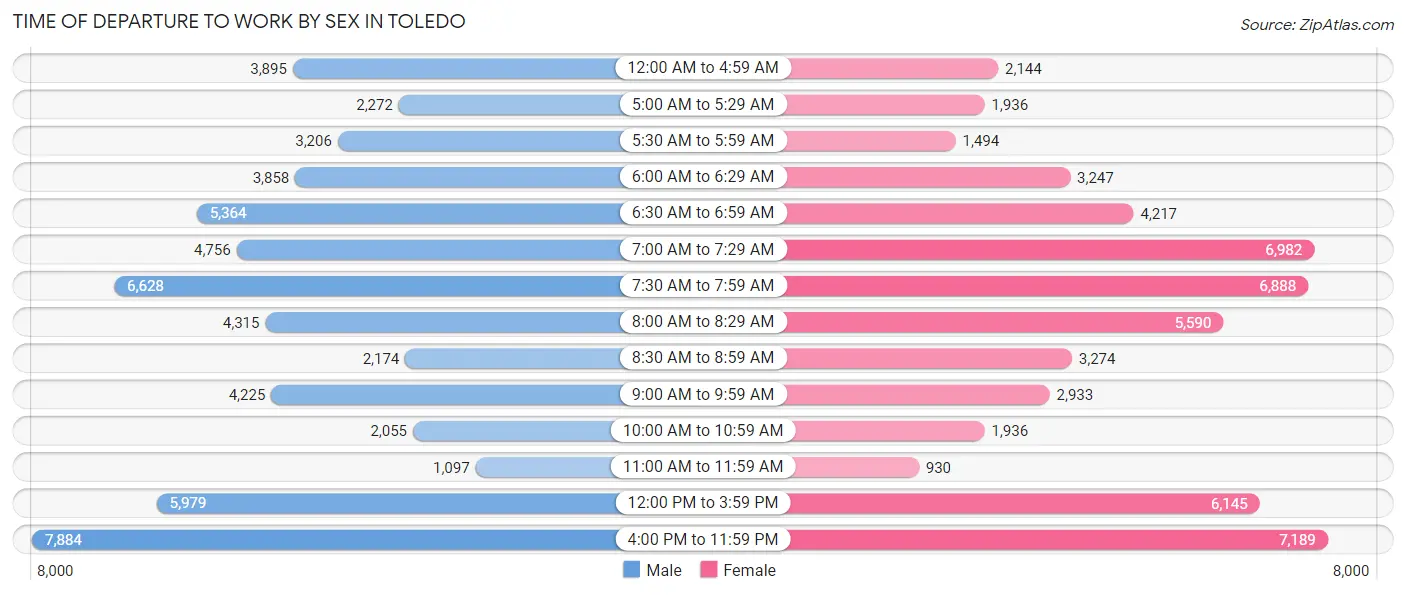
| Time of Departure | Male | Female |
| 12:00 AM to 4:59 AM | 3,895 (6.8%) | 2,144 (3.9%) |
| 5:00 AM to 5:29 AM | 2,272 (3.9%) | 1,936 (3.5%) |
| 5:30 AM to 5:59 AM | 3,206 (5.6%) | 1,494 (2.7%) |
| 6:00 AM to 6:29 AM | 3,858 (6.7%) | 3,247 (5.9%) |
| 6:30 AM to 6:59 AM | 5,364 (9.3%) | 4,217 (7.7%) |
| 7:00 AM to 7:29 AM | 4,756 (8.2%) | 6,982 (12.7%) |
| 7:30 AM to 7:59 AM | 6,628 (11.5%) | 6,888 (12.6%) |
| 8:00 AM to 8:29 AM | 4,315 (7.5%) | 5,590 (10.2%) |
| 8:30 AM to 8:59 AM | 2,174 (3.8%) | 3,274 (6.0%) |
| 9:00 AM to 9:59 AM | 4,225 (7.3%) | 2,933 (5.3%) |
| 10:00 AM to 10:59 AM | 2,055 (3.6%) | 1,936 (3.5%) |
| 11:00 AM to 11:59 AM | 1,097 (1.9%) | 930 (1.7%) |
| 12:00 PM to 3:59 PM | 5,979 (10.4%) | 6,145 (11.2%) |
| 4:00 PM to 11:59 PM | 7,884 (13.7%) | 7,189 (13.1%) |
| Total | 57,708 (100.0%) | 54,905 (100.0%) |
Housing Occupancy in Toledo
Occupancy by Ownership in Toledo
Of the total 117,618 dwellings in Toledo, owner-occupied units account for 61,663 (52.4%), while renter-occupied units make up 55,955 (47.6%).
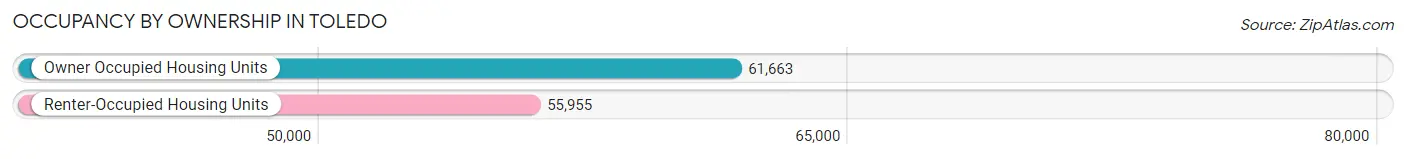
| Occupancy | # Housing Units | % Housing Units |
| Owner Occupied Housing Units | 61,663 | 52.4% |
| Renter-Occupied Housing Units | 55,955 | 47.6% |
| Total Occupied Housing Units | 117,618 | 100.0% |
Occupancy by Household Size in Toledo
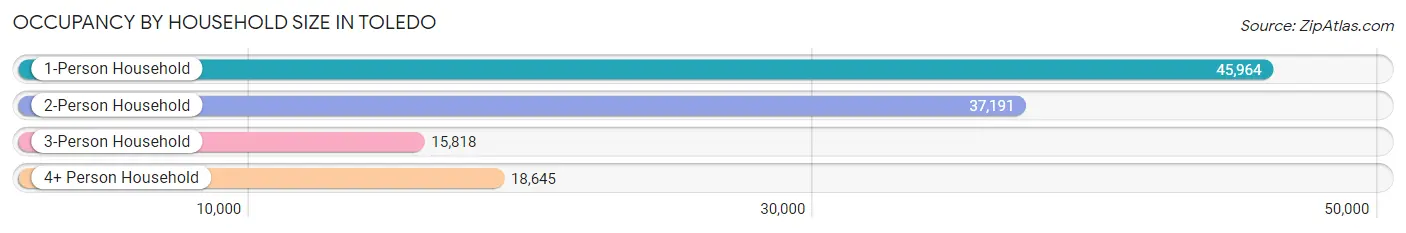
| Household Size | # Housing Units | % Housing Units |
| 1-Person Household | 45,964 | 39.1% |
| 2-Person Household | 37,191 | 31.6% |
| 3-Person Household | 15,818 | 13.5% |
| 4+ Person Household | 18,645 | 15.9% |
| Total Housing Units | 117,618 | 100.0% |
Occupancy by Ownership by Household Size in Toledo
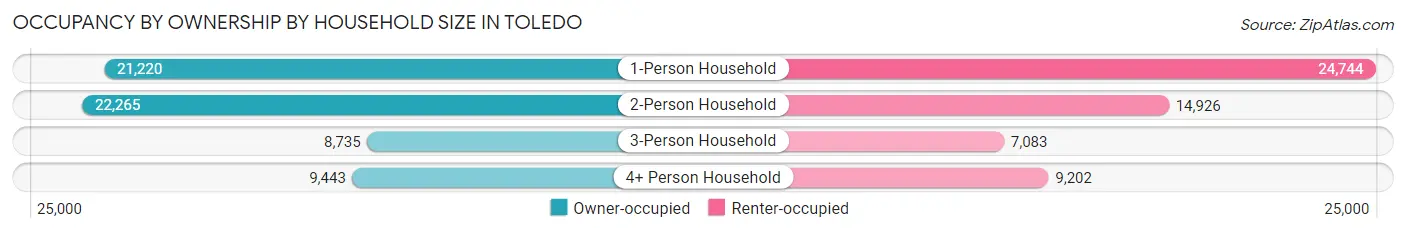
| Household Size | Owner-occupied | Renter-occupied |
| 1-Person Household | 21,220 (46.2%) | 24,744 (53.8%) |
| 2-Person Household | 22,265 (59.9%) | 14,926 (40.1%) |
| 3-Person Household | 8,735 (55.2%) | 7,083 (44.8%) |
| 4+ Person Household | 9,443 (50.6%) | 9,202 (49.3%) |
| Total Housing Units | 61,663 (52.4%) | 55,955 (47.6%) |
Occupancy by Educational Attainment in Toledo
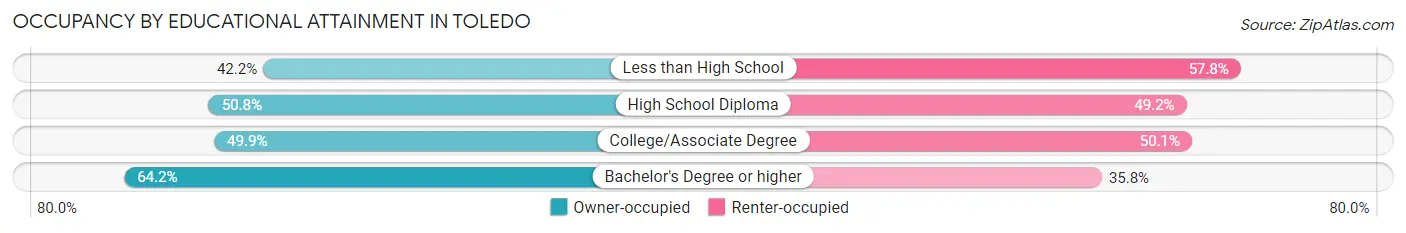
| Household Size | Owner-occupied | Renter-occupied |
| Less than High School | 5,151 (42.2%) | 7,057 (57.8%) |
| High School Diploma | 17,700 (50.8%) | 17,149 (49.2%) |
| College/Associate Degree | 22,690 (49.9%) | 22,754 (50.1%) |
| Bachelor's Degree or higher | 16,122 (64.2%) | 8,995 (35.8%) |
Occupancy by Age of Householder in Toledo
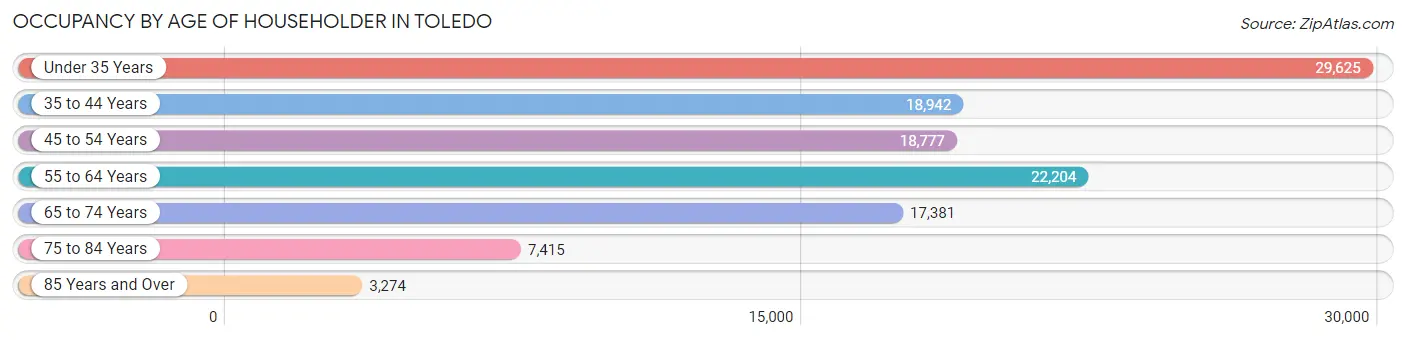
| Age Bracket | # Households | % Households |
| Under 35 Years | 29,625 | 25.2% |
| 35 to 44 Years | 18,942 | 16.1% |
| 45 to 54 Years | 18,777 | 16.0% |
| 55 to 64 Years | 22,204 | 18.9% |
| 65 to 74 Years | 17,381 | 14.8% |
| 75 to 84 Years | 7,415 | 6.3% |
| 85 Years and Over | 3,274 | 2.8% |
| Total | 117,618 | 100.0% |
Housing Finances in Toledo
Median Income by Occupancy in Toledo
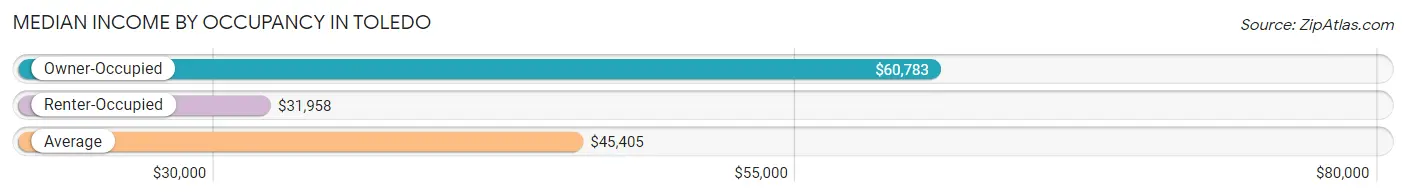
| Occupancy Type | # Households | Median Income |
| Owner-Occupied | 61,663 (52.4%) | $60,783 |
| Renter-Occupied | 55,955 (47.6%) | $31,958 |
| Average | 117,618 (100.0%) | $45,405 |
Occupancy by Householder Income Bracket in Toledo
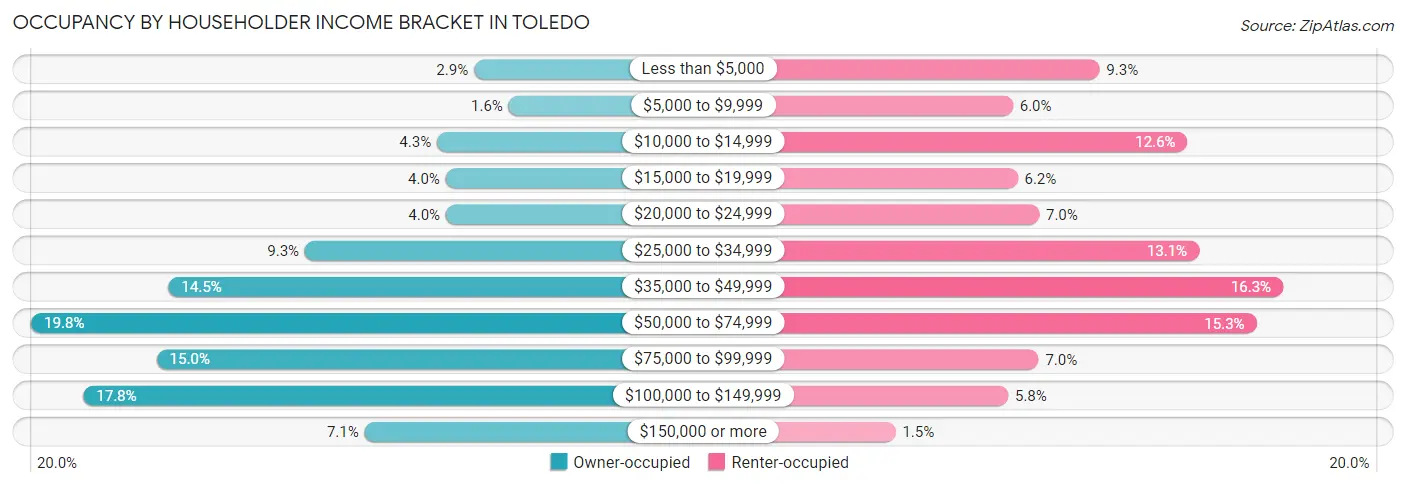
| Income Bracket | Owner-occupied | Renter-occupied |
| Less than $5,000 | 1,778 (2.9%) | 5,199 (9.3%) |
| $5,000 to $9,999 | 960 (1.6%) | 3,350 (6.0%) |
| $10,000 to $14,999 | 2,646 (4.3%) | 7,070 (12.6%) |
| $15,000 to $19,999 | 2,441 (4.0%) | 3,450 (6.2%) |
| $20,000 to $24,999 | 2,433 (4.0%) | 3,913 (7.0%) |
| $25,000 to $34,999 | 5,749 (9.3%) | 7,317 (13.1%) |
| $35,000 to $49,999 | 8,951 (14.5%) | 9,108 (16.3%) |
| $50,000 to $74,999 | 12,179 (19.8%) | 8,546 (15.3%) |
| $75,000 to $99,999 | 9,232 (15.0%) | 3,900 (7.0%) |
| $100,000 to $149,999 | 10,949 (17.8%) | 3,249 (5.8%) |
| $150,000 or more | 4,345 (7.0%) | 853 (1.5%) |
| Total | 61,663 (100.0%) | 55,955 (100.0%) |
Monthly Housing Cost Tiers in Toledo
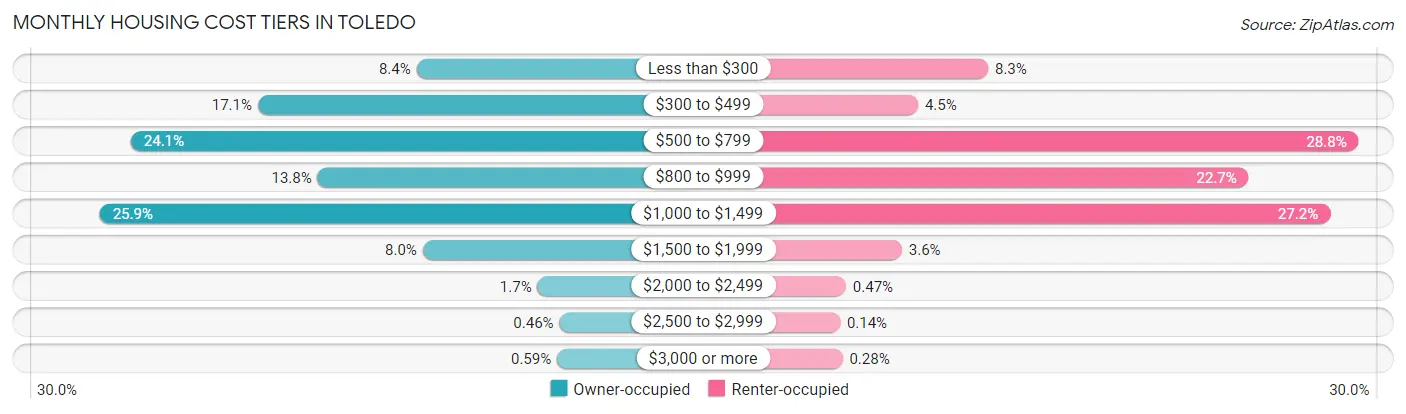
| Monthly Cost | Owner-occupied | Renter-occupied |
| Less than $300 | 5,150 (8.4%) | 4,658 (8.3%) |
| $300 to $499 | 10,558 (17.1%) | 2,489 (4.4%) |
| $500 to $799 | 14,880 (24.1%) | 16,105 (28.8%) |
| $800 to $999 | 8,521 (13.8%) | 12,706 (22.7%) |
| $1,000 to $1,499 | 15,940 (25.9%) | 15,223 (27.2%) |
| $1,500 to $1,999 | 4,938 (8.0%) | 1,992 (3.6%) |
| $2,000 to $2,499 | 1,032 (1.7%) | 263 (0.5%) |
| $2,500 to $2,999 | 282 (0.5%) | 78 (0.1%) |
| $3,000 or more | 362 (0.6%) | 154 (0.3%) |
| Total | 61,663 (100.0%) | 55,955 (100.0%) |
Physical Housing Characteristics in Toledo
Housing Structures in Toledo
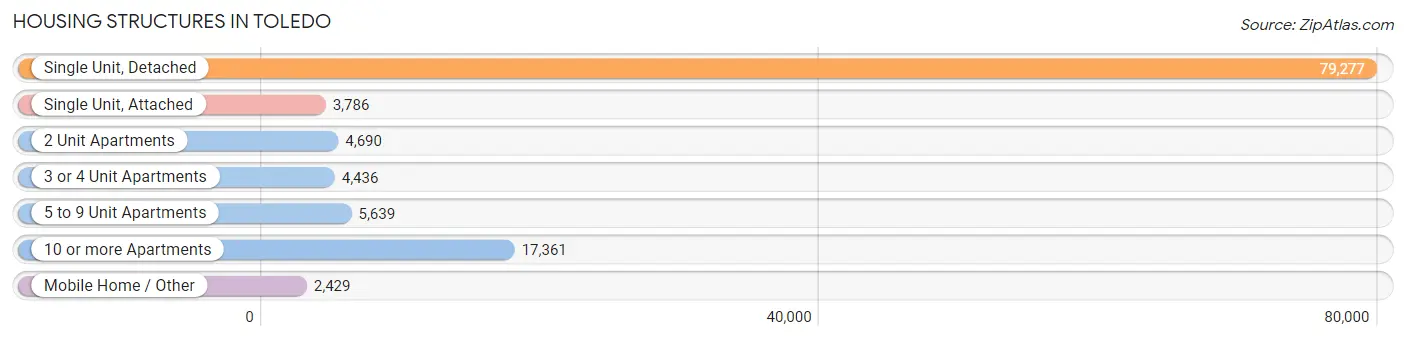
| Structure Type | # Housing Units | % Housing Units |
| Single Unit, Detached | 79,277 | 67.4% |
| Single Unit, Attached | 3,786 | 3.2% |
| 2 Unit Apartments | 4,690 | 4.0% |
| 3 or 4 Unit Apartments | 4,436 | 3.8% |
| 5 to 9 Unit Apartments | 5,639 | 4.8% |
| 10 or more Apartments | 17,361 | 14.8% |
| Mobile Home / Other | 2,429 | 2.1% |
| Total | 117,618 | 100.0% |
Housing Structures by Occupancy in Toledo
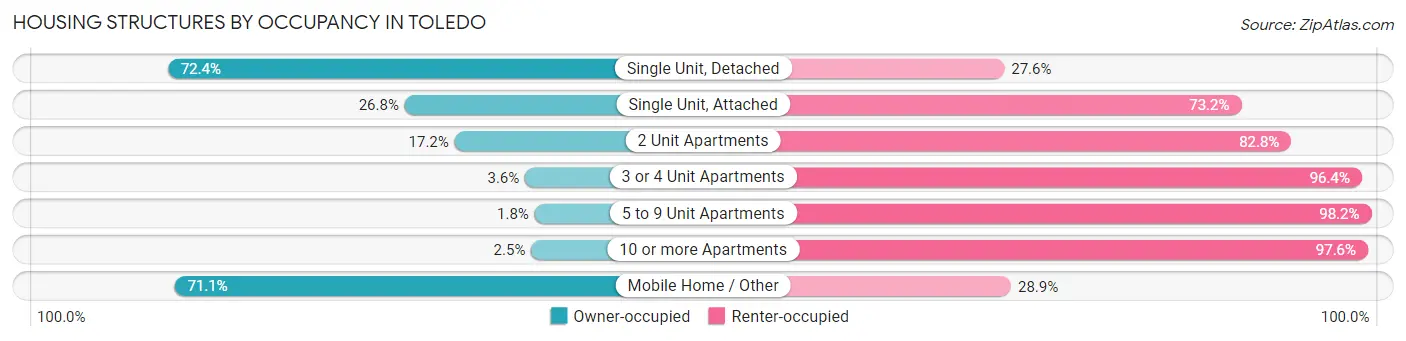
| Structure Type | Owner-occupied | Renter-occupied |
| Single Unit, Detached | 57,426 (72.4%) | 21,851 (27.6%) |
| Single Unit, Attached | 1,015 (26.8%) | 2,771 (73.2%) |
| 2 Unit Apartments | 807 (17.2%) | 3,883 (82.8%) |
| 3 or 4 Unit Apartments | 161 (3.6%) | 4,275 (96.4%) |
| 5 to 9 Unit Apartments | 101 (1.8%) | 5,538 (98.2%) |
| 10 or more Apartments | 425 (2.5%) | 16,936 (97.6%) |
| Mobile Home / Other | 1,728 (71.1%) | 701 (28.9%) |
| Total | 61,663 (52.4%) | 55,955 (47.6%) |
Housing Structures by Number of Rooms in Toledo
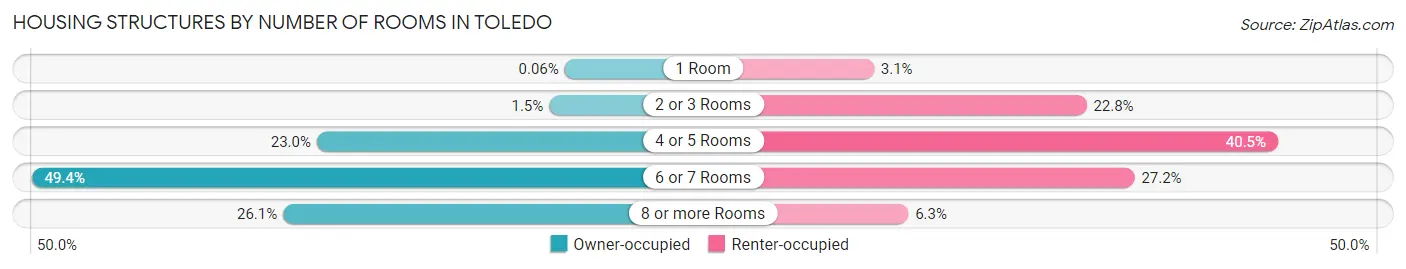
| Number of Rooms | Owner-occupied | Renter-occupied |
| 1 Room | 39 (0.1%) | 1,758 (3.1%) |
| 2 or 3 Rooms | 921 (1.5%) | 12,757 (22.8%) |
| 4 or 5 Rooms | 14,172 (23.0%) | 22,664 (40.5%) |
| 6 or 7 Rooms | 30,439 (49.4%) | 15,242 (27.2%) |
| 8 or more Rooms | 16,092 (26.1%) | 3,534 (6.3%) |
| Total | 61,663 (100.0%) | 55,955 (100.0%) |
Housing Structure by Heating Type in Toledo
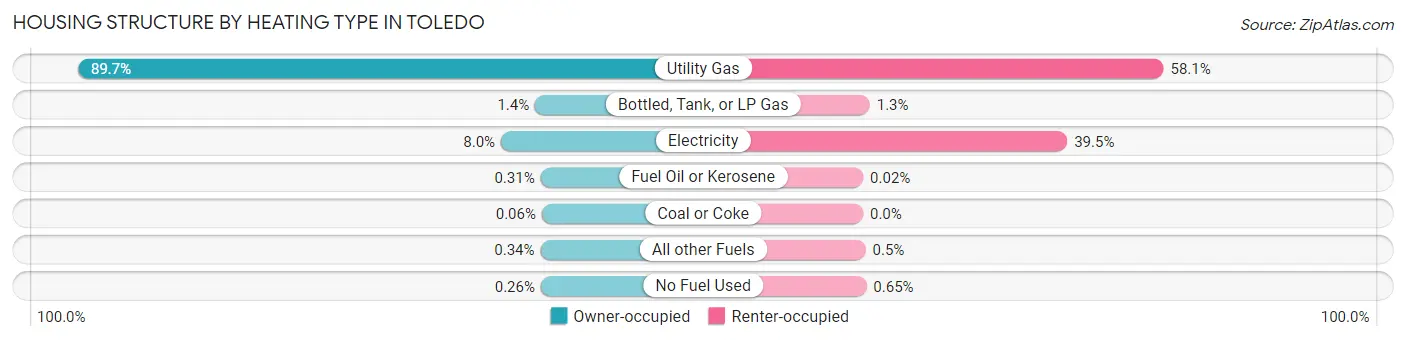
| Heating Type | Owner-occupied | Renter-occupied |
| Utility Gas | 55,316 (89.7%) | 32,495 (58.1%) |
| Bottled, Tank, or LP Gas | 844 (1.4%) | 725 (1.3%) |
| Electricity | 4,905 (8.0%) | 22,082 (39.5%) |
| Fuel Oil or Kerosene | 189 (0.3%) | 10 (0.0%) |
| Coal or Coke | 39 (0.1%) | 0 (0.0%) |
| All other Fuels | 209 (0.3%) | 282 (0.5%) |
| No Fuel Used | 161 (0.3%) | 361 (0.6%) |
| Total | 61,663 (100.0%) | 55,955 (100.0%) |
Household Vehicle Usage in Toledo
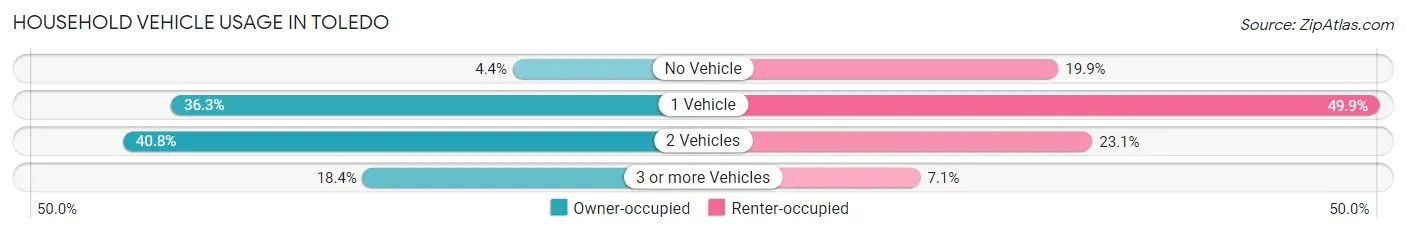
| Vehicles per Household | Owner-occupied | Renter-occupied |
| No Vehicle | 2,726 (4.4%) | 11,153 (19.9%) |
| 1 Vehicle | 22,397 (36.3%) | 27,930 (49.9%) |
| 2 Vehicles | 25,170 (40.8%) | 12,925 (23.1%) |
| 3 or more Vehicles | 11,370 (18.4%) | 3,947 (7.0%) |
| Total | 61,663 (100.0%) | 55,955 (100.0%) |
Real Estate & Mortgages in Toledo
Real Estate and Mortgage Overview in Toledo
| Characteristic | Without Mortgage | With Mortgage |
| Housing Units | 27,066 | 34,597 |
| Median Property Value | $80,900 | $111,500 |
| Median Household Income | $48,904 | $3,068 |
| Monthly Housing Costs | $473 | $271 |
| Real Estate Taxes | $1,467 | $1,007 |
Property Value by Mortgage Status in Toledo
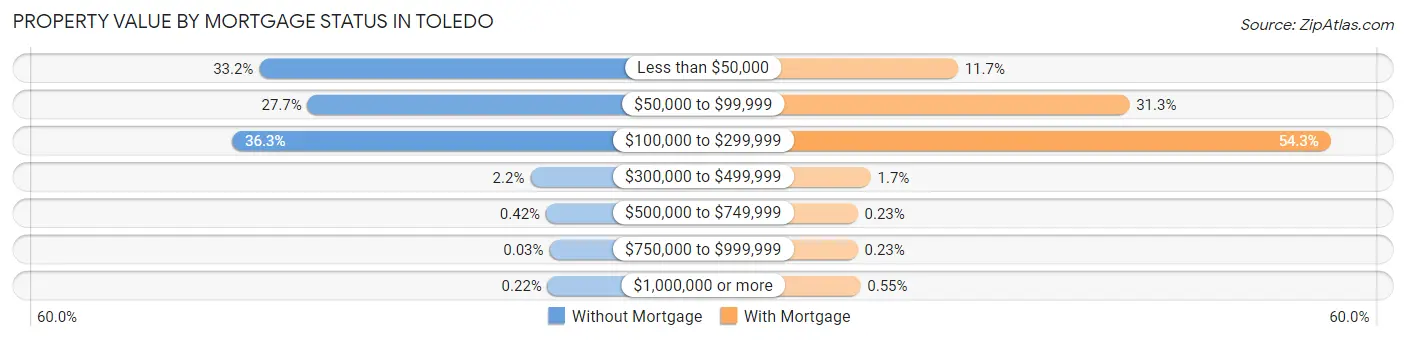
| Property Value | Without Mortgage | With Mortgage |
| Less than $50,000 | 8,982 (33.2%) | 4,041 (11.7%) |
| $50,000 to $99,999 | 7,487 (27.7%) | 10,823 (31.3%) |
| $100,000 to $299,999 | 9,820 (36.3%) | 18,787 (54.3%) |
| $300,000 to $499,999 | 598 (2.2%) | 596 (1.7%) |
| $500,000 to $749,999 | 113 (0.4%) | 81 (0.2%) |
| $750,000 to $999,999 | 7 (0.0%) | 79 (0.2%) |
| $1,000,000 or more | 59 (0.2%) | 190 (0.5%) |
| Total | 27,066 (100.0%) | 34,597 (100.0%) |
Household Income by Mortgage Status in Toledo
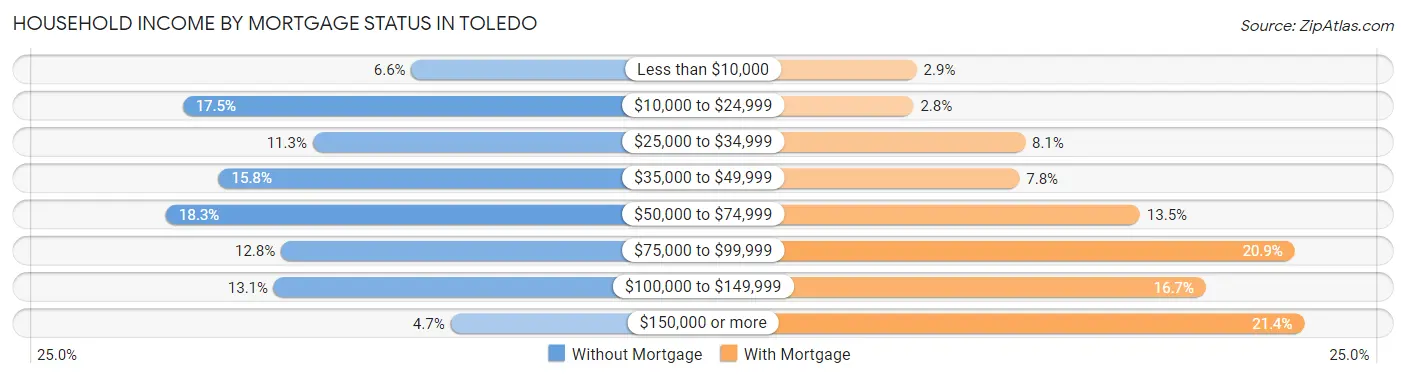
| Household Income | Without Mortgage | With Mortgage |
| Less than $10,000 | 1,782 (6.6%) | 1,006 (2.9%) |
| $10,000 to $24,999 | 4,729 (17.5%) | 956 (2.8%) |
| $25,000 to $34,999 | 3,052 (11.3%) | 2,791 (8.1%) |
| $35,000 to $49,999 | 4,265 (15.8%) | 2,697 (7.8%) |
| $50,000 to $74,999 | 4,945 (18.3%) | 4,686 (13.5%) |
| $75,000 to $99,999 | 3,462 (12.8%) | 7,234 (20.9%) |
| $100,000 to $149,999 | 3,554 (13.1%) | 5,770 (16.7%) |
| $150,000 or more | 1,277 (4.7%) | 7,395 (21.4%) |
| Total | 27,066 (100.0%) | 34,597 (100.0%) |
Property Value to Household Income Ratio in Toledo
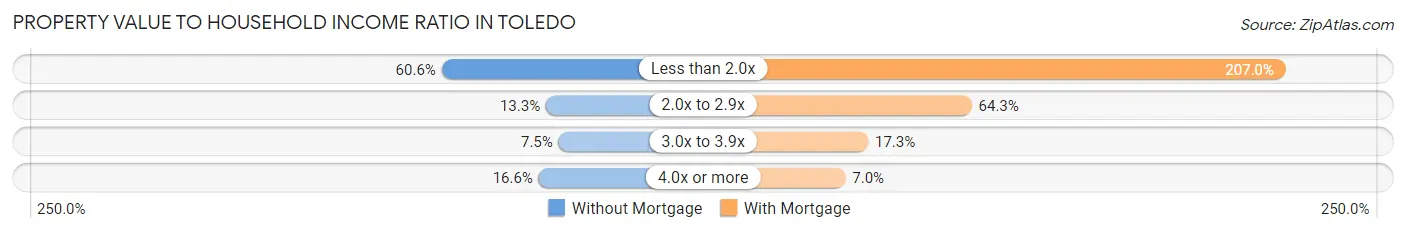
| Value-to-Income Ratio | Without Mortgage | With Mortgage |
| Less than 2.0x | 16,413 (60.6%) | 71,616 (207.0%) |
| 2.0x to 2.9x | 3,593 (13.3%) | 22,255 (64.3%) |
| 3.0x to 3.9x | 2,040 (7.5%) | 5,991 (17.3%) |
| 4.0x or more | 4,489 (16.6%) | 2,427 (7.0%) |
| Total | 27,066 (100.0%) | 34,597 (100.0%) |
Real Estate Taxes by Mortgage Status in Toledo
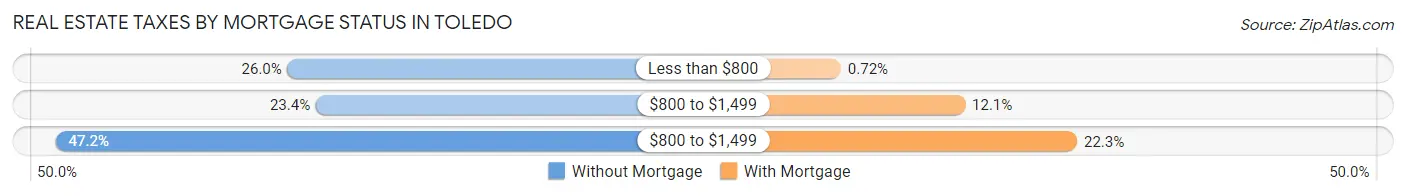
| Property Taxes | Without Mortgage | With Mortgage |
| Less than $800 | 7,033 (26.0%) | 250 (0.7%) |
| $800 to $1,499 | 6,331 (23.4%) | 4,171 (12.1%) |
| $800 to $1,499 | 12,765 (47.2%) | 7,707 (22.3%) |
| Total | 27,066 (100.0%) | 34,597 (100.0%) |
Health & Disability in Toledo
Health Insurance Coverage by Age in Toledo
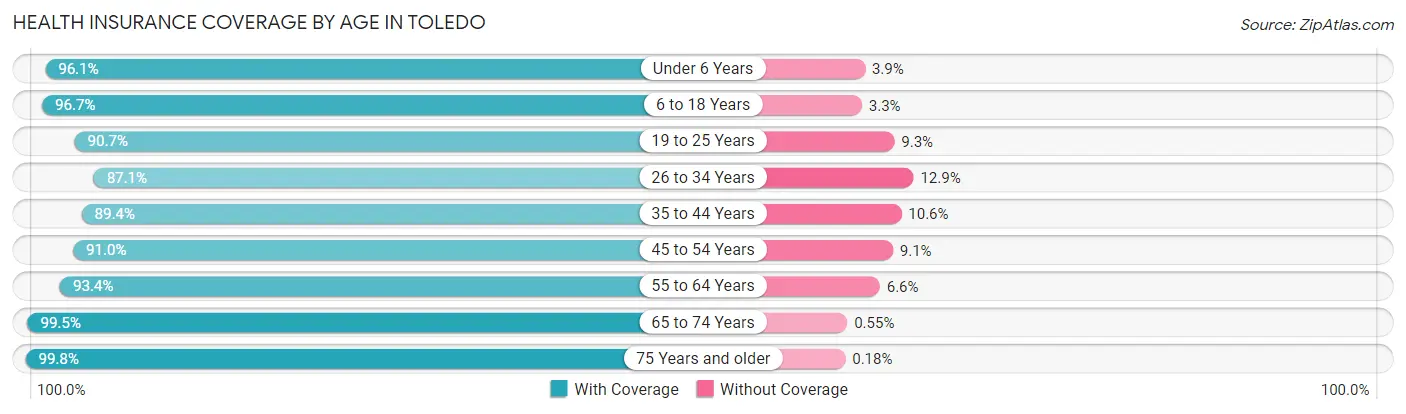
| Age Bracket | With Coverage | Without Coverage |
| Under 6 Years | 20,622 (96.1%) | 828 (3.9%) |
| 6 to 18 Years | 42,896 (96.7%) | 1,455 (3.3%) |
| 19 to 25 Years | 26,071 (90.7%) | 2,686 (9.3%) |
| 26 to 34 Years | 33,043 (87.1%) | 4,895 (12.9%) |
| 35 to 44 Years | 28,229 (89.4%) | 3,360 (10.6%) |
| 45 to 54 Years | 27,836 (90.9%) | 2,769 (9.0%) |
| 55 to 64 Years | 31,345 (93.4%) | 2,222 (6.6%) |
| 65 to 74 Years | 24,044 (99.5%) | 132 (0.5%) |
| 75 Years and older | 14,803 (99.8%) | 26 (0.2%) |
| Total | 248,889 (93.1%) | 18,373 (6.9%) |
Health Insurance Coverage by Citizenship Status in Toledo

| Citizenship Status | With Coverage | Without Coverage |
| Native Born | 20,622 (96.1%) | 828 (3.9%) |
| Foreign Born, Citizen | 42,896 (96.7%) | 1,455 (3.3%) |
| Foreign Born, not a Citizen | 26,071 (90.7%) | 2,686 (9.3%) |
Health Insurance Coverage by Household Income in Toledo
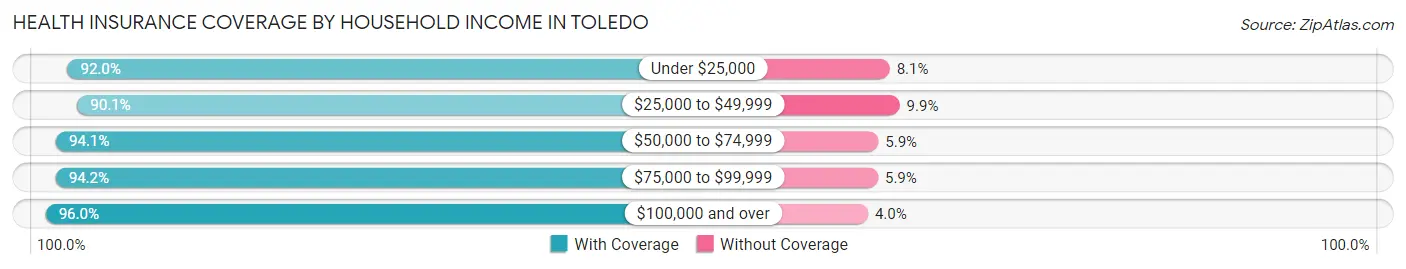
| Household Income | With Coverage | Without Coverage |
| Under $25,000 | 53,201 (91.9%) | 4,658 (8.1%) |
| $25,000 to $49,999 | 57,178 (90.1%) | 6,285 (9.9%) |
| $50,000 to $74,999 | 47,012 (94.1%) | 2,955 (5.9%) |
| $75,000 to $99,999 | 31,568 (94.2%) | 1,961 (5.9%) |
| $100,000 and over | 56,089 (96.0%) | 2,319 (4.0%) |
Public vs Private Health Insurance Coverage by Age in Toledo
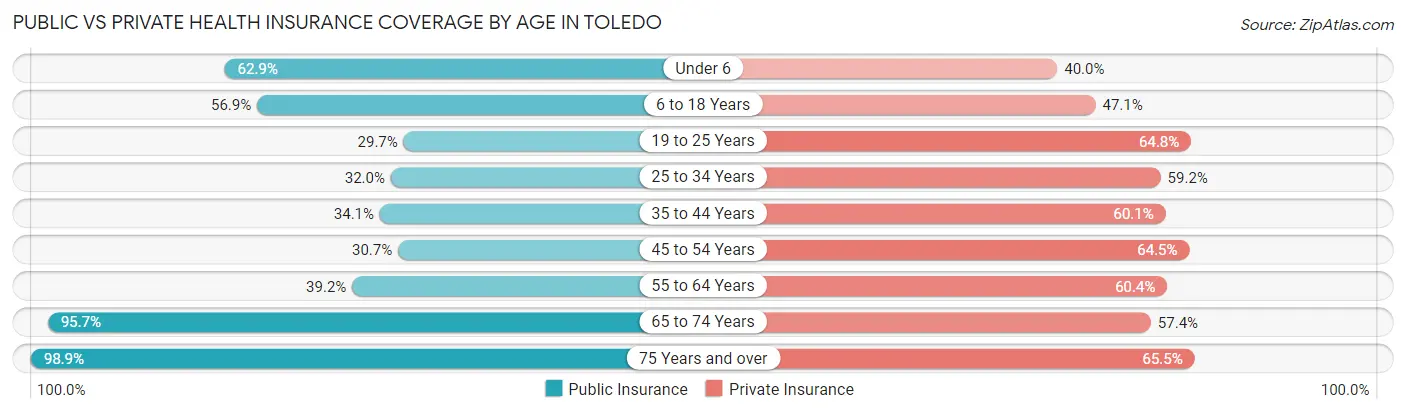
| Age Bracket | Public Insurance | Private Insurance |
| Under 6 | 13,488 (62.9%) | 8,580 (40.0%) |
| 6 to 18 Years | 25,216 (56.9%) | 20,888 (47.1%) |
| 19 to 25 Years | 8,526 (29.6%) | 18,644 (64.8%) |
| 25 to 34 Years | 12,152 (32.0%) | 22,456 (59.2%) |
| 35 to 44 Years | 10,760 (34.1%) | 18,982 (60.1%) |
| 45 to 54 Years | 9,393 (30.7%) | 19,742 (64.5%) |
| 55 to 64 Years | 13,157 (39.2%) | 20,274 (60.4%) |
| 65 to 74 Years | 23,137 (95.7%) | 13,871 (57.4%) |
| 75 Years and over | 14,658 (98.9%) | 9,709 (65.5%) |
| Total | 130,487 (48.8%) | 153,146 (57.3%) |
Disability Status by Sex by Age in Toledo
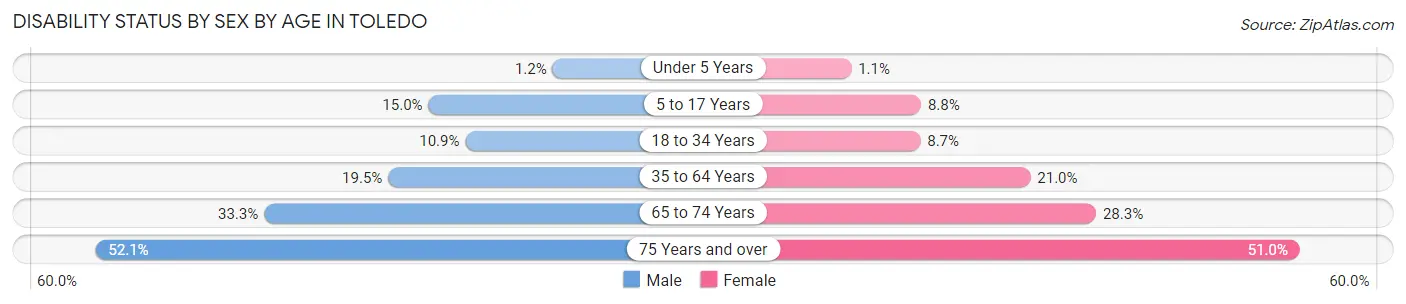
| Age Bracket | Male | Female |
| Under 5 Years | 105 (1.2%) | 91 (1.1%) |
| 5 to 17 Years | 3,455 (15.0%) | 1,899 (8.8%) |
| 18 to 34 Years | 3,800 (10.9%) | 3,122 (8.7%) |
| 35 to 64 Years | 9,152 (19.5%) | 10,260 (21.0%) |
| 65 to 74 Years | 3,785 (33.3%) | 3,629 (28.3%) |
| 75 Years and over | 2,947 (52.1%) | 4,679 (51.0%) |
Disability Class by Sex by Age in Toledo
Disability Class: Hearing Difficulty
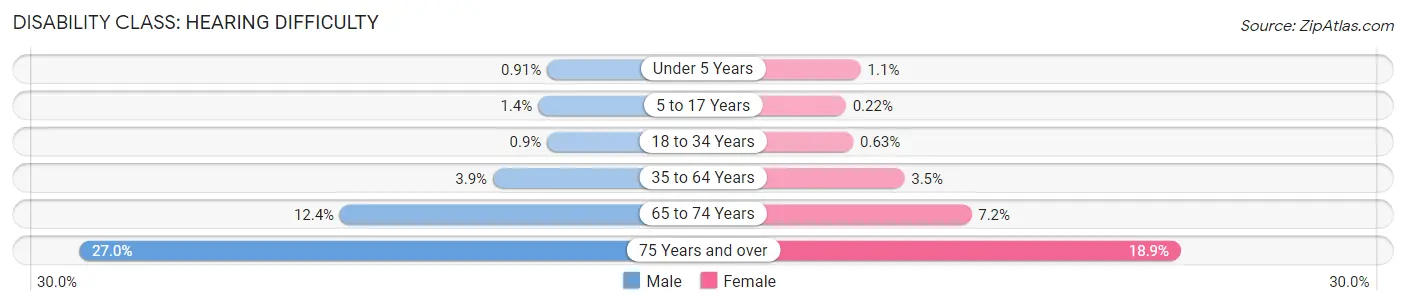
| Age Bracket | Male | Female |
| Under 5 Years | 80 (0.9%) | 91 (1.1%) |
| 5 to 17 Years | 324 (1.4%) | 48 (0.2%) |
| 18 to 34 Years | 314 (0.9%) | 226 (0.6%) |
| 35 to 64 Years | 1,840 (3.9%) | 1,699 (3.5%) |
| 65 to 74 Years | 1,412 (12.4%) | 924 (7.2%) |
| 75 Years and over | 1,525 (27.0%) | 1,732 (18.9%) |
Disability Class: Vision Difficulty
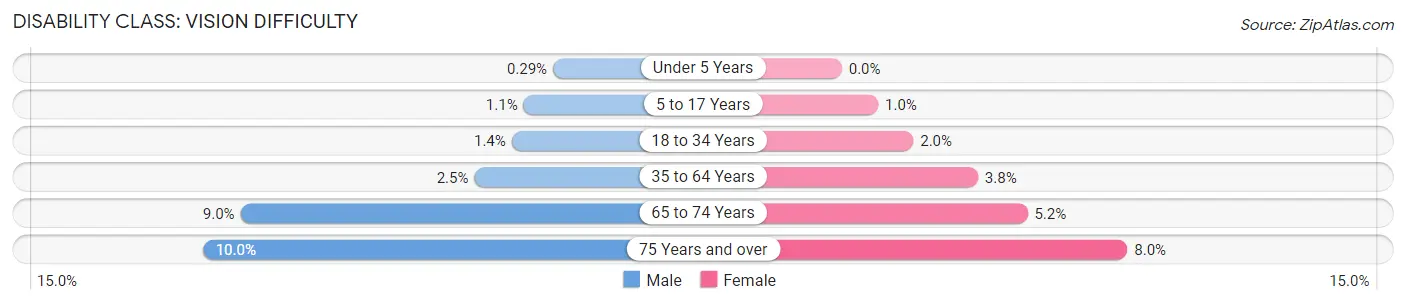
| Age Bracket | Male | Female |
| Under 5 Years | 25 (0.3%) | 0 (0.0%) |
| 5 to 17 Years | 256 (1.1%) | 218 (1.0%) |
| 18 to 34 Years | 501 (1.4%) | 711 (2.0%) |
| 35 to 64 Years | 1,164 (2.5%) | 1,851 (3.8%) |
| 65 to 74 Years | 1,021 (9.0%) | 663 (5.2%) |
| 75 Years and over | 568 (10.0%) | 729 (8.0%) |
Disability Class: Cognitive Difficulty
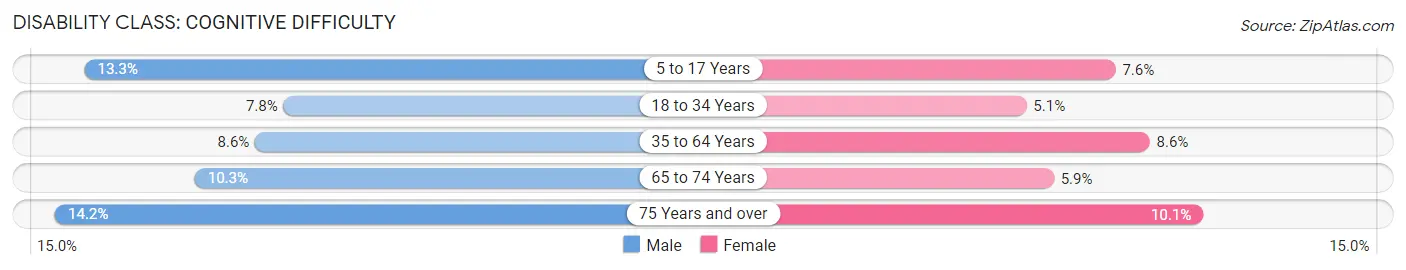
| Age Bracket | Male | Female |
| 5 to 17 Years | 3,064 (13.3%) | 1,640 (7.6%) |
| 18 to 34 Years | 2,713 (7.8%) | 1,837 (5.1%) |
| 35 to 64 Years | 4,023 (8.6%) | 4,186 (8.6%) |
| 65 to 74 Years | 1,165 (10.3%) | 757 (5.9%) |
| 75 Years and over | 800 (14.1%) | 923 (10.1%) |
Disability Class: Ambulatory Difficulty
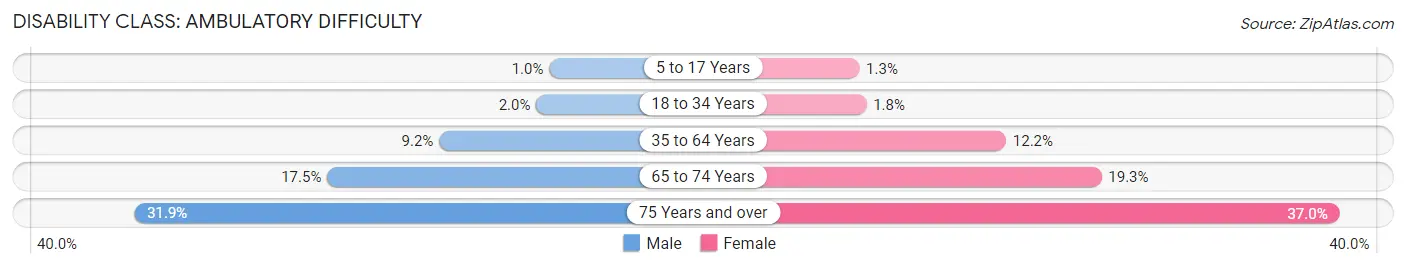
| Age Bracket | Male | Female |
| 5 to 17 Years | 239 (1.0%) | 278 (1.3%) |
| 18 to 34 Years | 698 (2.0%) | 645 (1.8%) |
| 35 to 64 Years | 4,325 (9.2%) | 5,948 (12.2%) |
| 65 to 74 Years | 1,990 (17.5%) | 2,471 (19.3%) |
| 75 Years and over | 1,803 (31.9%) | 3,390 (36.9%) |
Disability Class: Self-Care Difficulty
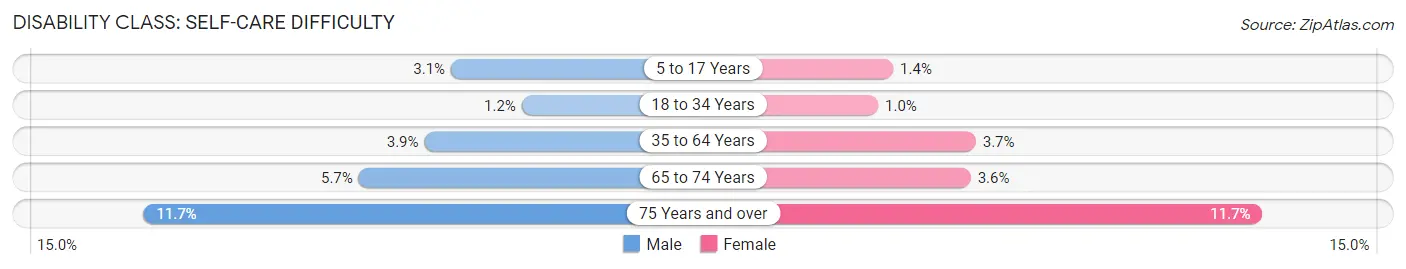
| Age Bracket | Male | Female |
| 5 to 17 Years | 720 (3.1%) | 307 (1.4%) |
| 18 to 34 Years | 403 (1.2%) | 362 (1.0%) |
| 35 to 64 Years | 1,815 (3.9%) | 1,823 (3.7%) |
| 65 to 74 Years | 647 (5.7%) | 460 (3.6%) |
| 75 Years and over | 661 (11.7%) | 1,074 (11.7%) |
Technology Access in Toledo
Computing Device Access in Toledo
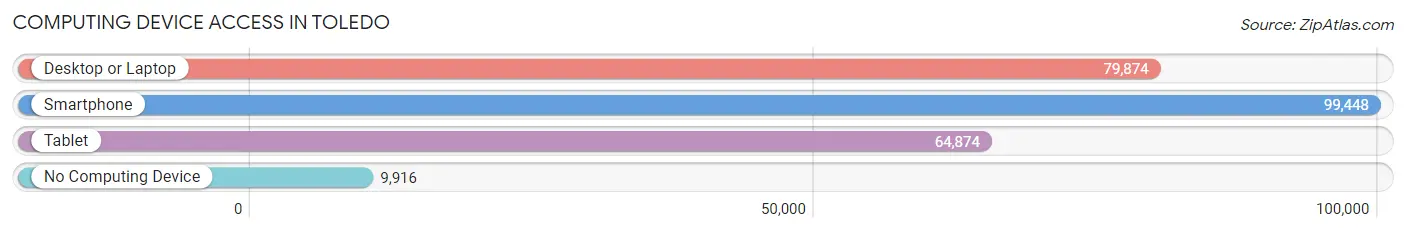
| Device Type | # Households | % Households |
| Desktop or Laptop | 79,874 | 67.9% |
| Smartphone | 99,448 | 84.6% |
| Tablet | 64,874 | 55.2% |
| No Computing Device | 9,916 | 8.4% |
| Total | 117,618 | 100.0% |
Internet Access in Toledo
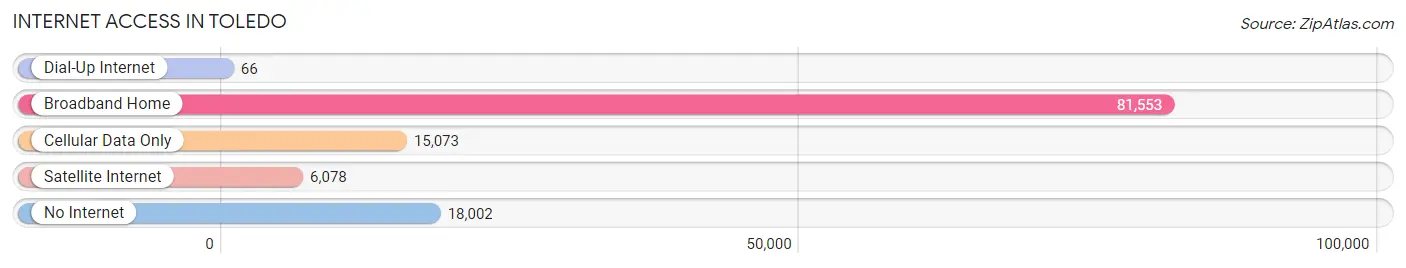
| Internet Type | # Households | % Households |
| Dial-Up Internet | 66 | 0.1% |
| Broadband Home | 81,553 | 69.3% |
| Cellular Data Only | 15,073 | 12.8% |
| Satellite Internet | 6,078 | 5.2% |
| No Internet | 18,002 | 15.3% |
| Total | 117,618 | 100.0% |
Toledo Summary
Toledo, Ohio is a city located in the northwest corner of the state, along the western shore of Lake Erie. It is the county seat of Lucas County and the fourth most populous city in the state. Toledo is a major port city, with a population of 287,208 in the 2010 census. The city is known for its rich history, diverse culture, and vibrant economy.
History
Toledo was founded in 1833 by two brothers, William and Edward Tiffin, who named the city after the Spanish city of Toledo. The city was incorporated in 1837 and quickly became a major transportation hub, with the Miami and Erie Canal connecting the city to the Great Lakes. The city was also a major industrial center, with the first glass factory opening in 1838.
In the late 19th century, Toledo became a major center for the automotive industry, with the first automobile factory opening in 1901. The city was also home to the first Jeep factory, which opened in 1941.
Geography
Toledo is located in the northwest corner of Ohio, along the western shore of Lake Erie. The city is situated at the mouth of the Maumee River, which flows into the lake. The city is bordered by the cities of Maumee, Oregon, and Rossford to the north, and the cities of Sylvania and Waterville to the south. The city covers an area of 84.3 square miles, with a population density of 3,400 people per square mile.
Economy
Toledo’s economy is largely based on manufacturing, with the automotive industry being the largest employer in the city. Other major industries include healthcare, education, and tourism. The city is also home to several major corporations, including Owens Corning, ProMedica, and HCR ManorCare.
Demographics
As of the 2010 census, the population of Toledo was 287,208, with a population density of 3,400 people per square mile. The racial makeup of the city was 63.2% White, 28.2% African American, 0.4% Native American, 2.2% Asian, and 5.9% from other races. The median household income was $35,945, and the median age was 35.7 years.
Toledo is a diverse city, with a variety of cultures and religions represented. The city is home to a large Hispanic population, with nearly 20% of the population being of Hispanic or Latino origin. The city is also home to a large Muslim population, with nearly 10% of the population being Muslim.
Conclusion
Toledo, Ohio is a vibrant city with a rich history, diverse culture, and vibrant economy. The city is home to a variety of industries, including automotive, healthcare, education, and tourism. The city is also home to a diverse population, with a variety of cultures and religions represented. Toledo is a great place to live, work, and visit.
Common Questions
What is Per Capita Income in Toledo?
Per Capita income in Toledo is $25,860.
What is the Median Family Income in Toledo?
Median Family Income in Toledo is $56,943.
What is the Median Household income in Toledo?
Median Household Income in Toledo is $45,405.
What is Income or Wage Gap in Toledo?
Income or Wage Gap in Toledo is 18.3%.
Women in Toledo earn 81.7 cents for every dollar earned by a man.
What is Family Income Deficit in Toledo?
Family Income Deficit in Toledo is $12,522.
Families that are below poverty line in Toledo earn $12,522 less on average than the poverty threshold level.
What is Inequality or Gini Index in Toledo?
Inequality or Gini Index in Toledo is 0.45.
What is the Total Population of Toledo?
Total Population of Toledo is 269,962.
What is the Total Male Population of Toledo?
Total Male Population of Toledo is 132,343.
What is the Total Female Population of Toledo?
Total Female Population of Toledo is 137,619.
What is the Ratio of Males per 100 Females in Toledo?
There are 96.17 Males per 100 Females in Toledo.
What is the Ratio of Females per 100 Males in Toledo?
There are 103.99 Females per 100 Males in Toledo.
What is the Median Population Age in Toledo?
Median Population Age in Toledo is 35.4 Years.
What is the Average Family Size in Toledo
Average Family Size in Toledo is 3.0 People.
What is the Average Household Size in Toledo
Average Household Size in Toledo is 2.2 People.
How Large is the Labor Force in Toledo?
There are 132,865 People in the Labor Forcein in Toledo.
What is the Percentage of People in the Labor Force in Toledo?
61.9% of People are in the Labor Force in Toledo.
What is the Unemployment Rate in Toledo?
Unemployment Rate in Toledo is 8.2%.