Finneytown, OH Map & Demographics
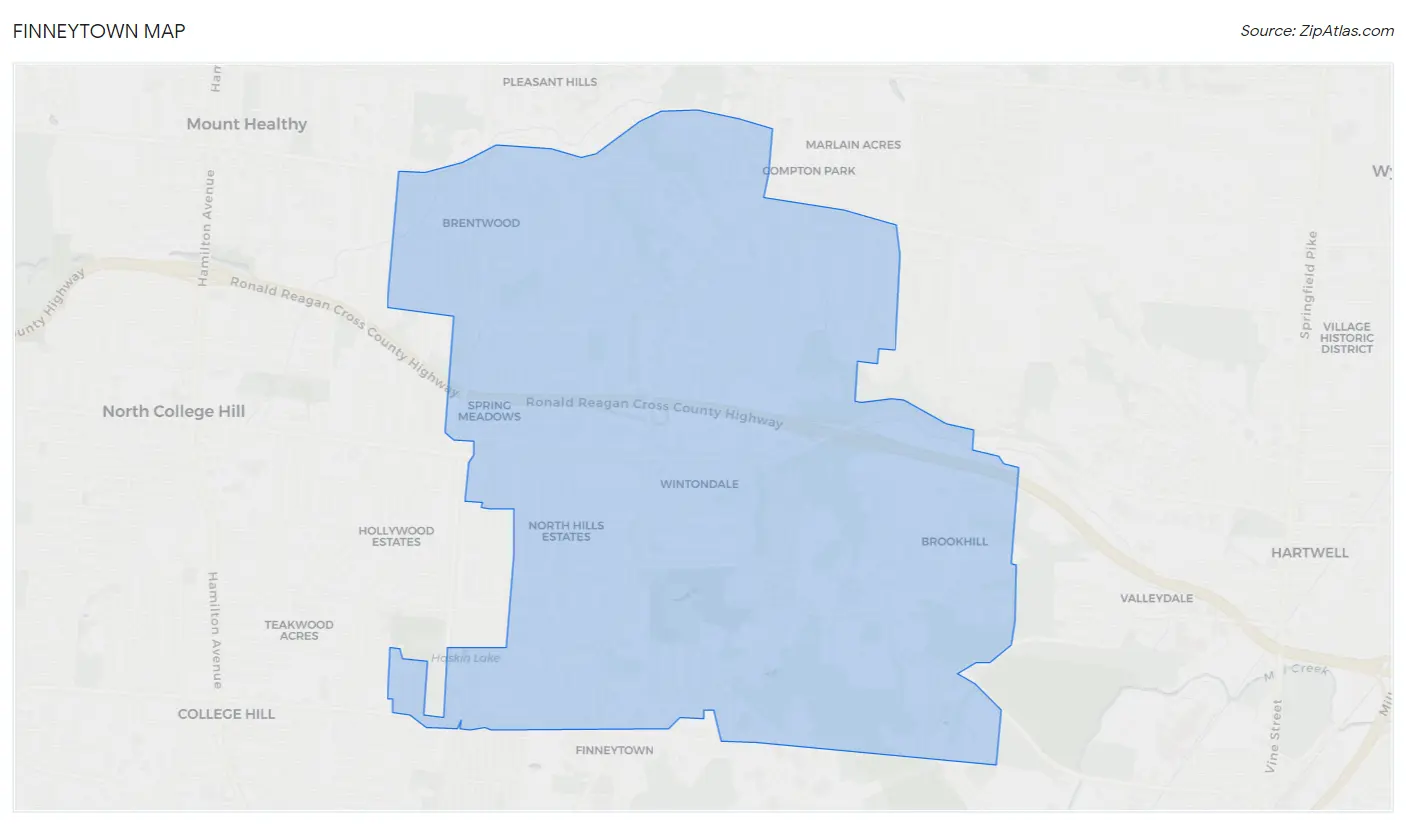
Finneytown Map
Finneytown Overview
$36,367
PER CAPITA INCOME
$81,860
AVG FAMILY INCOME
$78,571
AVG HOUSEHOLD INCOME
6.9%
WAGE / INCOME GAP [ % ]
93.1¢/ $1
WAGE / INCOME GAP [ $ ]
0.36
INEQUALITY / GINI INDEX
12,870
TOTAL POPULATION
6,254
MALE POPULATION
6,616
FEMALE POPULATION
94.53
MALES / 100 FEMALES
105.79
FEMALES / 100 MALES
45.1
MEDIAN AGE
3.0
AVG FAMILY SIZE
2.5
AVG HOUSEHOLD SIZE
6,726
LABOR FORCE [ PEOPLE ]
64.8%
PERCENT IN LABOR FORCE
5.4%
UNEMPLOYMENT RATE
Income in Finneytown
Income Overview in Finneytown
Per Capita Income in Finneytown is $36,367, while median incomes of families and households are $81,860 and $78,571 respectively.
| Characteristic | Number | Measure |
| Per Capita Income | 12,870 | $36,367 |
| Median Family Income | 3,504 | $81,860 |
| Mean Family Income | 3,504 | $89,352 |
| Median Household Income | 5,110 | $78,571 |
| Mean Household Income | 5,110 | $87,843 |
| Income Deficit | 3,504 | $0 |
| Wage / Income Gap (%) | 12,870 | 6.89% |
| Wage / Income Gap ($) | 12,870 | 93.11¢ per $1 |
| Gini / Inequality Index | 12,870 | 0.36 |
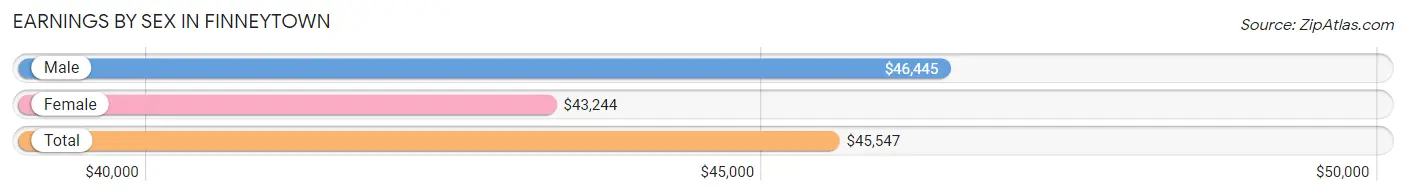
Earnings by Sex in Finneytown
Average Earnings in Finneytown are $45,547, $46,445 for men and $43,244 for women, a difference of 6.9%.
| Sex | Number | Average Earnings |
| Male | 3,391 (48.1%) | $46,445 |
| Female | 3,655 (51.9%) | $43,244 |
| Total | 7,046 (100.0%) | $45,547 |
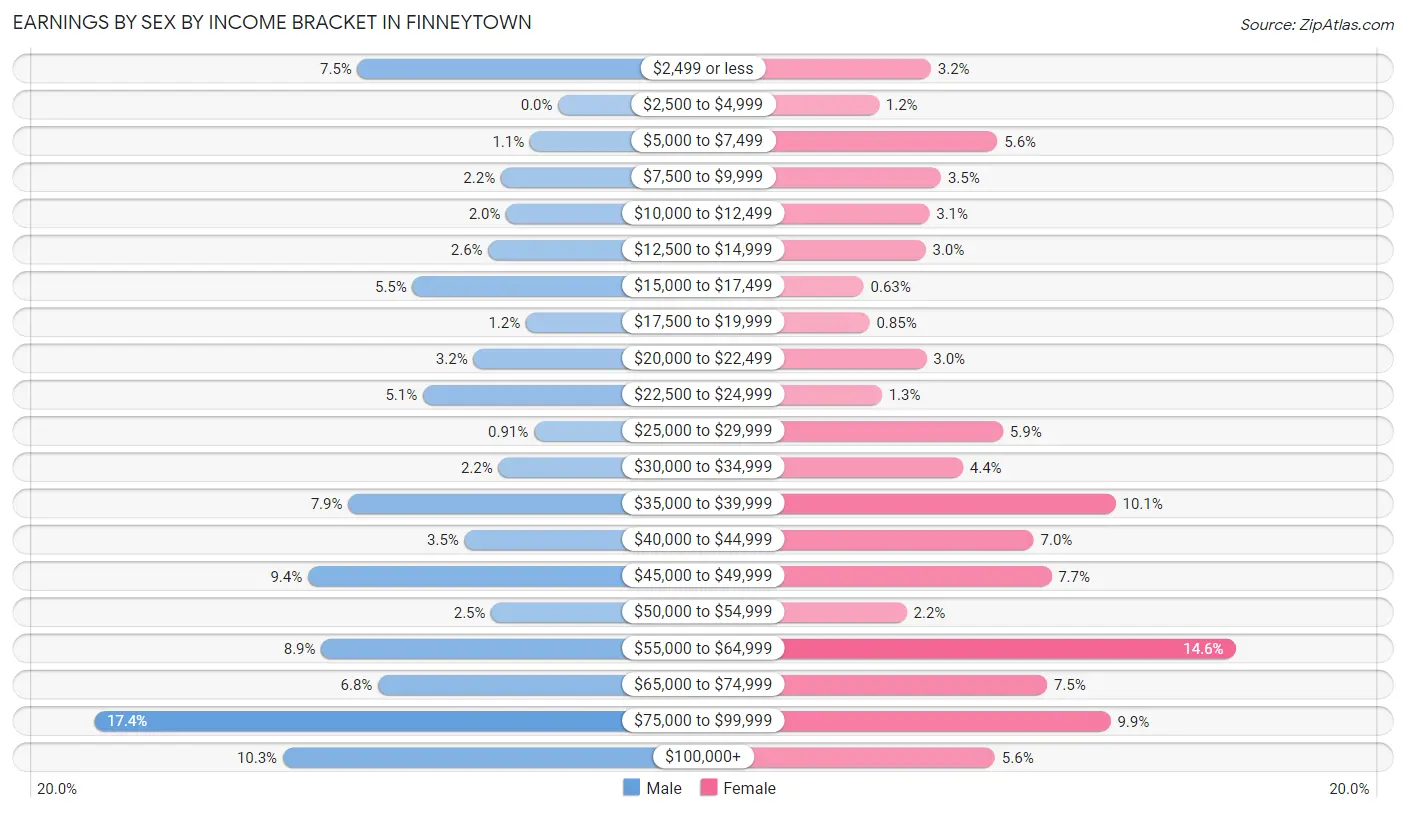
Earnings by Sex by Income Bracket in Finneytown
The most common earnings brackets in Finneytown are $75,000 to $99,999 for men (590 | 17.4%) and $55,000 to $64,999 for women (532 | 14.6%).
| Income | Male | Female |
| $2,499 or less | 255 (7.5%) | 115 (3.2%) |
| $2,500 to $4,999 | 0 (0.0%) | 44 (1.2%) |
| $5,000 to $7,499 | 36 (1.1%) | 206 (5.6%) |
| $7,500 to $9,999 | 73 (2.1%) | 129 (3.5%) |
| $10,000 to $12,499 | 66 (1.9%) | 113 (3.1%) |
| $12,500 to $14,999 | 89 (2.6%) | 108 (2.9%) |
| $15,000 to $17,499 | 185 (5.5%) | 23 (0.6%) |
| $17,500 to $19,999 | 41 (1.2%) | 31 (0.9%) |
| $20,000 to $22,499 | 108 (3.2%) | 109 (3.0%) |
| $22,500 to $24,999 | 172 (5.1%) | 48 (1.3%) |
| $25,000 to $29,999 | 31 (0.9%) | 214 (5.9%) |
| $30,000 to $34,999 | 76 (2.2%) | 159 (4.3%) |
| $35,000 to $39,999 | 267 (7.9%) | 368 (10.1%) |
| $40,000 to $44,999 | 119 (3.5%) | 256 (7.0%) |
| $45,000 to $49,999 | 318 (9.4%) | 280 (7.7%) |
| $50,000 to $54,999 | 85 (2.5%) | 82 (2.2%) |
| $55,000 to $64,999 | 301 (8.9%) | 532 (14.6%) |
| $65,000 to $74,999 | 229 (6.8%) | 274 (7.5%) |
| $75,000 to $99,999 | 590 (17.4%) | 361 (9.9%) |
| $100,000+ | 350 (10.3%) | 203 (5.6%) |
| Total | 3,391 (100.0%) | 3,655 (100.0%) |
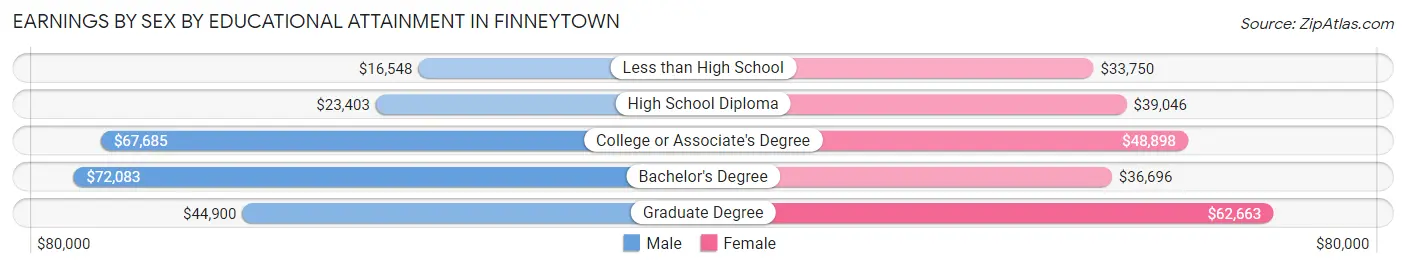
Earnings by Sex by Educational Attainment in Finneytown
Average earnings in Finneytown are $50,377 for men and $45,234 for women, a difference of 10.2%. Men with an educational attainment of bachelor's degree enjoy the highest average annual earnings of $72,083, while those with less than high school education earn the least with $16,548. Women with an educational attainment of graduate degree earn the most with the average annual earnings of $62,663, while those with less than high school education have the smallest earnings of $33,750.
| Educational Attainment | Male Income | Female Income |
| Less than High School | $16,548 | $33,750 |
| High School Diploma | $23,403 | $39,046 |
| College or Associate's Degree | $67,685 | $48,898 |
| Bachelor's Degree | $72,083 | $36,696 |
| Graduate Degree | $44,900 | $62,663 |
| Total | $50,377 | $45,234 |
Family Income in Finneytown
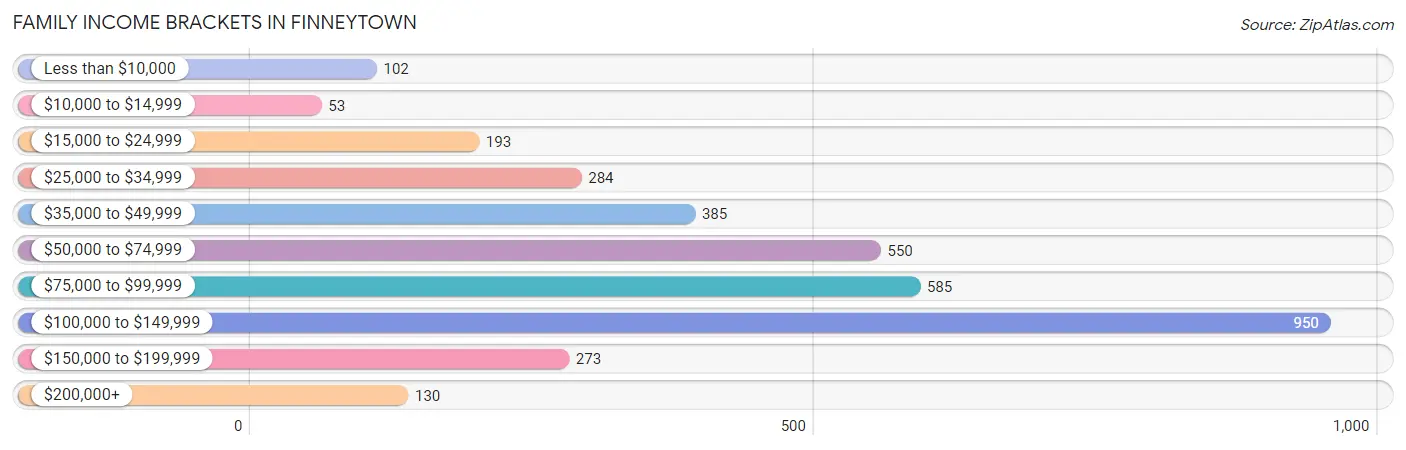
Family Income Brackets in Finneytown
According to the Finneytown family income data, there are 950 families falling into the $100,000 to $149,999 income range, which is the most common income bracket and makes up 27.1% of all families. Conversely, the $10,000 to $14,999 income bracket is the least frequent group with only 53 families (1.5%) belonging to this category.
| Income Bracket | # Families | % Families |
| Less than $10,000 | 102 | 2.9% |
| $10,000 to $14,999 | 53 | 1.5% |
| $15,000 to $24,999 | 193 | 5.5% |
| $25,000 to $34,999 | 284 | 8.1% |
| $35,000 to $49,999 | 385 | 11.0% |
| $50,000 to $74,999 | 550 | 15.7% |
| $75,000 to $99,999 | 585 | 16.7% |
| $100,000 to $149,999 | 950 | 27.1% |
| $150,000 to $199,999 | 273 | 7.8% |
| $200,000+ | 130 | 3.7% |
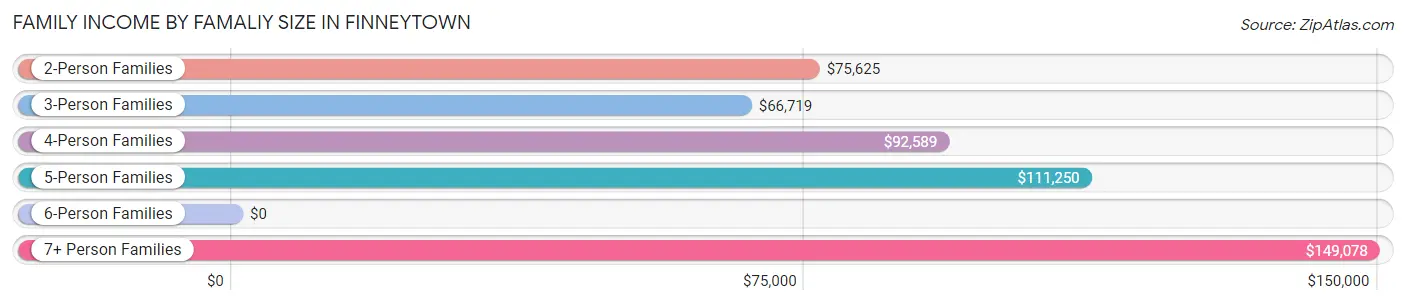
Family Income by Famaliy Size in Finneytown
7+ person families (85 | 2.4%) account for the highest median family income in Finneytown with $149,078 per family, while 2-person families (2,112 | 60.3%) have the highest median income of $37,812 per family member.
| Income Bracket | # Families | Median Income |
| 2-Person Families | 2,112 (60.3%) | $75,625 |
| 3-Person Families | 460 (13.1%) | $66,719 |
| 4-Person Families | 519 (14.8%) | $92,589 |
| 5-Person Families | 280 (8.0%) | $111,250 |
| 6-Person Families | 48 (1.4%) | $0 |
| 7+ Person Families | 85 (2.4%) | $149,078 |
| Total | 3,504 (100.0%) | $81,860 |
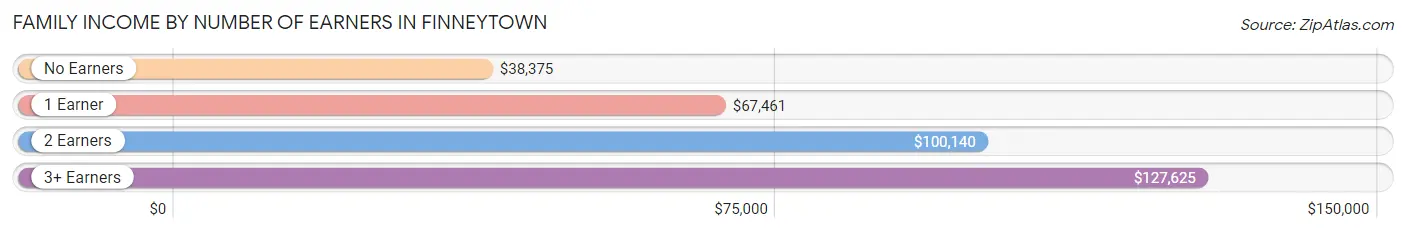
Family Income by Number of Earners in Finneytown
The median family income in Finneytown is $81,860, with families comprising 3+ earners (360) having the highest median family income of $127,625, while families with no earners (509) have the lowest median family income of $38,375, accounting for 10.3% and 14.5% of families, respectively.
| Number of Earners | # Families | Median Income |
| No Earners | 509 (14.5%) | $38,375 |
| 1 Earner | 1,219 (34.8%) | $67,461 |
| 2 Earners | 1,416 (40.4%) | $100,140 |
| 3+ Earners | 360 (10.3%) | $127,625 |
| Total | 3,504 (100.0%) | $81,860 |
Household Income in Finneytown
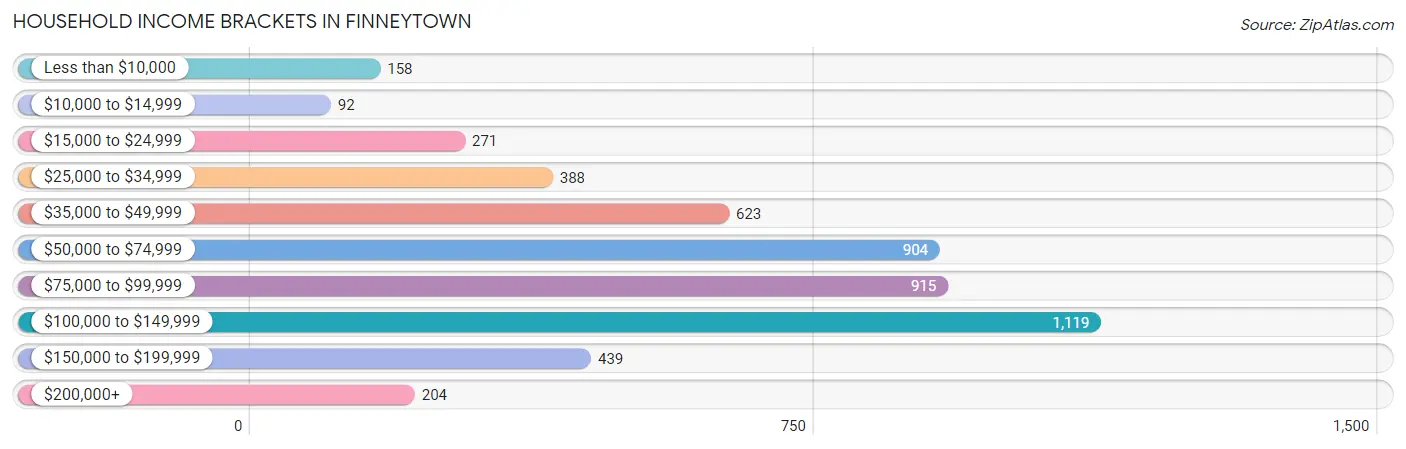
Household Income Brackets in Finneytown
With 1,119 households falling in the category, the $100,000 to $149,999 income range is the most frequent in Finneytown, accounting for 21.9% of all households. In contrast, only 92 households (1.8%) fall into the $10,000 to $14,999 income bracket, making it the least populous group.
| Income Bracket | # Households | % Households |
| Less than $10,000 | 158 | 3.1% |
| $10,000 to $14,999 | 92 | 1.8% |
| $15,000 to $24,999 | 271 | 5.3% |
| $25,000 to $34,999 | 388 | 7.6% |
| $35,000 to $49,999 | 623 | 12.2% |
| $50,000 to $74,999 | 904 | 17.7% |
| $75,000 to $99,999 | 915 | 17.9% |
| $100,000 to $149,999 | 1,119 | 21.9% |
| $150,000 to $199,999 | 439 | 8.6% |
| $200,000+ | 204 | 4.0% |
Household Income by Householder Age in Finneytown
The median household income in Finneytown is $78,571, with the highest median household income of $90,877 found in the 45 to 64 years age bracket for the primary householder. A total of 2,233 households (43.7%) fall into this category. Meanwhile, the 15 to 24 years age bracket for the primary householder has the lowest median household income of $0, with 20 households (0.4%) in this group.
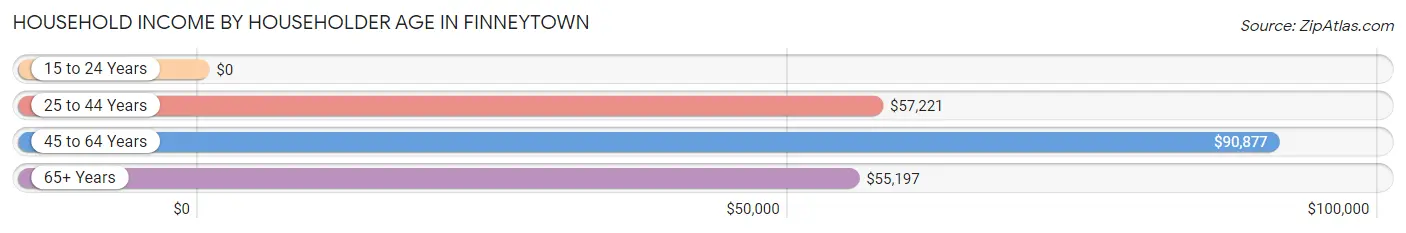
| Income Bracket | # Households | Median Income |
| 15 to 24 Years | 20 (0.4%) | $0 |
| 25 to 44 Years | 1,571 (30.7%) | $57,221 |
| 45 to 64 Years | 2,233 (43.7%) | $90,877 |
| 65+ Years | 1,286 (25.2%) | $55,197 |
| Total | 5,110 (100.0%) | $78,571 |
Poverty in Finneytown
Income Below Poverty by Sex and Age in Finneytown
With 11.9% poverty level for males and 12.3% for females among the residents of Finneytown, 15 year old males and under 5 year old females are the most vulnerable to poverty, with 63 males (56.2%) and 149 females (37.9%) in their respective age groups living below the poverty level.
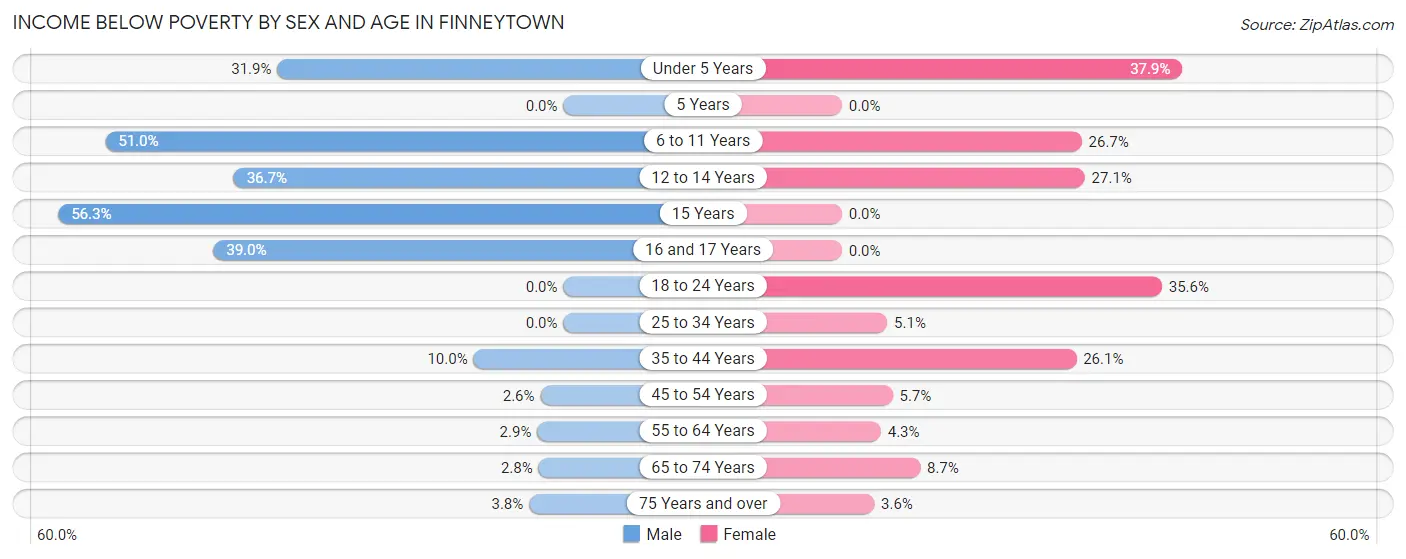
| Age Bracket | Male | Female |
| Under 5 Years | 94 (31.9%) | 149 (37.9%) |
| 5 Years | 0 (0.0%) | 0 (0.0%) |
| 6 to 11 Years | 203 (51.0%) | 86 (26.7%) |
| 12 to 14 Years | 116 (36.7%) | 76 (27.1%) |
| 15 Years | 63 (56.2%) | 0 (0.0%) |
| 16 and 17 Years | 99 (39.0%) | 0 (0.0%) |
| 18 to 24 Years | 0 (0.0%) | 67 (35.6%) |
| 25 to 34 Years | 0 (0.0%) | 40 (5.1%) |
| 35 to 44 Years | 78 (10.0%) | 206 (26.1%) |
| 45 to 54 Years | 20 (2.6%) | 48 (5.7%) |
| 55 to 64 Years | 33 (2.9%) | 57 (4.3%) |
| 65 to 74 Years | 17 (2.8%) | 64 (8.7%) |
| 75 Years and over | 16 (3.8%) | 21 (3.6%) |
| Total | 739 (11.9%) | 814 (12.3%) |
Income Above Poverty by Sex and Age in Finneytown
According to the poverty statistics in Finneytown, males aged 5 years and females aged 5 years are the age groups that are most secure financially, with 100.0% of males and 100.0% of females in these age groups living above the poverty line.
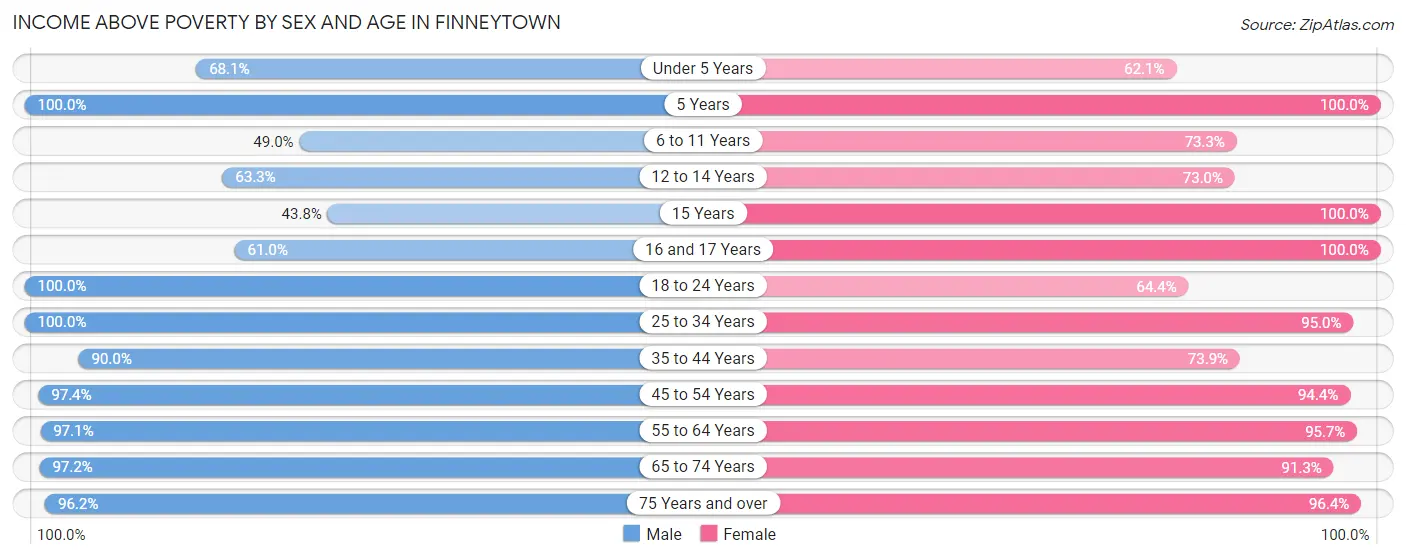
| Age Bracket | Male | Female |
| Under 5 Years | 201 (68.1%) | 244 (62.1%) |
| 5 Years | 93 (100.0%) | 164 (100.0%) |
| 6 to 11 Years | 195 (49.0%) | 236 (73.3%) |
| 12 to 14 Years | 200 (63.3%) | 205 (73.0%) |
| 15 Years | 49 (43.8%) | 93 (100.0%) |
| 16 and 17 Years | 155 (61.0%) | 114 (100.0%) |
| 18 to 24 Years | 213 (100.0%) | 121 (64.4%) |
| 25 to 34 Years | 806 (100.0%) | 752 (95.0%) |
| 35 to 44 Years | 701 (90.0%) | 583 (73.9%) |
| 45 to 54 Years | 762 (97.4%) | 801 (94.4%) |
| 55 to 64 Years | 1,101 (97.1%) | 1,256 (95.7%) |
| 65 to 74 Years | 600 (97.2%) | 671 (91.3%) |
| 75 Years and over | 404 (96.2%) | 562 (96.4%) |
| Total | 5,480 (88.1%) | 5,802 (87.7%) |
Income Below Poverty Among Married-Couple Families in Finneytown
The poverty statistics for married-couple families in Finneytown show that 1.8% or 44 of the total 2,479 families live below the poverty line. Families with no children have the highest poverty rate of 2.5%, comprising of 44 families. On the other hand, families with 1 or 2 children have the lowest poverty rate of 0.0%, which includes 0 families.
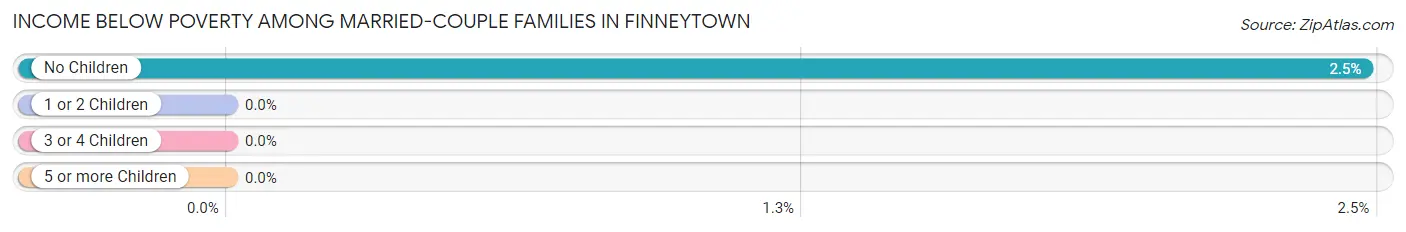
| Children | Above Poverty | Below Poverty |
| No Children | 1,735 (97.5%) | 44 (2.5%) |
| 1 or 2 Children | 554 (100.0%) | 0 (0.0%) |
| 3 or 4 Children | 146 (100.0%) | 0 (0.0%) |
| 5 or more Children | 0 (0.0%) | 0 (0.0%) |
| Total | 2,435 (98.2%) | 44 (1.8%) |
Income Below Poverty Among Single-Parent Households in Finneytown
According to the poverty data in Finneytown, 59.7% or 77 single-father households and 27.5% or 246 single-mother households are living below the poverty line. Among single-father households, those with 1 or 2 children have the highest poverty rate, with 77 households (73.3%) experiencing poverty. Likewise, among single-mother households, those with 5 or more children have the highest poverty rate, with 39 households (100.0%) falling below the poverty line.
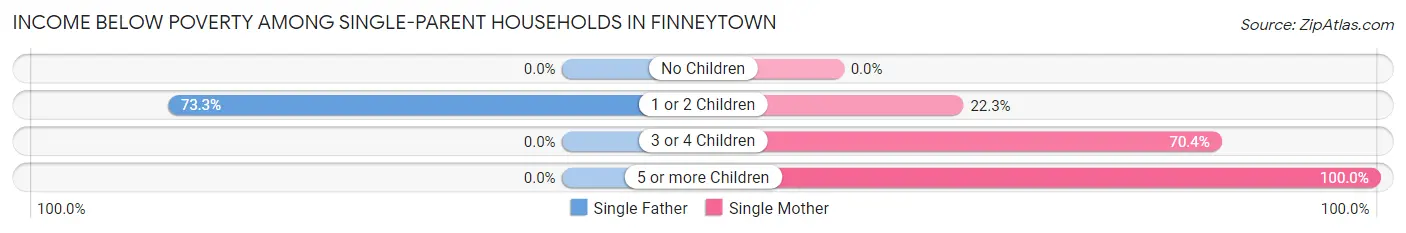
| Children | Single Father | Single Mother |
| No Children | 0 (0.0%) | 0 (0.0%) |
| 1 or 2 Children | 77 (73.3%) | 112 (22.3%) |
| 3 or 4 Children | 0 (0.0%) | 95 (70.4%) |
| 5 or more Children | 0 (0.0%) | 39 (100.0%) |
| Total | 77 (59.7%) | 246 (27.5%) |
Income Below Poverty Among Married-Couple vs Single-Parent Households in Finneytown
The poverty data for Finneytown shows that 44 of the married-couple family households (1.8%) and 323 of the single-parent households (31.5%) are living below the poverty level. Within the married-couple family households, those with no children have the highest poverty rate, with 44 households (2.5%) falling below the poverty line. Among the single-parent households, those with 5 or more children have the highest poverty rate, with 39 household (100.0%) living below poverty.
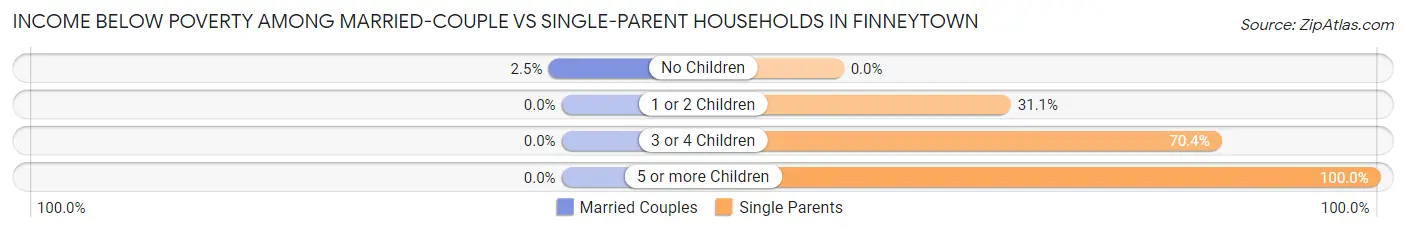
| Children | Married-Couple Families | Single-Parent Households |
| No Children | 44 (2.5%) | 0 (0.0%) |
| 1 or 2 Children | 0 (0.0%) | 189 (31.1%) |
| 3 or 4 Children | 0 (0.0%) | 95 (70.4%) |
| 5 or more Children | 0 (0.0%) | 39 (100.0%) |
| Total | 44 (1.8%) | 323 (31.5%) |
Race in Finneytown
The most populous races in Finneytown are White / Caucasian (6,636 | 51.6%), Black / African American (4,576 | 35.6%), and Two or more Races (929 | 7.2%).
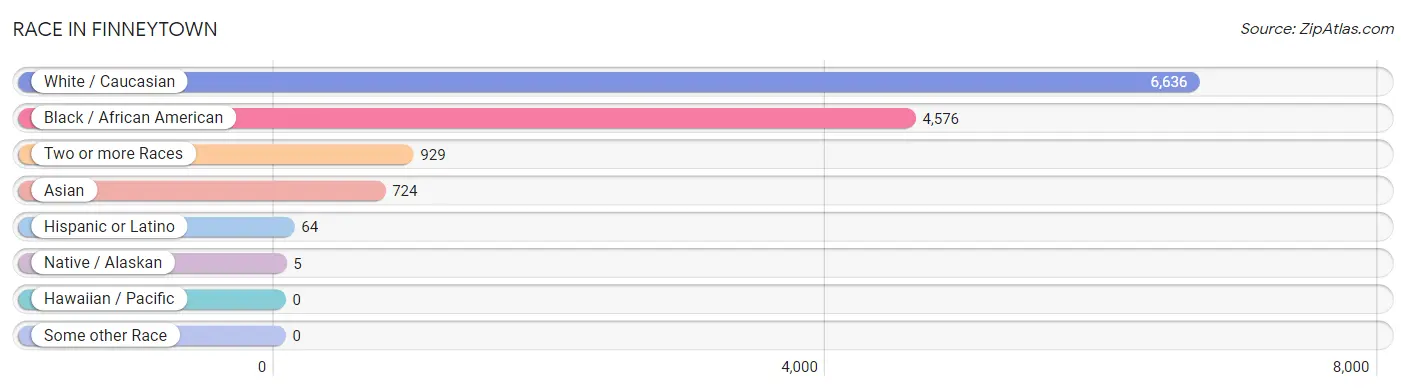
| Race | # Population | % Population |
| Asian | 724 | 5.6% |
| Black / African American | 4,576 | 35.6% |
| Hawaiian / Pacific | 0 | 0.0% |
| Hispanic or Latino | 64 | 0.5% |
| Native / Alaskan | 5 | 0.0% |
| White / Caucasian | 6,636 | 51.6% |
| Two or more Races | 929 | 7.2% |
| Some other Race | 0 | 0.0% |
| Total | 12,870 | 100.0% |
Ancestry in Finneytown
The most populous ancestries reported in Finneytown are German (3,381 | 26.3%), Irish (1,767 | 13.7%), English (1,026 | 8.0%), Italian (556 | 4.3%), and Subsaharan African (484 | 3.8%), together accounting for 56.0% of all Finneytown residents.
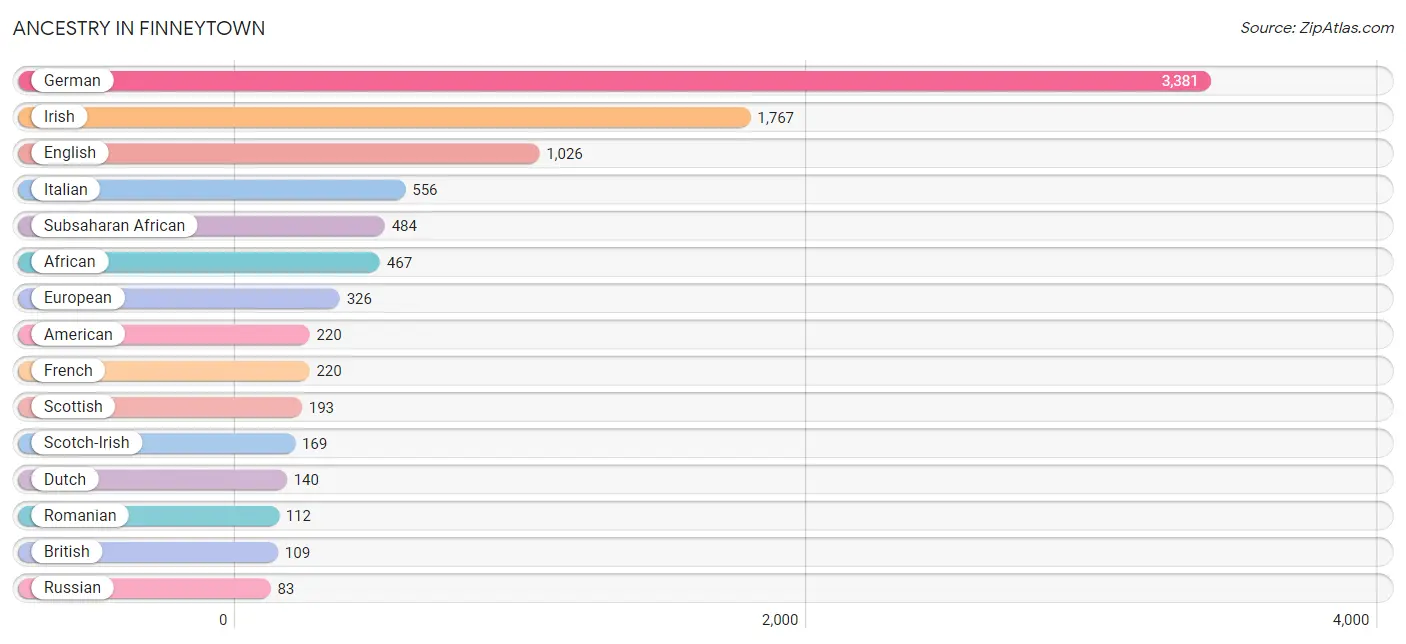
| Ancestry | # Population | % Population |
| African | 467 | 3.6% |
| American | 220 | 1.7% |
| Austrian | 40 | 0.3% |
| Bhutanese | 16 | 0.1% |
| Blackfeet | 3 | 0.0% |
| British | 109 | 0.9% |
| Burmese | 7 | 0.1% |
| Chippewa | 4 | 0.0% |
| Croatian | 8 | 0.1% |
| Czech | 18 | 0.1% |
| Dutch | 140 | 1.1% |
| Eastern European | 50 | 0.4% |
| English | 1,026 | 8.0% |
| European | 326 | 2.5% |
| Finnish | 60 | 0.5% |
| French | 220 | 1.7% |
| German | 3,381 | 26.3% |
| Greek | 66 | 0.5% |
| Hungarian | 61 | 0.5% |
| Irish | 1,767 | 13.7% |
| Italian | 556 | 4.3% |
| Japanese | 16 | 0.1% |
| Korean | 17 | 0.1% |
| Mexican | 39 | 0.3% |
| Nigerian | 17 | 0.1% |
| Norwegian | 54 | 0.4% |
| Polish | 49 | 0.4% |
| Romanian | 112 | 0.9% |
| Russian | 83 | 0.6% |
| Scandinavian | 6 | 0.1% |
| Scotch-Irish | 169 | 1.3% |
| Scottish | 193 | 1.5% |
| Slavic | 22 | 0.2% |
| Spaniard | 22 | 0.2% |
| Subsaharan African | 484 | 3.8% |
| Swedish | 8 | 0.1% |
| Swiss | 83 | 0.6% |
| Thai | 72 | 0.6% |
| Ukrainian | 44 | 0.3% |
| Welsh | 18 | 0.1% | View All 40 Rows |
Immigrants in Finneytown
The most numerous immigrant groups reported in Finneytown came from Europe (331 | 2.6%), France (230 | 1.8%), Western Europe (230 | 1.8%), Asia (223 | 1.7%), and South Central Asia (163 | 1.3%), together accounting for 9.1% of all Finneytown residents.
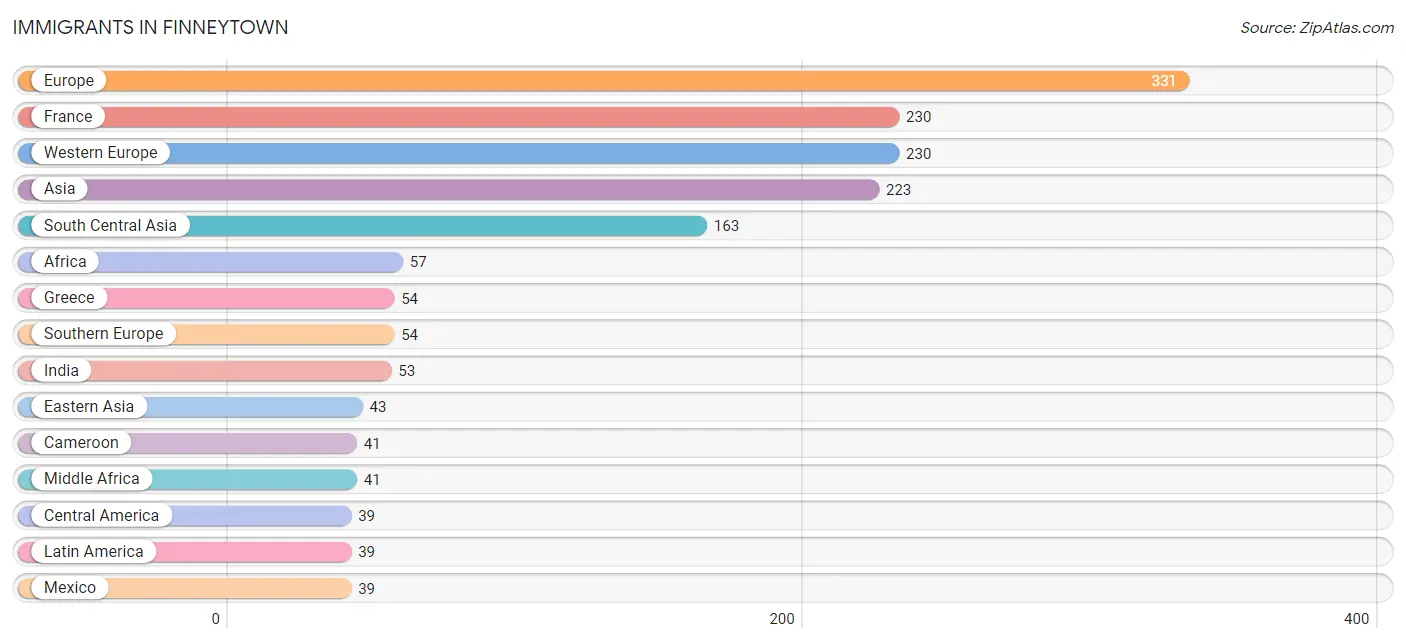
| Immigration Origin | # Population | % Population |
| Africa | 57 | 0.4% |
| Asia | 223 | 1.7% |
| Cameroon | 41 | 0.3% |
| Canada | 11 | 0.1% |
| Central America | 39 | 0.3% |
| China | 36 | 0.3% |
| Eastern Africa | 16 | 0.1% |
| Eastern Asia | 43 | 0.3% |
| Eastern Europe | 12 | 0.1% |
| England | 35 | 0.3% |
| Europe | 331 | 2.6% |
| France | 230 | 1.8% |
| Greece | 54 | 0.4% |
| India | 53 | 0.4% |
| Korea | 7 | 0.1% |
| Latin America | 39 | 0.3% |
| Mexico | 39 | 0.3% |
| Middle Africa | 41 | 0.3% |
| Northern Europe | 35 | 0.3% |
| Pakistan | 19 | 0.2% |
| Philippines | 17 | 0.1% |
| South Central Asia | 163 | 1.3% |
| South Eastern Asia | 17 | 0.1% |
| Southern Europe | 54 | 0.4% |
| Western Europe | 230 | 1.8% |
| Zimbabwe | 16 | 0.1% | View All 26 Rows |
Sex and Age in Finneytown
Sex and Age in Finneytown
The most populous age groups in Finneytown are 60 to 64 Years (705 | 11.3%) for men and 55 to 59 Years (740 | 11.2%) for women.
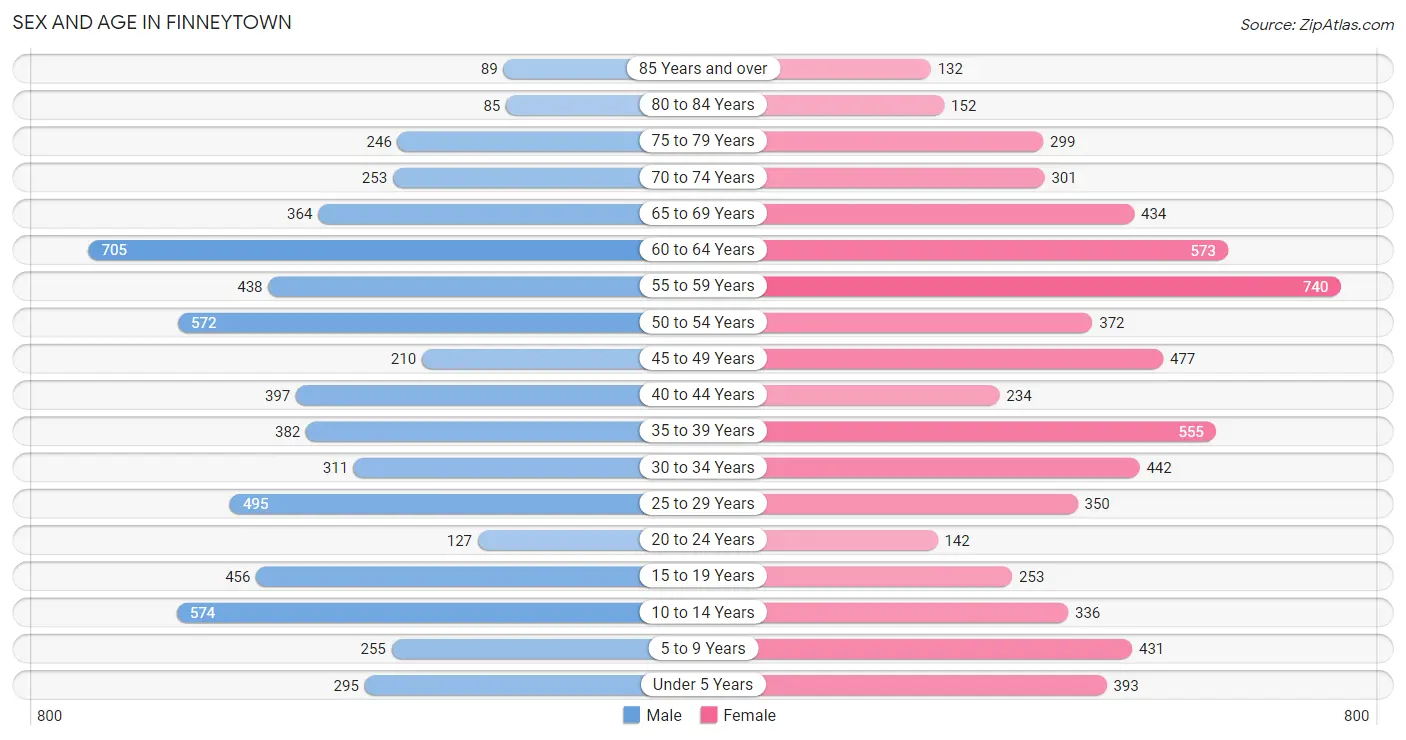
| Age Bracket | Male | Female |
| Under 5 Years | 295 (4.7%) | 393 (5.9%) |
| 5 to 9 Years | 255 (4.1%) | 431 (6.5%) |
| 10 to 14 Years | 574 (9.2%) | 336 (5.1%) |
| 15 to 19 Years | 456 (7.3%) | 253 (3.8%) |
| 20 to 24 Years | 127 (2.0%) | 142 (2.1%) |
| 25 to 29 Years | 495 (7.9%) | 350 (5.3%) |
| 30 to 34 Years | 311 (5.0%) | 442 (6.7%) |
| 35 to 39 Years | 382 (6.1%) | 555 (8.4%) |
| 40 to 44 Years | 397 (6.4%) | 234 (3.5%) |
| 45 to 49 Years | 210 (3.4%) | 477 (7.2%) |
| 50 to 54 Years | 572 (9.1%) | 372 (5.6%) |
| 55 to 59 Years | 438 (7.0%) | 740 (11.2%) |
| 60 to 64 Years | 705 (11.3%) | 573 (8.7%) |
| 65 to 69 Years | 364 (5.8%) | 434 (6.6%) |
| 70 to 74 Years | 253 (4.1%) | 301 (4.5%) |
| 75 to 79 Years | 246 (3.9%) | 299 (4.5%) |
| 80 to 84 Years | 85 (1.4%) | 152 (2.3%) |
| 85 Years and over | 89 (1.4%) | 132 (2.0%) |
| Total | 6,254 (100.0%) | 6,616 (100.0%) |
Families and Households in Finneytown
Median Family Size in Finneytown
The median family size in Finneytown is 2.97 persons per family, with single female/mother families (896 | 25.6%) accounting for the largest median family size of 3.24 persons per family. On the other hand, single male/father families (129 | 3.7%) represent the smallest median family size with 2.14 persons per family.
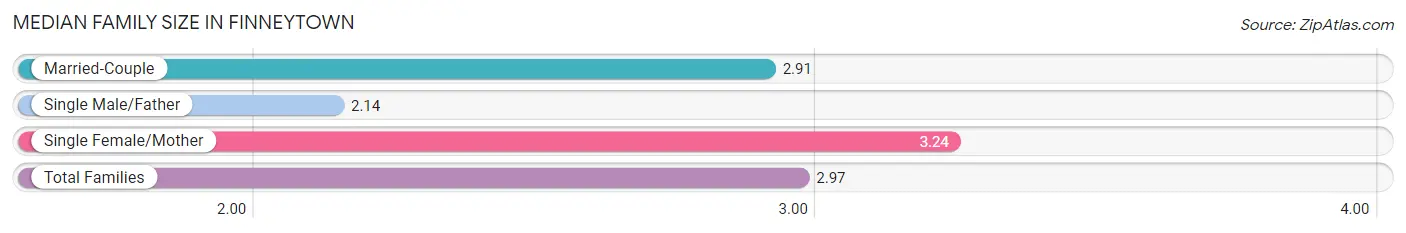
| Family Type | # Families | Family Size |
| Married-Couple | 2,479 (70.8%) | 2.91 |
| Single Male/Father | 129 (3.7%) | 2.14 |
| Single Female/Mother | 896 (25.6%) | 3.24 |
| Total Families | 3,504 (100.0%) | 2.97 |
Median Household Size in Finneytown
The median household size in Finneytown is 2.51 persons per household, with single male/father households (129 | 2.5%) accounting for the largest median household size of 3.43 persons per household. non-family households (1,606 | 31.4%) represent the smallest median household size with 1.33 persons per household.
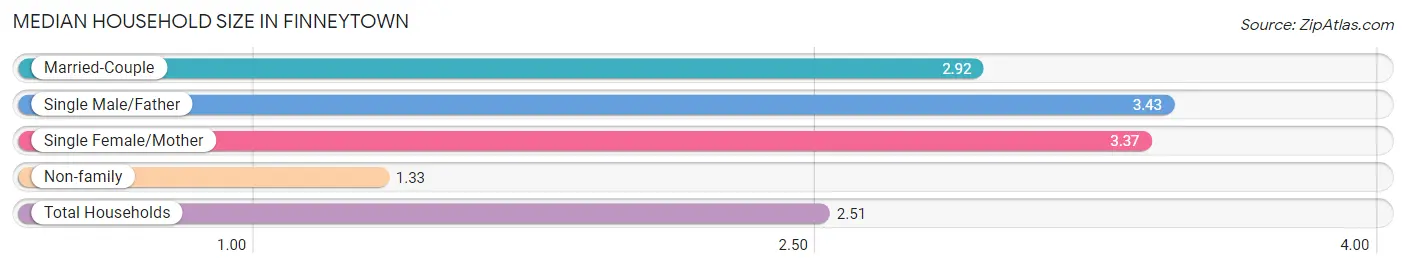
| Household Type | # Households | Household Size |
| Married-Couple | 2,479 (48.5%) | 2.92 |
| Single Male/Father | 129 (2.5%) | 3.43 |
| Single Female/Mother | 896 (17.5%) | 3.37 |
| Non-family | 1,606 (31.4%) | 1.33 |
| Total Households | 5,110 (100.0%) | 2.51 |
Household Size by Marriage Status in Finneytown
Out of a total of 5,110 households in Finneytown, 3,504 (68.6%) are family households, while 1,606 (31.4%) are nonfamily households. The most numerous type of family households are 2-person households, comprising 2,035, and the most common type of nonfamily households are 1-person households, comprising 1,284.
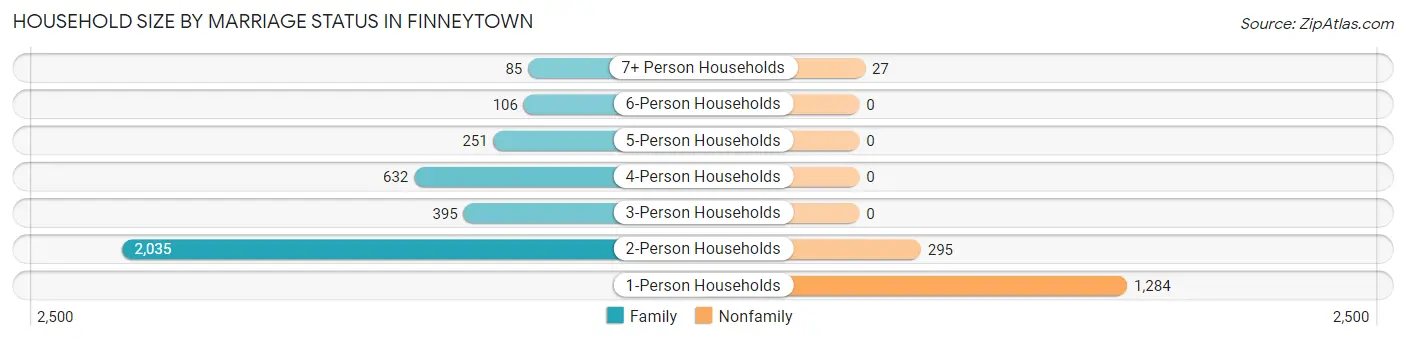
| Household Size | Family Households | Nonfamily Households |
| 1-Person Households | - | 1,284 (25.1%) |
| 2-Person Households | 2,035 (39.8%) | 295 (5.8%) |
| 3-Person Households | 395 (7.7%) | 0 (0.0%) |
| 4-Person Households | 632 (12.4%) | 0 (0.0%) |
| 5-Person Households | 251 (4.9%) | 0 (0.0%) |
| 6-Person Households | 106 (2.1%) | 0 (0.0%) |
| 7+ Person Households | 85 (1.7%) | 27 (0.5%) |
| Total | 3,504 (68.6%) | 1,606 (31.4%) |
Female Fertility in Finneytown
Fertility by Age in Finneytown
Average fertility rate in Finneytown is 89.0 births per 1,000 women. Women in the age bracket of 20 to 34 years have the highest fertility rate with 230.0 births per 1,000 women. Women in the age bracket of 20 to 34 years acount for 96.0% of all women with births.
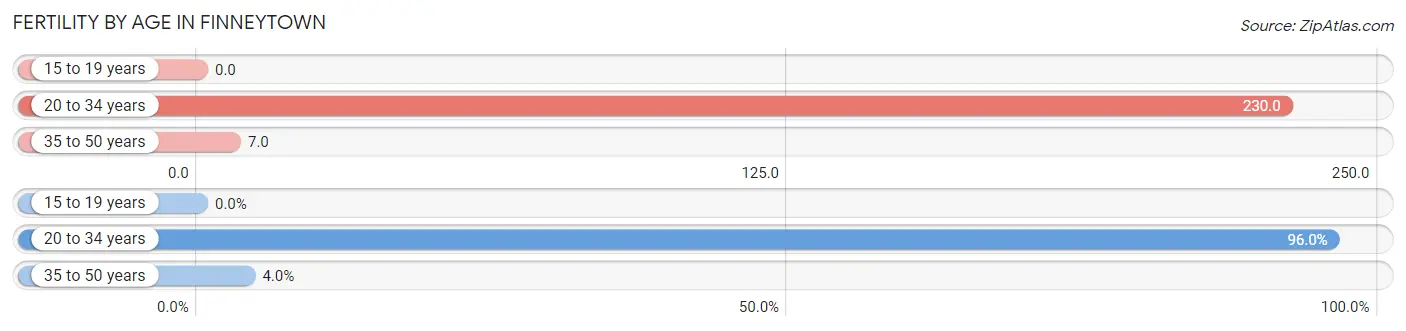
| Age Bracket | Women with Births | Births / 1,000 Women |
| 15 to 19 years | 0 (0.0%) | 0.0 |
| 20 to 34 years | 215 (96.0%) | 230.0 |
| 35 to 50 years | 9 (4.0%) | 7.0 |
| Total | 224 (100.0%) | 89.0 |
Fertility by Age by Marriage Status in Finneytown
72.8% of women with births (224) in Finneytown are married. The highest percentage of unmarried women with births falls into 20 to 34 years age bracket with 28.4% of them unmarried at the time of birth, while the lowest percentage of unmarried women with births belong to 35 to 50 years age bracket with 0.0% of them unmarried.
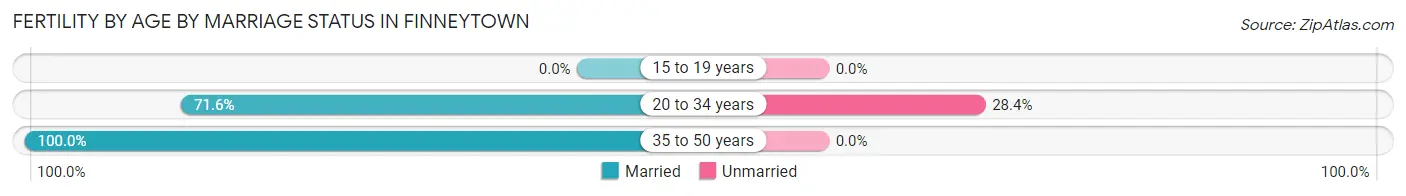
| Age Bracket | Married | Unmarried |
| 15 to 19 years | 0 (0.0%) | 0 (0.0%) |
| 20 to 34 years | 154 (71.6%) | 61 (28.4%) |
| 35 to 50 years | 9 (100.0%) | 0 (0.0%) |
| Total | 163 (72.8%) | 61 (27.2%) |
Fertility by Education in Finneytown
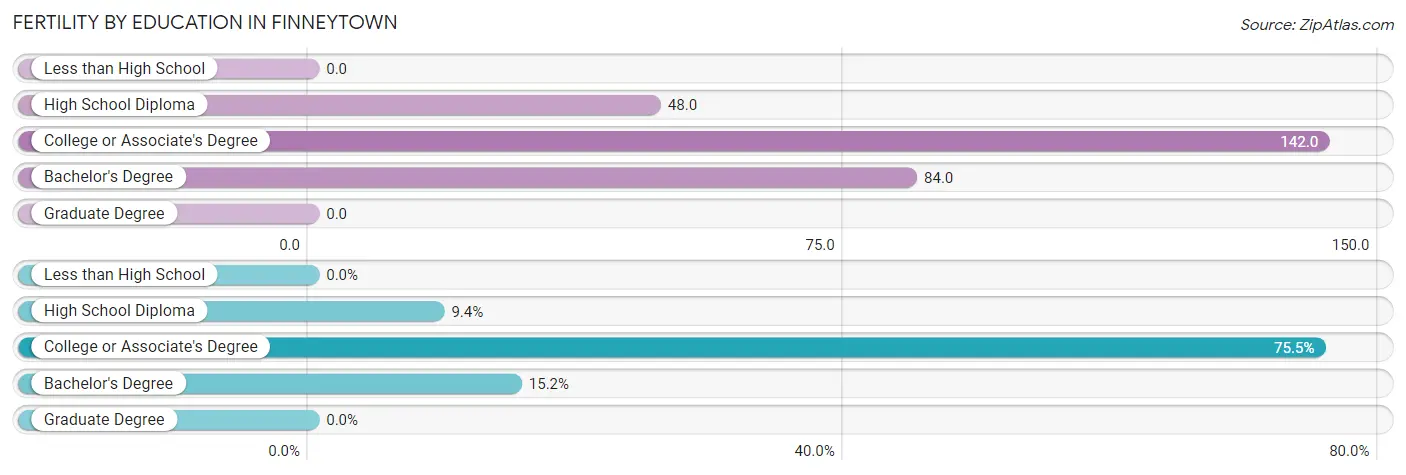
| Educational Attainment | Women with Births | Births / 1,000 Women |
| Less than High School | 0 (0.0%) | 0.0 |
| High School Diploma | 21 (9.4%) | 48.0 |
| College or Associate's Degree | 169 (75.4%) | 142.0 |
| Bachelor's Degree | 34 (15.2%) | 84.0 |
| Graduate Degree | 0 (0.0%) | 0.0 |
| Total | 224 (100.0%) | 89.0 |
Fertility by Education by Marriage Status in Finneytown
27.2% of women with births in Finneytown are unmarried. Women with the educational attainment of high school diploma are most likely to be married with 100.0% of them married at childbirth, while women with the educational attainment of college or associate's degree are least likely to be married with 36.1% of them unmarried at childbirth.
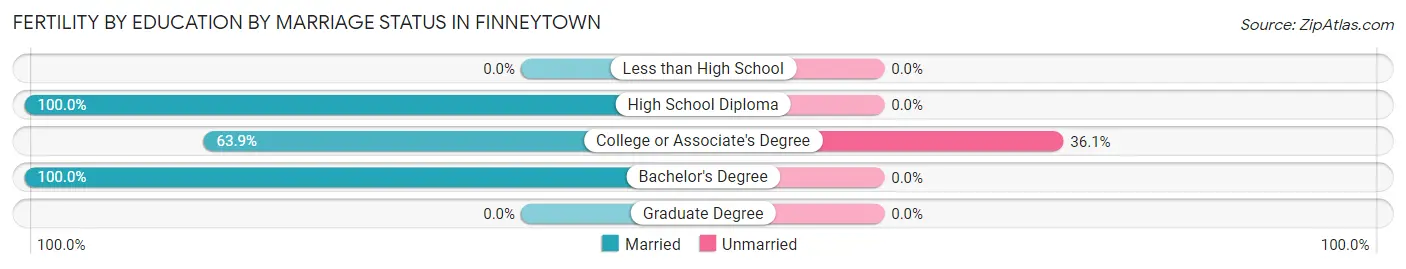
| Educational Attainment | Married | Unmarried |
| Less than High School | 0 (0.0%) | 0 (0.0%) |
| High School Diploma | 21 (100.0%) | 0 (0.0%) |
| College or Associate's Degree | 108 (63.9%) | 61 (36.1%) |
| Bachelor's Degree | 34 (100.0%) | 0 (0.0%) |
| Graduate Degree | 0 (0.0%) | 0 (0.0%) |
| Total | 163 (72.8%) | 61 (27.2%) |
Employment Characteristics in Finneytown
Employment by Class of Employer in Finneytown
Among the 5,849 employed individuals in Finneytown, private company employees (4,086 | 69.9%), not-for-profit organizations (976 | 16.7%), and local government employees (287 | 4.9%) make up the most common classes of employment.
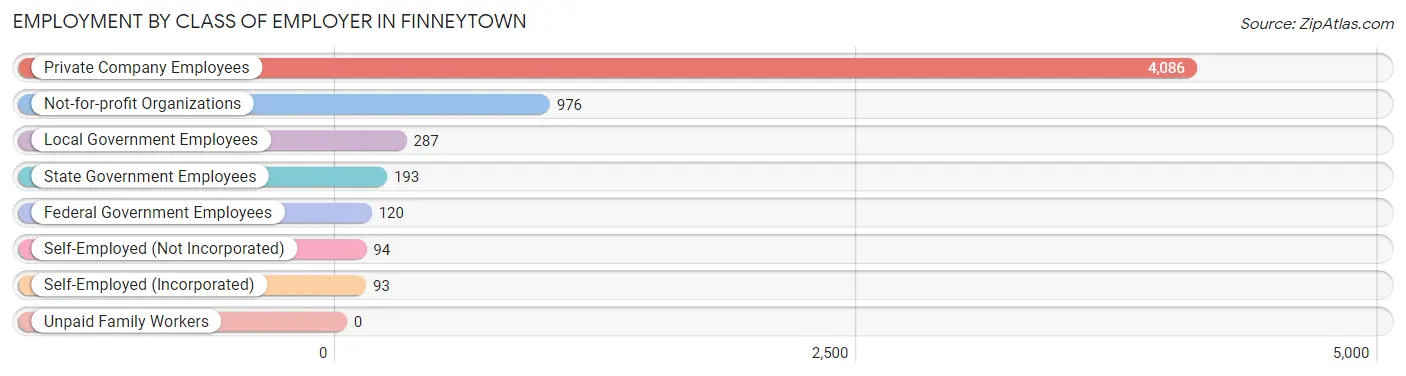
| Employer Class | # Employees | % Employees |
| Private Company Employees | 4,086 | 69.9% |
| Self-Employed (Incorporated) | 93 | 1.6% |
| Self-Employed (Not Incorporated) | 94 | 1.6% |
| Not-for-profit Organizations | 976 | 16.7% |
| Local Government Employees | 287 | 4.9% |
| State Government Employees | 193 | 3.3% |
| Federal Government Employees | 120 | 2.1% |
| Unpaid Family Workers | 0 | 0.0% |
| Total | 5,849 | 100.0% |
Employment Status by Age in Finneytown
According to the labor force statistics for Finneytown, out of the total population over 16 years of age (10,380), 64.8% or 6,726 individuals are in the labor force, with 5.4% or 363 of them unemployed. The age group with the highest labor force participation rate is 35 to 44 years, with 89.0% or 1,396 individuals in the labor force. Within the labor force, the 25 to 29 years age range has the highest percentage of unemployed individuals, with 18.8% or 139 of them being unemployed.
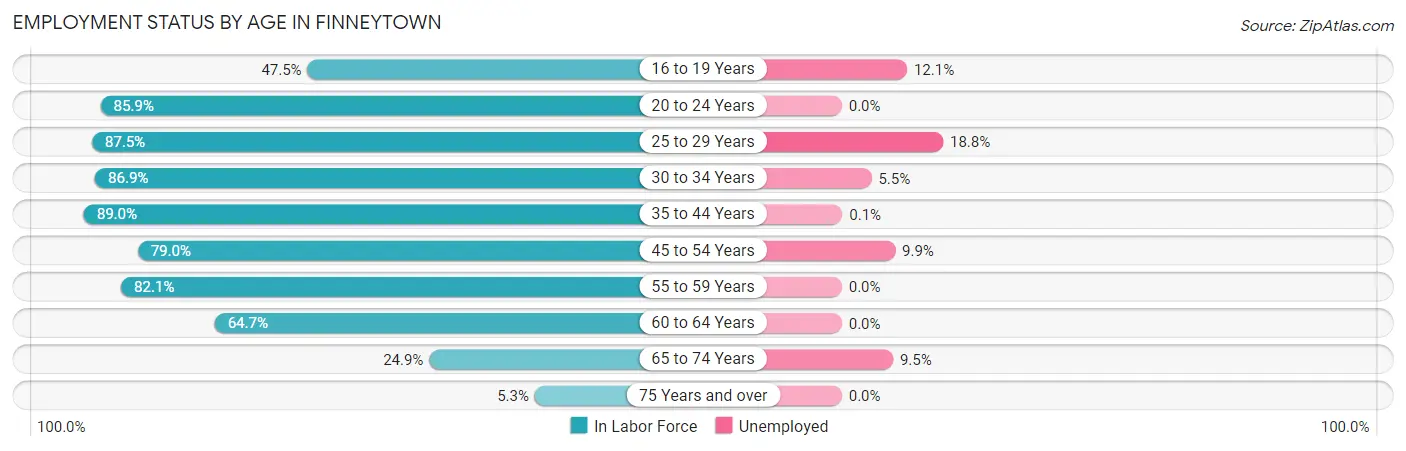
| Age Bracket | In Labor Force | Unemployed |
| 16 to 19 Years | 239 (47.5%) | 29 (12.1%) |
| 20 to 24 Years | 231 (85.9%) | 0 (0.0%) |
| 25 to 29 Years | 739 (87.5%) | 139 (18.8%) |
| 30 to 34 Years | 654 (86.9%) | 36 (5.5%) |
| 35 to 44 Years | 1,396 (89.0%) | 1 (0.1%) |
| 45 to 54 Years | 1,288 (79.0%) | 128 (9.9%) |
| 55 to 59 Years | 967 (82.1%) | 0 (0.0%) |
| 60 to 64 Years | 827 (64.7%) | 0 (0.0%) |
| 65 to 74 Years | 337 (24.9%) | 32 (9.5%) |
| 75 Years and over | 53 (5.3%) | 0 (0.0%) |
| Total | 6,726 (64.8%) | 363 (5.4%) |
Employment Status by Educational Attainment in Finneytown
According to labor force statistics for Finneytown, 80.9% of individuals (5,868) out of the total population between 25 and 64 years of age (7,253) are in the labor force, with 5.2% or 305 of them being unemployed. The group with the highest labor force participation rate are those with the educational attainment of bachelor's degree or higher, with 93.5% or 2,072 individuals in the labor force. Within the labor force, individuals with college / associate degree education have the highest percentage of unemployment, with 7.8% or 169 of them being unemployed.
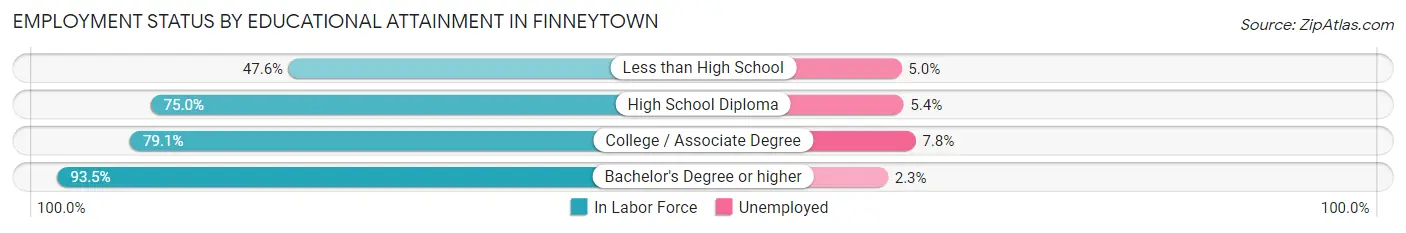
| Educational Attainment | In Labor Force | Unemployed |
| Less than High School | 161 (47.6%) | 17 (5.0%) |
| High School Diploma | 1,475 (75.0%) | 106 (5.4%) |
| College / Associate Degree | 2,161 (79.1%) | 213 (7.8%) |
| Bachelor's Degree or higher | 2,072 (93.5%) | 51 (2.3%) |
| Total | 5,868 (80.9%) | 377 (5.2%) |
Employment Occupations by Sex in Finneytown
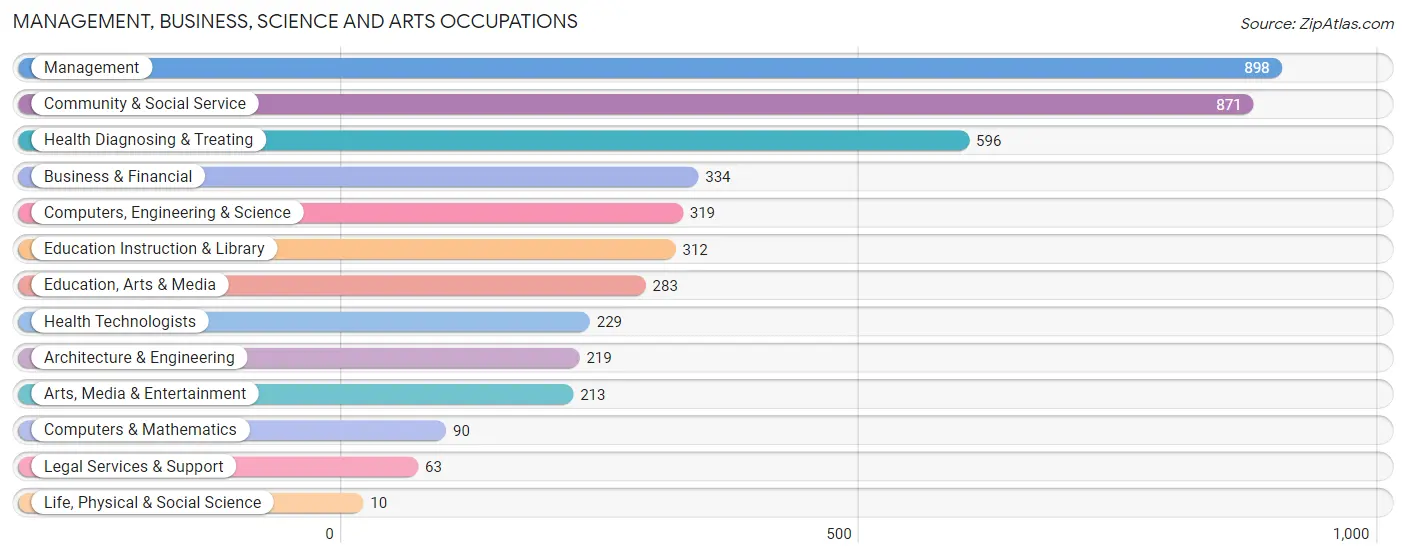
Management, Business, Science and Arts Occupations
The most common Management, Business, Science and Arts occupations in Finneytown are Management (898 | 14.1%), Community & Social Service (871 | 13.7%), Health Diagnosing & Treating (596 | 9.4%), Business & Financial (334 | 5.2%), and Computers, Engineering & Science (319 | 5.0%).
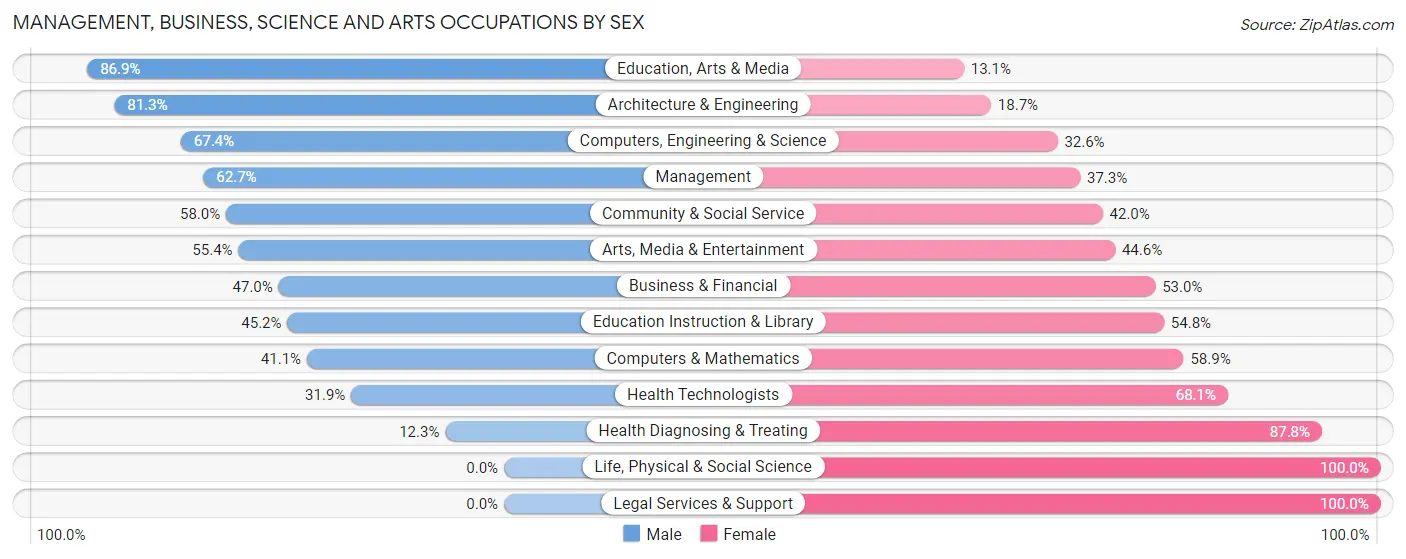
Management, Business, Science and Arts Occupations by Sex
Within the Management, Business, Science and Arts occupations in Finneytown, the most male-oriented occupations are Education, Arts & Media (86.9%), Architecture & Engineering (81.3%), and Computers, Engineering & Science (67.4%), while the most female-oriented occupations are Life, Physical & Social Science (100.0%), Legal Services & Support (100.0%), and Health Diagnosing & Treating (87.7%).
| Occupation | Male | Female |
| Management | 563 (62.7%) | 335 (37.3%) |
| Business & Financial | 157 (47.0%) | 177 (53.0%) |
| Computers, Engineering & Science | 215 (67.4%) | 104 (32.6%) |
| Computers & Mathematics | 37 (41.1%) | 53 (58.9%) |
| Architecture & Engineering | 178 (81.3%) | 41 (18.7%) |
| Life, Physical & Social Science | 0 (0.0%) | 10 (100.0%) |
| Community & Social Service | 505 (58.0%) | 366 (42.0%) |
| Education, Arts & Media | 246 (86.9%) | 37 (13.1%) |
| Legal Services & Support | 0 (0.0%) | 63 (100.0%) |
| Education Instruction & Library | 141 (45.2%) | 171 (54.8%) |
| Arts, Media & Entertainment | 118 (55.4%) | 95 (44.6%) |
| Health Diagnosing & Treating | 73 (12.2%) | 523 (87.7%) |
| Health Technologists | 73 (31.9%) | 156 (68.1%) |
| Total (Category) | 1,513 (50.1%) | 1,505 (49.9%) |
| Total (Overall) | 3,142 (49.4%) | 3,224 (50.6%) |
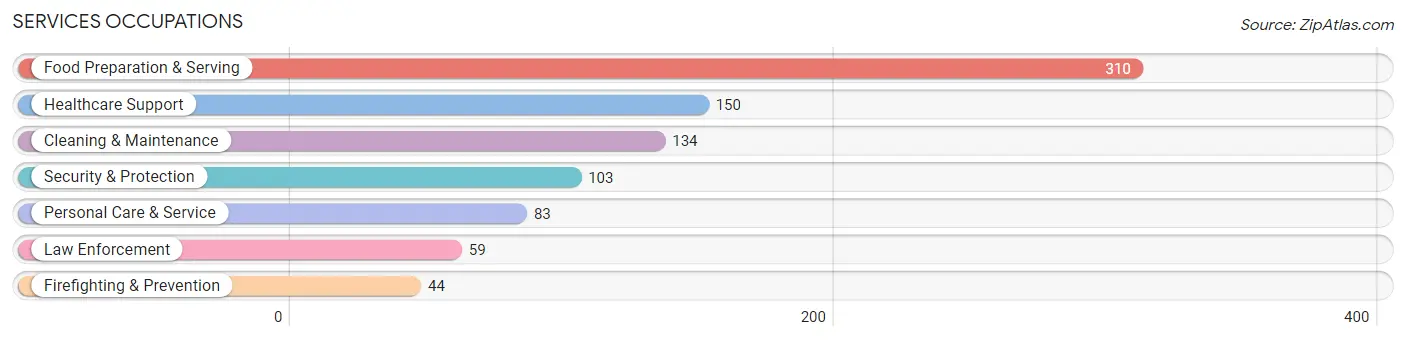
Services Occupations
The most common Services occupations in Finneytown are Food Preparation & Serving (310 | 4.9%), Healthcare Support (150 | 2.4%), Cleaning & Maintenance (134 | 2.1%), Security & Protection (103 | 1.6%), and Personal Care & Service (83 | 1.3%).
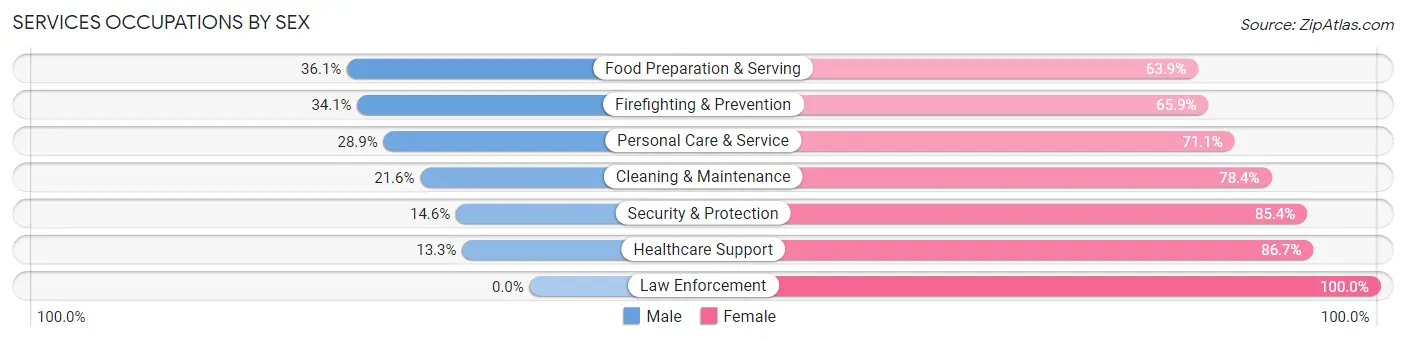
Services Occupations by Sex
Within the Services occupations in Finneytown, the most male-oriented occupations are Food Preparation & Serving (36.1%), Firefighting & Prevention (34.1%), and Personal Care & Service (28.9%), while the most female-oriented occupations are Law Enforcement (100.0%), Healthcare Support (86.7%), and Security & Protection (85.4%).
| Occupation | Male | Female |
| Healthcare Support | 20 (13.3%) | 130 (86.7%) |
| Security & Protection | 15 (14.6%) | 88 (85.4%) |
| Firefighting & Prevention | 15 (34.1%) | 29 (65.9%) |
| Law Enforcement | 0 (0.0%) | 59 (100.0%) |
| Food Preparation & Serving | 112 (36.1%) | 198 (63.9%) |
| Cleaning & Maintenance | 29 (21.6%) | 105 (78.4%) |
| Personal Care & Service | 24 (28.9%) | 59 (71.1%) |
| Total (Category) | 200 (25.6%) | 580 (74.4%) |
| Total (Overall) | 3,142 (49.4%) | 3,224 (50.6%) |
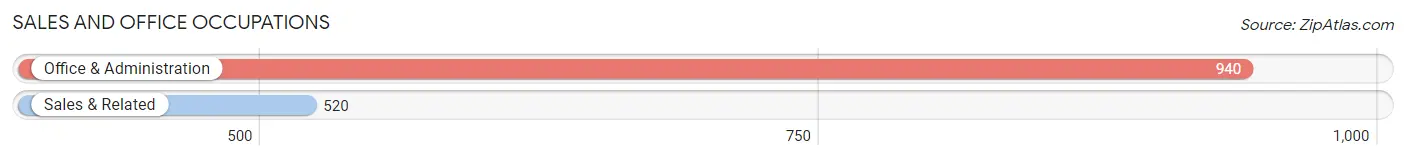
Sales and Office Occupations
The most common Sales and Office occupations in Finneytown are Office & Administration (940 | 14.8%), and Sales & Related (520 | 8.2%).
Sales and Office Occupations by Sex
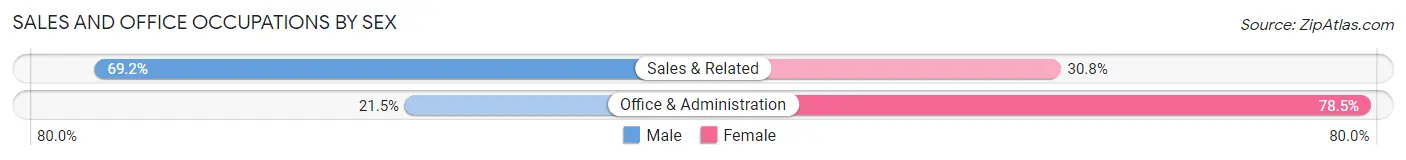
| Occupation | Male | Female |
| Sales & Related | 360 (69.2%) | 160 (30.8%) |
| Office & Administration | 202 (21.5%) | 738 (78.5%) |
| Total (Category) | 562 (38.5%) | 898 (61.5%) |
| Total (Overall) | 3,142 (49.4%) | 3,224 (50.6%) |
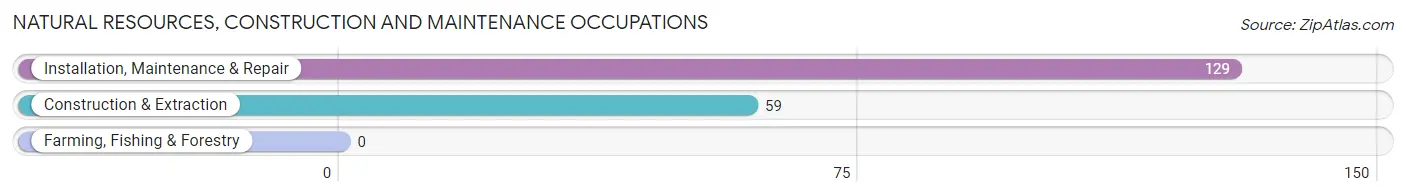
Natural Resources, Construction and Maintenance Occupations
The most common Natural Resources, Construction and Maintenance occupations in Finneytown are Installation, Maintenance & Repair (129 | 2.0%), and Construction & Extraction (59 | 0.9%).
Natural Resources, Construction and Maintenance Occupations by Sex
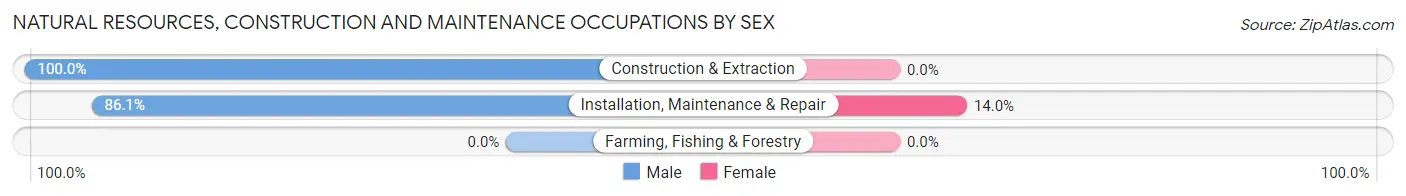
| Occupation | Male | Female |
| Farming, Fishing & Forestry | 0 (0.0%) | 0 (0.0%) |
| Construction & Extraction | 59 (100.0%) | 0 (0.0%) |
| Installation, Maintenance & Repair | 111 (86.1%) | 18 (14.0%) |
| Total (Category) | 170 (90.4%) | 18 (9.6%) |
| Total (Overall) | 3,142 (49.4%) | 3,224 (50.6%) |
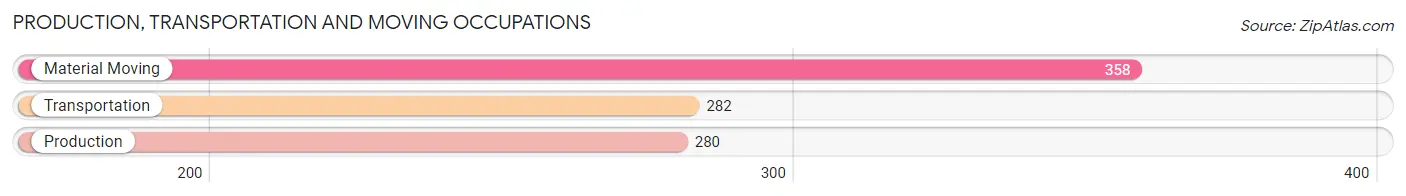
Production, Transportation and Moving Occupations
The most common Production, Transportation and Moving occupations in Finneytown are Material Moving (358 | 5.6%), Transportation (282 | 4.4%), and Production (280 | 4.4%).
Production, Transportation and Moving Occupations by Sex
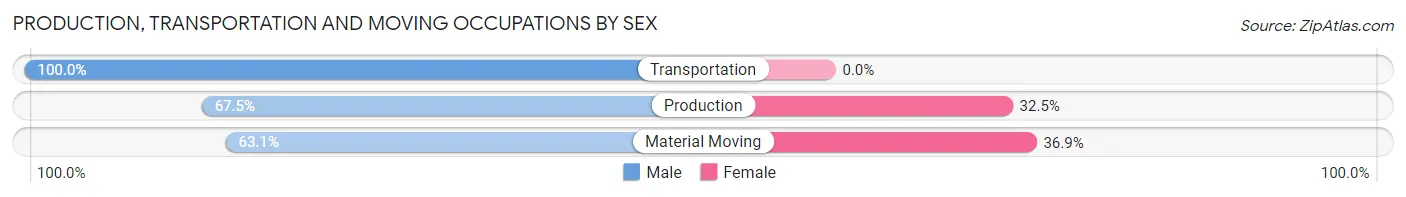
| Occupation | Male | Female |
| Production | 189 (67.5%) | 91 (32.5%) |
| Transportation | 282 (100.0%) | 0 (0.0%) |
| Material Moving | 226 (63.1%) | 132 (36.9%) |
| Total (Category) | 697 (75.8%) | 223 (24.2%) |
| Total (Overall) | 3,142 (49.4%) | 3,224 (50.6%) |
Employment Industries by Sex in Finneytown
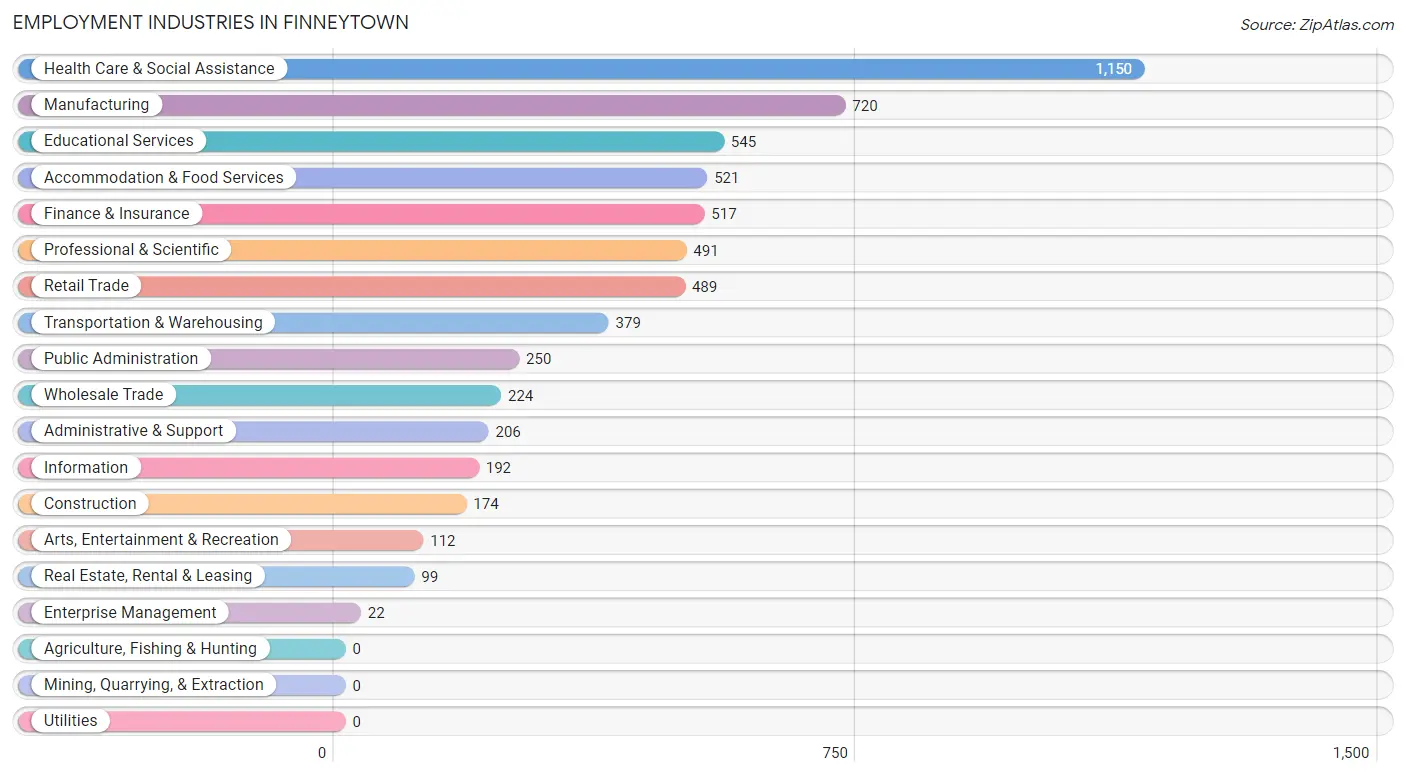
Employment Industries in Finneytown
The major employment industries in Finneytown include Health Care & Social Assistance (1,150 | 18.1%), Manufacturing (720 | 11.3%), Educational Services (545 | 8.6%), Accommodation & Food Services (521 | 8.2%), and Finance & Insurance (517 | 8.1%).
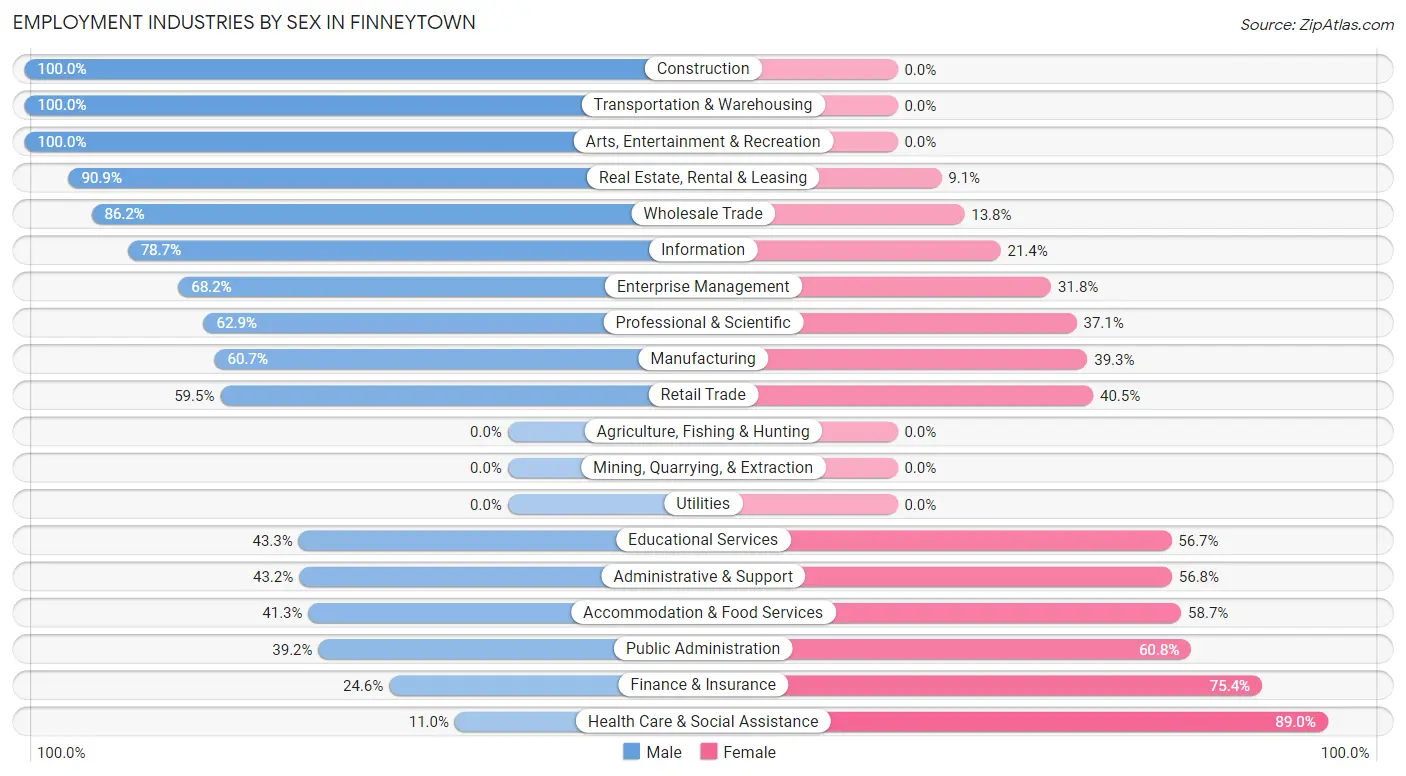
Employment Industries by Sex in Finneytown
The Finneytown industries that see more men than women are Construction (100.0%), Transportation & Warehousing (100.0%), and Arts, Entertainment & Recreation (100.0%), whereas the industries that tend to have a higher number of women are Health Care & Social Assistance (89.0%), Finance & Insurance (75.4%), and Public Administration (60.8%).
| Industry | Male | Female |
| Agriculture, Fishing & Hunting | 0 (0.0%) | 0 (0.0%) |
| Mining, Quarrying, & Extraction | 0 (0.0%) | 0 (0.0%) |
| Construction | 174 (100.0%) | 0 (0.0%) |
| Manufacturing | 437 (60.7%) | 283 (39.3%) |
| Wholesale Trade | 193 (86.2%) | 31 (13.8%) |
| Retail Trade | 291 (59.5%) | 198 (40.5%) |
| Transportation & Warehousing | 379 (100.0%) | 0 (0.0%) |
| Utilities | 0 (0.0%) | 0 (0.0%) |
| Information | 151 (78.6%) | 41 (21.3%) |
| Finance & Insurance | 127 (24.6%) | 390 (75.4%) |
| Real Estate, Rental & Leasing | 90 (90.9%) | 9 (9.1%) |
| Professional & Scientific | 309 (62.9%) | 182 (37.1%) |
| Enterprise Management | 15 (68.2%) | 7 (31.8%) |
| Administrative & Support | 89 (43.2%) | 117 (56.8%) |
| Educational Services | 236 (43.3%) | 309 (56.7%) |
| Health Care & Social Assistance | 126 (11.0%) | 1,024 (89.0%) |
| Arts, Entertainment & Recreation | 112 (100.0%) | 0 (0.0%) |
| Accommodation & Food Services | 215 (41.3%) | 306 (58.7%) |
| Public Administration | 98 (39.2%) | 152 (60.8%) |
| Total | 3,142 (49.4%) | 3,224 (50.6%) |
Education in Finneytown
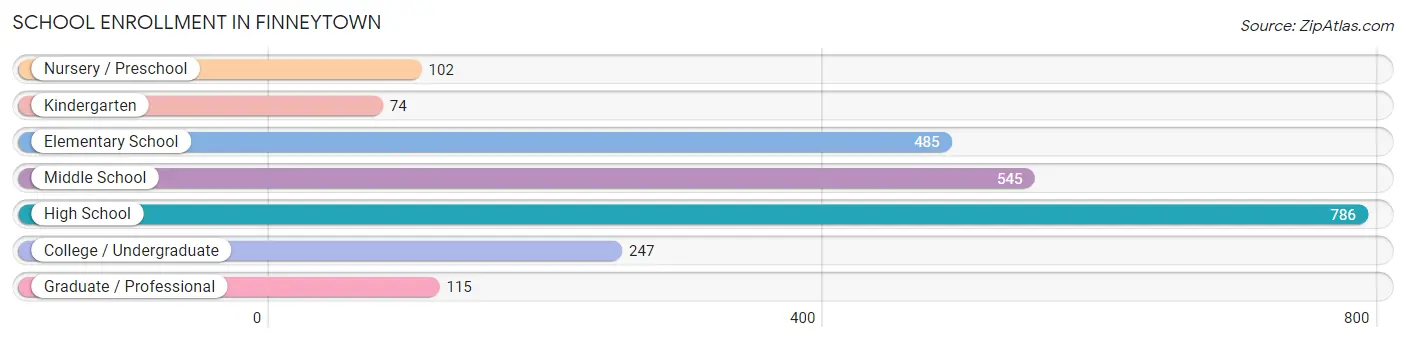
School Enrollment in Finneytown
The most common levels of schooling among the 2,354 students in Finneytown are high school (786 | 33.4%), middle school (545 | 23.2%), and elementary school (485 | 20.6%).
| School Level | # Students | % Students |
| Nursery / Preschool | 102 | 4.3% |
| Kindergarten | 74 | 3.1% |
| Elementary School | 485 | 20.6% |
| Middle School | 545 | 23.2% |
| High School | 786 | 33.4% |
| College / Undergraduate | 247 | 10.5% |
| Graduate / Professional | 115 | 4.9% |
| Total | 2,354 | 100.0% |
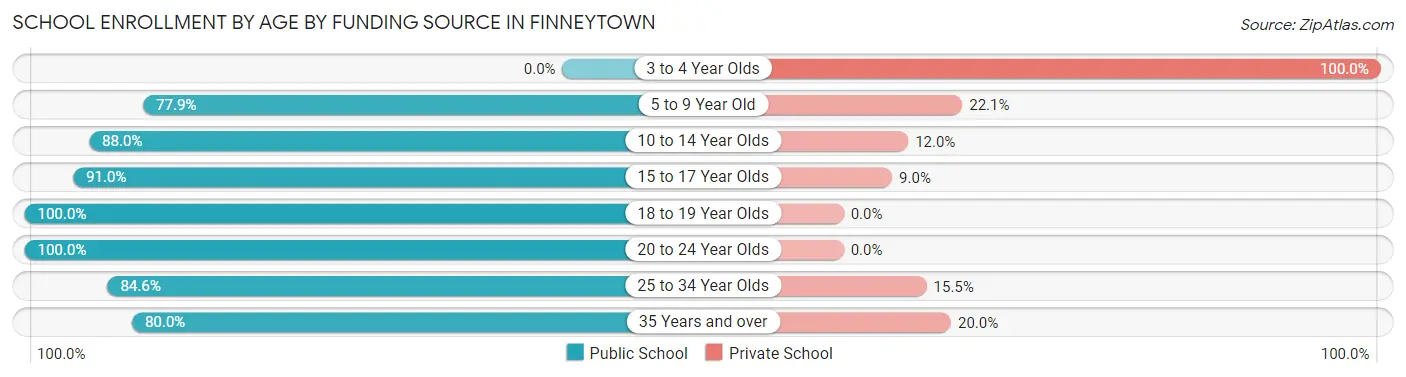
School Enrollment by Age by Funding Source in Finneytown
Out of a total of 2,354 students who are enrolled in schools in Finneytown, 332 (14.1%) attend a private institution, while the remaining 2,022 (85.9%) are enrolled in public schools. The age group of 3 to 4 year olds has the highest likelihood of being enrolled in private schools, with 11 (100.0% in the age bracket) enrolled. Conversely, the age group of 18 to 19 year olds has the lowest likelihood of being enrolled in a private school, with 60 (100.0% in the age bracket) attending a public institution.
| Age Bracket | Public School | Private School |
| 3 to 4 Year Olds | 0 (0.0%) | 11 (100.0%) |
| 5 to 9 Year Old | 448 (77.9%) | 127 (22.1%) |
| 10 to 14 Year Olds | 688 (88.0%) | 94 (12.0%) |
| 15 to 17 Year Olds | 524 (91.0%) | 52 (9.0%) |
| 18 to 19 Year Olds | 60 (100.0%) | 0 (0.0%) |
| 20 to 24 Year Olds | 87 (100.0%) | 0 (0.0%) |
| 25 to 34 Year Olds | 104 (84.6%) | 19 (15.4%) |
| 35 Years and over | 112 (80.0%) | 28 (20.0%) |
| Total | 2,022 (85.9%) | 332 (14.1%) |
Educational Attainment by Field of Study in Finneytown
Business (592 | 17.6%), education (466 | 13.9%), arts & humanities (292 | 8.7%), engineering (277 | 8.3%), and science & technology (259 | 7.7%) are the most common fields of study among 3,356 individuals in Finneytown who have obtained a bachelor's degree or higher.
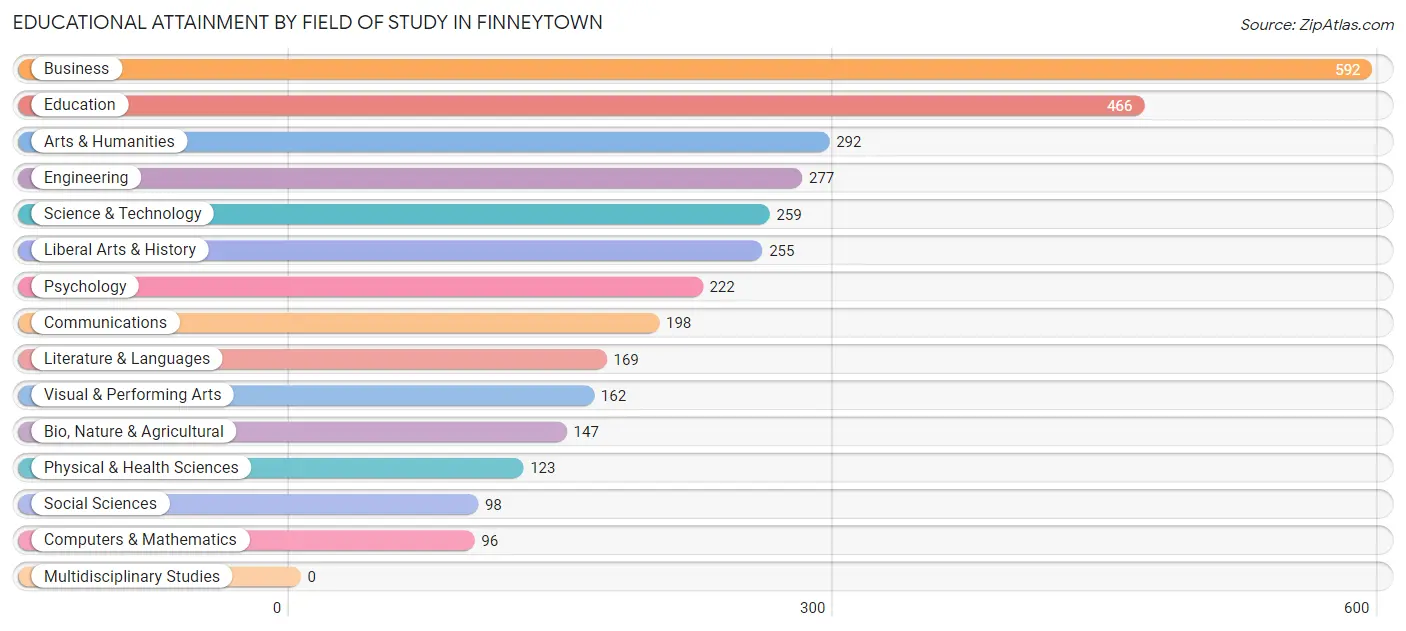
| Field of Study | # Graduates | % Graduates |
| Computers & Mathematics | 96 | 2.9% |
| Bio, Nature & Agricultural | 147 | 4.4% |
| Physical & Health Sciences | 123 | 3.7% |
| Psychology | 222 | 6.6% |
| Social Sciences | 98 | 2.9% |
| Engineering | 277 | 8.3% |
| Multidisciplinary Studies | 0 | 0.0% |
| Science & Technology | 259 | 7.7% |
| Business | 592 | 17.6% |
| Education | 466 | 13.9% |
| Literature & Languages | 169 | 5.0% |
| Liberal Arts & History | 255 | 7.6% |
| Visual & Performing Arts | 162 | 4.8% |
| Communications | 198 | 5.9% |
| Arts & Humanities | 292 | 8.7% |
| Total | 3,356 | 100.0% |
Transportation & Commute in Finneytown
Vehicle Availability by Sex in Finneytown
The most prevalent vehicle ownership categories in Finneytown are males with 2 vehicles (1,573, accounting for 52.6%) and females with 2 vehicles (1,565, making up 55.1%).
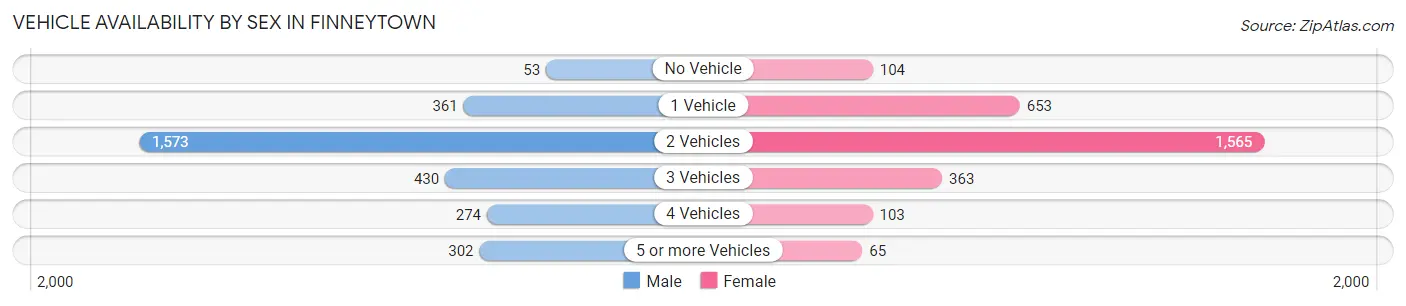
| Vehicles Available | Male | Female |
| No Vehicle | 53 (1.8%) | 104 (3.6%) |
| 1 Vehicle | 361 (12.1%) | 653 (22.9%) |
| 2 Vehicles | 1,573 (52.6%) | 1,565 (54.8%) |
| 3 Vehicles | 430 (14.4%) | 363 (12.7%) |
| 4 Vehicles | 274 (9.1%) | 103 (3.6%) |
| 5 or more Vehicles | 302 (10.1%) | 65 (2.3%) |
| Total | 2,993 (100.0%) | 2,853 (100.0%) |
Commute Time in Finneytown
The most frequently occuring commute durations in Finneytown are 20 to 24 minutes (1,475 commuters, 29.1%), 15 to 19 minutes (905 commuters, 17.9%), and 30 to 34 minutes (748 commuters, 14.8%).
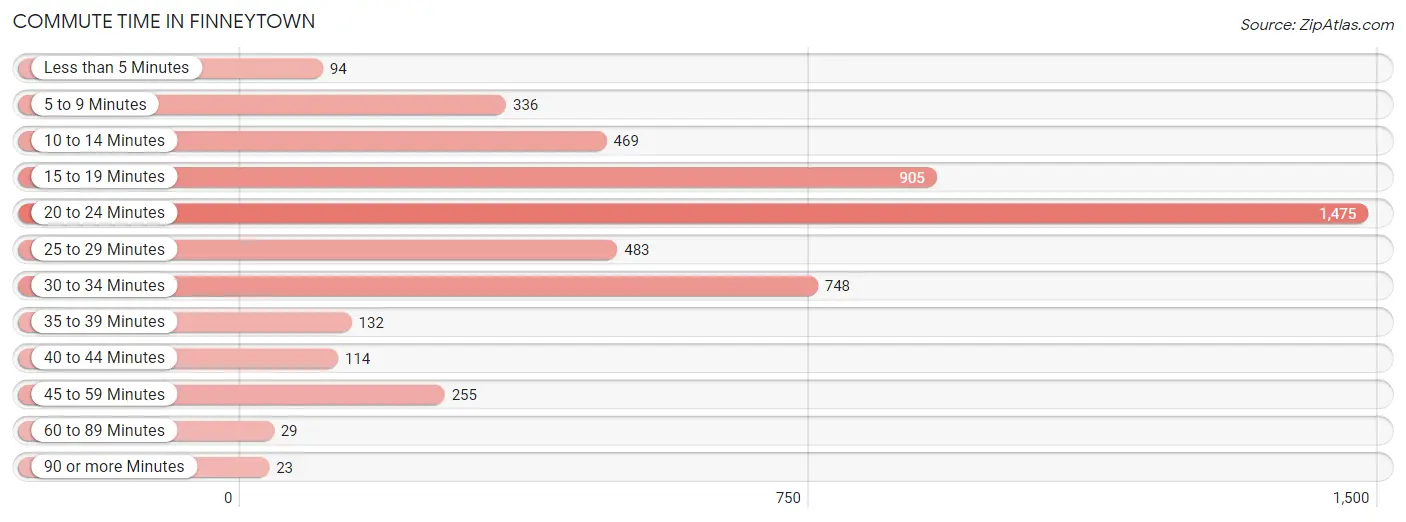
| Commute Time | # Commuters | % Commuters |
| Less than 5 Minutes | 94 | 1.9% |
| 5 to 9 Minutes | 336 | 6.6% |
| 10 to 14 Minutes | 469 | 9.3% |
| 15 to 19 Minutes | 905 | 17.9% |
| 20 to 24 Minutes | 1,475 | 29.1% |
| 25 to 29 Minutes | 483 | 9.5% |
| 30 to 34 Minutes | 748 | 14.8% |
| 35 to 39 Minutes | 132 | 2.6% |
| 40 to 44 Minutes | 114 | 2.2% |
| 45 to 59 Minutes | 255 | 5.0% |
| 60 to 89 Minutes | 29 | 0.6% |
| 90 or more Minutes | 23 | 0.4% |
Commute Time by Sex in Finneytown
The most common commute times in Finneytown are 20 to 24 minutes (700 commuters, 26.4%) for males and 20 to 24 minutes (775 commuters, 32.1%) for females.
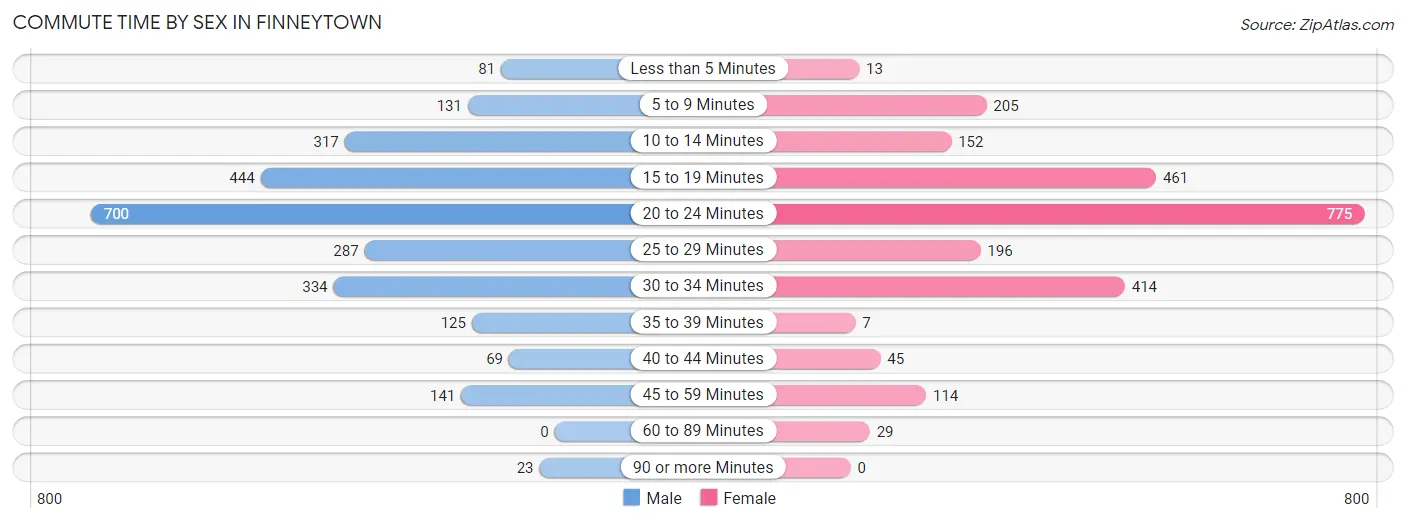
| Commute Time | Male | Female |
| Less than 5 Minutes | 81 (3.0%) | 13 (0.5%) |
| 5 to 9 Minutes | 131 (4.9%) | 205 (8.5%) |
| 10 to 14 Minutes | 317 (11.9%) | 152 (6.3%) |
| 15 to 19 Minutes | 444 (16.7%) | 461 (19.1%) |
| 20 to 24 Minutes | 700 (26.4%) | 775 (32.1%) |
| 25 to 29 Minutes | 287 (10.8%) | 196 (8.1%) |
| 30 to 34 Minutes | 334 (12.6%) | 414 (17.2%) |
| 35 to 39 Minutes | 125 (4.7%) | 7 (0.3%) |
| 40 to 44 Minutes | 69 (2.6%) | 45 (1.9%) |
| 45 to 59 Minutes | 141 (5.3%) | 114 (4.7%) |
| 60 to 89 Minutes | 0 (0.0%) | 29 (1.2%) |
| 90 or more Minutes | 23 (0.9%) | 0 (0.0%) |
Time of Departure to Work by Sex in Finneytown
The most frequent times of departure to work in Finneytown are 7:30 AM to 7:59 AM (352, 13.3%) for males and 7:00 AM to 7:29 AM (626, 26.0%) for females.
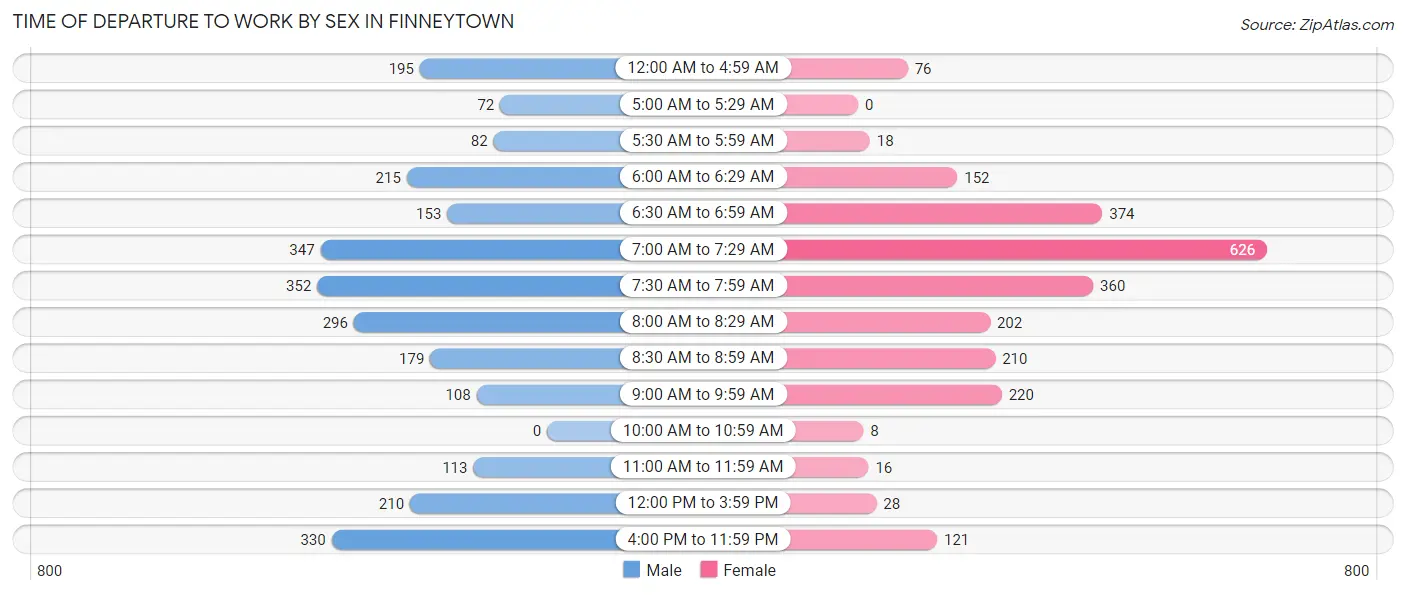
| Time of Departure | Male | Female |
| 12:00 AM to 4:59 AM | 195 (7.3%) | 76 (3.2%) |
| 5:00 AM to 5:29 AM | 72 (2.7%) | 0 (0.0%) |
| 5:30 AM to 5:59 AM | 82 (3.1%) | 18 (0.7%) |
| 6:00 AM to 6:29 AM | 215 (8.1%) | 152 (6.3%) |
| 6:30 AM to 6:59 AM | 153 (5.8%) | 374 (15.5%) |
| 7:00 AM to 7:29 AM | 347 (13.1%) | 626 (26.0%) |
| 7:30 AM to 7:59 AM | 352 (13.3%) | 360 (14.9%) |
| 8:00 AM to 8:29 AM | 296 (11.2%) | 202 (8.4%) |
| 8:30 AM to 8:59 AM | 179 (6.8%) | 210 (8.7%) |
| 9:00 AM to 9:59 AM | 108 (4.1%) | 220 (9.1%) |
| 10:00 AM to 10:59 AM | 0 (0.0%) | 8 (0.3%) |
| 11:00 AM to 11:59 AM | 113 (4.3%) | 16 (0.7%) |
| 12:00 PM to 3:59 PM | 210 (7.9%) | 28 (1.2%) |
| 4:00 PM to 11:59 PM | 330 (12.4%) | 121 (5.0%) |
| Total | 2,652 (100.0%) | 2,411 (100.0%) |
Housing Occupancy in Finneytown
Occupancy by Ownership in Finneytown
Of the total 5,110 dwellings in Finneytown, owner-occupied units account for 4,189 (82.0%), while renter-occupied units make up 921 (18.0%).
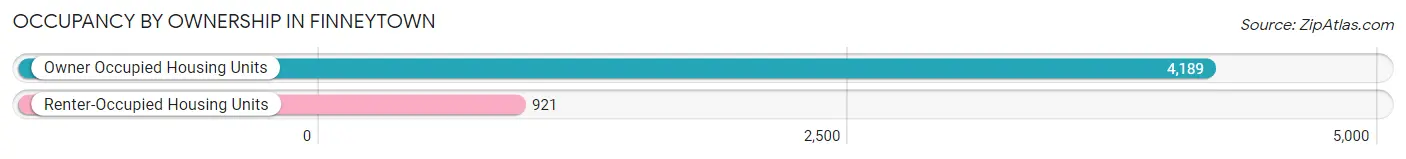
| Occupancy | # Housing Units | % Housing Units |
| Owner Occupied Housing Units | 4,189 | 82.0% |
| Renter-Occupied Housing Units | 921 | 18.0% |
| Total Occupied Housing Units | 5,110 | 100.0% |
Occupancy by Household Size in Finneytown
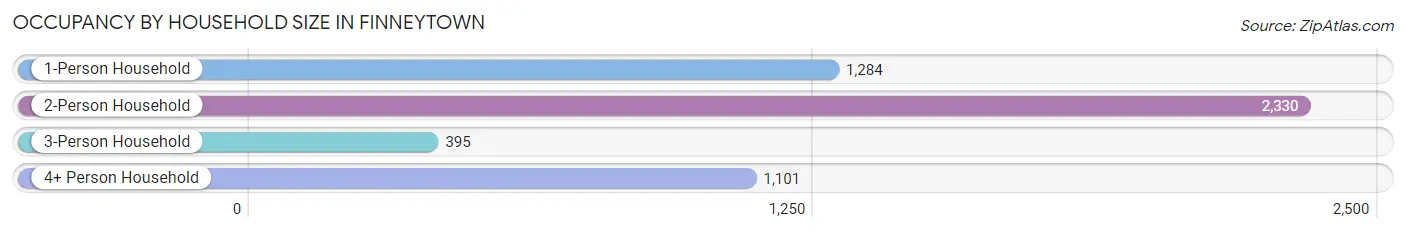
| Household Size | # Housing Units | % Housing Units |
| 1-Person Household | 1,284 | 25.1% |
| 2-Person Household | 2,330 | 45.6% |
| 3-Person Household | 395 | 7.7% |
| 4+ Person Household | 1,101 | 21.5% |
| Total Housing Units | 5,110 | 100.0% |
Occupancy by Ownership by Household Size in Finneytown
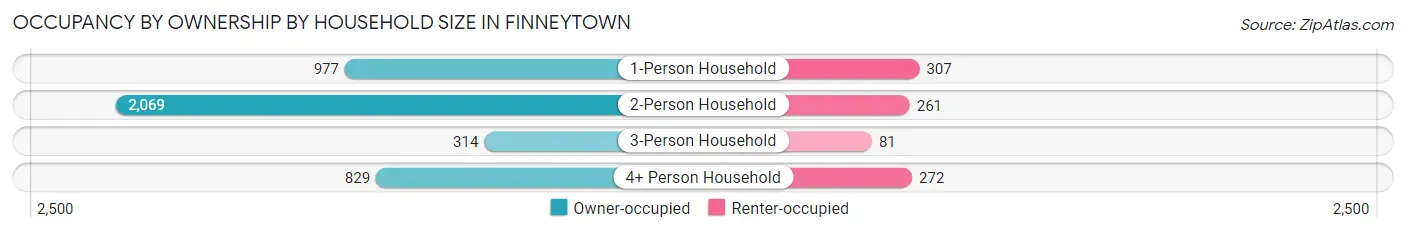
| Household Size | Owner-occupied | Renter-occupied |
| 1-Person Household | 977 (76.1%) | 307 (23.9%) |
| 2-Person Household | 2,069 (88.8%) | 261 (11.2%) |
| 3-Person Household | 314 (79.5%) | 81 (20.5%) |
| 4+ Person Household | 829 (75.3%) | 272 (24.7%) |
| Total Housing Units | 4,189 (82.0%) | 921 (18.0%) |
Occupancy by Educational Attainment in Finneytown
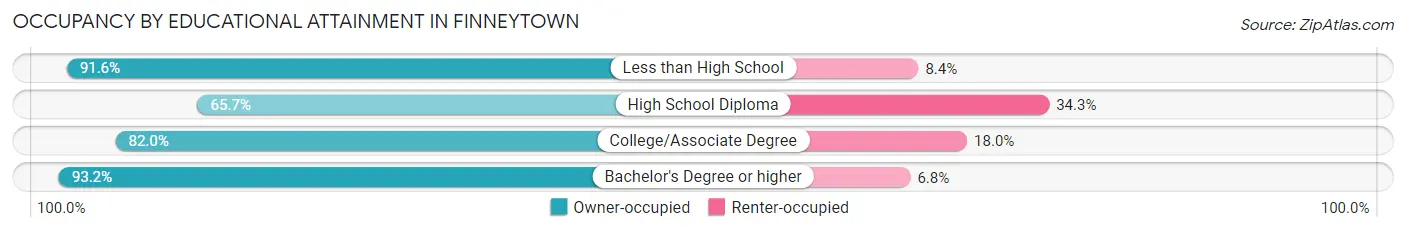
| Household Size | Owner-occupied | Renter-occupied |
| Less than High School | 175 (91.6%) | 16 (8.4%) |
| High School Diploma | 852 (65.7%) | 445 (34.3%) |
| College/Associate Degree | 1,558 (82.0%) | 343 (18.0%) |
| Bachelor's Degree or higher | 1,604 (93.2%) | 117 (6.8%) |
Occupancy by Age of Householder in Finneytown
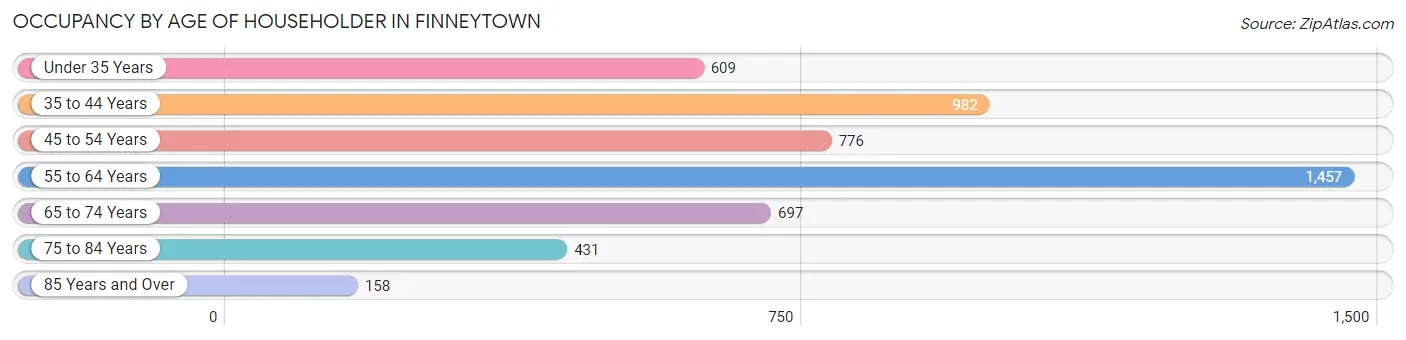
| Age Bracket | # Households | % Households |
| Under 35 Years | 609 | 11.9% |
| 35 to 44 Years | 982 | 19.2% |
| 45 to 54 Years | 776 | 15.2% |
| 55 to 64 Years | 1,457 | 28.5% |
| 65 to 74 Years | 697 | 13.6% |
| 75 to 84 Years | 431 | 8.4% |
| 85 Years and Over | 158 | 3.1% |
| Total | 5,110 | 100.0% |
Housing Finances in Finneytown
Median Income by Occupancy in Finneytown
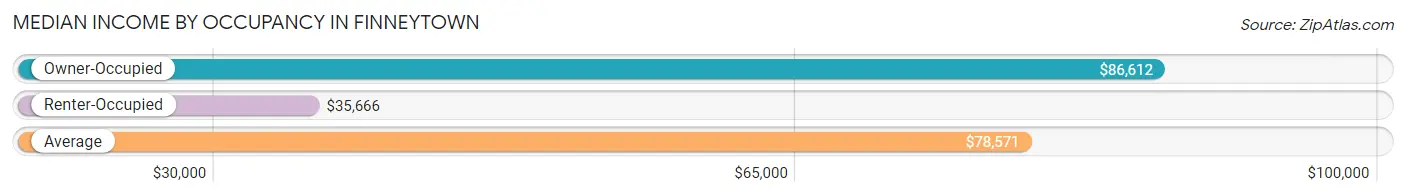
| Occupancy Type | # Households | Median Income |
| Owner-Occupied | 4,189 (82.0%) | $86,612 |
| Renter-Occupied | 921 (18.0%) | $35,666 |
| Average | 5,110 (100.0%) | $78,571 |
Occupancy by Householder Income Bracket in Finneytown
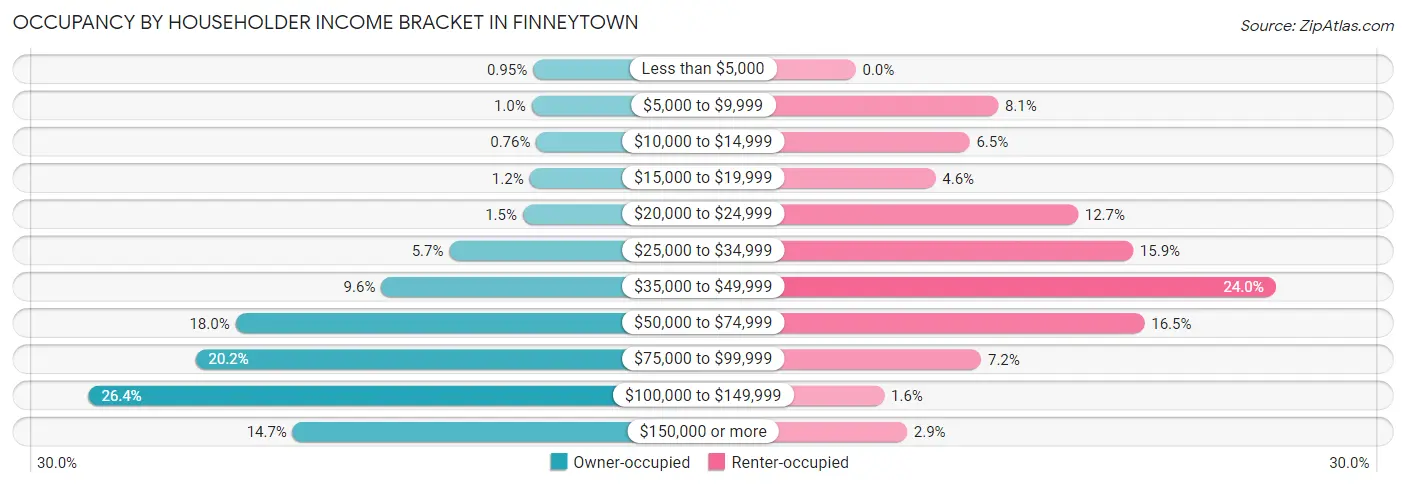
| Income Bracket | Owner-occupied | Renter-occupied |
| Less than $5,000 | 40 (0.9%) | 0 (0.0%) |
| $5,000 to $9,999 | 43 (1.0%) | 75 (8.1%) |
| $10,000 to $14,999 | 32 (0.8%) | 60 (6.5%) |
| $15,000 to $19,999 | 48 (1.1%) | 42 (4.6%) |
| $20,000 to $24,999 | 64 (1.5%) | 117 (12.7%) |
| $25,000 to $34,999 | 240 (5.7%) | 146 (15.9%) |
| $35,000 to $49,999 | 403 (9.6%) | 221 (24.0%) |
| $50,000 to $74,999 | 752 (17.9%) | 152 (16.5%) |
| $75,000 to $99,999 | 848 (20.2%) | 66 (7.2%) |
| $100,000 to $149,999 | 1,104 (26.4%) | 15 (1.6%) |
| $150,000 or more | 615 (14.7%) | 27 (2.9%) |
| Total | 4,189 (100.0%) | 921 (100.0%) |
Monthly Housing Cost Tiers in Finneytown
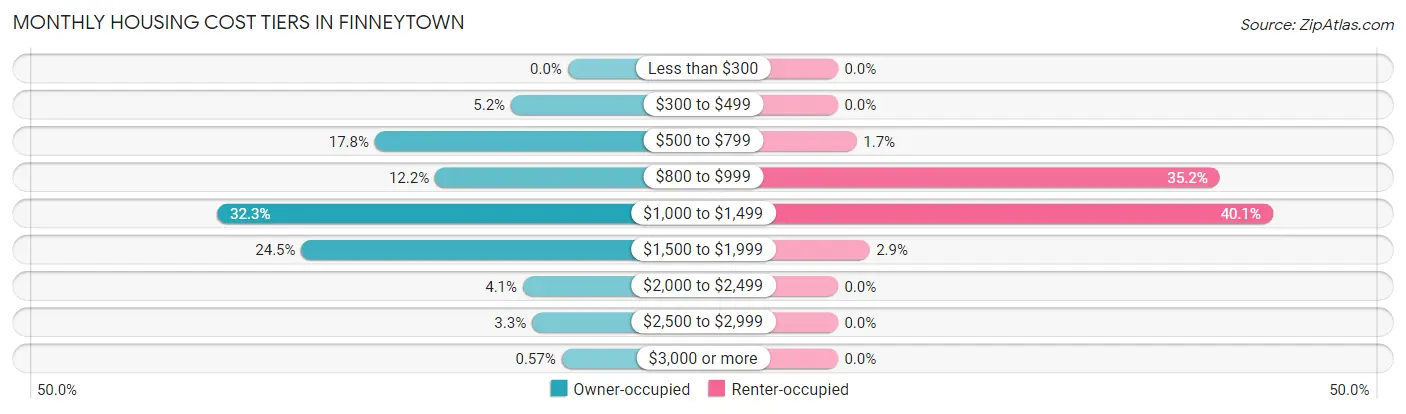
| Monthly Cost | Owner-occupied | Renter-occupied |
| Less than $300 | 0 (0.0%) | 0 (0.0%) |
| $300 to $499 | 219 (5.2%) | 0 (0.0%) |
| $500 to $799 | 744 (17.8%) | 16 (1.7%) |
| $800 to $999 | 512 (12.2%) | 324 (35.2%) |
| $1,000 to $1,499 | 1,352 (32.3%) | 369 (40.1%) |
| $1,500 to $1,999 | 1,027 (24.5%) | 27 (2.9%) |
| $2,000 to $2,499 | 173 (4.1%) | 0 (0.0%) |
| $2,500 to $2,999 | 138 (3.3%) | 0 (0.0%) |
| $3,000 or more | 24 (0.6%) | 0 (0.0%) |
| Total | 4,189 (100.0%) | 921 (100.0%) |
Physical Housing Characteristics in Finneytown
Housing Structures in Finneytown
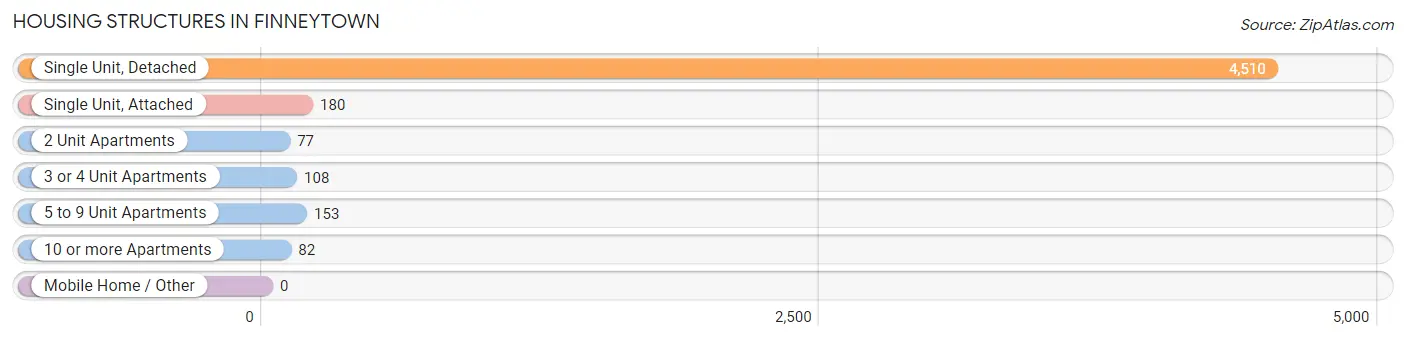
| Structure Type | # Housing Units | % Housing Units |
| Single Unit, Detached | 4,510 | 88.3% |
| Single Unit, Attached | 180 | 3.5% |
| 2 Unit Apartments | 77 | 1.5% |
| 3 or 4 Unit Apartments | 108 | 2.1% |
| 5 to 9 Unit Apartments | 153 | 3.0% |
| 10 or more Apartments | 82 | 1.6% |
| Mobile Home / Other | 0 | 0.0% |
| Total | 5,110 | 100.0% |
Housing Structures by Occupancy in Finneytown
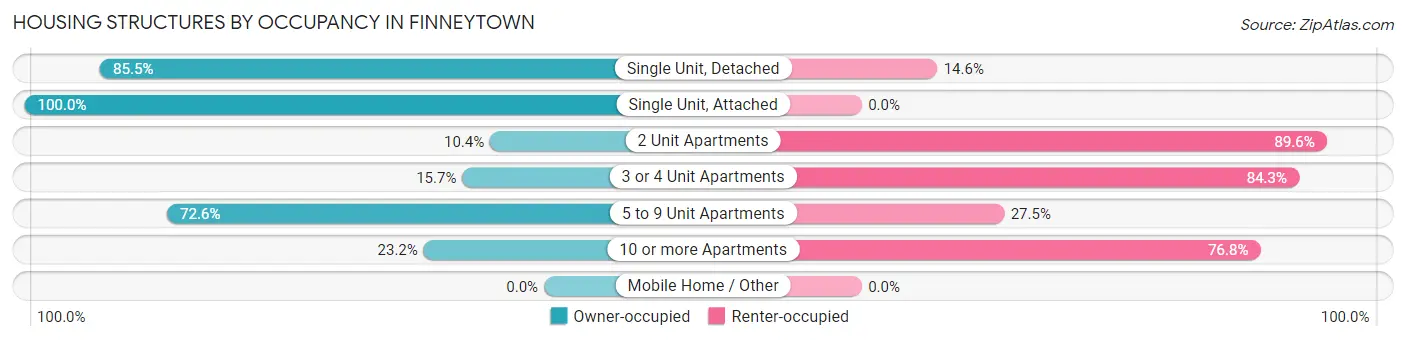
| Structure Type | Owner-occupied | Renter-occupied |
| Single Unit, Detached | 3,854 (85.5%) | 656 (14.5%) |
| Single Unit, Attached | 180 (100.0%) | 0 (0.0%) |
| 2 Unit Apartments | 8 (10.4%) | 69 (89.6%) |
| 3 or 4 Unit Apartments | 17 (15.7%) | 91 (84.3%) |
| 5 to 9 Unit Apartments | 111 (72.6%) | 42 (27.5%) |
| 10 or more Apartments | 19 (23.2%) | 63 (76.8%) |
| Mobile Home / Other | 0 (0.0%) | 0 (0.0%) |
| Total | 4,189 (82.0%) | 921 (18.0%) |
Housing Structures by Number of Rooms in Finneytown
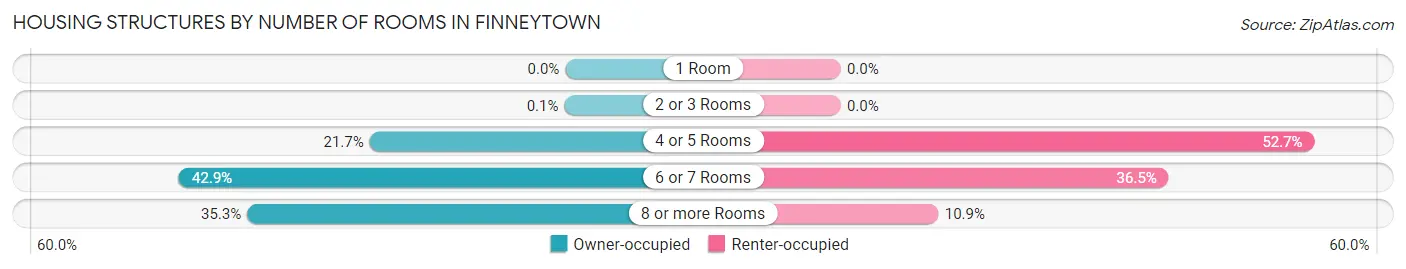
| Number of Rooms | Owner-occupied | Renter-occupied |
| 1 Room | 0 (0.0%) | 0 (0.0%) |
| 2 or 3 Rooms | 4 (0.1%) | 0 (0.0%) |
| 4 or 5 Rooms | 910 (21.7%) | 485 (52.7%) |
| 6 or 7 Rooms | 1,796 (42.9%) | 336 (36.5%) |
| 8 or more Rooms | 1,479 (35.3%) | 100 (10.9%) |
| Total | 4,189 (100.0%) | 921 (100.0%) |
Housing Structure by Heating Type in Finneytown
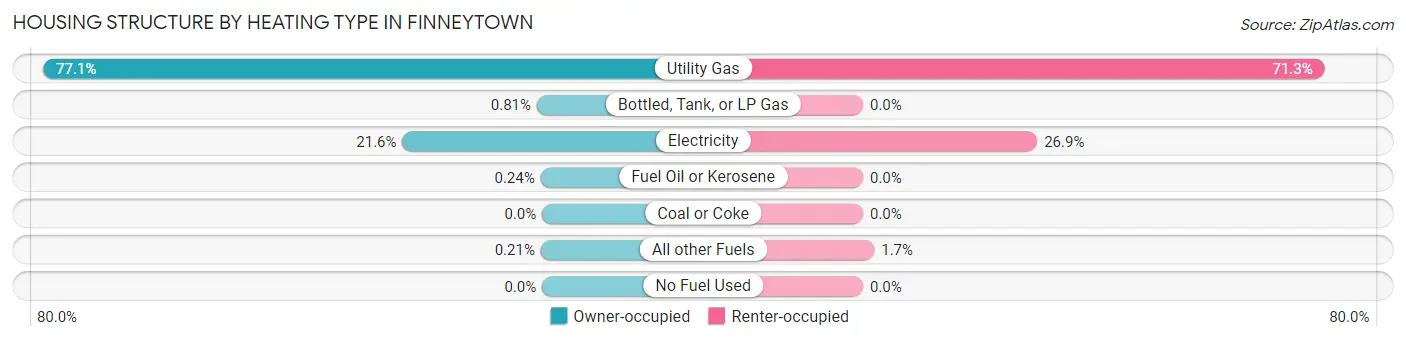
| Heating Type | Owner-occupied | Renter-occupied |
| Utility Gas | 3,231 (77.1%) | 657 (71.3%) |
| Bottled, Tank, or LP Gas | 34 (0.8%) | 0 (0.0%) |
| Electricity | 905 (21.6%) | 248 (26.9%) |
| Fuel Oil or Kerosene | 10 (0.2%) | 0 (0.0%) |
| Coal or Coke | 0 (0.0%) | 0 (0.0%) |
| All other Fuels | 9 (0.2%) | 16 (1.7%) |
| No Fuel Used | 0 (0.0%) | 0 (0.0%) |
| Total | 4,189 (100.0%) | 921 (100.0%) |
Household Vehicle Usage in Finneytown
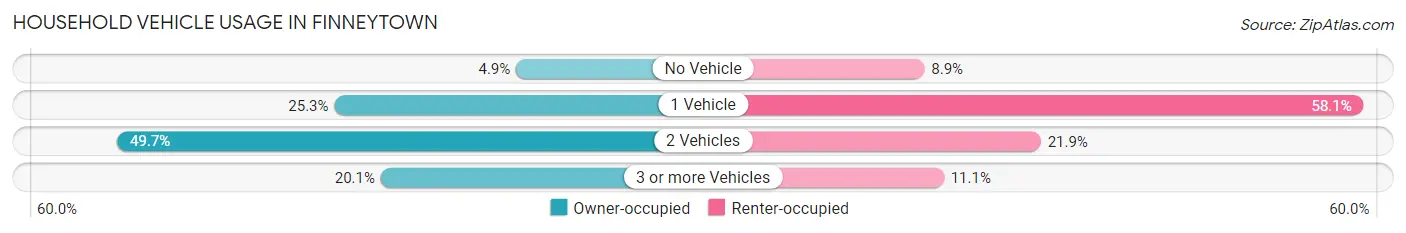
| Vehicles per Household | Owner-occupied | Renter-occupied |
| No Vehicle | 207 (4.9%) | 82 (8.9%) |
| 1 Vehicle | 1,060 (25.3%) | 535 (58.1%) |
| 2 Vehicles | 2,080 (49.6%) | 202 (21.9%) |
| 3 or more Vehicles | 842 (20.1%) | 102 (11.1%) |
| Total | 4,189 (100.0%) | 921 (100.0%) |
Real Estate & Mortgages in Finneytown
Real Estate and Mortgage Overview in Finneytown
| Characteristic | Without Mortgage | With Mortgage |
| Housing Units | 1,329 | 2,860 |
| Median Property Value | $160,100 | $165,900 |
| Median Household Income | $71,821 | $417 |
| Monthly Housing Costs | $640 | $24 |
| Real Estate Taxes | $3,507 | $18 |
Property Value by Mortgage Status in Finneytown
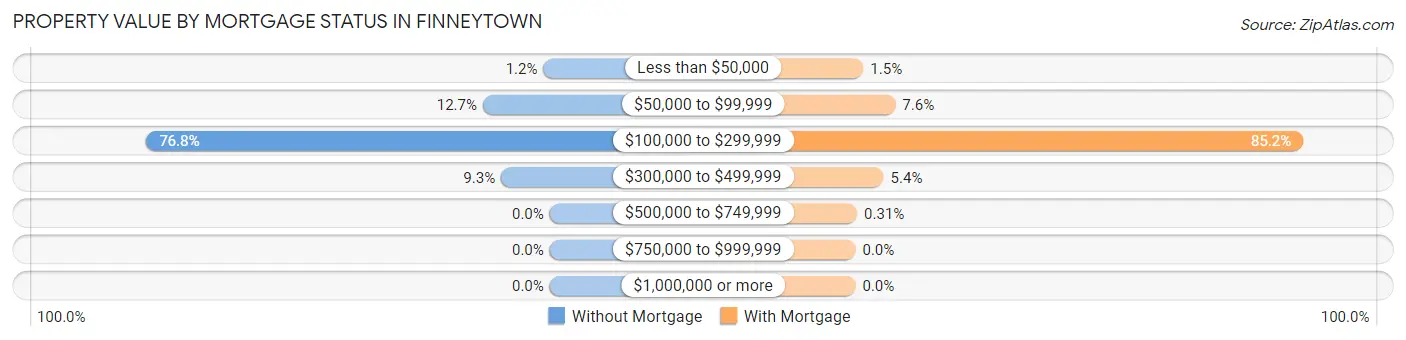
| Property Value | Without Mortgage | With Mortgage |
| Less than $50,000 | 16 (1.2%) | 43 (1.5%) |
| $50,000 to $99,999 | 169 (12.7%) | 217 (7.6%) |
| $100,000 to $299,999 | 1,021 (76.8%) | 2,438 (85.2%) |
| $300,000 to $499,999 | 123 (9.3%) | 153 (5.3%) |
| $500,000 to $749,999 | 0 (0.0%) | 9 (0.3%) |
| $750,000 to $999,999 | 0 (0.0%) | 0 (0.0%) |
| $1,000,000 or more | 0 (0.0%) | 0 (0.0%) |
| Total | 1,329 (100.0%) | 2,860 (100.0%) |
Household Income by Mortgage Status in Finneytown
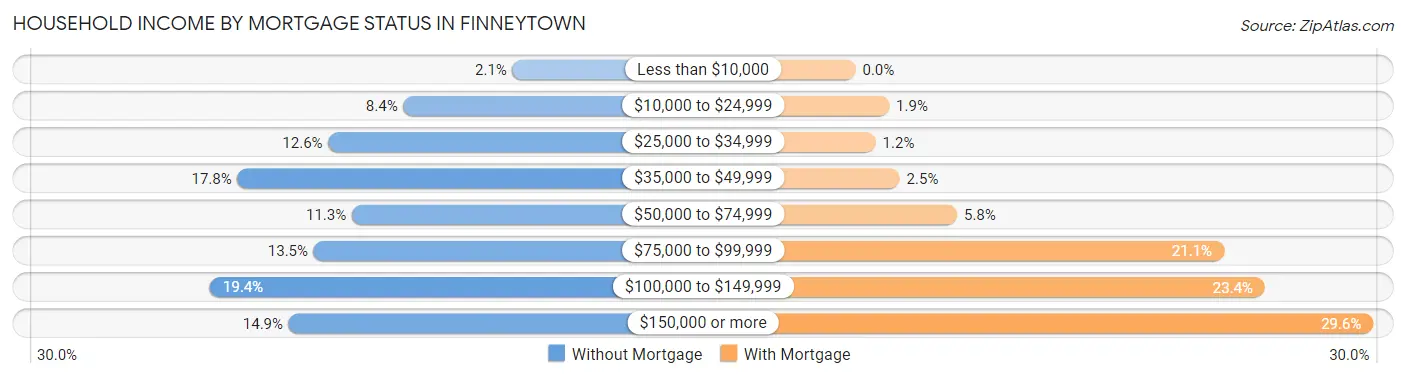
| Household Income | Without Mortgage | With Mortgage |
| Less than $10,000 | 28 (2.1%) | 0 (0.0%) |
| $10,000 to $24,999 | 111 (8.4%) | 55 (1.9%) |
| $25,000 to $34,999 | 168 (12.6%) | 33 (1.1%) |
| $35,000 to $49,999 | 237 (17.8%) | 72 (2.5%) |
| $50,000 to $74,999 | 150 (11.3%) | 166 (5.8%) |
| $75,000 to $99,999 | 179 (13.5%) | 602 (21.0%) |
| $100,000 to $149,999 | 258 (19.4%) | 669 (23.4%) |
| $150,000 or more | 198 (14.9%) | 846 (29.6%) |
| Total | 1,329 (100.0%) | 2,860 (100.0%) |
Property Value to Household Income Ratio in Finneytown
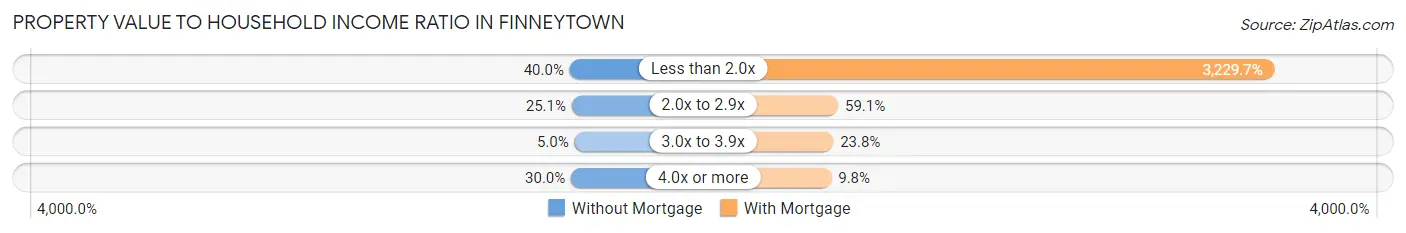
| Value-to-Income Ratio | Without Mortgage | With Mortgage |
| Less than 2.0x | 531 (40.0%) | 92,368 (3,229.7%) |
| 2.0x to 2.9x | 333 (25.1%) | 1,691 (59.1%) |
| 3.0x to 3.9x | 66 (5.0%) | 681 (23.8%) |
| 4.0x or more | 399 (30.0%) | 280 (9.8%) |
| Total | 1,329 (100.0%) | 2,860 (100.0%) |
Real Estate Taxes by Mortgage Status in Finneytown
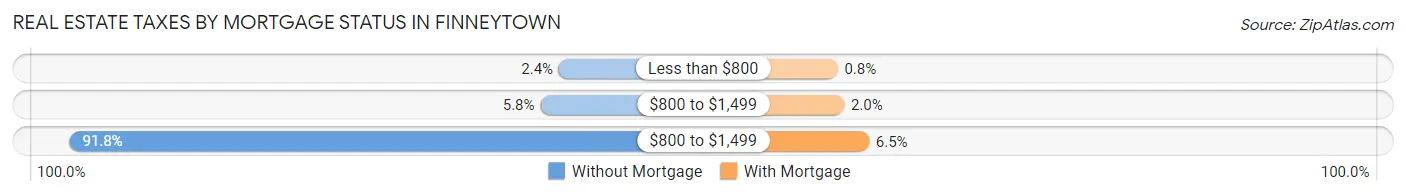
| Property Taxes | Without Mortgage | With Mortgage |
| Less than $800 | 32 (2.4%) | 23 (0.8%) |
| $800 to $1,499 | 77 (5.8%) | 57 (2.0%) |
| $800 to $1,499 | 1,220 (91.8%) | 187 (6.5%) |
| Total | 1,329 (100.0%) | 2,860 (100.0%) |
Health & Disability in Finneytown
Health Insurance Coverage by Age in Finneytown
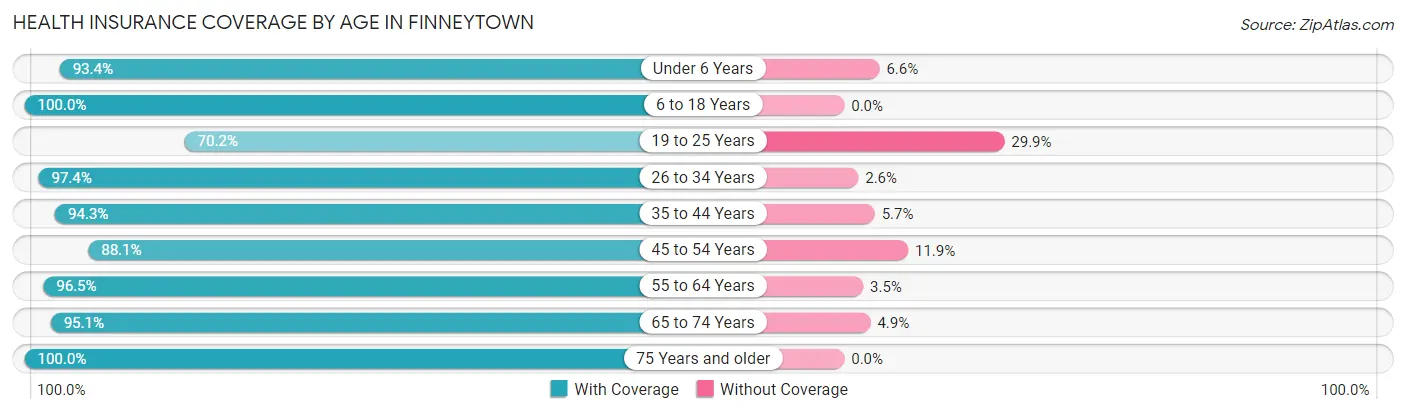
| Age Bracket | With Coverage | Without Coverage |
| Under 6 Years | 883 (93.4%) | 62 (6.6%) |
| 6 to 18 Years | 2,016 (100.0%) | 0 (0.0%) |
| 19 to 25 Years | 336 (70.2%) | 143 (29.8%) |
| 26 to 34 Years | 1,378 (97.4%) | 37 (2.6%) |
| 35 to 44 Years | 1,479 (94.3%) | 89 (5.7%) |
| 45 to 54 Years | 1,437 (88.1%) | 194 (11.9%) |
| 55 to 64 Years | 2,361 (96.5%) | 86 (3.5%) |
| 65 to 74 Years | 1,286 (95.1%) | 66 (4.9%) |
| 75 Years and older | 1,003 (100.0%) | 0 (0.0%) |
| Total | 12,179 (94.7%) | 677 (5.3%) |
Health Insurance Coverage by Citizenship Status in Finneytown
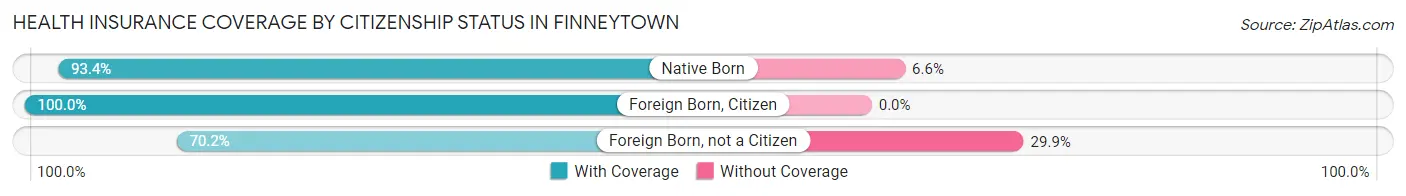
| Citizenship Status | With Coverage | Without Coverage |
| Native Born | 883 (93.4%) | 62 (6.6%) |
| Foreign Born, Citizen | 2,016 (100.0%) | 0 (0.0%) |
| Foreign Born, not a Citizen | 336 (70.2%) | 143 (29.8%) |
Health Insurance Coverage by Household Income in Finneytown
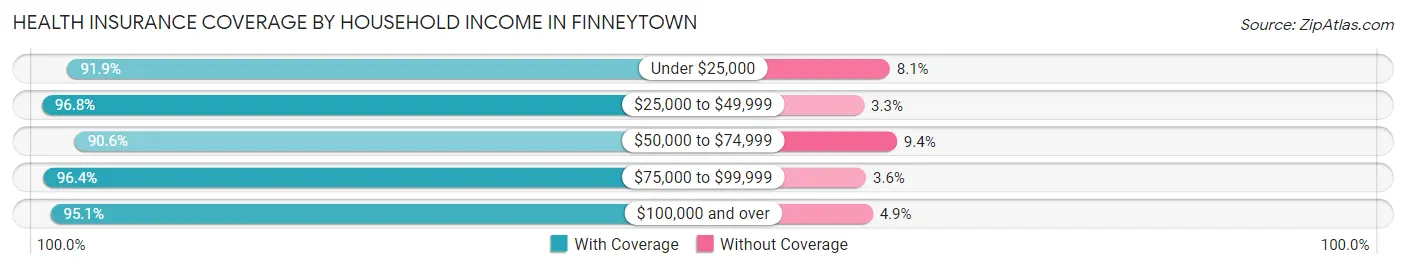
| Household Income | With Coverage | Without Coverage |
| Under $25,000 | 821 (91.9%) | 72 (8.1%) |
| $25,000 to $49,999 | 2,380 (96.8%) | 80 (3.3%) |
| $50,000 to $74,999 | 1,757 (90.6%) | 182 (9.4%) |
| $75,000 to $99,999 | 1,942 (96.4%) | 73 (3.6%) |
| $100,000 and over | 5,262 (95.1%) | 269 (4.9%) |
Public vs Private Health Insurance Coverage by Age in Finneytown
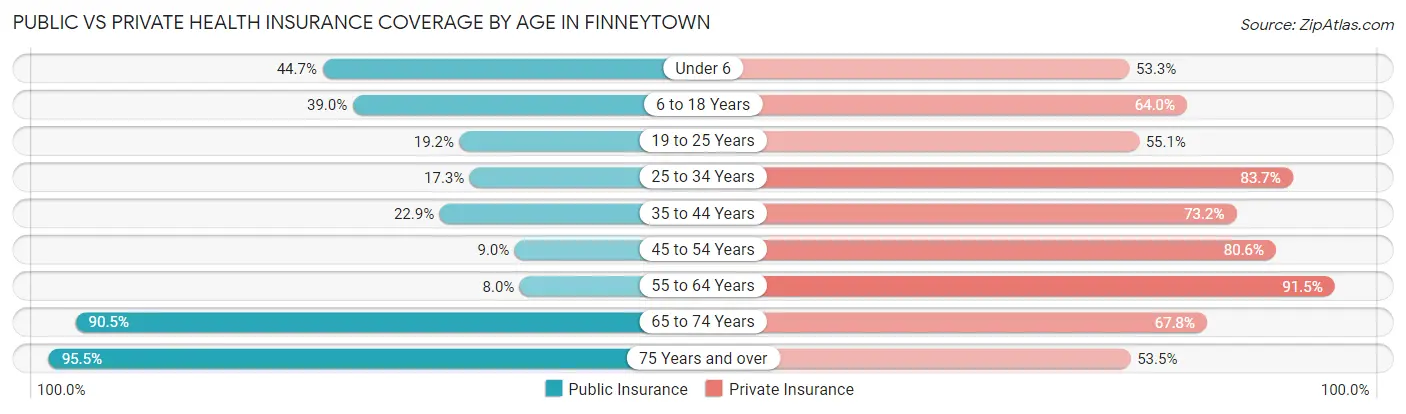
| Age Bracket | Public Insurance | Private Insurance |
| Under 6 | 422 (44.7%) | 504 (53.3%) |
| 6 to 18 Years | 787 (39.0%) | 1,291 (64.0%) |
| 19 to 25 Years | 92 (19.2%) | 264 (55.1%) |
| 25 to 34 Years | 245 (17.3%) | 1,184 (83.7%) |
| 35 to 44 Years | 359 (22.9%) | 1,148 (73.2%) |
| 45 to 54 Years | 146 (8.9%) | 1,314 (80.6%) |
| 55 to 64 Years | 196 (8.0%) | 2,238 (91.5%) |
| 65 to 74 Years | 1,224 (90.5%) | 916 (67.7%) |
| 75 Years and over | 958 (95.5%) | 537 (53.5%) |
| Total | 4,429 (34.4%) | 9,396 (73.1%) |
Disability Status by Sex by Age in Finneytown
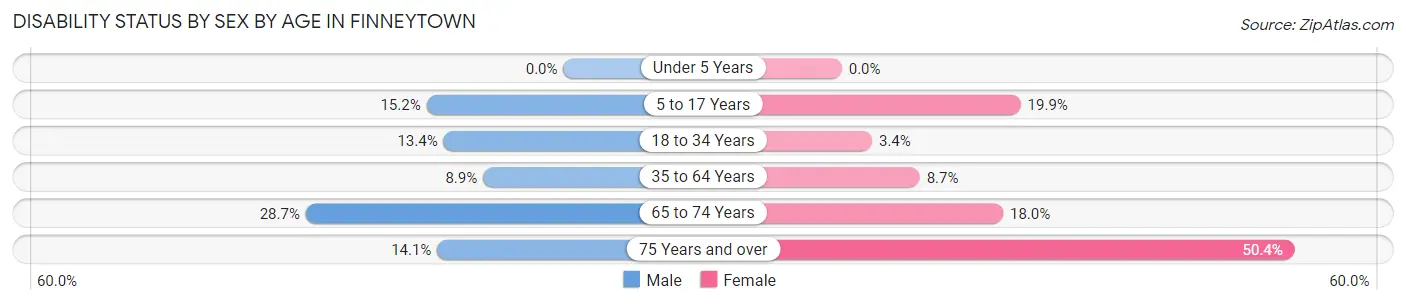
| Age Bracket | Male | Female |
| Under 5 Years | 0 (0.0%) | 0 (0.0%) |
| 5 to 17 Years | 182 (15.2%) | 194 (19.9%) |
| 18 to 34 Years | 136 (13.4%) | 33 (3.4%) |
| 35 to 64 Years | 241 (8.9%) | 256 (8.7%) |
| 65 to 74 Years | 177 (28.7%) | 132 (18.0%) |
| 75 Years and over | 59 (14.1%) | 294 (50.4%) |
Disability Class by Sex by Age in Finneytown
Disability Class: Hearing Difficulty
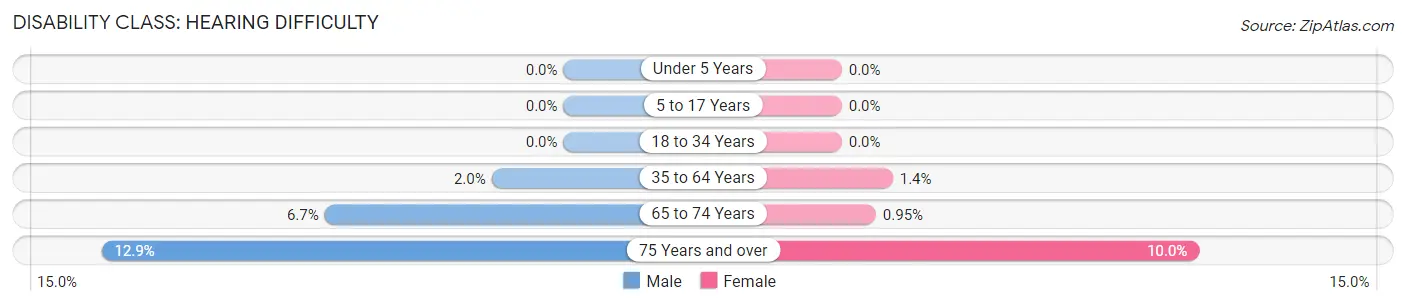
| Age Bracket | Male | Female |
| Under 5 Years | 0 (0.0%) | 0 (0.0%) |
| 5 to 17 Years | 0 (0.0%) | 0 (0.0%) |
| 18 to 34 Years | 0 (0.0%) | 0 (0.0%) |
| 35 to 64 Years | 54 (2.0%) | 42 (1.4%) |
| 65 to 74 Years | 41 (6.7%) | 7 (0.9%) |
| 75 Years and over | 54 (12.9%) | 58 (10.0%) |
Disability Class: Vision Difficulty
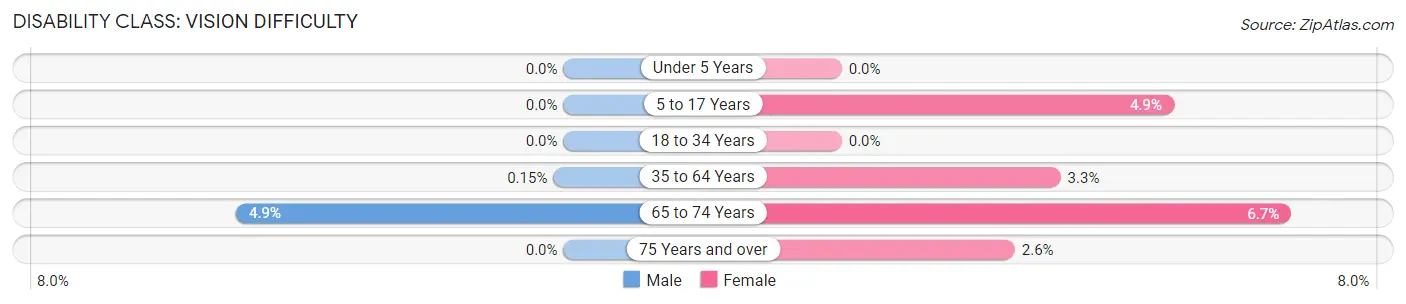
| Age Bracket | Male | Female |
| Under 5 Years | 0 (0.0%) | 0 (0.0%) |
| 5 to 17 Years | 0 (0.0%) | 48 (4.9%) |
| 18 to 34 Years | 0 (0.0%) | 0 (0.0%) |
| 35 to 64 Years | 4 (0.2%) | 96 (3.3%) |
| 65 to 74 Years | 30 (4.9%) | 49 (6.7%) |
| 75 Years and over | 0 (0.0%) | 15 (2.6%) |
Disability Class: Cognitive Difficulty
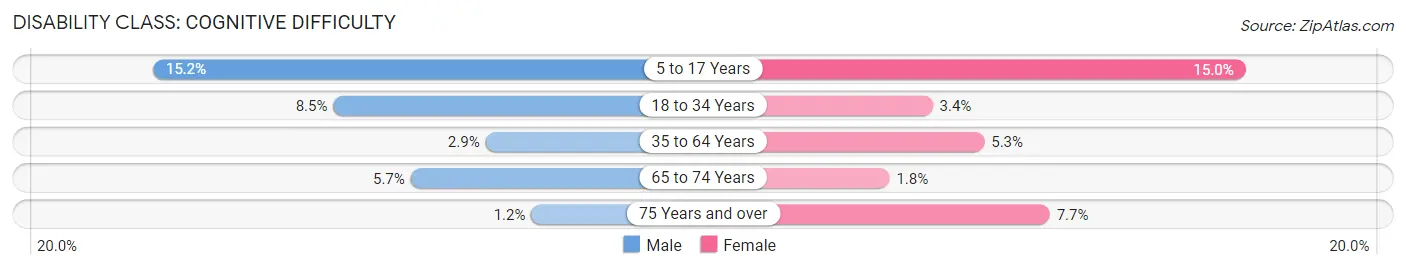
| Age Bracket | Male | Female |
| 5 to 17 Years | 182 (15.2%) | 146 (15.0%) |
| 18 to 34 Years | 87 (8.5%) | 33 (3.4%) |
| 35 to 64 Years | 78 (2.9%) | 156 (5.3%) |
| 65 to 74 Years | 35 (5.7%) | 13 (1.8%) |
| 75 Years and over | 5 (1.2%) | 45 (7.7%) |
Disability Class: Ambulatory Difficulty
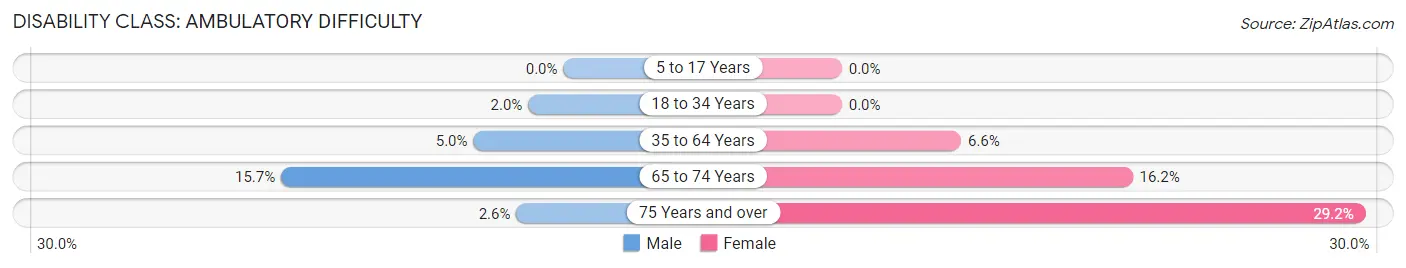
| Age Bracket | Male | Female |
| 5 to 17 Years | 0 (0.0%) | 0 (0.0%) |
| 18 to 34 Years | 20 (2.0%) | 0 (0.0%) |
| 35 to 64 Years | 135 (5.0%) | 196 (6.6%) |
| 65 to 74 Years | 97 (15.7%) | 119 (16.2%) |
| 75 Years and over | 11 (2.6%) | 170 (29.2%) |
Disability Class: Self-Care Difficulty
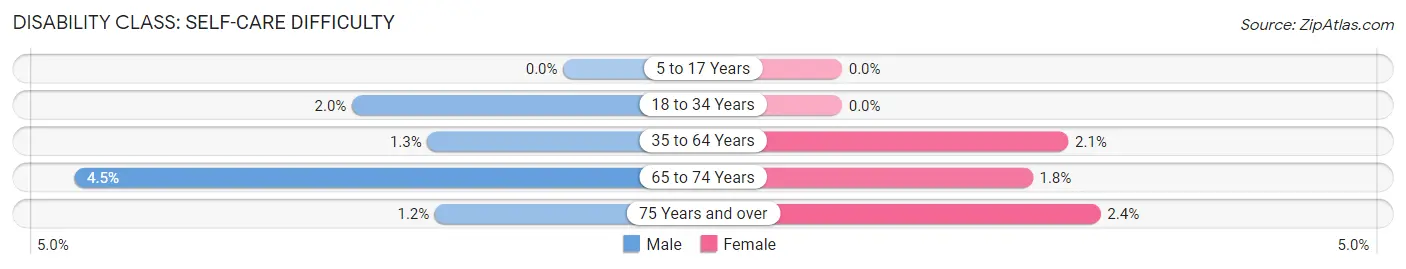
| Age Bracket | Male | Female |
| 5 to 17 Years | 0 (0.0%) | 0 (0.0%) |
| 18 to 34 Years | 20 (2.0%) | 0 (0.0%) |
| 35 to 64 Years | 34 (1.3%) | 62 (2.1%) |
| 65 to 74 Years | 28 (4.5%) | 13 (1.8%) |
| 75 Years and over | 5 (1.2%) | 14 (2.4%) |
Technology Access in Finneytown
Computing Device Access in Finneytown
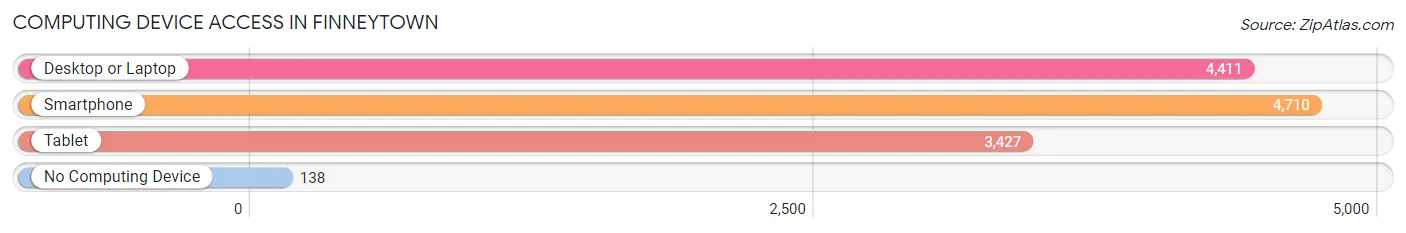
| Device Type | # Households | % Households |
| Desktop or Laptop | 4,411 | 86.3% |
| Smartphone | 4,710 | 92.2% |
| Tablet | 3,427 | 67.1% |
| No Computing Device | 138 | 2.7% |
| Total | 5,110 | 100.0% |
Internet Access in Finneytown
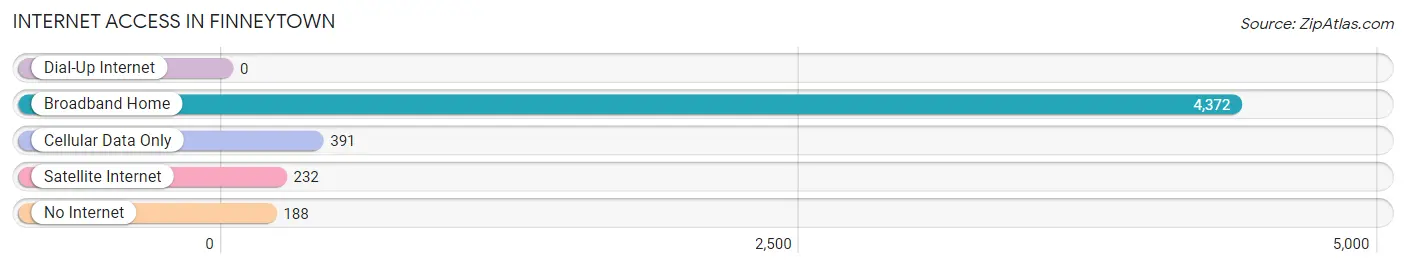
| Internet Type | # Households | % Households |
| Dial-Up Internet | 0 | 0.0% |
| Broadband Home | 4,372 | 85.6% |
| Cellular Data Only | 391 | 7.6% |
| Satellite Internet | 232 | 4.5% |
| No Internet | 188 | 3.7% |
| Total | 5,110 | 100.0% |
Finneytown Summary
History
Finneytown is a small village located in Hamilton County, Ohio. It is a suburb of Cincinnati and is part of the Cincinnati Metropolitan Statistical Area. The village was founded in 1817 by William Finney, a Revolutionary War veteran. Finneytown was originally a farming community, but it has since grown into a residential area.
The village was incorporated in 1845 and was named after its founder. Finneytown was a small, rural community until the 1950s when it began to experience rapid growth due to the expansion of Cincinnati. The village was annexed by the city of Cincinnati in 1961, but it still retains its own identity.
Geography
Finneytown is located in Hamilton County, Ohio. It is situated on the western edge of Cincinnati, about 10 miles from downtown. The village is bordered by the cities of Springfield Township, Forest Park, and North College Hill. The total area of Finneytown is 1.3 square miles, with a population of approximately 5,000 people.
The terrain of Finneytown is mostly flat, with some rolling hills. The village is located in the Miami Valley, which is part of the larger Ohio Valley region. The climate of Finneytown is humid continental, with hot summers and cold winters.
Economy
Finneytown’s economy is largely based on the service industry. The village is home to several small businesses, including restaurants, retail stores, and professional services. Finneytown is also home to a number of manufacturing companies, including a plastics factory and a metal fabrication plant.
The village is served by the Cincinnati/Northern Kentucky International Airport, which is located about 20 miles away. Finneytown is also served by several major highways, including Interstate 75 and Interstate 74.
Demographics
As of the 2010 census, the population of Finneytown was 5,039. The racial makeup of the village was 87.3% White, 8.2% African American, 0.7% Asian, 0.3% Native American, and 3.5% from other races. The median household income in Finneytown was $50,945, and the median family income was $60,945.
Finneytown is a diverse community, with a variety of religious and cultural backgrounds. The village is home to a number of churches, including Catholic, Protestant, and Jewish congregations. Finneytown is also home to a number of civic organizations, including the Finneytown Lions Club and the Finneytown Historical Society.
Common Questions
What is Per Capita Income in Finneytown?
Per Capita income in Finneytown is $36,367.
What is the Median Family Income in Finneytown?
Median Family Income in Finneytown is $81,860.
What is the Median Household income in Finneytown?
Median Household Income in Finneytown is $78,571.
What is Income or Wage Gap in Finneytown?
Income or Wage Gap in Finneytown is 6.9%.
Women in Finneytown earn 93.1 cents for every dollar earned by a man.
What is Inequality or Gini Index in Finneytown?
Inequality or Gini Index in Finneytown is 0.36.
What is the Total Population of Finneytown?
Total Population of Finneytown is 12,870.
What is the Total Male Population of Finneytown?
Total Male Population of Finneytown is 6,254.
What is the Total Female Population of Finneytown?
Total Female Population of Finneytown is 6,616.
What is the Ratio of Males per 100 Females in Finneytown?
There are 94.53 Males per 100 Females in Finneytown.
What is the Ratio of Females per 100 Males in Finneytown?
There are 105.79 Females per 100 Males in Finneytown.
What is the Median Population Age in Finneytown?
Median Population Age in Finneytown is 45.1 Years.
What is the Average Family Size in Finneytown
Average Family Size in Finneytown is 3.0 People.
What is the Average Household Size in Finneytown
Average Household Size in Finneytown is 2.5 People.
How Large is the Labor Force in Finneytown?
There are 6,726 People in the Labor Forcein in Finneytown.
What is the Percentage of People in the Labor Force in Finneytown?
64.8% of People are in the Labor Force in Finneytown.
What is the Unemployment Rate in Finneytown?
Unemployment Rate in Finneytown is 5.4%.