Garfield Heights, OH Map & Demographics
Garfield Heights Map
Garfield Heights Overview
$25,828
PER CAPITA INCOME
$62,199
AVG FAMILY INCOME
$49,864
AVG HOUSEHOLD INCOME
29.3%
WAGE / INCOME GAP [ % ]
70.7¢/ $1
WAGE / INCOME GAP [ $ ]
0.44
INEQUALITY / GINI INDEX
29,497
TOTAL POPULATION
13,458
MALE POPULATION
16,039
FEMALE POPULATION
83.91
MALES / 100 FEMALES
119.18
FEMALES / 100 MALES
39.4
MEDIAN AGE
3.2
AVG FAMILY SIZE
2.4
AVG HOUSEHOLD SIZE
14,874
LABOR FORCE [ PEOPLE ]
63.9%
PERCENT IN LABOR FORCE
9.8%
UNEMPLOYMENT RATE
Income in Garfield Heights
Income Overview in Garfield Heights
Per Capita Income in Garfield Heights is $25,828, while median incomes of families and households are $62,199 and $49,864 respectively.
| Characteristic | Number | Measure |
| Per Capita Income | 29,497 | $25,828 |
| Median Family Income | 6,667 | $62,199 |
| Mean Family Income | 6,667 | $68,111 |
| Median Household Income | 11,974 | $49,864 |
| Mean Household Income | 11,974 | $61,426 |
| Income Deficit | 6,667 | $0 |
| Wage / Income Gap (%) | 29,497 | 29.34% |
| Wage / Income Gap ($) | 29,497 | 70.66¢ per $1 |
| Gini / Inequality Index | 29,497 | 0.44 |
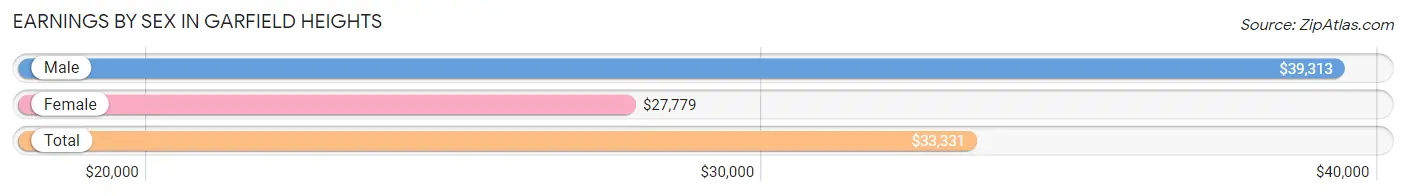
Earnings by Sex in Garfield Heights
Average Earnings in Garfield Heights are $33,331, $39,313 for men and $27,779 for women, a difference of 29.3%.
| Sex | Number | Average Earnings |
| Male | 6,743 (46.1%) | $39,313 |
| Female | 7,896 (53.9%) | $27,779 |
| Total | 14,639 (100.0%) | $33,331 |
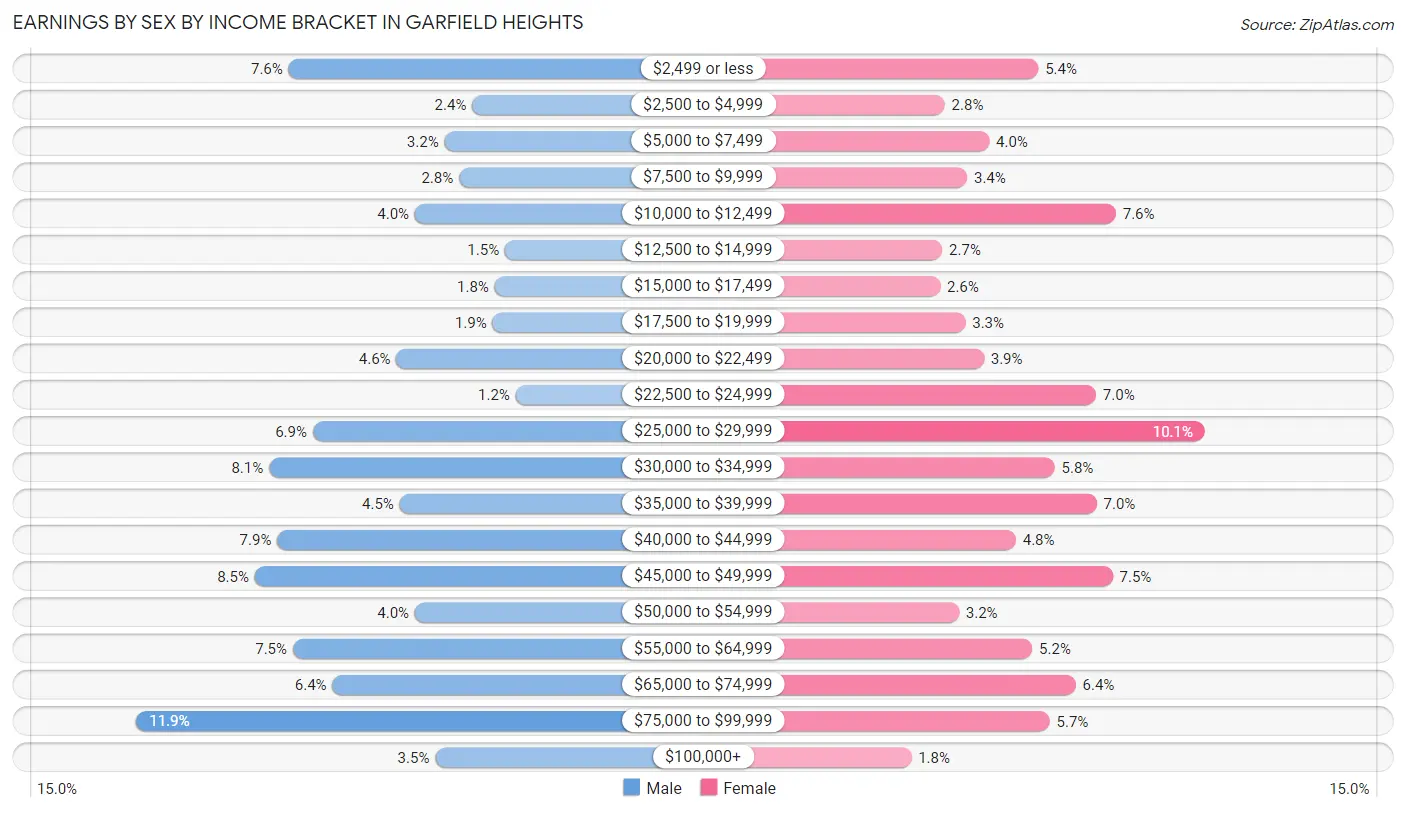
Earnings by Sex by Income Bracket in Garfield Heights
The most common earnings brackets in Garfield Heights are $75,000 to $99,999 for men (800 | 11.9%) and $25,000 to $29,999 for women (794 | 10.1%).
| Income | Male | Female |
| $2,499 or less | 511 (7.6%) | 425 (5.4%) |
| $2,500 to $4,999 | 163 (2.4%) | 217 (2.8%) |
| $5,000 to $7,499 | 216 (3.2%) | 316 (4.0%) |
| $7,500 to $9,999 | 188 (2.8%) | 267 (3.4%) |
| $10,000 to $12,499 | 272 (4.0%) | 597 (7.6%) |
| $12,500 to $14,999 | 101 (1.5%) | 212 (2.7%) |
| $15,000 to $17,499 | 121 (1.8%) | 207 (2.6%) |
| $17,500 to $19,999 | 125 (1.8%) | 263 (3.3%) |
| $20,000 to $22,499 | 307 (4.5%) | 304 (3.8%) |
| $22,500 to $24,999 | 81 (1.2%) | 553 (7.0%) |
| $25,000 to $29,999 | 465 (6.9%) | 794 (10.1%) |
| $30,000 to $34,999 | 548 (8.1%) | 461 (5.8%) |
| $35,000 to $39,999 | 301 (4.5%) | 554 (7.0%) |
| $40,000 to $44,999 | 533 (7.9%) | 375 (4.8%) |
| $45,000 to $49,999 | 575 (8.5%) | 590 (7.5%) |
| $50,000 to $54,999 | 272 (4.0%) | 249 (3.2%) |
| $55,000 to $64,999 | 503 (7.5%) | 411 (5.2%) |
| $65,000 to $74,999 | 428 (6.4%) | 508 (6.4%) |
| $75,000 to $99,999 | 800 (11.9%) | 450 (5.7%) |
| $100,000+ | 233 (3.5%) | 143 (1.8%) |
| Total | 6,743 (100.0%) | 7,896 (100.0%) |
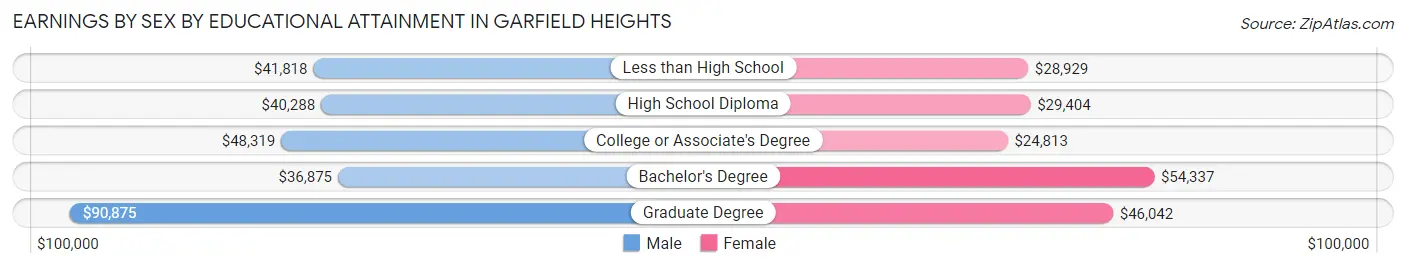
Earnings by Sex by Educational Attainment in Garfield Heights
Average earnings in Garfield Heights are $44,675 for men and $33,234 for women, a difference of 25.6%. Men with an educational attainment of graduate degree enjoy the highest average annual earnings of $90,875, while those with bachelor's degree education earn the least with $36,875. Women with an educational attainment of bachelor's degree earn the most with the average annual earnings of $54,337, while those with college or associate's degree education have the smallest earnings of $24,813.
| Educational Attainment | Male Income | Female Income |
| Less than High School | $41,818 | $28,929 |
| High School Diploma | $40,288 | $29,404 |
| College or Associate's Degree | $48,319 | $24,813 |
| Bachelor's Degree | $36,875 | $54,337 |
| Graduate Degree | $90,875 | $46,042 |
| Total | $44,675 | $33,234 |
Family Income in Garfield Heights
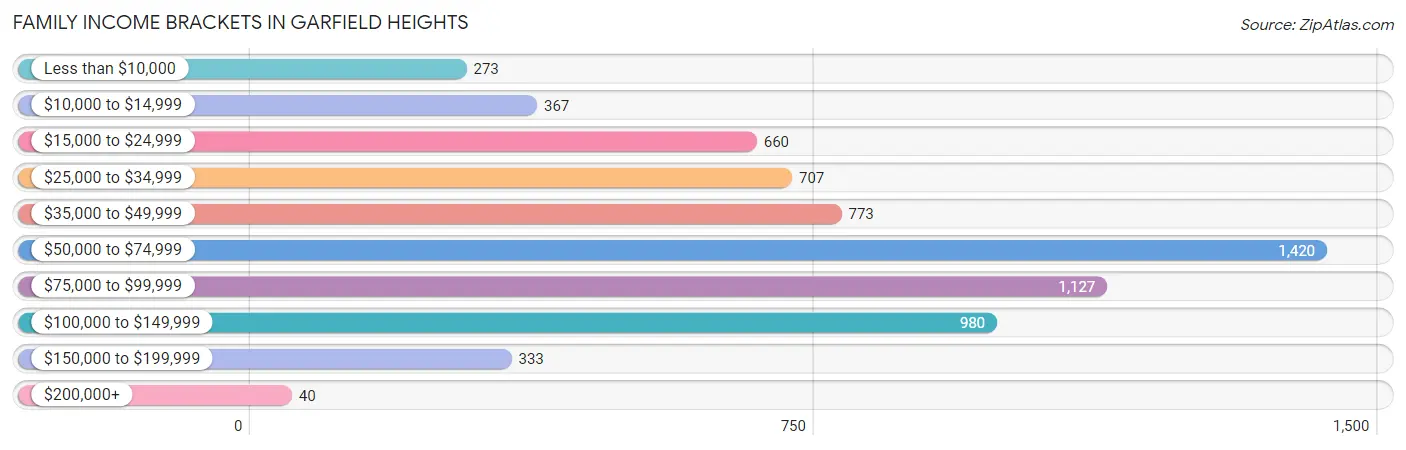
Family Income Brackets in Garfield Heights
According to the Garfield Heights family income data, there are 1,420 families falling into the $50,000 to $74,999 income range, which is the most common income bracket and makes up 21.3% of all families. Conversely, the $200,000+ income bracket is the least frequent group with only 40 families (0.6%) belonging to this category.
| Income Bracket | # Families | % Families |
| Less than $10,000 | 273 | 4.1% |
| $10,000 to $14,999 | 367 | 5.5% |
| $15,000 to $24,999 | 660 | 9.9% |
| $25,000 to $34,999 | 707 | 10.6% |
| $35,000 to $49,999 | 773 | 11.6% |
| $50,000 to $74,999 | 1,420 | 21.3% |
| $75,000 to $99,999 | 1,127 | 16.9% |
| $100,000 to $149,999 | 980 | 14.7% |
| $150,000 to $199,999 | 333 | 5.0% |
| $200,000+ | 40 | 0.6% |
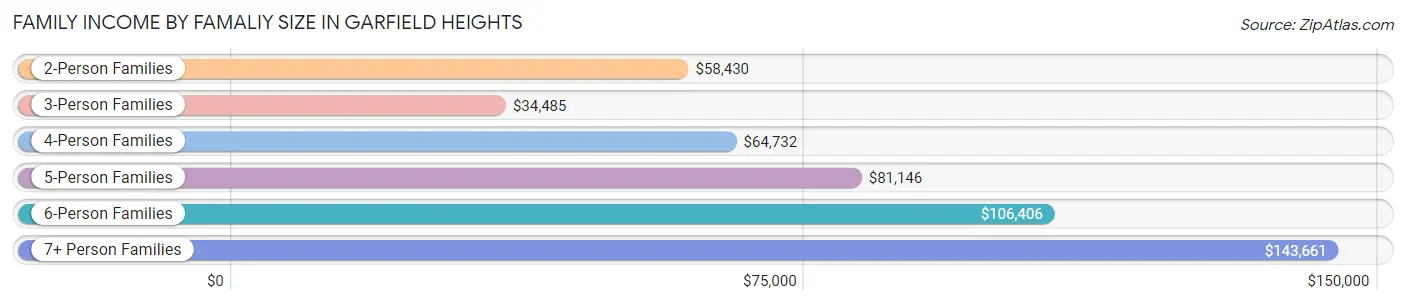
Family Income by Famaliy Size in Garfield Heights
7+ person families (53 | 0.8%) account for the highest median family income in Garfield Heights with $143,661 per family, while 2-person families (2,988 | 44.8%) have the highest median income of $29,215 per family member.
| Income Bracket | # Families | Median Income |
| 2-Person Families | 2,988 (44.8%) | $58,430 |
| 3-Person Families | 1,684 (25.3%) | $34,485 |
| 4-Person Families | 1,183 (17.7%) | $64,732 |
| 5-Person Families | 658 (9.9%) | $81,146 |
| 6-Person Families | 101 (1.5%) | $106,406 |
| 7+ Person Families | 53 (0.8%) | $143,661 |
| Total | 6,667 (100.0%) | $62,199 |
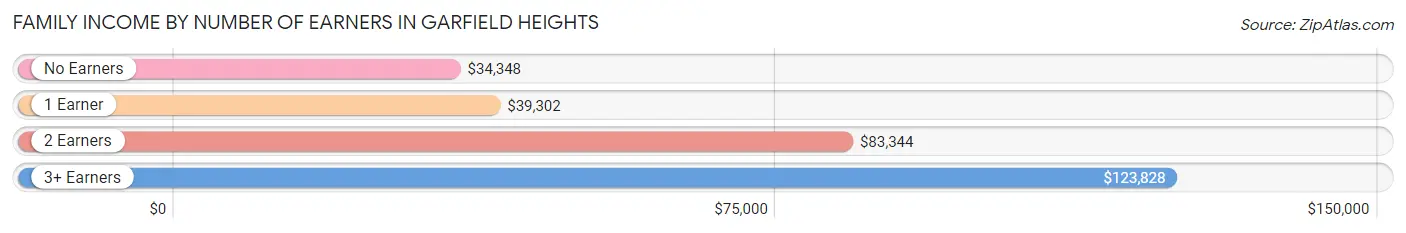
Family Income by Number of Earners in Garfield Heights
The median family income in Garfield Heights is $62,199, with families comprising 3+ earners (617) having the highest median family income of $123,828, while families with no earners (1,000) have the lowest median family income of $34,348, accounting for 9.2% and 15.0% of families, respectively.
| Number of Earners | # Families | Median Income |
| No Earners | 1,000 (15.0%) | $34,348 |
| 1 Earner | 2,460 (36.9%) | $39,302 |
| 2 Earners | 2,590 (38.9%) | $83,344 |
| 3+ Earners | 617 (9.2%) | $123,828 |
| Total | 6,667 (100.0%) | $62,199 |
Household Income in Garfield Heights
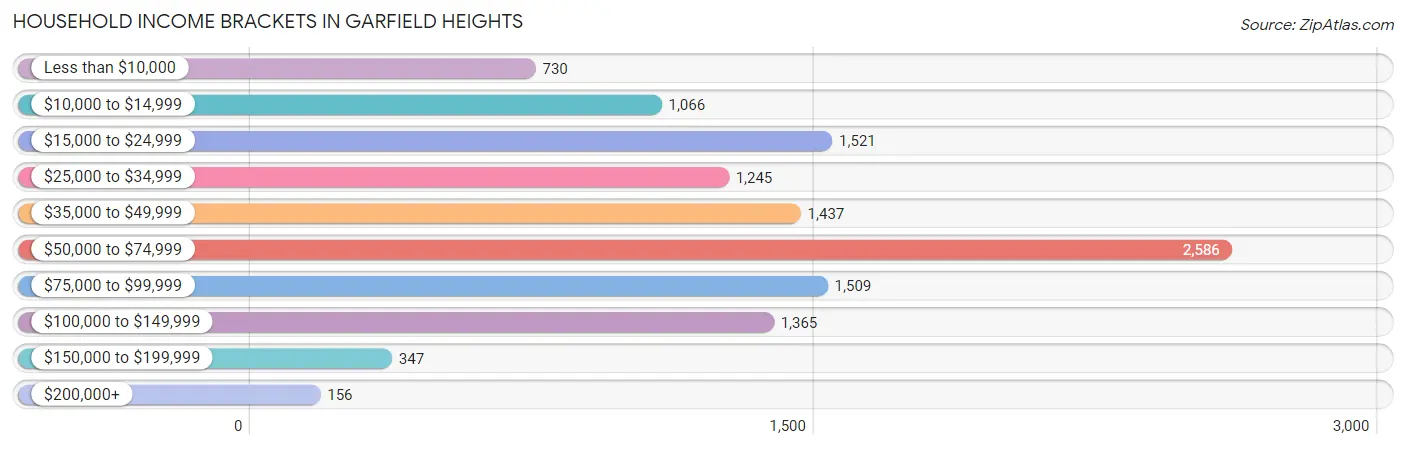
Household Income Brackets in Garfield Heights
With 2,586 households falling in the category, the $50,000 to $74,999 income range is the most frequent in Garfield Heights, accounting for 21.6% of all households. In contrast, only 156 households (1.3%) fall into the $200,000+ income bracket, making it the least populous group.
| Income Bracket | # Households | % Households |
| Less than $10,000 | 730 | 6.1% |
| $10,000 to $14,999 | 1,066 | 8.9% |
| $15,000 to $24,999 | 1,521 | 12.7% |
| $25,000 to $34,999 | 1,245 | 10.4% |
| $35,000 to $49,999 | 1,437 | 12.0% |
| $50,000 to $74,999 | 2,586 | 21.6% |
| $75,000 to $99,999 | 1,509 | 12.6% |
| $100,000 to $149,999 | 1,365 | 11.4% |
| $150,000 to $199,999 | 347 | 2.9% |
| $200,000+ | 156 | 1.3% |
Household Income by Householder Age in Garfield Heights
The median household income in Garfield Heights is $49,864, with the highest median household income of $63,259 found in the 45 to 64 years age bracket for the primary householder. A total of 4,697 households (39.2%) fall into this category. Meanwhile, the 15 to 24 years age bracket for the primary householder has the lowest median household income of $30,873, with 385 households (3.2%) in this group.
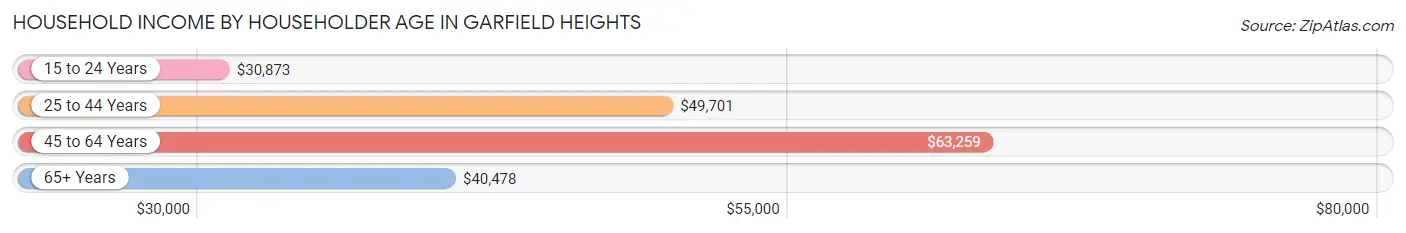
| Income Bracket | # Households | Median Income |
| 15 to 24 Years | 385 (3.2%) | $30,873 |
| 25 to 44 Years | 3,680 (30.7%) | $49,701 |
| 45 to 64 Years | 4,697 (39.2%) | $63,259 |
| 65+ Years | 3,212 (26.8%) | $40,478 |
| Total | 11,974 (100.0%) | $49,864 |
Poverty in Garfield Heights
Income Below Poverty by Sex and Age in Garfield Heights
With 20.5% poverty level for males and 23.1% for females among the residents of Garfield Heights, 5 year old males and 5 year old females are the most vulnerable to poverty, with 84 males (59.6%) and 98 females (64.9%) in their respective age groups living below the poverty level.
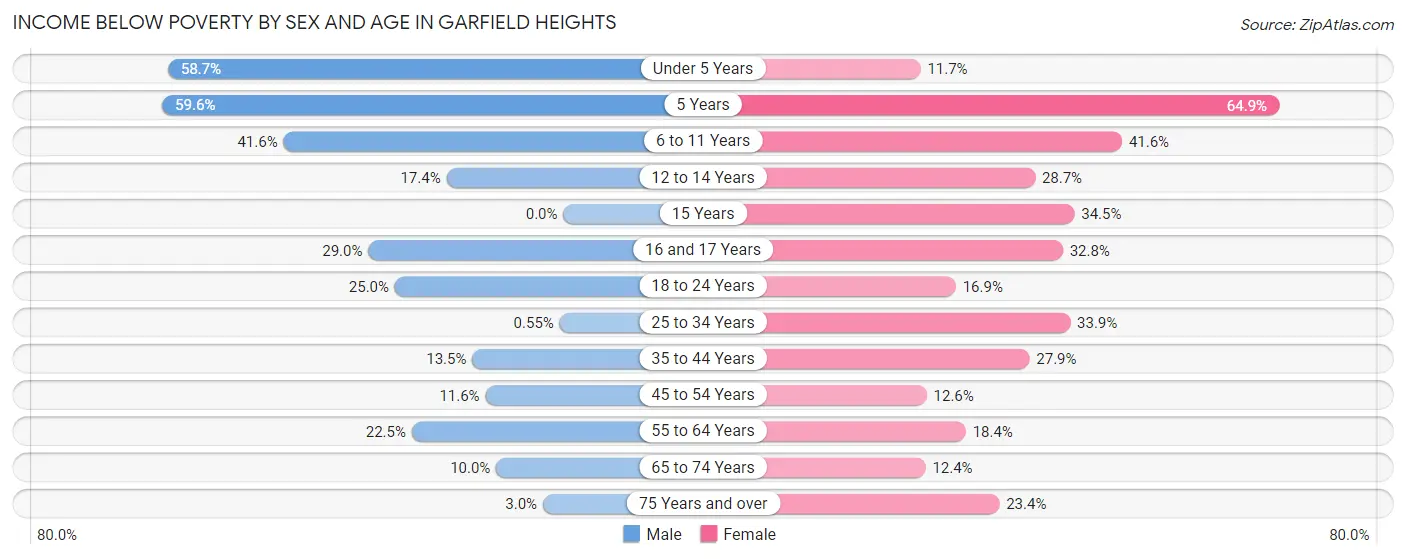
| Age Bracket | Male | Female |
| Under 5 Years | 565 (58.7%) | 108 (11.7%) |
| 5 Years | 84 (59.6%) | 98 (64.9%) |
| 6 to 11 Years | 507 (41.6%) | 483 (41.6%) |
| 12 to 14 Years | 97 (17.3%) | 148 (28.7%) |
| 15 Years | 0 (0.0%) | 48 (34.5%) |
| 16 and 17 Years | 113 (29.0%) | 165 (32.8%) |
| 18 to 24 Years | 348 (25.0%) | 257 (16.9%) |
| 25 to 34 Years | 8 (0.5%) | 617 (33.9%) |
| 35 to 44 Years | 229 (13.5%) | 550 (27.9%) |
| 45 to 54 Years | 163 (11.6%) | 223 (12.6%) |
| 55 to 64 Years | 461 (22.5%) | 486 (18.4%) |
| 65 to 74 Years | 114 (10.0%) | 177 (12.4%) |
| 75 Years and over | 16 (3.0%) | 292 (23.4%) |
| Total | 2,705 (20.5%) | 3,652 (23.1%) |
Income Above Poverty by Sex and Age in Garfield Heights
According to the poverty statistics in Garfield Heights, males aged 15 years and females aged under 5 years are the age groups that are most secure financially, with 100.0% of males and 88.3% of females in these age groups living above the poverty line.
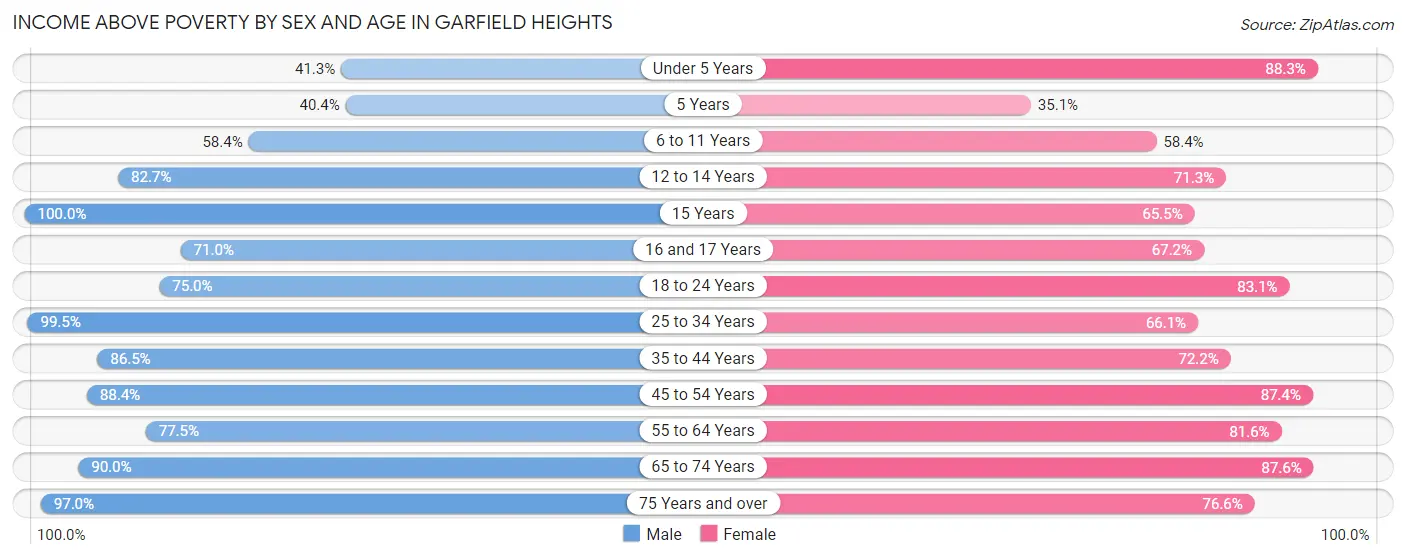
| Age Bracket | Male | Female |
| Under 5 Years | 397 (41.3%) | 817 (88.3%) |
| 5 Years | 57 (40.4%) | 53 (35.1%) |
| 6 to 11 Years | 713 (58.4%) | 678 (58.4%) |
| 12 to 14 Years | 462 (82.7%) | 368 (71.3%) |
| 15 Years | 220 (100.0%) | 91 (65.5%) |
| 16 and 17 Years | 277 (71.0%) | 338 (67.2%) |
| 18 to 24 Years | 1,043 (75.0%) | 1,262 (83.1%) |
| 25 to 34 Years | 1,448 (99.5%) | 1,203 (66.1%) |
| 35 to 44 Years | 1,465 (86.5%) | 1,425 (72.2%) |
| 45 to 54 Years | 1,246 (88.4%) | 1,548 (87.4%) |
| 55 to 64 Years | 1,588 (77.5%) | 2,155 (81.6%) |
| 65 to 74 Years | 1,029 (90.0%) | 1,248 (87.6%) |
| 75 Years and over | 512 (97.0%) | 957 (76.6%) |
| Total | 10,457 (79.4%) | 12,143 (76.9%) |
Income Below Poverty Among Married-Couple Families in Garfield Heights
The poverty statistics for married-couple families in Garfield Heights show that 2.8% or 93 of the total 3,370 families live below the poverty line. Families with 3 or 4 children have the highest poverty rate of 13.1%, comprising of 29 families. On the other hand, families with 5 or more children have the lowest poverty rate of 0.0%, which includes 0 families.
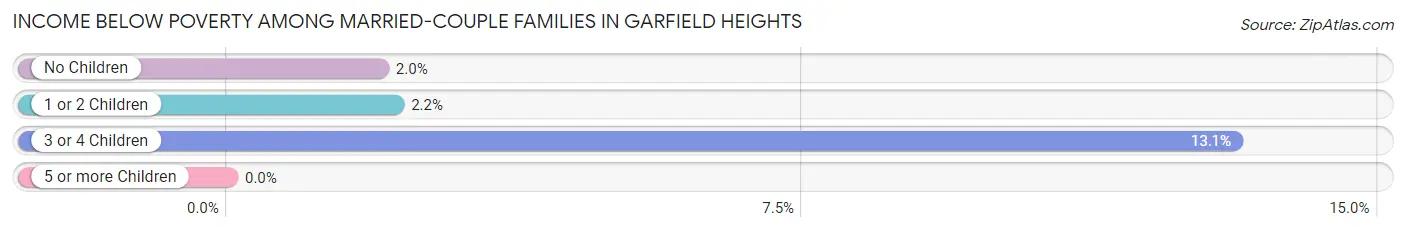
| Children | Above Poverty | Below Poverty |
| No Children | 2,086 (98.0%) | 42 (2.0%) |
| 1 or 2 Children | 992 (97.8%) | 22 (2.2%) |
| 3 or 4 Children | 192 (86.9%) | 29 (13.1%) |
| 5 or more Children | 7 (100.0%) | 0 (0.0%) |
| Total | 3,277 (97.2%) | 93 (2.8%) |
Income Below Poverty Among Single-Parent Households in Garfield Heights
According to the poverty data in Garfield Heights, 3.2% or 16 single-father households and 41.1% or 1,153 single-mother households are living below the poverty line. Among single-father households, those with 3 or 4 children have the highest poverty rate, with 16 households (100.0%) experiencing poverty. Likewise, among single-mother households, those with 3 or 4 children have the highest poverty rate, with 231 households (59.4%) falling below the poverty line.
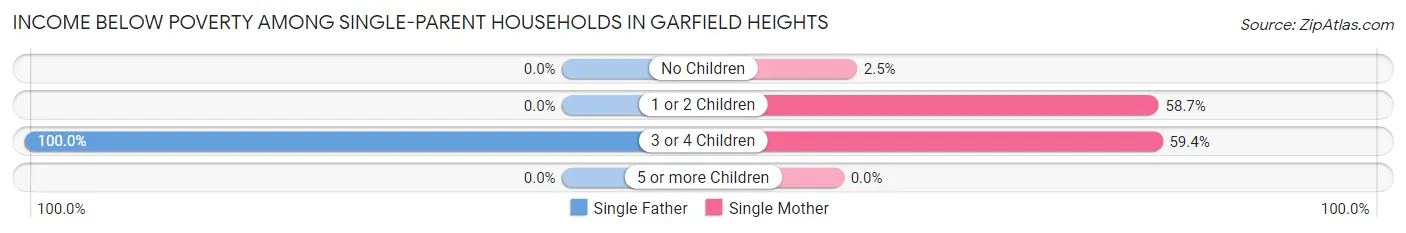
| Children | Single Father | Single Mother |
| No Children | 0 (0.0%) | 21 (2.5%) |
| 1 or 2 Children | 0 (0.0%) | 901 (58.7%) |
| 3 or 4 Children | 16 (100.0%) | 231 (59.4%) |
| 5 or more Children | 0 (0.0%) | 0 (0.0%) |
| Total | 16 (3.2%) | 1,153 (41.1%) |
Income Below Poverty Among Married-Couple vs Single-Parent Households in Garfield Heights
The poverty data for Garfield Heights shows that 93 of the married-couple family households (2.8%) and 1,169 of the single-parent households (35.5%) are living below the poverty level. Within the married-couple family households, those with 3 or 4 children have the highest poverty rate, with 29 households (13.1%) falling below the poverty line. Among the single-parent households, those with 3 or 4 children have the highest poverty rate, with 247 household (61.0%) living below poverty.
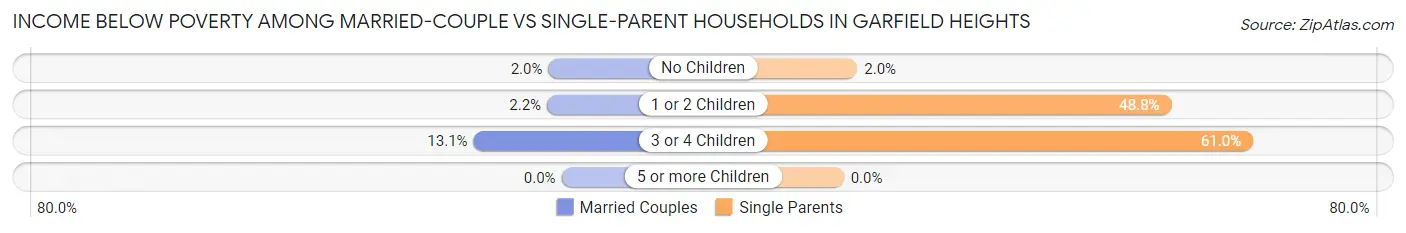
| Children | Married-Couple Families | Single-Parent Households |
| No Children | 42 (2.0%) | 21 (2.0%) |
| 1 or 2 Children | 22 (2.2%) | 901 (48.8%) |
| 3 or 4 Children | 29 (13.1%) | 247 (61.0%) |
| 5 or more Children | 0 (0.0%) | 0 (0.0%) |
| Total | 93 (2.8%) | 1,169 (35.5%) |
Race in Garfield Heights
The most populous races in Garfield Heights are Black / African American (16,701 | 56.6%), White / Caucasian (10,344 | 35.1%), and Two or more Races (1,546 | 5.2%).
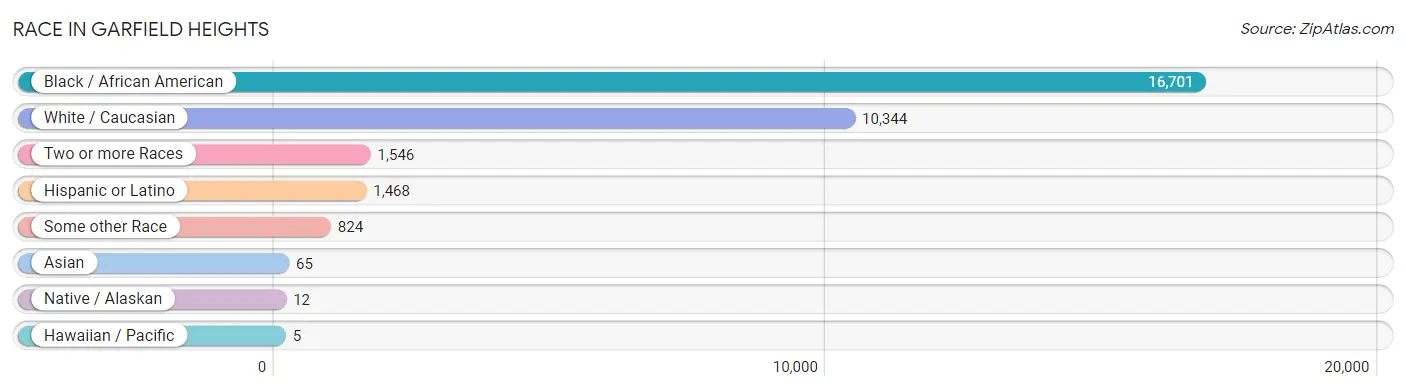
| Race | # Population | % Population |
| Asian | 65 | 0.2% |
| Black / African American | 16,701 | 56.6% |
| Hawaiian / Pacific | 5 | 0.0% |
| Hispanic or Latino | 1,468 | 5.0% |
| Native / Alaskan | 12 | 0.0% |
| White / Caucasian | 10,344 | 35.1% |
| Two or more Races | 1,546 | 5.2% |
| Some other Race | 824 | 2.8% |
| Total | 29,497 | 100.0% |
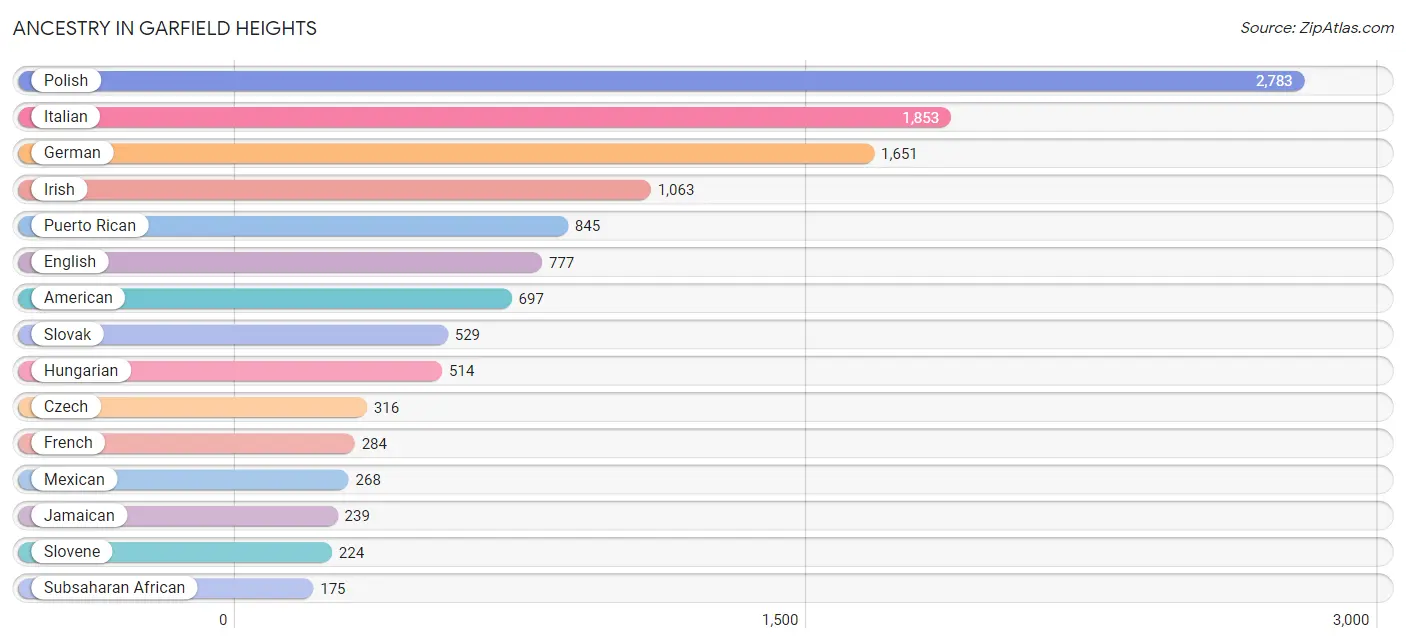
Ancestry in Garfield Heights
The most populous ancestries reported in Garfield Heights are Polish (2,783 | 9.4%), Italian (1,853 | 6.3%), German (1,651 | 5.6%), Irish (1,063 | 3.6%), and Puerto Rican (845 | 2.9%), together accounting for 27.8% of all Garfield Heights residents.
| Ancestry | # Population | % Population |
| African | 161 | 0.5% |
| American | 697 | 2.4% |
| Arab | 68 | 0.2% |
| Argentinean | 29 | 0.1% |
| Armenian | 9 | 0.0% |
| Austrian | 9 | 0.0% |
| Bhutanese | 61 | 0.2% |
| British | 25 | 0.1% |
| Burmese | 21 | 0.1% |
| Canadian | 9 | 0.0% |
| Carpatho Rusyn | 16 | 0.1% |
| Central American | 58 | 0.2% |
| Cherokee | 109 | 0.4% |
| Chippewa | 6 | 0.0% |
| Croatian | 150 | 0.5% |
| Cuban | 19 | 0.1% |
| Czech | 316 | 1.1% |
| Czechoslovakian | 118 | 0.4% |
| Danish | 11 | 0.0% |
| Dominican | 101 | 0.3% |
| Dutch | 77 | 0.3% |
| Eastern European | 13 | 0.0% |
| English | 777 | 2.6% |
| European | 113 | 0.4% |
| Finnish | 21 | 0.1% |
| French | 284 | 1.0% |
| German | 1,651 | 5.6% |
| Ghanaian | 14 | 0.1% |
| Greek | 61 | 0.2% |
| Honduran | 44 | 0.2% |
| Hungarian | 514 | 1.7% |
| Indian (Asian) | 49 | 0.2% |
| Irish | 1,063 | 3.6% |
| Italian | 1,853 | 6.3% |
| Jamaican | 239 | 0.8% |
| Korean | 19 | 0.1% |
| Lebanese | 4 | 0.0% |
| Lithuanian | 13 | 0.0% |
| Mexican | 268 | 0.9% |
| Moroccan | 64 | 0.2% |
| Pennsylvania German | 56 | 0.2% |
| Peruvian | 19 | 0.1% |
| Polish | 2,783 | 9.4% |
| Portuguese | 12 | 0.0% |
| Puerto Rican | 845 | 2.9% |
| Romanian | 19 | 0.1% |
| Russian | 99 | 0.3% |
| Salvadoran | 14 | 0.1% |
| Samoan | 5 | 0.0% |
| Scandinavian | 18 | 0.1% |
| Scotch-Irish | 56 | 0.2% |
| Scottish | 165 | 0.6% |
| Serbian | 8 | 0.0% |
| Slovak | 529 | 1.8% |
| Slovene | 224 | 0.8% |
| South American | 48 | 0.2% |
| Spanish | 9 | 0.0% |
| Subsaharan African | 175 | 0.6% |
| Swedish | 71 | 0.2% |
| Swiss | 4 | 0.0% |
| Trinidadian and Tobagonian | 10 | 0.0% |
| Ukrainian | 52 | 0.2% |
| Welsh | 18 | 0.1% |
| West Indian | 12 | 0.0% | View All 64 Rows |
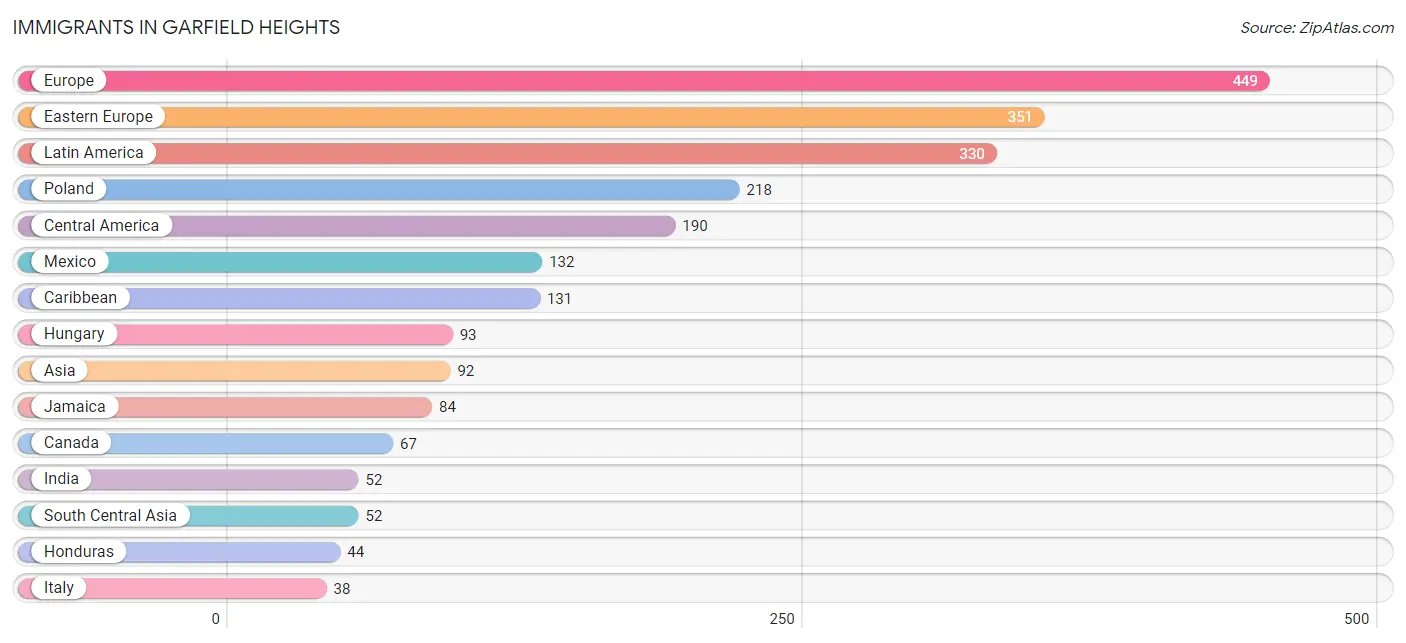
Immigrants in Garfield Heights
The most numerous immigrant groups reported in Garfield Heights came from Europe (449 | 1.5%), Eastern Europe (351 | 1.2%), Latin America (330 | 1.1%), Poland (218 | 0.7%), and Central America (190 | 0.6%), together accounting for 5.2% of all Garfield Heights residents.
| Immigration Origin | # Population | % Population |
| Africa | 14 | 0.1% |
| Argentina | 9 | 0.0% |
| Asia | 92 | 0.3% |
| Canada | 67 | 0.2% |
| Caribbean | 131 | 0.4% |
| Central America | 190 | 0.6% |
| Czechoslovakia | 7 | 0.0% |
| Dominican Republic | 35 | 0.1% |
| Eastern Asia | 21 | 0.1% |
| Eastern Europe | 351 | 1.2% |
| El Salvador | 14 | 0.1% |
| England | 24 | 0.1% |
| Europe | 449 | 1.5% |
| Germany | 36 | 0.1% |
| Ghana | 14 | 0.1% |
| Honduras | 44 | 0.2% |
| Hungary | 93 | 0.3% |
| India | 52 | 0.2% |
| Italy | 38 | 0.1% |
| Jamaica | 84 | 0.3% |
| Korea | 21 | 0.1% |
| Latin America | 330 | 1.1% |
| Mexico | 132 | 0.4% |
| Northern Europe | 24 | 0.1% |
| Philippines | 19 | 0.1% |
| Poland | 218 | 0.7% |
| Romania | 18 | 0.1% |
| Russia | 15 | 0.1% |
| South America | 9 | 0.0% |
| South Central Asia | 52 | 0.2% |
| South Eastern Asia | 19 | 0.1% |
| Southern Europe | 38 | 0.1% |
| Trinidad and Tobago | 12 | 0.0% |
| Western Africa | 14 | 0.1% |
| Western Europe | 36 | 0.1% | View All 35 Rows |
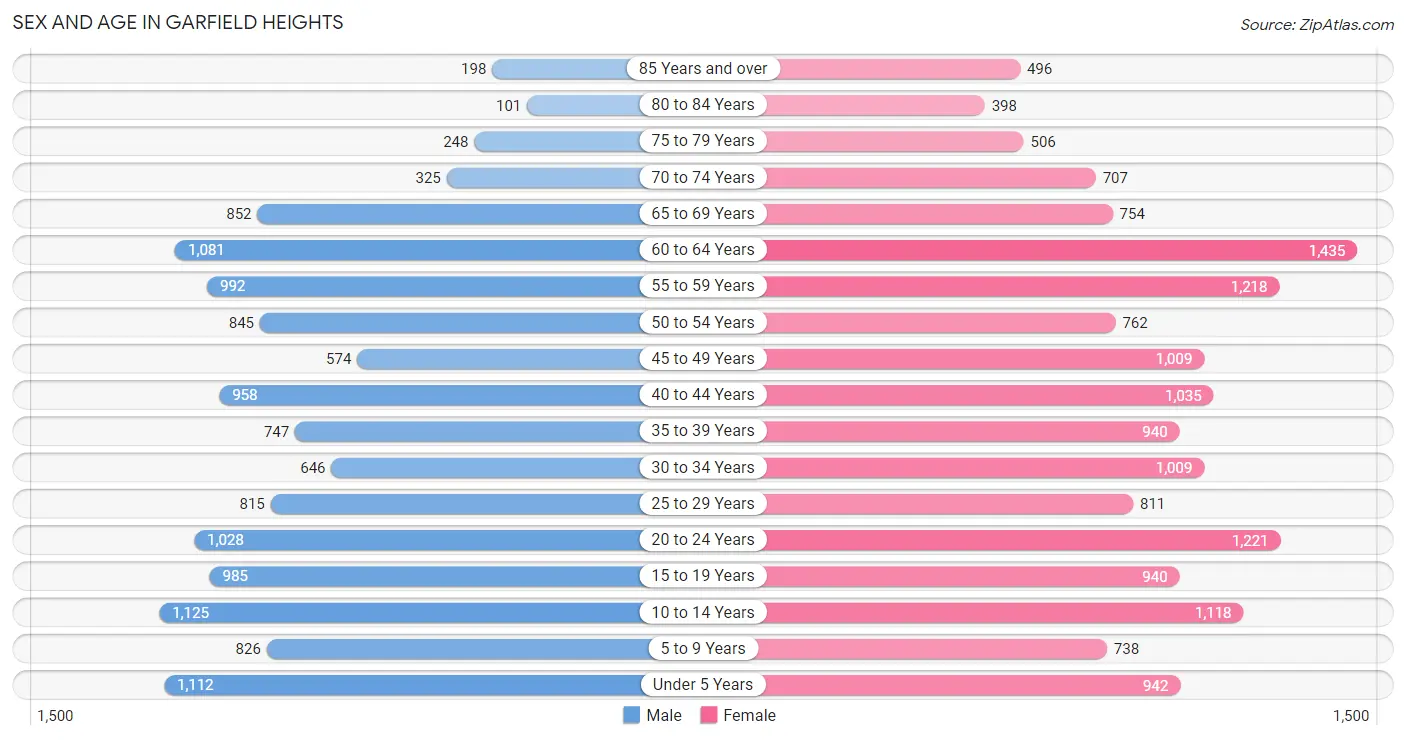
Sex and Age in Garfield Heights
Sex and Age in Garfield Heights
The most populous age groups in Garfield Heights are 10 to 14 Years (1,125 | 8.4%) for men and 60 to 64 Years (1,435 | 8.9%) for women.
| Age Bracket | Male | Female |
| Under 5 Years | 1,112 (8.3%) | 942 (5.9%) |
| 5 to 9 Years | 826 (6.1%) | 738 (4.6%) |
| 10 to 14 Years | 1,125 (8.4%) | 1,118 (7.0%) |
| 15 to 19 Years | 985 (7.3%) | 940 (5.9%) |
| 20 to 24 Years | 1,028 (7.6%) | 1,221 (7.6%) |
| 25 to 29 Years | 815 (6.1%) | 811 (5.1%) |
| 30 to 34 Years | 646 (4.8%) | 1,009 (6.3%) |
| 35 to 39 Years | 747 (5.6%) | 940 (5.9%) |
| 40 to 44 Years | 958 (7.1%) | 1,035 (6.5%) |
| 45 to 49 Years | 574 (4.3%) | 1,009 (6.3%) |
| 50 to 54 Years | 845 (6.3%) | 762 (4.8%) |
| 55 to 59 Years | 992 (7.4%) | 1,218 (7.6%) |
| 60 to 64 Years | 1,081 (8.0%) | 1,435 (8.9%) |
| 65 to 69 Years | 852 (6.3%) | 754 (4.7%) |
| 70 to 74 Years | 325 (2.4%) | 707 (4.4%) |
| 75 to 79 Years | 248 (1.8%) | 506 (3.2%) |
| 80 to 84 Years | 101 (0.7%) | 398 (2.5%) |
| 85 Years and over | 198 (1.5%) | 496 (3.1%) |
| Total | 13,458 (100.0%) | 16,039 (100.0%) |
Families and Households in Garfield Heights
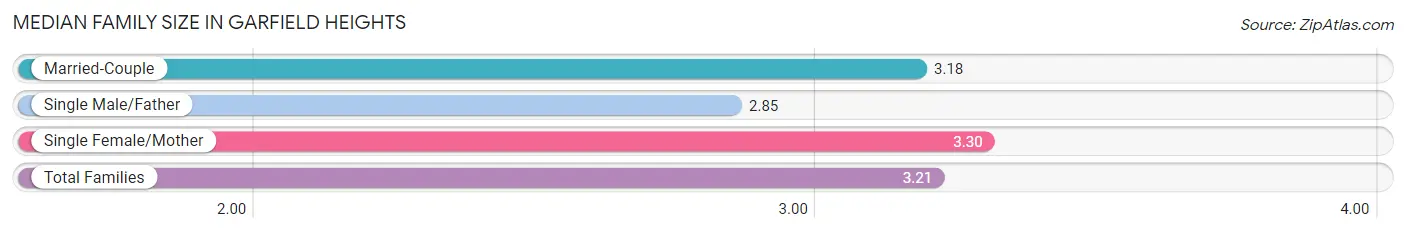
Median Family Size in Garfield Heights
The median family size in Garfield Heights is 3.21 persons per family, with single female/mother families (2,802 | 42.0%) accounting for the largest median family size of 3.3 persons per family. On the other hand, single male/father families (495 | 7.4%) represent the smallest median family size with 2.85 persons per family.
| Family Type | # Families | Family Size |
| Married-Couple | 3,370 (50.5%) | 3.18 |
| Single Male/Father | 495 (7.4%) | 2.85 |
| Single Female/Mother | 2,802 (42.0%) | 3.30 |
| Total Families | 6,667 (100.0%) | 3.21 |
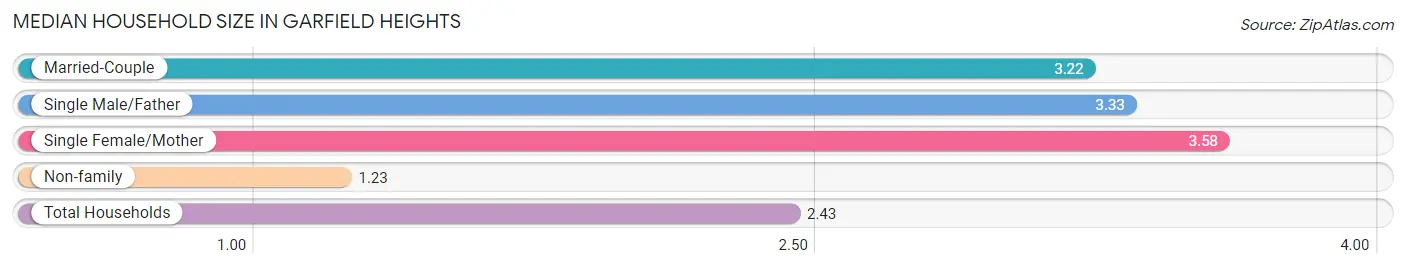
Median Household Size in Garfield Heights
The median household size in Garfield Heights is 2.43 persons per household, with single female/mother households (2,802 | 23.4%) accounting for the largest median household size of 3.58 persons per household. non-family households (5,307 | 44.3%) represent the smallest median household size with 1.23 persons per household.
| Household Type | # Households | Household Size |
| Married-Couple | 3,370 (28.1%) | 3.22 |
| Single Male/Father | 495 (4.1%) | 3.33 |
| Single Female/Mother | 2,802 (23.4%) | 3.58 |
| Non-family | 5,307 (44.3%) | 1.23 |
| Total Households | 11,974 (100.0%) | 2.43 |
Household Size by Marriage Status in Garfield Heights
Out of a total of 11,974 households in Garfield Heights, 6,667 (55.7%) are family households, while 5,307 (44.3%) are nonfamily households. The most numerous type of family households are 2-person households, comprising 2,570, and the most common type of nonfamily households are 1-person households, comprising 4,520.
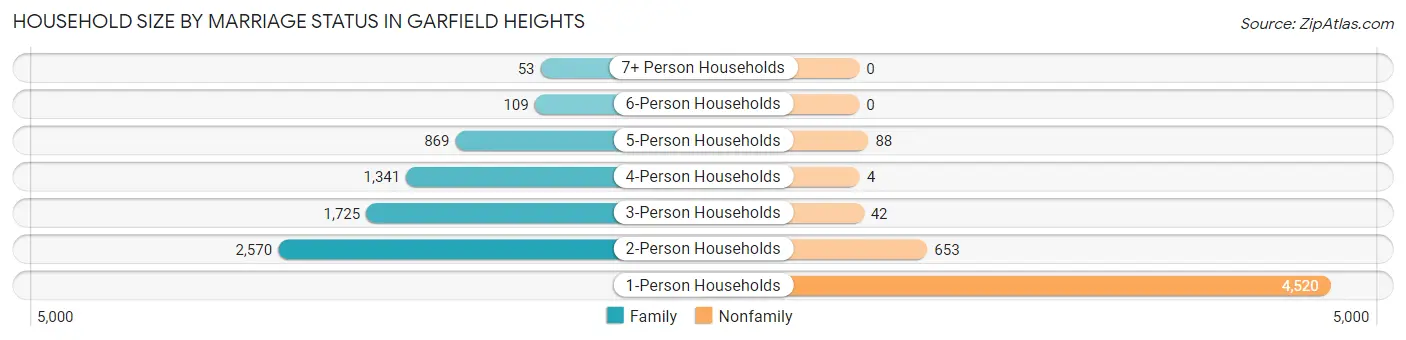
| Household Size | Family Households | Nonfamily Households |
| 1-Person Households | - | 4,520 (37.8%) |
| 2-Person Households | 2,570 (21.5%) | 653 (5.4%) |
| 3-Person Households | 1,725 (14.4%) | 42 (0.4%) |
| 4-Person Households | 1,341 (11.2%) | 4 (0.0%) |
| 5-Person Households | 869 (7.3%) | 88 (0.7%) |
| 6-Person Households | 109 (0.9%) | 0 (0.0%) |
| 7+ Person Households | 53 (0.4%) | 0 (0.0%) |
| Total | 6,667 (55.7%) | 5,307 (44.3%) |
Female Fertility in Garfield Heights
Fertility by Age in Garfield Heights
Average fertility rate in Garfield Heights is 55.0 births per 1,000 women. Women in the age bracket of 20 to 34 years have the highest fertility rate with 116.0 births per 1,000 women. Women in the age bracket of 20 to 34 years acount for 91.0% of all women with births.
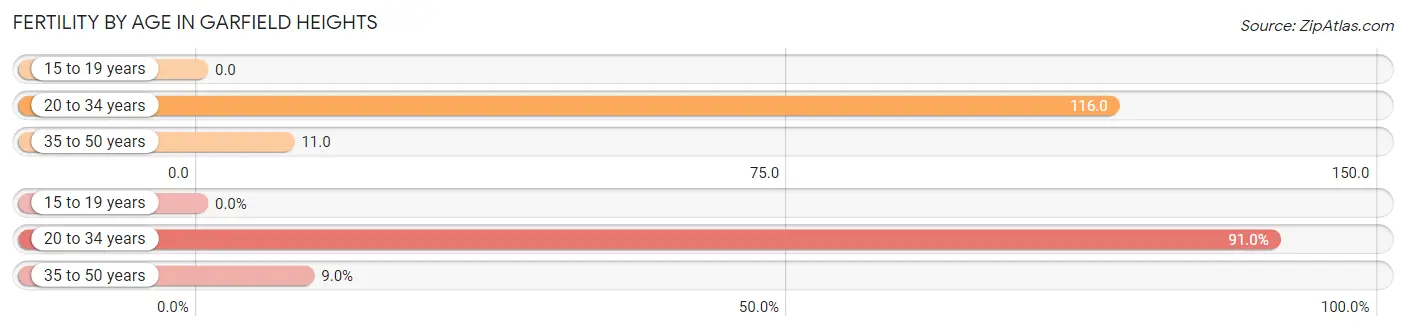
| Age Bracket | Women with Births | Births / 1,000 Women |
| 15 to 19 years | 0 (0.0%) | 0.0 |
| 20 to 34 years | 353 (91.0%) | 116.0 |
| 35 to 50 years | 35 (9.0%) | 11.0 |
| Total | 388 (100.0%) | 55.0 |
Fertility by Age by Marriage Status in Garfield Heights
13.9% of women with births (388) in Garfield Heights are married. The highest percentage of unmarried women with births falls into 35 to 50 years age bracket with 100.0% of them unmarried at the time of birth, while the lowest percentage of unmarried women with births belong to 20 to 34 years age bracket with 84.7% of them unmarried.
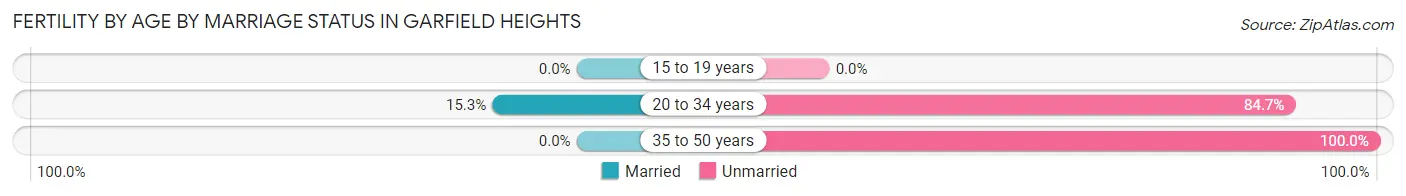
| Age Bracket | Married | Unmarried |
| 15 to 19 years | 0 (0.0%) | 0 (0.0%) |
| 20 to 34 years | 54 (15.3%) | 299 (84.7%) |
| 35 to 50 years | 0 (0.0%) | 35 (100.0%) |
| Total | 54 (13.9%) | 334 (86.1%) |
Fertility by Education in Garfield Heights
Average fertility rate in Garfield Heights is 55.0 births per 1,000 women. Women with the education attainment of college or associate's degree have the highest fertility rate of 86.0 births per 1,000 women, while women with the education attainment of high school diploma have the lowest fertility at 14.0 births per 1,000 women. Women with the education attainment of college or associate's degree represent 66.7% of all women with births.
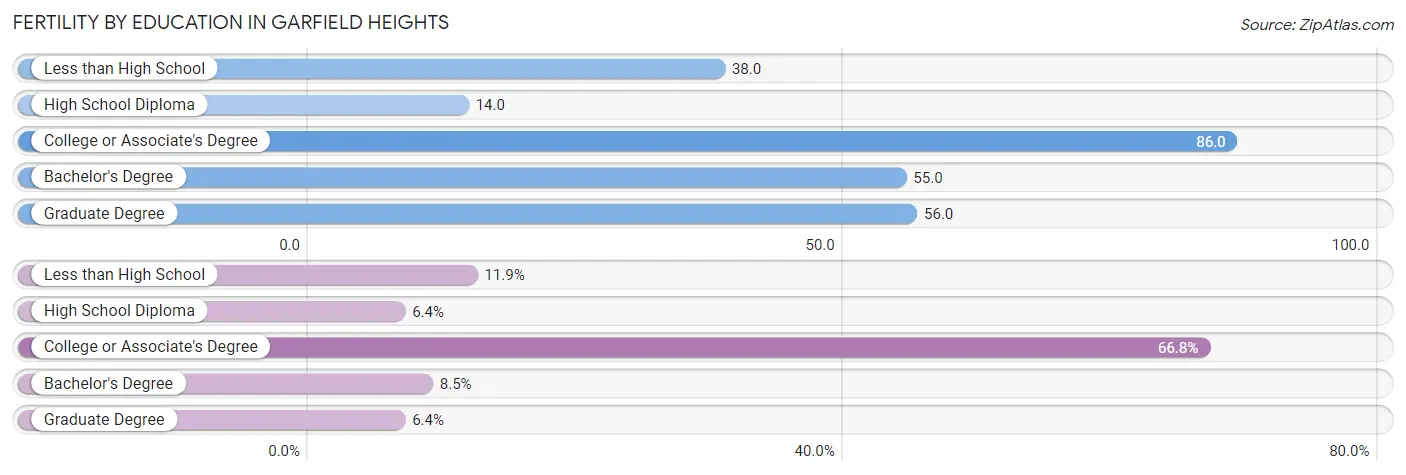
| Educational Attainment | Women with Births | Births / 1,000 Women |
| Less than High School | 46 (11.9%) | 38.0 |
| High School Diploma | 25 (6.4%) | 14.0 |
| College or Associate's Degree | 259 (66.7%) | 86.0 |
| Bachelor's Degree | 33 (8.5%) | 55.0 |
| Graduate Degree | 25 (6.4%) | 56.0 |
| Total | 388 (100.0%) | 55.0 |
Fertility by Education by Marriage Status in Garfield Heights
86.1% of women with births in Garfield Heights are unmarried. Women with the educational attainment of bachelor's degree are most likely to be married with 100.0% of them married at childbirth, while women with the educational attainment of less than high school are least likely to be married with 100.0% of them unmarried at childbirth.
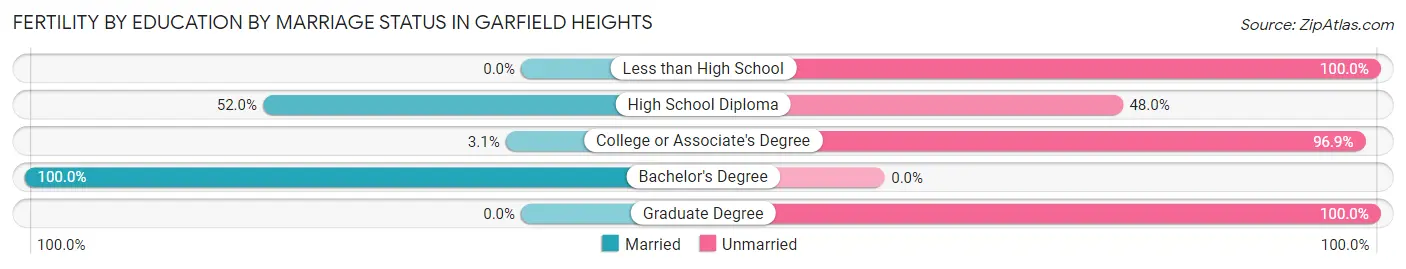
| Educational Attainment | Married | Unmarried |
| Less than High School | 0 (0.0%) | 46 (100.0%) |
| High School Diploma | 13 (52.0%) | 12 (48.0%) |
| College or Associate's Degree | 8 (3.1%) | 251 (96.9%) |
| Bachelor's Degree | 33 (100.0%) | 0 (0.0%) |
| Graduate Degree | 0 (0.0%) | 25 (100.0%) |
| Total | 54 (13.9%) | 334 (86.1%) |
Employment Characteristics in Garfield Heights
Employment by Class of Employer in Garfield Heights
Among the 13,015 employed individuals in Garfield Heights, private company employees (8,774 | 67.4%), not-for-profit organizations (1,665 | 12.8%), and local government employees (1,146 | 8.8%) make up the most common classes of employment.
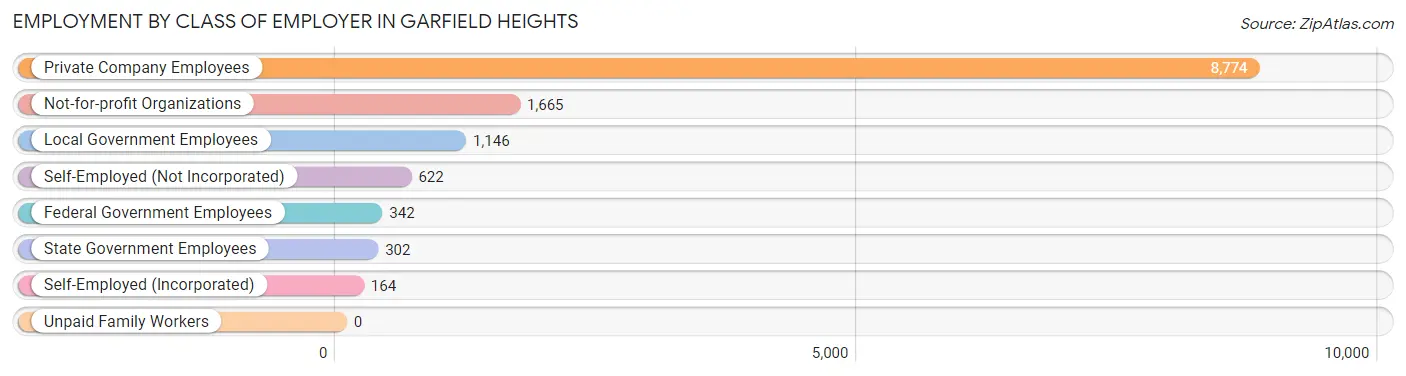
| Employer Class | # Employees | % Employees |
| Private Company Employees | 8,774 | 67.4% |
| Self-Employed (Incorporated) | 164 | 1.3% |
| Self-Employed (Not Incorporated) | 622 | 4.8% |
| Not-for-profit Organizations | 1,665 | 12.8% |
| Local Government Employees | 1,146 | 8.8% |
| State Government Employees | 302 | 2.3% |
| Federal Government Employees | 342 | 2.6% |
| Unpaid Family Workers | 0 | 0.0% |
| Total | 13,015 | 100.0% |
Employment Status by Age in Garfield Heights
According to the labor force statistics for Garfield Heights, out of the total population over 16 years of age (23,277), 63.9% or 14,874 individuals are in the labor force, with 9.8% or 1,458 of them unemployed. The age group with the highest labor force participation rate is 30 to 34 years, with 91.4% or 1,513 individuals in the labor force. Within the labor force, the 16 to 19 years age range has the highest percentage of unemployed individuals, with 38.1% or 253 of them being unemployed.
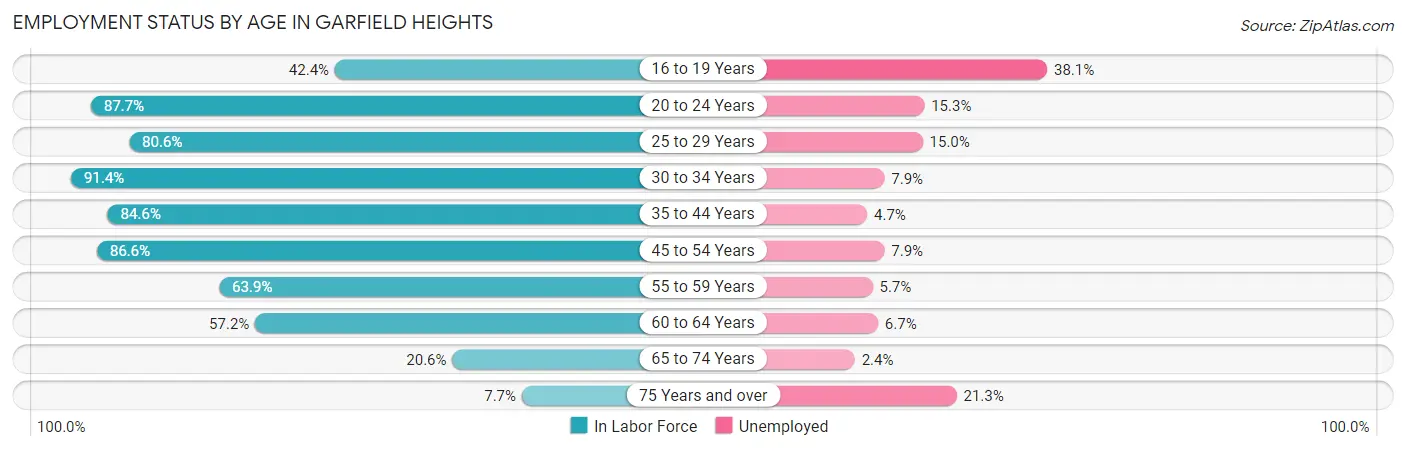
| Age Bracket | In Labor Force | Unemployed |
| 16 to 19 Years | 664 (42.4%) | 253 (38.1%) |
| 20 to 24 Years | 1,972 (87.7%) | 302 (15.3%) |
| 25 to 29 Years | 1,311 (80.6%) | 197 (15.0%) |
| 30 to 34 Years | 1,513 (91.4%) | 120 (7.9%) |
| 35 to 44 Years | 3,113 (84.6%) | 146 (4.7%) |
| 45 to 54 Years | 2,763 (86.6%) | 218 (7.9%) |
| 55 to 59 Years | 1,412 (63.9%) | 80 (5.7%) |
| 60 to 64 Years | 1,439 (57.2%) | 96 (6.7%) |
| 65 to 74 Years | 543 (20.6%) | 13 (2.4%) |
| 75 Years and over | 150 (7.7%) | 32 (21.3%) |
| Total | 14,874 (63.9%) | 1,458 (9.8%) |
Employment Status by Educational Attainment in Garfield Heights
According to labor force statistics for Garfield Heights, 77.6% of individuals (11,545) out of the total population between 25 and 64 years of age (14,877) are in the labor force, with 7.4% or 854 of them being unemployed. The group with the highest labor force participation rate are those with the educational attainment of bachelor's degree or higher, with 89.0% or 2,010 individuals in the labor force. Within the labor force, individuals with less than high school education have the highest percentage of unemployment, with 24.5% or 200 of them being unemployed.
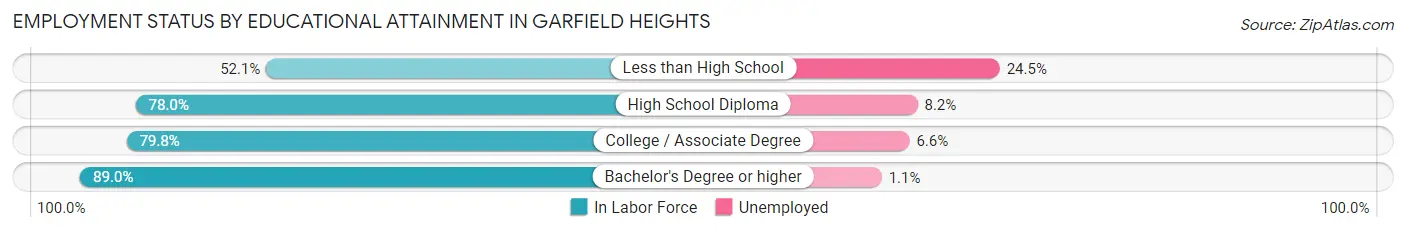
| Educational Attainment | In Labor Force | Unemployed |
| Less than High School | 815 (52.1%) | 383 (24.5%) |
| High School Diploma | 4,044 (78.0%) | 425 (8.2%) |
| College / Associate Degree | 4,685 (79.8%) | 387 (6.6%) |
| Bachelor's Degree or higher | 2,010 (89.0%) | 25 (1.1%) |
| Total | 11,545 (77.6%) | 1,101 (7.4%) |
Employment Occupations by Sex in Garfield Heights
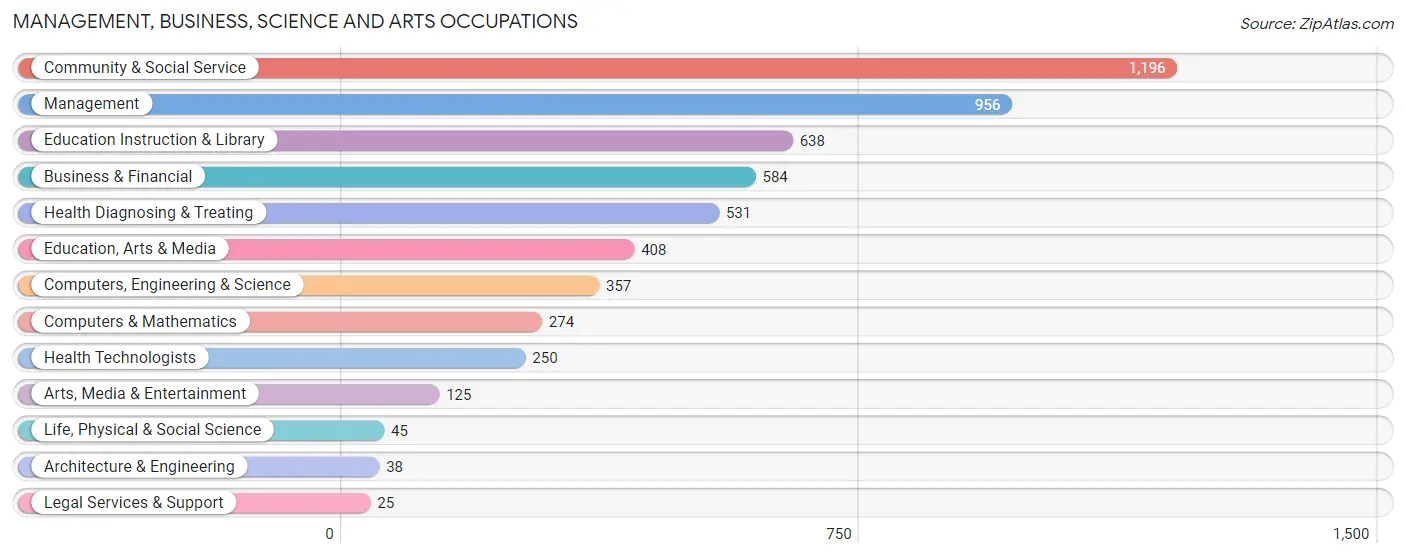
Management, Business, Science and Arts Occupations
The most common Management, Business, Science and Arts occupations in Garfield Heights are Community & Social Service (1,196 | 8.9%), Management (956 | 7.1%), Education Instruction & Library (638 | 4.8%), Business & Financial (584 | 4.3%), and Health Diagnosing & Treating (531 | 4.0%).
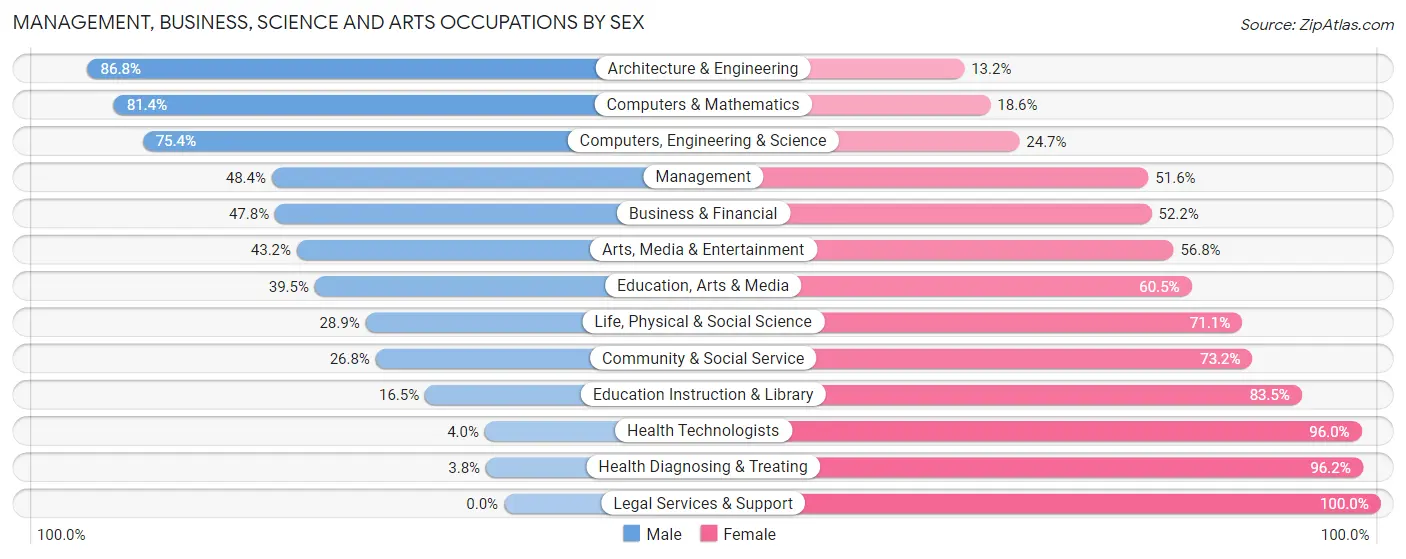
Management, Business, Science and Arts Occupations by Sex
Within the Management, Business, Science and Arts occupations in Garfield Heights, the most male-oriented occupations are Architecture & Engineering (86.8%), Computers & Mathematics (81.4%), and Computers, Engineering & Science (75.3%), while the most female-oriented occupations are Legal Services & Support (100.0%), Health Diagnosing & Treating (96.2%), and Health Technologists (96.0%).
| Occupation | Male | Female |
| Management | 463 (48.4%) | 493 (51.6%) |
| Business & Financial | 279 (47.8%) | 305 (52.2%) |
| Computers, Engineering & Science | 269 (75.3%) | 88 (24.6%) |
| Computers & Mathematics | 223 (81.4%) | 51 (18.6%) |
| Architecture & Engineering | 33 (86.8%) | 5 (13.2%) |
| Life, Physical & Social Science | 13 (28.9%) | 32 (71.1%) |
| Community & Social Service | 320 (26.8%) | 876 (73.2%) |
| Education, Arts & Media | 161 (39.5%) | 247 (60.5%) |
| Legal Services & Support | 0 (0.0%) | 25 (100.0%) |
| Education Instruction & Library | 105 (16.5%) | 533 (83.5%) |
| Arts, Media & Entertainment | 54 (43.2%) | 71 (56.8%) |
| Health Diagnosing & Treating | 20 (3.8%) | 511 (96.2%) |
| Health Technologists | 10 (4.0%) | 240 (96.0%) |
| Total (Category) | 1,351 (37.3%) | 2,273 (62.7%) |
| Total (Overall) | 6,183 (46.1%) | 7,227 (53.9%) |
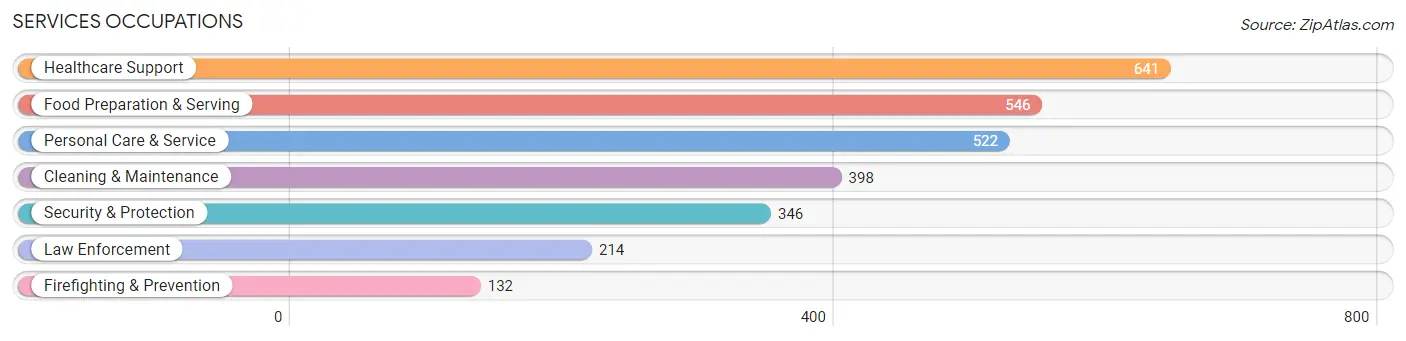
Services Occupations
The most common Services occupations in Garfield Heights are Healthcare Support (641 | 4.8%), Food Preparation & Serving (546 | 4.1%), Personal Care & Service (522 | 3.9%), Cleaning & Maintenance (398 | 3.0%), and Security & Protection (346 | 2.6%).
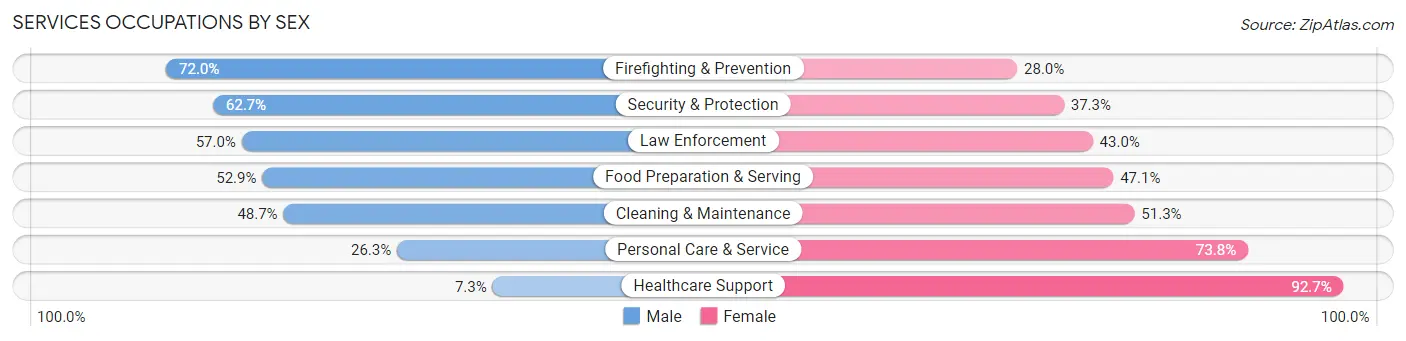
Services Occupations by Sex
Within the Services occupations in Garfield Heights, the most male-oriented occupations are Firefighting & Prevention (72.0%), Security & Protection (62.7%), and Law Enforcement (57.0%), while the most female-oriented occupations are Healthcare Support (92.7%), Personal Care & Service (73.8%), and Cleaning & Maintenance (51.3%).
| Occupation | Male | Female |
| Healthcare Support | 47 (7.3%) | 594 (92.7%) |
| Security & Protection | 217 (62.7%) | 129 (37.3%) |
| Firefighting & Prevention | 95 (72.0%) | 37 (28.0%) |
| Law Enforcement | 122 (57.0%) | 92 (43.0%) |
| Food Preparation & Serving | 289 (52.9%) | 257 (47.1%) |
| Cleaning & Maintenance | 194 (48.7%) | 204 (51.3%) |
| Personal Care & Service | 137 (26.3%) | 385 (73.8%) |
| Total (Category) | 884 (36.0%) | 1,569 (64.0%) |
| Total (Overall) | 6,183 (46.1%) | 7,227 (53.9%) |
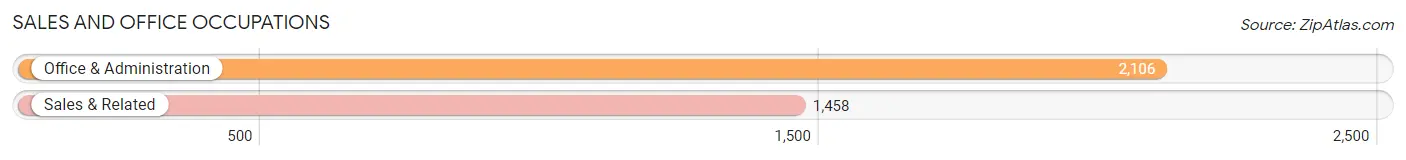
Sales and Office Occupations
The most common Sales and Office occupations in Garfield Heights are Office & Administration (2,106 | 15.7%), and Sales & Related (1,458 | 10.9%).
Sales and Office Occupations by Sex
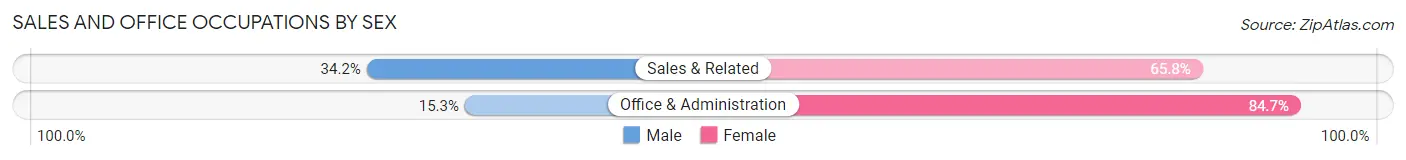
| Occupation | Male | Female |
| Sales & Related | 499 (34.2%) | 959 (65.8%) |
| Office & Administration | 323 (15.3%) | 1,783 (84.7%) |
| Total (Category) | 822 (23.1%) | 2,742 (76.9%) |
| Total (Overall) | 6,183 (46.1%) | 7,227 (53.9%) |
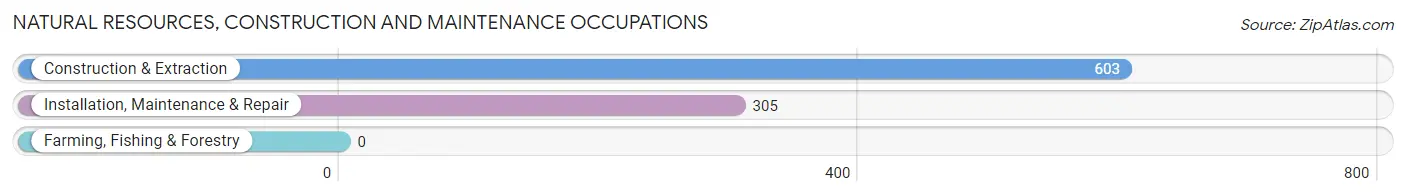
Natural Resources, Construction and Maintenance Occupations
The most common Natural Resources, Construction and Maintenance occupations in Garfield Heights are Construction & Extraction (603 | 4.5%), and Installation, Maintenance & Repair (305 | 2.3%).
Natural Resources, Construction and Maintenance Occupations by Sex
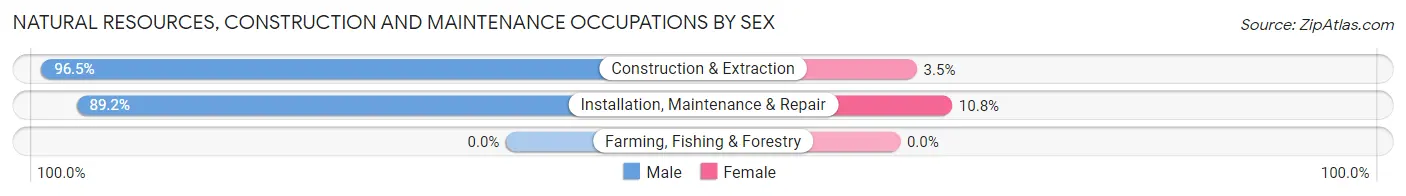
| Occupation | Male | Female |
| Farming, Fishing & Forestry | 0 (0.0%) | 0 (0.0%) |
| Construction & Extraction | 582 (96.5%) | 21 (3.5%) |
| Installation, Maintenance & Repair | 272 (89.2%) | 33 (10.8%) |
| Total (Category) | 854 (94.1%) | 54 (5.9%) |
| Total (Overall) | 6,183 (46.1%) | 7,227 (53.9%) |
Production, Transportation and Moving Occupations
The most common Production, Transportation and Moving occupations in Garfield Heights are Production (1,120 | 8.4%), Transportation (1,009 | 7.5%), and Material Moving (732 | 5.5%).
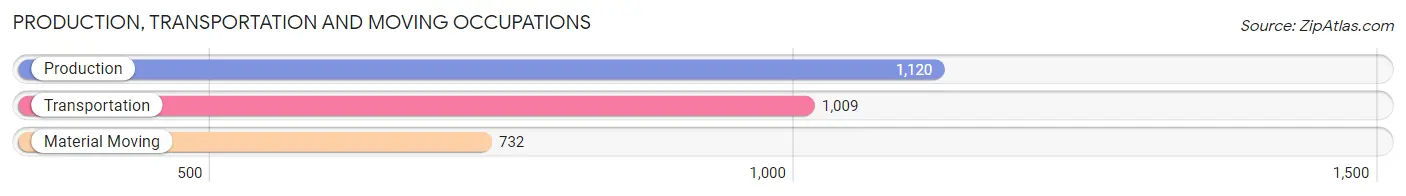
Production, Transportation and Moving Occupations by Sex
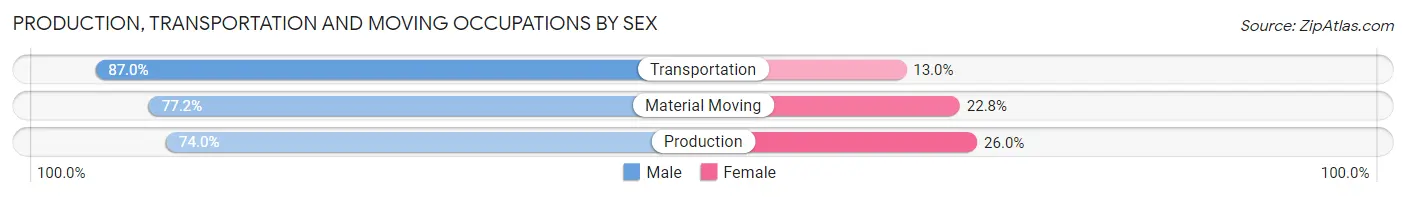
| Occupation | Male | Female |
| Production | 829 (74.0%) | 291 (26.0%) |
| Transportation | 878 (87.0%) | 131 (13.0%) |
| Material Moving | 565 (77.2%) | 167 (22.8%) |
| Total (Category) | 2,272 (79.4%) | 589 (20.6%) |
| Total (Overall) | 6,183 (46.1%) | 7,227 (53.9%) |
Employment Industries by Sex in Garfield Heights
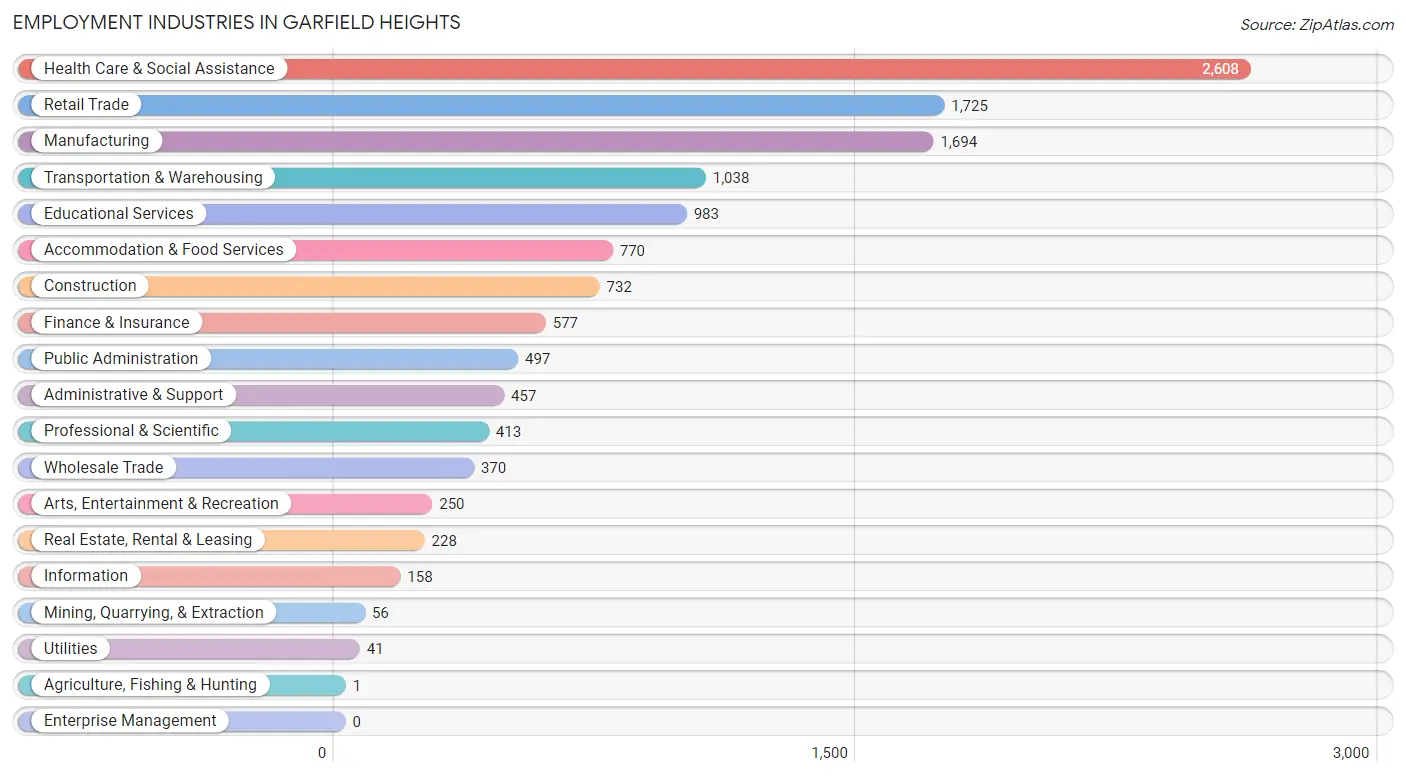
Employment Industries in Garfield Heights
The major employment industries in Garfield Heights include Health Care & Social Assistance (2,608 | 19.5%), Retail Trade (1,725 | 12.9%), Manufacturing (1,694 | 12.6%), Transportation & Warehousing (1,038 | 7.7%), and Educational Services (983 | 7.3%).
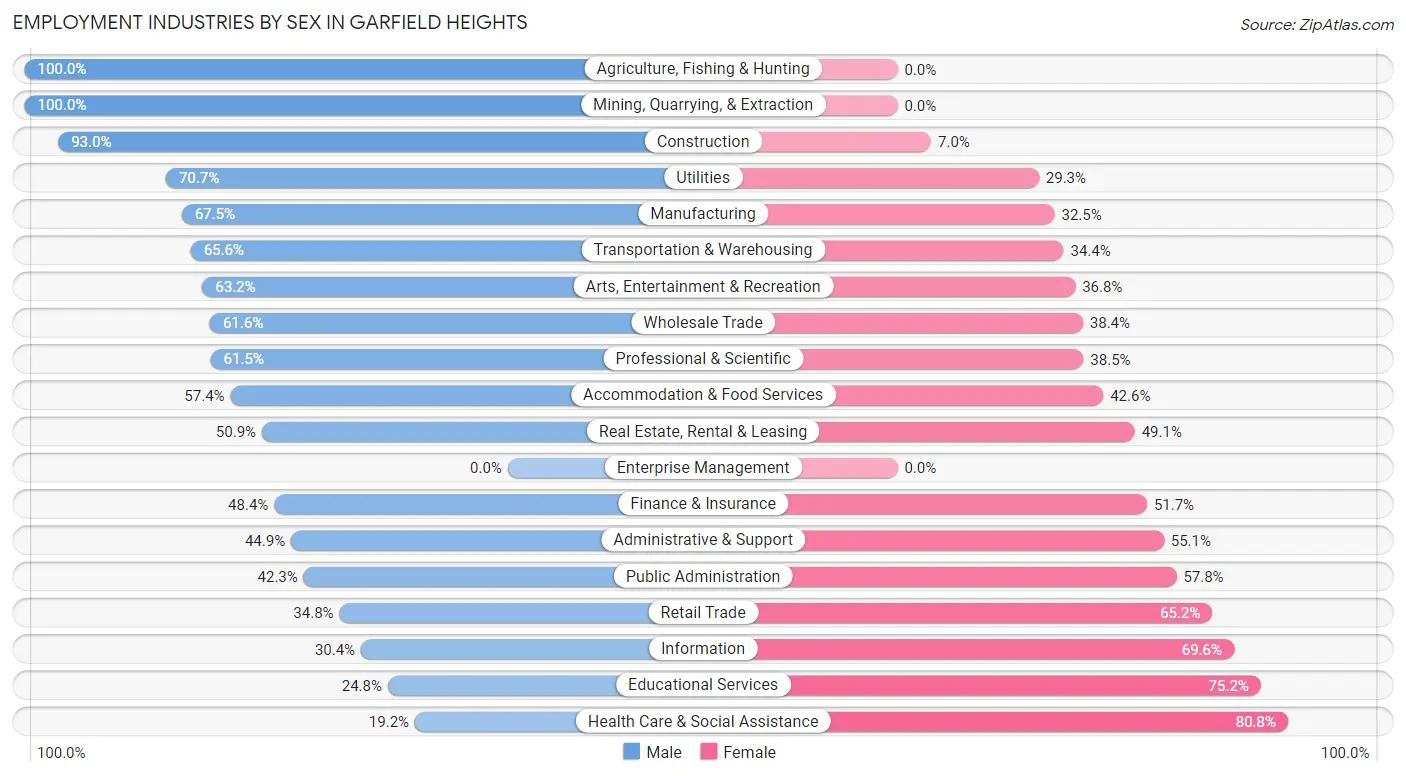
Employment Industries by Sex in Garfield Heights
The Garfield Heights industries that see more men than women are Agriculture, Fishing & Hunting (100.0%), Mining, Quarrying, & Extraction (100.0%), and Construction (93.0%), whereas the industries that tend to have a higher number of women are Health Care & Social Assistance (80.8%), Educational Services (75.2%), and Information (69.6%).
| Industry | Male | Female |
| Agriculture, Fishing & Hunting | 1 (100.0%) | 0 (0.0%) |
| Mining, Quarrying, & Extraction | 56 (100.0%) | 0 (0.0%) |
| Construction | 681 (93.0%) | 51 (7.0%) |
| Manufacturing | 1,143 (67.5%) | 551 (32.5%) |
| Wholesale Trade | 228 (61.6%) | 142 (38.4%) |
| Retail Trade | 601 (34.8%) | 1,124 (65.2%) |
| Transportation & Warehousing | 681 (65.6%) | 357 (34.4%) |
| Utilities | 29 (70.7%) | 12 (29.3%) |
| Information | 48 (30.4%) | 110 (69.6%) |
| Finance & Insurance | 279 (48.3%) | 298 (51.6%) |
| Real Estate, Rental & Leasing | 116 (50.9%) | 112 (49.1%) |
| Professional & Scientific | 254 (61.5%) | 159 (38.5%) |
| Enterprise Management | 0 (0.0%) | 0 (0.0%) |
| Administrative & Support | 205 (44.9%) | 252 (55.1%) |
| Educational Services | 244 (24.8%) | 739 (75.2%) |
| Health Care & Social Assistance | 501 (19.2%) | 2,107 (80.8%) |
| Arts, Entertainment & Recreation | 158 (63.2%) | 92 (36.8%) |
| Accommodation & Food Services | 442 (57.4%) | 328 (42.6%) |
| Public Administration | 210 (42.2%) | 287 (57.8%) |
| Total | 6,183 (46.1%) | 7,227 (53.9%) |
Education in Garfield Heights
School Enrollment in Garfield Heights
The most common levels of schooling among the 7,227 students in Garfield Heights are middle school (2,088 | 28.9%), high school (1,667 | 23.1%), and college / undergraduate (1,370 | 19.0%).
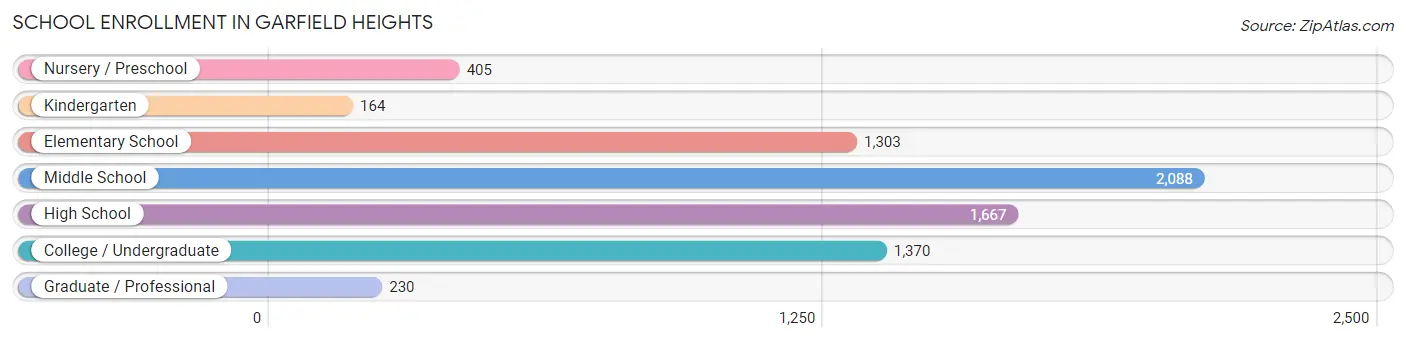
| School Level | # Students | % Students |
| Nursery / Preschool | 405 | 5.6% |
| Kindergarten | 164 | 2.3% |
| Elementary School | 1,303 | 18.0% |
| Middle School | 2,088 | 28.9% |
| High School | 1,667 | 23.1% |
| College / Undergraduate | 1,370 | 19.0% |
| Graduate / Professional | 230 | 3.2% |
| Total | 7,227 | 100.0% |
School Enrollment by Age by Funding Source in Garfield Heights
Out of a total of 7,227 students who are enrolled in schools in Garfield Heights, 968 (13.4%) attend a private institution, while the remaining 6,259 (86.6%) are enrolled in public schools. The age group of 20 to 24 year olds has the highest likelihood of being enrolled in private schools, with 285 (33.5% in the age bracket) enrolled. Conversely, the age group of 10 to 14 year olds has the lowest likelihood of being enrolled in a private school, with 2,121 (95.3% in the age bracket) attending a public institution.
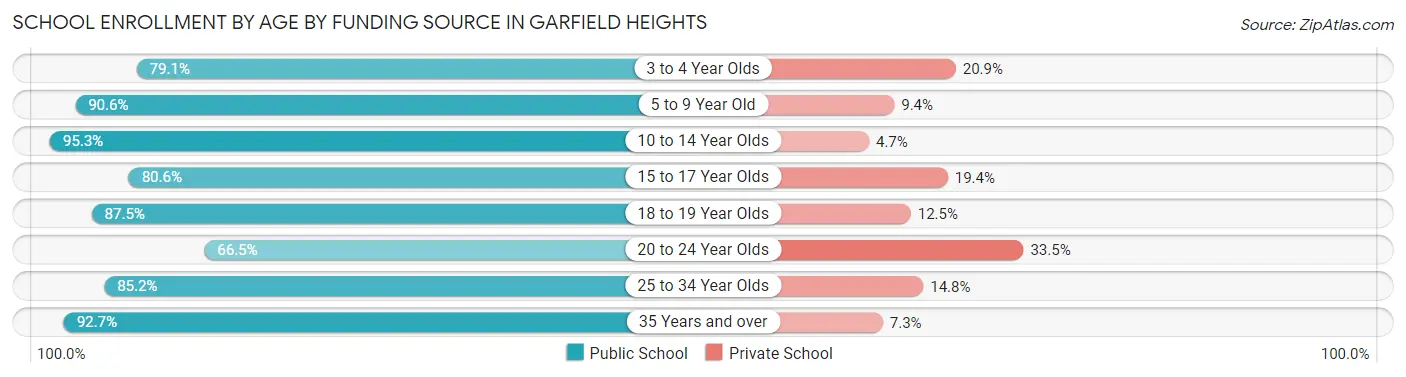
| Age Bracket | Public School | Private School |
| 3 to 4 Year Olds | 269 (79.1%) | 71 (20.9%) |
| 5 to 9 Year Old | 1,335 (90.6%) | 139 (9.4%) |
| 10 to 14 Year Olds | 2,121 (95.3%) | 105 (4.7%) |
| 15 to 17 Year Olds | 935 (80.6%) | 225 (19.4%) |
| 18 to 19 Year Olds | 483 (87.5%) | 69 (12.5%) |
| 20 to 24 Year Olds | 566 (66.5%) | 285 (33.5%) |
| 25 to 34 Year Olds | 333 (85.2%) | 58 (14.8%) |
| 35 Years and over | 216 (92.7%) | 17 (7.3%) |
| Total | 6,259 (86.6%) | 968 (13.4%) |
Educational Attainment by Field of Study in Garfield Heights
Business (876 | 28.8%), education (487 | 16.0%), science & technology (244 | 8.0%), social sciences (211 | 7.0%), and arts & humanities (172 | 5.7%) are the most common fields of study among 3,038 individuals in Garfield Heights who have obtained a bachelor's degree or higher.
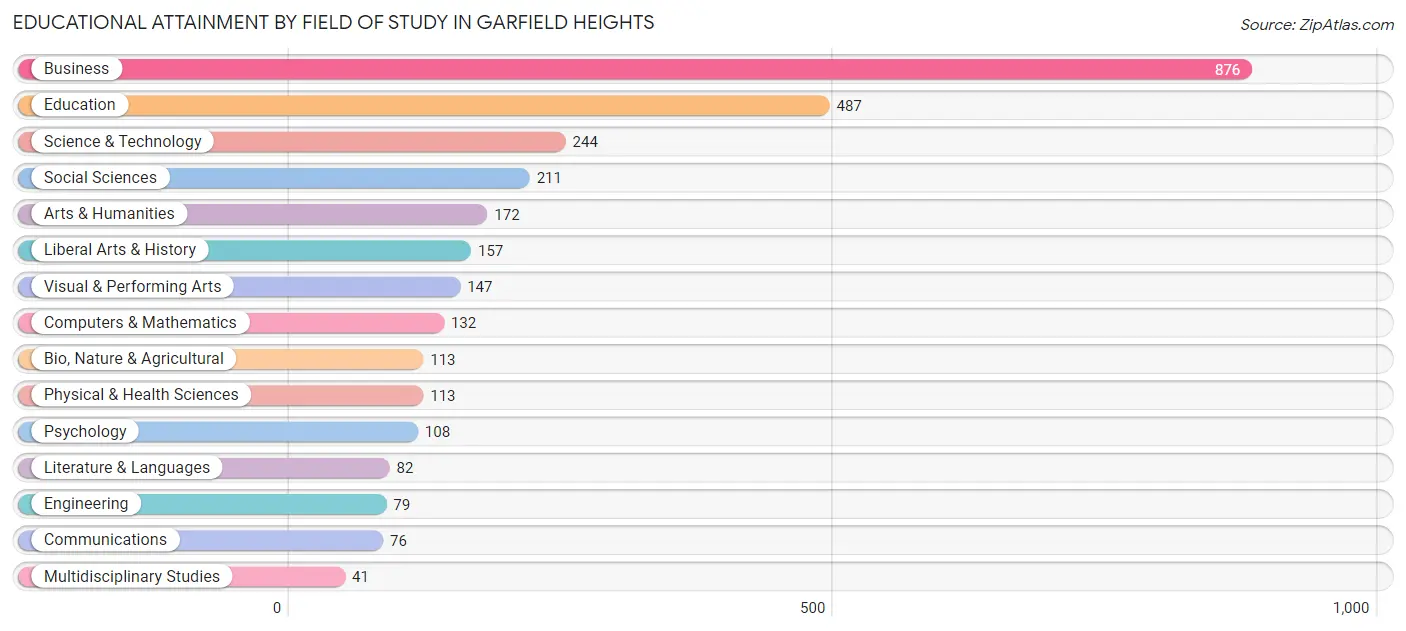
| Field of Study | # Graduates | % Graduates |
| Computers & Mathematics | 132 | 4.3% |
| Bio, Nature & Agricultural | 113 | 3.7% |
| Physical & Health Sciences | 113 | 3.7% |
| Psychology | 108 | 3.5% |
| Social Sciences | 211 | 7.0% |
| Engineering | 79 | 2.6% |
| Multidisciplinary Studies | 41 | 1.3% |
| Science & Technology | 244 | 8.0% |
| Business | 876 | 28.8% |
| Education | 487 | 16.0% |
| Literature & Languages | 82 | 2.7% |
| Liberal Arts & History | 157 | 5.2% |
| Visual & Performing Arts | 147 | 4.8% |
| Communications | 76 | 2.5% |
| Arts & Humanities | 172 | 5.7% |
| Total | 3,038 | 100.0% |
Transportation & Commute in Garfield Heights
Vehicle Availability by Sex in Garfield Heights
The most prevalent vehicle ownership categories in Garfield Heights are males with 2 vehicles (2,768, accounting for 46.4%) and females with 2 vehicles (2,442, making up 39.3%).
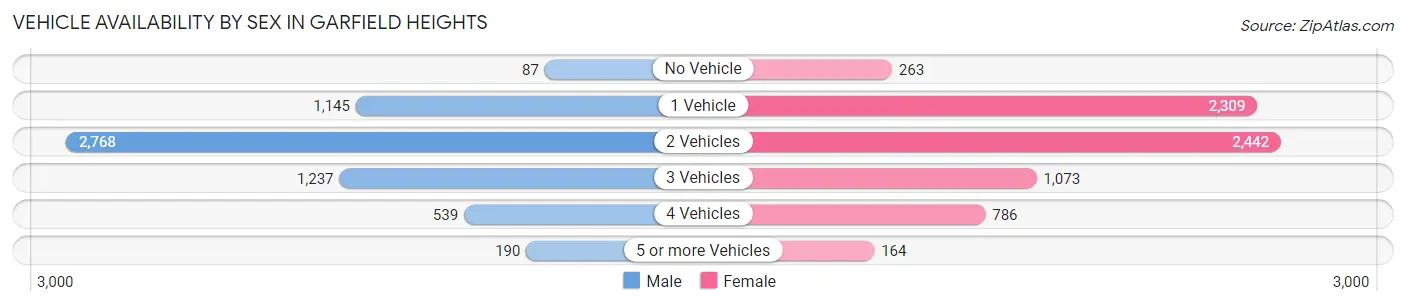
| Vehicles Available | Male | Female |
| No Vehicle | 87 (1.5%) | 263 (3.7%) |
| 1 Vehicle | 1,145 (19.2%) | 2,309 (32.8%) |
| 2 Vehicles | 2,768 (46.4%) | 2,442 (34.7%) |
| 3 Vehicles | 1,237 (20.7%) | 1,073 (15.2%) |
| 4 Vehicles | 539 (9.0%) | 786 (11.2%) |
| 5 or more Vehicles | 190 (3.2%) | 164 (2.3%) |
| Total | 5,966 (100.0%) | 7,037 (100.0%) |
Commute Time in Garfield Heights
The most frequently occuring commute durations in Garfield Heights are 20 to 24 minutes (2,305 commuters, 18.6%), 30 to 34 minutes (2,291 commuters, 18.4%), and 15 to 19 minutes (2,203 commuters, 17.7%).
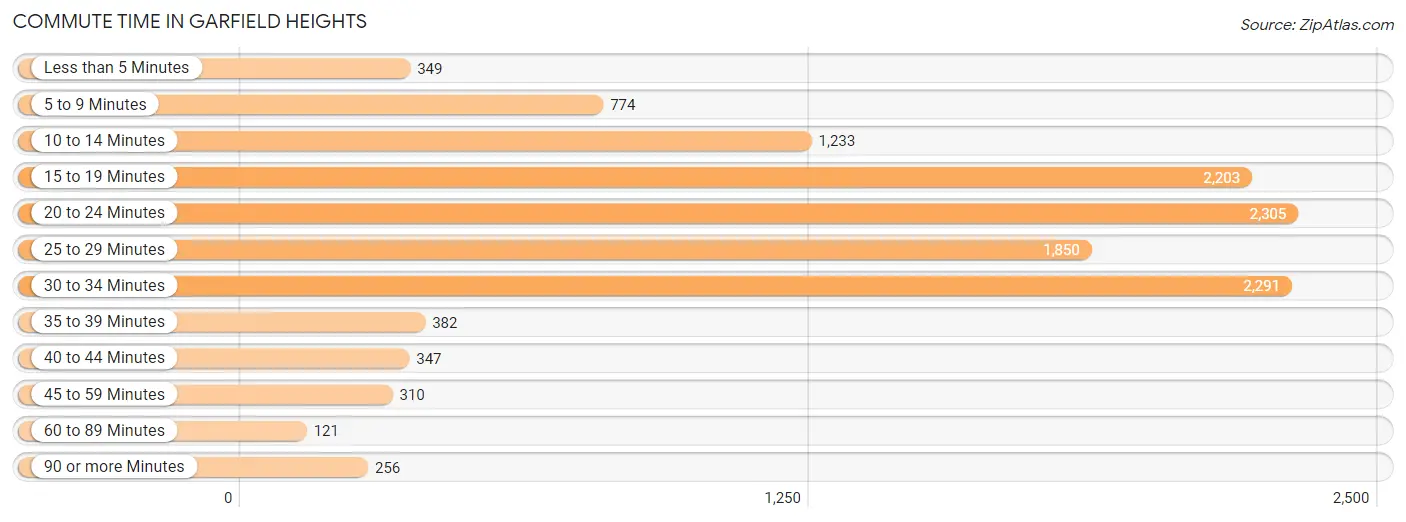
| Commute Time | # Commuters | % Commuters |
| Less than 5 Minutes | 349 | 2.8% |
| 5 to 9 Minutes | 774 | 6.2% |
| 10 to 14 Minutes | 1,233 | 9.9% |
| 15 to 19 Minutes | 2,203 | 17.7% |
| 20 to 24 Minutes | 2,305 | 18.6% |
| 25 to 29 Minutes | 1,850 | 14.9% |
| 30 to 34 Minutes | 2,291 | 18.4% |
| 35 to 39 Minutes | 382 | 3.1% |
| 40 to 44 Minutes | 347 | 2.8% |
| 45 to 59 Minutes | 310 | 2.5% |
| 60 to 89 Minutes | 121 | 1.0% |
| 90 or more Minutes | 256 | 2.1% |
Commute Time by Sex in Garfield Heights
The most common commute times in Garfield Heights are 15 to 19 minutes (1,197 commuters, 21.0%) for males and 20 to 24 minutes (1,254 commuters, 18.6%) for females.
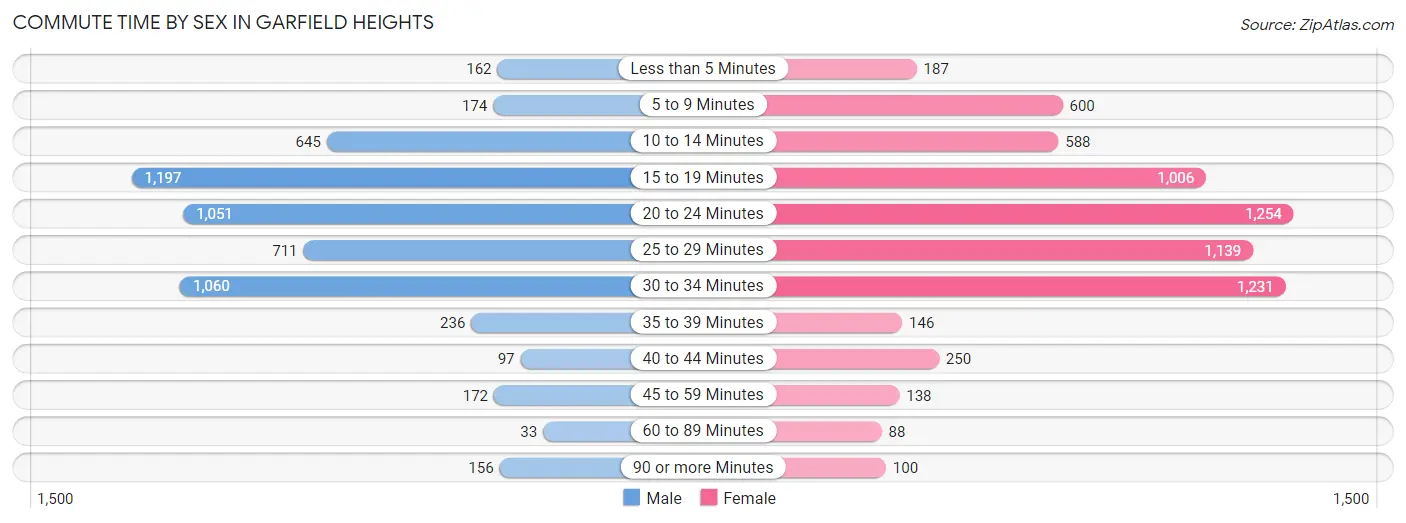
| Commute Time | Male | Female |
| Less than 5 Minutes | 162 (2.9%) | 187 (2.8%) |
| 5 to 9 Minutes | 174 (3.1%) | 600 (8.9%) |
| 10 to 14 Minutes | 645 (11.3%) | 588 (8.7%) |
| 15 to 19 Minutes | 1,197 (21.0%) | 1,006 (14.9%) |
| 20 to 24 Minutes | 1,051 (18.5%) | 1,254 (18.6%) |
| 25 to 29 Minutes | 711 (12.5%) | 1,139 (16.9%) |
| 30 to 34 Minutes | 1,060 (18.6%) | 1,231 (18.3%) |
| 35 to 39 Minutes | 236 (4.1%) | 146 (2.2%) |
| 40 to 44 Minutes | 97 (1.7%) | 250 (3.7%) |
| 45 to 59 Minutes | 172 (3.0%) | 138 (2.1%) |
| 60 to 89 Minutes | 33 (0.6%) | 88 (1.3%) |
| 90 or more Minutes | 156 (2.7%) | 100 (1.5%) |
Time of Departure to Work by Sex in Garfield Heights
The most frequent times of departure to work in Garfield Heights are 6:30 AM to 6:59 AM (574, 10.1%) for males and 8:00 AM to 8:29 AM (986, 14.7%) for females.
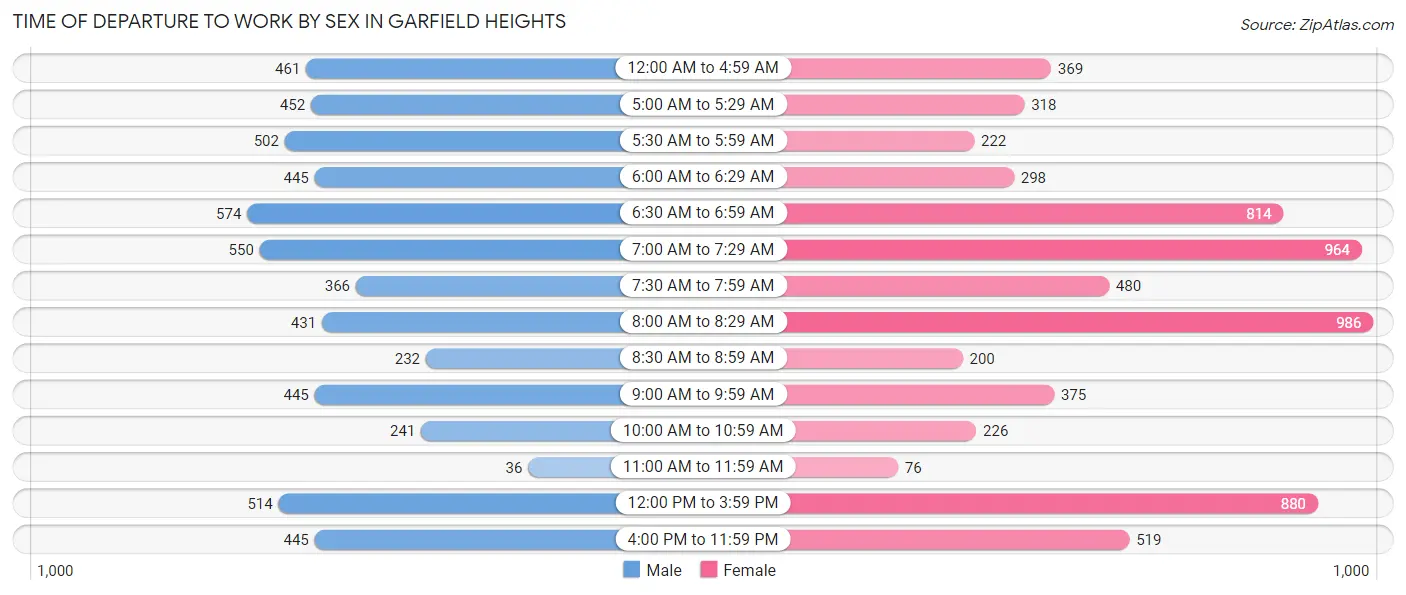
| Time of Departure | Male | Female |
| 12:00 AM to 4:59 AM | 461 (8.1%) | 369 (5.5%) |
| 5:00 AM to 5:29 AM | 452 (7.9%) | 318 (4.7%) |
| 5:30 AM to 5:59 AM | 502 (8.8%) | 222 (3.3%) |
| 6:00 AM to 6:29 AM | 445 (7.8%) | 298 (4.4%) |
| 6:30 AM to 6:59 AM | 574 (10.1%) | 814 (12.1%) |
| 7:00 AM to 7:29 AM | 550 (9.7%) | 964 (14.3%) |
| 7:30 AM to 7:59 AM | 366 (6.4%) | 480 (7.1%) |
| 8:00 AM to 8:29 AM | 431 (7.6%) | 986 (14.7%) |
| 8:30 AM to 8:59 AM | 232 (4.1%) | 200 (3.0%) |
| 9:00 AM to 9:59 AM | 445 (7.8%) | 375 (5.6%) |
| 10:00 AM to 10:59 AM | 241 (4.2%) | 226 (3.4%) |
| 11:00 AM to 11:59 AM | 36 (0.6%) | 76 (1.1%) |
| 12:00 PM to 3:59 PM | 514 (9.0%) | 880 (13.1%) |
| 4:00 PM to 11:59 PM | 445 (7.8%) | 519 (7.7%) |
| Total | 5,694 (100.0%) | 6,727 (100.0%) |
Housing Occupancy in Garfield Heights
Occupancy by Ownership in Garfield Heights
Of the total 11,974 dwellings in Garfield Heights, owner-occupied units account for 6,845 (57.2%), while renter-occupied units make up 5,129 (42.8%).
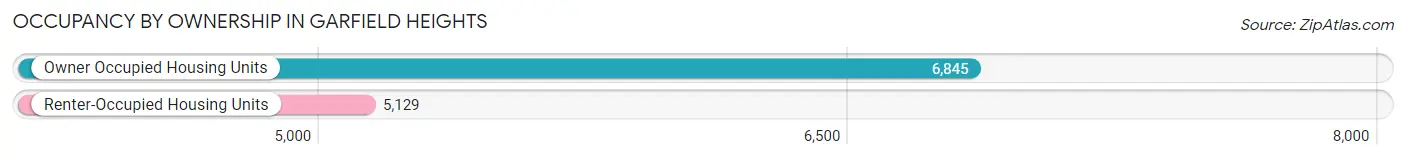
| Occupancy | # Housing Units | % Housing Units |
| Owner Occupied Housing Units | 6,845 | 57.2% |
| Renter-Occupied Housing Units | 5,129 | 42.8% |
| Total Occupied Housing Units | 11,974 | 100.0% |
Occupancy by Household Size in Garfield Heights
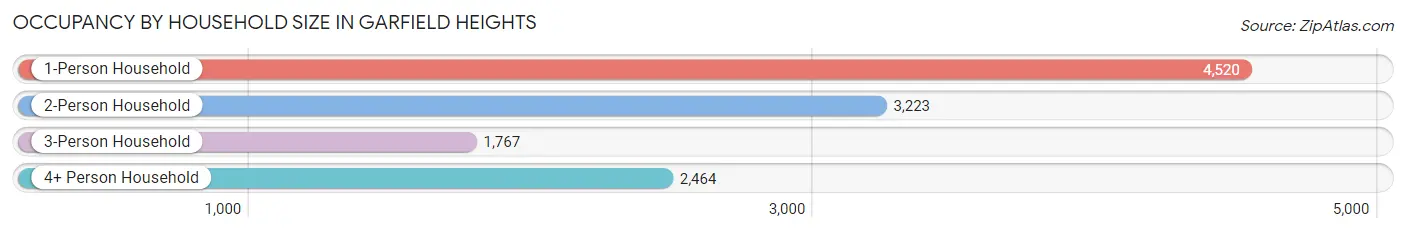
| Household Size | # Housing Units | % Housing Units |
| 1-Person Household | 4,520 | 37.8% |
| 2-Person Household | 3,223 | 26.9% |
| 3-Person Household | 1,767 | 14.8% |
| 4+ Person Household | 2,464 | 20.6% |
| Total Housing Units | 11,974 | 100.0% |
Occupancy by Ownership by Household Size in Garfield Heights
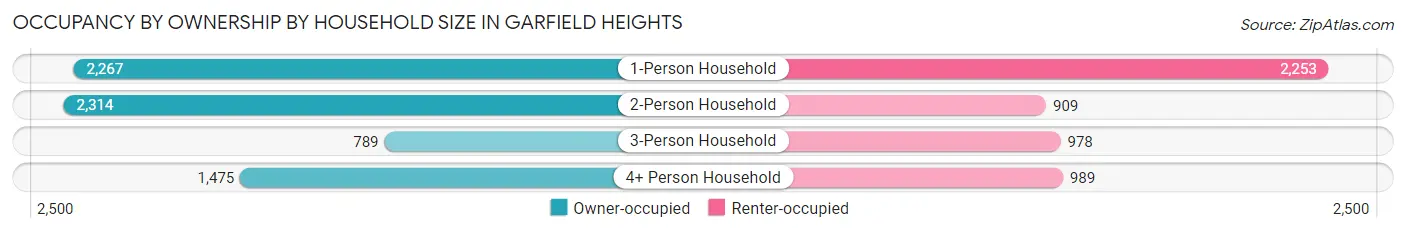
| Household Size | Owner-occupied | Renter-occupied |
| 1-Person Household | 2,267 (50.1%) | 2,253 (49.8%) |
| 2-Person Household | 2,314 (71.8%) | 909 (28.2%) |
| 3-Person Household | 789 (44.7%) | 978 (55.3%) |
| 4+ Person Household | 1,475 (59.9%) | 989 (40.1%) |
| Total Housing Units | 6,845 (57.2%) | 5,129 (42.8%) |
Occupancy by Educational Attainment in Garfield Heights
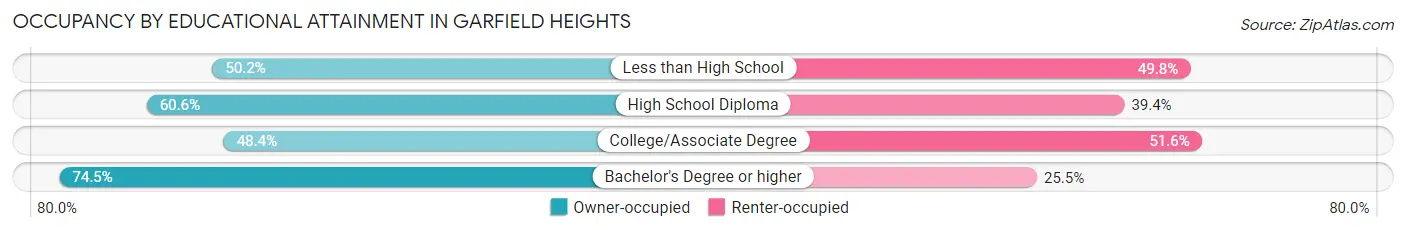
| Household Size | Owner-occupied | Renter-occupied |
| Less than High School | 479 (50.2%) | 475 (49.8%) |
| High School Diploma | 2,486 (60.6%) | 1,615 (39.4%) |
| College/Associate Degree | 2,365 (48.4%) | 2,520 (51.6%) |
| Bachelor's Degree or higher | 1,515 (74.5%) | 519 (25.5%) |
Occupancy by Age of Householder in Garfield Heights
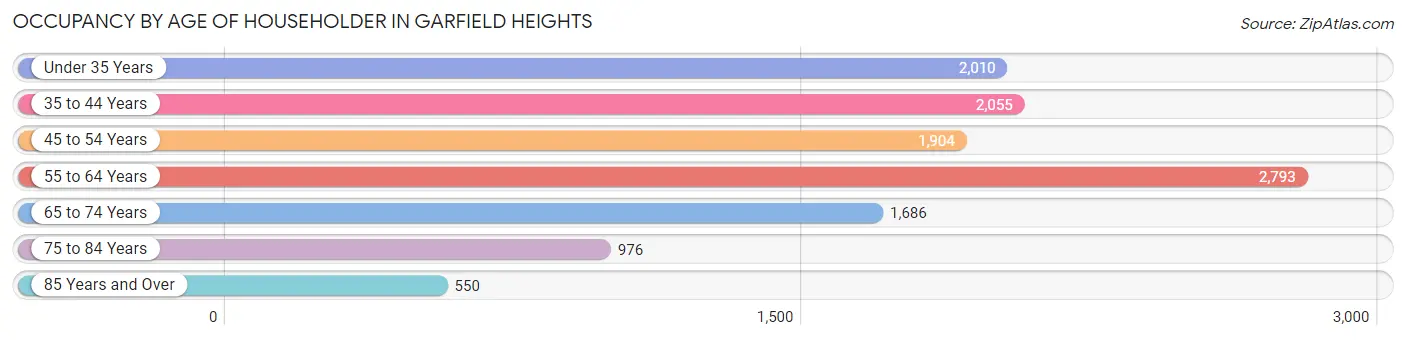
| Age Bracket | # Households | % Households |
| Under 35 Years | 2,010 | 16.8% |
| 35 to 44 Years | 2,055 | 17.2% |
| 45 to 54 Years | 1,904 | 15.9% |
| 55 to 64 Years | 2,793 | 23.3% |
| 65 to 74 Years | 1,686 | 14.1% |
| 75 to 84 Years | 976 | 8.2% |
| 85 Years and Over | 550 | 4.6% |
| Total | 11,974 | 100.0% |
Housing Finances in Garfield Heights
Median Income by Occupancy in Garfield Heights
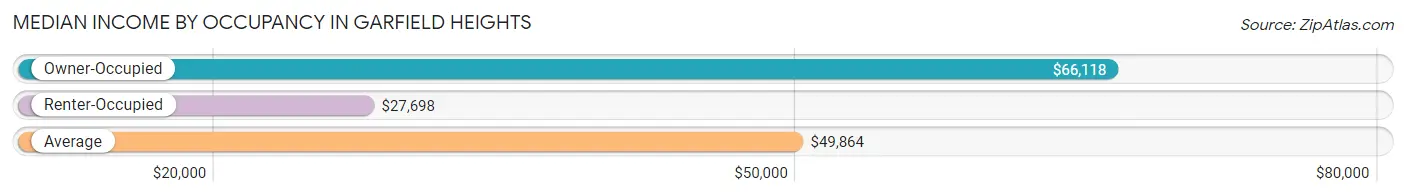
| Occupancy Type | # Households | Median Income |
| Owner-Occupied | 6,845 (57.2%) | $66,118 |
| Renter-Occupied | 5,129 (42.8%) | $27,698 |
| Average | 11,974 (100.0%) | $49,864 |
Occupancy by Householder Income Bracket in Garfield Heights
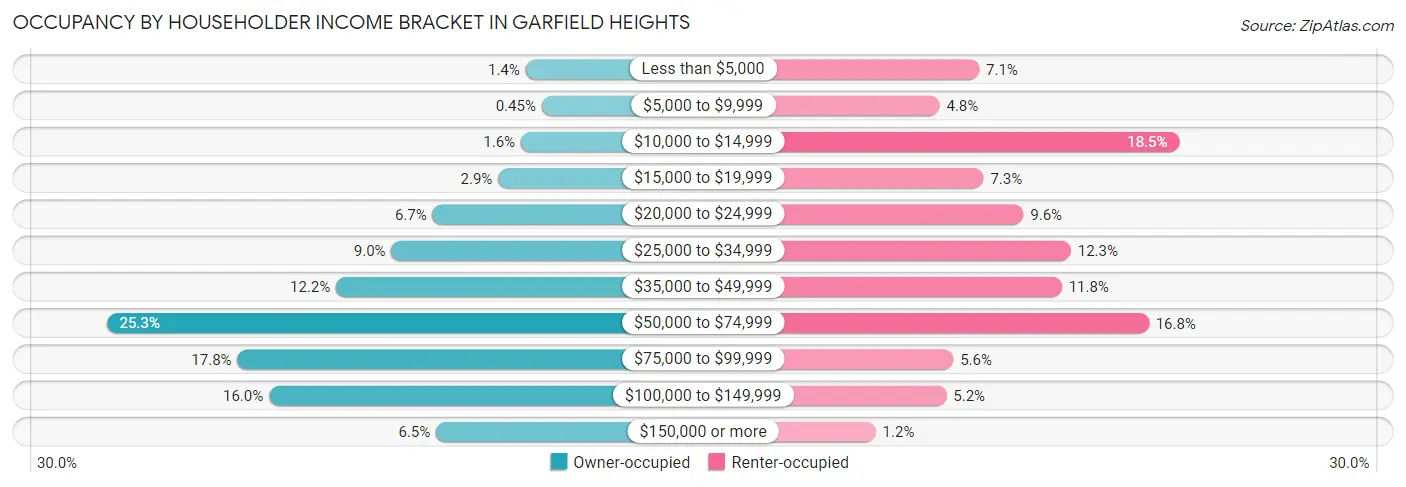
| Income Bracket | Owner-occupied | Renter-occupied |
| Less than $5,000 | 94 (1.4%) | 362 (7.1%) |
| $5,000 to $9,999 | 31 (0.4%) | 246 (4.8%) |
| $10,000 to $14,999 | 112 (1.6%) | 949 (18.5%) |
| $15,000 to $19,999 | 201 (2.9%) | 375 (7.3%) |
| $20,000 to $24,999 | 458 (6.7%) | 492 (9.6%) |
| $25,000 to $34,999 | 619 (9.0%) | 631 (12.3%) |
| $35,000 to $49,999 | 835 (12.2%) | 604 (11.8%) |
| $50,000 to $74,999 | 1,733 (25.3%) | 859 (16.8%) |
| $75,000 to $99,999 | 1,221 (17.8%) | 286 (5.6%) |
| $100,000 to $149,999 | 1,097 (16.0%) | 266 (5.2%) |
| $150,000 or more | 444 (6.5%) | 59 (1.1%) |
| Total | 6,845 (100.0%) | 5,129 (100.0%) |
Monthly Housing Cost Tiers in Garfield Heights
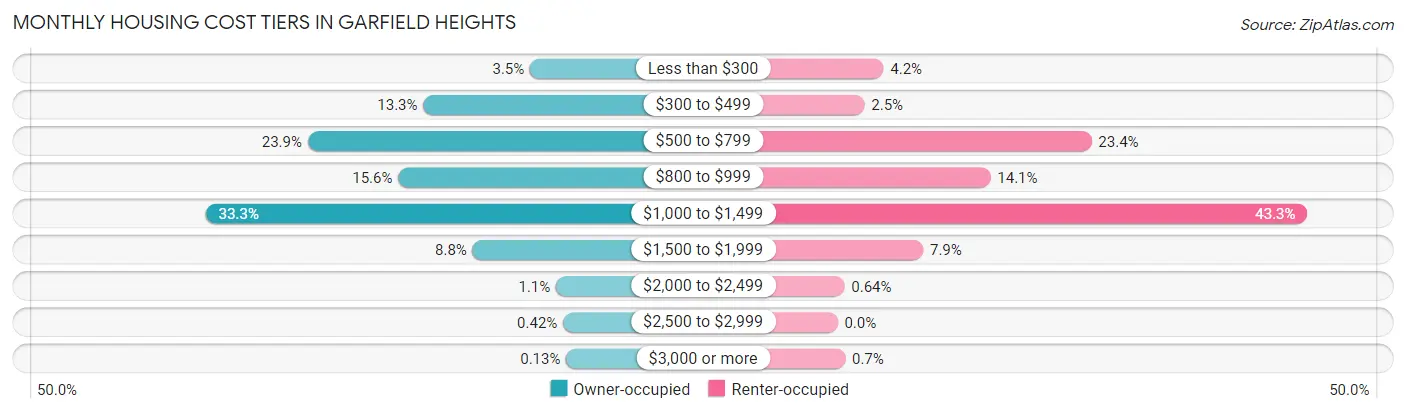
| Monthly Cost | Owner-occupied | Renter-occupied |
| Less than $300 | 237 (3.5%) | 217 (4.2%) |
| $300 to $499 | 910 (13.3%) | 127 (2.5%) |
| $500 to $799 | 1,638 (23.9%) | 1,199 (23.4%) |
| $800 to $999 | 1,068 (15.6%) | 722 (14.1%) |
| $1,000 to $1,499 | 2,282 (33.3%) | 2,219 (43.3%) |
| $1,500 to $1,999 | 599 (8.7%) | 404 (7.9%) |
| $2,000 to $2,499 | 73 (1.1%) | 33 (0.6%) |
| $2,500 to $2,999 | 29 (0.4%) | 0 (0.0%) |
| $3,000 or more | 9 (0.1%) | 36 (0.7%) |
| Total | 6,845 (100.0%) | 5,129 (100.0%) |
Physical Housing Characteristics in Garfield Heights
Housing Structures in Garfield Heights
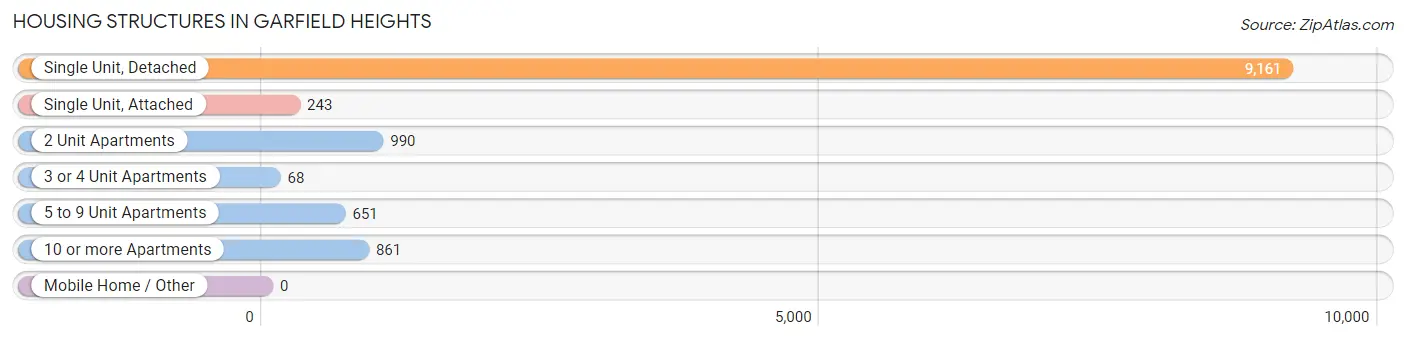
| Structure Type | # Housing Units | % Housing Units |
| Single Unit, Detached | 9,161 | 76.5% |
| Single Unit, Attached | 243 | 2.0% |
| 2 Unit Apartments | 990 | 8.3% |
| 3 or 4 Unit Apartments | 68 | 0.6% |
| 5 to 9 Unit Apartments | 651 | 5.4% |
| 10 or more Apartments | 861 | 7.2% |
| Mobile Home / Other | 0 | 0.0% |
| Total | 11,974 | 100.0% |
Housing Structures by Occupancy in Garfield Heights
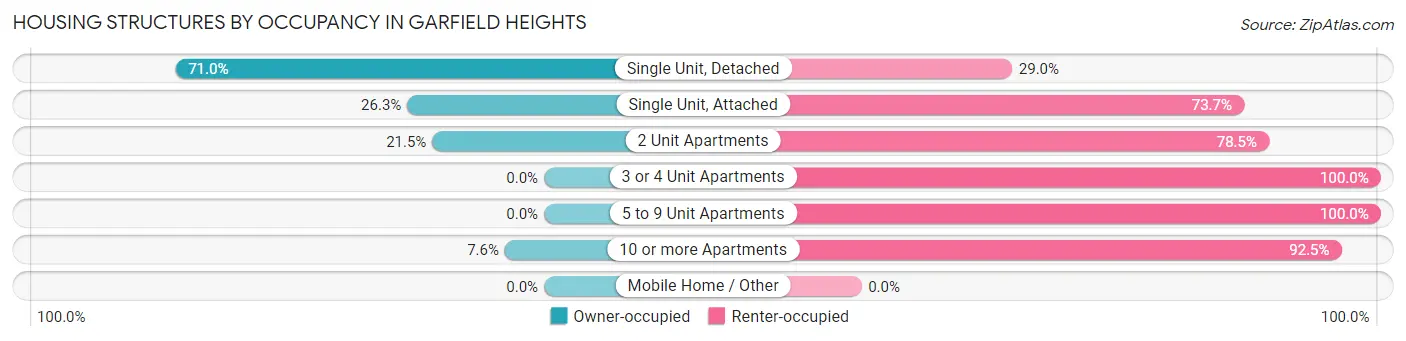
| Structure Type | Owner-occupied | Renter-occupied |
| Single Unit, Detached | 6,503 (71.0%) | 2,658 (29.0%) |
| Single Unit, Attached | 64 (26.3%) | 179 (73.7%) |
| 2 Unit Apartments | 213 (21.5%) | 777 (78.5%) |
| 3 or 4 Unit Apartments | 0 (0.0%) | 68 (100.0%) |
| 5 to 9 Unit Apartments | 0 (0.0%) | 651 (100.0%) |
| 10 or more Apartments | 65 (7.5%) | 796 (92.4%) |
| Mobile Home / Other | 0 (0.0%) | 0 (0.0%) |
| Total | 6,845 (57.2%) | 5,129 (42.8%) |
Housing Structures by Number of Rooms in Garfield Heights
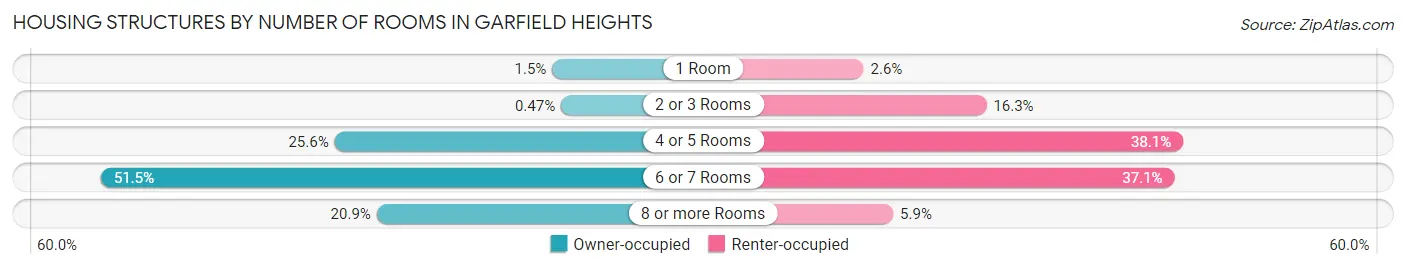
| Number of Rooms | Owner-occupied | Renter-occupied |
| 1 Room | 99 (1.5%) | 135 (2.6%) |
| 2 or 3 Rooms | 32 (0.5%) | 834 (16.3%) |
| 4 or 5 Rooms | 1,753 (25.6%) | 1,953 (38.1%) |
| 6 or 7 Rooms | 3,528 (51.5%) | 1,904 (37.1%) |
| 8 or more Rooms | 1,433 (20.9%) | 303 (5.9%) |
| Total | 6,845 (100.0%) | 5,129 (100.0%) |
Housing Structure by Heating Type in Garfield Heights
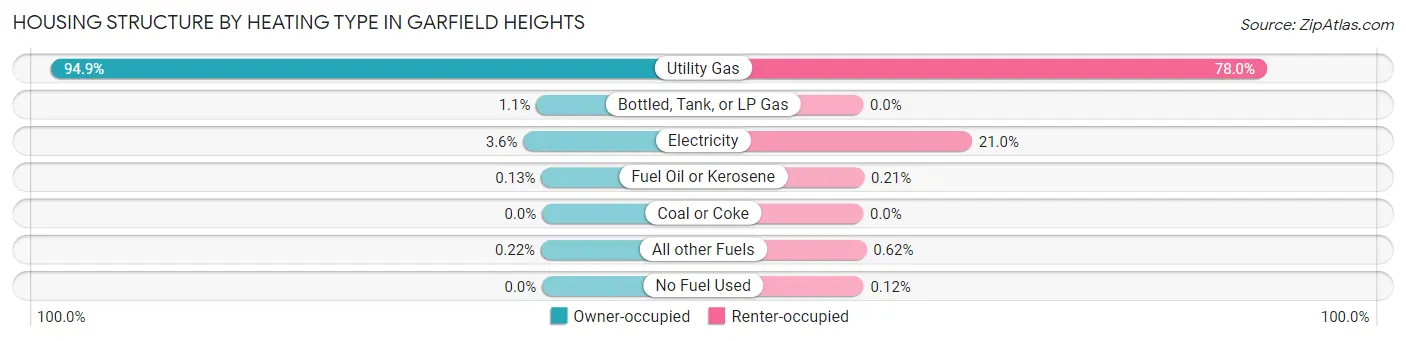
| Heating Type | Owner-occupied | Renter-occupied |
| Utility Gas | 6,496 (94.9%) | 4,002 (78.0%) |
| Bottled, Tank, or LP Gas | 77 (1.1%) | 0 (0.0%) |
| Electricity | 248 (3.6%) | 1,078 (21.0%) |
| Fuel Oil or Kerosene | 9 (0.1%) | 11 (0.2%) |
| Coal or Coke | 0 (0.0%) | 0 (0.0%) |
| All other Fuels | 15 (0.2%) | 32 (0.6%) |
| No Fuel Used | 0 (0.0%) | 6 (0.1%) |
| Total | 6,845 (100.0%) | 5,129 (100.0%) |
Household Vehicle Usage in Garfield Heights
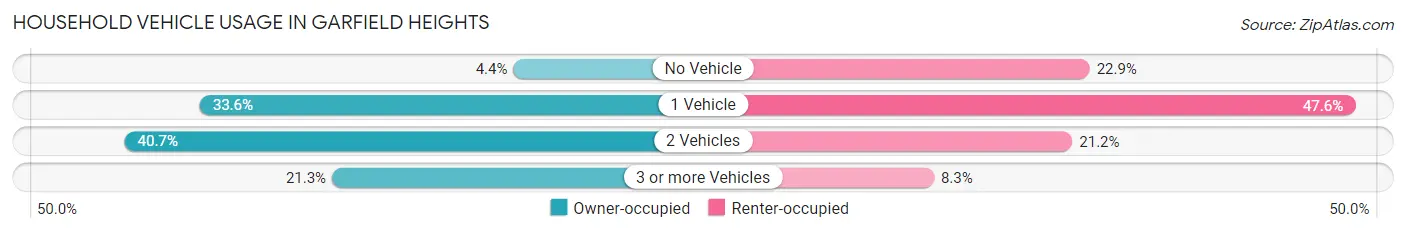
| Vehicles per Household | Owner-occupied | Renter-occupied |
| No Vehicle | 300 (4.4%) | 1,172 (22.9%) |
| 1 Vehicle | 2,303 (33.6%) | 2,442 (47.6%) |
| 2 Vehicles | 2,783 (40.7%) | 1,089 (21.2%) |
| 3 or more Vehicles | 1,459 (21.3%) | 426 (8.3%) |
| Total | 6,845 (100.0%) | 5,129 (100.0%) |
Real Estate & Mortgages in Garfield Heights
Real Estate and Mortgage Overview in Garfield Heights
| Characteristic | Without Mortgage | With Mortgage |
| Housing Units | 2,743 | 4,102 |
| Median Property Value | $90,200 | $95,400 |
| Median Household Income | $54,897 | $346 |
| Monthly Housing Costs | $550 | $0 |
| Real Estate Taxes | $2,842 | $61 |
Property Value by Mortgage Status in Garfield Heights
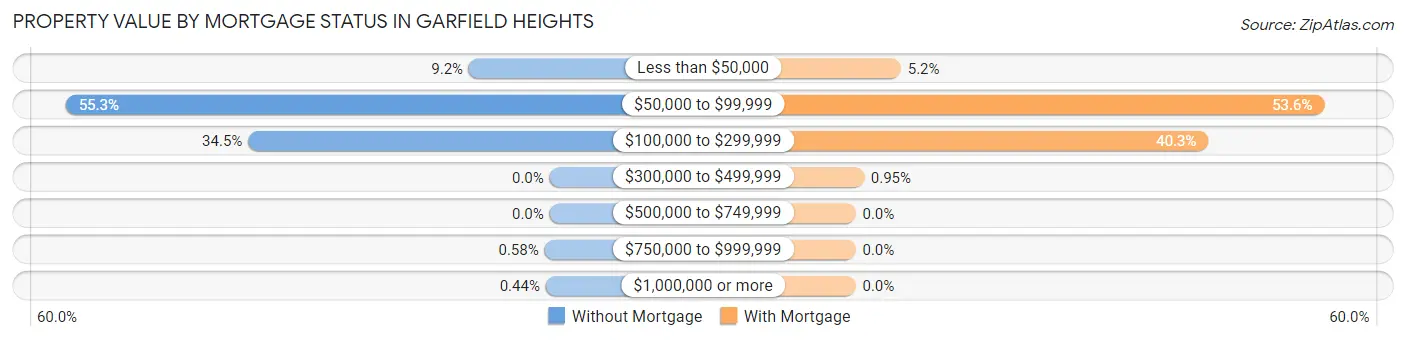
| Property Value | Without Mortgage | With Mortgage |
| Less than $50,000 | 253 (9.2%) | 212 (5.2%) |
| $50,000 to $99,999 | 1,517 (55.3%) | 2,197 (53.6%) |
| $100,000 to $299,999 | 945 (34.4%) | 1,654 (40.3%) |
| $300,000 to $499,999 | 0 (0.0%) | 39 (0.9%) |
| $500,000 to $749,999 | 0 (0.0%) | 0 (0.0%) |
| $750,000 to $999,999 | 16 (0.6%) | 0 (0.0%) |
| $1,000,000 or more | 12 (0.4%) | 0 (0.0%) |
| Total | 2,743 (100.0%) | 4,102 (100.0%) |
Household Income by Mortgage Status in Garfield Heights
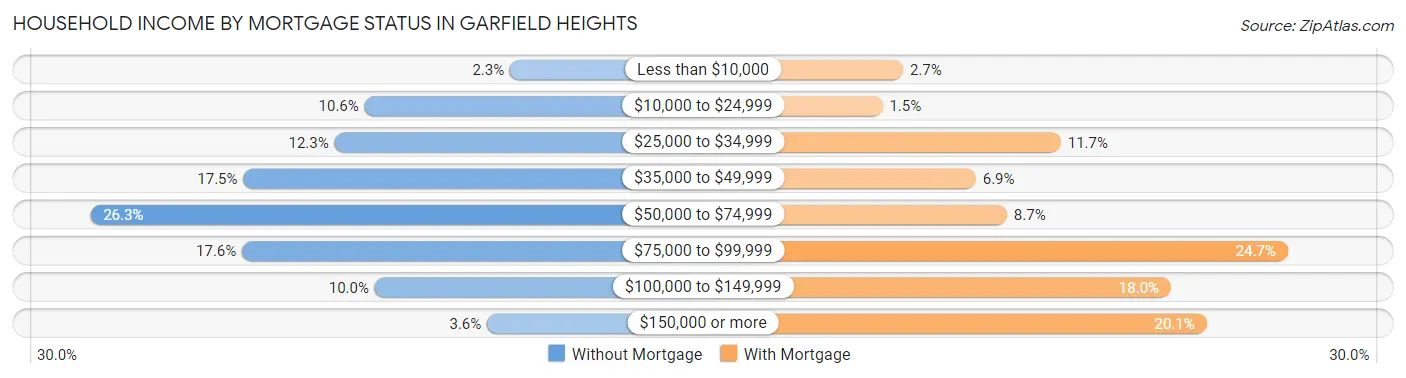
| Household Income | Without Mortgage | With Mortgage |
| Less than $10,000 | 62 (2.3%) | 111 (2.7%) |
| $10,000 to $24,999 | 290 (10.6%) | 63 (1.5%) |
| $25,000 to $34,999 | 337 (12.3%) | 481 (11.7%) |
| $35,000 to $49,999 | 480 (17.5%) | 282 (6.9%) |
| $50,000 to $74,999 | 720 (26.3%) | 355 (8.6%) |
| $75,000 to $99,999 | 482 (17.6%) | 1,013 (24.7%) |
| $100,000 to $149,999 | 274 (10.0%) | 739 (18.0%) |
| $150,000 or more | 98 (3.6%) | 823 (20.1%) |
| Total | 2,743 (100.0%) | 4,102 (100.0%) |
Property Value to Household Income Ratio in Garfield Heights
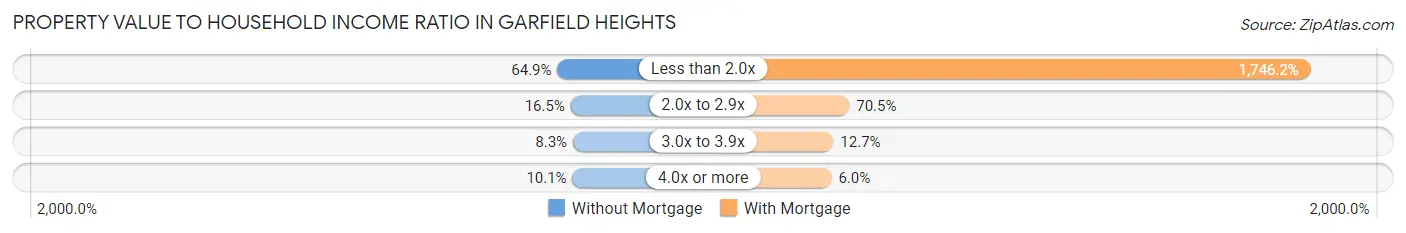
| Value-to-Income Ratio | Without Mortgage | With Mortgage |
| Less than 2.0x | 1,779 (64.9%) | 71,627 (1,746.2%) |
| 2.0x to 2.9x | 453 (16.5%) | 2,891 (70.5%) |
| 3.0x to 3.9x | 228 (8.3%) | 519 (12.7%) |
| 4.0x or more | 276 (10.1%) | 244 (5.9%) |
| Total | 2,743 (100.0%) | 4,102 (100.0%) |
Real Estate Taxes by Mortgage Status in Garfield Heights
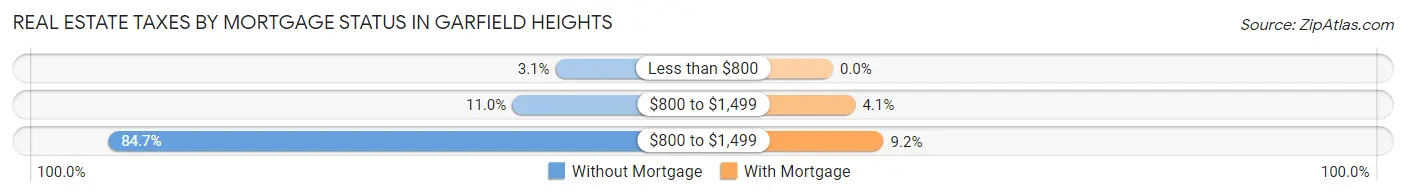
| Property Taxes | Without Mortgage | With Mortgage |
| Less than $800 | 84 (3.1%) | 0 (0.0%) |
| $800 to $1,499 | 301 (11.0%) | 168 (4.1%) |
| $800 to $1,499 | 2,324 (84.7%) | 379 (9.2%) |
| Total | 2,743 (100.0%) | 4,102 (100.0%) |
Health & Disability in Garfield Heights
Health Insurance Coverage by Age in Garfield Heights
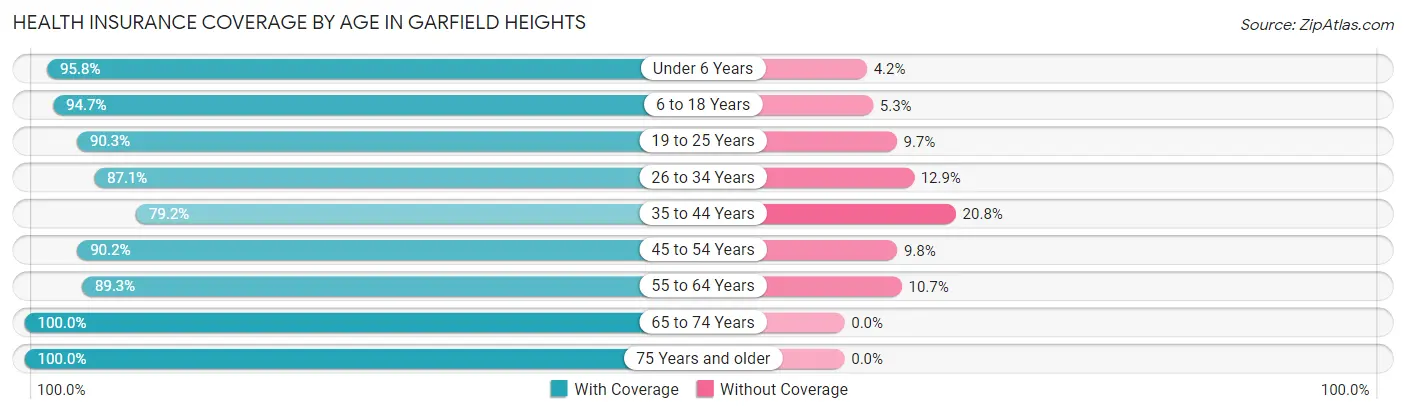
| Age Bracket | With Coverage | Without Coverage |
| Under 6 Years | 2,248 (95.8%) | 98 (4.2%) |
| 6 to 18 Years | 4,781 (94.7%) | 269 (5.3%) |
| 19 to 25 Years | 2,586 (90.3%) | 279 (9.7%) |
| 26 to 34 Years | 2,643 (87.1%) | 393 (12.9%) |
| 35 to 44 Years | 2,907 (79.2%) | 762 (20.8%) |
| 45 to 54 Years | 2,855 (90.2%) | 311 (9.8%) |
| 55 to 64 Years | 4,189 (89.3%) | 501 (10.7%) |
| 65 to 74 Years | 2,568 (100.0%) | 0 (0.0%) |
| 75 Years and older | 1,777 (100.0%) | 0 (0.0%) |
| Total | 26,554 (91.0%) | 2,613 (9.0%) |
Health Insurance Coverage by Citizenship Status in Garfield Heights
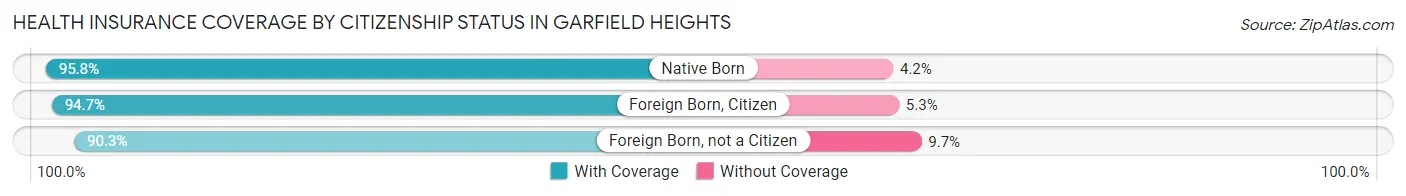
| Citizenship Status | With Coverage | Without Coverage |
| Native Born | 2,248 (95.8%) | 98 (4.2%) |
| Foreign Born, Citizen | 4,781 (94.7%) | 269 (5.3%) |
| Foreign Born, not a Citizen | 2,586 (90.3%) | 279 (9.7%) |
Health Insurance Coverage by Household Income in Garfield Heights
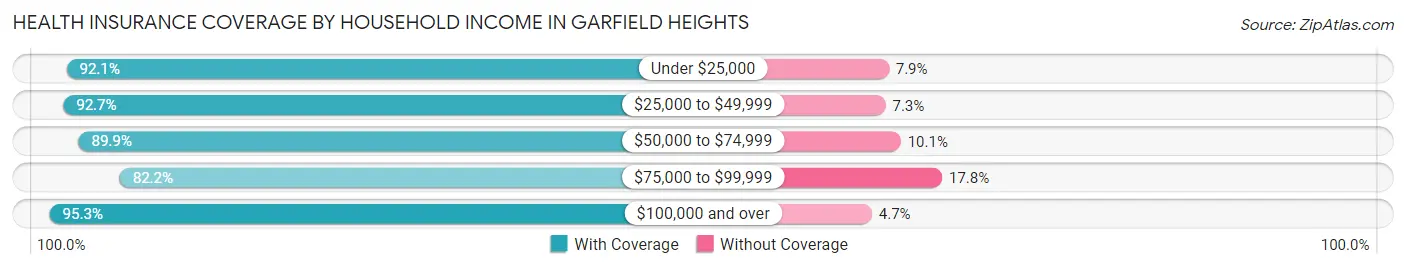
| Household Income | With Coverage | Without Coverage |
| Under $25,000 | 5,469 (92.1%) | 467 (7.9%) |
| $25,000 to $49,999 | 5,530 (92.7%) | 433 (7.3%) |
| $50,000 to $74,999 | 5,537 (89.9%) | 623 (10.1%) |
| $75,000 to $99,999 | 3,574 (82.2%) | 776 (17.8%) |
| $100,000 and over | 6,327 (95.3%) | 312 (4.7%) |
Public vs Private Health Insurance Coverage by Age in Garfield Heights
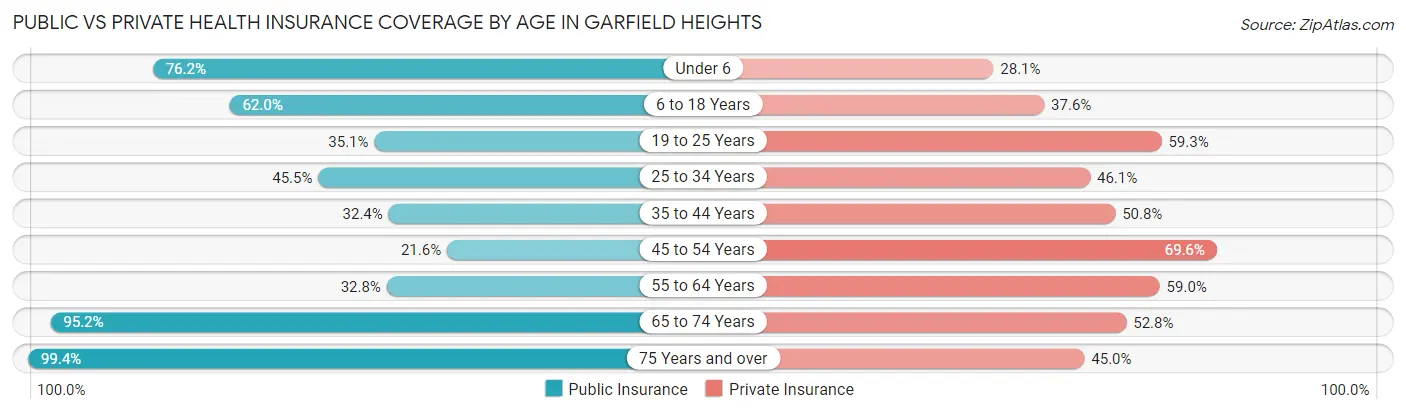
| Age Bracket | Public Insurance | Private Insurance |
| Under 6 | 1,788 (76.2%) | 660 (28.1%) |
| 6 to 18 Years | 3,129 (62.0%) | 1,897 (37.6%) |
| 19 to 25 Years | 1,005 (35.1%) | 1,700 (59.3%) |
| 25 to 34 Years | 1,381 (45.5%) | 1,399 (46.1%) |
| 35 to 44 Years | 1,190 (32.4%) | 1,862 (50.7%) |
| 45 to 54 Years | 684 (21.6%) | 2,204 (69.6%) |
| 55 to 64 Years | 1,538 (32.8%) | 2,767 (59.0%) |
| 65 to 74 Years | 2,445 (95.2%) | 1,356 (52.8%) |
| 75 Years and over | 1,766 (99.4%) | 800 (45.0%) |
| Total | 14,926 (51.2%) | 14,645 (50.2%) |
Disability Status by Sex by Age in Garfield Heights
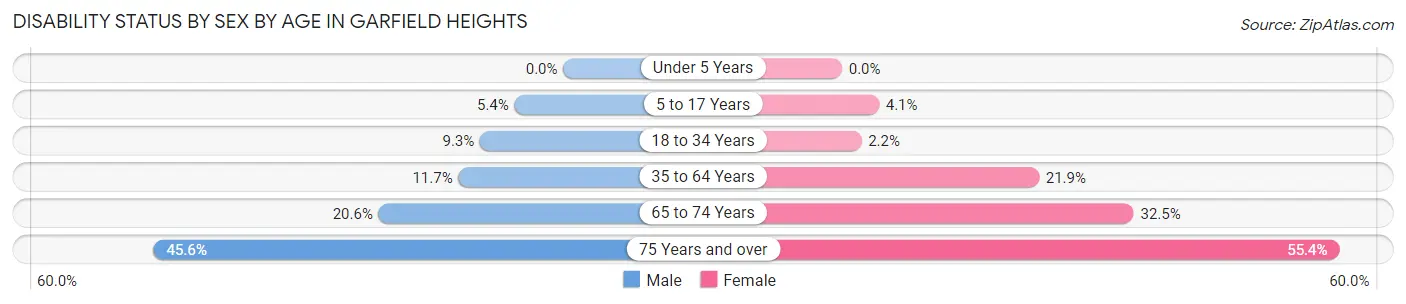
| Age Bracket | Male | Female |
| Under 5 Years | 0 (0.0%) | 0 (0.0%) |
| 5 to 17 Years | 139 (5.4%) | 103 (4.1%) |
| 18 to 34 Years | 264 (9.3%) | 72 (2.2%) |
| 35 to 64 Years | 602 (11.7%) | 1,398 (21.9%) |
| 65 to 74 Years | 235 (20.6%) | 463 (32.5%) |
| 75 Years and over | 241 (45.6%) | 692 (55.4%) |
Disability Class by Sex by Age in Garfield Heights
Disability Class: Hearing Difficulty
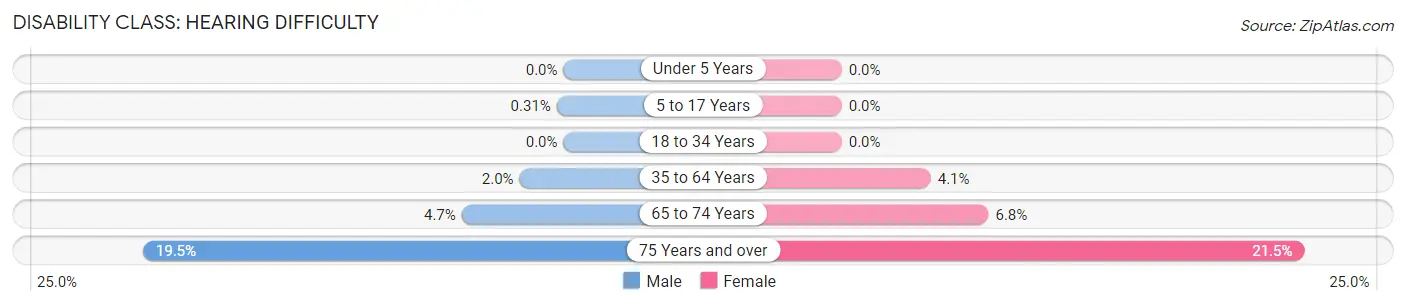
| Age Bracket | Male | Female |
| Under 5 Years | 0 (0.0%) | 0 (0.0%) |
| 5 to 17 Years | 8 (0.3%) | 0 (0.0%) |
| 18 to 34 Years | 0 (0.0%) | 0 (0.0%) |
| 35 to 64 Years | 105 (2.0%) | 263 (4.1%) |
| 65 to 74 Years | 54 (4.7%) | 97 (6.8%) |
| 75 Years and over | 103 (19.5%) | 268 (21.5%) |
Disability Class: Vision Difficulty
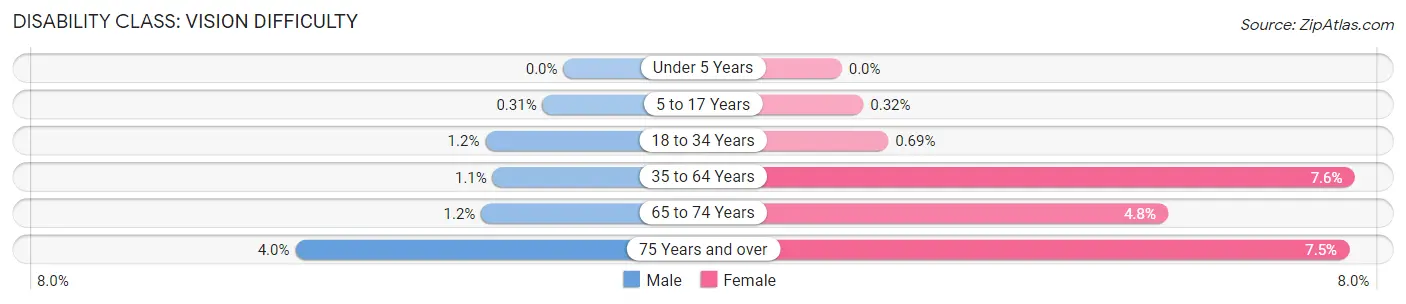
| Age Bracket | Male | Female |
| Under 5 Years | 0 (0.0%) | 0 (0.0%) |
| 5 to 17 Years | 8 (0.3%) | 8 (0.3%) |
| 18 to 34 Years | 33 (1.2%) | 23 (0.7%) |
| 35 to 64 Years | 54 (1.1%) | 485 (7.6%) |
| 65 to 74 Years | 14 (1.2%) | 69 (4.8%) |
| 75 Years and over | 21 (4.0%) | 94 (7.5%) |
Disability Class: Cognitive Difficulty
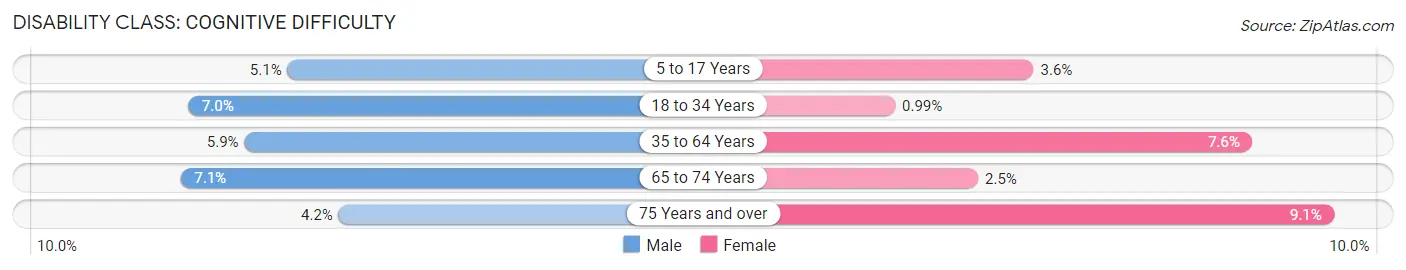
| Age Bracket | Male | Female |
| 5 to 17 Years | 131 (5.1%) | 89 (3.6%) |
| 18 to 34 Years | 198 (7.0%) | 33 (1.0%) |
| 35 to 64 Years | 305 (5.9%) | 485 (7.6%) |
| 65 to 74 Years | 81 (7.1%) | 36 (2.5%) |
| 75 Years and over | 22 (4.2%) | 114 (9.1%) |
Disability Class: Ambulatory Difficulty
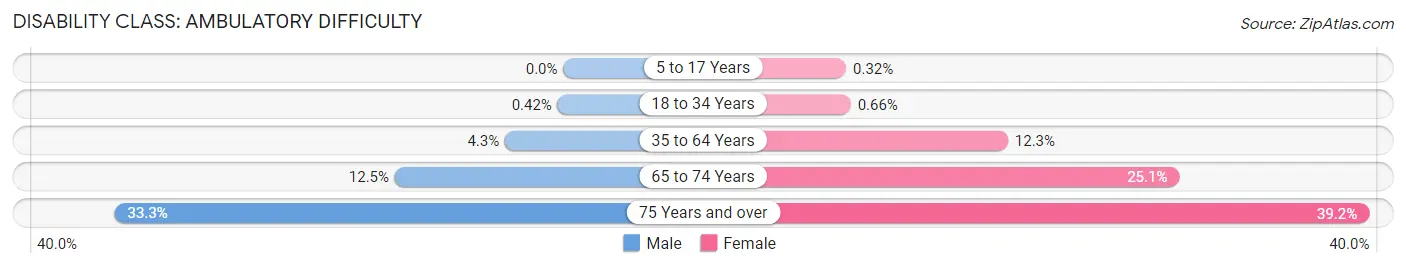
| Age Bracket | Male | Female |
| 5 to 17 Years | 0 (0.0%) | 8 (0.3%) |
| 18 to 34 Years | 12 (0.4%) | 22 (0.7%) |
| 35 to 64 Years | 223 (4.3%) | 786 (12.3%) |
| 65 to 74 Years | 143 (12.5%) | 357 (25.1%) |
| 75 Years and over | 176 (33.3%) | 489 (39.2%) |
Disability Class: Self-Care Difficulty
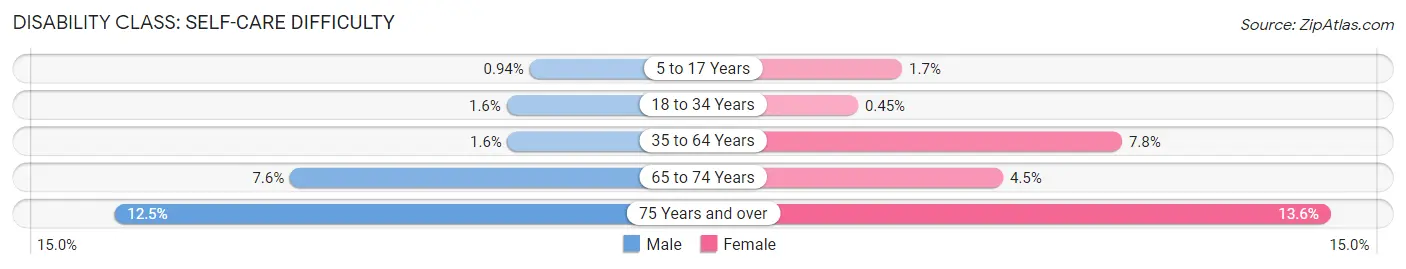
| Age Bracket | Male | Female |
| 5 to 17 Years | 24 (0.9%) | 42 (1.7%) |
| 18 to 34 Years | 45 (1.6%) | 15 (0.4%) |
| 35 to 64 Years | 80 (1.5%) | 497 (7.8%) |
| 65 to 74 Years | 87 (7.6%) | 64 (4.5%) |
| 75 Years and over | 66 (12.5%) | 170 (13.6%) |
Technology Access in Garfield Heights
Computing Device Access in Garfield Heights
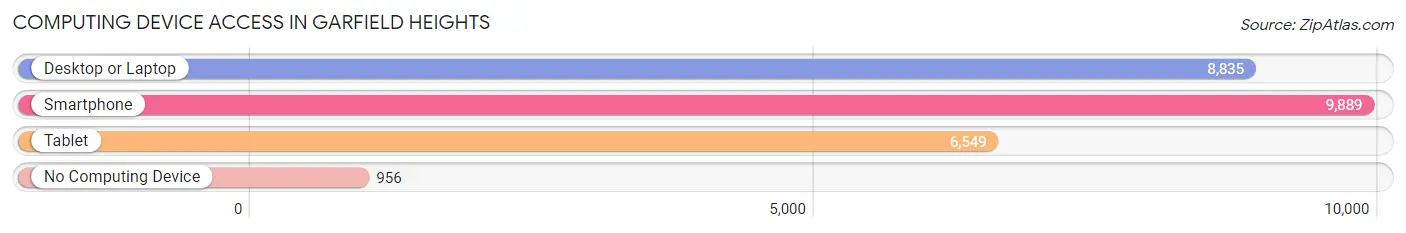
| Device Type | # Households | % Households |
| Desktop or Laptop | 8,835 | 73.8% |
| Smartphone | 9,889 | 82.6% |
| Tablet | 6,549 | 54.7% |
| No Computing Device | 956 | 8.0% |
| Total | 11,974 | 100.0% |
Internet Access in Garfield Heights
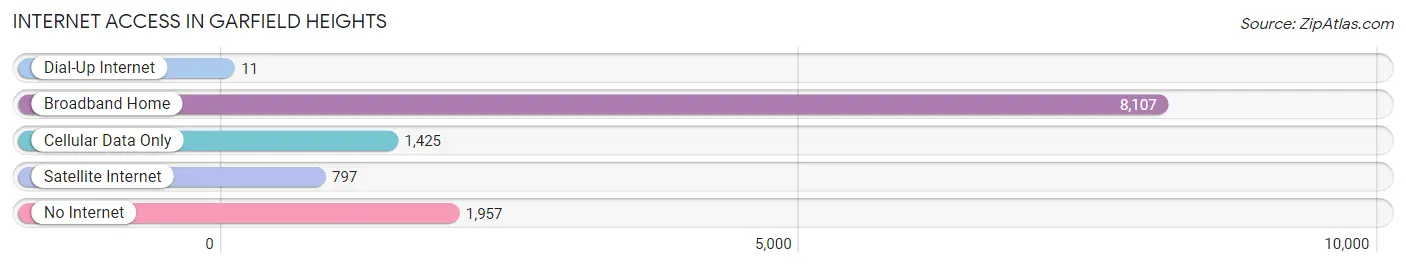
| Internet Type | # Households | % Households |
| Dial-Up Internet | 11 | 0.1% |
| Broadband Home | 8,107 | 67.7% |
| Cellular Data Only | 1,425 | 11.9% |
| Satellite Internet | 797 | 6.7% |
| No Internet | 1,957 | 16.3% |
| Total | 11,974 | 100.0% |
Garfield Heights Summary
Garfield Heights is a city located in Cuyahoga County, Ohio, United States. It is a suburb of Cleveland and is located approximately 8 miles southeast of the city. As of the 2010 census, the city had a population of 28,849.
History
Garfield Heights was first settled in 1815 by a group of settlers from Connecticut. The area was originally known as Garfield Township, named after President James Garfield. The township was incorporated in 1921 and was later renamed Garfield Heights in 1925.
The city experienced rapid growth in the 1950s and 1960s, as many people moved to the area from Cleveland. The population peaked in 1970 at over 33,000. Since then, the population has declined slightly, but the city remains a popular destination for those looking for a suburban lifestyle.
Geography
Garfield Heights is located at 41°24'17" North, 81°35'45" West (41.404722, -81.595833). According to the United States Census Bureau, the city has a total area of 8.2 square miles, of which 8.1 square miles is land and 0.1 square miles is water.
The city is located in the Western Reserve region of Ohio, and is part of the Greater Cleveland area. It is bordered by Cleveland to the north, Maple Heights to the east, Bedford Heights to the south, and Brooklyn Heights to the west.
Economy
Garfield Heights is home to a variety of businesses, including manufacturing, retail, and service industries. The city is also home to several large employers, including the Cleveland Clinic, University Hospitals, and the Cleveland Metroparks.
The city's largest employer is the Cleveland Clinic, which employs over 5,000 people in Garfield Heights. Other major employers include University Hospitals, the Cleveland Metroparks, and the City of Garfield Heights.
Demographics
As of the 2010 census, there were 28,849 people, 11,845 households, and 7,845 families residing in the city. The population density was 3,567.2 people per square mile. The racial makeup of the city was 79.2% White, 14.3% African American, 0.3% Native American, 1.7% Asian, 0.1% Pacific Islander, 1.3% from other races, and 3.3% from two or more races. Hispanic or Latino of any race were 4.2% of the population.
The median income for a household in the city was $41,945, and the median income for a family was $51,945. Males had a median income of $37,945 versus $30,945 for females. The per capita income for the city was $20,945. About 8.2% of families and 10.3% of the population were below the poverty line, including 14.3% of those under age 18 and 8.2% of those age 65 or over.
Garfield Heights is a diverse city, with a variety of cultures and backgrounds represented. The city is home to a large number of immigrants, with the largest groups coming from Mexico, India, and the Philippines. The city also has a large African American population, making up 14.3% of the population.
Common Questions
What is Per Capita Income in Garfield Heights?
Per Capita income in Garfield Heights is $25,828.
What is the Median Family Income in Garfield Heights?
Median Family Income in Garfield Heights is $62,199.
What is the Median Household income in Garfield Heights?
Median Household Income in Garfield Heights is $49,864.
What is Income or Wage Gap in Garfield Heights?
Income or Wage Gap in Garfield Heights is 29.3%.
Women in Garfield Heights earn 70.7 cents for every dollar earned by a man.
What is Inequality or Gini Index in Garfield Heights?
Inequality or Gini Index in Garfield Heights is 0.44.
What is the Total Population of Garfield Heights?
Total Population of Garfield Heights is 29,497.
What is the Total Male Population of Garfield Heights?
Total Male Population of Garfield Heights is 13,458.
What is the Total Female Population of Garfield Heights?
Total Female Population of Garfield Heights is 16,039.
What is the Ratio of Males per 100 Females in Garfield Heights?
There are 83.91 Males per 100 Females in Garfield Heights.
What is the Ratio of Females per 100 Males in Garfield Heights?
There are 119.18 Females per 100 Males in Garfield Heights.
What is the Median Population Age in Garfield Heights?
Median Population Age in Garfield Heights is 39.4 Years.
What is the Average Family Size in Garfield Heights
Average Family Size in Garfield Heights is 3.2 People.
What is the Average Household Size in Garfield Heights
Average Household Size in Garfield Heights is 2.4 People.
How Large is the Labor Force in Garfield Heights?
There are 14,874 People in the Labor Forcein in Garfield Heights.
What is the Percentage of People in the Labor Force in Garfield Heights?
63.9% of People are in the Labor Force in Garfield Heights.
What is the Unemployment Rate in Garfield Heights?
Unemployment Rate in Garfield Heights is 9.8%.