Zip Codes with the Highest Percentage of Black / African American Population in Youngstown, OH
RELATED REPORTS & OPTIONS
Black / African American
Youngstown
Compare Zip Codes
Map of Zip Codes with the Highest Percentage of Black / African American Population in Youngstown
1.3%
81.8%
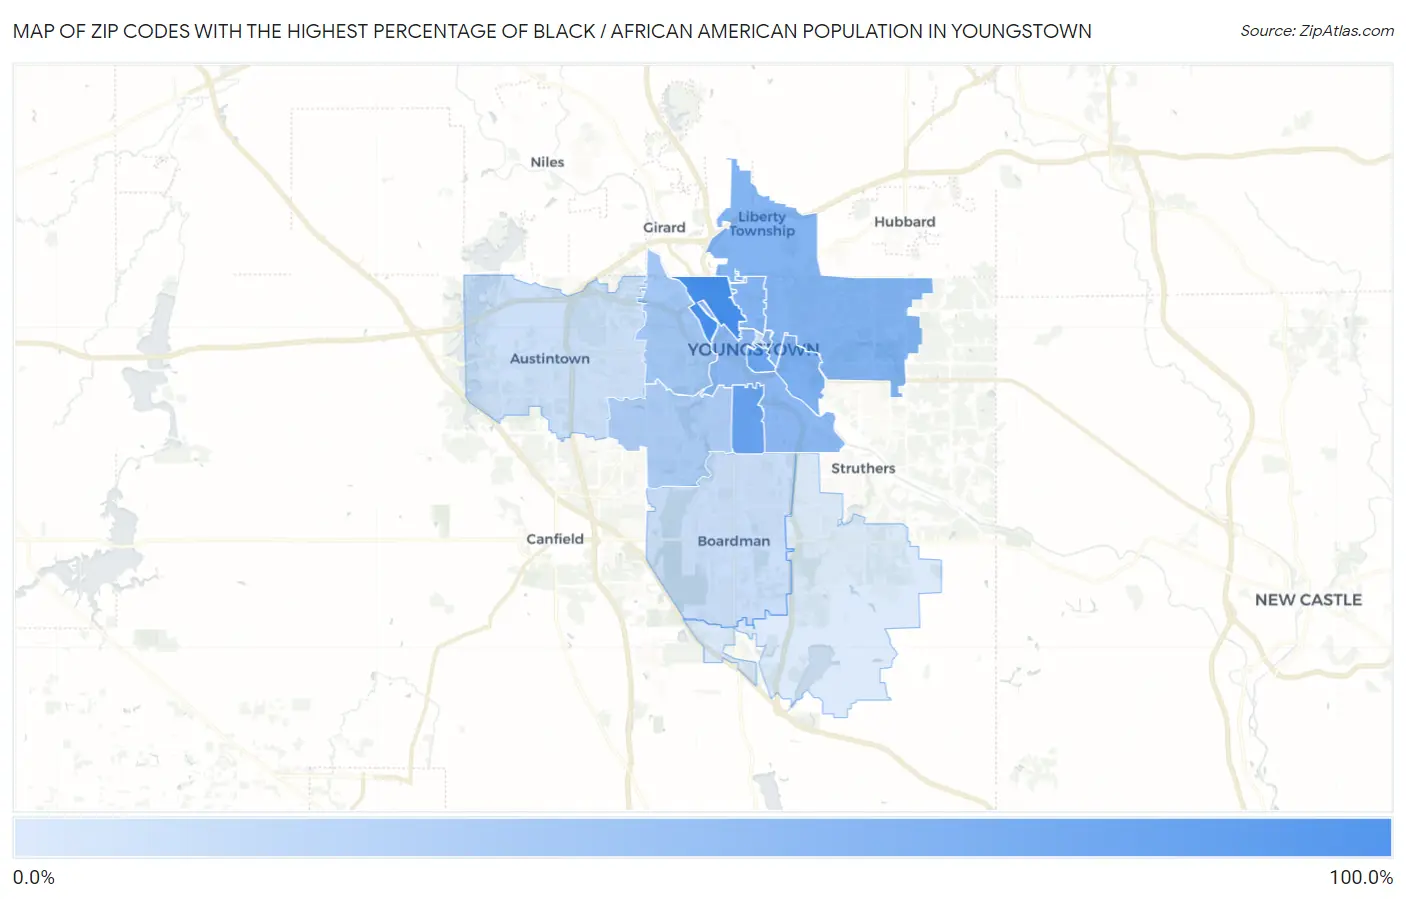
Zip Codes with the Highest Percentage of Black / African American Population in Youngstown, OH
| Zip Code | Black / African American | vs State | vs National | |
| 1. | 44510 | 81.8% | 12.3% (+69.5)#5 | 12.5% (+69.4)#278 |
| 2. | 44507 | 60.0% | 12.3% (+47.7)#35 | 12.5% (+47.5)#871 |
| 3. | 44503 | 57.8% | 12.3% (+45.5)#41 | 12.5% (+45.3)#943 |
| 4. | 44506 | 46.6% | 12.3% (+34.3)#54 | 12.5% (+34.1)#1,422 |
| 5. | 44505 | 43.8% | 12.3% (+31.5)#61 | 12.5% (+31.3)#1,586 |
| 6. | 44504 | 42.1% | 12.3% (+29.7)#62 | 12.5% (+29.6)#1,690 |
| 7. | 44502 | 38.9% | 12.3% (+26.6)#67 | 12.5% (+26.5)#1,923 |
| 8. | 44509 | 26.7% | 12.3% (+14.3)#98 | 12.5% (+14.2)#3,013 |
| 9. | 44511 | 22.2% | 12.3% (+9.89)#115 | 12.5% (+9.73)#3,600 |
| 10. | 44555 | 9.0% | 12.3% (-3.27)#202 | 12.5% (-3.43)#7,020 |
| 11. | 44512 | 8.4% | 12.3% (-3.86)#208 | 12.5% (-4.02)#7,324 |
| 12. | 44515 | 8.1% | 12.3% (-4.23)#217 | 12.5% (-4.39)#7,500 |
| 13. | 44514 | 1.3% | 12.3% (-11.0)#482 | 12.5% (-11.1)#15,284 |
1
Common Questions
What are the Top 10 Zip Codes with the Highest Percentage of Black / African American Population in Youngstown, OH?
Top 10 Zip Codes with the Highest Percentage of Black / African American Population in Youngstown, OH are:
What zip code has the Highest Percentage of Black / African American Population in Youngstown, OH?
44510 has the Highest Percentage of Black / African American Population in Youngstown, OH with 81.8%.
What is the Percentage of Black / African American Population in Youngstown, OH?
Percentage of Black / African American Population in Youngstown is 41.8%.
What is the Percentage of Black / African American Population in Ohio?
Percentage of Black / African American Population in Ohio is 12.3%.
What is the Percentage of Black / African American Population in the United States?
Percentage of Black / African American Population in the United States is 12.5%.