Huber Ridge, OH Map & Demographics
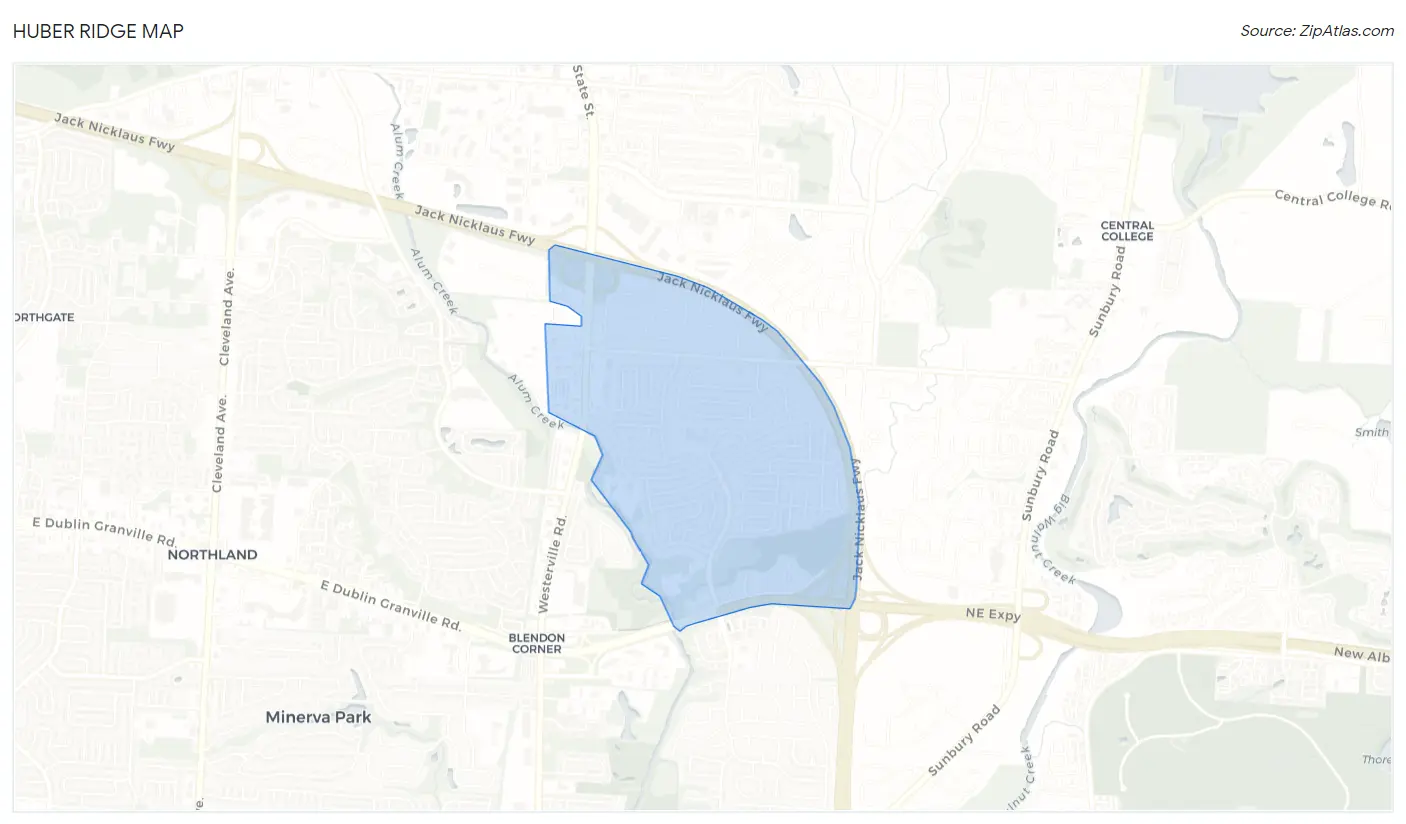
Huber Ridge Map
Huber Ridge Overview
$39,069
PER CAPITA INCOME
$107,576
AVG FAMILY INCOME
$92,188
AVG HOUSEHOLD INCOME
20.7%
WAGE / INCOME GAP [ % ]
79.3¢/ $1
WAGE / INCOME GAP [ $ ]
0.30
INEQUALITY / GINI INDEX
4,302
TOTAL POPULATION
1,932
MALE POPULATION
2,370
FEMALE POPULATION
81.52
MALES / 100 FEMALES
122.67
FEMALES / 100 MALES
34.7
MEDIAN AGE
3.1
AVG FAMILY SIZE
2.7
AVG HOUSEHOLD SIZE
2,752
LABOR FORCE [ PEOPLE ]
85.4%
PERCENT IN LABOR FORCE
2.0%
UNEMPLOYMENT RATE
Income in Huber Ridge
Income Overview in Huber Ridge
Per Capita Income in Huber Ridge is $39,069, while median incomes of families and households are $107,576 and $92,188 respectively.
| Characteristic | Number | Measure |
| Per Capita Income | 4,302 | $39,069 |
| Median Family Income | 1,100 | $107,576 |
| Mean Family Income | 1,100 | $108,271 |
| Median Household Income | 1,589 | $92,188 |
| Mean Household Income | 1,589 | $104,990 |
| Income Deficit | 1,100 | $0 |
| Wage / Income Gap (%) | 4,302 | 20.71% |
| Wage / Income Gap ($) | 4,302 | 79.29¢ per $1 |
| Gini / Inequality Index | 4,302 | 0.30 |
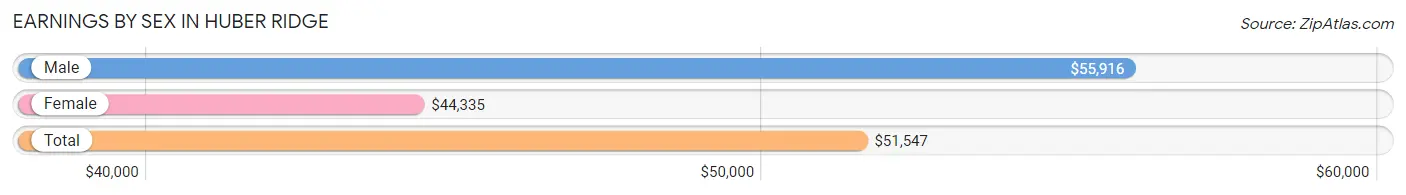
Earnings by Sex in Huber Ridge
Average Earnings in Huber Ridge are $51,547, $55,916 for men and $44,335 for women, a difference of 20.7%.
| Sex | Number | Average Earnings |
| Male | 1,346 (48.9%) | $55,916 |
| Female | 1,405 (51.1%) | $44,335 |
| Total | 2,751 (100.0%) | $51,547 |
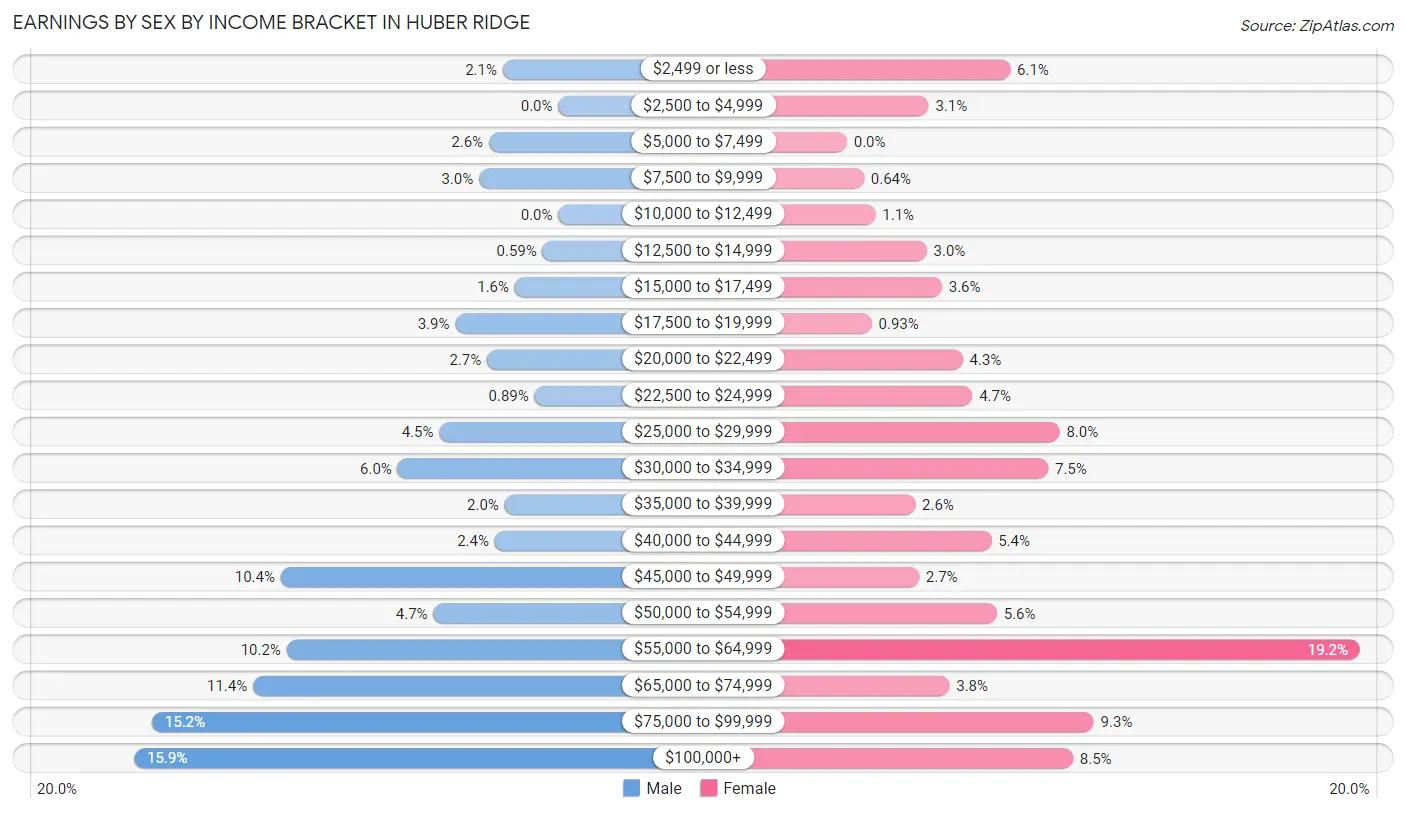
Earnings by Sex by Income Bracket in Huber Ridge
The most common earnings brackets in Huber Ridge are $100,000+ for men (214 | 15.9%) and $55,000 to $64,999 for women (270 | 19.2%).
| Income | Male | Female |
| $2,499 or less | 28 (2.1%) | 86 (6.1%) |
| $2,500 to $4,999 | 0 (0.0%) | 43 (3.1%) |
| $5,000 to $7,499 | 35 (2.6%) | 0 (0.0%) |
| $7,500 to $9,999 | 40 (3.0%) | 9 (0.6%) |
| $10,000 to $12,499 | 0 (0.0%) | 15 (1.1%) |
| $12,500 to $14,999 | 8 (0.6%) | 42 (3.0%) |
| $15,000 to $17,499 | 22 (1.6%) | 50 (3.6%) |
| $17,500 to $19,999 | 52 (3.9%) | 13 (0.9%) |
| $20,000 to $22,499 | 36 (2.7%) | 61 (4.3%) |
| $22,500 to $24,999 | 12 (0.9%) | 66 (4.7%) |
| $25,000 to $29,999 | 60 (4.5%) | 112 (8.0%) |
| $30,000 to $34,999 | 81 (6.0%) | 106 (7.5%) |
| $35,000 to $39,999 | 27 (2.0%) | 36 (2.6%) |
| $40,000 to $44,999 | 32 (2.4%) | 76 (5.4%) |
| $45,000 to $49,999 | 140 (10.4%) | 38 (2.7%) |
| $50,000 to $54,999 | 63 (4.7%) | 79 (5.6%) |
| $55,000 to $64,999 | 137 (10.2%) | 270 (19.2%) |
| $65,000 to $74,999 | 154 (11.4%) | 54 (3.8%) |
| $75,000 to $99,999 | 205 (15.2%) | 130 (9.2%) |
| $100,000+ | 214 (15.9%) | 119 (8.5%) |
| Total | 1,346 (100.0%) | 1,405 (100.0%) |
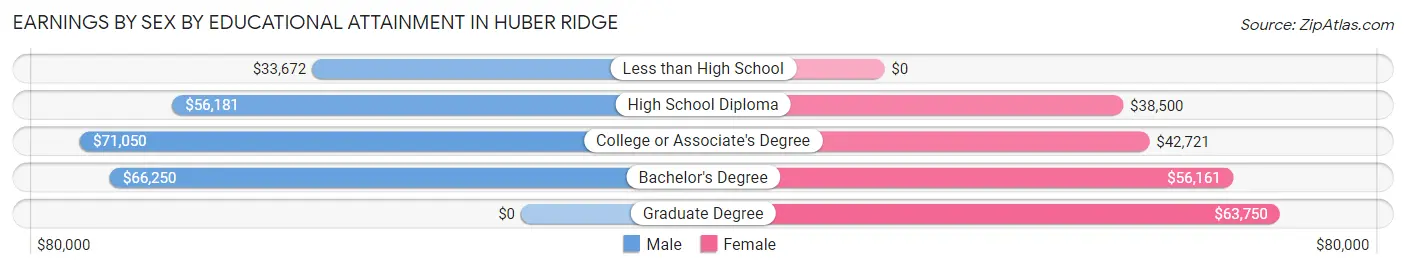
Earnings by Sex by Educational Attainment in Huber Ridge
Average earnings in Huber Ridge are $57,290 for men and $51,209 for women, a difference of 10.6%. Men with an educational attainment of college or associate's degree enjoy the highest average annual earnings of $71,050, while those with less than high school education earn the least with $33,672. Women with an educational attainment of graduate degree earn the most with the average annual earnings of $63,750, while those with high school diploma education have the smallest earnings of $38,500.
| Educational Attainment | Male Income | Female Income |
| Less than High School | $33,672 | $0 |
| High School Diploma | $56,181 | $38,500 |
| College or Associate's Degree | $71,050 | $42,721 |
| Bachelor's Degree | $66,250 | $56,161 |
| Graduate Degree | - | - |
| Total | $57,290 | $51,209 |
Family Income in Huber Ridge
Family Income Brackets in Huber Ridge
According to the Huber Ridge family income data, there are 404 families falling into the $100,000 to $149,999 income range, which is the most common income bracket and makes up 36.7% of all families.
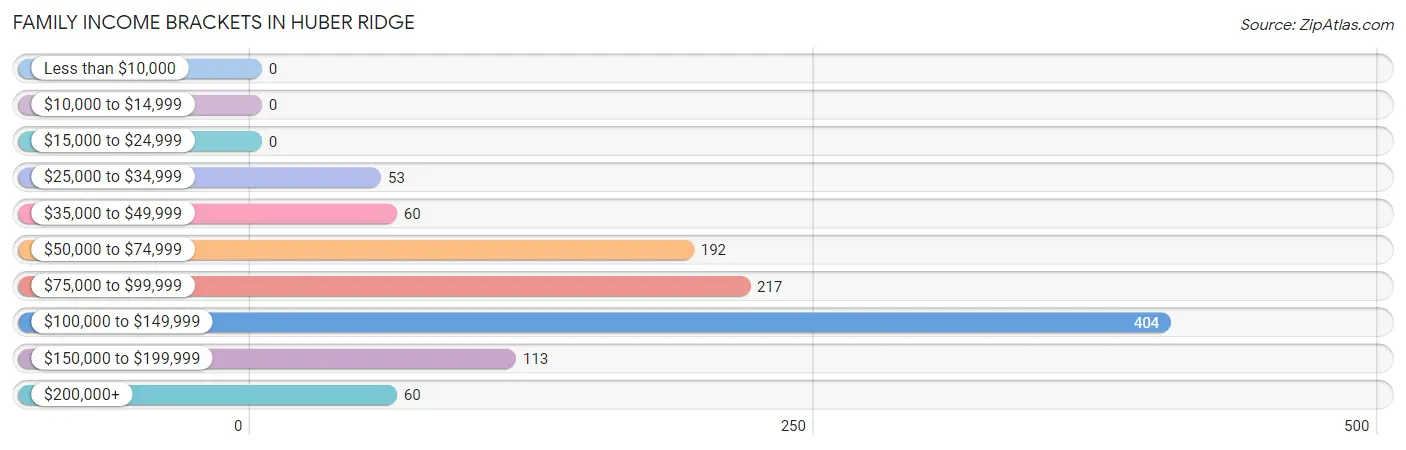
| Income Bracket | # Families | % Families |
| Less than $10,000 | 0 | 0.0% |
| $10,000 to $14,999 | 0 | 0.0% |
| $15,000 to $24,999 | 0 | 0.0% |
| $25,000 to $34,999 | 53 | 4.8% |
| $35,000 to $49,999 | 60 | 5.5% |
| $50,000 to $74,999 | 192 | 17.5% |
| $75,000 to $99,999 | 217 | 19.7% |
| $100,000 to $149,999 | 404 | 36.7% |
| $150,000 to $199,999 | 113 | 10.3% |
| $200,000+ | 60 | 5.5% |
Family Income by Famaliy Size in Huber Ridge
4-person families (204 | 18.5%) account for the highest median family income in Huber Ridge with $110,000 per family, while 2-person families (330 | 30.0%) have the highest median income of $46,724 per family member.
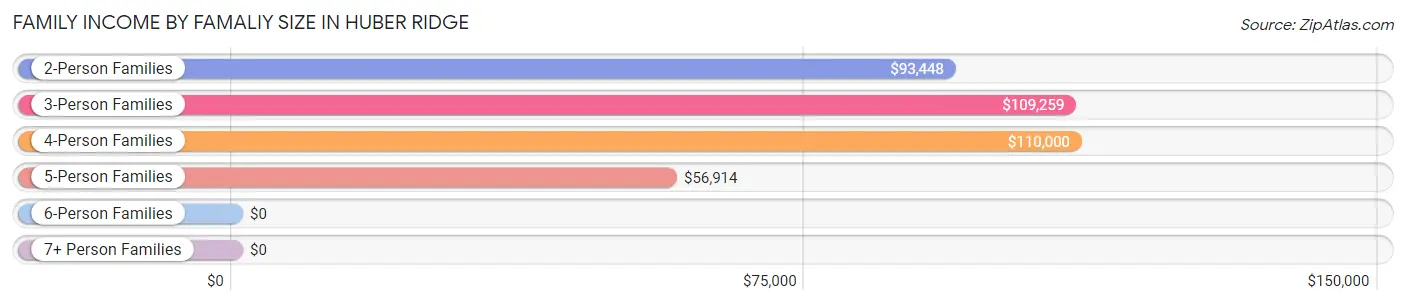
| Income Bracket | # Families | Median Income |
| 2-Person Families | 330 (30.0%) | $93,448 |
| 3-Person Families | 446 (40.6%) | $109,259 |
| 4-Person Families | 204 (18.5%) | $110,000 |
| 5-Person Families | 49 (4.4%) | $56,914 |
| 6-Person Families | 36 (3.3%) | $0 |
| 7+ Person Families | 35 (3.2%) | $0 |
| Total | 1,100 (100.0%) | $107,576 |
Family Income by Number of Earners in Huber Ridge
The median family income in Huber Ridge is $107,576, with families comprising 3+ earners (191) having the highest median family income of $135,795, while families with no earners (34) have the lowest median family income of $46,667, accounting for 17.4% and 3.1% of families, respectively.
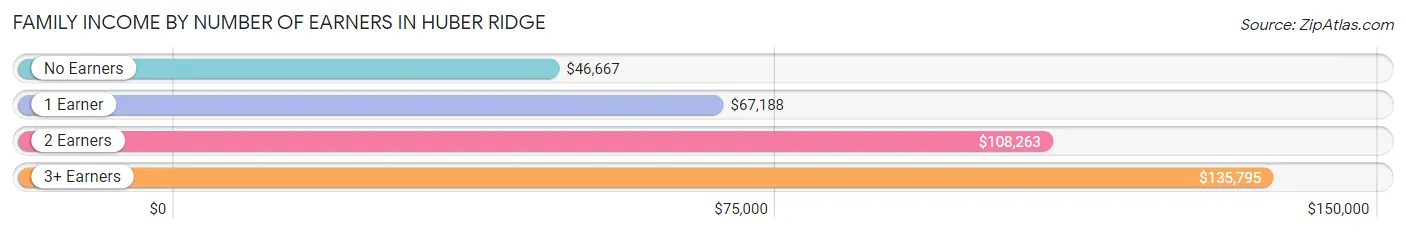
| Number of Earners | # Families | Median Income |
| No Earners | 34 (3.1%) | $46,667 |
| 1 Earner | 318 (28.9%) | $67,188 |
| 2 Earners | 557 (50.6%) | $108,263 |
| 3+ Earners | 191 (17.4%) | $135,795 |
| Total | 1,100 (100.0%) | $107,576 |
Household Income in Huber Ridge
Household Income Brackets in Huber Ridge
With 458 households falling in the category, the $100,000 to $149,999 income range is the most frequent in Huber Ridge, accounting for 28.8% of all households. In contrast, only 6 households (0.4%) fall into the $10,000 to $14,999 income bracket, making it the least populous group.
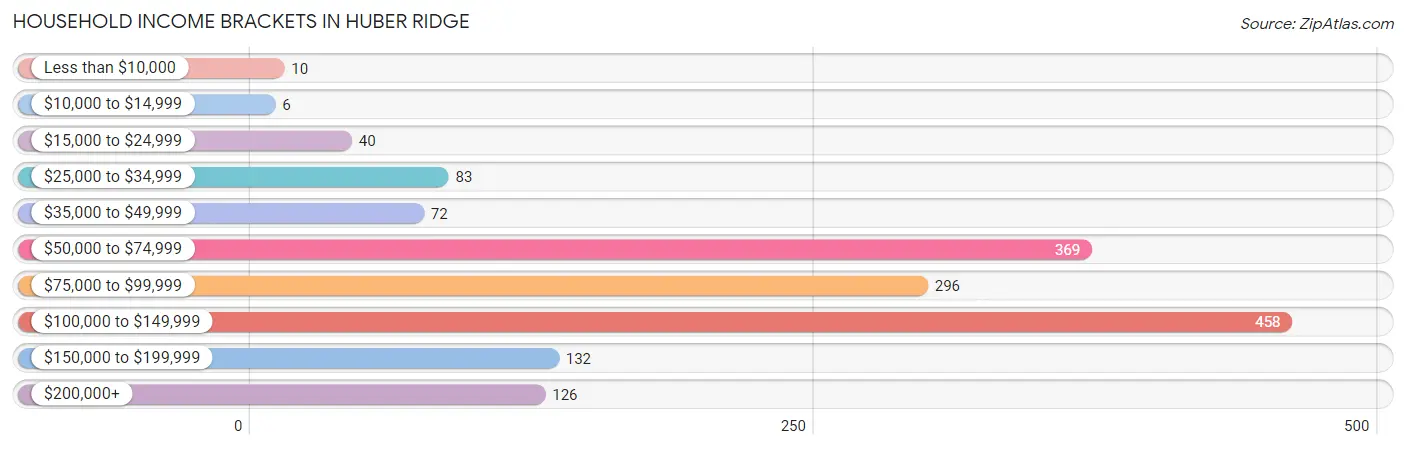
| Income Bracket | # Households | % Households |
| Less than $10,000 | 10 | 0.6% |
| $10,000 to $14,999 | 6 | 0.4% |
| $15,000 to $24,999 | 40 | 2.5% |
| $25,000 to $34,999 | 83 | 5.2% |
| $35,000 to $49,999 | 72 | 4.5% |
| $50,000 to $74,999 | 369 | 23.2% |
| $75,000 to $99,999 | 296 | 18.6% |
| $100,000 to $149,999 | 458 | 28.8% |
| $150,000 to $199,999 | 132 | 8.3% |
| $200,000+ | 126 | 7.9% |
Household Income by Householder Age in Huber Ridge
The median household income in Huber Ridge is $92,188, with the highest median household income of $105,000 found in the 25 to 44 years age bracket for the primary householder. A total of 722 households (45.4%) fall into this category. Meanwhile, the 15 to 24 years age bracket for the primary householder has the lowest median household income of $0, with 11 households (0.7%) in this group.
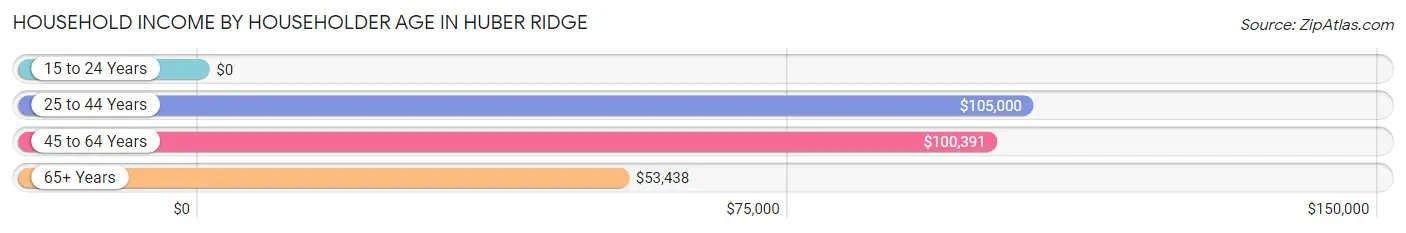
| Income Bracket | # Households | Median Income |
| 15 to 24 Years | 11 (0.7%) | $0 |
| 25 to 44 Years | 722 (45.4%) | $105,000 |
| 45 to 64 Years | 635 (40.0%) | $100,391 |
| 65+ Years | 221 (13.9%) | $53,438 |
| Total | 1,589 (100.0%) | $92,188 |
Poverty in Huber Ridge
Income Below Poverty by Sex and Age in Huber Ridge
With 1.3% poverty level for males and 1.0% for females among the residents of Huber Ridge, 75 year old and over males and 75 year old and over females are the most vulnerable to poverty, with 4 males (11.8%) and 7 females (7.3%) in their respective age groups living below the poverty level.
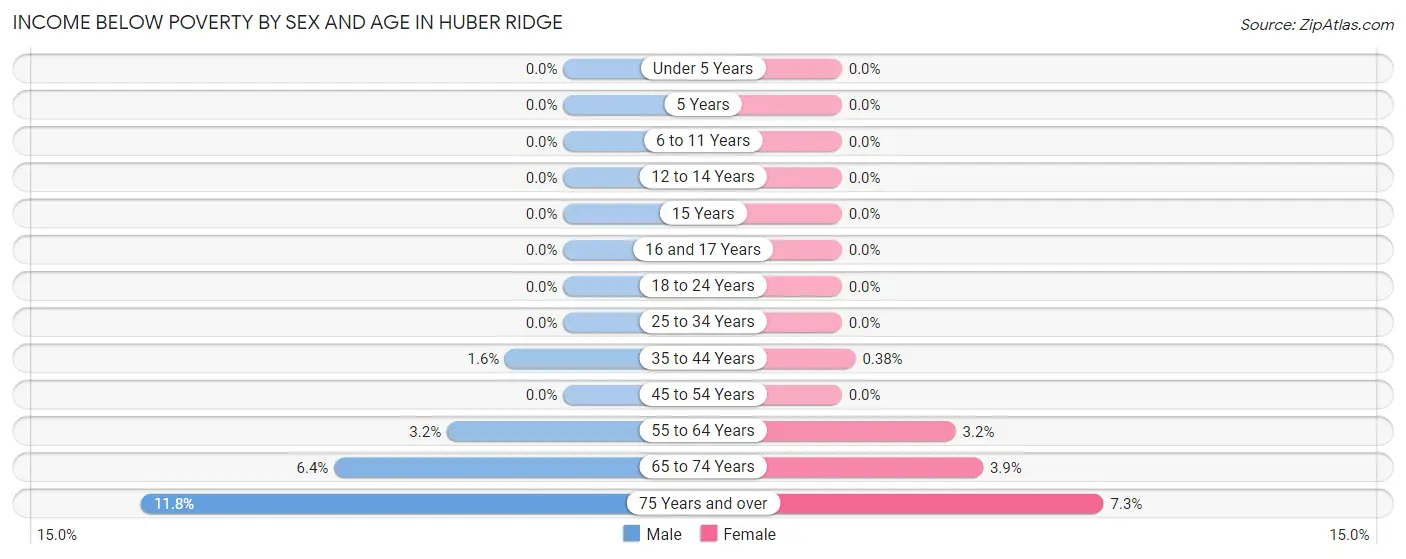
| Age Bracket | Male | Female |
| Under 5 Years | 0 (0.0%) | 0 (0.0%) |
| 5 Years | 0 (0.0%) | 0 (0.0%) |
| 6 to 11 Years | 0 (0.0%) | 0 (0.0%) |
| 12 to 14 Years | 0 (0.0%) | 0 (0.0%) |
| 15 Years | 0 (0.0%) | 0 (0.0%) |
| 16 and 17 Years | 0 (0.0%) | 0 (0.0%) |
| 18 to 24 Years | 0 (0.0%) | 0 (0.0%) |
| 25 to 34 Years | 0 (0.0%) | 0 (0.0%) |
| 35 to 44 Years | 7 (1.6%) | 1 (0.4%) |
| 45 to 54 Years | 0 (0.0%) | 0 (0.0%) |
| 55 to 64 Years | 8 (3.2%) | 9 (3.2%) |
| 65 to 74 Years | 6 (6.4%) | 7 (3.9%) |
| 75 Years and over | 4 (11.8%) | 7 (7.3%) |
| Total | 25 (1.3%) | 24 (1.0%) |
Income Above Poverty by Sex and Age in Huber Ridge
According to the poverty statistics in Huber Ridge, males aged under 5 years and females aged under 5 years are the age groups that are most secure financially, with 100.0% of males and 100.0% of females in these age groups living above the poverty line.
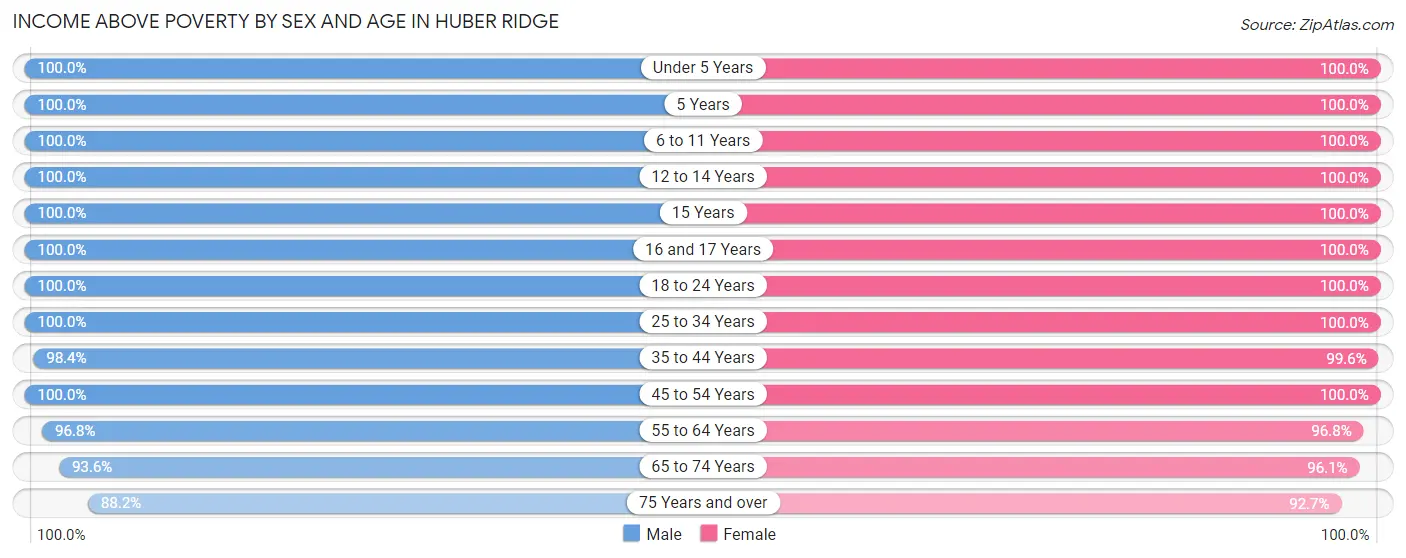
| Age Bracket | Male | Female |
| Under 5 Years | 216 (100.0%) | 166 (100.0%) |
| 5 Years | 7 (100.0%) | 41 (100.0%) |
| 6 to 11 Years | 124 (100.0%) | 168 (100.0%) |
| 12 to 14 Years | 72 (100.0%) | 165 (100.0%) |
| 15 Years | 45 (100.0%) | 53 (100.0%) |
| 16 and 17 Years | 29 (100.0%) | 81 (100.0%) |
| 18 to 24 Years | 111 (100.0%) | 126 (100.0%) |
| 25 to 34 Years | 304 (100.0%) | 459 (100.0%) |
| 35 to 44 Years | 424 (98.4%) | 260 (99.6%) |
| 45 to 54 Years | 218 (100.0%) | 270 (100.0%) |
| 55 to 64 Years | 239 (96.8%) | 275 (96.8%) |
| 65 to 74 Years | 88 (93.6%) | 171 (96.1%) |
| 75 Years and over | 30 (88.2%) | 89 (92.7%) |
| Total | 1,907 (98.7%) | 2,324 (99.0%) |
Income Below Poverty Among Married-Couple Families in Huber Ridge
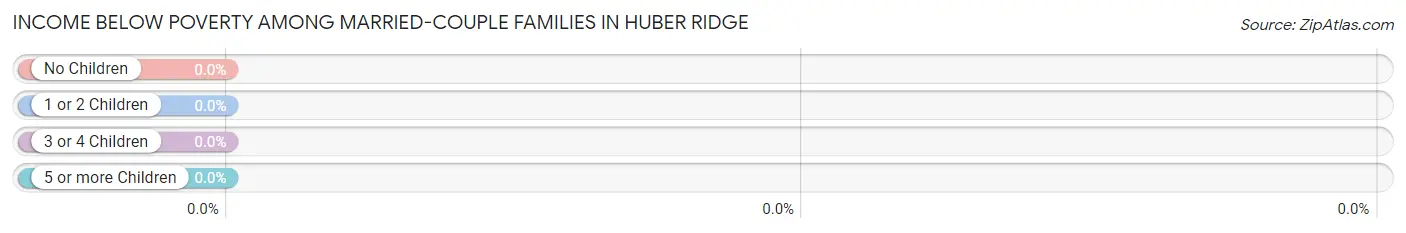
| Children | Above Poverty | Below Poverty |
| No Children | 328 (100.0%) | 0 (0.0%) |
| 1 or 2 Children | 319 (100.0%) | 0 (0.0%) |
| 3 or 4 Children | 93 (100.0%) | 0 (0.0%) |
| 5 or more Children | 27 (100.0%) | 0 (0.0%) |
| Total | 767 (100.0%) | 0 (0.0%) |
Income Below Poverty Among Single-Parent Households in Huber Ridge
| Children | Single Father | Single Mother |
| No Children | 0 (0.0%) | 0 (0.0%) |
| 1 or 2 Children | 0 (0.0%) | 0 (0.0%) |
| 3 or 4 Children | 0 (0.0%) | 0 (0.0%) |
| 5 or more Children | 0 (0.0%) | 0 (0.0%) |
| Total | 0 (0.0%) | 0 (0.0%) |
Income Below Poverty Among Married-Couple vs Single-Parent Households in Huber Ridge
| Children | Married-Couple Families | Single-Parent Households |
| No Children | 0 (0.0%) | 0 (0.0%) |
| 1 or 2 Children | 0 (0.0%) | 0 (0.0%) |
| 3 or 4 Children | 0 (0.0%) | 0 (0.0%) |
| 5 or more Children | 0 (0.0%) | 0 (0.0%) |
| Total | 0 (0.0%) | 0 (0.0%) |
Race in Huber Ridge
The most populous races in Huber Ridge are White / Caucasian (3,319 | 77.1%), Black / African American (692 | 16.1%), and Two or more Races (264 | 6.1%).
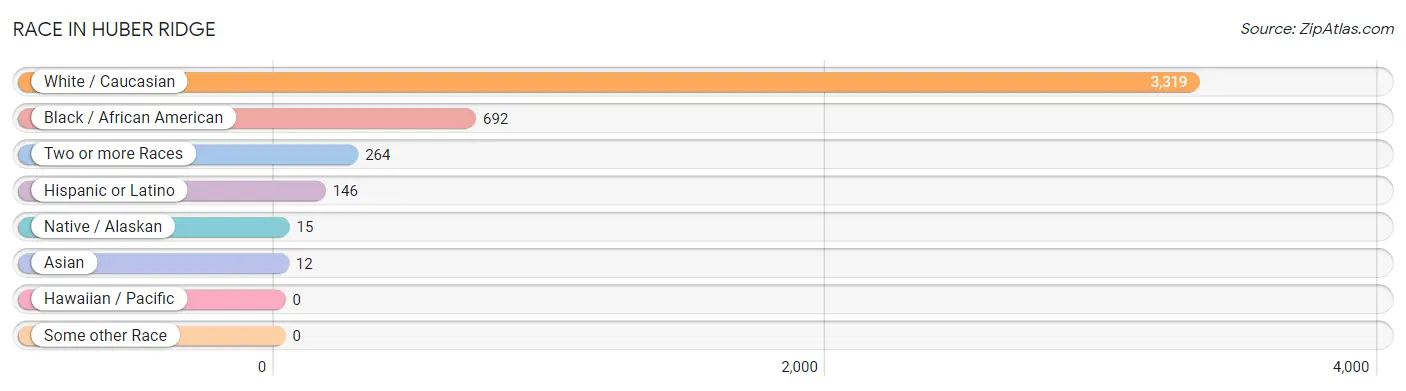
| Race | # Population | % Population |
| Asian | 12 | 0.3% |
| Black / African American | 692 | 16.1% |
| Hawaiian / Pacific | 0 | 0.0% |
| Hispanic or Latino | 146 | 3.4% |
| Native / Alaskan | 15 | 0.4% |
| White / Caucasian | 3,319 | 77.1% |
| Two or more Races | 264 | 6.1% |
| Some other Race | 0 | 0.0% |
| Total | 4,302 | 100.0% |
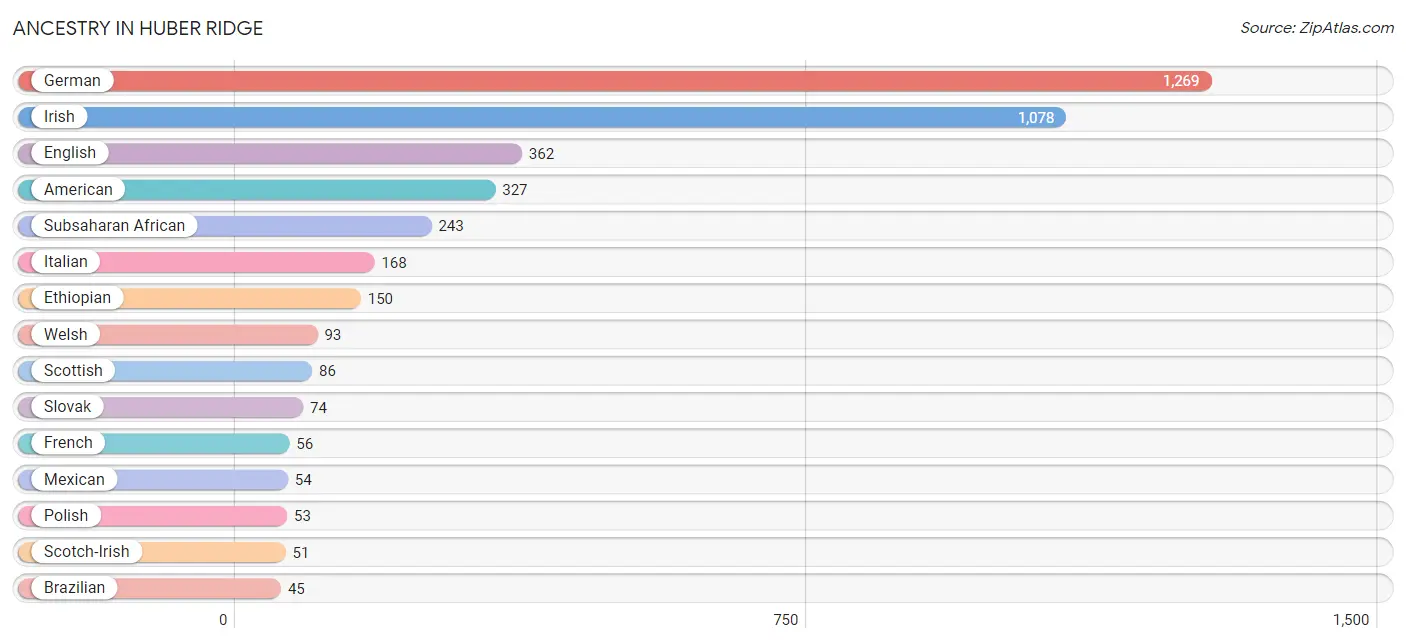
Ancestry in Huber Ridge
The most populous ancestries reported in Huber Ridge are German (1,269 | 29.5%), Irish (1,078 | 25.1%), English (362 | 8.4%), American (327 | 7.6%), and Subsaharan African (243 | 5.7%), together accounting for 76.2% of all Huber Ridge residents.
| Ancestry | # Population | % Population |
| American | 327 | 7.6% |
| Austrian | 36 | 0.8% |
| Brazilian | 45 | 1.1% |
| British | 42 | 1.0% |
| Cherokee | 41 | 0.9% |
| Croatian | 28 | 0.6% |
| Czech | 23 | 0.5% |
| Danish | 16 | 0.4% |
| Dutch | 31 | 0.7% |
| Eastern European | 6 | 0.1% |
| English | 362 | 8.4% |
| Ethiopian | 150 | 3.5% |
| European | 45 | 1.1% |
| Filipino | 12 | 0.3% |
| French | 56 | 1.3% |
| German | 1,269 | 29.5% |
| Hungarian | 18 | 0.4% |
| Indian (Asian) | 17 | 0.4% |
| Irish | 1,078 | 25.1% |
| Italian | 168 | 3.9% |
| Korean | 43 | 1.0% |
| Latvian | 7 | 0.2% |
| Macedonian | 6 | 0.1% |
| Mexican | 54 | 1.3% |
| Native Hawaiian | 10 | 0.2% |
| Nigerian | 11 | 0.3% |
| Northern European | 24 | 0.6% |
| Norwegian | 29 | 0.7% |
| Pennsylvania German | 6 | 0.1% |
| Polish | 53 | 1.2% |
| Puerto Rican | 7 | 0.2% |
| Romanian | 15 | 0.4% |
| Russian | 16 | 0.4% |
| Scandinavian | 15 | 0.4% |
| Scotch-Irish | 51 | 1.2% |
| Scottish | 86 | 2.0% |
| Slovak | 74 | 1.7% |
| South African | 12 | 0.3% |
| Spaniard | 8 | 0.2% |
| Spanish | 32 | 0.7% |
| Subsaharan African | 243 | 5.7% |
| Swedish | 8 | 0.2% |
| Swiss | 20 | 0.5% |
| Welsh | 93 | 2.2% | View All 44 Rows |
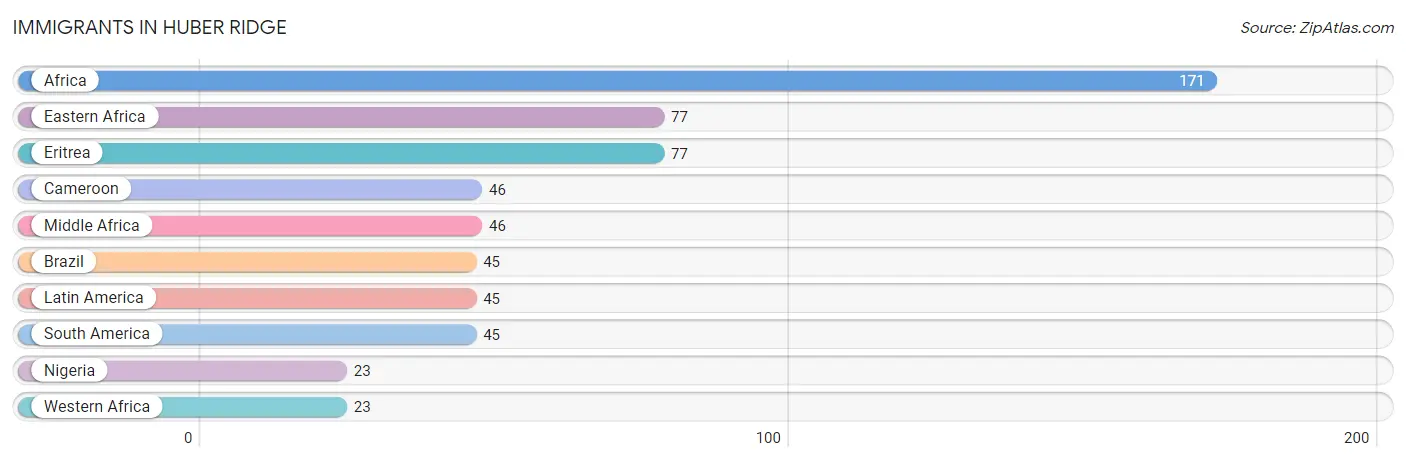
Immigrants in Huber Ridge
The most numerous immigrant groups reported in Huber Ridge came from Africa (171 | 4.0%), Eastern Africa (77 | 1.8%), Eritrea (77 | 1.8%), Cameroon (46 | 1.1%), and Middle Africa (46 | 1.1%), together accounting for 9.7% of all Huber Ridge residents.
| Immigration Origin | # Population | % Population |
| Africa | 171 | 4.0% |
| Brazil | 45 | 1.1% |
| Cameroon | 46 | 1.1% |
| Eastern Africa | 77 | 1.8% |
| Eritrea | 77 | 1.8% |
| Latin America | 45 | 1.1% |
| Middle Africa | 46 | 1.1% |
| Nigeria | 23 | 0.5% |
| South America | 45 | 1.1% |
| Western Africa | 23 | 0.5% | View All 10 Rows |
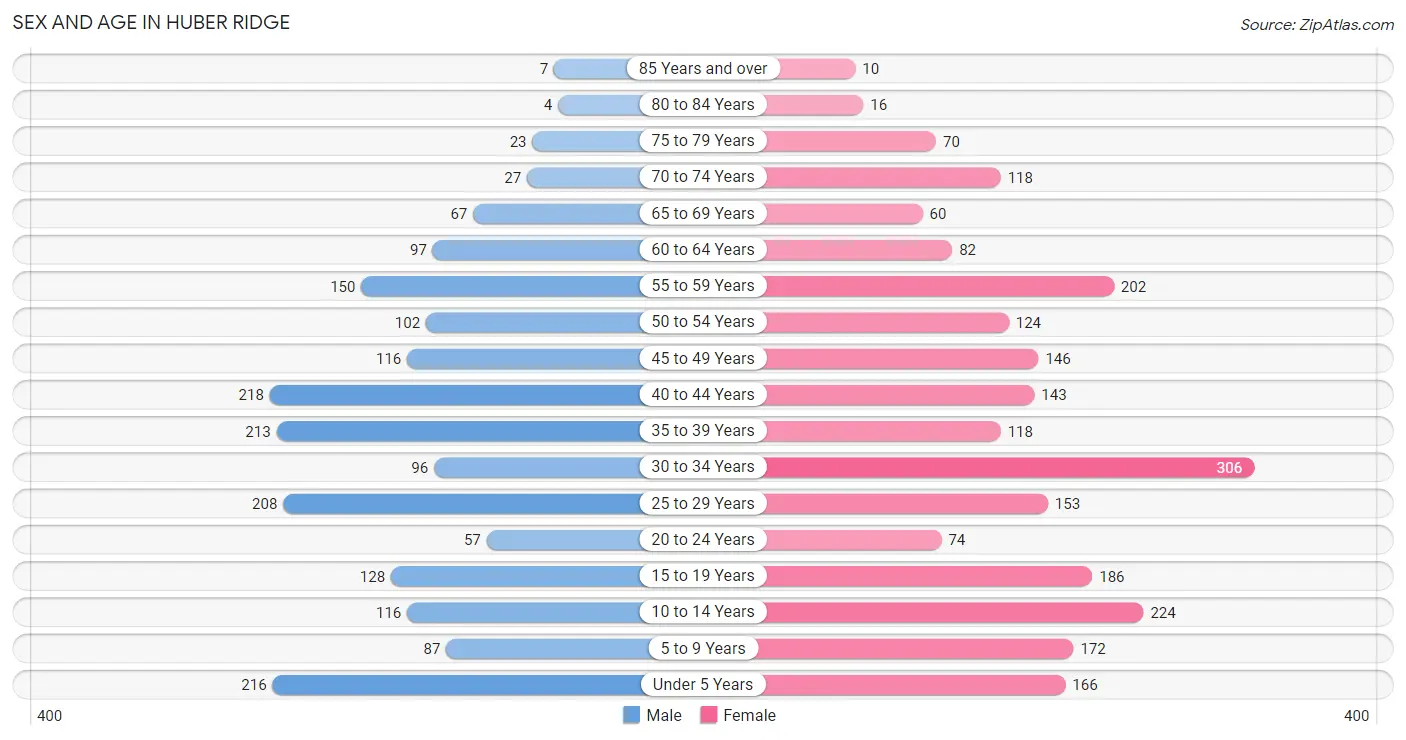
Sex and Age in Huber Ridge
Sex and Age in Huber Ridge
The most populous age groups in Huber Ridge are 40 to 44 Years (218 | 11.3%) for men and 30 to 34 Years (306 | 12.9%) for women.
| Age Bracket | Male | Female |
| Under 5 Years | 216 (11.2%) | 166 (7.0%) |
| 5 to 9 Years | 87 (4.5%) | 172 (7.3%) |
| 10 to 14 Years | 116 (6.0%) | 224 (9.5%) |
| 15 to 19 Years | 128 (6.6%) | 186 (7.9%) |
| 20 to 24 Years | 57 (2.9%) | 74 (3.1%) |
| 25 to 29 Years | 208 (10.8%) | 153 (6.5%) |
| 30 to 34 Years | 96 (5.0%) | 306 (12.9%) |
| 35 to 39 Years | 213 (11.0%) | 118 (5.0%) |
| 40 to 44 Years | 218 (11.3%) | 143 (6.0%) |
| 45 to 49 Years | 116 (6.0%) | 146 (6.2%) |
| 50 to 54 Years | 102 (5.3%) | 124 (5.2%) |
| 55 to 59 Years | 150 (7.8%) | 202 (8.5%) |
| 60 to 64 Years | 97 (5.0%) | 82 (3.5%) |
| 65 to 69 Years | 67 (3.5%) | 60 (2.5%) |
| 70 to 74 Years | 27 (1.4%) | 118 (5.0%) |
| 75 to 79 Years | 23 (1.2%) | 70 (2.9%) |
| 80 to 84 Years | 4 (0.2%) | 16 (0.7%) |
| 85 Years and over | 7 (0.4%) | 10 (0.4%) |
| Total | 1,932 (100.0%) | 2,370 (100.0%) |
Families and Households in Huber Ridge
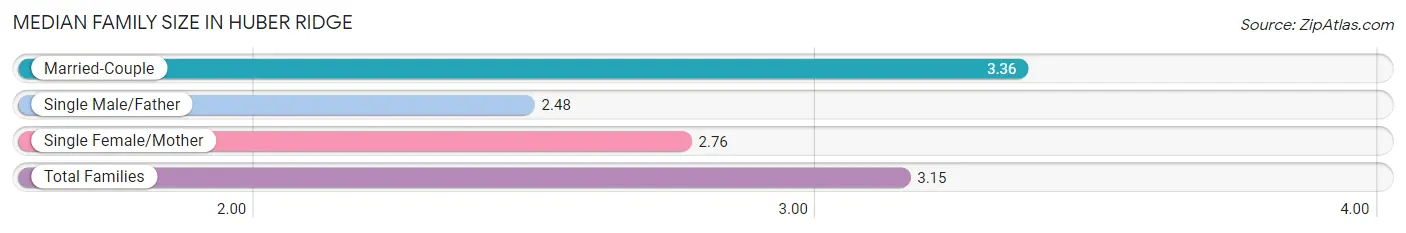
Median Family Size in Huber Ridge
The median family size in Huber Ridge is 3.15 persons per family, with married-couple families (767 | 69.7%) accounting for the largest median family size of 3.36 persons per family. On the other hand, single male/father families (90 | 8.2%) represent the smallest median family size with 2.48 persons per family.
| Family Type | # Families | Family Size |
| Married-Couple | 767 (69.7%) | 3.36 |
| Single Male/Father | 90 (8.2%) | 2.48 |
| Single Female/Mother | 243 (22.1%) | 2.76 |
| Total Families | 1,100 (100.0%) | 3.15 |
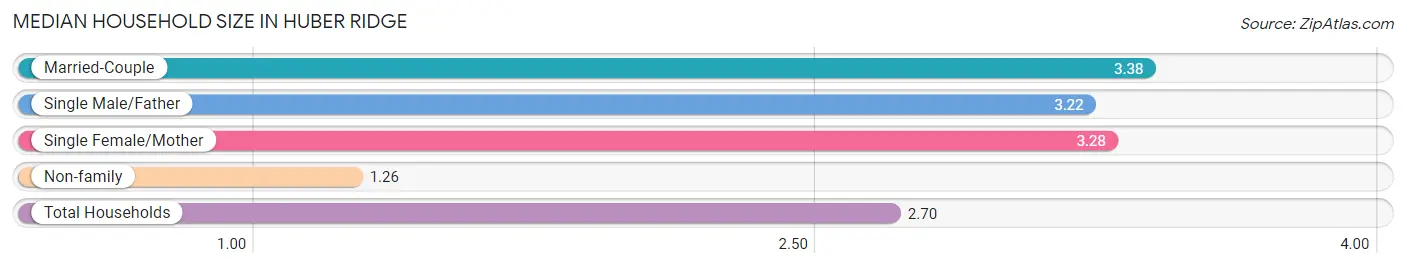
Median Household Size in Huber Ridge
The median household size in Huber Ridge is 2.70 persons per household, with married-couple households (767 | 48.3%) accounting for the largest median household size of 3.38 persons per household. non-family households (489 | 30.8%) represent the smallest median household size with 1.26 persons per household.
| Household Type | # Households | Household Size |
| Married-Couple | 767 (48.3%) | 3.38 |
| Single Male/Father | 90 (5.7%) | 3.22 |
| Single Female/Mother | 243 (15.3%) | 3.28 |
| Non-family | 489 (30.8%) | 1.26 |
| Total Households | 1,589 (100.0%) | 2.70 |
Household Size by Marriage Status in Huber Ridge
Out of a total of 1,589 households in Huber Ridge, 1,100 (69.2%) are family households, while 489 (30.8%) are nonfamily households. The most numerous type of family households are 3-person households, comprising 440, and the most common type of nonfamily households are 1-person households, comprising 389.
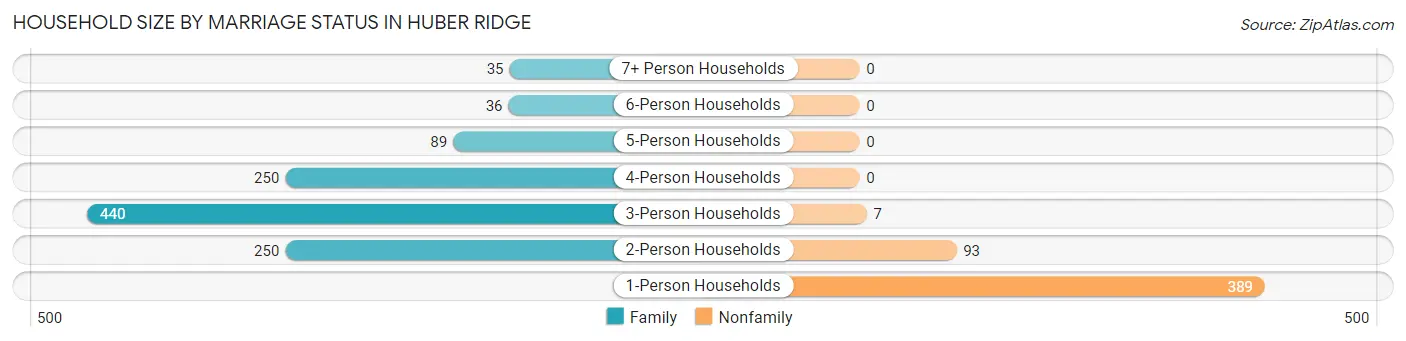
| Household Size | Family Households | Nonfamily Households |
| 1-Person Households | - | 389 (24.5%) |
| 2-Person Households | 250 (15.7%) | 93 (5.9%) |
| 3-Person Households | 440 (27.7%) | 7 (0.4%) |
| 4-Person Households | 250 (15.7%) | 0 (0.0%) |
| 5-Person Households | 89 (5.6%) | 0 (0.0%) |
| 6-Person Households | 36 (2.3%) | 0 (0.0%) |
| 7+ Person Households | 35 (2.2%) | 0 (0.0%) |
| Total | 1,100 (69.2%) | 489 (30.8%) |
Female Fertility in Huber Ridge
Fertility by Age in Huber Ridge
Average fertility rate in Huber Ridge is 122.0 births per 1,000 women. Women in the age bracket of 20 to 34 years have the highest fertility rate with 231.0 births per 1,000 women. Women in the age bracket of 20 to 34 years acount for 88.5% of all women with births.
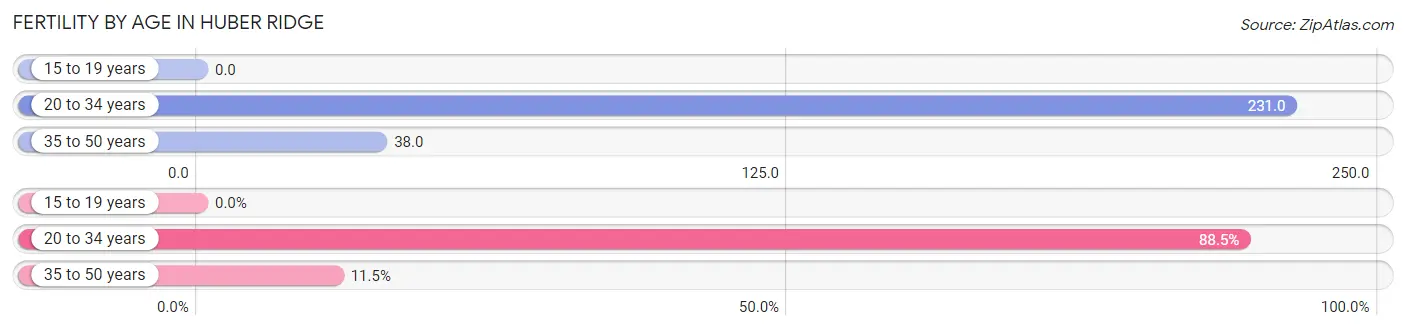
| Age Bracket | Women with Births | Births / 1,000 Women |
| 15 to 19 years | 0 (0.0%) | 0.0 |
| 20 to 34 years | 123 (88.5%) | 231.0 |
| 35 to 50 years | 16 (11.5%) | 38.0 |
| Total | 139 (100.0%) | 122.0 |
Fertility by Age by Marriage Status in Huber Ridge
83.5% of women with births (139) in Huber Ridge are married. The highest percentage of unmarried women with births falls into 35 to 50 years age bracket with 100.0% of them unmarried at the time of birth, while the lowest percentage of unmarried women with births belong to 20 to 34 years age bracket with 5.7% of them unmarried.
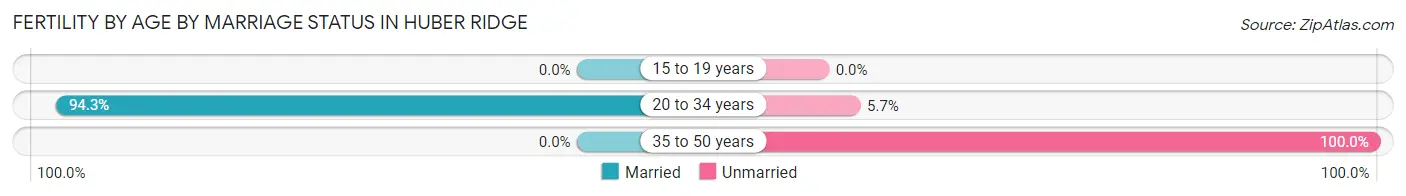
| Age Bracket | Married | Unmarried |
| 15 to 19 years | 0 (0.0%) | 0 (0.0%) |
| 20 to 34 years | 116 (94.3%) | 7 (5.7%) |
| 35 to 50 years | 0 (0.0%) | 16 (100.0%) |
| Total | 116 (83.5%) | 23 (16.6%) |
Fertility by Education in Huber Ridge
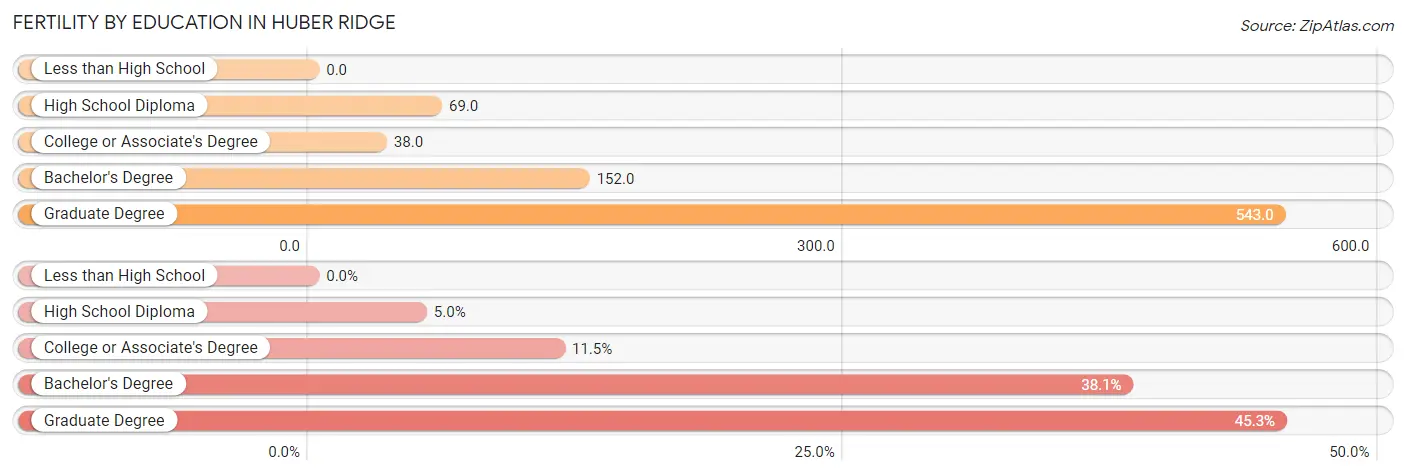
| Educational Attainment | Women with Births | Births / 1,000 Women |
| Less than High School | 0 (0.0%) | 0.0 |
| High School Diploma | 7 (5.0%) | 69.0 |
| College or Associate's Degree | 16 (11.5%) | 38.0 |
| Bachelor's Degree | 53 (38.1%) | 152.0 |
| Graduate Degree | 63 (45.3%) | 543.0 |
| Total | 139 (100.0%) | 122.0 |
Fertility by Education by Marriage Status in Huber Ridge
16.6% of women with births in Huber Ridge are unmarried. Women with the educational attainment of graduate degree are most likely to be married with 100.0% of them married at childbirth, while women with the educational attainment of high school diploma are least likely to be married with 100.0% of them unmarried at childbirth.
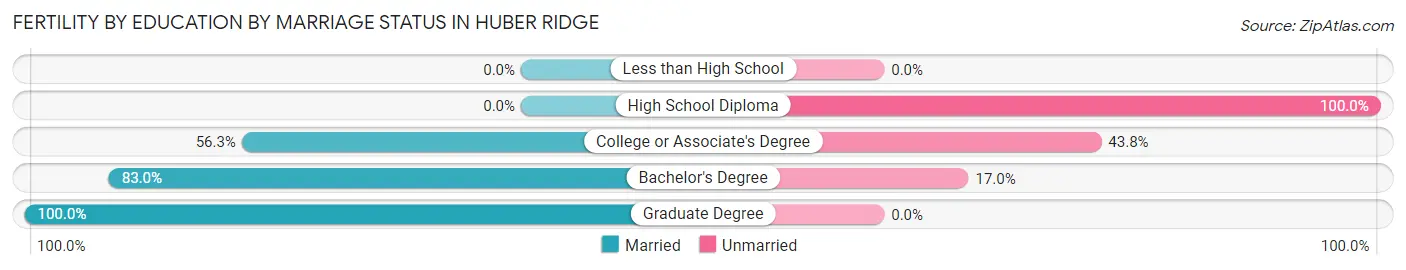
| Educational Attainment | Married | Unmarried |
| Less than High School | 0 (0.0%) | 0 (0.0%) |
| High School Diploma | 0 (0.0%) | 7 (100.0%) |
| College or Associate's Degree | 9 (56.2%) | 7 (43.8%) |
| Bachelor's Degree | 44 (83.0%) | 9 (17.0%) |
| Graduate Degree | 63 (100.0%) | 0 (0.0%) |
| Total | 116 (83.5%) | 23 (16.6%) |
Employment Characteristics in Huber Ridge
Employment by Class of Employer in Huber Ridge
Among the 2,628 employed individuals in Huber Ridge, private company employees (1,808 | 68.8%), not-for-profit organizations (244 | 9.3%), and self-employed (not incorporated) (213 | 8.1%) make up the most common classes of employment.
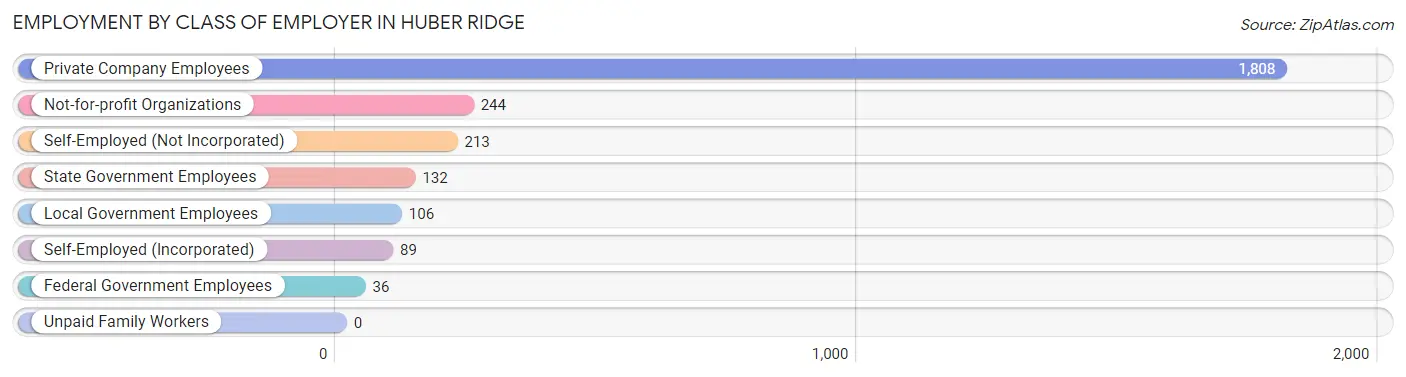
| Employer Class | # Employees | % Employees |
| Private Company Employees | 1,808 | 68.8% |
| Self-Employed (Incorporated) | 89 | 3.4% |
| Self-Employed (Not Incorporated) | 213 | 8.1% |
| Not-for-profit Organizations | 244 | 9.3% |
| Local Government Employees | 106 | 4.0% |
| State Government Employees | 132 | 5.0% |
| Federal Government Employees | 36 | 1.4% |
| Unpaid Family Workers | 0 | 0.0% |
| Total | 2,628 | 100.0% |
Employment Status by Age in Huber Ridge
According to the labor force statistics for Huber Ridge, out of the total population over 16 years of age (3,223), 85.4% or 2,752 individuals are in the labor force, with 2.0% or 55 of them unemployed. The age group with the highest labor force participation rate is 45 to 54 years, with 98.8% or 482 individuals in the labor force. Within the labor force, the 16 to 19 years age range has the highest percentage of unemployed individuals, with 12.1% or 21 of them being unemployed.
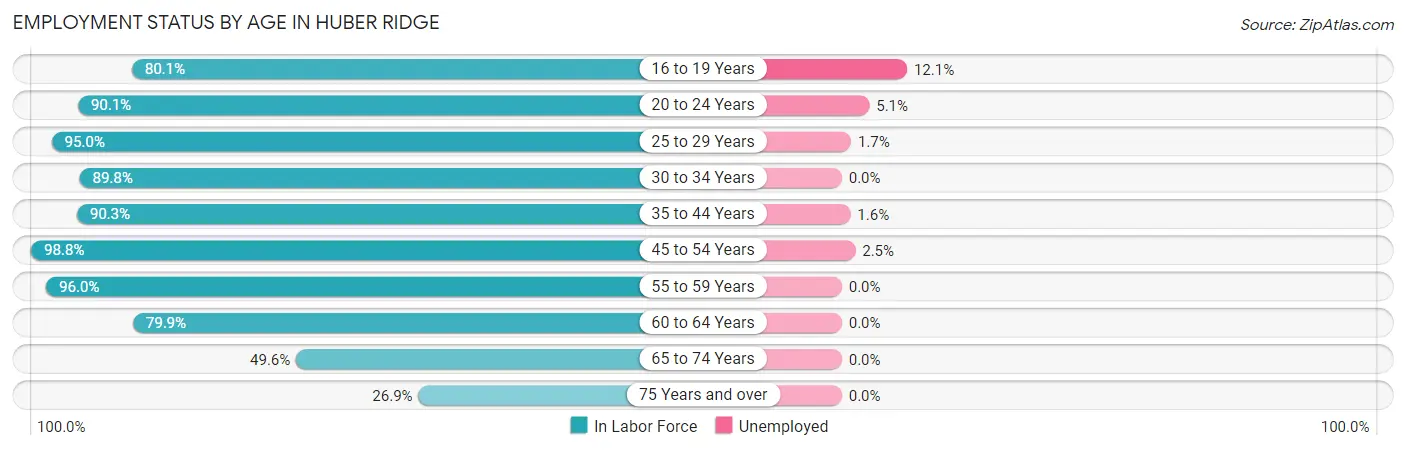
| Age Bracket | In Labor Force | Unemployed |
| 16 to 19 Years | 173 (80.1%) | 21 (12.1%) |
| 20 to 24 Years | 118 (90.1%) | 6 (5.1%) |
| 25 to 29 Years | 343 (95.0%) | 6 (1.7%) |
| 30 to 34 Years | 361 (89.8%) | 0 (0.0%) |
| 35 to 44 Years | 625 (90.3%) | 10 (1.6%) |
| 45 to 54 Years | 482 (98.8%) | 12 (2.5%) |
| 55 to 59 Years | 338 (96.0%) | 0 (0.0%) |
| 60 to 64 Years | 143 (79.9%) | 0 (0.0%) |
| 65 to 74 Years | 135 (49.6%) | 0 (0.0%) |
| 75 Years and over | 35 (26.9%) | 0 (0.0%) |
| Total | 2,752 (85.4%) | 55 (2.0%) |
Employment Status by Educational Attainment in Huber Ridge
According to labor force statistics for Huber Ridge, 92.6% of individuals (2,291) out of the total population between 25 and 64 years of age (2,474) are in the labor force, with 1.2% or 27 of them being unemployed. The group with the highest labor force participation rate are those with the educational attainment of bachelor's degree or higher, with 94.6% or 971 individuals in the labor force. Within the labor force, individuals with high school diploma education have the highest percentage of unemployment, with 2.7% or 10 of them being unemployed.
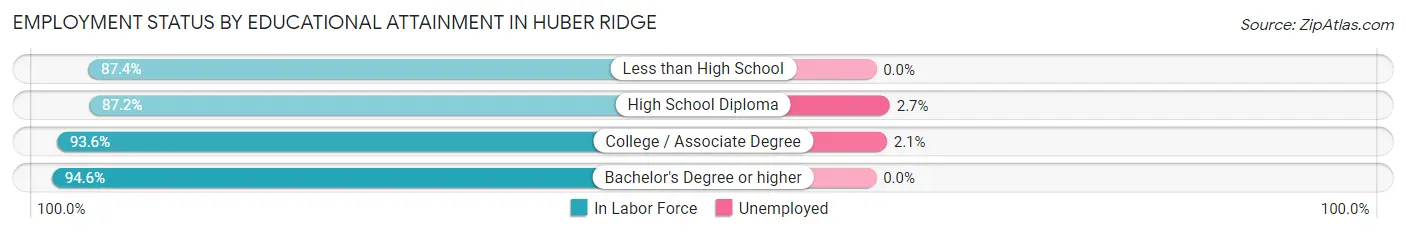
| Educational Attainment | In Labor Force | Unemployed |
| Less than High School | 97 (87.4%) | 0 (0.0%) |
| High School Diploma | 375 (87.2%) | 12 (2.7%) |
| College / Associate Degree | 849 (93.6%) | 19 (2.1%) |
| Bachelor's Degree or higher | 971 (94.6%) | 0 (0.0%) |
| Total | 2,291 (92.6%) | 30 (1.2%) |
Employment Occupations by Sex in Huber Ridge
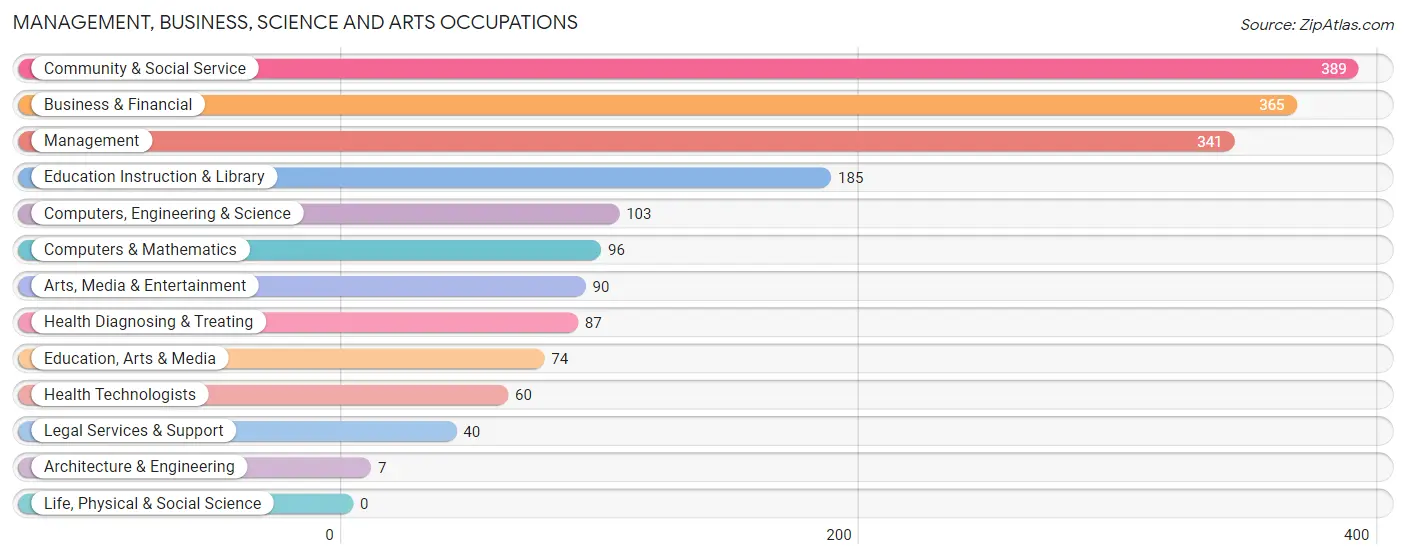
Management, Business, Science and Arts Occupations
The most common Management, Business, Science and Arts occupations in Huber Ridge are Community & Social Service (389 | 14.4%), Business & Financial (365 | 13.5%), Management (341 | 12.6%), Education Instruction & Library (185 | 6.9%), and Computers, Engineering & Science (103 | 3.8%).
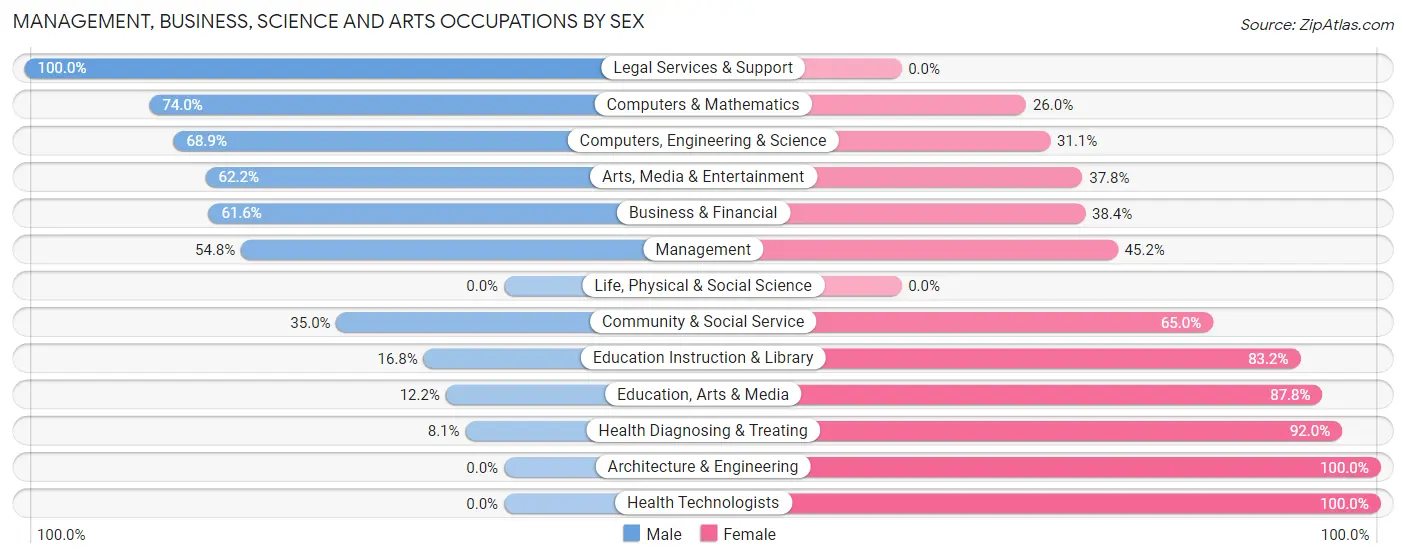
Management, Business, Science and Arts Occupations by Sex
Within the Management, Business, Science and Arts occupations in Huber Ridge, the most male-oriented occupations are Legal Services & Support (100.0%), Computers & Mathematics (74.0%), and Computers, Engineering & Science (68.9%), while the most female-oriented occupations are Architecture & Engineering (100.0%), Health Technologists (100.0%), and Health Diagnosing & Treating (91.9%).
| Occupation | Male | Female |
| Management | 187 (54.8%) | 154 (45.2%) |
| Business & Financial | 225 (61.6%) | 140 (38.4%) |
| Computers, Engineering & Science | 71 (68.9%) | 32 (31.1%) |
| Computers & Mathematics | 71 (74.0%) | 25 (26.0%) |
| Architecture & Engineering | 0 (0.0%) | 7 (100.0%) |
| Life, Physical & Social Science | 0 (0.0%) | 0 (0.0%) |
| Community & Social Service | 136 (35.0%) | 253 (65.0%) |
| Education, Arts & Media | 9 (12.2%) | 65 (87.8%) |
| Legal Services & Support | 40 (100.0%) | 0 (0.0%) |
| Education Instruction & Library | 31 (16.8%) | 154 (83.2%) |
| Arts, Media & Entertainment | 56 (62.2%) | 34 (37.8%) |
| Health Diagnosing & Treating | 7 (8.1%) | 80 (91.9%) |
| Health Technologists | 0 (0.0%) | 60 (100.0%) |
| Total (Category) | 626 (48.7%) | 659 (51.3%) |
| Total (Overall) | 1,346 (49.9%) | 1,352 (50.1%) |
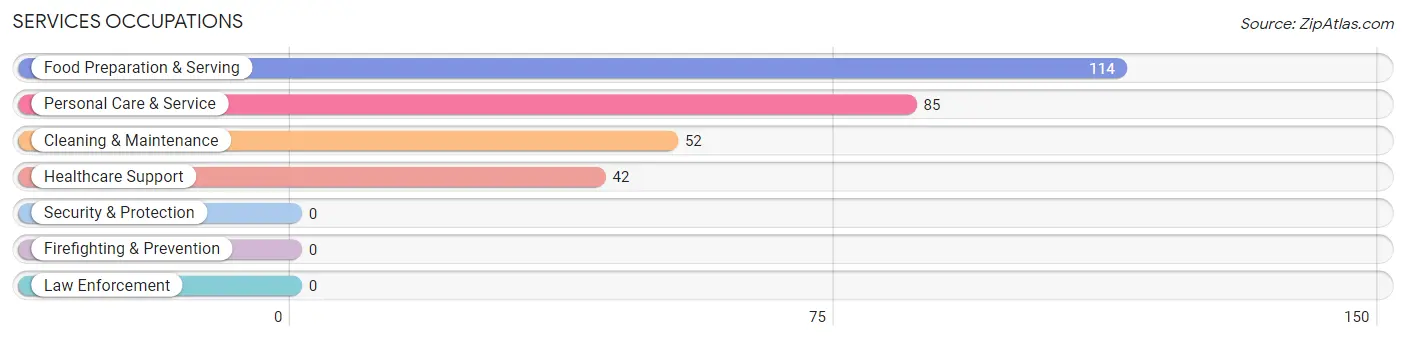
Services Occupations
The most common Services occupations in Huber Ridge are Food Preparation & Serving (114 | 4.2%), Personal Care & Service (85 | 3.2%), Cleaning & Maintenance (52 | 1.9%), and Healthcare Support (42 | 1.6%).
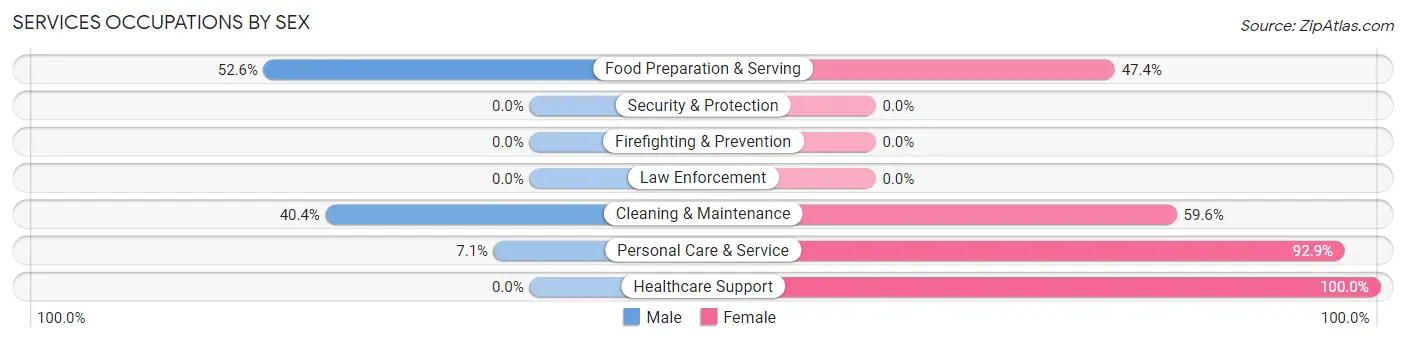
Services Occupations by Sex
Within the Services occupations in Huber Ridge, the most male-oriented occupations are Food Preparation & Serving (52.6%), Cleaning & Maintenance (40.4%), and Personal Care & Service (7.1%), while the most female-oriented occupations are Healthcare Support (100.0%), Personal Care & Service (92.9%), and Cleaning & Maintenance (59.6%).
| Occupation | Male | Female |
| Healthcare Support | 0 (0.0%) | 42 (100.0%) |
| Security & Protection | 0 (0.0%) | 0 (0.0%) |
| Firefighting & Prevention | 0 (0.0%) | 0 (0.0%) |
| Law Enforcement | 0 (0.0%) | 0 (0.0%) |
| Food Preparation & Serving | 60 (52.6%) | 54 (47.4%) |
| Cleaning & Maintenance | 21 (40.4%) | 31 (59.6%) |
| Personal Care & Service | 6 (7.1%) | 79 (92.9%) |
| Total (Category) | 87 (29.7%) | 206 (70.3%) |
| Total (Overall) | 1,346 (49.9%) | 1,352 (50.1%) |
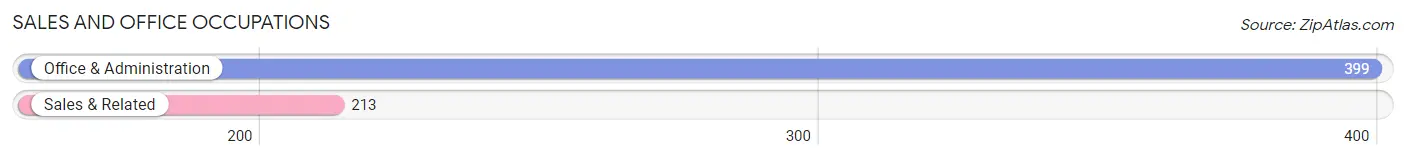
Sales and Office Occupations
The most common Sales and Office occupations in Huber Ridge are Office & Administration (399 | 14.8%), and Sales & Related (213 | 7.9%).
Sales and Office Occupations by Sex
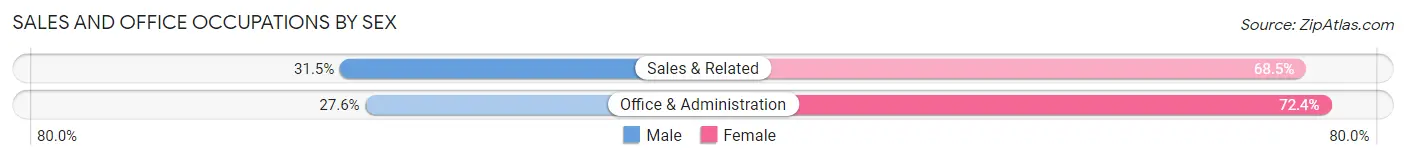
| Occupation | Male | Female |
| Sales & Related | 67 (31.5%) | 146 (68.5%) |
| Office & Administration | 110 (27.6%) | 289 (72.4%) |
| Total (Category) | 177 (28.9%) | 435 (71.1%) |
| Total (Overall) | 1,346 (49.9%) | 1,352 (50.1%) |
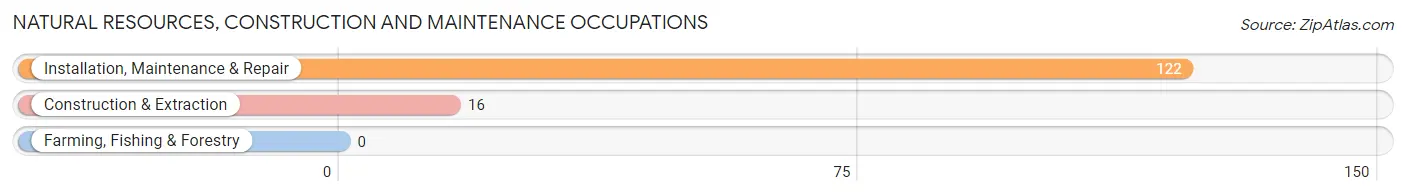
Natural Resources, Construction and Maintenance Occupations
The most common Natural Resources, Construction and Maintenance occupations in Huber Ridge are Installation, Maintenance & Repair (122 | 4.5%), and Construction & Extraction (16 | 0.6%).
Natural Resources, Construction and Maintenance Occupations by Sex
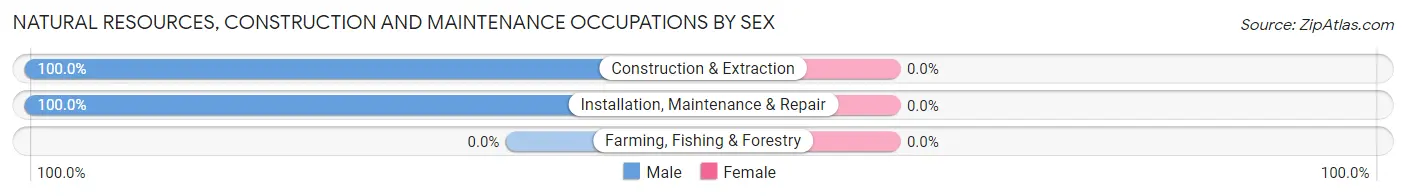
| Occupation | Male | Female |
| Farming, Fishing & Forestry | 0 (0.0%) | 0 (0.0%) |
| Construction & Extraction | 16 (100.0%) | 0 (0.0%) |
| Installation, Maintenance & Repair | 122 (100.0%) | 0 (0.0%) |
| Total (Category) | 138 (100.0%) | 0 (0.0%) |
| Total (Overall) | 1,346 (49.9%) | 1,352 (50.1%) |
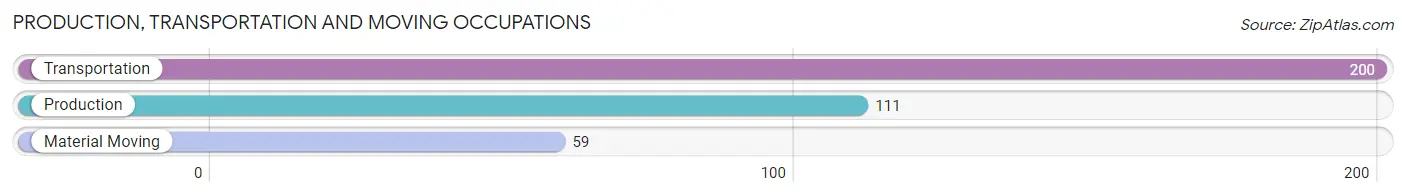
Production, Transportation and Moving Occupations
The most common Production, Transportation and Moving occupations in Huber Ridge are Transportation (200 | 7.4%), Production (111 | 4.1%), and Material Moving (59 | 2.2%).
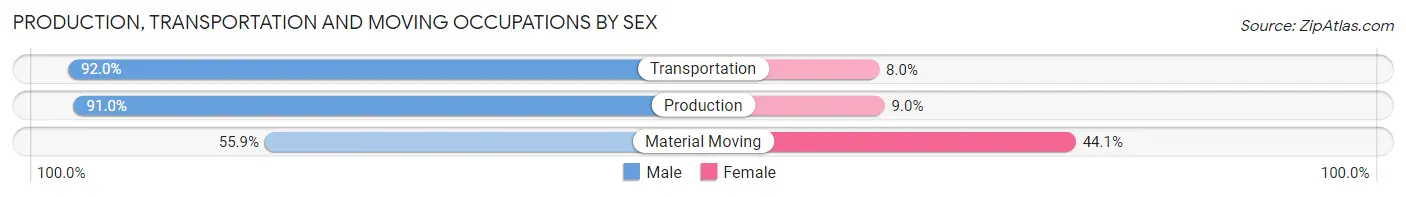
Production, Transportation and Moving Occupations by Sex
| Occupation | Male | Female |
| Production | 101 (91.0%) | 10 (9.0%) |
| Transportation | 184 (92.0%) | 16 (8.0%) |
| Material Moving | 33 (55.9%) | 26 (44.1%) |
| Total (Category) | 318 (86.0%) | 52 (14.1%) |
| Total (Overall) | 1,346 (49.9%) | 1,352 (50.1%) |
Employment Industries by Sex in Huber Ridge
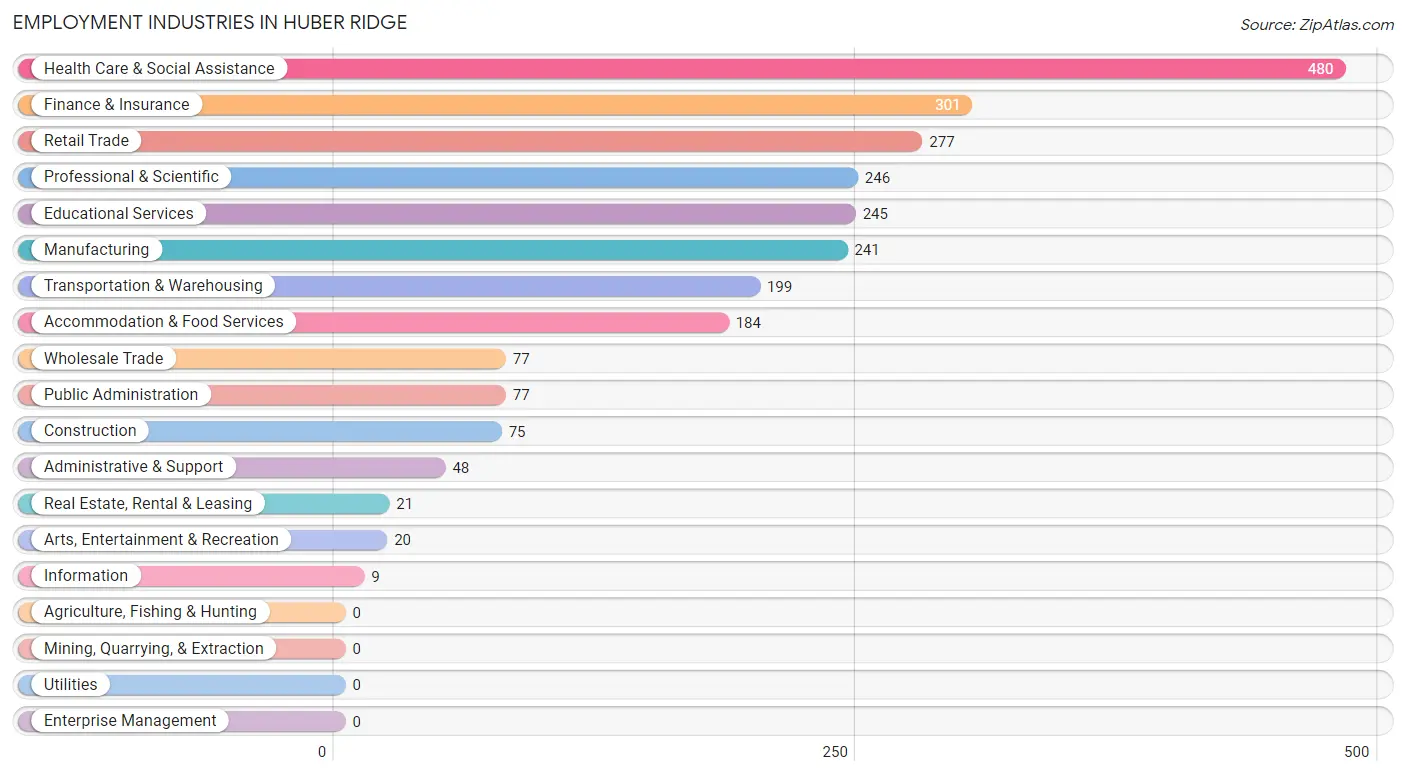
Employment Industries in Huber Ridge
The major employment industries in Huber Ridge include Health Care & Social Assistance (480 | 17.8%), Finance & Insurance (301 | 11.2%), Retail Trade (277 | 10.3%), Professional & Scientific (246 | 9.1%), and Educational Services (245 | 9.1%).
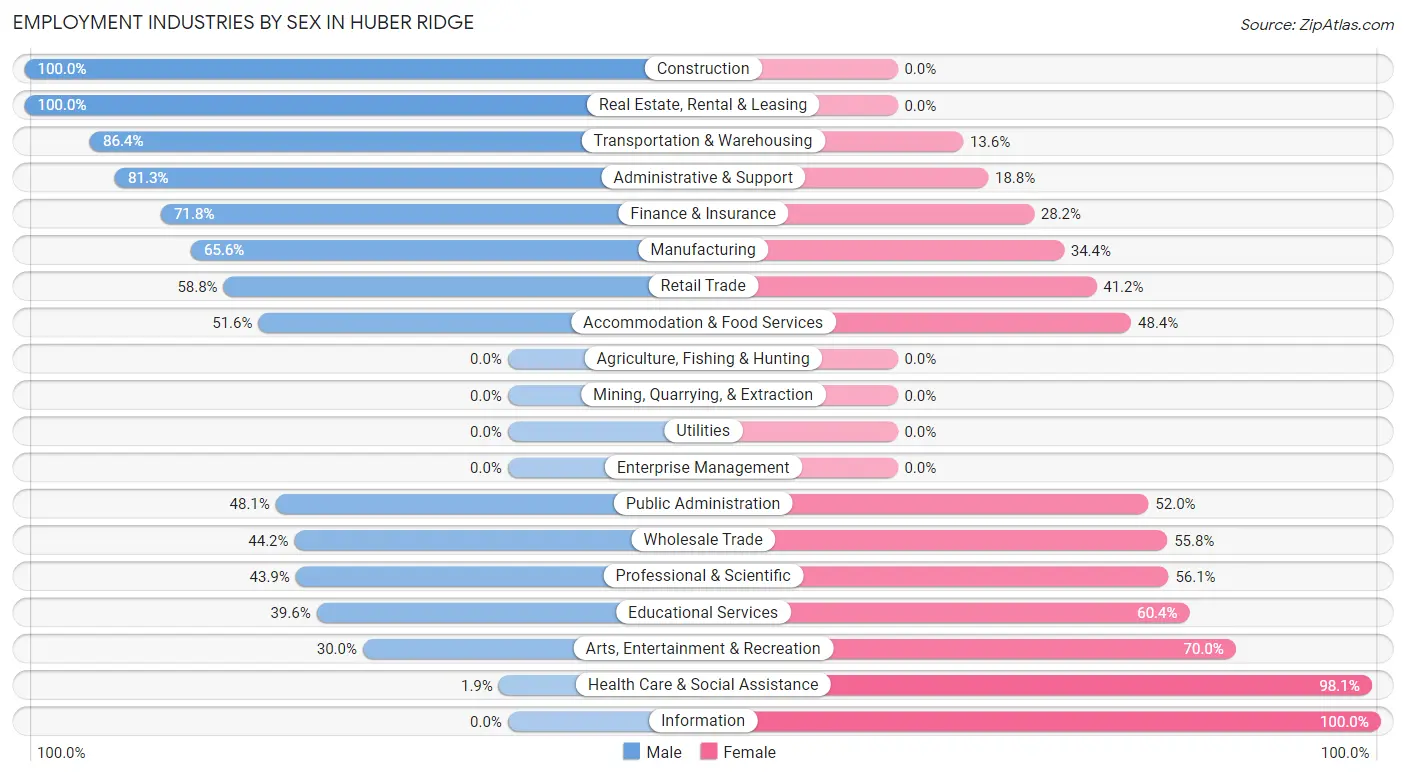
Employment Industries by Sex in Huber Ridge
The Huber Ridge industries that see more men than women are Construction (100.0%), Real Estate, Rental & Leasing (100.0%), and Transportation & Warehousing (86.4%), whereas the industries that tend to have a higher number of women are Information (100.0%), Health Care & Social Assistance (98.1%), and Arts, Entertainment & Recreation (70.0%).
| Industry | Male | Female |
| Agriculture, Fishing & Hunting | 0 (0.0%) | 0 (0.0%) |
| Mining, Quarrying, & Extraction | 0 (0.0%) | 0 (0.0%) |
| Construction | 75 (100.0%) | 0 (0.0%) |
| Manufacturing | 158 (65.6%) | 83 (34.4%) |
| Wholesale Trade | 34 (44.2%) | 43 (55.8%) |
| Retail Trade | 163 (58.8%) | 114 (41.2%) |
| Transportation & Warehousing | 172 (86.4%) | 27 (13.6%) |
| Utilities | 0 (0.0%) | 0 (0.0%) |
| Information | 0 (0.0%) | 9 (100.0%) |
| Finance & Insurance | 216 (71.8%) | 85 (28.2%) |
| Real Estate, Rental & Leasing | 21 (100.0%) | 0 (0.0%) |
| Professional & Scientific | 108 (43.9%) | 138 (56.1%) |
| Enterprise Management | 0 (0.0%) | 0 (0.0%) |
| Administrative & Support | 39 (81.2%) | 9 (18.8%) |
| Educational Services | 97 (39.6%) | 148 (60.4%) |
| Health Care & Social Assistance | 9 (1.9%) | 471 (98.1%) |
| Arts, Entertainment & Recreation | 6 (30.0%) | 14 (70.0%) |
| Accommodation & Food Services | 95 (51.6%) | 89 (48.4%) |
| Public Administration | 37 (48.0%) | 40 (51.9%) |
| Total | 1,346 (49.9%) | 1,352 (50.1%) |
Education in Huber Ridge
School Enrollment in Huber Ridge
The most common levels of schooling among the 1,015 students in Huber Ridge are middle school (329 | 32.4%), high school (183 | 18.0%), and elementary school (179 | 17.6%).
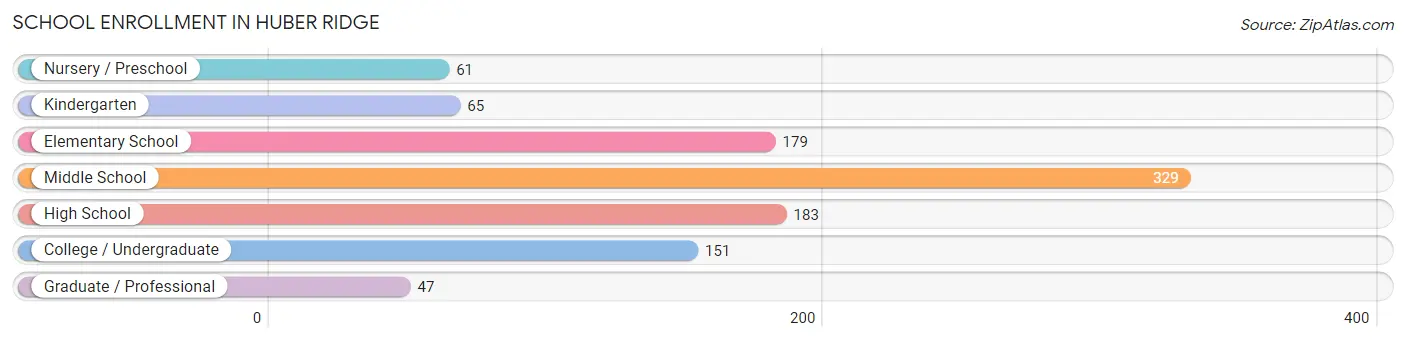
| School Level | # Students | % Students |
| Nursery / Preschool | 61 | 6.0% |
| Kindergarten | 65 | 6.4% |
| Elementary School | 179 | 17.6% |
| Middle School | 329 | 32.4% |
| High School | 183 | 18.0% |
| College / Undergraduate | 151 | 14.9% |
| Graduate / Professional | 47 | 4.6% |
| Total | 1,015 | 100.0% |
School Enrollment by Age by Funding Source in Huber Ridge
Out of a total of 1,015 students who are enrolled in schools in Huber Ridge, 170 (16.7%) attend a private institution, while the remaining 845 (83.3%) are enrolled in public schools. The age group of 25 to 34 year olds has the highest likelihood of being enrolled in private schools, with 7 (43.8% in the age bracket) enrolled. Conversely, the age group of 20 to 24 year olds has the lowest likelihood of being enrolled in a private school, with 54 (100.0% in the age bracket) attending a public institution.
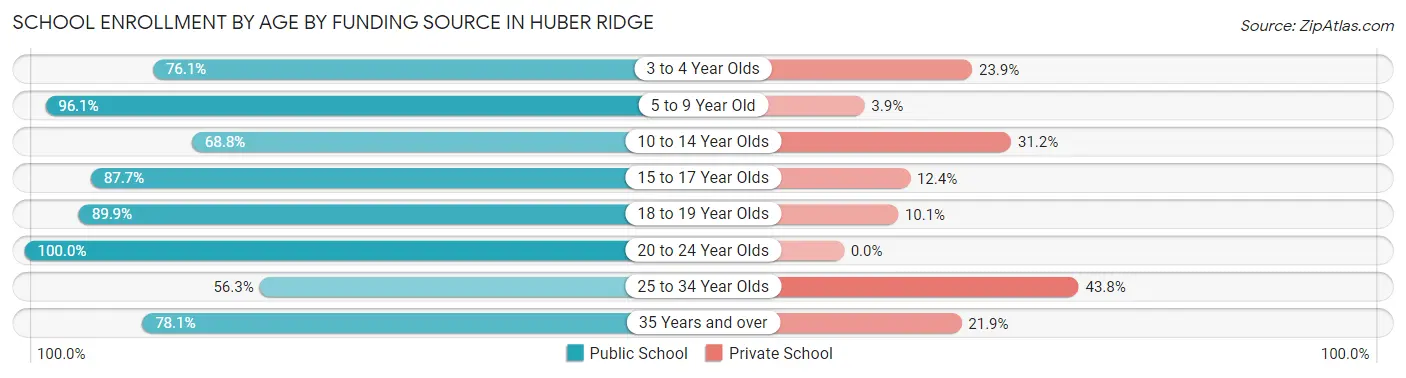
| Age Bracket | Public School | Private School |
| 3 to 4 Year Olds | 35 (76.1%) | 11 (23.9%) |
| 5 to 9 Year Old | 249 (96.1%) | 10 (3.9%) |
| 10 to 14 Year Olds | 212 (68.8%) | 96 (31.2%) |
| 15 to 17 Year Olds | 149 (87.6%) | 21 (12.3%) |
| 18 to 19 Year Olds | 80 (89.9%) | 9 (10.1%) |
| 20 to 24 Year Olds | 54 (100.0%) | 0 (0.0%) |
| 25 to 34 Year Olds | 9 (56.2%) | 7 (43.8%) |
| 35 Years and over | 57 (78.1%) | 16 (21.9%) |
| Total | 845 (83.3%) | 170 (16.7%) |
Educational Attainment by Field of Study in Huber Ridge
Business (295 | 25.6%), education (160 | 13.9%), psychology (144 | 12.5%), communications (97 | 8.4%), and science & technology (82 | 7.1%) are the most common fields of study among 1,152 individuals in Huber Ridge who have obtained a bachelor's degree or higher.
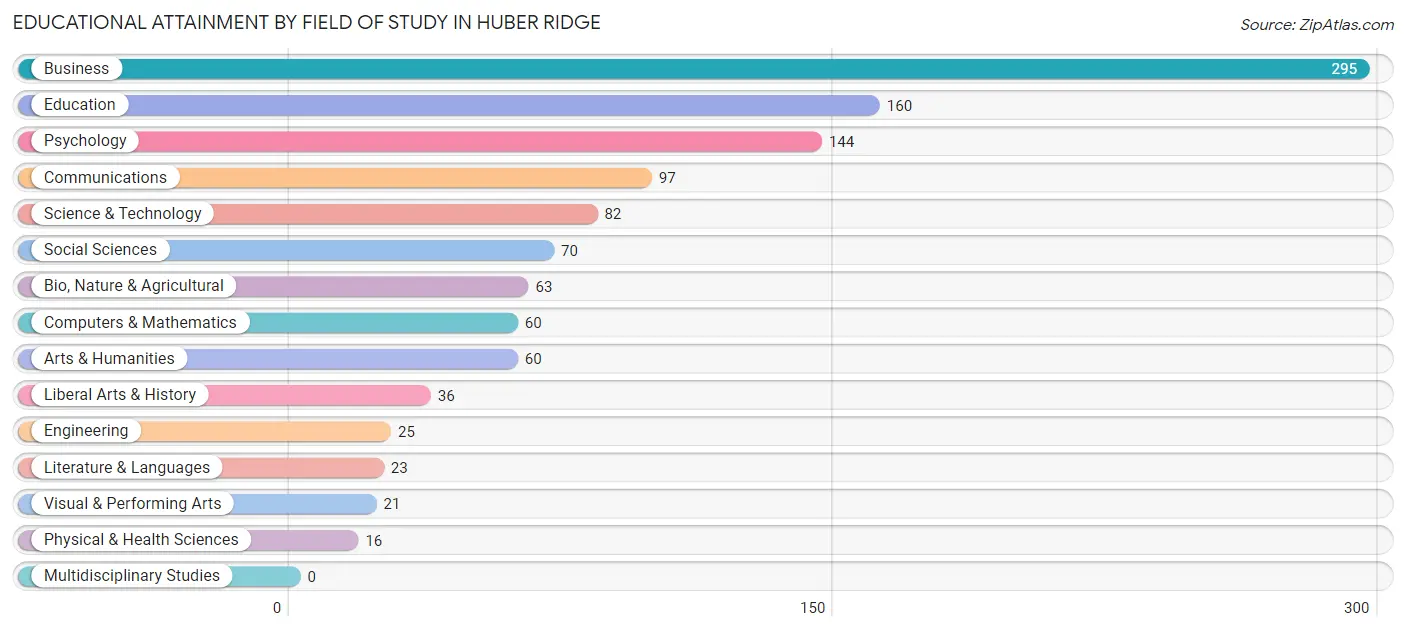
| Field of Study | # Graduates | % Graduates |
| Computers & Mathematics | 60 | 5.2% |
| Bio, Nature & Agricultural | 63 | 5.5% |
| Physical & Health Sciences | 16 | 1.4% |
| Psychology | 144 | 12.5% |
| Social Sciences | 70 | 6.1% |
| Engineering | 25 | 2.2% |
| Multidisciplinary Studies | 0 | 0.0% |
| Science & Technology | 82 | 7.1% |
| Business | 295 | 25.6% |
| Education | 160 | 13.9% |
| Literature & Languages | 23 | 2.0% |
| Liberal Arts & History | 36 | 3.1% |
| Visual & Performing Arts | 21 | 1.8% |
| Communications | 97 | 8.4% |
| Arts & Humanities | 60 | 5.2% |
| Total | 1,152 | 100.0% |
Transportation & Commute in Huber Ridge
Vehicle Availability by Sex in Huber Ridge
The most prevalent vehicle ownership categories in Huber Ridge are males with 2 vehicles (653, accounting for 49.4%) and females with 2 vehicles (624, making up 50.0%).
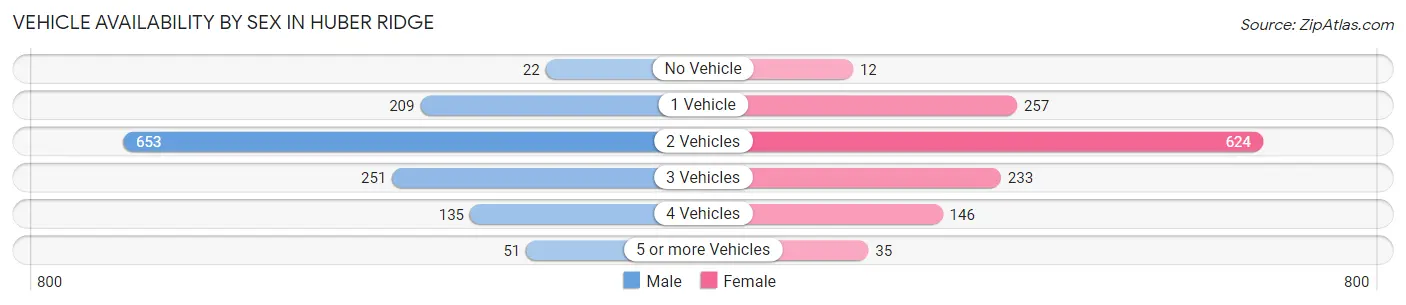
| Vehicles Available | Male | Female |
| No Vehicle | 22 (1.7%) | 12 (0.9%) |
| 1 Vehicle | 209 (15.8%) | 257 (19.7%) |
| 2 Vehicles | 653 (49.4%) | 624 (47.7%) |
| 3 Vehicles | 251 (19.0%) | 233 (17.8%) |
| 4 Vehicles | 135 (10.2%) | 146 (11.2%) |
| 5 or more Vehicles | 51 (3.9%) | 35 (2.7%) |
| Total | 1,321 (100.0%) | 1,307 (100.0%) |
Commute Time in Huber Ridge
The most frequently occuring commute durations in Huber Ridge are 15 to 19 minutes (414 commuters, 19.7%), 20 to 24 minutes (352 commuters, 16.7%), and 25 to 29 minutes (347 commuters, 16.5%).
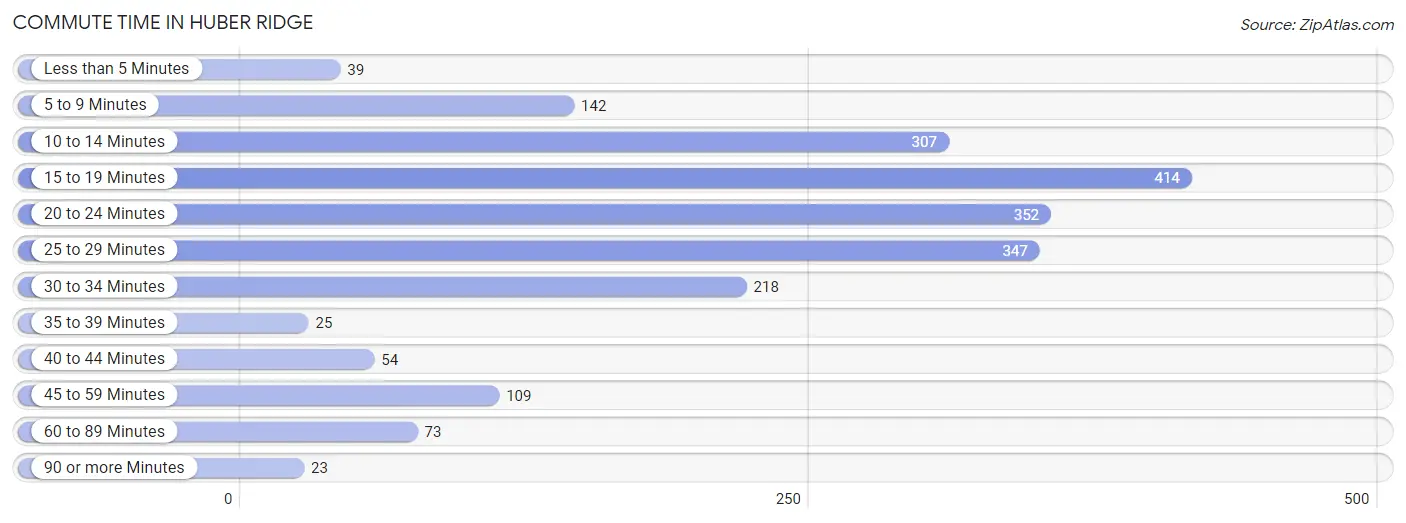
| Commute Time | # Commuters | % Commuters |
| Less than 5 Minutes | 39 | 1.8% |
| 5 to 9 Minutes | 142 | 6.8% |
| 10 to 14 Minutes | 307 | 14.6% |
| 15 to 19 Minutes | 414 | 19.7% |
| 20 to 24 Minutes | 352 | 16.7% |
| 25 to 29 Minutes | 347 | 16.5% |
| 30 to 34 Minutes | 218 | 10.4% |
| 35 to 39 Minutes | 25 | 1.2% |
| 40 to 44 Minutes | 54 | 2.6% |
| 45 to 59 Minutes | 109 | 5.2% |
| 60 to 89 Minutes | 73 | 3.5% |
| 90 or more Minutes | 23 | 1.1% |
Commute Time by Sex in Huber Ridge
The most common commute times in Huber Ridge are 25 to 29 minutes (235 commuters, 22.4%) for males and 15 to 19 minutes (289 commuters, 27.5%) for females.
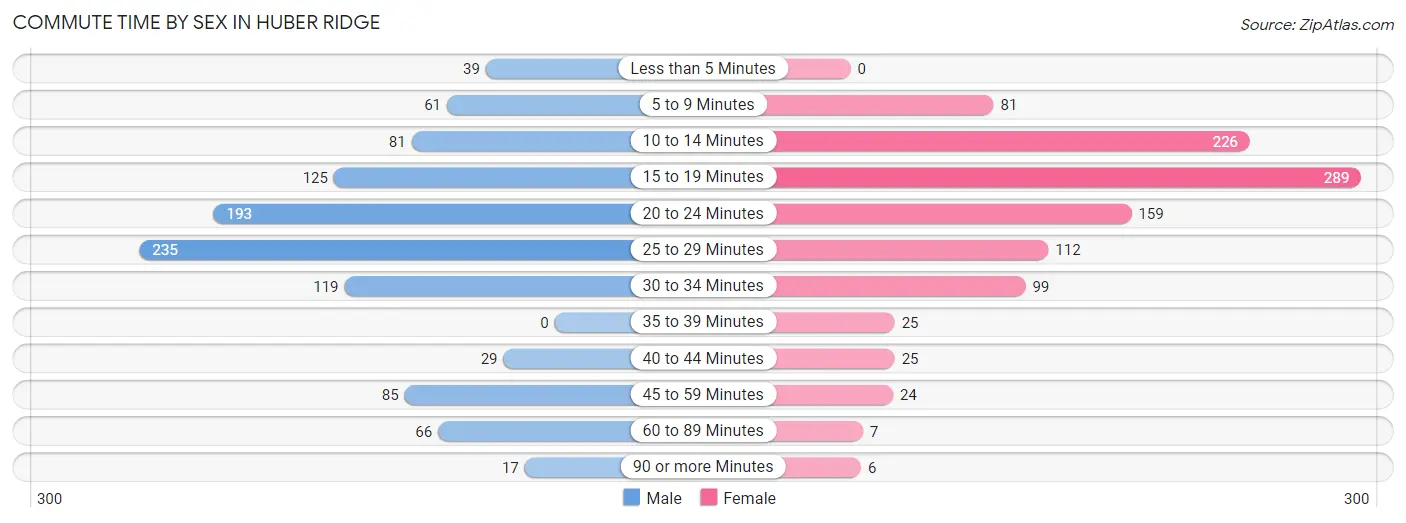
| Commute Time | Male | Female |
| Less than 5 Minutes | 39 (3.7%) | 0 (0.0%) |
| 5 to 9 Minutes | 61 (5.8%) | 81 (7.7%) |
| 10 to 14 Minutes | 81 (7.7%) | 226 (21.5%) |
| 15 to 19 Minutes | 125 (11.9%) | 289 (27.5%) |
| 20 to 24 Minutes | 193 (18.4%) | 159 (15.1%) |
| 25 to 29 Minutes | 235 (22.4%) | 112 (10.6%) |
| 30 to 34 Minutes | 119 (11.3%) | 99 (9.4%) |
| 35 to 39 Minutes | 0 (0.0%) | 25 (2.4%) |
| 40 to 44 Minutes | 29 (2.8%) | 25 (2.4%) |
| 45 to 59 Minutes | 85 (8.1%) | 24 (2.3%) |
| 60 to 89 Minutes | 66 (6.3%) | 7 (0.7%) |
| 90 or more Minutes | 17 (1.6%) | 6 (0.6%) |
Time of Departure to Work by Sex in Huber Ridge
The most frequent times of departure to work in Huber Ridge are 12:00 AM to 4:59 AM (137, 13.1%) for males and 6:30 AM to 6:59 AM (171, 16.2%) for females.
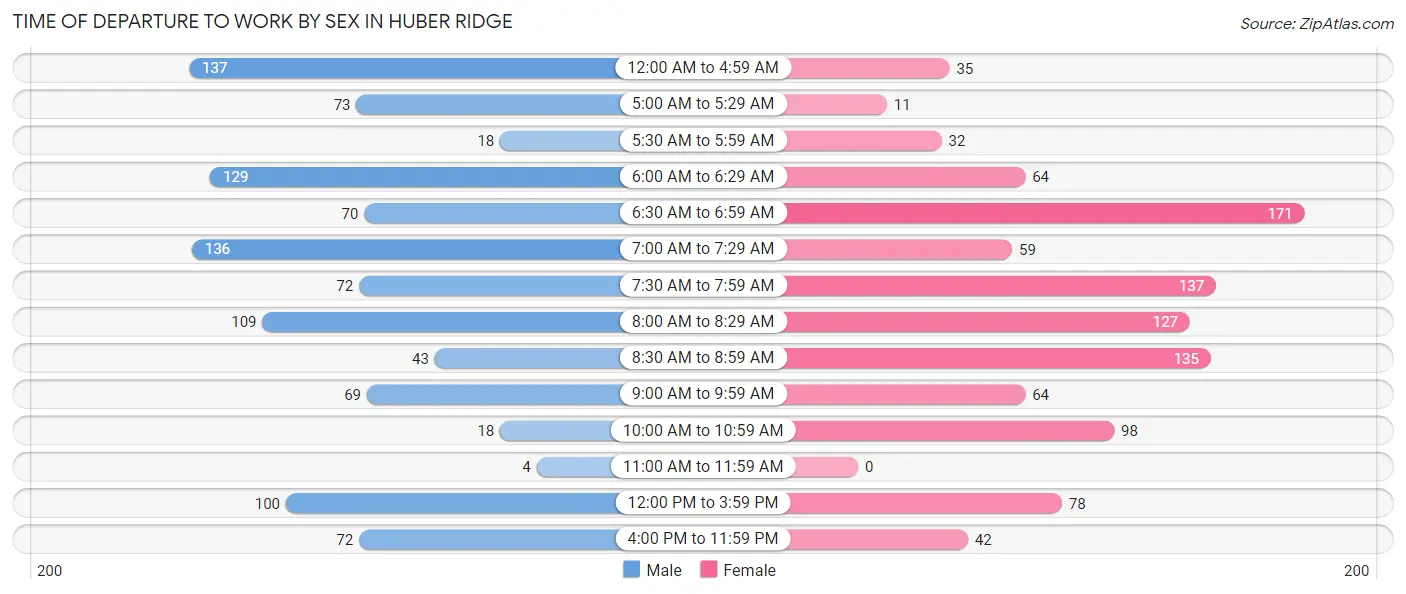
| Time of Departure | Male | Female |
| 12:00 AM to 4:59 AM | 137 (13.1%) | 35 (3.3%) |
| 5:00 AM to 5:29 AM | 73 (7.0%) | 11 (1.0%) |
| 5:30 AM to 5:59 AM | 18 (1.7%) | 32 (3.0%) |
| 6:00 AM to 6:29 AM | 129 (12.3%) | 64 (6.1%) |
| 6:30 AM to 6:59 AM | 70 (6.7%) | 171 (16.2%) |
| 7:00 AM to 7:29 AM | 136 (13.0%) | 59 (5.6%) |
| 7:30 AM to 7:59 AM | 72 (6.9%) | 137 (13.0%) |
| 8:00 AM to 8:29 AM | 109 (10.4%) | 127 (12.1%) |
| 8:30 AM to 8:59 AM | 43 (4.1%) | 135 (12.8%) |
| 9:00 AM to 9:59 AM | 69 (6.6%) | 64 (6.1%) |
| 10:00 AM to 10:59 AM | 18 (1.7%) | 98 (9.3%) |
| 11:00 AM to 11:59 AM | 4 (0.4%) | 0 (0.0%) |
| 12:00 PM to 3:59 PM | 100 (9.5%) | 78 (7.4%) |
| 4:00 PM to 11:59 PM | 72 (6.9%) | 42 (4.0%) |
| Total | 1,050 (100.0%) | 1,053 (100.0%) |
Housing Occupancy in Huber Ridge
Occupancy by Ownership in Huber Ridge
Of the total 1,589 dwellings in Huber Ridge, owner-occupied units account for 1,168 (73.5%), while renter-occupied units make up 421 (26.5%).
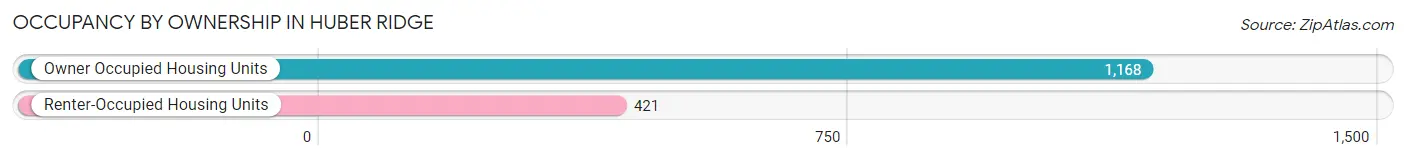
| Occupancy | # Housing Units | % Housing Units |
| Owner Occupied Housing Units | 1,168 | 73.5% |
| Renter-Occupied Housing Units | 421 | 26.5% |
| Total Occupied Housing Units | 1,589 | 100.0% |
Occupancy by Household Size in Huber Ridge
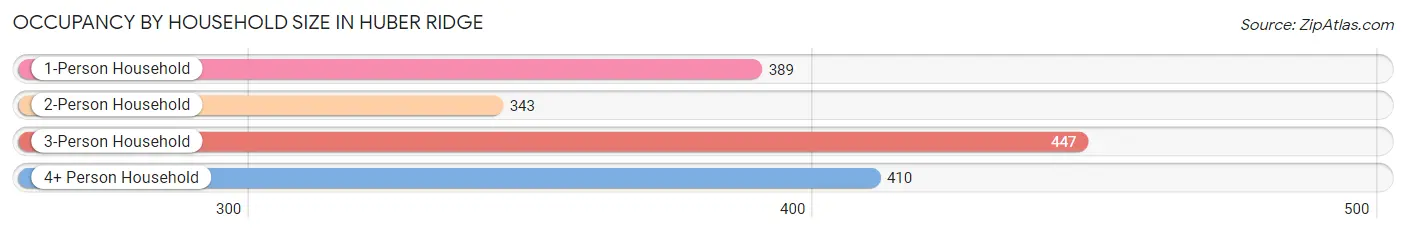
| Household Size | # Housing Units | % Housing Units |
| 1-Person Household | 389 | 24.5% |
| 2-Person Household | 343 | 21.6% |
| 3-Person Household | 447 | 28.1% |
| 4+ Person Household | 410 | 25.8% |
| Total Housing Units | 1,589 | 100.0% |
Occupancy by Ownership by Household Size in Huber Ridge
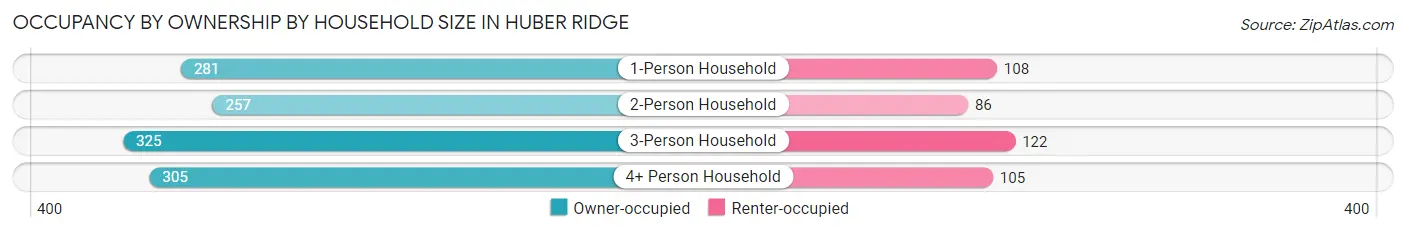
| Household Size | Owner-occupied | Renter-occupied |
| 1-Person Household | 281 (72.2%) | 108 (27.8%) |
| 2-Person Household | 257 (74.9%) | 86 (25.1%) |
| 3-Person Household | 325 (72.7%) | 122 (27.3%) |
| 4+ Person Household | 305 (74.4%) | 105 (25.6%) |
| Total Housing Units | 1,168 (73.5%) | 421 (26.5%) |
Occupancy by Educational Attainment in Huber Ridge
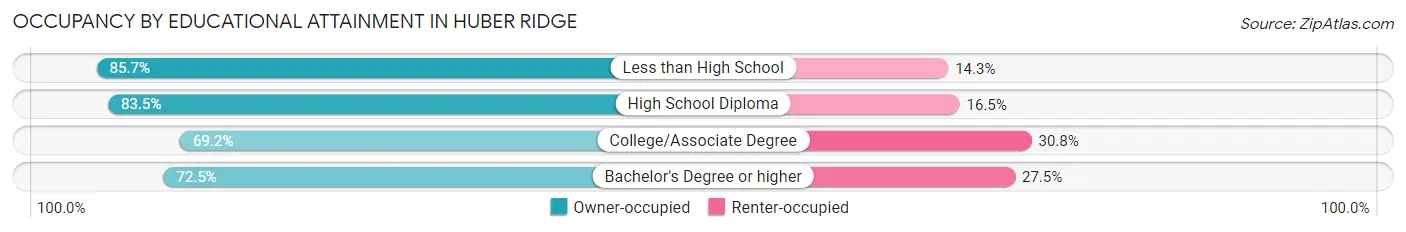
| Household Size | Owner-occupied | Renter-occupied |
| Less than High School | 42 (85.7%) | 7 (14.3%) |
| High School Diploma | 227 (83.5%) | 45 (16.5%) |
| College/Associate Degree | 420 (69.2%) | 187 (30.8%) |
| Bachelor's Degree or higher | 479 (72.5%) | 182 (27.5%) |
Occupancy by Age of Householder in Huber Ridge
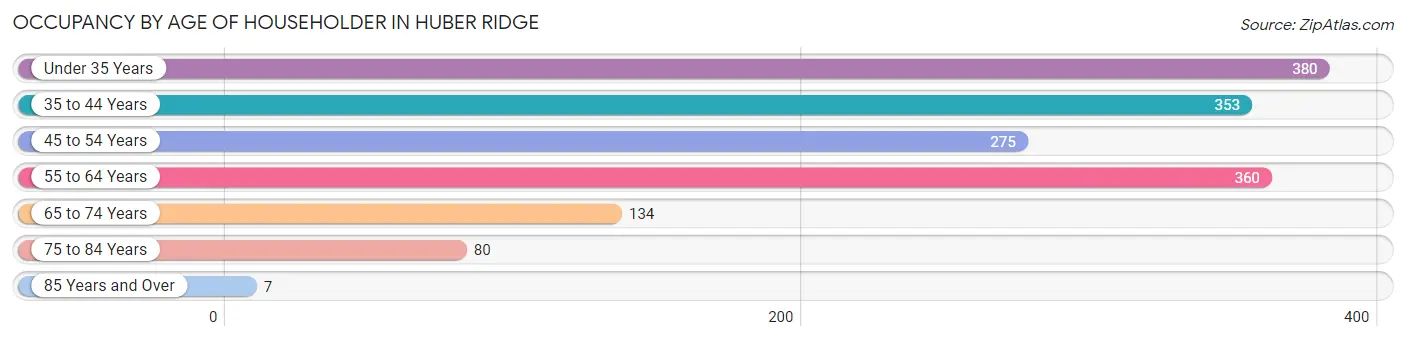
| Age Bracket | # Households | % Households |
| Under 35 Years | 380 | 23.9% |
| 35 to 44 Years | 353 | 22.2% |
| 45 to 54 Years | 275 | 17.3% |
| 55 to 64 Years | 360 | 22.7% |
| 65 to 74 Years | 134 | 8.4% |
| 75 to 84 Years | 80 | 5.0% |
| 85 Years and Over | 7 | 0.4% |
| Total | 1,589 | 100.0% |
Housing Finances in Huber Ridge
Median Income by Occupancy in Huber Ridge
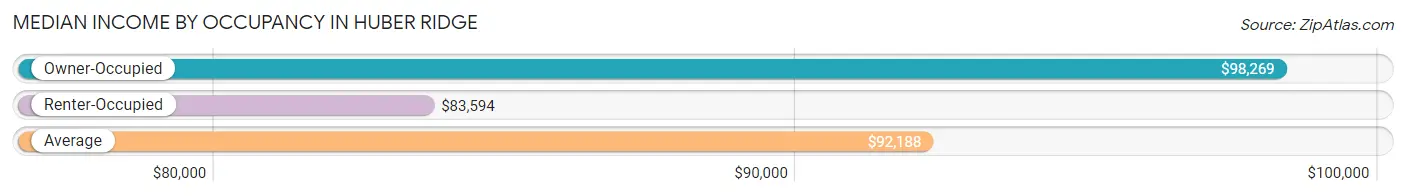
| Occupancy Type | # Households | Median Income |
| Owner-Occupied | 1,168 (73.5%) | $98,269 |
| Renter-Occupied | 421 (26.5%) | $83,594 |
| Average | 1,589 (100.0%) | $92,188 |
Occupancy by Householder Income Bracket in Huber Ridge
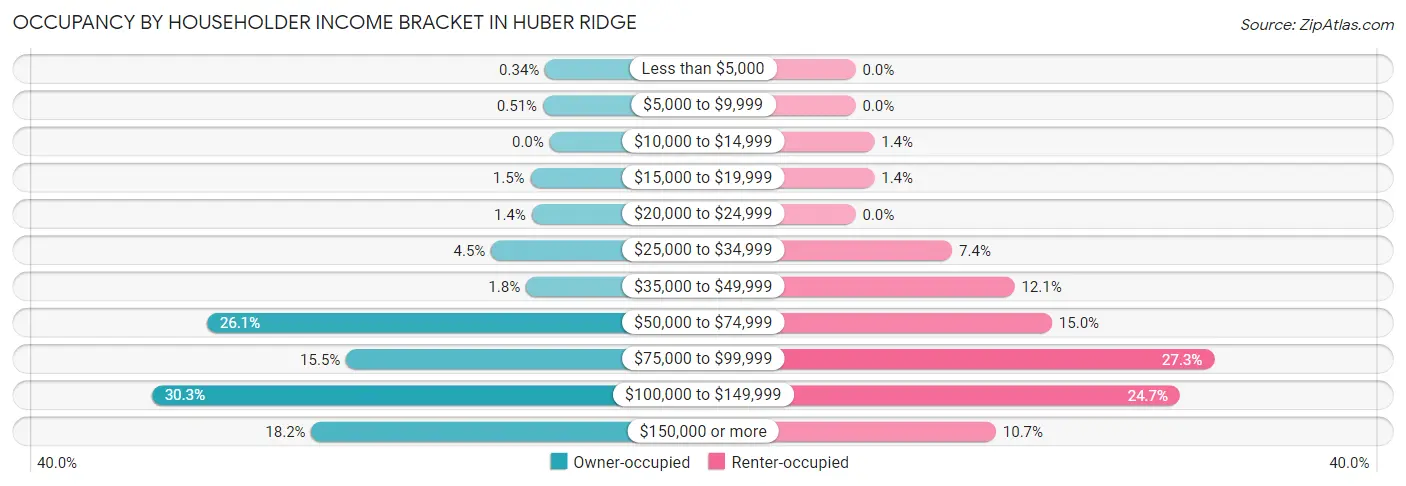
| Income Bracket | Owner-occupied | Renter-occupied |
| Less than $5,000 | 4 (0.3%) | 0 (0.0%) |
| $5,000 to $9,999 | 6 (0.5%) | 0 (0.0%) |
| $10,000 to $14,999 | 0 (0.0%) | 6 (1.4%) |
| $15,000 to $19,999 | 17 (1.5%) | 6 (1.4%) |
| $20,000 to $24,999 | 16 (1.4%) | 0 (0.0%) |
| $25,000 to $34,999 | 52 (4.4%) | 31 (7.4%) |
| $35,000 to $49,999 | 21 (1.8%) | 51 (12.1%) |
| $50,000 to $74,999 | 305 (26.1%) | 63 (15.0%) |
| $75,000 to $99,999 | 181 (15.5%) | 115 (27.3%) |
| $100,000 to $149,999 | 354 (30.3%) | 104 (24.7%) |
| $150,000 or more | 212 (18.1%) | 45 (10.7%) |
| Total | 1,168 (100.0%) | 421 (100.0%) |
Monthly Housing Cost Tiers in Huber Ridge
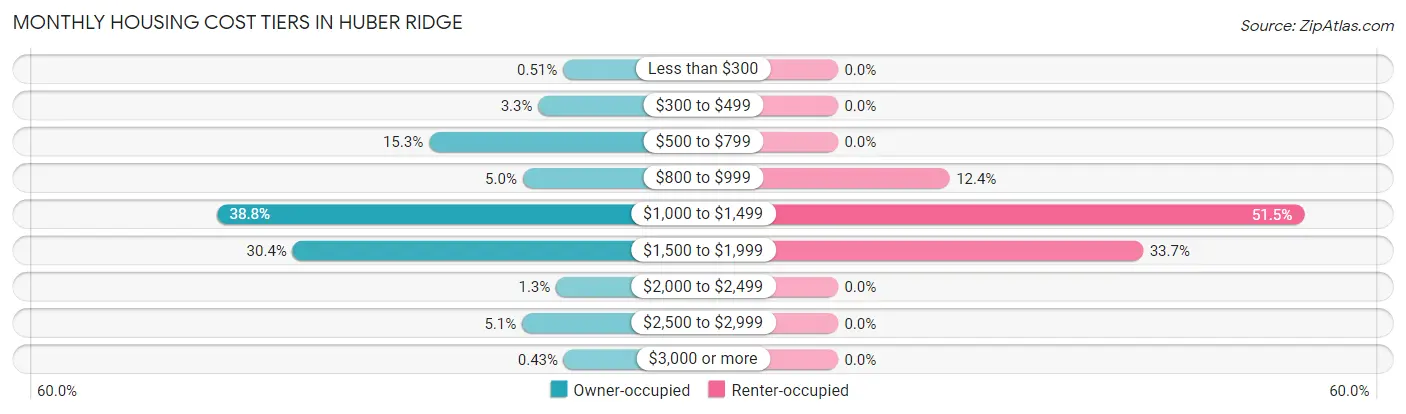
| Monthly Cost | Owner-occupied | Renter-occupied |
| Less than $300 | 6 (0.5%) | 0 (0.0%) |
| $300 to $499 | 38 (3.3%) | 0 (0.0%) |
| $500 to $799 | 179 (15.3%) | 0 (0.0%) |
| $800 to $999 | 58 (5.0%) | 52 (12.3%) |
| $1,000 to $1,499 | 453 (38.8%) | 217 (51.5%) |
| $1,500 to $1,999 | 355 (30.4%) | 142 (33.7%) |
| $2,000 to $2,499 | 15 (1.3%) | 0 (0.0%) |
| $2,500 to $2,999 | 59 (5.1%) | 0 (0.0%) |
| $3,000 or more | 5 (0.4%) | 0 (0.0%) |
| Total | 1,168 (100.0%) | 421 (100.0%) |
Physical Housing Characteristics in Huber Ridge
Housing Structures in Huber Ridge
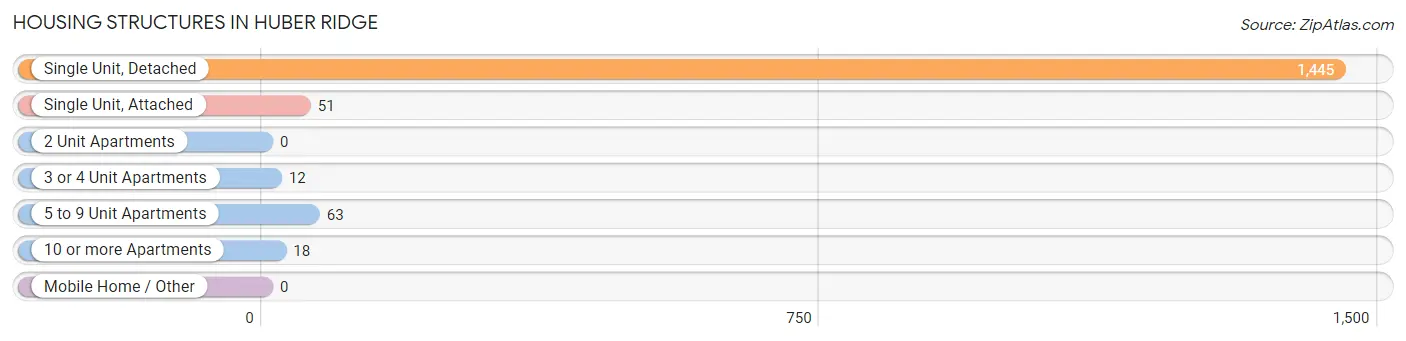
| Structure Type | # Housing Units | % Housing Units |
| Single Unit, Detached | 1,445 | 90.9% |
| Single Unit, Attached | 51 | 3.2% |
| 2 Unit Apartments | 0 | 0.0% |
| 3 or 4 Unit Apartments | 12 | 0.8% |
| 5 to 9 Unit Apartments | 63 | 4.0% |
| 10 or more Apartments | 18 | 1.1% |
| Mobile Home / Other | 0 | 0.0% |
| Total | 1,589 | 100.0% |
Housing Structures by Occupancy in Huber Ridge
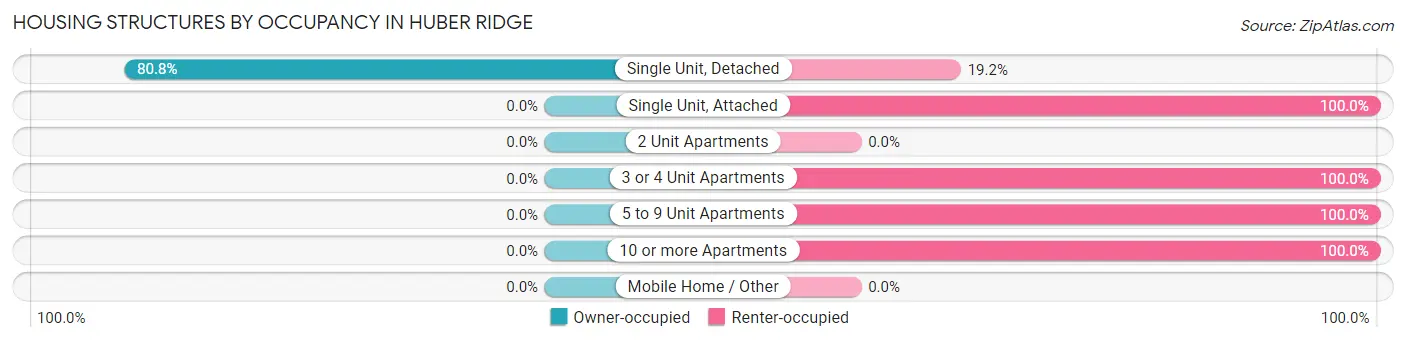
| Structure Type | Owner-occupied | Renter-occupied |
| Single Unit, Detached | 1,168 (80.8%) | 277 (19.2%) |
| Single Unit, Attached | 0 (0.0%) | 51 (100.0%) |
| 2 Unit Apartments | 0 (0.0%) | 0 (0.0%) |
| 3 or 4 Unit Apartments | 0 (0.0%) | 12 (100.0%) |
| 5 to 9 Unit Apartments | 0 (0.0%) | 63 (100.0%) |
| 10 or more Apartments | 0 (0.0%) | 18 (100.0%) |
| Mobile Home / Other | 0 (0.0%) | 0 (0.0%) |
| Total | 1,168 (73.5%) | 421 (26.5%) |
Housing Structures by Number of Rooms in Huber Ridge
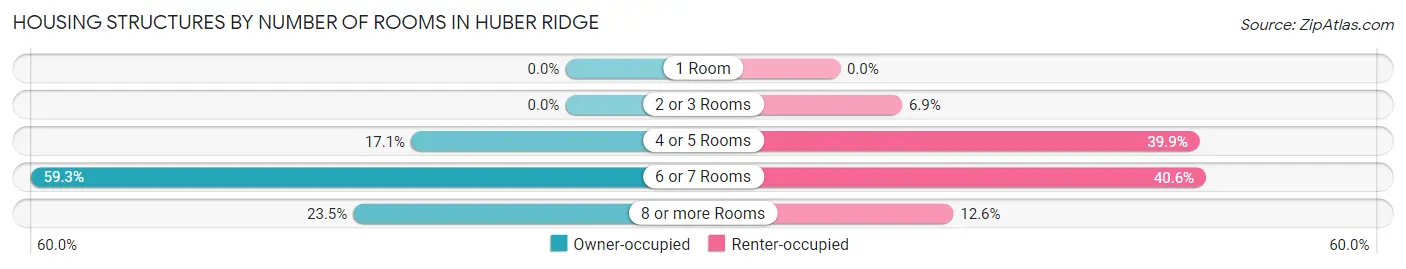
| Number of Rooms | Owner-occupied | Renter-occupied |
| 1 Room | 0 (0.0%) | 0 (0.0%) |
| 2 or 3 Rooms | 0 (0.0%) | 29 (6.9%) |
| 4 or 5 Rooms | 200 (17.1%) | 168 (39.9%) |
| 6 or 7 Rooms | 693 (59.3%) | 171 (40.6%) |
| 8 or more Rooms | 275 (23.5%) | 53 (12.6%) |
| Total | 1,168 (100.0%) | 421 (100.0%) |
Housing Structure by Heating Type in Huber Ridge
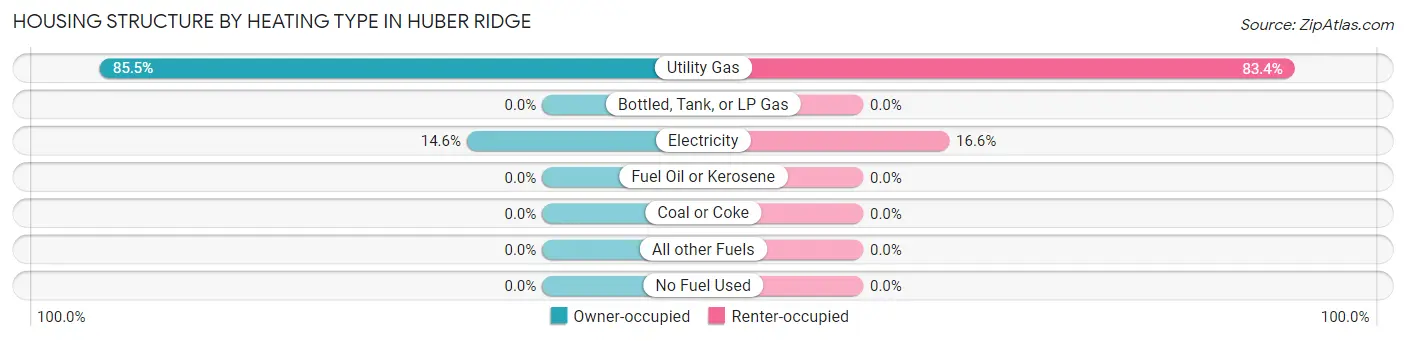
| Heating Type | Owner-occupied | Renter-occupied |
| Utility Gas | 998 (85.5%) | 351 (83.4%) |
| Bottled, Tank, or LP Gas | 0 (0.0%) | 0 (0.0%) |
| Electricity | 170 (14.5%) | 70 (16.6%) |
| Fuel Oil or Kerosene | 0 (0.0%) | 0 (0.0%) |
| Coal or Coke | 0 (0.0%) | 0 (0.0%) |
| All other Fuels | 0 (0.0%) | 0 (0.0%) |
| No Fuel Used | 0 (0.0%) | 0 (0.0%) |
| Total | 1,168 (100.0%) | 421 (100.0%) |
Household Vehicle Usage in Huber Ridge
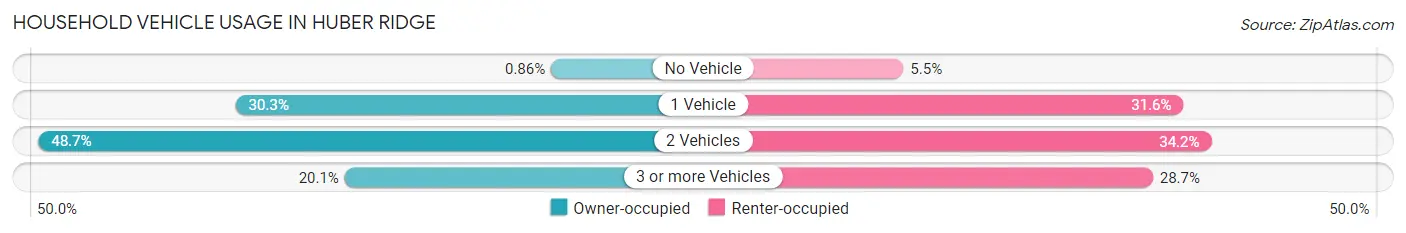
| Vehicles per Household | Owner-occupied | Renter-occupied |
| No Vehicle | 10 (0.9%) | 23 (5.5%) |
| 1 Vehicle | 354 (30.3%) | 133 (31.6%) |
| 2 Vehicles | 569 (48.7%) | 144 (34.2%) |
| 3 or more Vehicles | 235 (20.1%) | 121 (28.7%) |
| Total | 1,168 (100.0%) | 421 (100.0%) |
Real Estate & Mortgages in Huber Ridge
Real Estate and Mortgage Overview in Huber Ridge
| Characteristic | Without Mortgage | With Mortgage |
| Housing Units | 235 | 933 |
| Median Property Value | $182,800 | $193,800 |
| Median Household Income | $73,380 | $197 |
| Monthly Housing Costs | $618 | $5 |
| Real Estate Taxes | $4,086 | $0 |
Property Value by Mortgage Status in Huber Ridge
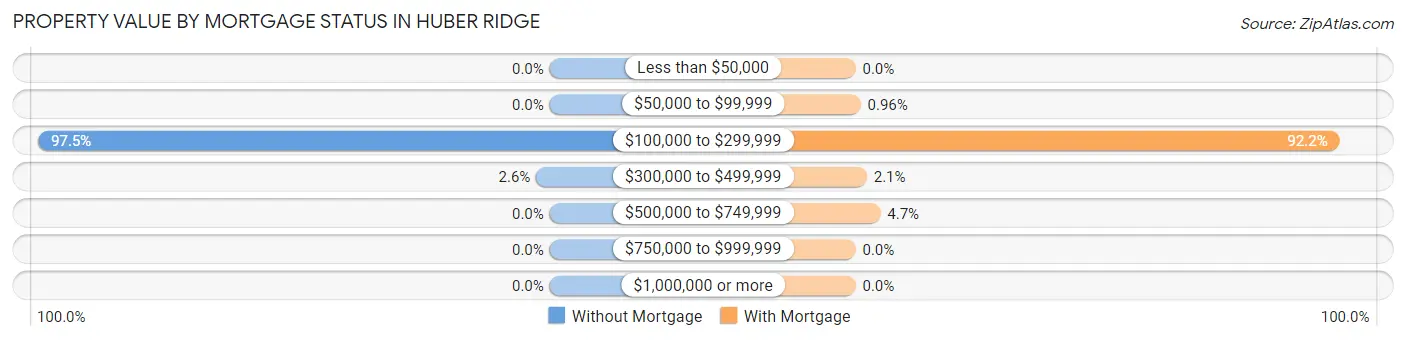
| Property Value | Without Mortgage | With Mortgage |
| Less than $50,000 | 0 (0.0%) | 0 (0.0%) |
| $50,000 to $99,999 | 0 (0.0%) | 9 (1.0%) |
| $100,000 to $299,999 | 229 (97.5%) | 860 (92.2%) |
| $300,000 to $499,999 | 6 (2.5%) | 20 (2.1%) |
| $500,000 to $749,999 | 0 (0.0%) | 44 (4.7%) |
| $750,000 to $999,999 | 0 (0.0%) | 0 (0.0%) |
| $1,000,000 or more | 0 (0.0%) | 0 (0.0%) |
| Total | 235 (100.0%) | 933 (100.0%) |
Household Income by Mortgage Status in Huber Ridge
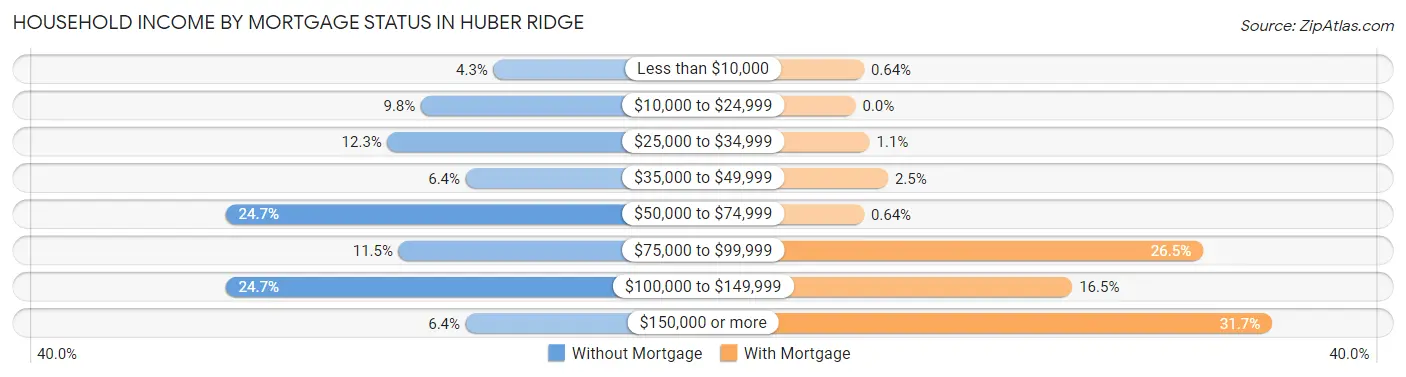
| Household Income | Without Mortgage | With Mortgage |
| Less than $10,000 | 10 (4.3%) | 6 (0.6%) |
| $10,000 to $24,999 | 23 (9.8%) | 0 (0.0%) |
| $25,000 to $34,999 | 29 (12.3%) | 10 (1.1%) |
| $35,000 to $49,999 | 15 (6.4%) | 23 (2.5%) |
| $50,000 to $74,999 | 58 (24.7%) | 6 (0.6%) |
| $75,000 to $99,999 | 27 (11.5%) | 247 (26.5%) |
| $100,000 to $149,999 | 58 (24.7%) | 154 (16.5%) |
| $150,000 or more | 15 (6.4%) | 296 (31.7%) |
| Total | 235 (100.0%) | 933 (100.0%) |
Property Value to Household Income Ratio in Huber Ridge
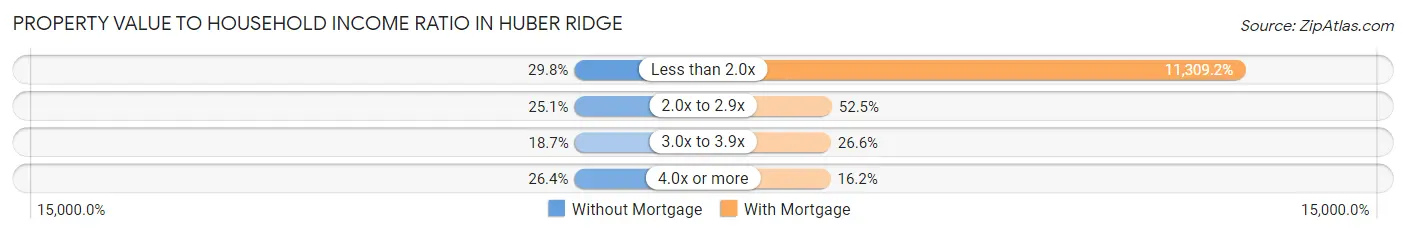
| Value-to-Income Ratio | Without Mortgage | With Mortgage |
| Less than 2.0x | 70 (29.8%) | 105,515 (11,309.2%) |
| 2.0x to 2.9x | 59 (25.1%) | 490 (52.5%) |
| 3.0x to 3.9x | 44 (18.7%) | 248 (26.6%) |
| 4.0x or more | 62 (26.4%) | 151 (16.2%) |
| Total | 235 (100.0%) | 933 (100.0%) |
Real Estate Taxes by Mortgage Status in Huber Ridge
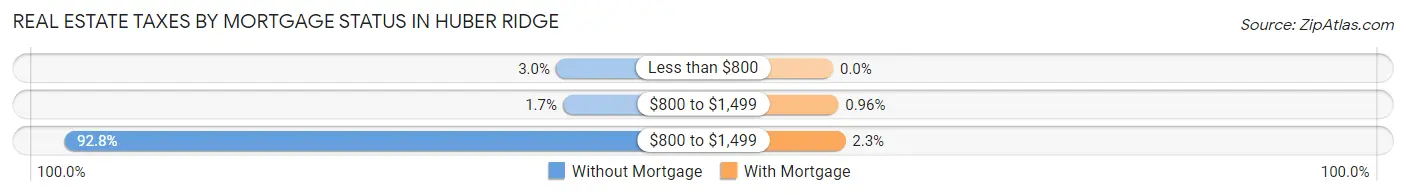
| Property Taxes | Without Mortgage | With Mortgage |
| Less than $800 | 7 (3.0%) | 0 (0.0%) |
| $800 to $1,499 | 4 (1.7%) | 9 (1.0%) |
| $800 to $1,499 | 218 (92.8%) | 21 (2.2%) |
| Total | 235 (100.0%) | 933 (100.0%) |
Health & Disability in Huber Ridge
Health Insurance Coverage by Age in Huber Ridge
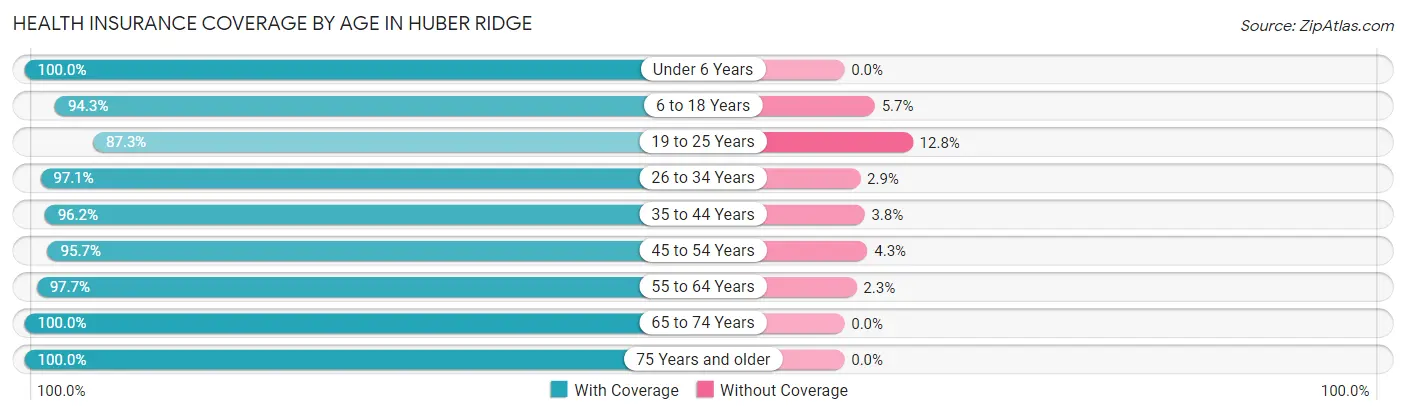
| Age Bracket | With Coverage | Without Coverage |
| Under 6 Years | 430 (100.0%) | 0 (0.0%) |
| 6 to 18 Years | 748 (94.3%) | 45 (5.7%) |
| 19 to 25 Years | 219 (87.3%) | 32 (12.8%) |
| 26 to 34 Years | 694 (97.1%) | 21 (2.9%) |
| 35 to 44 Years | 666 (96.2%) | 26 (3.8%) |
| 45 to 54 Years | 467 (95.7%) | 21 (4.3%) |
| 55 to 64 Years | 519 (97.7%) | 12 (2.3%) |
| 65 to 74 Years | 272 (100.0%) | 0 (0.0%) |
| 75 Years and older | 130 (100.0%) | 0 (0.0%) |
| Total | 4,145 (96.4%) | 157 (3.6%) |
Health Insurance Coverage by Citizenship Status in Huber Ridge
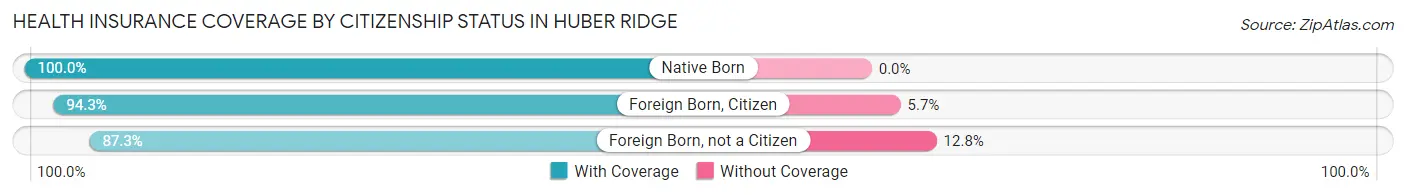
| Citizenship Status | With Coverage | Without Coverage |
| Native Born | 430 (100.0%) | 0 (0.0%) |
| Foreign Born, Citizen | 748 (94.3%) | 45 (5.7%) |
| Foreign Born, not a Citizen | 219 (87.3%) | 32 (12.8%) |
Health Insurance Coverage by Household Income in Huber Ridge
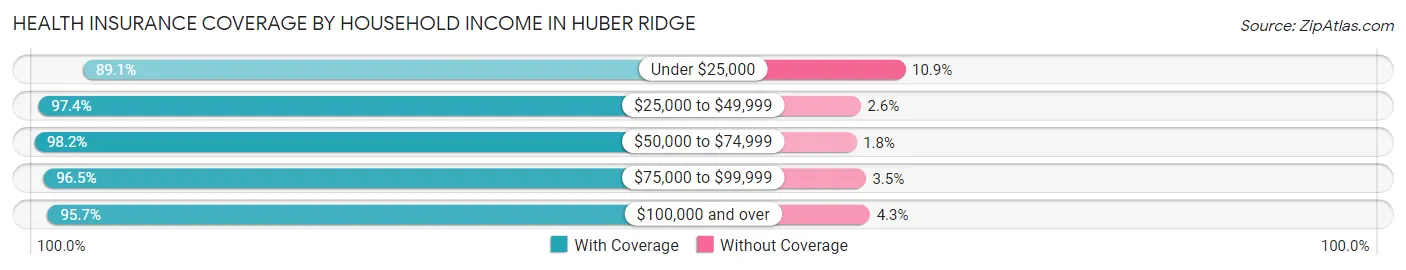
| Household Income | With Coverage | Without Coverage |
| Under $25,000 | 49 (89.1%) | 6 (10.9%) |
| $25,000 to $49,999 | 265 (97.4%) | 7 (2.6%) |
| $50,000 to $74,999 | 725 (98.2%) | 13 (1.8%) |
| $75,000 to $99,999 | 938 (96.5%) | 34 (3.5%) |
| $100,000 and over | 2,162 (95.7%) | 97 (4.3%) |
Public vs Private Health Insurance Coverage by Age in Huber Ridge
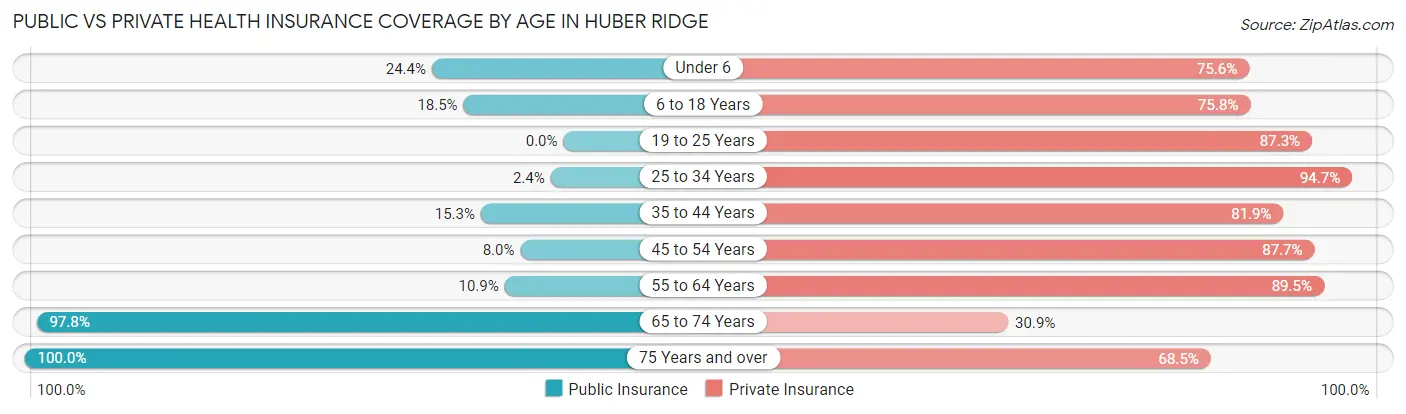
| Age Bracket | Public Insurance | Private Insurance |
| Under 6 | 105 (24.4%) | 325 (75.6%) |
| 6 to 18 Years | 147 (18.5%) | 601 (75.8%) |
| 19 to 25 Years | 0 (0.0%) | 219 (87.3%) |
| 25 to 34 Years | 17 (2.4%) | 677 (94.7%) |
| 35 to 44 Years | 106 (15.3%) | 567 (81.9%) |
| 45 to 54 Years | 39 (8.0%) | 428 (87.7%) |
| 55 to 64 Years | 58 (10.9%) | 475 (89.4%) |
| 65 to 74 Years | 266 (97.8%) | 84 (30.9%) |
| 75 Years and over | 130 (100.0%) | 89 (68.5%) |
| Total | 868 (20.2%) | 3,465 (80.5%) |
Disability Status by Sex by Age in Huber Ridge
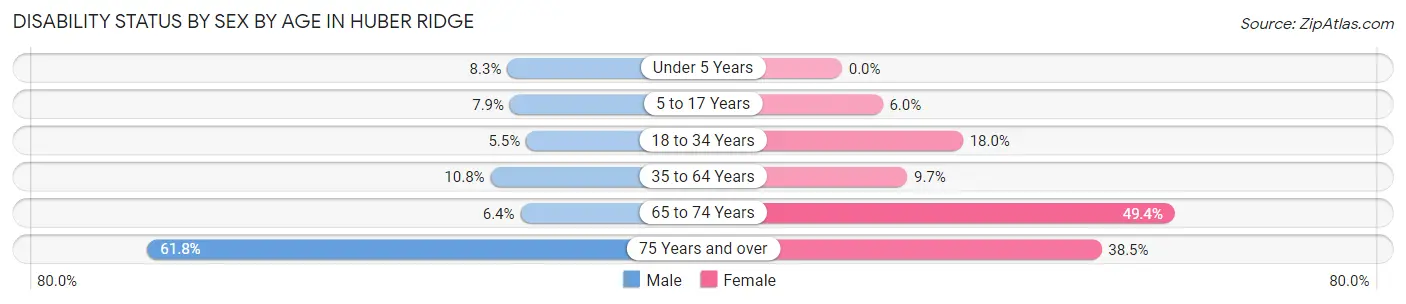
| Age Bracket | Male | Female |
| Under 5 Years | 18 (8.3%) | 0 (0.0%) |
| 5 to 17 Years | 22 (7.9%) | 32 (6.0%) |
| 18 to 34 Years | 23 (5.5%) | 105 (17.9%) |
| 35 to 64 Years | 97 (10.8%) | 79 (9.7%) |
| 65 to 74 Years | 6 (6.4%) | 88 (49.4%) |
| 75 Years and over | 21 (61.8%) | 37 (38.5%) |
Disability Class by Sex by Age in Huber Ridge
Disability Class: Hearing Difficulty
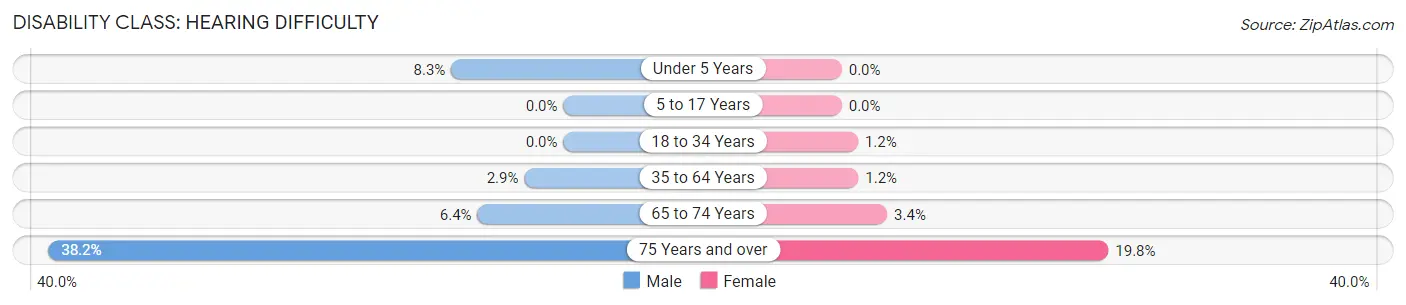
| Age Bracket | Male | Female |
| Under 5 Years | 18 (8.3%) | 0 (0.0%) |
| 5 to 17 Years | 0 (0.0%) | 0 (0.0%) |
| 18 to 34 Years | 0 (0.0%) | 7 (1.2%) |
| 35 to 64 Years | 26 (2.9%) | 10 (1.2%) |
| 65 to 74 Years | 6 (6.4%) | 6 (3.4%) |
| 75 Years and over | 13 (38.2%) | 19 (19.8%) |
Disability Class: Vision Difficulty
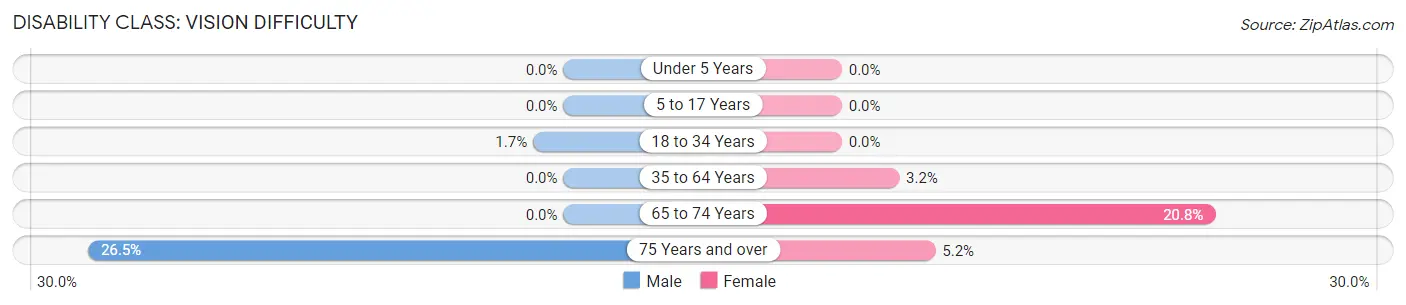
| Age Bracket | Male | Female |
| Under 5 Years | 0 (0.0%) | 0 (0.0%) |
| 5 to 17 Years | 0 (0.0%) | 0 (0.0%) |
| 18 to 34 Years | 7 (1.7%) | 0 (0.0%) |
| 35 to 64 Years | 0 (0.0%) | 26 (3.2%) |
| 65 to 74 Years | 0 (0.0%) | 37 (20.8%) |
| 75 Years and over | 9 (26.5%) | 5 (5.2%) |
Disability Class: Cognitive Difficulty
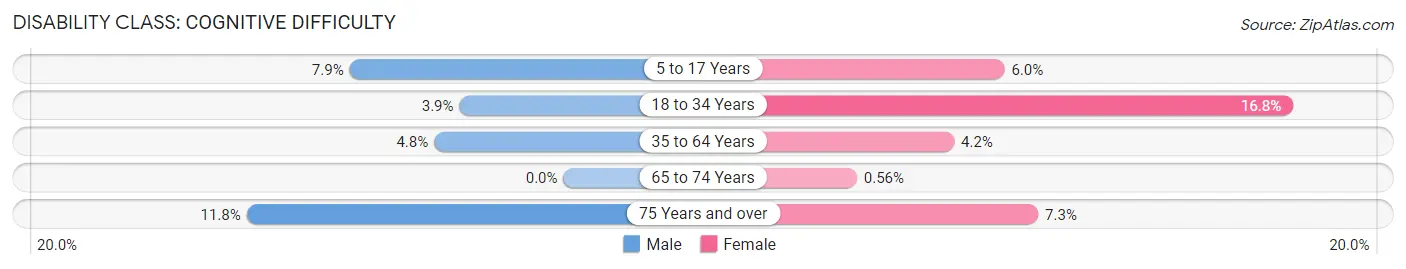
| Age Bracket | Male | Female |
| 5 to 17 Years | 22 (7.9%) | 32 (6.0%) |
| 18 to 34 Years | 16 (3.9%) | 98 (16.8%) |
| 35 to 64 Years | 43 (4.8%) | 34 (4.2%) |
| 65 to 74 Years | 0 (0.0%) | 1 (0.6%) |
| 75 Years and over | 4 (11.8%) | 7 (7.3%) |
Disability Class: Ambulatory Difficulty
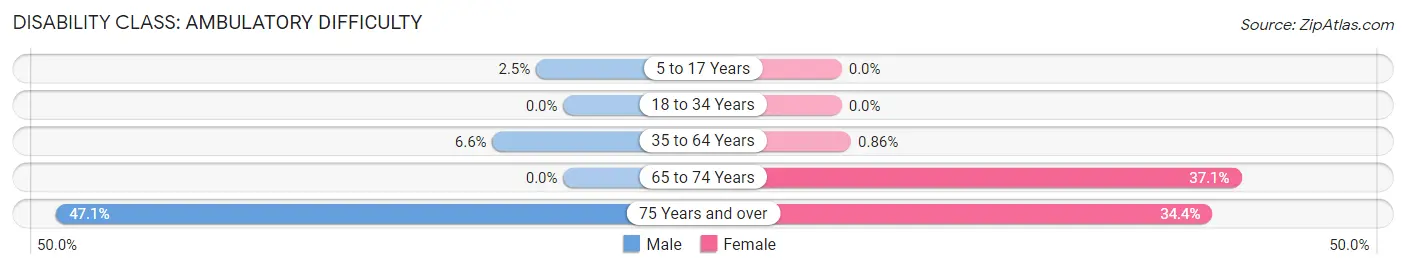
| Age Bracket | Male | Female |
| 5 to 17 Years | 7 (2.5%) | 0 (0.0%) |
| 18 to 34 Years | 0 (0.0%) | 0 (0.0%) |
| 35 to 64 Years | 59 (6.6%) | 7 (0.9%) |
| 65 to 74 Years | 0 (0.0%) | 66 (37.1%) |
| 75 Years and over | 16 (47.1%) | 33 (34.4%) |
Disability Class: Self-Care Difficulty
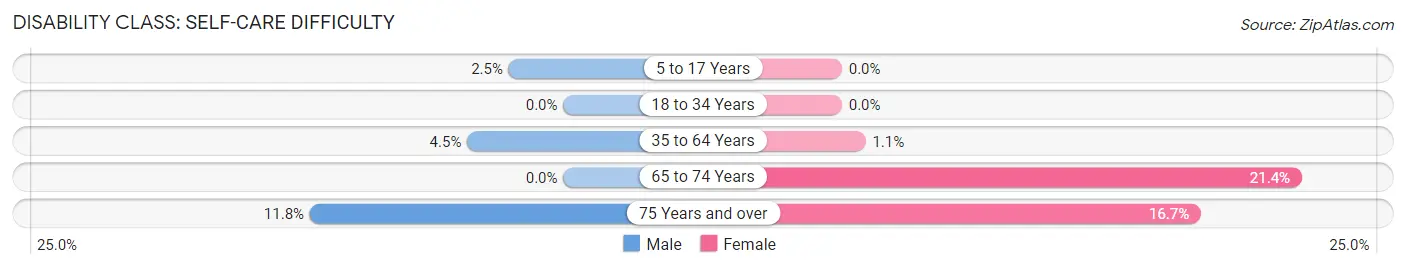
| Age Bracket | Male | Female |
| 5 to 17 Years | 7 (2.5%) | 0 (0.0%) |
| 18 to 34 Years | 0 (0.0%) | 0 (0.0%) |
| 35 to 64 Years | 40 (4.5%) | 9 (1.1%) |
| 65 to 74 Years | 0 (0.0%) | 38 (21.3%) |
| 75 Years and over | 4 (11.8%) | 16 (16.7%) |
Technology Access in Huber Ridge
Computing Device Access in Huber Ridge
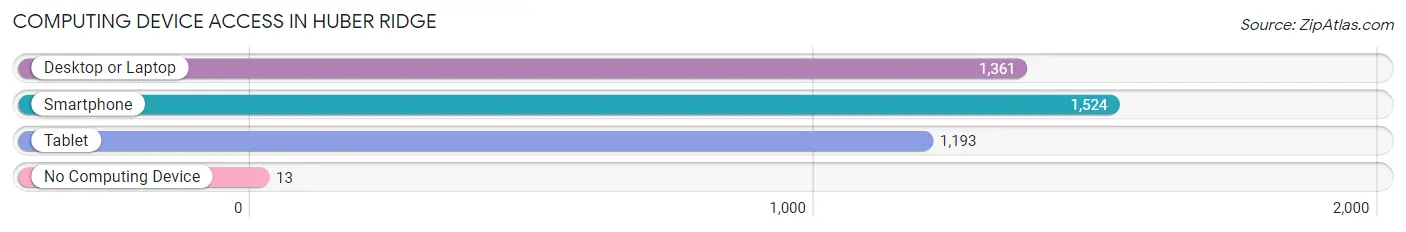
| Device Type | # Households | % Households |
| Desktop or Laptop | 1,361 | 85.7% |
| Smartphone | 1,524 | 95.9% |
| Tablet | 1,193 | 75.1% |
| No Computing Device | 13 | 0.8% |
| Total | 1,589 | 100.0% |
Internet Access in Huber Ridge
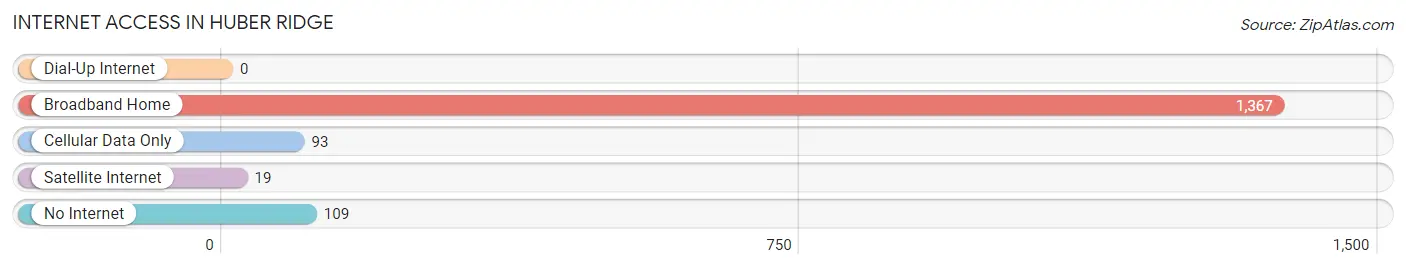
| Internet Type | # Households | % Households |
| Dial-Up Internet | 0 | 0.0% |
| Broadband Home | 1,367 | 86.0% |
| Cellular Data Only | 93 | 5.9% |
| Satellite Internet | 19 | 1.2% |
| No Internet | 109 | 6.9% |
| Total | 1,589 | 100.0% |
Huber Ridge Summary
Huber Ridge is a small unincorporated community located in Franklin County, Ohio. It is situated in the northwest corner of the county, just south of the city of Columbus. The community is bordered by the cities of Westerville and Gahanna to the north, and Reynoldsburg to the south. Huber Ridge is part of the Columbus Metropolitan Statistical Area.
History
Huber Ridge was founded in 1817 by Jacob Huber, a German immigrant who had settled in the area. Huber purchased a large tract of land in the area and began to develop it for farming. He built a log cabin and a grist mill, and the area soon became known as Huber's Ridge. The community grew slowly over the years, and by the early 1900s, it had become a small farming community.
In the 1950s, Huber Ridge began to experience rapid growth as the city of Columbus expanded outward. The area was annexed by the city of Columbus in 1959, and the population of Huber Ridge increased significantly. By the 2000 census, the population of Huber Ridge had grown to over 4,000.
Geography
Huber Ridge is located in the northwest corner of Franklin County, Ohio. It is situated just south of the city of Columbus, and is bordered by the cities of Westerville and Gahanna to the north, and Reynoldsburg to the south. The community is part of the Columbus Metropolitan Statistical Area.
The terrain of Huber Ridge is mostly flat, with some rolling hills. The area is mostly residential, with some commercial and industrial development. The community is served by several major highways, including Interstate 270, State Route 161, and State Route 3.
Economy
Huber Ridge is primarily a residential community, with some commercial and industrial development. The area is home to several small businesses, including restaurants, retail stores, and professional services. The community is also home to a number of light industrial and manufacturing businesses.
The largest employer in Huber Ridge is the Ohio State University, which is located just south of the community. The university employs over 10,000 people in the area. Other major employers include Nationwide Children's Hospital, OhioHealth, and the City of Columbus.
Demographics
As of the 2010 census, the population of Huber Ridge was 4,541. The racial makeup of the community was 87.3% White, 8.2% African American, 0.7% Asian, 0.3% Native American, and 3.5% from other races. The median household income was $50,945, and the median family income was $60,945.
The population of Huber Ridge is well-educated, with over 90% of adults having at least a high school diploma. The community is also diverse, with over 20% of the population being foreign-born. The largest ethnic groups in the area are German, Irish, and Italian.
Conclusion
Huber Ridge is a small unincorporated community located in Franklin County, Ohio. It is situated in the northwest corner of the county, just south of the city of Columbus. The community is bordered by the cities of Westerville and Gahanna to the north, and Reynoldsburg to the south. Huber Ridge is part of the Columbus Metropolitan Statistical Area. The area is mostly residential, with some commercial and industrial development. The largest employer in Huber Ridge is the Ohio State University, which is located just south of the community. The population of Huber Ridge is well-educated, with over 90% of adults having at least a high school diploma. The community is also diverse, with over 20% of the population being foreign-born.
Common Questions
What is Per Capita Income in Huber Ridge?
Per Capita income in Huber Ridge is $39,069.
What is the Median Family Income in Huber Ridge?
Median Family Income in Huber Ridge is $107,576.
What is the Median Household income in Huber Ridge?
Median Household Income in Huber Ridge is $92,188.
What is Income or Wage Gap in Huber Ridge?
Income or Wage Gap in Huber Ridge is 20.7%.
Women in Huber Ridge earn 79.3 cents for every dollar earned by a man.
What is Inequality or Gini Index in Huber Ridge?
Inequality or Gini Index in Huber Ridge is 0.30.
What is the Total Population of Huber Ridge?
Total Population of Huber Ridge is 4,302.
What is the Total Male Population of Huber Ridge?
Total Male Population of Huber Ridge is 1,932.
What is the Total Female Population of Huber Ridge?
Total Female Population of Huber Ridge is 2,370.
What is the Ratio of Males per 100 Females in Huber Ridge?
There are 81.52 Males per 100 Females in Huber Ridge.
What is the Ratio of Females per 100 Males in Huber Ridge?
There are 122.67 Females per 100 Males in Huber Ridge.
What is the Median Population Age in Huber Ridge?
Median Population Age in Huber Ridge is 34.7 Years.
What is the Average Family Size in Huber Ridge
Average Family Size in Huber Ridge is 3.1 People.
What is the Average Household Size in Huber Ridge
Average Household Size in Huber Ridge is 2.7 People.
How Large is the Labor Force in Huber Ridge?
There are 2,752 People in the Labor Forcein in Huber Ridge.
What is the Percentage of People in the Labor Force in Huber Ridge?
85.4% of People are in the Labor Force in Huber Ridge.
What is the Unemployment Rate in Huber Ridge?
Unemployment Rate in Huber Ridge is 2.0%.