Cleveland, OH Map & Demographics
Cleveland Map
Cleveland Overview
$26,040
PER CAPITA INCOME
$46,784
AVG FAMILY INCOME
$37,271
AVG HOUSEHOLD INCOME
14.9%
WAGE / INCOME GAP [ % ]
85.1¢/ $1
WAGE / INCOME GAP [ $ ]
$11,601
FAMILY INCOME DEFICIT
0.52
INEQUALITY / GINI INDEX
370,365
TOTAL POPULATION
180,693
MALE POPULATION
189,672
FEMALE POPULATION
95.27
MALES / 100 FEMALES
104.97
FEMALES / 100 MALES
36.3
MEDIAN AGE
3.1
AVG FAMILY SIZE
2.1
AVG HOUSEHOLD SIZE
179,251
LABOR FORCE [ PEOPLE ]
59.6%
PERCENT IN LABOR FORCE
11.9%
UNEMPLOYMENT RATE
Cleveland Zip Codes
Income in Cleveland
Income Overview in Cleveland
Per Capita Income in Cleveland is $26,040, while median incomes of families and households are $46,784 and $37,271 respectively.
| Characteristic | Number | Measure |
| Per Capita Income | 370,365 | $26,040 |
| Median Family Income | 75,991 | $46,784 |
| Mean Family Income | 75,991 | $66,346 |
| Median Household Income | 167,829 | $37,271 |
| Mean Household Income | 167,829 | $55,028 |
| Income Deficit | 75,991 | $11,601 |
| Wage / Income Gap (%) | 370,365 | 14.95% |
| Wage / Income Gap ($) | 370,365 | 85.05¢ per $1 |
| Gini / Inequality Index | 370,365 | 0.52 |
Earnings by Sex in Cleveland
Average Earnings in Cleveland are $31,447, $34,038 for men and $28,950 for women, a difference of 14.9%.
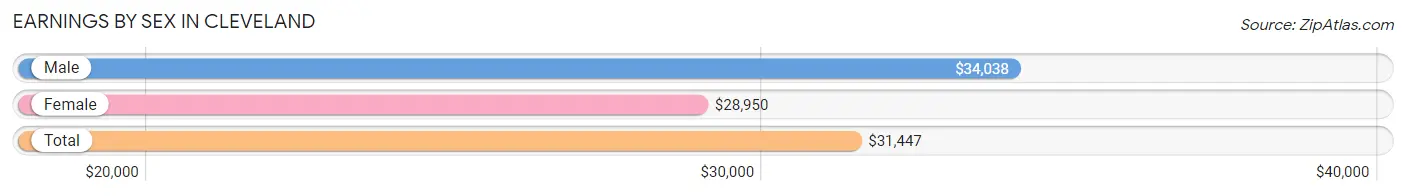
| Sex | Number | Average Earnings |
| Male | 90,093 (49.5%) | $34,038 |
| Female | 92,019 (50.5%) | $28,950 |
| Total | 182,112 (100.0%) | $31,447 |
Earnings by Sex by Income Bracket in Cleveland
The most common earnings brackets in Cleveland are $75,000 to $99,999 for men (6,873 | 7.6%) and $25,000 to $29,999 for women (7,737 | 8.4%).
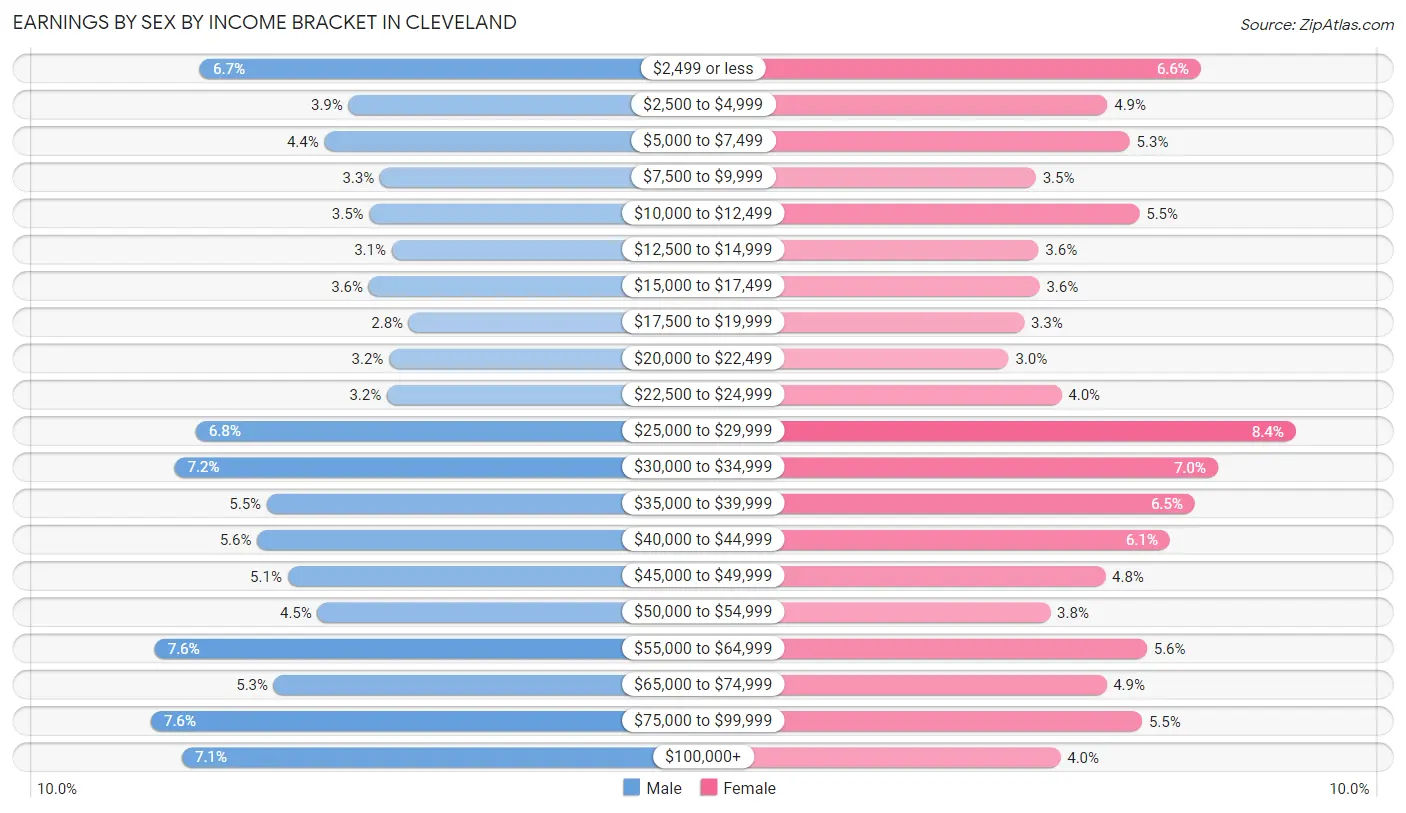
| Income | Male | Female |
| $2,499 or less | 6,049 (6.7%) | 6,102 (6.6%) |
| $2,500 to $4,999 | 3,542 (3.9%) | 4,493 (4.9%) |
| $5,000 to $7,499 | 3,942 (4.4%) | 4,881 (5.3%) |
| $7,500 to $9,999 | 3,012 (3.3%) | 3,257 (3.5%) |
| $10,000 to $12,499 | 3,191 (3.5%) | 5,043 (5.5%) |
| $12,500 to $14,999 | 2,813 (3.1%) | 3,303 (3.6%) |
| $15,000 to $17,499 | 3,198 (3.5%) | 3,325 (3.6%) |
| $17,500 to $19,999 | 2,524 (2.8%) | 3,051 (3.3%) |
| $20,000 to $22,499 | 2,852 (3.2%) | 2,791 (3.0%) |
| $22,500 to $24,999 | 2,896 (3.2%) | 3,701 (4.0%) |
| $25,000 to $29,999 | 6,113 (6.8%) | 7,737 (8.4%) |
| $30,000 to $34,999 | 6,480 (7.2%) | 6,397 (7.0%) |
| $35,000 to $39,999 | 4,922 (5.5%) | 5,996 (6.5%) |
| $40,000 to $44,999 | 5,079 (5.6%) | 5,568 (6.0%) |
| $45,000 to $49,999 | 4,571 (5.1%) | 4,457 (4.8%) |
| $50,000 to $54,999 | 4,067 (4.5%) | 3,505 (3.8%) |
| $55,000 to $64,999 | 6,811 (7.6%) | 5,174 (5.6%) |
| $65,000 to $74,999 | 4,805 (5.3%) | 4,473 (4.9%) |
| $75,000 to $99,999 | 6,873 (7.6%) | 5,086 (5.5%) |
| $100,000+ | 6,353 (7.0%) | 3,679 (4.0%) |
| Total | 90,093 (100.0%) | 92,019 (100.0%) |
Earnings by Sex by Educational Attainment in Cleveland
Average earnings in Cleveland are $38,943 for men and $32,828 for women, a difference of 15.7%. Men with an educational attainment of graduate degree enjoy the highest average annual earnings of $68,106, while those with less than high school education earn the least with $26,898. Women with an educational attainment of graduate degree earn the most with the average annual earnings of $65,140, while those with less than high school education have the smallest earnings of $19,993.
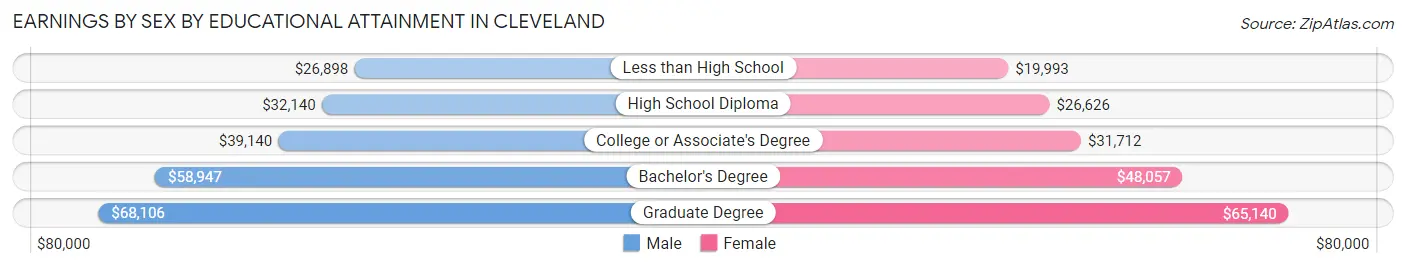
| Educational Attainment | Male Income | Female Income |
| Less than High School | $26,898 | $19,993 |
| High School Diploma | $32,140 | $26,626 |
| College or Associate's Degree | $39,140 | $31,712 |
| Bachelor's Degree | $58,947 | $48,057 |
| Graduate Degree | $68,106 | $65,140 |
| Total | $38,943 | $32,828 |
Family Income in Cleveland
Family Income Brackets in Cleveland
According to the Cleveland family income data, there are 12,918 families falling into the $50,000 to $74,999 income range, which is the most common income bracket and makes up 17.0% of all families. Conversely, the $200,000+ income bracket is the least frequent group with only 2,660 families (3.5%) belonging to this category.
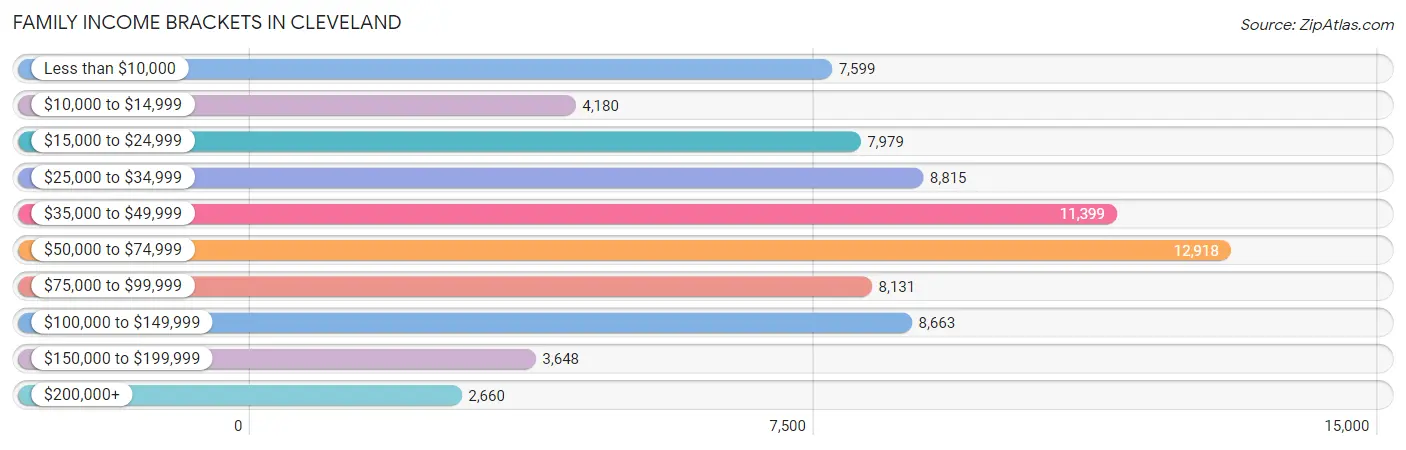
| Income Bracket | # Families | % Families |
| Less than $10,000 | 7,599 | 10.0% |
| $10,000 to $14,999 | 4,180 | 5.5% |
| $15,000 to $24,999 | 7,979 | 10.5% |
| $25,000 to $34,999 | 8,815 | 11.6% |
| $35,000 to $49,999 | 11,399 | 15.0% |
| $50,000 to $74,999 | 12,918 | 17.0% |
| $75,000 to $99,999 | 8,131 | 10.7% |
| $100,000 to $149,999 | 8,663 | 11.4% |
| $150,000 to $199,999 | 3,648 | 4.8% |
| $200,000+ | 2,660 | 3.5% |
Family Income by Famaliy Size in Cleveland
7+ person families (1,272 | 1.7%) account for the highest median family income in Cleveland with $56,439 per family, while 2-person families (37,549 | 49.4%) have the highest median income of $22,595 per family member.
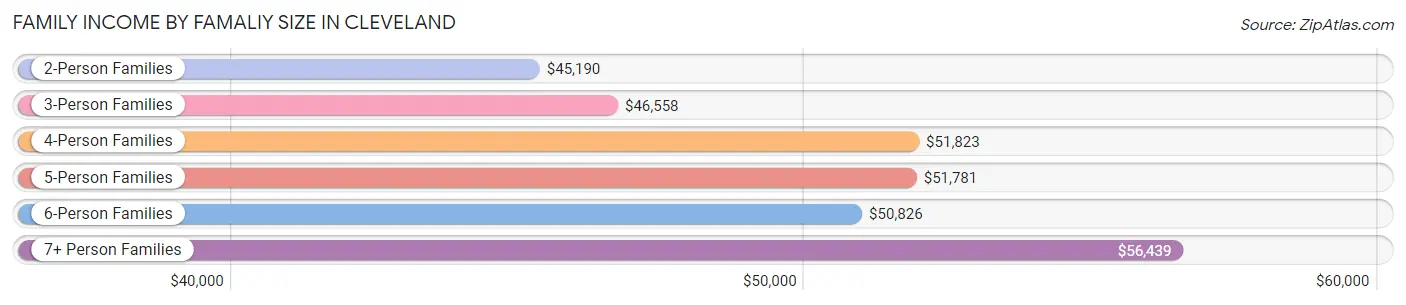
| Income Bracket | # Families | Median Income |
| 2-Person Families | 37,549 (49.4%) | $45,190 |
| 3-Person Families | 18,828 (24.8%) | $46,558 |
| 4-Person Families | 10,987 (14.5%) | $51,823 |
| 5-Person Families | 5,084 (6.7%) | $51,781 |
| 6-Person Families | 2,271 (3.0%) | $50,826 |
| 7+ Person Families | 1,272 (1.7%) | $56,439 |
| Total | 75,991 (100.0%) | $46,784 |
Family Income by Number of Earners in Cleveland
The median family income in Cleveland is $46,784, with families comprising 3+ earners (6,395) having the highest median family income of $107,094, while families with no earners (13,764) have the lowest median family income of $18,339, accounting for 8.4% and 18.1% of families, respectively.
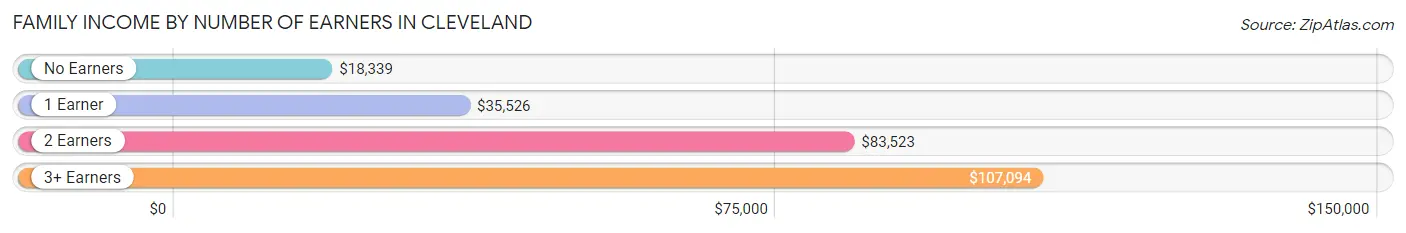
| Number of Earners | # Families | Median Income |
| No Earners | 13,764 (18.1%) | $18,339 |
| 1 Earner | 32,627 (42.9%) | $35,526 |
| 2 Earners | 23,205 (30.5%) | $83,523 |
| 3+ Earners | 6,395 (8.4%) | $107,094 |
| Total | 75,991 (100.0%) | $46,784 |
Household Income in Cleveland
Household Income Brackets in Cleveland
With 26,181 households falling in the category, the $50,000 to $74,999 income range is the most frequent in Cleveland, accounting for 15.6% of all households. In contrast, only 4,196 households (2.5%) fall into the $200,000+ income bracket, making it the least populous group.
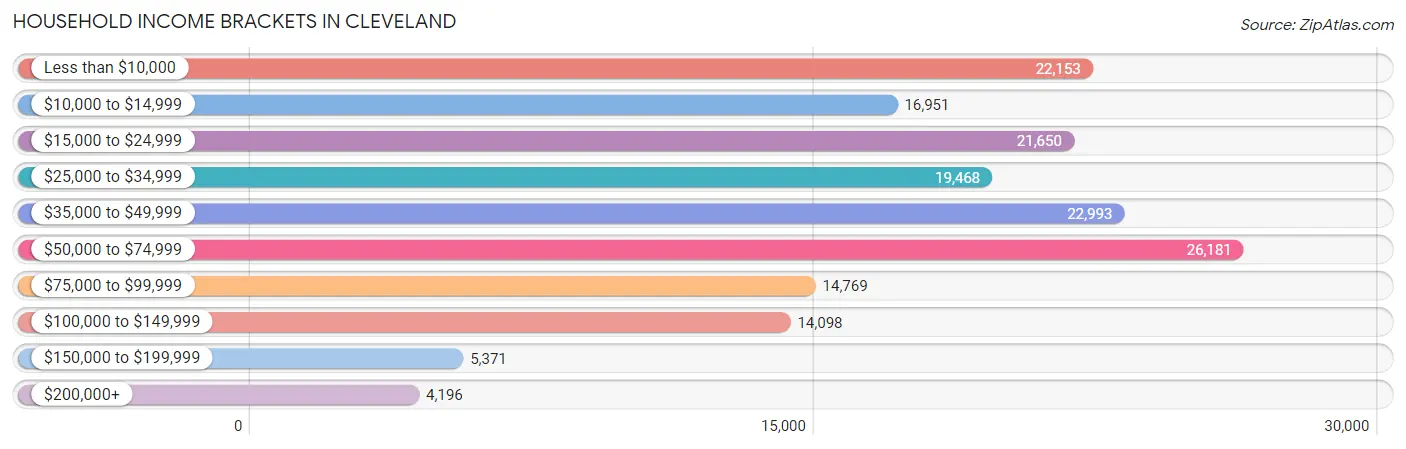
| Income Bracket | # Households | % Households |
| Less than $10,000 | 22,153 | 13.2% |
| $10,000 to $14,999 | 16,951 | 10.1% |
| $15,000 to $24,999 | 21,650 | 12.9% |
| $25,000 to $34,999 | 19,468 | 11.6% |
| $35,000 to $49,999 | 22,993 | 13.7% |
| $50,000 to $74,999 | 26,181 | 15.6% |
| $75,000 to $99,999 | 14,769 | 8.8% |
| $100,000 to $149,999 | 14,098 | 8.4% |
| $150,000 to $199,999 | 5,371 | 3.2% |
| $200,000+ | 4,196 | 2.5% |
Household Income by Householder Age in Cleveland
The median household income in Cleveland is $37,271, with the highest median household income of $42,960 found in the 25 to 44 years age bracket for the primary householder. A total of 58,647 households (34.9%) fall into this category. Meanwhile, the 15 to 24 years age bracket for the primary householder has the lowest median household income of $26,827, with 8,608 households (5.1%) in this group.
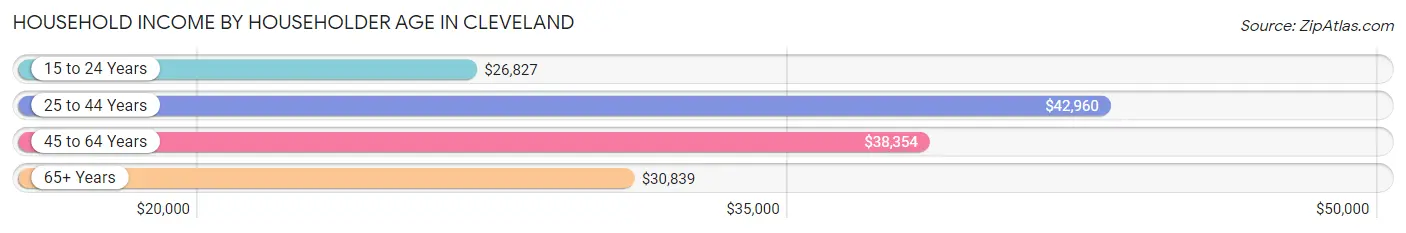
| Income Bracket | # Households | Median Income |
| 15 to 24 Years | 8,608 (5.1%) | $26,827 |
| 25 to 44 Years | 58,647 (34.9%) | $42,960 |
| 45 to 64 Years | 61,808 (36.8%) | $38,354 |
| 65+ Years | 38,766 (23.1%) | $30,839 |
| Total | 167,829 (100.0%) | $37,271 |
Poverty in Cleveland
Income Below Poverty by Sex and Age in Cleveland
With 29.7% poverty level for males and 32.6% for females among the residents of Cleveland, under 5 year old males and 5 year old females are the most vulnerable to poverty, with 5,547 males (52.0%) and 1,316 females (58.5%) in their respective age groups living below the poverty level.
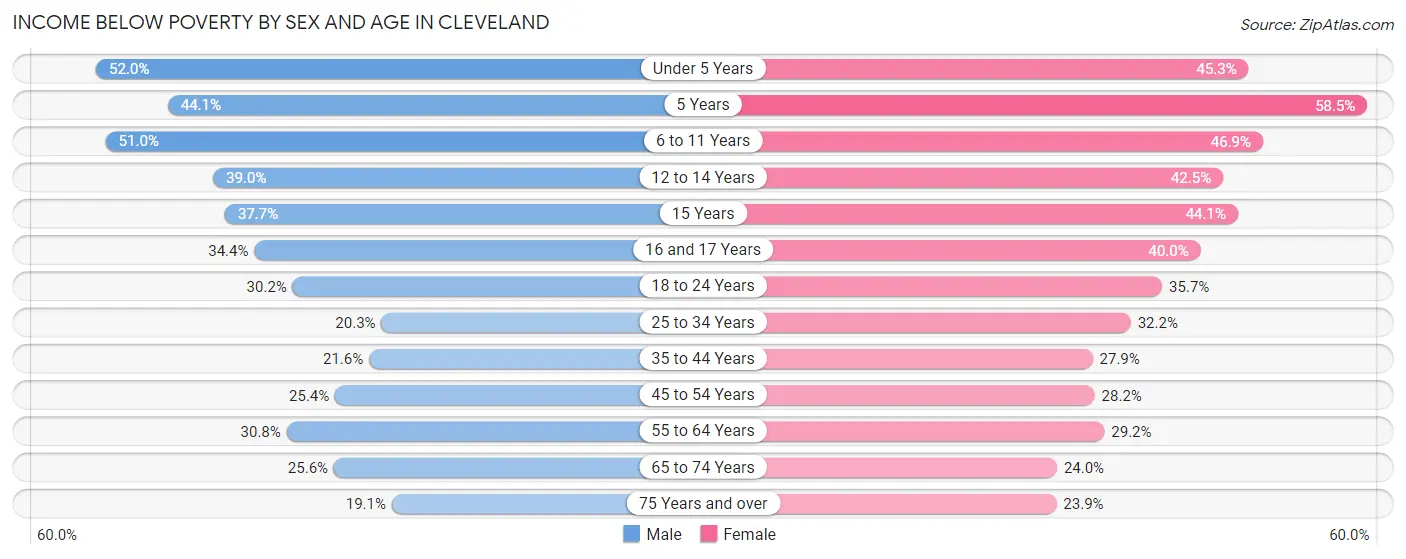
| Age Bracket | Male | Female |
| Under 5 Years | 5,547 (52.0%) | 4,483 (45.3%) |
| 5 Years | 700 (44.1%) | 1,316 (58.5%) |
| 6 to 11 Years | 6,803 (51.0%) | 6,426 (46.9%) |
| 12 to 14 Years | 2,531 (39.0%) | 2,573 (42.4%) |
| 15 Years | 989 (37.7%) | 958 (44.1%) |
| 16 and 17 Years | 1,527 (34.4%) | 1,762 (40.0%) |
| 18 to 24 Years | 4,908 (30.1%) | 6,068 (35.7%) |
| 25 to 34 Years | 6,114 (20.3%) | 10,254 (32.2%) |
| 35 to 44 Years | 4,589 (21.6%) | 6,141 (27.9%) |
| 45 to 54 Years | 5,403 (25.4%) | 5,950 (28.2%) |
| 55 to 64 Years | 7,754 (30.8%) | 7,325 (29.2%) |
| 65 to 74 Years | 3,733 (25.6%) | 4,108 (24.0%) |
| 75 Years and over | 1,447 (19.1%) | 3,047 (23.9%) |
| Total | 52,045 (29.7%) | 60,411 (32.6%) |
Income Above Poverty by Sex and Age in Cleveland
According to the poverty statistics in Cleveland, males aged 75 years and over and females aged 75 years and over are the age groups that are most secure financially, with 80.9% of males and 76.1% of females in these age groups living above the poverty line.
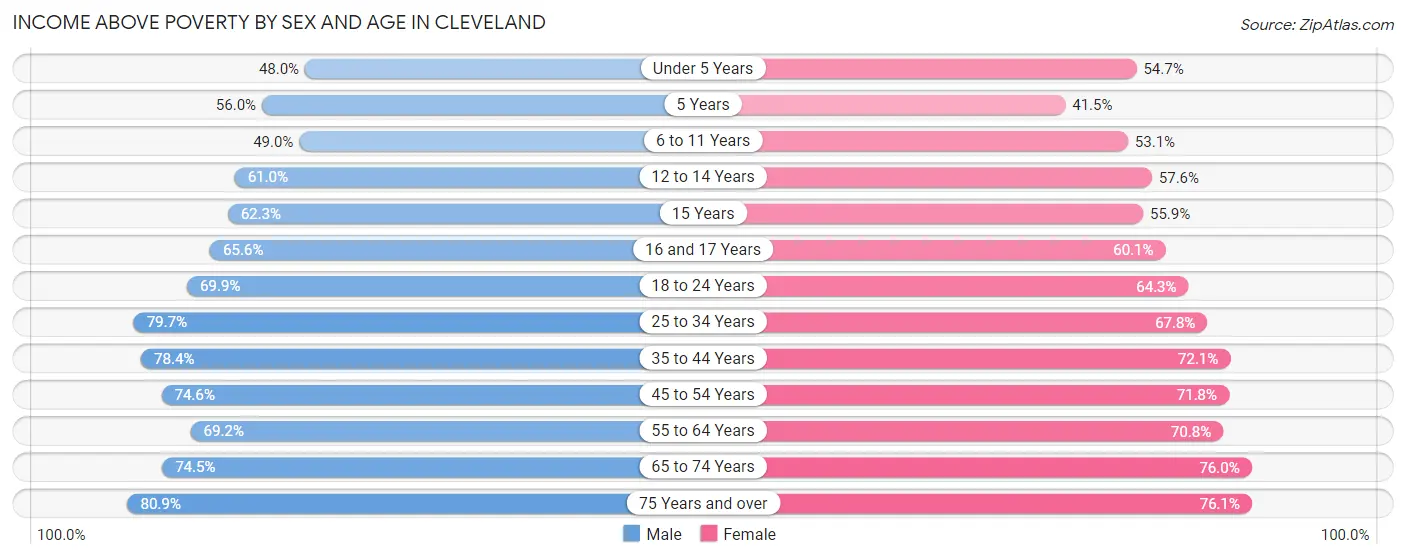
| Age Bracket | Male | Female |
| Under 5 Years | 5,112 (48.0%) | 5,414 (54.7%) |
| 5 Years | 889 (55.9%) | 933 (41.5%) |
| 6 to 11 Years | 6,544 (49.0%) | 7,277 (53.1%) |
| 12 to 14 Years | 3,957 (61.0%) | 3,488 (57.6%) |
| 15 Years | 1,634 (62.3%) | 1,215 (55.9%) |
| 16 and 17 Years | 2,909 (65.6%) | 2,648 (60.1%) |
| 18 to 24 Years | 11,370 (69.9%) | 10,938 (64.3%) |
| 25 to 34 Years | 24,061 (79.7%) | 21,606 (67.8%) |
| 35 to 44 Years | 16,615 (78.4%) | 15,847 (72.1%) |
| 45 to 54 Years | 15,848 (74.6%) | 15,178 (71.8%) |
| 55 to 64 Years | 17,404 (69.2%) | 17,725 (70.8%) |
| 65 to 74 Years | 10,876 (74.5%) | 13,038 (76.0%) |
| 75 Years and over | 6,123 (80.9%) | 9,702 (76.1%) |
| Total | 123,342 (70.3%) | 125,009 (67.4%) |
Income Below Poverty Among Married-Couple Families in Cleveland
The poverty statistics for married-couple families in Cleveland show that 10.5% or 3,359 of the total 31,932 families live below the poverty line. Families with 5 or more children have the highest poverty rate of 67.5%, comprising of 127 families. On the other hand, families with no children have the lowest poverty rate of 8.3%, which includes 1,711 families.
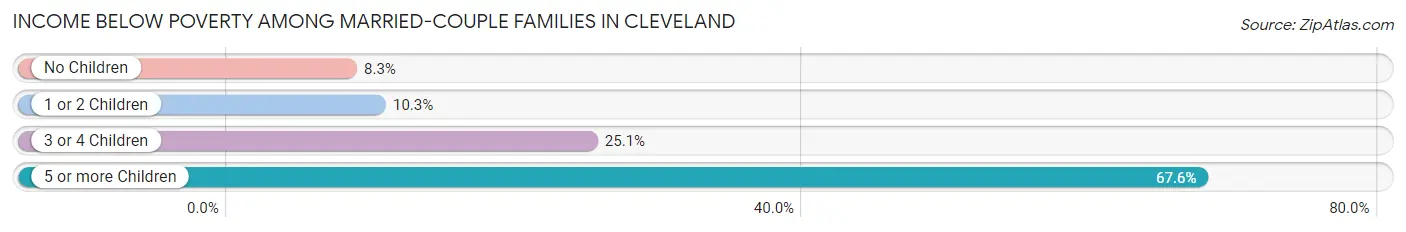
| Children | Above Poverty | Below Poverty |
| No Children | 18,920 (91.7%) | 1,711 (8.3%) |
| 1 or 2 Children | 7,684 (89.7%) | 883 (10.3%) |
| 3 or 4 Children | 1,908 (74.9%) | 638 (25.1%) |
| 5 or more Children | 61 (32.5%) | 127 (67.5%) |
| Total | 28,573 (89.5%) | 3,359 (10.5%) |
Income Below Poverty Among Single-Parent Households in Cleveland
According to the poverty data in Cleveland, 26.7% or 2,750 single-father households and 39.6% or 13,377 single-mother households are living below the poverty line. Among single-father households, those with 5 or more children have the highest poverty rate, with 85 households (78.0%) experiencing poverty. Likewise, among single-mother households, those with 5 or more children have the highest poverty rate, with 650 households (90.5%) falling below the poverty line.
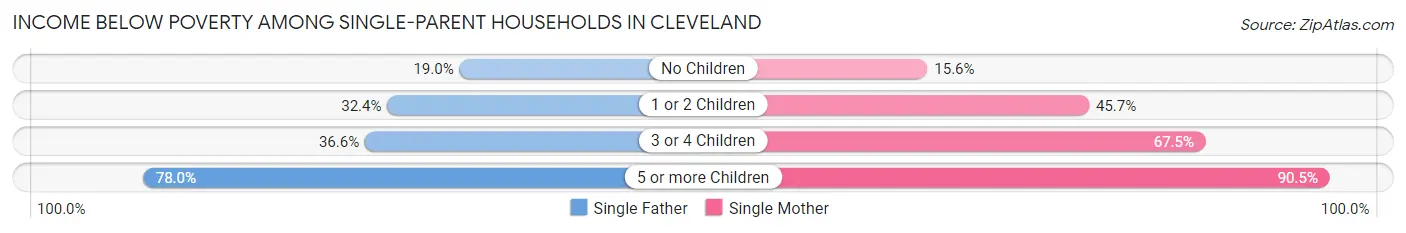
| Children | Single Father | Single Mother |
| No Children | 941 (19.0%) | 1,748 (15.6%) |
| 1 or 2 Children | 1,481 (32.4%) | 7,890 (45.7%) |
| 3 or 4 Children | 243 (36.6%) | 3,089 (67.4%) |
| 5 or more Children | 85 (78.0%) | 650 (90.5%) |
| Total | 2,750 (26.7%) | 13,377 (39.6%) |
Income Below Poverty Among Married-Couple vs Single-Parent Households in Cleveland
The poverty data for Cleveland shows that 3,359 of the married-couple family households (10.5%) and 16,127 of the single-parent households (36.6%) are living below the poverty level. Within the married-couple family households, those with 5 or more children have the highest poverty rate, with 127 households (67.5%) falling below the poverty line. Among the single-parent households, those with 5 or more children have the highest poverty rate, with 735 household (88.9%) living below poverty.
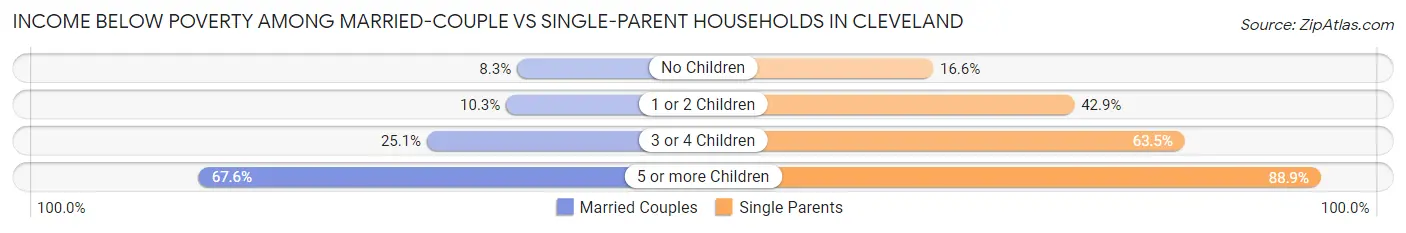
| Children | Married-Couple Families | Single-Parent Households |
| No Children | 1,711 (8.3%) | 2,689 (16.6%) |
| 1 or 2 Children | 883 (10.3%) | 9,371 (42.9%) |
| 3 or 4 Children | 638 (25.1%) | 3,332 (63.5%) |
| 5 or more Children | 127 (67.5%) | 735 (88.9%) |
| Total | 3,359 (10.5%) | 16,127 (36.6%) |
Race in Cleveland
The most populous races in Cleveland are Black / African American (172,571 | 46.6%), White / Caucasian (141,746 | 38.3%), and Hispanic or Latino (46,349 | 12.5%).
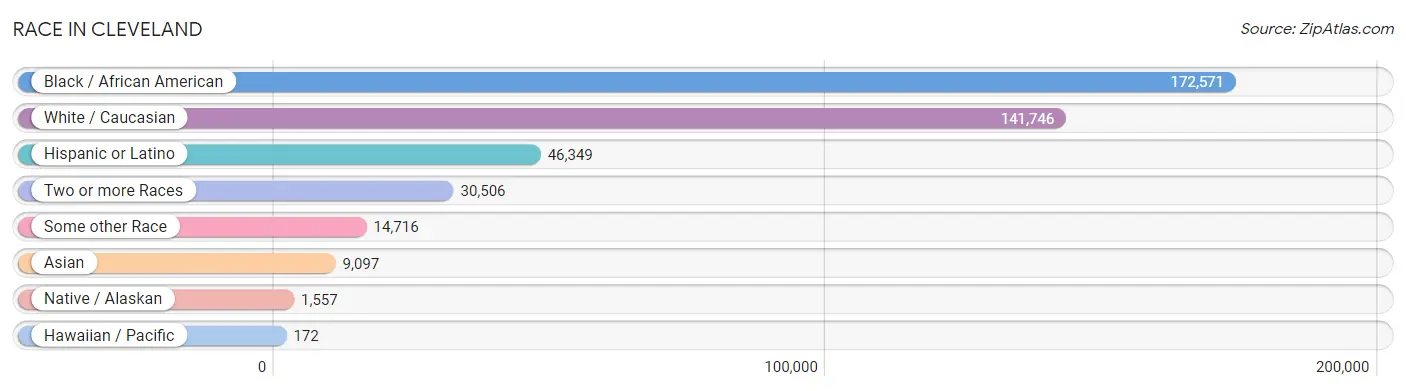
| Race | # Population | % Population |
| Asian | 9,097 | 2.5% |
| Black / African American | 172,571 | 46.6% |
| Hawaiian / Pacific | 172 | 0.1% |
| Hispanic or Latino | 46,349 | 12.5% |
| Native / Alaskan | 1,557 | 0.4% |
| White / Caucasian | 141,746 | 38.3% |
| Two or more Races | 30,506 | 8.2% |
| Some other Race | 14,716 | 4.0% |
| Total | 370,365 | 100.0% |
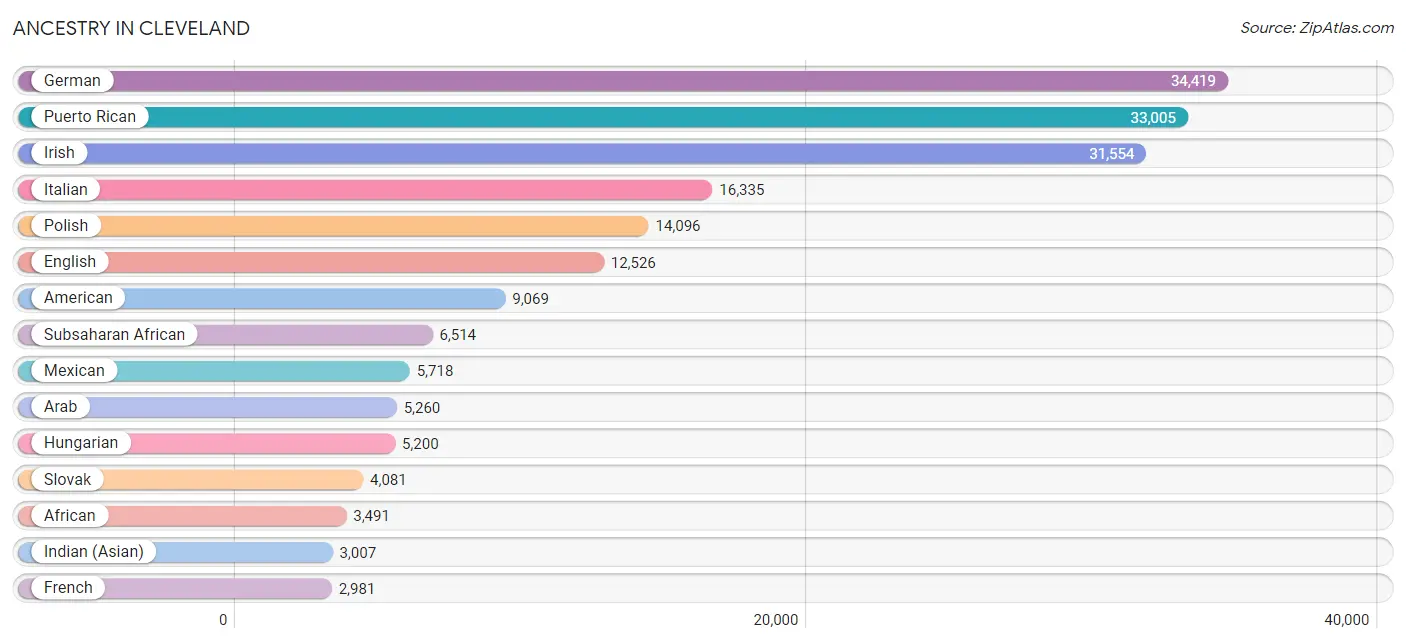
Ancestry in Cleveland
The most populous ancestries reported in Cleveland are German (34,419 | 9.3%), Puerto Rican (33,005 | 8.9%), Irish (31,554 | 8.5%), Italian (16,335 | 4.4%), and Polish (14,096 | 3.8%), together accounting for 34.9% of all Cleveland residents.
| Ancestry | # Population | % Population |
| Afghan | 275 | 0.1% |
| African | 3,491 | 0.9% |
| Albanian | 103 | 0.0% |
| Alsatian | 8 | 0.0% |
| American | 9,069 | 2.5% |
| Apache | 69 | 0.0% |
| Arab | 5,260 | 1.4% |
| Argentinean | 40 | 0.0% |
| Armenian | 130 | 0.0% |
| Australian | 20 | 0.0% |
| Austrian | 470 | 0.1% |
| Barbadian | 46 | 0.0% |
| Belgian | 68 | 0.0% |
| Belizean | 36 | 0.0% |
| Bhutanese | 374 | 0.1% |
| Blackfeet | 429 | 0.1% |
| Bolivian | 6 | 0.0% |
| Brazilian | 61 | 0.0% |
| British | 815 | 0.2% |
| British West Indian | 22 | 0.0% |
| Bulgarian | 41 | 0.0% |
| Burmese | 790 | 0.2% |
| Cajun | 9 | 0.0% |
| Cambodian | 15 | 0.0% |
| Canadian | 180 | 0.1% |
| Cape Verdean | 10 | 0.0% |
| Carpatho Rusyn | 20 | 0.0% |
| Celtic | 20 | 0.0% |
| Central American | 2,794 | 0.7% |
| Central American Indian | 2,239 | 0.6% |
| Cherokee | 1,666 | 0.4% |
| Cheyenne | 4 | 0.0% |
| Chilean | 58 | 0.0% |
| Chippewa | 37 | 0.0% |
| Choctaw | 90 | 0.0% |
| Colombian | 383 | 0.1% |
| Comanche | 3 | 0.0% |
| Costa Rican | 31 | 0.0% |
| Creek | 58 | 0.0% |
| Croatian | 1,358 | 0.4% |
| Cuban | 785 | 0.2% |
| Czech | 2,156 | 0.6% |
| Czechoslovakian | 564 | 0.2% |
| Danish | 175 | 0.1% |
| Delaware | 24 | 0.0% |
| Dominican | 1,427 | 0.4% |
| Dutch | 1,954 | 0.5% |
| Dutch West Indian | 20 | 0.0% |
| Eastern European | 810 | 0.2% |
| Ecuadorian | 220 | 0.1% |
| Egyptian | 189 | 0.1% |
| English | 12,526 | 3.4% |
| Estonian | 10 | 0.0% |
| Ethiopian | 129 | 0.0% |
| European | 1,900 | 0.5% |
| Filipino | 104 | 0.0% |
| Finnish | 355 | 0.1% |
| French | 2,981 | 0.8% |
| French American Indian | 17 | 0.0% |
| French Canadian | 426 | 0.1% |
| German | 34,419 | 9.3% |
| Ghanaian | 238 | 0.1% |
| Greek | 1,546 | 0.4% |
| Guamanian / Chamorro | 38 | 0.0% |
| Guatemalan | 902 | 0.2% |
| Guyanese | 196 | 0.1% |
| Haitian | 277 | 0.1% |
| Honduran | 677 | 0.2% |
| Hopi | 14 | 0.0% |
| Hungarian | 5,200 | 1.4% |
| Icelander | 67 | 0.0% |
| Indian (Asian) | 3,007 | 0.8% |
| Indonesian | 10 | 0.0% |
| Iranian | 134 | 0.0% |
| Iraqi | 112 | 0.0% |
| Irish | 31,554 | 8.5% |
| Iroquois | 7 | 0.0% |
| Israeli | 216 | 0.1% |
| Italian | 16,335 | 4.4% |
| Jamaican | 1,163 | 0.3% |
| Japanese | 537 | 0.1% |
| Jordanian | 176 | 0.1% |
| Korean | 1,226 | 0.3% |
| Laotian | 12 | 0.0% |
| Latvian | 48 | 0.0% |
| Lebanese | 969 | 0.3% |
| Liberian | 487 | 0.1% |
| Lithuanian | 857 | 0.2% |
| Lumbee | 13 | 0.0% |
| Macedonian | 40 | 0.0% |
| Malaysian | 74 | 0.0% |
| Mexican | 5,718 | 1.5% |
| Mexican American Indian | 95 | 0.0% |
| Mongolian | 55 | 0.0% |
| Moroccan | 464 | 0.1% |
| Native Hawaiian | 242 | 0.1% |
| Navajo | 33 | 0.0% |
| Nicaraguan | 245 | 0.1% |
| Nigerian | 1,045 | 0.3% |
| Northern European | 151 | 0.0% |
| Norwegian | 486 | 0.1% |
| Pakistani | 38 | 0.0% |
| Palestinian | 1,285 | 0.4% |
| Panamanian | 89 | 0.0% |
| Paraguayan | 12 | 0.0% |
| Pennsylvania German | 131 | 0.0% |
| Peruvian | 221 | 0.1% |
| Polish | 14,096 | 3.8% |
| Portuguese | 237 | 0.1% |
| Pueblo | 12 | 0.0% |
| Puerto Rican | 33,005 | 8.9% |
| Romanian | 1,398 | 0.4% |
| Russian | 1,539 | 0.4% |
| Salvadoran | 845 | 0.2% |
| Samoan | 92 | 0.0% |
| Scandinavian | 223 | 0.1% |
| Scotch-Irish | 1,690 | 0.5% |
| Scottish | 2,594 | 0.7% |
| Seminole | 20 | 0.0% |
| Senegalese | 19 | 0.0% |
| Serbian | 580 | 0.2% |
| Sierra Leonean | 8 | 0.0% |
| Slavic | 101 | 0.0% |
| Slovak | 4,081 | 1.1% |
| Slovene | 2,322 | 0.6% |
| Somali | 270 | 0.1% |
| South African | 86 | 0.0% |
| South American | 990 | 0.3% |
| Spaniard | 216 | 0.1% |
| Spanish | 675 | 0.2% |
| Sri Lankan | 664 | 0.2% |
| Subsaharan African | 6,514 | 1.8% |
| Sudanese | 94 | 0.0% |
| Swedish | 866 | 0.2% |
| Swiss | 476 | 0.1% |
| Syrian | 700 | 0.2% |
| Thai | 2,231 | 0.6% |
| Trinidadian and Tobagonian | 353 | 0.1% |
| Turkish | 97 | 0.0% |
| U.S. Virgin Islander | 29 | 0.0% |
| Ugandan | 2 | 0.0% |
| Ukrainian | 1,676 | 0.4% |
| Venezuelan | 50 | 0.0% |
| Vietnamese | 27 | 0.0% |
| Welsh | 1,320 | 0.4% |
| West Indian | 352 | 0.1% |
| Yaqui | 16 | 0.0% |
| Yugoslavian | 268 | 0.1% |
| Yup'ik | 151 | 0.0% |
| Zimbabwean | 28 | 0.0% | View All 150 Rows |
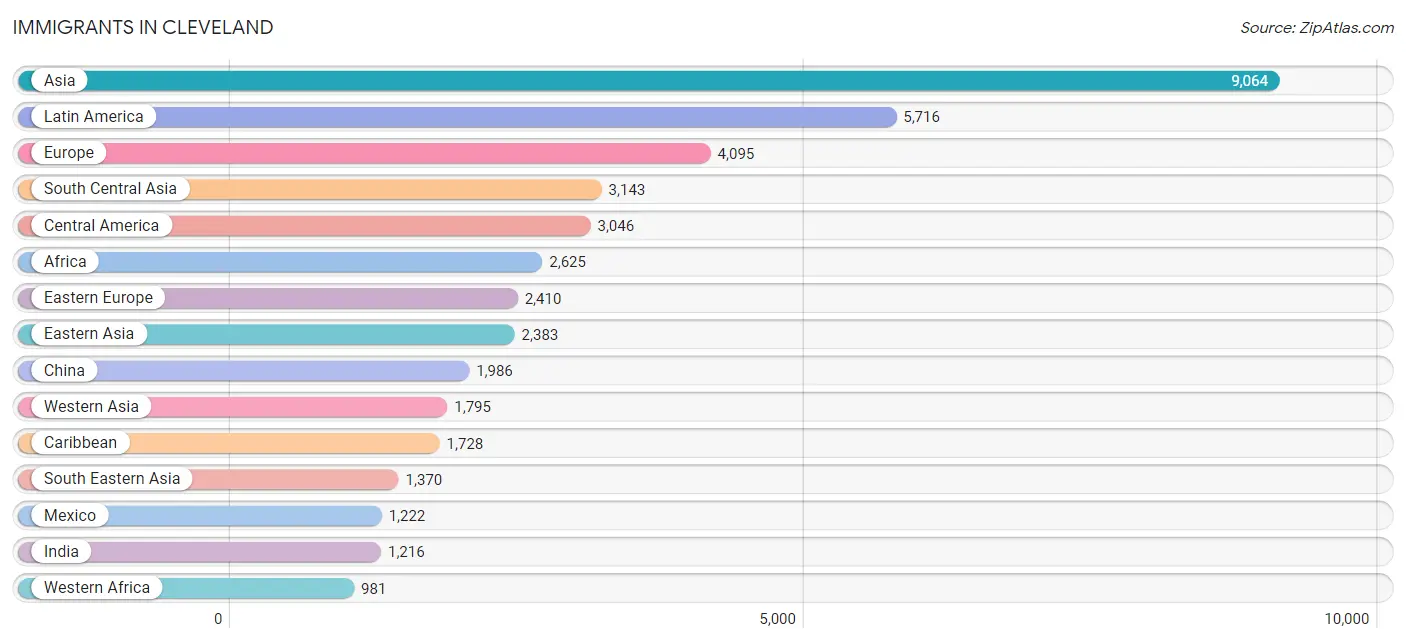
Immigrants in Cleveland
The most numerous immigrant groups reported in Cleveland came from Asia (9,064 | 2.5%), Latin America (5,716 | 1.5%), Europe (4,095 | 1.1%), South Central Asia (3,143 | 0.9%), and Central America (3,046 | 0.8%), together accounting for 6.8% of all Cleveland residents.
| Immigration Origin | # Population | % Population |
| Afghanistan | 300 | 0.1% |
| Africa | 2,625 | 0.7% |
| Albania | 108 | 0.0% |
| Argentina | 20 | 0.0% |
| Asia | 9,064 | 2.5% |
| Australia | 39 | 0.0% |
| Austria | 84 | 0.0% |
| Bangladesh | 41 | 0.0% |
| Barbados | 19 | 0.0% |
| Belarus | 68 | 0.0% |
| Belgium | 6 | 0.0% |
| Belize | 31 | 0.0% |
| Bosnia and Herzegovina | 162 | 0.0% |
| Brazil | 98 | 0.0% |
| Bulgaria | 59 | 0.0% |
| Cabo Verde | 5 | 0.0% |
| Cambodia | 146 | 0.0% |
| Cameroon | 21 | 0.0% |
| Canada | 476 | 0.1% |
| Caribbean | 1,728 | 0.5% |
| Central America | 3,046 | 0.8% |
| Chile | 19 | 0.0% |
| China | 1,986 | 0.5% |
| Colombia | 147 | 0.0% |
| Congo | 269 | 0.1% |
| Costa Rica | 105 | 0.0% |
| Croatia | 154 | 0.0% |
| Cuba | 152 | 0.0% |
| Czechoslovakia | 26 | 0.0% |
| Dominican Republic | 794 | 0.2% |
| Eastern Africa | 667 | 0.2% |
| Eastern Asia | 2,383 | 0.6% |
| Eastern Europe | 2,410 | 0.6% |
| Ecuador | 147 | 0.0% |
| Egypt | 155 | 0.0% |
| El Salvador | 417 | 0.1% |
| England | 61 | 0.0% |
| Ethiopia | 80 | 0.0% |
| Europe | 4,095 | 1.1% |
| France | 56 | 0.0% |
| Germany | 518 | 0.1% |
| Ghana | 109 | 0.0% |
| Greece | 238 | 0.1% |
| Guatemala | 614 | 0.2% |
| Guyana | 292 | 0.1% |
| Haiti | 9 | 0.0% |
| Honduras | 416 | 0.1% |
| Hong Kong | 55 | 0.0% |
| Hungary | 65 | 0.0% |
| India | 1,216 | 0.3% |
| Indonesia | 41 | 0.0% |
| Iran | 173 | 0.1% |
| Iraq | 251 | 0.1% |
| Ireland | 119 | 0.0% |
| Israel | 64 | 0.0% |
| Italy | 325 | 0.1% |
| Jamaica | 377 | 0.1% |
| Japan | 73 | 0.0% |
| Jordan | 206 | 0.1% |
| Kazakhstan | 19 | 0.0% |
| Kenya | 215 | 0.1% |
| Korea | 312 | 0.1% |
| Kuwait | 207 | 0.1% |
| Laos | 51 | 0.0% |
| Latin America | 5,716 | 1.5% |
| Lebanon | 126 | 0.0% |
| Liberia | 163 | 0.0% |
| Lithuania | 92 | 0.0% |
| Malaysia | 58 | 0.0% |
| Mexico | 1,222 | 0.3% |
| Middle Africa | 347 | 0.1% |
| Morocco | 320 | 0.1% |
| Nepal | 496 | 0.1% |
| Netherlands | 23 | 0.0% |
| Nicaragua | 162 | 0.0% |
| Nigeria | 555 | 0.2% |
| Northern Africa | 581 | 0.2% |
| Northern Europe | 407 | 0.1% |
| Norway | 7 | 0.0% |
| Oceania | 39 | 0.0% |
| Pakistan | 224 | 0.1% |
| Panama | 79 | 0.0% |
| Peru | 184 | 0.1% |
| Philippines | 618 | 0.2% |
| Poland | 459 | 0.1% |
| Romania | 519 | 0.1% |
| Russia | 91 | 0.0% |
| Saudi Arabia | 175 | 0.1% |
| Scotland | 38 | 0.0% |
| Senegal | 19 | 0.0% |
| Serbia | 58 | 0.0% |
| Sierra Leone | 13 | 0.0% |
| Singapore | 31 | 0.0% |
| Somalia | 71 | 0.0% |
| South Africa | 49 | 0.0% |
| South America | 942 | 0.3% |
| South Central Asia | 3,143 | 0.9% |
| South Eastern Asia | 1,370 | 0.4% |
| Southern Europe | 591 | 0.2% |
| Spain | 28 | 0.0% |
| Sudan | 51 | 0.0% |
| Sweden | 11 | 0.0% |
| Syria | 592 | 0.2% |
| Taiwan | 120 | 0.0% |
| Thailand | 22 | 0.0% |
| Trinidad and Tobago | 191 | 0.1% |
| Turkey | 51 | 0.0% |
| Uganda | 2 | 0.0% |
| Ukraine | 312 | 0.1% |
| Uruguay | 6 | 0.0% |
| Venezuela | 29 | 0.0% |
| Vietnam | 393 | 0.1% |
| West Indies | 167 | 0.1% |
| Western Africa | 981 | 0.3% |
| Western Asia | 1,795 | 0.5% |
| Western Europe | 687 | 0.2% |
| Zaire | 57 | 0.0% |
| Zimbabwe | 28 | 0.0% | View All 118 Rows |
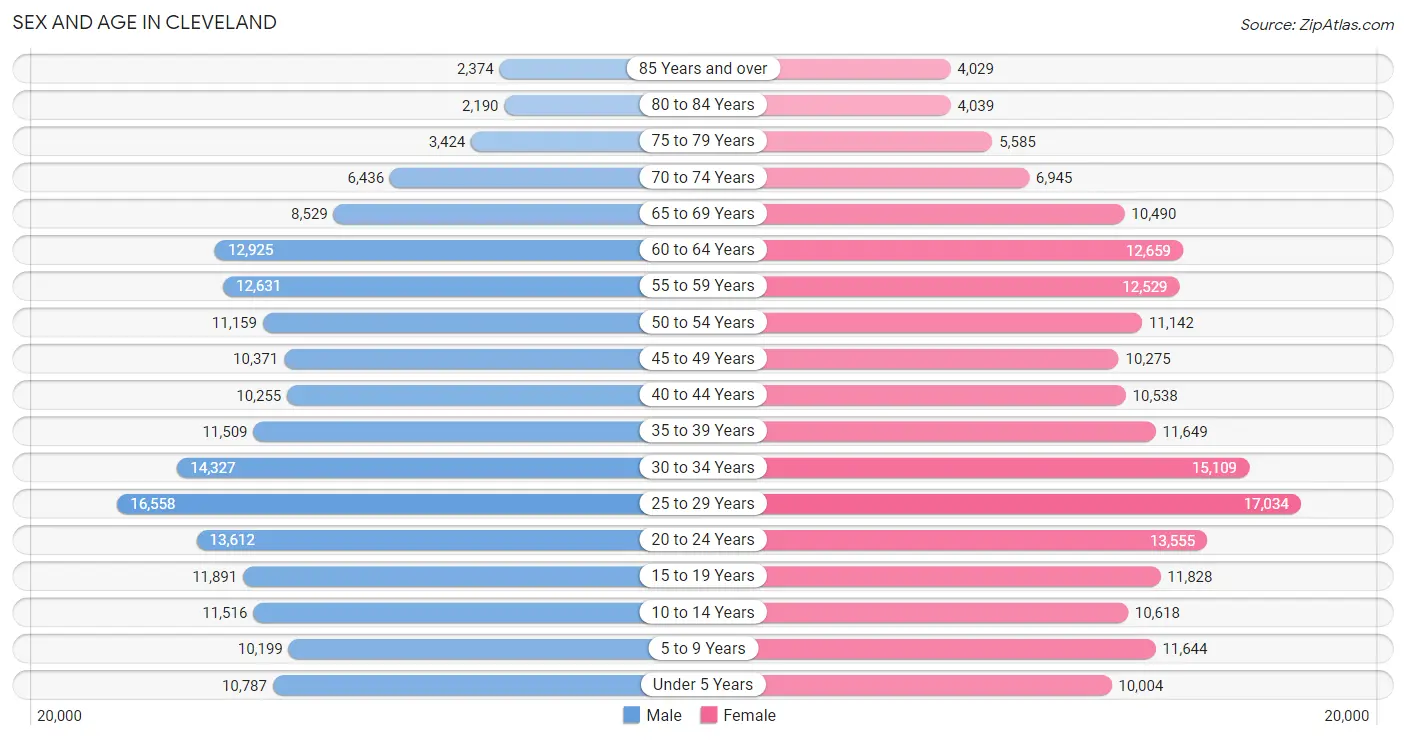
Sex and Age in Cleveland
Sex and Age in Cleveland
The most populous age groups in Cleveland are 25 to 29 Years (16,558 | 9.2%) for men and 25 to 29 Years (17,034 | 9.0%) for women.
| Age Bracket | Male | Female |
| Under 5 Years | 10,787 (6.0%) | 10,004 (5.3%) |
| 5 to 9 Years | 10,199 (5.6%) | 11,644 (6.1%) |
| 10 to 14 Years | 11,516 (6.4%) | 10,618 (5.6%) |
| 15 to 19 Years | 11,891 (6.6%) | 11,828 (6.2%) |
| 20 to 24 Years | 13,612 (7.5%) | 13,555 (7.1%) |
| 25 to 29 Years | 16,558 (9.2%) | 17,034 (9.0%) |
| 30 to 34 Years | 14,327 (7.9%) | 15,109 (8.0%) |
| 35 to 39 Years | 11,509 (6.4%) | 11,649 (6.1%) |
| 40 to 44 Years | 10,255 (5.7%) | 10,538 (5.6%) |
| 45 to 49 Years | 10,371 (5.7%) | 10,275 (5.4%) |
| 50 to 54 Years | 11,159 (6.2%) | 11,142 (5.9%) |
| 55 to 59 Years | 12,631 (7.0%) | 12,529 (6.6%) |
| 60 to 64 Years | 12,925 (7.1%) | 12,659 (6.7%) |
| 65 to 69 Years | 8,529 (4.7%) | 10,490 (5.5%) |
| 70 to 74 Years | 6,436 (3.6%) | 6,945 (3.7%) |
| 75 to 79 Years | 3,424 (1.9%) | 5,585 (2.9%) |
| 80 to 84 Years | 2,190 (1.2%) | 4,039 (2.1%) |
| 85 Years and over | 2,374 (1.3%) | 4,029 (2.1%) |
| Total | 180,693 (100.0%) | 189,672 (100.0%) |
Families and Households in Cleveland
Median Family Size in Cleveland
The median family size in Cleveland is 3.15 persons per family, with single female/mother families (33,767 | 44.4%) accounting for the largest median family size of 3.3 persons per family. On the other hand, single male/father families (10,292 | 13.5%) represent the smallest median family size with 2.75 persons per family.
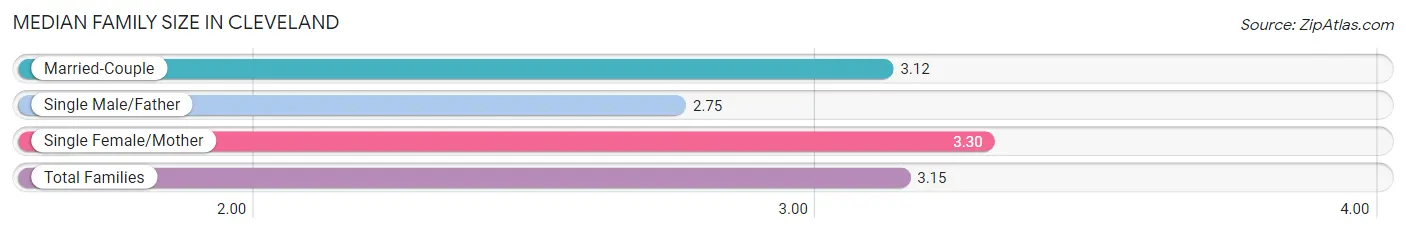
| Family Type | # Families | Family Size |
| Married-Couple | 31,932 (42.0%) | 3.12 |
| Single Male/Father | 10,292 (13.5%) | 2.75 |
| Single Female/Mother | 33,767 (44.4%) | 3.30 |
| Total Families | 75,991 (100.0%) | 3.15 |
Median Household Size in Cleveland
The median household size in Cleveland is 2.13 persons per household, with single female/mother households (33,767 | 20.1%) accounting for the largest median household size of 3.47 persons per household. non-family households (91,838 | 54.7%) represent the smallest median household size with 1.19 persons per household.
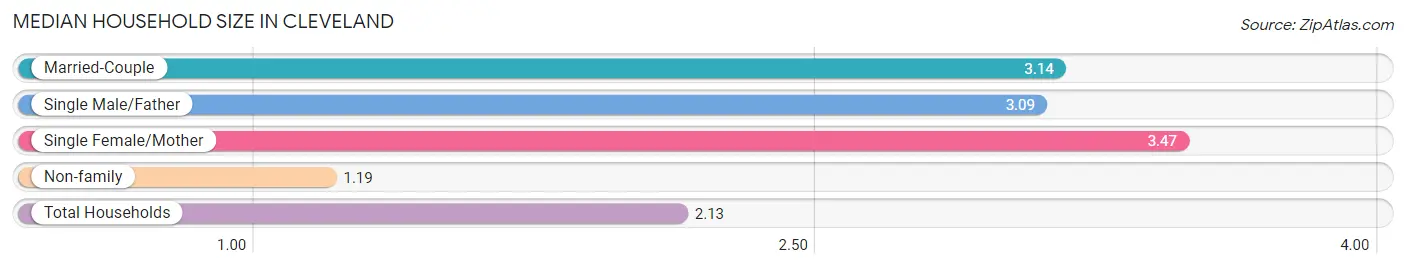
| Household Type | # Households | Household Size |
| Married-Couple | 31,932 (19.0%) | 3.14 |
| Single Male/Father | 10,292 (6.1%) | 3.09 |
| Single Female/Mother | 33,767 (20.1%) | 3.47 |
| Non-family | 91,838 (54.7%) | 1.19 |
| Total Households | 167,829 (100.0%) | 2.13 |
Household Size by Marriage Status in Cleveland
Out of a total of 167,829 households in Cleveland, 75,991 (45.3%) are family households, while 91,838 (54.7%) are nonfamily households. The most numerous type of family households are 2-person households, comprising 34,140, and the most common type of nonfamily households are 1-person households, comprising 77,983.
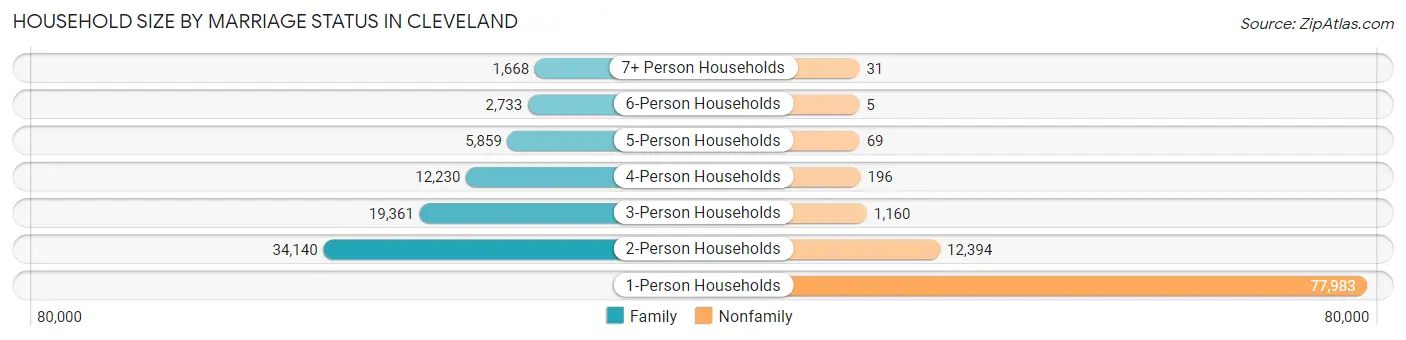
| Household Size | Family Households | Nonfamily Households |
| 1-Person Households | - | 77,983 (46.5%) |
| 2-Person Households | 34,140 (20.3%) | 12,394 (7.4%) |
| 3-Person Households | 19,361 (11.5%) | 1,160 (0.7%) |
| 4-Person Households | 12,230 (7.3%) | 196 (0.1%) |
| 5-Person Households | 5,859 (3.5%) | 69 (0.0%) |
| 6-Person Households | 2,733 (1.6%) | 5 (0.0%) |
| 7+ Person Households | 1,668 (1.0%) | 31 (0.0%) |
| Total | 75,991 (45.3%) | 91,838 (54.7%) |
Female Fertility in Cleveland
Fertility by Age in Cleveland
Average fertility rate in Cleveland is 52.0 births per 1,000 women. Women in the age bracket of 20 to 34 years have the highest fertility rate with 78.0 births per 1,000 women. Women in the age bracket of 20 to 34 years acount for 74.2% of all women with births.
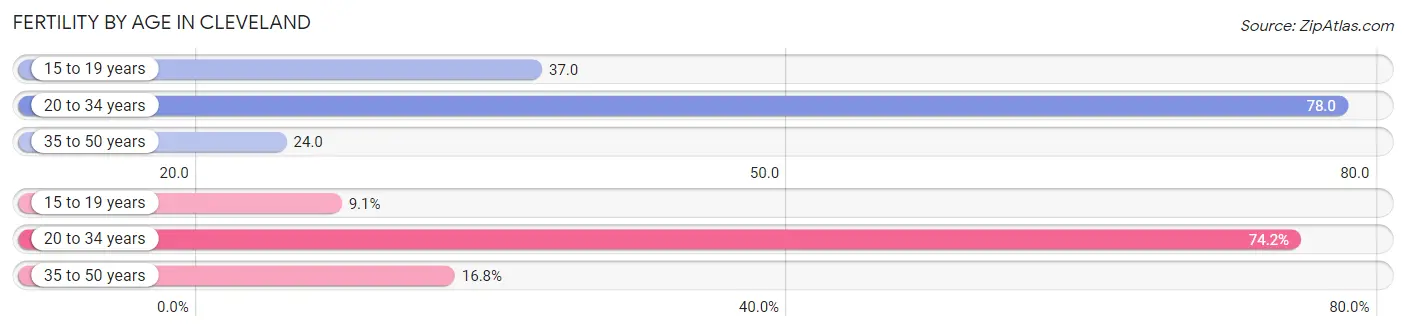
| Age Bracket | Women with Births | Births / 1,000 Women |
| 15 to 19 years | 437 (9.1%) | 37.0 |
| 20 to 34 years | 3,573 (74.2%) | 78.0 |
| 35 to 50 years | 807 (16.8%) | 24.0 |
| Total | 4,817 (100.0%) | 52.0 |
Fertility by Age by Marriage Status in Cleveland
27.4% of women with births (4,817) in Cleveland are married. The highest percentage of unmarried women with births falls into 15 to 19 years age bracket with 100.0% of them unmarried at the time of birth, while the lowest percentage of unmarried women with births belong to 35 to 50 years age bracket with 44.7% of them unmarried.
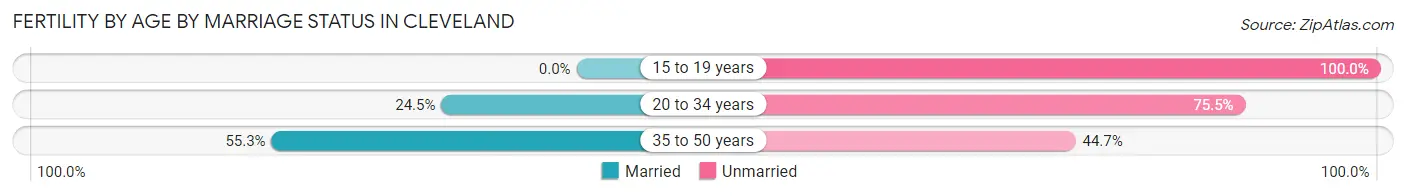
| Age Bracket | Married | Unmarried |
| 15 to 19 years | 0 (0.0%) | 437 (100.0%) |
| 20 to 34 years | 875 (24.5%) | 2,698 (75.5%) |
| 35 to 50 years | 446 (55.3%) | 361 (44.7%) |
| Total | 1,320 (27.4%) | 3,497 (72.6%) |
Fertility by Education in Cleveland
Average fertility rate in Cleveland is 52.0 births per 1,000 women. Women with the education attainment of less than high school have the highest fertility rate of 59.0 births per 1,000 women, while women with the education attainment of graduate degree have the lowest fertility at 40.0 births per 1,000 women. Women with the education attainment of high school diploma represent 30.2% of all women with births.
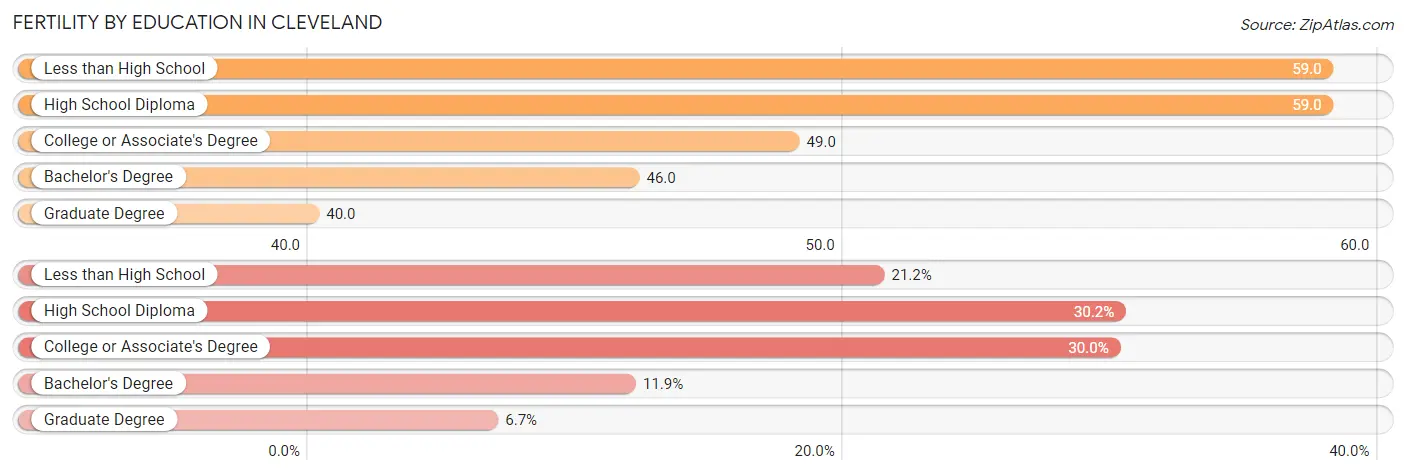
| Educational Attainment | Women with Births | Births / 1,000 Women |
| Less than High School | 1,020 (21.2%) | 59.0 |
| High School Diploma | 1,456 (30.2%) | 59.0 |
| College or Associate's Degree | 1,446 (30.0%) | 49.0 |
| Bachelor's Degree | 572 (11.9%) | 46.0 |
| Graduate Degree | 323 (6.7%) | 40.0 |
| Total | 4,817 (100.0%) | 52.0 |
Fertility by Education by Marriage Status in Cleveland
72.6% of women with births in Cleveland are unmarried. Women with the educational attainment of graduate degree are most likely to be married with 85.5% of them married at childbirth, while women with the educational attainment of high school diploma are least likely to be married with 83.6% of them unmarried at childbirth.
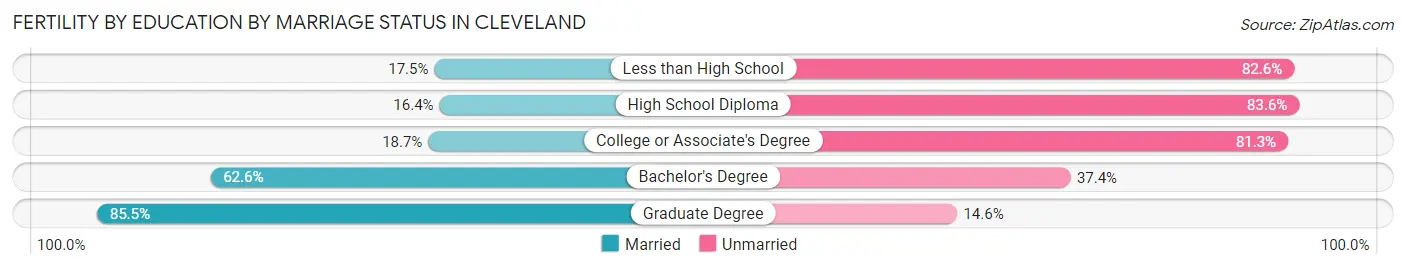
| Educational Attainment | Married | Unmarried |
| Less than High School | 178 (17.4%) | 842 (82.6%) |
| High School Diploma | 239 (16.4%) | 1,217 (83.6%) |
| College or Associate's Degree | 270 (18.7%) | 1,176 (81.3%) |
| Bachelor's Degree | 358 (62.6%) | 214 (37.4%) |
| Graduate Degree | 276 (85.5%) | 47 (14.5%) |
| Total | 1,320 (27.4%) | 3,497 (72.6%) |
Employment Characteristics in Cleveland
Employment by Class of Employer in Cleveland
Among the 153,905 employed individuals in Cleveland, private company employees (104,485 | 67.9%), not-for-profit organizations (20,826 | 13.5%), and local government employees (11,345 | 7.4%) make up the most common classes of employment.
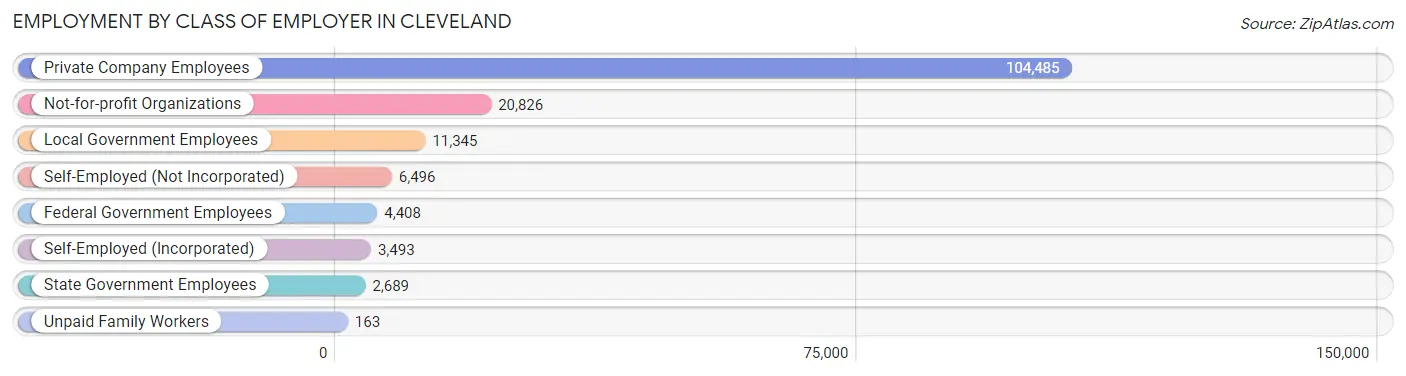
| Employer Class | # Employees | % Employees |
| Private Company Employees | 104,485 | 67.9% |
| Self-Employed (Incorporated) | 3,493 | 2.3% |
| Self-Employed (Not Incorporated) | 6,496 | 4.2% |
| Not-for-profit Organizations | 20,826 | 13.5% |
| Local Government Employees | 11,345 | 7.4% |
| State Government Employees | 2,689 | 1.8% |
| Federal Government Employees | 4,408 | 2.9% |
| Unpaid Family Workers | 163 | 0.1% |
| Total | 153,905 | 100.0% |
Employment Status by Age in Cleveland
According to the labor force statistics for Cleveland, out of the total population over 16 years of age (300,756), 59.6% or 179,251 individuals are in the labor force, with 11.9% or 21,331 of them unemployed. The age group with the highest labor force participation rate is 30 to 34 years, with 82.3% or 24,226 individuals in the labor force. Within the labor force, the 16 to 19 years age range has the highest percentage of unemployed individuals, with 33.7% or 2,876 of them being unemployed.
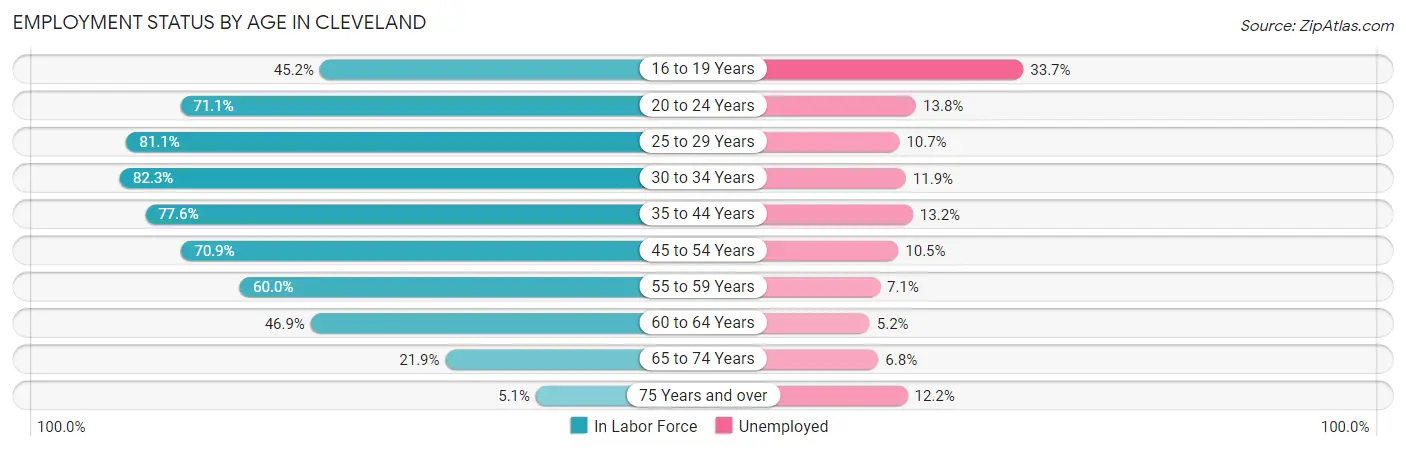
| Age Bracket | In Labor Force | Unemployed |
| 16 to 19 Years | 8,533 (45.2%) | 2,876 (33.7%) |
| 20 to 24 Years | 19,316 (71.1%) | 2,666 (13.8%) |
| 25 to 29 Years | 27,243 (81.1%) | 2,915 (10.7%) |
| 30 to 34 Years | 24,226 (82.3%) | 2,883 (11.9%) |
| 35 to 44 Years | 34,106 (77.6%) | 4,502 (13.2%) |
| 45 to 54 Years | 30,449 (70.9%) | 3,197 (10.5%) |
| 55 to 59 Years | 15,096 (60.0%) | 1,072 (7.1%) |
| 60 to 64 Years | 11,999 (46.9%) | 624 (5.2%) |
| 65 to 74 Years | 7,096 (21.9%) | 483 (6.8%) |
| 75 Years and over | 1,104 (5.1%) | 135 (12.2%) |
| Total | 179,251 (59.6%) | 21,331 (11.9%) |
Employment Status by Educational Attainment in Cleveland
According to labor force statistics for Cleveland, 71.3% of individuals (143,078) out of the total population between 25 and 64 years of age (200,670) are in the labor force, with 10.6% or 15,166 of them being unemployed. The group with the highest labor force participation rate are those with the educational attainment of bachelor's degree or higher, with 88.1% or 38,355 individuals in the labor force. Within the labor force, individuals with less than high school education have the highest percentage of unemployment, with 19.8% or 3,022 of them being unemployed.
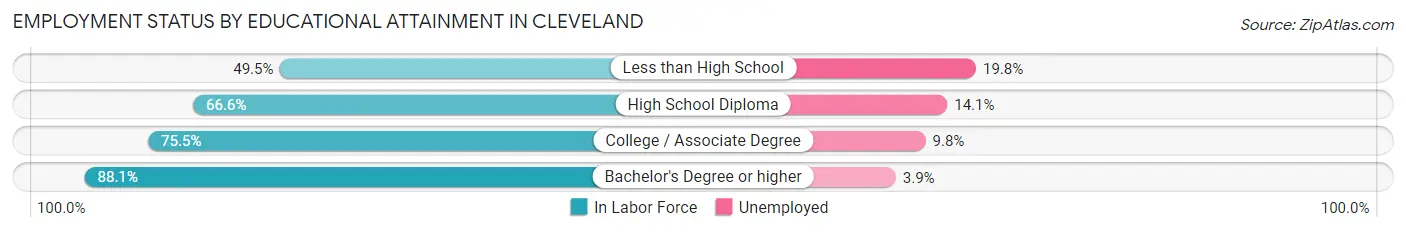
| Educational Attainment | In Labor Force | Unemployed |
| Less than High School | 15,261 (49.5%) | 6,105 (19.8%) |
| High School Diploma | 43,770 (66.6%) | 9,267 (14.1%) |
| College / Associate Degree | 45,740 (75.5%) | 5,937 (9.8%) |
| Bachelor's Degree or higher | 38,355 (88.1%) | 1,698 (3.9%) |
| Total | 143,078 (71.3%) | 21,271 (10.6%) |
Employment Occupations by Sex in Cleveland
Management, Business, Science and Arts Occupations
The most common Management, Business, Science and Arts occupations in Cleveland are Community & Social Service (13,934 | 8.8%), Management (11,204 | 7.1%), Health Diagnosing & Treating (10,248 | 6.5%), Business & Financial (8,161 | 5.2%), and Computers, Engineering & Science (7,583 | 4.8%).
Management, Business, Science and Arts Occupations by Sex
Within the Management, Business, Science and Arts occupations in Cleveland, the most male-oriented occupations are Architecture & Engineering (83.1%), Computers & Mathematics (68.0%), and Computers, Engineering & Science (67.1%), while the most female-oriented occupations are Education Instruction & Library (74.7%), Health Diagnosing & Treating (73.7%), and Health Technologists (69.6%).
| Occupation | Male | Female |
| Management | 5,588 (49.9%) | 5,616 (50.1%) |
| Business & Financial | 3,492 (42.8%) | 4,669 (57.2%) |
| Computers, Engineering & Science | 5,086 (67.1%) | 2,497 (32.9%) |
| Computers & Mathematics | 2,772 (68.0%) | 1,303 (32.0%) |
| Architecture & Engineering | 1,404 (83.1%) | 286 (16.9%) |
| Life, Physical & Social Science | 910 (50.1%) | 908 (49.9%) |
| Community & Social Service | 4,879 (35.0%) | 9,055 (65.0%) |
| Education, Arts & Media | 1,066 (32.2%) | 2,241 (67.8%) |
| Legal Services & Support | 920 (44.5%) | 1,148 (55.5%) |
| Education Instruction & Library | 1,599 (25.3%) | 4,718 (74.7%) |
| Arts, Media & Entertainment | 1,294 (57.7%) | 948 (42.3%) |
| Health Diagnosing & Treating | 2,697 (26.3%) | 7,551 (73.7%) |
| Health Technologists | 1,947 (30.4%) | 4,452 (69.6%) |
| Total (Category) | 21,742 (42.5%) | 29,388 (57.5%) |
| Total (Overall) | 76,747 (48.7%) | 80,935 (51.3%) |
Services Occupations
The most common Services occupations in Cleveland are Food Preparation & Serving (11,362 | 7.2%), Healthcare Support (9,696 | 6.1%), Cleaning & Maintenance (8,073 | 5.1%), Personal Care & Service (4,105 | 2.6%), and Security & Protection (3,587 | 2.3%).
Services Occupations by Sex
Within the Services occupations in Cleveland, the most male-oriented occupations are Law Enforcement (87.2%), Security & Protection (77.1%), and Firefighting & Prevention (71.6%), while the most female-oriented occupations are Healthcare Support (86.2%), Personal Care & Service (72.9%), and Food Preparation & Serving (49.1%).
| Occupation | Male | Female |
| Healthcare Support | 1,334 (13.8%) | 8,362 (86.2%) |
| Security & Protection | 2,767 (77.1%) | 820 (22.9%) |
| Firefighting & Prevention | 1,654 (71.6%) | 657 (28.4%) |
| Law Enforcement | 1,113 (87.2%) | 163 (12.8%) |
| Food Preparation & Serving | 5,782 (50.9%) | 5,580 (49.1%) |
| Cleaning & Maintenance | 4,525 (56.0%) | 3,548 (44.0%) |
| Personal Care & Service | 1,111 (27.1%) | 2,994 (72.9%) |
| Total (Category) | 15,519 (42.1%) | 21,304 (57.9%) |
| Total (Overall) | 76,747 (48.7%) | 80,935 (51.3%) |
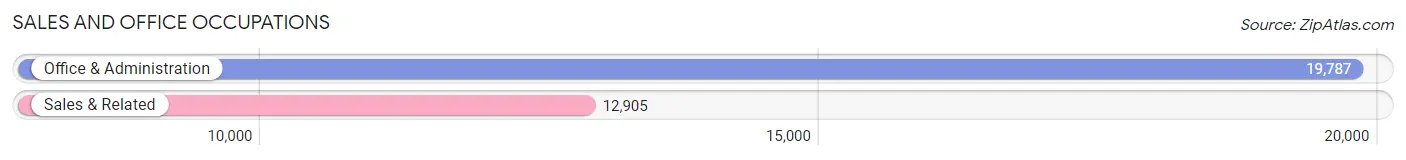
Sales and Office Occupations
The most common Sales and Office occupations in Cleveland are Office & Administration (19,787 | 12.6%), and Sales & Related (12,905 | 8.2%).
Sales and Office Occupations by Sex
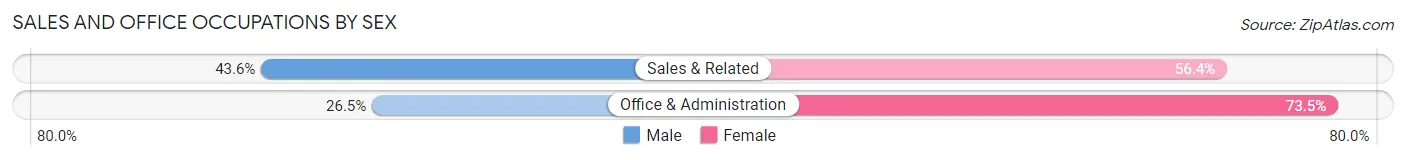
| Occupation | Male | Female |
| Sales & Related | 5,627 (43.6%) | 7,278 (56.4%) |
| Office & Administration | 5,252 (26.5%) | 14,535 (73.5%) |
| Total (Category) | 10,879 (33.3%) | 21,813 (66.7%) |
| Total (Overall) | 76,747 (48.7%) | 80,935 (51.3%) |
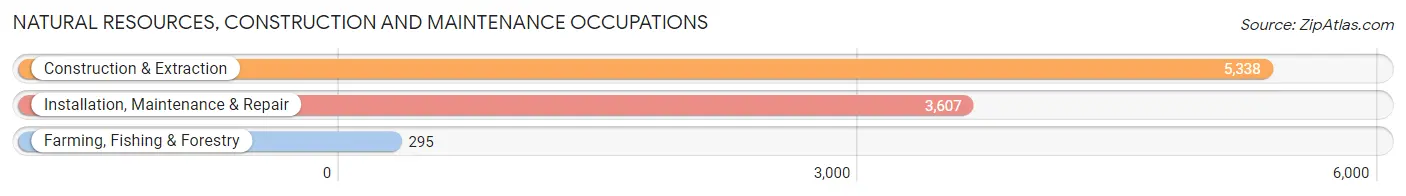
Natural Resources, Construction and Maintenance Occupations
The most common Natural Resources, Construction and Maintenance occupations in Cleveland are Construction & Extraction (5,338 | 3.4%), Installation, Maintenance & Repair (3,607 | 2.3%), and Farming, Fishing & Forestry (295 | 0.2%).
Natural Resources, Construction and Maintenance Occupations by Sex
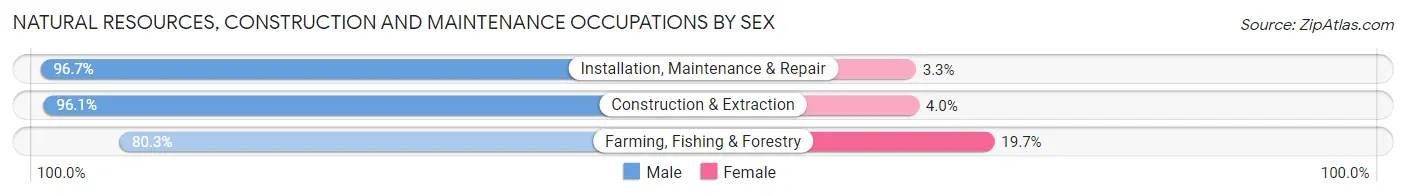
| Occupation | Male | Female |
| Farming, Fishing & Forestry | 237 (80.3%) | 58 (19.7%) |
| Construction & Extraction | 5,127 (96.1%) | 211 (4.0%) |
| Installation, Maintenance & Repair | 3,488 (96.7%) | 119 (3.3%) |
| Total (Category) | 8,852 (95.8%) | 388 (4.2%) |
| Total (Overall) | 76,747 (48.7%) | 80,935 (51.3%) |
Production, Transportation and Moving Occupations
The most common Production, Transportation and Moving occupations in Cleveland are Production (12,363 | 7.8%), Material Moving (9,055 | 5.7%), and Transportation (6,379 | 4.1%).
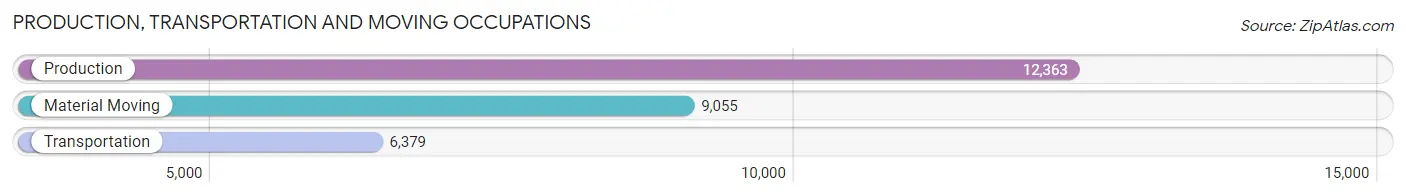
Production, Transportation and Moving Occupations by Sex
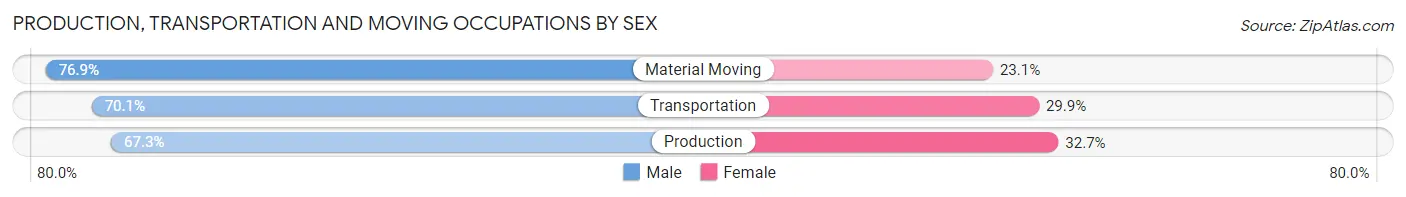
| Occupation | Male | Female |
| Production | 8,319 (67.3%) | 4,044 (32.7%) |
| Transportation | 4,474 (70.1%) | 1,905 (29.9%) |
| Material Moving | 6,962 (76.9%) | 2,093 (23.1%) |
| Total (Category) | 19,755 (71.1%) | 8,042 (28.9%) |
| Total (Overall) | 76,747 (48.7%) | 80,935 (51.3%) |
Employment Industries by Sex in Cleveland
Employment Industries in Cleveland
The major employment industries in Cleveland include Health Care & Social Assistance (31,355 | 19.9%), Manufacturing (19,101 | 12.1%), Retail Trade (16,572 | 10.5%), Accommodation & Food Services (13,809 | 8.8%), and Educational Services (9,813 | 6.2%).
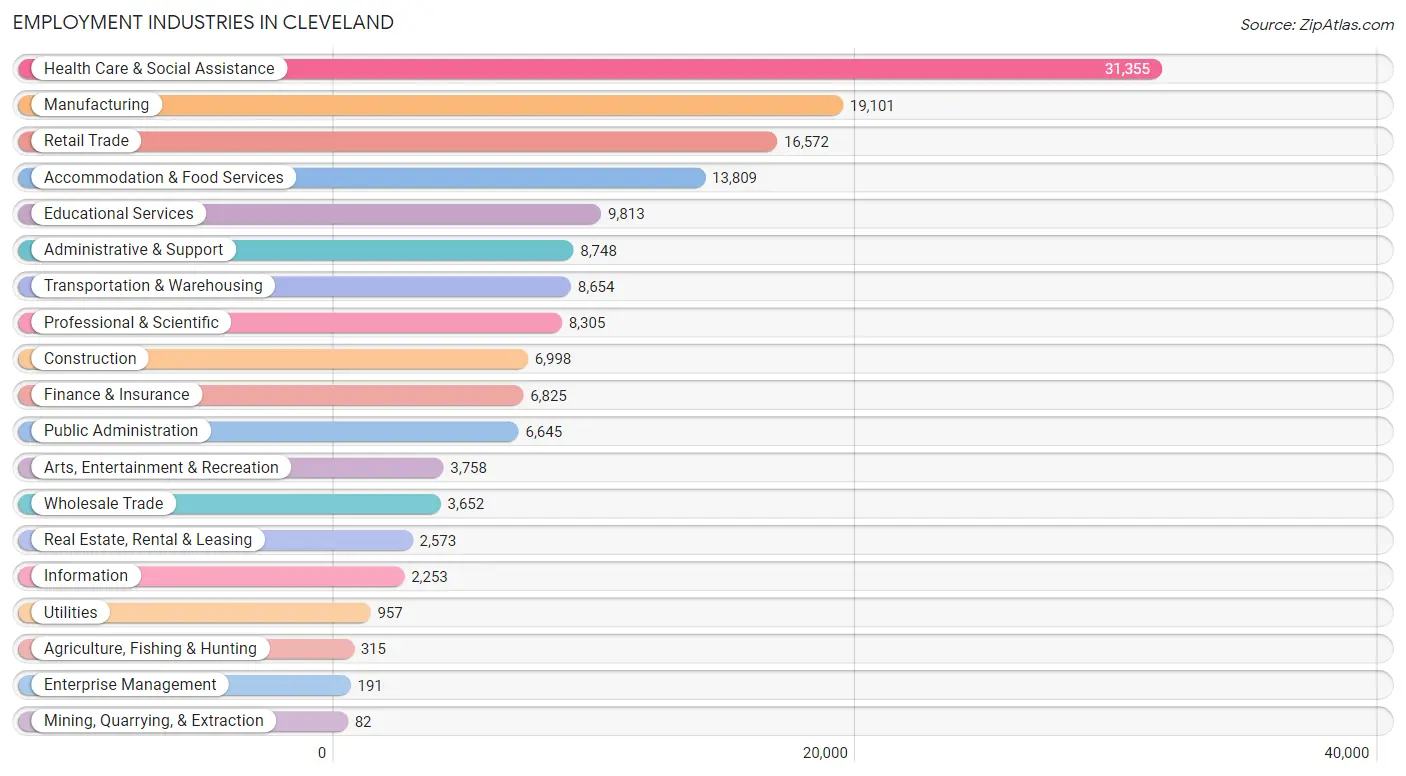
Employment Industries by Sex in Cleveland
The Cleveland industries that see more men than women are Construction (93.3%), Mining, Quarrying, & Extraction (91.5%), and Utilities (75.3%), whereas the industries that tend to have a higher number of women are Health Care & Social Assistance (76.4%), Enterprise Management (74.9%), and Educational Services (66.1%).
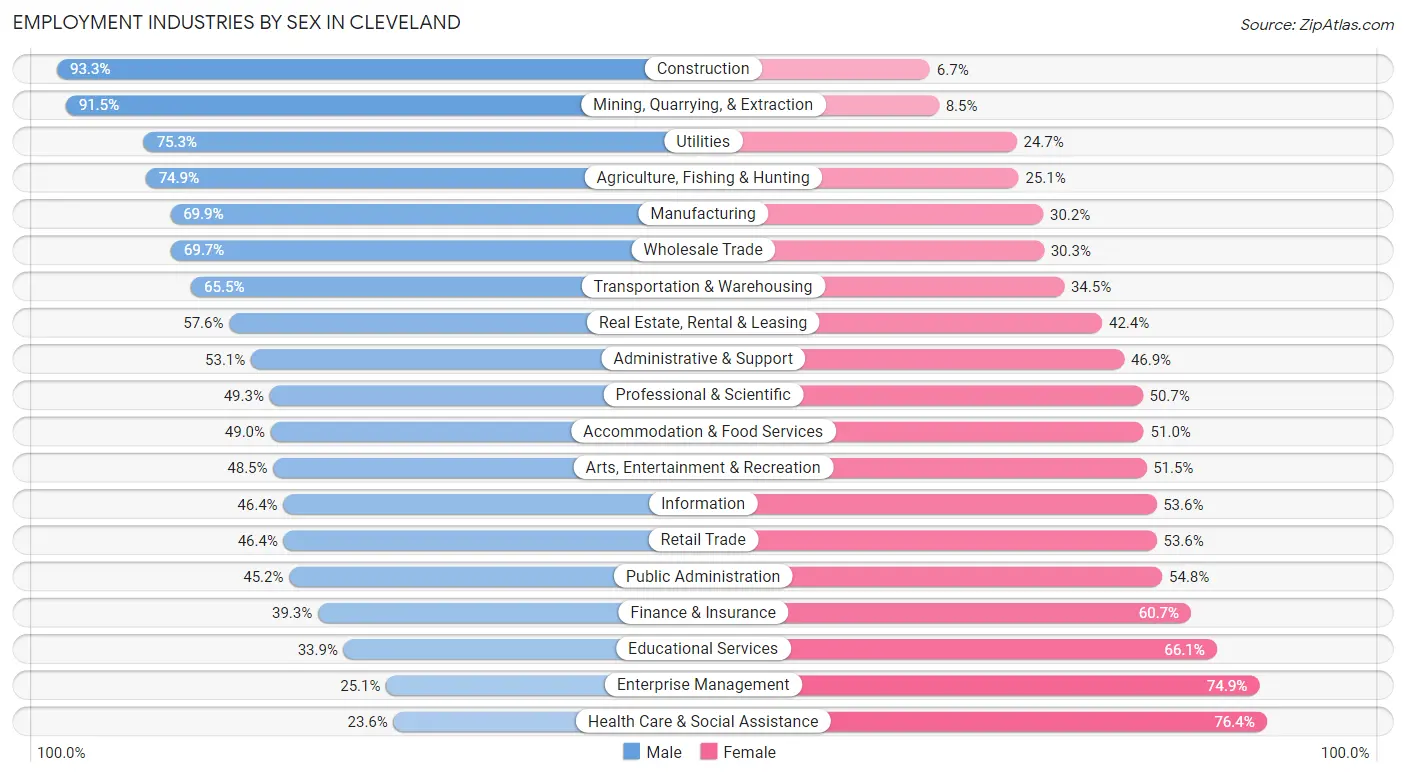
| Industry | Male | Female |
| Agriculture, Fishing & Hunting | 236 (74.9%) | 79 (25.1%) |
| Mining, Quarrying, & Extraction | 75 (91.5%) | 7 (8.5%) |
| Construction | 6,528 (93.3%) | 470 (6.7%) |
| Manufacturing | 13,342 (69.9%) | 5,759 (30.1%) |
| Wholesale Trade | 2,546 (69.7%) | 1,106 (30.3%) |
| Retail Trade | 7,683 (46.4%) | 8,889 (53.6%) |
| Transportation & Warehousing | 5,670 (65.5%) | 2,984 (34.5%) |
| Utilities | 721 (75.3%) | 236 (24.7%) |
| Information | 1,046 (46.4%) | 1,207 (53.6%) |
| Finance & Insurance | 2,680 (39.3%) | 4,145 (60.7%) |
| Real Estate, Rental & Leasing | 1,483 (57.6%) | 1,090 (42.4%) |
| Professional & Scientific | 4,091 (49.3%) | 4,214 (50.7%) |
| Enterprise Management | 48 (25.1%) | 143 (74.9%) |
| Administrative & Support | 4,646 (53.1%) | 4,102 (46.9%) |
| Educational Services | 3,331 (33.9%) | 6,482 (66.1%) |
| Health Care & Social Assistance | 7,405 (23.6%) | 23,950 (76.4%) |
| Arts, Entertainment & Recreation | 1,823 (48.5%) | 1,935 (51.5%) |
| Accommodation & Food Services | 6,770 (49.0%) | 7,039 (51.0%) |
| Public Administration | 3,004 (45.2%) | 3,641 (54.8%) |
| Total | 76,747 (48.7%) | 80,935 (51.3%) |
Education in Cleveland
School Enrollment in Cleveland
The most common levels of schooling among the 87,096 students in Cleveland are high school (18,802 | 21.6%), college / undergraduate (18,572 | 21.3%), and elementary school (17,626 | 20.2%).
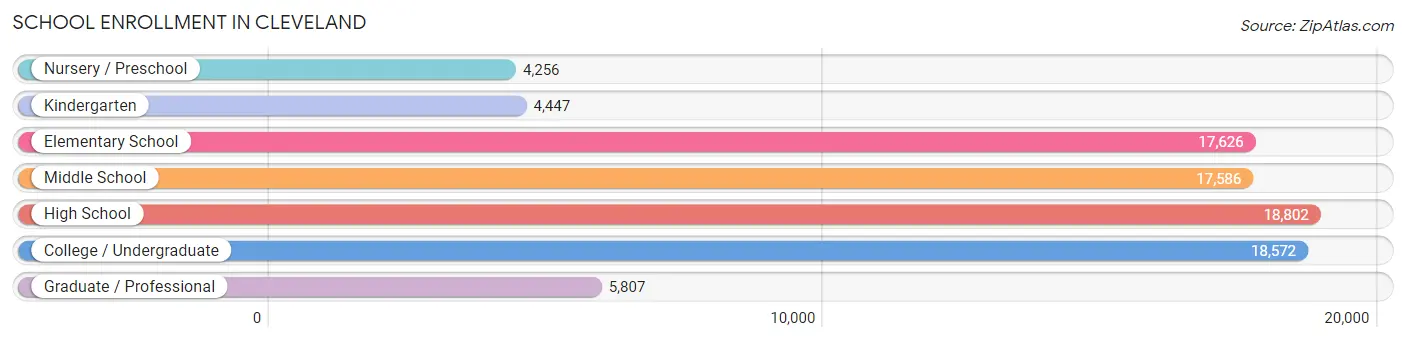
| School Level | # Students | % Students |
| Nursery / Preschool | 4,256 | 4.9% |
| Kindergarten | 4,447 | 5.1% |
| Elementary School | 17,626 | 20.2% |
| Middle School | 17,586 | 20.2% |
| High School | 18,802 | 21.6% |
| College / Undergraduate | 18,572 | 21.3% |
| Graduate / Professional | 5,807 | 6.7% |
| Total | 87,096 | 100.0% |
School Enrollment by Age by Funding Source in Cleveland
Out of a total of 87,096 students who are enrolled in schools in Cleveland, 22,558 (25.9%) attend a private institution, while the remaining 64,538 (74.1%) are enrolled in public schools. The age group of 20 to 24 year olds has the highest likelihood of being enrolled in private schools, with 3,810 (37.2% in the age bracket) enrolled. Conversely, the age group of 15 to 17 year olds has the lowest likelihood of being enrolled in a private school, with 10,353 (78.6% in the age bracket) attending a public institution.
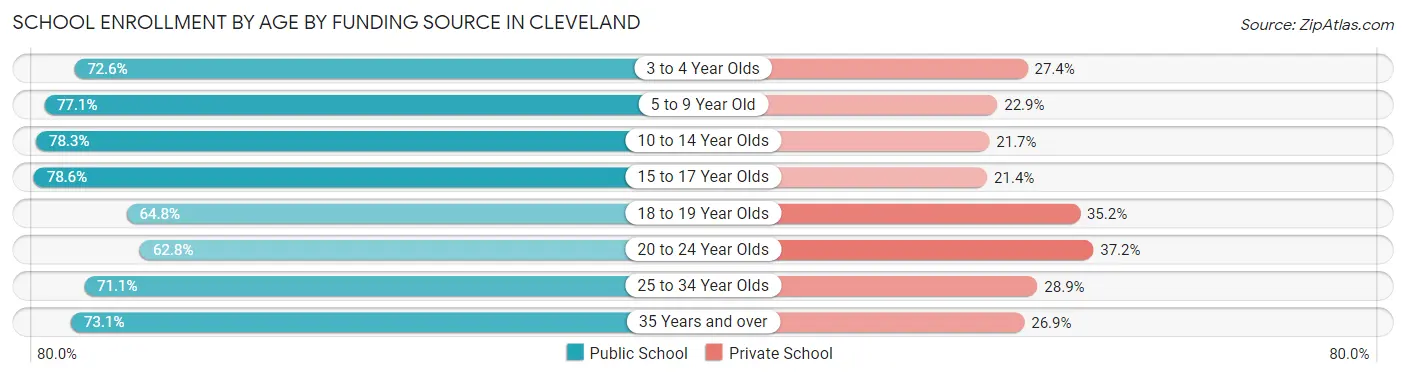
| Age Bracket | Public School | Private School |
| 3 to 4 Year Olds | 2,586 (72.6%) | 976 (27.4%) |
| 5 to 9 Year Old | 15,518 (77.1%) | 4,607 (22.9%) |
| 10 to 14 Year Olds | 17,066 (78.3%) | 4,732 (21.7%) |
| 15 to 17 Year Olds | 10,353 (78.6%) | 2,816 (21.4%) |
| 18 to 19 Year Olds | 4,338 (64.8%) | 2,357 (35.2%) |
| 20 to 24 Year Olds | 6,433 (62.8%) | 3,810 (37.2%) |
| 25 to 34 Year Olds | 4,964 (71.1%) | 2,015 (28.9%) |
| 35 Years and over | 3,307 (73.1%) | 1,218 (26.9%) |
| Total | 64,538 (74.1%) | 22,558 (25.9%) |
Educational Attainment by Field of Study in Cleveland
Business (10,305 | 18.4%), science & technology (5,533 | 9.9%), education (5,262 | 9.4%), social sciences (5,093 | 9.1%), and arts & humanities (4,044 | 7.2%) are the most common fields of study among 56,033 individuals in Cleveland who have obtained a bachelor's degree or higher.
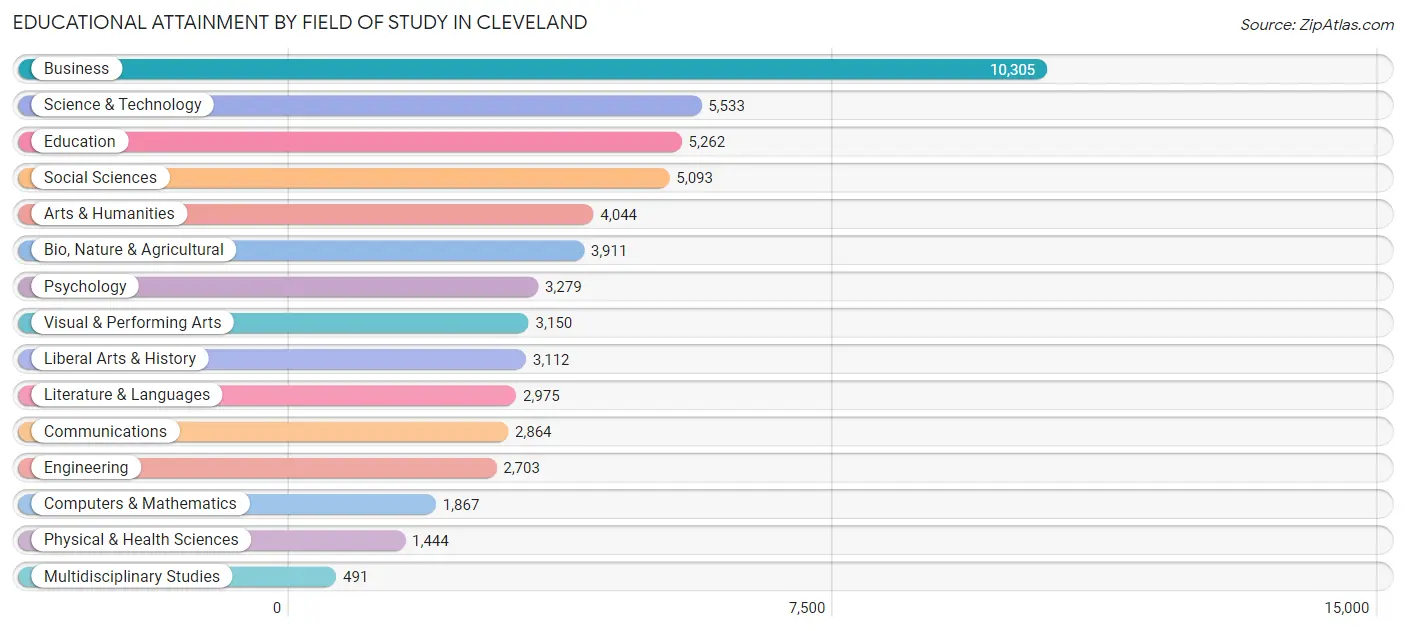
| Field of Study | # Graduates | % Graduates |
| Computers & Mathematics | 1,867 | 3.3% |
| Bio, Nature & Agricultural | 3,911 | 7.0% |
| Physical & Health Sciences | 1,444 | 2.6% |
| Psychology | 3,279 | 5.9% |
| Social Sciences | 5,093 | 9.1% |
| Engineering | 2,703 | 4.8% |
| Multidisciplinary Studies | 491 | 0.9% |
| Science & Technology | 5,533 | 9.9% |
| Business | 10,305 | 18.4% |
| Education | 5,262 | 9.4% |
| Literature & Languages | 2,975 | 5.3% |
| Liberal Arts & History | 3,112 | 5.6% |
| Visual & Performing Arts | 3,150 | 5.6% |
| Communications | 2,864 | 5.1% |
| Arts & Humanities | 4,044 | 7.2% |
| Total | 56,033 | 100.0% |
Transportation & Commute in Cleveland
Vehicle Availability by Sex in Cleveland
The most prevalent vehicle ownership categories in Cleveland are males with 2 vehicles (27,485, accounting for 36.9%) and females with 2 vehicles (26,213, making up 35.4%).
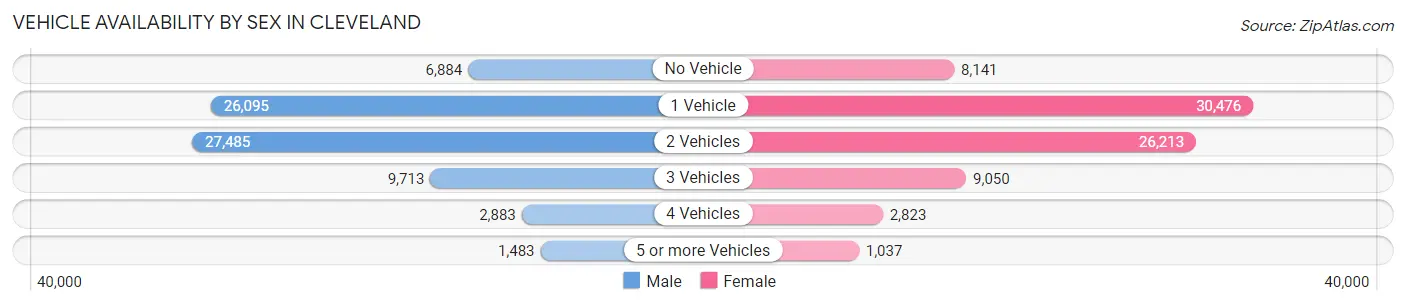
| Vehicles Available | Male | Female |
| No Vehicle | 6,884 (9.2%) | 8,141 (10.5%) |
| 1 Vehicle | 26,095 (35.0%) | 30,476 (39.2%) |
| 2 Vehicles | 27,485 (36.9%) | 26,213 (33.7%) |
| 3 Vehicles | 9,713 (13.0%) | 9,050 (11.6%) |
| 4 Vehicles | 2,883 (3.9%) | 2,823 (3.6%) |
| 5 or more Vehicles | 1,483 (2.0%) | 1,037 (1.3%) |
| Total | 74,543 (100.0%) | 77,740 (100.0%) |
Commute Time in Cleveland
The most frequently occuring commute durations in Cleveland are 15 to 19 minutes (27,851 commuters, 19.8%), 20 to 24 minutes (26,934 commuters, 19.2%), and 10 to 14 minutes (20,769 commuters, 14.8%).
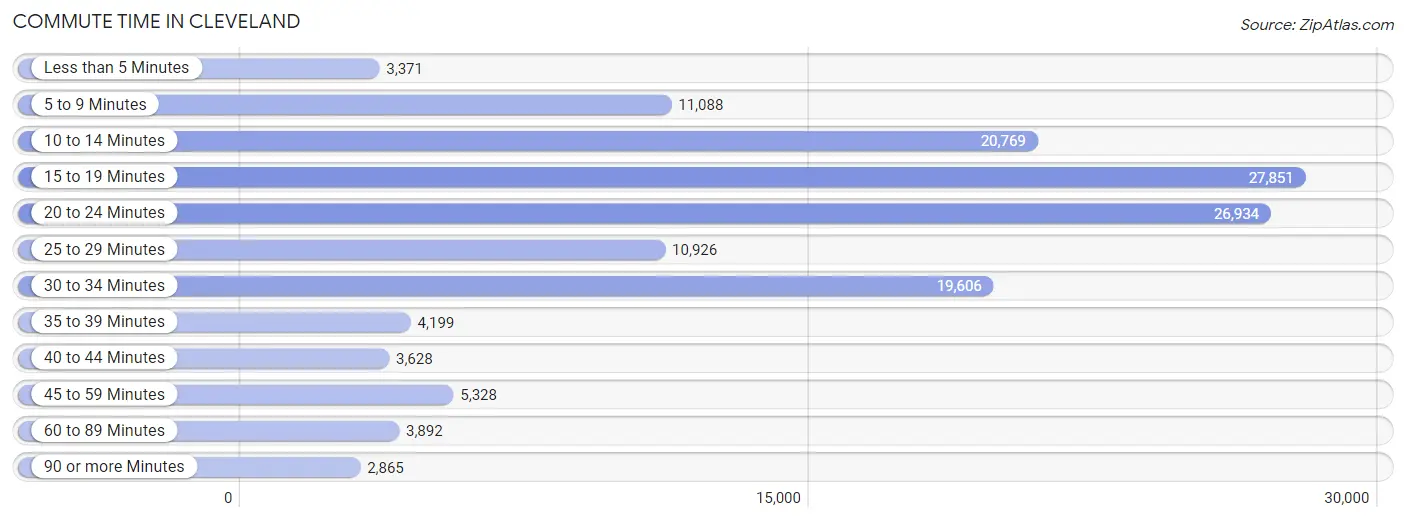
| Commute Time | # Commuters | % Commuters |
| Less than 5 Minutes | 3,371 | 2.4% |
| 5 to 9 Minutes | 11,088 | 7.9% |
| 10 to 14 Minutes | 20,769 | 14.8% |
| 15 to 19 Minutes | 27,851 | 19.8% |
| 20 to 24 Minutes | 26,934 | 19.2% |
| 25 to 29 Minutes | 10,926 | 7.8% |
| 30 to 34 Minutes | 19,606 | 14.0% |
| 35 to 39 Minutes | 4,199 | 3.0% |
| 40 to 44 Minutes | 3,628 | 2.6% |
| 45 to 59 Minutes | 5,328 | 3.8% |
| 60 to 89 Minutes | 3,892 | 2.8% |
| 90 or more Minutes | 2,865 | 2.0% |
Commute Time by Sex in Cleveland
The most common commute times in Cleveland are 15 to 19 minutes (13,975 commuters, 20.0%) for males and 15 to 19 minutes (13,876 commuters, 19.6%) for females.
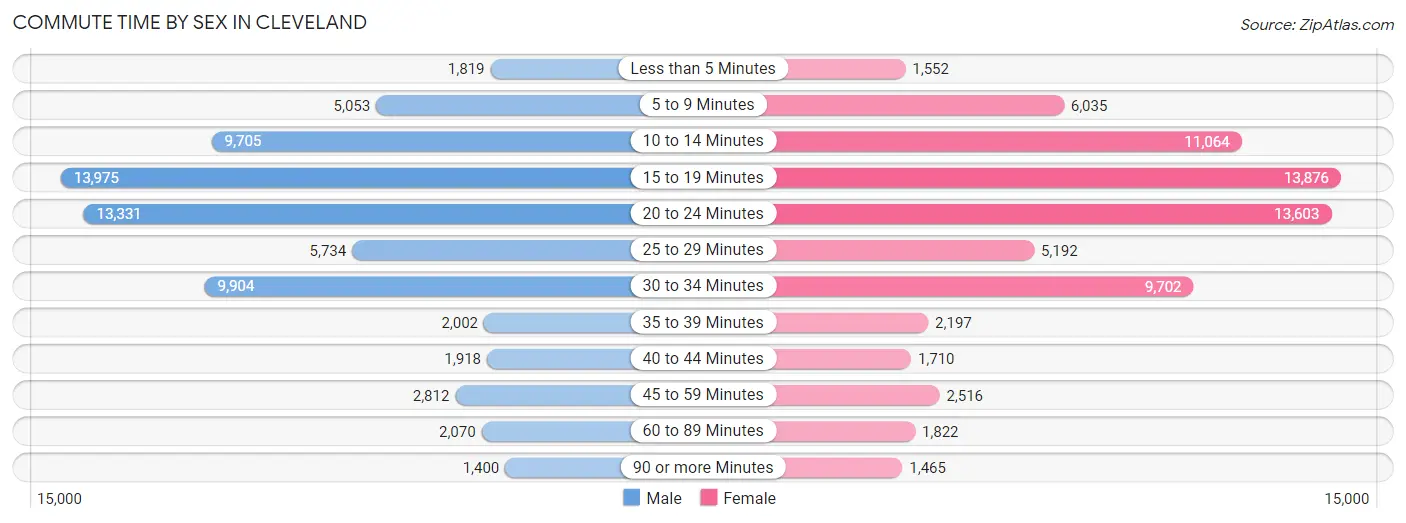
| Commute Time | Male | Female |
| Less than 5 Minutes | 1,819 (2.6%) | 1,552 (2.2%) |
| 5 to 9 Minutes | 5,053 (7.2%) | 6,035 (8.5%) |
| 10 to 14 Minutes | 9,705 (13.9%) | 11,064 (15.6%) |
| 15 to 19 Minutes | 13,975 (20.0%) | 13,876 (19.6%) |
| 20 to 24 Minutes | 13,331 (19.1%) | 13,603 (19.2%) |
| 25 to 29 Minutes | 5,734 (8.2%) | 5,192 (7.3%) |
| 30 to 34 Minutes | 9,904 (14.2%) | 9,702 (13.7%) |
| 35 to 39 Minutes | 2,002 (2.9%) | 2,197 (3.1%) |
| 40 to 44 Minutes | 1,918 (2.8%) | 1,710 (2.4%) |
| 45 to 59 Minutes | 2,812 (4.0%) | 2,516 (3.6%) |
| 60 to 89 Minutes | 2,070 (3.0%) | 1,822 (2.6%) |
| 90 or more Minutes | 1,400 (2.0%) | 1,465 (2.1%) |
Time of Departure to Work by Sex in Cleveland
The most frequent times of departure to work in Cleveland are 7:00 AM to 7:29 AM (8,042, 11.5%) for males and 7:00 AM to 7:29 AM (8,534, 12.1%) for females.
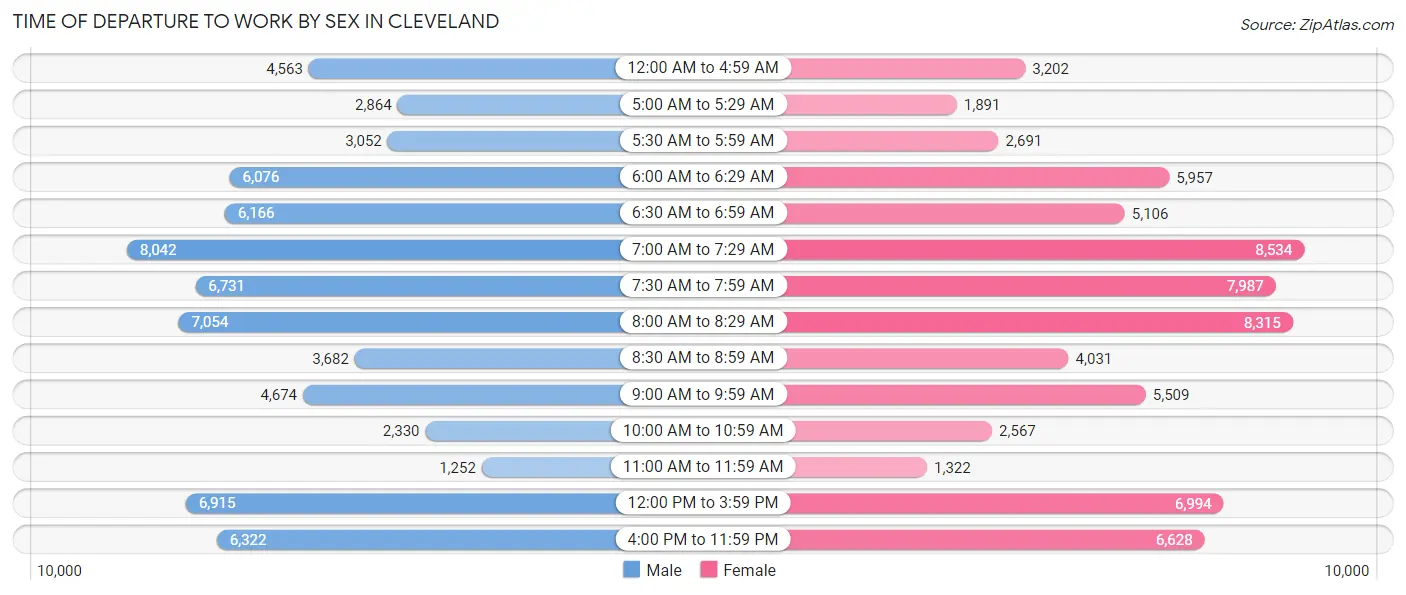
| Time of Departure | Male | Female |
| 12:00 AM to 4:59 AM | 4,563 (6.5%) | 3,202 (4.5%) |
| 5:00 AM to 5:29 AM | 2,864 (4.1%) | 1,891 (2.7%) |
| 5:30 AM to 5:59 AM | 3,052 (4.4%) | 2,691 (3.8%) |
| 6:00 AM to 6:29 AM | 6,076 (8.7%) | 5,957 (8.4%) |
| 6:30 AM to 6:59 AM | 6,166 (8.8%) | 5,106 (7.2%) |
| 7:00 AM to 7:29 AM | 8,042 (11.5%) | 8,534 (12.1%) |
| 7:30 AM to 7:59 AM | 6,731 (9.7%) | 7,987 (11.3%) |
| 8:00 AM to 8:29 AM | 7,054 (10.1%) | 8,315 (11.8%) |
| 8:30 AM to 8:59 AM | 3,682 (5.3%) | 4,031 (5.7%) |
| 9:00 AM to 9:59 AM | 4,674 (6.7%) | 5,509 (7.8%) |
| 10:00 AM to 10:59 AM | 2,330 (3.3%) | 2,567 (3.6%) |
| 11:00 AM to 11:59 AM | 1,252 (1.8%) | 1,322 (1.9%) |
| 12:00 PM to 3:59 PM | 6,915 (9.9%) | 6,994 (9.9%) |
| 4:00 PM to 11:59 PM | 6,322 (9.1%) | 6,628 (9.4%) |
| Total | 69,723 (100.0%) | 70,734 (100.0%) |
Housing Occupancy in Cleveland
Occupancy by Ownership in Cleveland
Of the total 167,829 dwellings in Cleveland, owner-occupied units account for 68,705 (40.9%), while renter-occupied units make up 99,124 (59.1%).
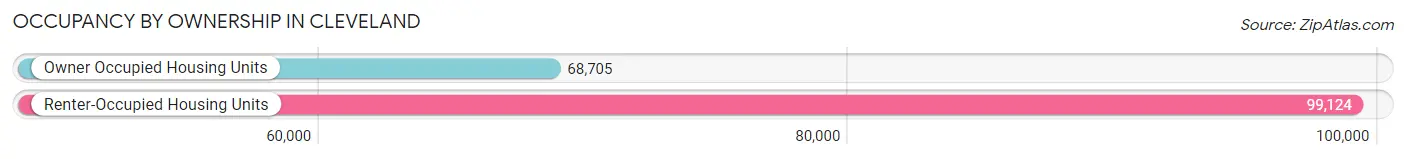
| Occupancy | # Housing Units | % Housing Units |
| Owner Occupied Housing Units | 68,705 | 40.9% |
| Renter-Occupied Housing Units | 99,124 | 59.1% |
| Total Occupied Housing Units | 167,829 | 100.0% |
Occupancy by Household Size in Cleveland
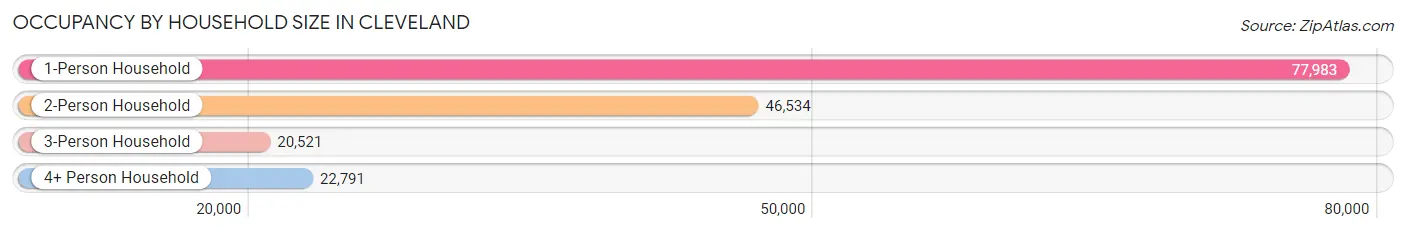
| Household Size | # Housing Units | % Housing Units |
| 1-Person Household | 77,983 | 46.5% |
| 2-Person Household | 46,534 | 27.7% |
| 3-Person Household | 20,521 | 12.2% |
| 4+ Person Household | 22,791 | 13.6% |
| Total Housing Units | 167,829 | 100.0% |
Occupancy by Ownership by Household Size in Cleveland

| Household Size | Owner-occupied | Renter-occupied |
| 1-Person Household | 26,295 (33.7%) | 51,688 (66.3%) |
| 2-Person Household | 22,651 (48.7%) | 23,883 (51.3%) |
| 3-Person Household | 10,048 (49.0%) | 10,473 (51.0%) |
| 4+ Person Household | 9,711 (42.6%) | 13,080 (57.4%) |
| Total Housing Units | 68,705 (40.9%) | 99,124 (59.1%) |
Occupancy by Educational Attainment in Cleveland
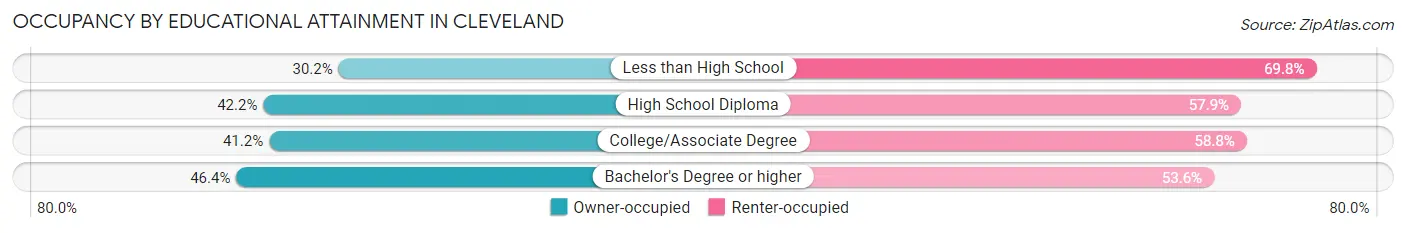
| Household Size | Owner-occupied | Renter-occupied |
| Less than High School | 7,940 (30.2%) | 18,340 (69.8%) |
| High School Diploma | 21,225 (42.1%) | 29,131 (57.9%) |
| College/Associate Degree | 22,268 (41.2%) | 31,728 (58.8%) |
| Bachelor's Degree or higher | 17,272 (46.4%) | 19,925 (53.6%) |
Occupancy by Age of Householder in Cleveland
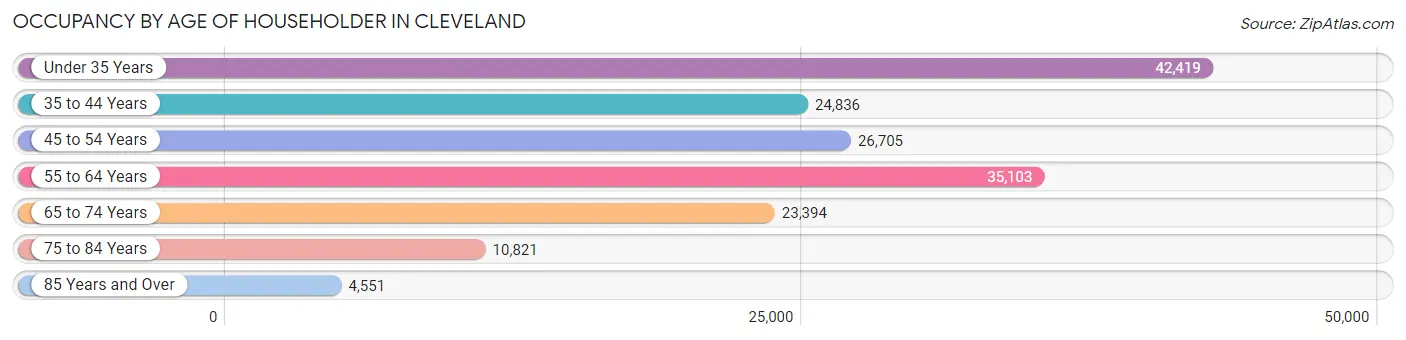
| Age Bracket | # Households | % Households |
| Under 35 Years | 42,419 | 25.3% |
| 35 to 44 Years | 24,836 | 14.8% |
| 45 to 54 Years | 26,705 | 15.9% |
| 55 to 64 Years | 35,103 | 20.9% |
| 65 to 74 Years | 23,394 | 13.9% |
| 75 to 84 Years | 10,821 | 6.5% |
| 85 Years and Over | 4,551 | 2.7% |
| Total | 167,829 | 100.0% |
Housing Finances in Cleveland
Median Income by Occupancy in Cleveland
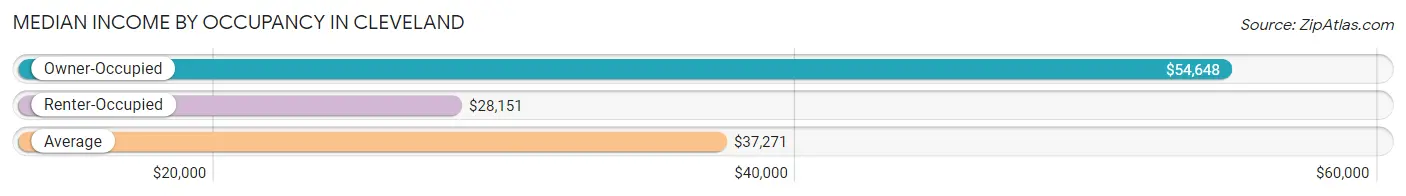
| Occupancy Type | # Households | Median Income |
| Owner-Occupied | 68,705 (40.9%) | $54,648 |
| Renter-Occupied | 99,124 (59.1%) | $28,151 |
| Average | 167,829 (100.0%) | $37,271 |
Occupancy by Householder Income Bracket in Cleveland
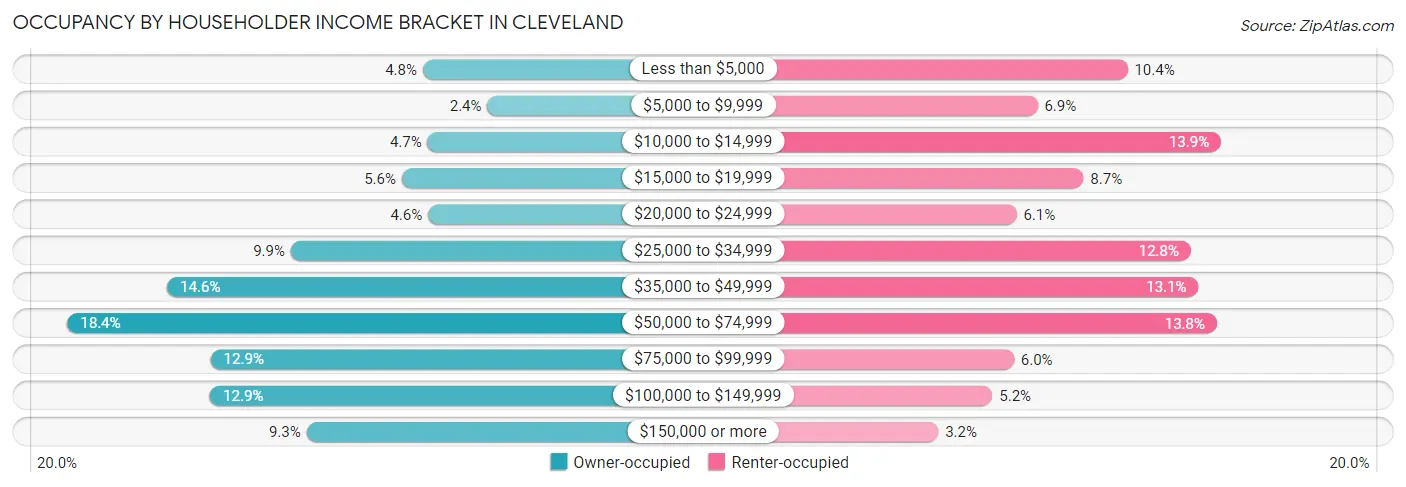
| Income Bracket | Owner-occupied | Renter-occupied |
| Less than $5,000 | 3,316 (4.8%) | 10,265 (10.4%) |
| $5,000 to $9,999 | 1,626 (2.4%) | 6,869 (6.9%) |
| $10,000 to $14,999 | 3,195 (4.6%) | 13,796 (13.9%) |
| $15,000 to $19,999 | 3,866 (5.6%) | 8,603 (8.7%) |
| $20,000 to $24,999 | 3,181 (4.6%) | 6,078 (6.1%) |
| $25,000 to $34,999 | 6,773 (9.9%) | 12,662 (12.8%) |
| $35,000 to $49,999 | 10,013 (14.6%) | 12,944 (13.1%) |
| $50,000 to $74,999 | 12,621 (18.4%) | 13,641 (13.8%) |
| $75,000 to $99,999 | 8,873 (12.9%) | 5,973 (6.0%) |
| $100,000 to $149,999 | 8,882 (12.9%) | 5,169 (5.2%) |
| $150,000 or more | 6,359 (9.3%) | 3,124 (3.2%) |
| Total | 68,705 (100.0%) | 99,124 (100.0%) |
Monthly Housing Cost Tiers in Cleveland
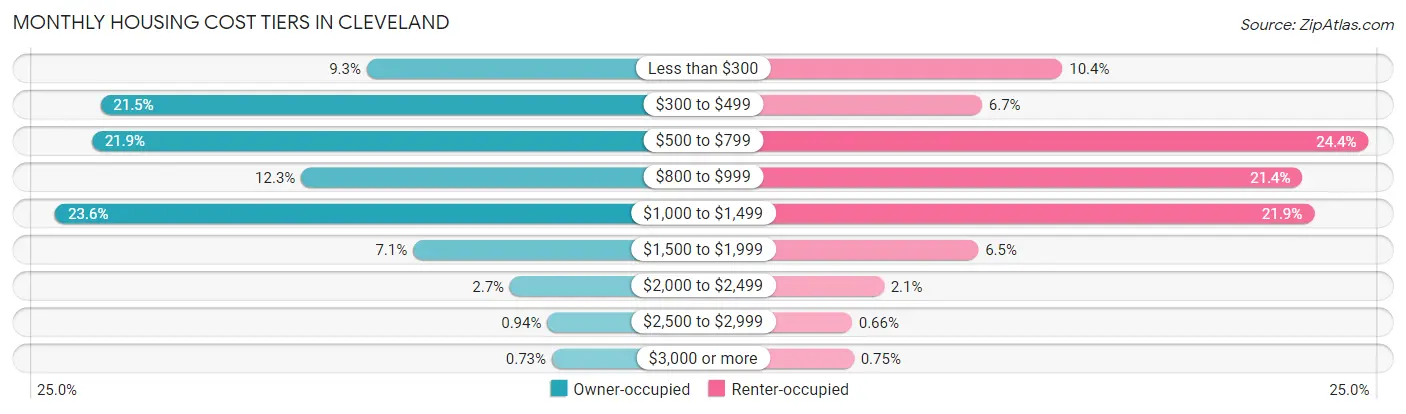
| Monthly Cost | Owner-occupied | Renter-occupied |
| Less than $300 | 6,358 (9.2%) | 10,260 (10.3%) |
| $300 to $499 | 14,780 (21.5%) | 6,587 (6.7%) |
| $500 to $799 | 15,056 (21.9%) | 24,222 (24.4%) |
| $800 to $999 | 8,428 (12.3%) | 21,216 (21.4%) |
| $1,000 to $1,499 | 16,216 (23.6%) | 21,752 (21.9%) |
| $1,500 to $1,999 | 4,891 (7.1%) | 6,419 (6.5%) |
| $2,000 to $2,499 | 1,828 (2.7%) | 2,111 (2.1%) |
| $2,500 to $2,999 | 648 (0.9%) | 658 (0.7%) |
| $3,000 or more | 500 (0.7%) | 742 (0.7%) |
| Total | 68,705 (100.0%) | 99,124 (100.0%) |
Physical Housing Characteristics in Cleveland
Housing Structures in Cleveland
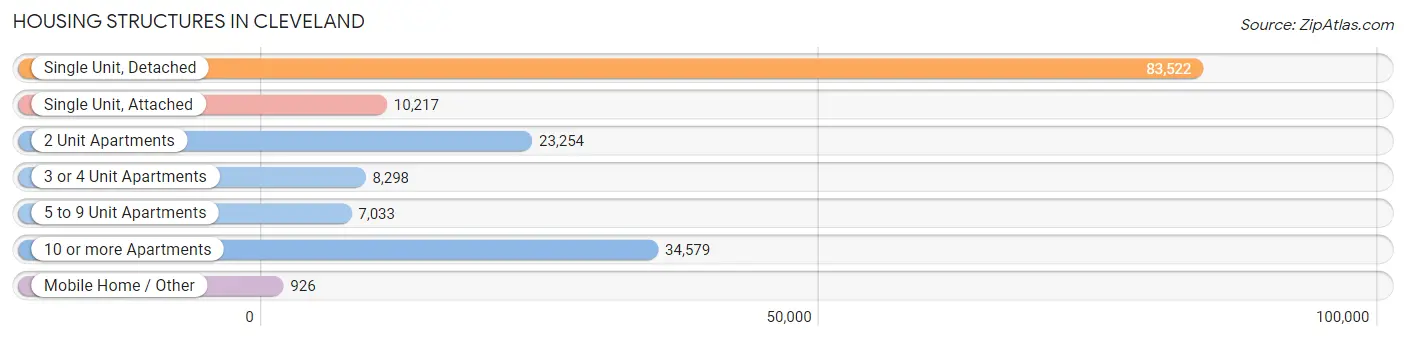
| Structure Type | # Housing Units | % Housing Units |
| Single Unit, Detached | 83,522 | 49.8% |
| Single Unit, Attached | 10,217 | 6.1% |
| 2 Unit Apartments | 23,254 | 13.9% |
| 3 or 4 Unit Apartments | 8,298 | 4.9% |
| 5 to 9 Unit Apartments | 7,033 | 4.2% |
| 10 or more Apartments | 34,579 | 20.6% |
| Mobile Home / Other | 926 | 0.5% |
| Total | 167,829 | 100.0% |
Housing Structures by Occupancy in Cleveland
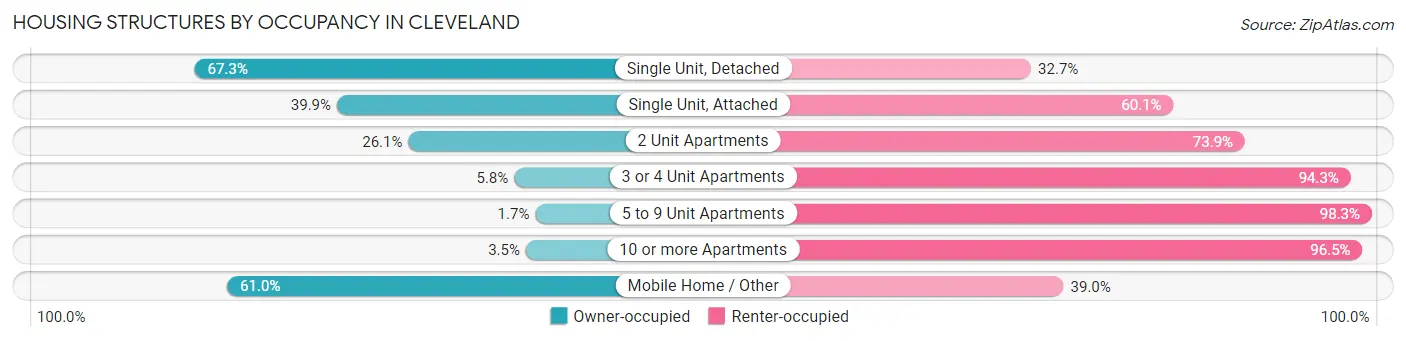
| Structure Type | Owner-occupied | Renter-occupied |
| Single Unit, Detached | 56,186 (67.3%) | 27,336 (32.7%) |
| Single Unit, Attached | 4,075 (39.9%) | 6,142 (60.1%) |
| 2 Unit Apartments | 6,073 (26.1%) | 17,181 (73.9%) |
| 3 or 4 Unit Apartments | 477 (5.8%) | 7,821 (94.3%) |
| 5 to 9 Unit Apartments | 118 (1.7%) | 6,915 (98.3%) |
| 10 or more Apartments | 1,211 (3.5%) | 33,368 (96.5%) |
| Mobile Home / Other | 565 (61.0%) | 361 (39.0%) |
| Total | 68,705 (40.9%) | 99,124 (59.1%) |
Housing Structures by Number of Rooms in Cleveland
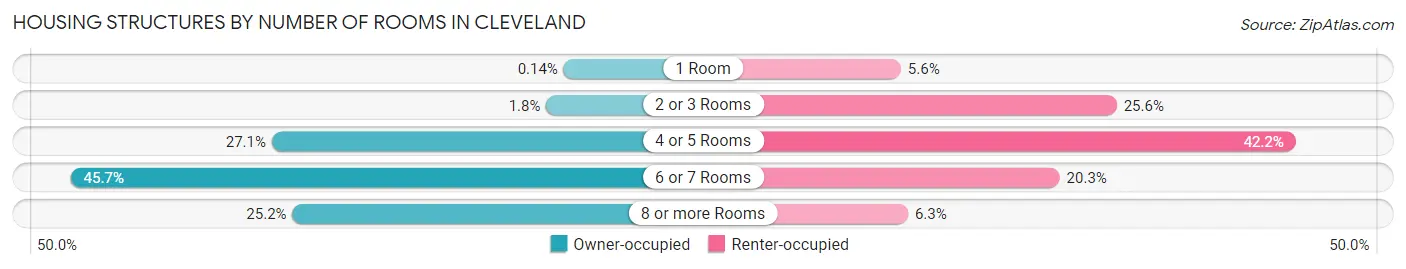
| Number of Rooms | Owner-occupied | Renter-occupied |
| 1 Room | 93 (0.1%) | 5,590 (5.6%) |
| 2 or 3 Rooms | 1,200 (1.8%) | 25,375 (25.6%) |
| 4 or 5 Rooms | 18,648 (27.1%) | 41,777 (42.1%) |
| 6 or 7 Rooms | 31,428 (45.7%) | 20,144 (20.3%) |
| 8 or more Rooms | 17,336 (25.2%) | 6,238 (6.3%) |
| Total | 68,705 (100.0%) | 99,124 (100.0%) |
Housing Structure by Heating Type in Cleveland
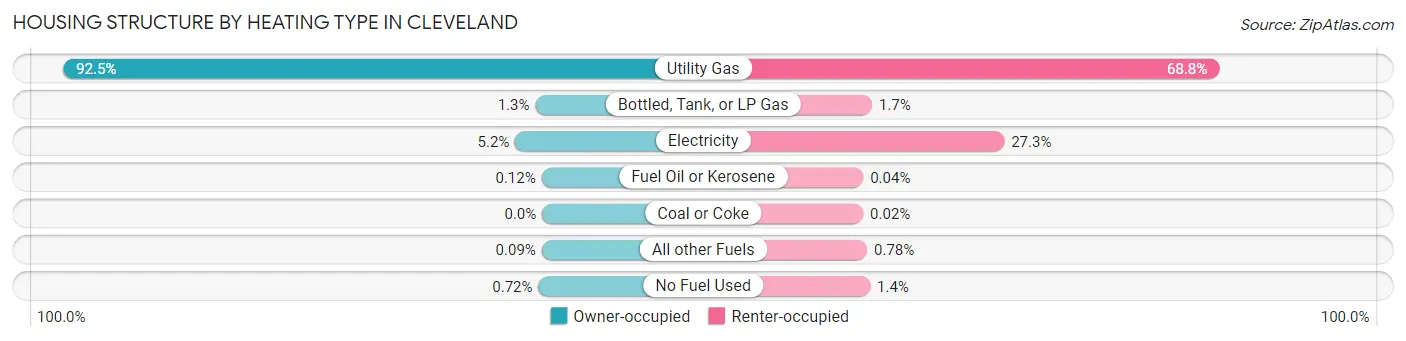
| Heating Type | Owner-occupied | Renter-occupied |
| Utility Gas | 63,582 (92.5%) | 68,194 (68.8%) |
| Bottled, Tank, or LP Gas | 905 (1.3%) | 1,712 (1.7%) |
| Electricity | 3,575 (5.2%) | 27,037 (27.3%) |
| Fuel Oil or Kerosene | 83 (0.1%) | 39 (0.0%) |
| Coal or Coke | 0 (0.0%) | 24 (0.0%) |
| All other Fuels | 63 (0.1%) | 772 (0.8%) |
| No Fuel Used | 497 (0.7%) | 1,346 (1.4%) |
| Total | 68,705 (100.0%) | 99,124 (100.0%) |
Household Vehicle Usage in Cleveland
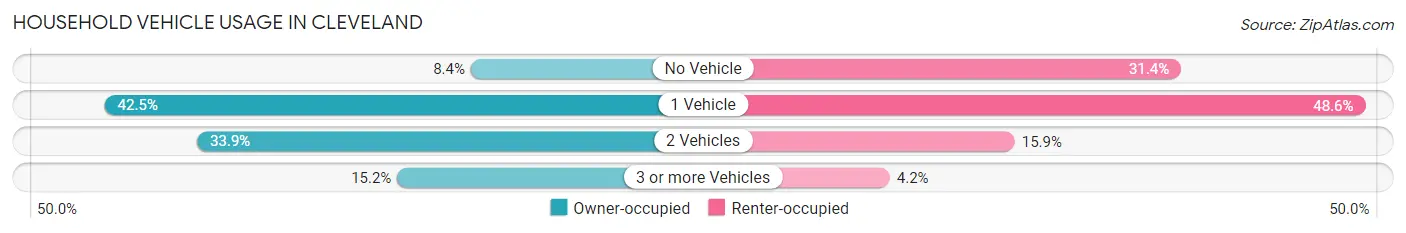
| Vehicles per Household | Owner-occupied | Renter-occupied |
| No Vehicle | 5,735 (8.4%) | 31,102 (31.4%) |
| 1 Vehicle | 29,219 (42.5%) | 48,152 (48.6%) |
| 2 Vehicles | 23,297 (33.9%) | 15,718 (15.9%) |
| 3 or more Vehicles | 10,454 (15.2%) | 4,152 (4.2%) |
| Total | 68,705 (100.0%) | 99,124 (100.0%) |
Real Estate & Mortgages in Cleveland
Real Estate and Mortgage Overview in Cleveland
| Characteristic | Without Mortgage | With Mortgage |
| Housing Units | 32,708 | 35,997 |
| Median Property Value | $68,900 | $101,400 |
| Median Household Income | $42,908 | $4,590 |
| Monthly Housing Costs | $444 | $474 |
| Real Estate Taxes | $1,329 | $2,023 |
Property Value by Mortgage Status in Cleveland
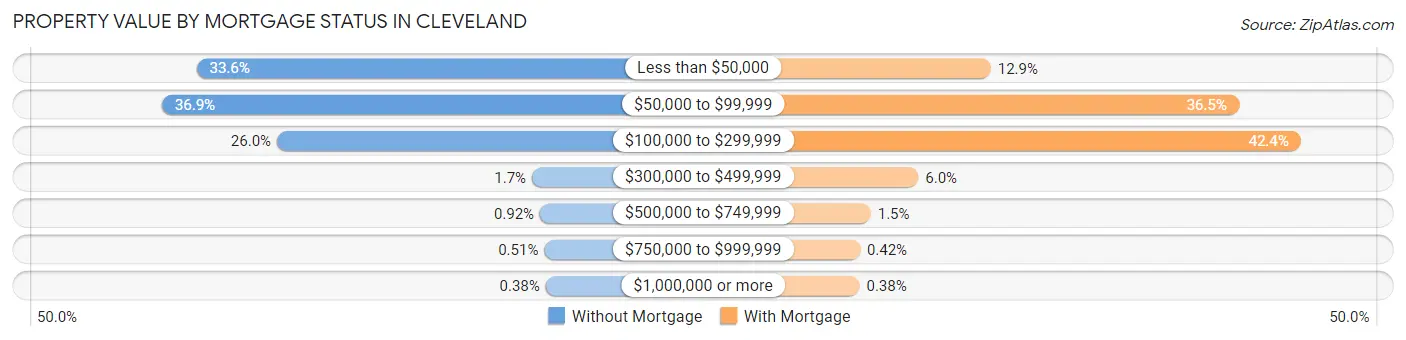
| Property Value | Without Mortgage | With Mortgage |
| Less than $50,000 | 10,997 (33.6%) | 4,637 (12.9%) |
| $50,000 to $99,999 | 12,077 (36.9%) | 13,136 (36.5%) |
| $100,000 to $299,999 | 8,493 (26.0%) | 15,263 (42.4%) |
| $300,000 to $499,999 | 548 (1.7%) | 2,152 (6.0%) |
| $500,000 to $749,999 | 301 (0.9%) | 523 (1.5%) |
| $750,000 to $999,999 | 168 (0.5%) | 150 (0.4%) |
| $1,000,000 or more | 124 (0.4%) | 136 (0.4%) |
| Total | 32,708 (100.0%) | 35,997 (100.0%) |
Household Income by Mortgage Status in Cleveland
| Household Income | Without Mortgage | With Mortgage |
| Less than $10,000 | 3,058 (9.3%) | 1,280 (3.6%) |
| $10,000 to $24,999 | 6,680 (20.4%) | 1,884 (5.2%) |
| $25,000 to $34,999 | 3,815 (11.7%) | 3,562 (9.9%) |
| $35,000 to $49,999 | 5,154 (15.8%) | 2,958 (8.2%) |
| $50,000 to $74,999 | 5,799 (17.7%) | 4,859 (13.5%) |
| $75,000 to $99,999 | 3,228 (9.9%) | 6,822 (19.0%) |
| $100,000 to $149,999 | 3,205 (9.8%) | 5,645 (15.7%) |
| $150,000 or more | 1,769 (5.4%) | 5,677 (15.8%) |
| Total | 32,708 (100.0%) | 35,997 (100.0%) |
Property Value to Household Income Ratio in Cleveland
| Value-to-Income Ratio | Without Mortgage | With Mortgage |
| Less than 2.0x | 18,806 (57.5%) | 67,621 (187.9%) |
| 2.0x to 2.9x | 4,351 (13.3%) | 21,564 (59.9%) |
| 3.0x to 3.9x | 2,759 (8.4%) | 5,867 (16.3%) |
| 4.0x or more | 5,986 (18.3%) | 2,725 (7.6%) |
| Total | 32,708 (100.0%) | 35,997 (100.0%) |
Real Estate Taxes by Mortgage Status in Cleveland
| Property Taxes | Without Mortgage | With Mortgage |
| Less than $800 | 8,053 (24.6%) | 806 (2.2%) |
| $800 to $1,499 | 9,662 (29.5%) | 4,125 (11.5%) |
| $800 to $1,499 | 13,157 (40.2%) | 7,961 (22.1%) |
| Total | 32,708 (100.0%) | 35,997 (100.0%) |
Health & Disability in Cleveland
Health Insurance Coverage by Age in Cleveland
| Age Bracket | With Coverage | Without Coverage |
| Under 6 Years | 23,957 (97.1%) | 714 (2.9%) |
| 6 to 18 Years | 56,172 (95.8%) | 2,442 (4.2%) |
| 19 to 25 Years | 34,932 (89.6%) | 4,046 (10.4%) |
| 26 to 34 Years | 47,826 (87.2%) | 7,002 (12.8%) |
| 35 to 44 Years | 37,486 (87.1%) | 5,558 (12.9%) |
| 45 to 54 Years | 38,630 (91.2%) | 3,723 (8.8%) |
| 55 to 64 Years | 46,797 (93.2%) | 3,411 (6.8%) |
| 65 to 74 Years | 31,487 (99.2%) | 268 (0.8%) |
| 75 Years and older | 20,208 (99.5%) | 111 (0.5%) |
| Total | 337,495 (92.5%) | 27,275 (7.5%) |
Health Insurance Coverage by Citizenship Status in Cleveland
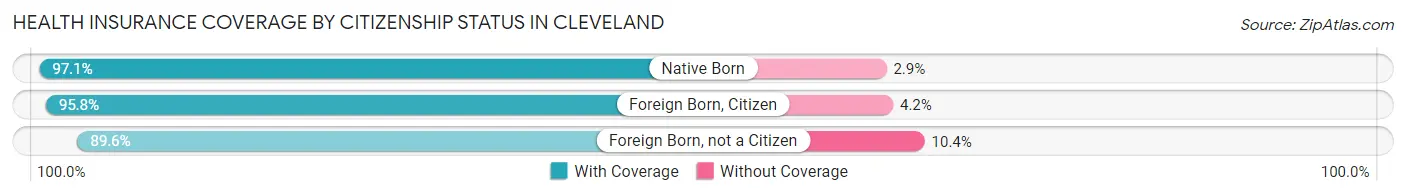
| Citizenship Status | With Coverage | Without Coverage |
| Native Born | 23,957 (97.1%) | 714 (2.9%) |
| Foreign Born, Citizen | 56,172 (95.8%) | 2,442 (4.2%) |
| Foreign Born, not a Citizen | 34,932 (89.6%) | 4,046 (10.4%) |
Health Insurance Coverage by Household Income in Cleveland
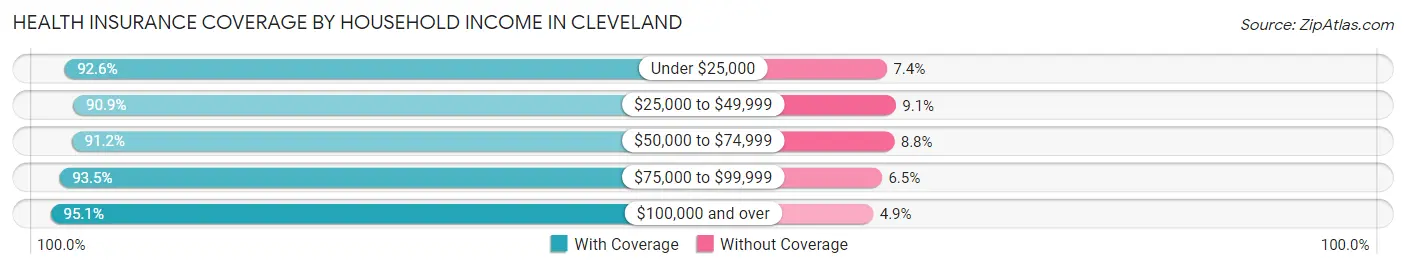
| Household Income | With Coverage | Without Coverage |
| Under $25,000 | 94,519 (92.6%) | 7,586 (7.4%) |
| $25,000 to $49,999 | 82,859 (90.9%) | 8,294 (9.1%) |
| $50,000 to $74,999 | 54,409 (91.2%) | 5,247 (8.8%) |
| $75,000 to $99,999 | 35,773 (93.5%) | 2,481 (6.5%) |
| $100,000 and over | 63,675 (95.1%) | 3,260 (4.9%) |
Public vs Private Health Insurance Coverage by Age in Cleveland
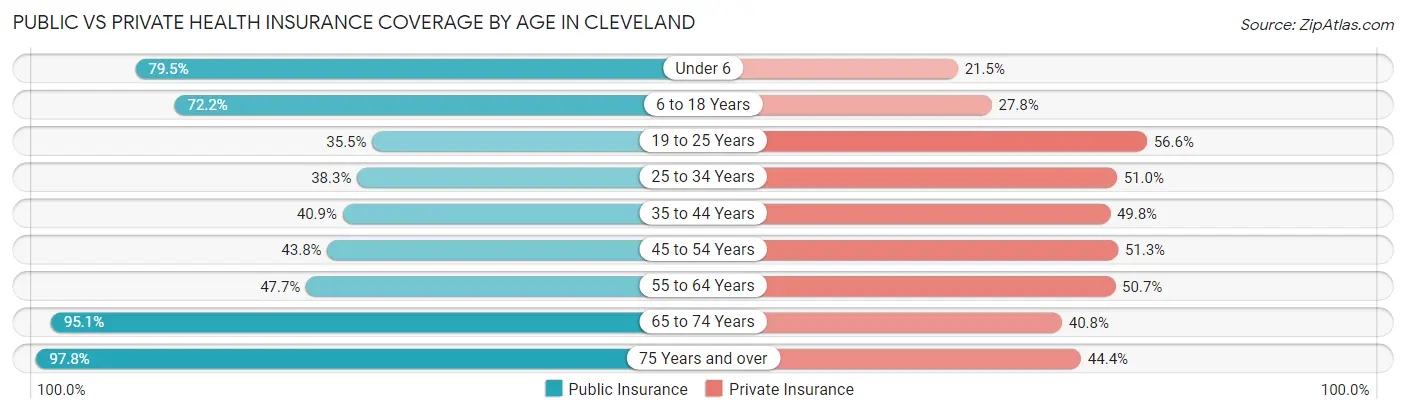
| Age Bracket | Public Insurance | Private Insurance |
| Under 6 | 19,600 (79.4%) | 5,309 (21.5%) |
| 6 to 18 Years | 42,315 (72.2%) | 16,292 (27.8%) |
| 19 to 25 Years | 13,818 (35.4%) | 22,060 (56.6%) |
| 25 to 34 Years | 20,978 (38.3%) | 27,981 (51.0%) |
| 35 to 44 Years | 17,621 (40.9%) | 21,422 (49.8%) |
| 45 to 54 Years | 18,547 (43.8%) | 21,709 (51.3%) |
| 55 to 64 Years | 23,962 (47.7%) | 25,475 (50.7%) |
| 65 to 74 Years | 30,207 (95.1%) | 12,970 (40.8%) |
| 75 Years and over | 19,871 (97.8%) | 9,017 (44.4%) |
| Total | 206,919 (56.7%) | 162,235 (44.5%) |
Disability Status by Sex by Age in Cleveland
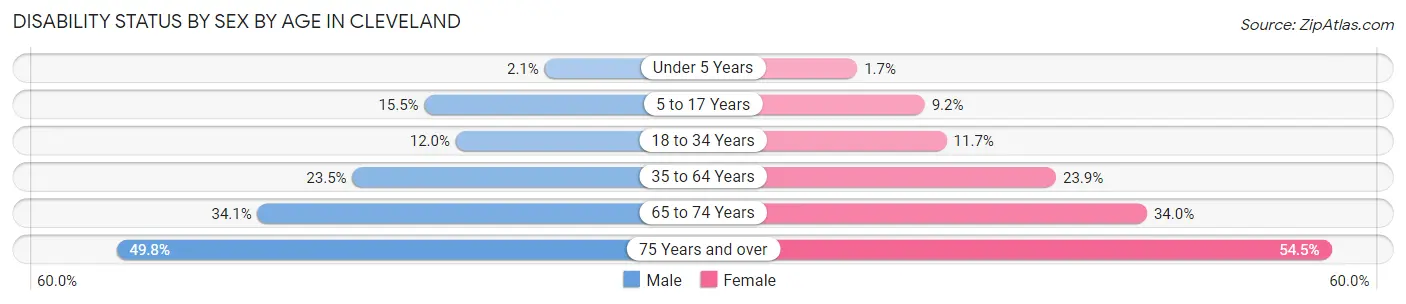
| Age Bracket | Male | Female |
| Under 5 Years | 225 (2.1%) | 172 (1.7%) |
| 5 to 17 Years | 4,455 (15.5%) | 2,662 (9.2%) |
| 18 to 34 Years | 5,759 (12.0%) | 5,911 (11.7%) |
| 35 to 64 Years | 15,849 (23.5%) | 16,259 (23.9%) |
| 65 to 74 Years | 4,976 (34.1%) | 5,828 (34.0%) |
| 75 Years and over | 3,767 (49.8%) | 6,950 (54.5%) |
Disability Class by Sex by Age in Cleveland
Disability Class: Hearing Difficulty
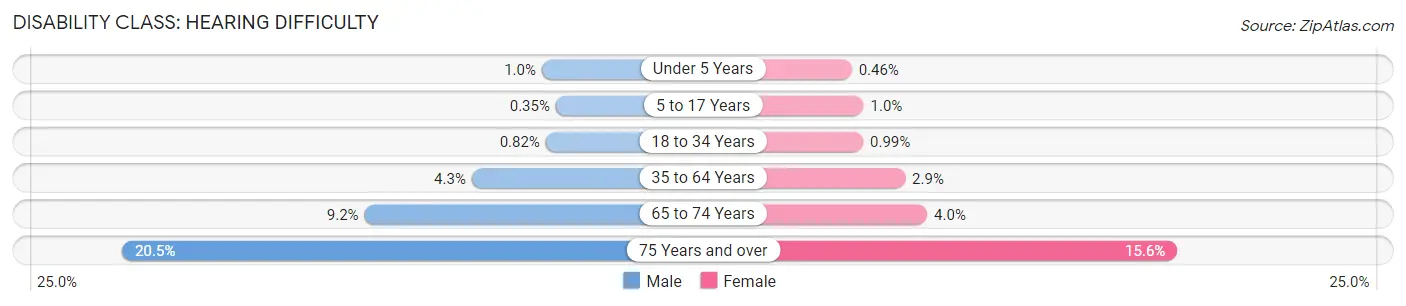
| Age Bracket | Male | Female |
| Under 5 Years | 108 (1.0%) | 46 (0.5%) |
| 5 to 17 Years | 101 (0.4%) | 290 (1.0%) |
| 18 to 34 Years | 394 (0.8%) | 500 (1.0%) |
| 35 to 64 Years | 2,865 (4.3%) | 2,003 (2.9%) |
| 65 to 74 Years | 1,349 (9.2%) | 679 (4.0%) |
| 75 Years and over | 1,550 (20.5%) | 1,984 (15.6%) |
Disability Class: Vision Difficulty
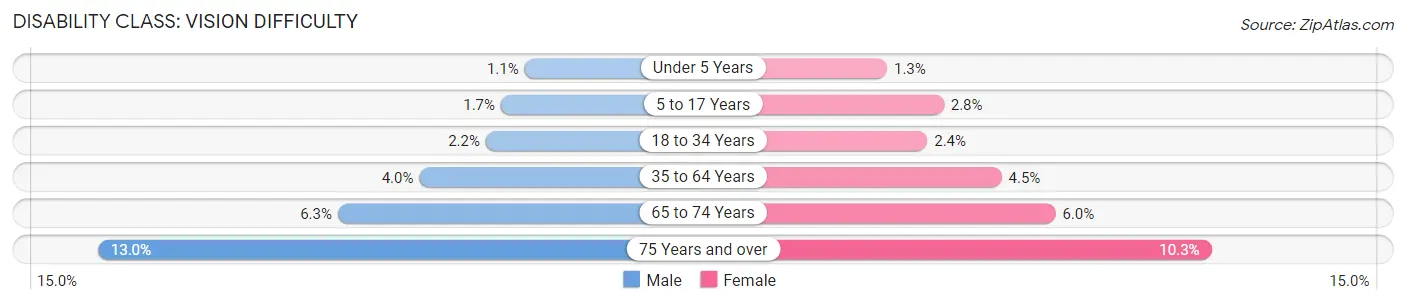
| Age Bracket | Male | Female |
| Under 5 Years | 117 (1.1%) | 126 (1.3%) |
| 5 to 17 Years | 502 (1.7%) | 817 (2.8%) |
| 18 to 34 Years | 1,037 (2.2%) | 1,205 (2.4%) |
| 35 to 64 Years | 2,703 (4.0%) | 3,029 (4.4%) |
| 65 to 74 Years | 917 (6.3%) | 1,021 (5.9%) |
| 75 Years and over | 981 (13.0%) | 1,312 (10.3%) |
Disability Class: Cognitive Difficulty
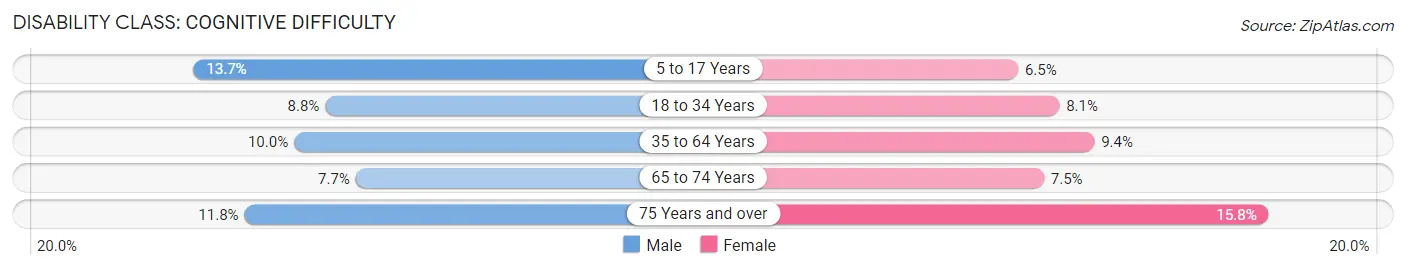
| Age Bracket | Male | Female |
| 5 to 17 Years | 3,953 (13.7%) | 1,885 (6.5%) |
| 18 to 34 Years | 4,253 (8.8%) | 4,083 (8.1%) |
| 35 to 64 Years | 6,749 (10.0%) | 6,385 (9.4%) |
| 65 to 74 Years | 1,127 (7.7%) | 1,286 (7.5%) |
| 75 Years and over | 896 (11.8%) | 2,019 (15.8%) |
Disability Class: Ambulatory Difficulty
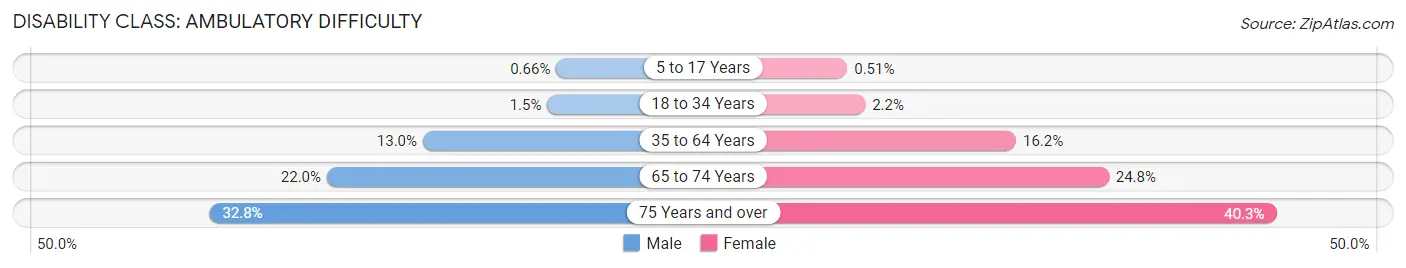
| Age Bracket | Male | Female |
| 5 to 17 Years | 190 (0.7%) | 147 (0.5%) |
| 18 to 34 Years | 718 (1.5%) | 1,099 (2.2%) |
| 35 to 64 Years | 8,798 (13.0%) | 11,017 (16.2%) |
| 65 to 74 Years | 3,207 (22.0%) | 4,248 (24.8%) |
| 75 Years and over | 2,486 (32.8%) | 5,140 (40.3%) |
Disability Class: Self-Care Difficulty
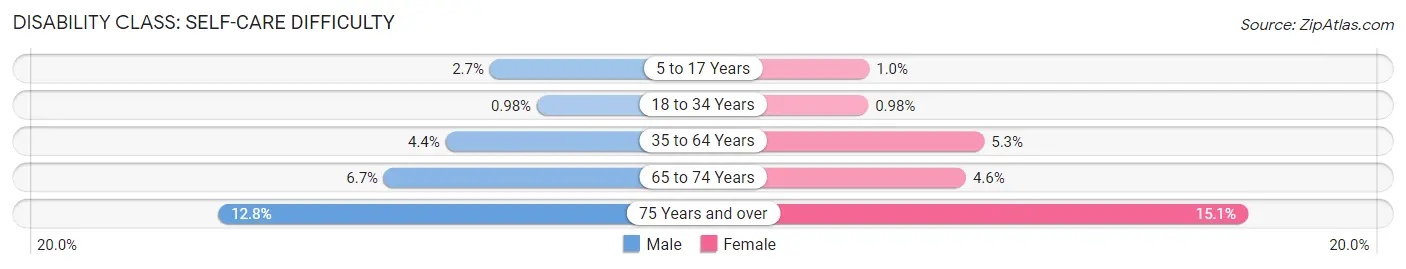
| Age Bracket | Male | Female |
| 5 to 17 Years | 787 (2.7%) | 293 (1.0%) |
| 18 to 34 Years | 471 (1.0%) | 496 (1.0%) |
| 35 to 64 Years | 2,945 (4.4%) | 3,603 (5.3%) |
| 65 to 74 Years | 973 (6.7%) | 790 (4.6%) |
| 75 Years and over | 970 (12.8%) | 1,921 (15.1%) |
Technology Access in Cleveland
Computing Device Access in Cleveland
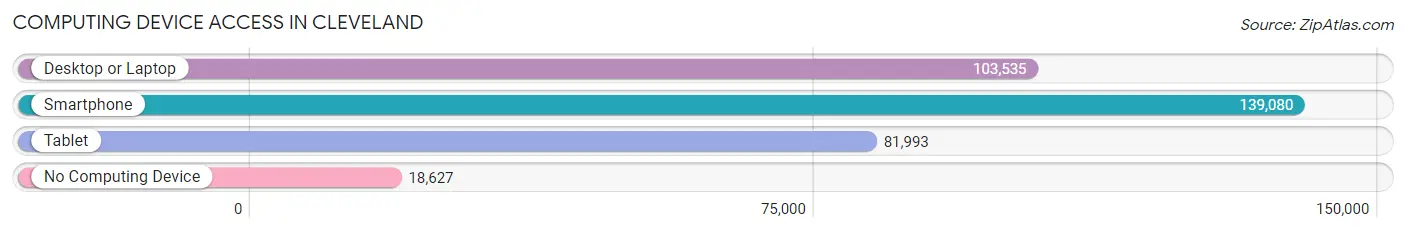
| Device Type | # Households | % Households |
| Desktop or Laptop | 103,535 | 61.7% |
| Smartphone | 139,080 | 82.9% |
| Tablet | 81,993 | 48.9% |
| No Computing Device | 18,627 | 11.1% |
| Total | 167,829 | 100.0% |
Internet Access in Cleveland
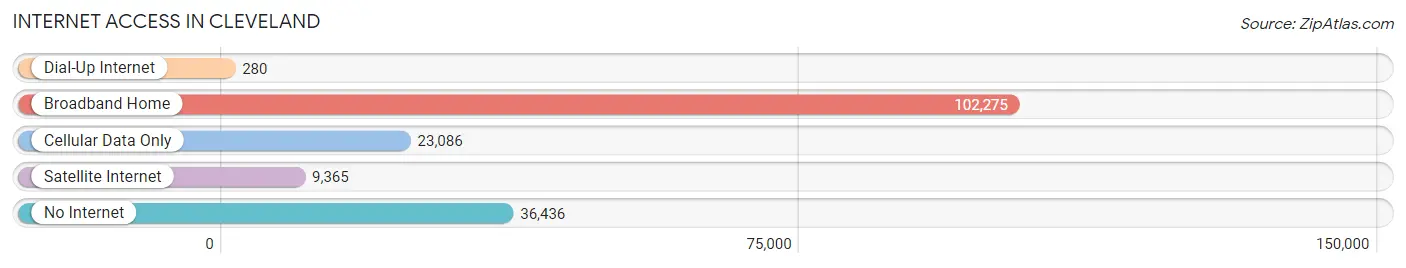
| Internet Type | # Households | % Households |
| Dial-Up Internet | 280 | 0.2% |
| Broadband Home | 102,275 | 60.9% |
| Cellular Data Only | 23,086 | 13.8% |
| Satellite Internet | 9,365 | 5.6% |
| No Internet | 36,436 | 21.7% |
| Total | 167,829 | 100.0% |
Cleveland Summary
Cleveland, Ohio is a major city located in the northeastern part of the United States. It is the second largest city in Ohio and the 48th largest city in the United States. It is located on the southern shore of Lake Erie, approximately 60 miles west of the Pennsylvania border.
History
Cleveland was founded in 1796 by General Moses Cleaveland, a surveyor for the Connecticut Land Company. The city was named after him and was incorporated in 1836. In the early 19th century, Cleveland was a major port city and a hub for the Great Lakes region. It was also a major manufacturing center, with steel mills, automotive factories, and other industries.
In the late 19th century, Cleveland was a major center of immigration, with many immigrants from Eastern and Southern Europe settling in the city. This influx of immigrants helped to shape the city’s culture and economy.
In the early 20th century, Cleveland was a major center of industry and manufacturing. It was also a major center of culture, with many museums, theaters, and other cultural institutions.
In the late 20th century, Cleveland experienced a period of economic decline, as many of its industries moved away or closed down. The city has since experienced a resurgence, with a focus on technology, healthcare, and other industries.
Geography
Cleveland is located in the northeastern part of Ohio, on the southern shore of Lake Erie. It is approximately 60 miles west of the Pennsylvania border. The city is situated on a plateau, with the Cuyahoga River running through the center of the city.
The city has a total area of 82.7 square miles, of which 79.2 square miles is land and 3.5 square miles is water. The city is divided into several neighborhoods, including Downtown, Ohio City, Tremont, and University Circle.
Economy
Cleveland’s economy is largely based on services, manufacturing, and healthcare. The city is home to several major corporations, including KeyCorp, Sherwin-Williams, and Eaton Corporation.
The city is also home to several major healthcare institutions, including the Cleveland Clinic, University Hospitals, and MetroHealth.
The city is also home to several major universities, including Case Western Reserve University, Cleveland State University, and the University of Akron.
Demographics
As of the 2010 census, the population of Cleveland was 396,815. The city is racially diverse, with the largest racial groups being African American (53.3%), White (35.2%), and Hispanic or Latino (7.3%).
The median household income in Cleveland is $26,845, and the median family income is $32,945. The city has a poverty rate of 33.3%, which is higher than the national average.
Conclusion
Cleveland, Ohio is a major city located in the northeastern part of the United States. It is the second largest city in Ohio and the 48th largest city in the United States. It is located on the southern shore of Lake Erie, approximately 60 miles west of the Pennsylvania border. The city has a long history, and has experienced periods of economic decline and resurgence. The city’s economy is largely based on services, manufacturing, and healthcare. The city is racially diverse, with the largest racial groups being African American, White, and Hispanic or Latino. The median household income in Cleveland is $26,845, and the poverty rate is 33.3%.
Common Questions
What is Per Capita Income in Cleveland?
Per Capita income in Cleveland is $26,040.
What is the Median Family Income in Cleveland?
Median Family Income in Cleveland is $46,784.
What is the Median Household income in Cleveland?
Median Household Income in Cleveland is $37,271.
What is Income or Wage Gap in Cleveland?
Income or Wage Gap in Cleveland is 14.9%.
Women in Cleveland earn 85.1 cents for every dollar earned by a man.
What is Family Income Deficit in Cleveland?
Family Income Deficit in Cleveland is $11,601.
Families that are below poverty line in Cleveland earn $11,601 less on average than the poverty threshold level.
What is Inequality or Gini Index in Cleveland?
Inequality or Gini Index in Cleveland is 0.52.
What is the Total Population of Cleveland?
Total Population of Cleveland is 370,365.
What is the Total Male Population of Cleveland?
Total Male Population of Cleveland is 180,693.
What is the Total Female Population of Cleveland?
Total Female Population of Cleveland is 189,672.
What is the Ratio of Males per 100 Females in Cleveland?
There are 95.27 Males per 100 Females in Cleveland.
What is the Ratio of Females per 100 Males in Cleveland?
There are 104.97 Females per 100 Males in Cleveland.
What is the Median Population Age in Cleveland?
Median Population Age in Cleveland is 36.3 Years.
What is the Average Family Size in Cleveland
Average Family Size in Cleveland is 3.1 People.
What is the Average Household Size in Cleveland
Average Household Size in Cleveland is 2.1 People.
How Large is the Labor Force in Cleveland?
There are 179,251 People in the Labor Forcein in Cleveland.
What is the Percentage of People in the Labor Force in Cleveland?
59.6% of People are in the Labor Force in Cleveland.
What is the Unemployment Rate in Cleveland?
Unemployment Rate in Cleveland is 11.9%.