Beulah Beach, OH Map & Demographics
Beulah Beach Map
Beulah Beach Overview
$27,967
PER CAPITA INCOME
0.24
INEQUALITY / GINI INDEX
67
TOTAL POPULATION
32
MALE POPULATION
35
FEMALE POPULATION
91.43
MALES / 100 FEMALES
109.38
FEMALES / 100 MALES
58.8
MEDIAN AGE
2.5
AVG FAMILY SIZE
1.9
AVG HOUSEHOLD SIZE
51
LABOR FORCE [ PEOPLE ]
76.1%
PERCENT IN LABOR FORCE
25.5%
UNEMPLOYMENT RATE
Income in Beulah Beach
Income Overview in Beulah Beach
| Characteristic | Number | Measure |
| Per Capita Income | 67 | $27,967 |
| Median Family Income | 21 | $0 |
| Mean Family Income | 21 | $0 |
| Median Household Income | 35 | $0 |
| Mean Household Income | 35 | $39,523 |
| Income Deficit | 21 | $0 |
| Wage / Income Gap (%) | 67 | 0.00% |
| Wage / Income Gap ($) | 67 | 100.00¢ per $1 |
| Gini / Inequality Index | 67 | 0.24 |
Earnings by Sex in Beulah Beach
| Sex | Number | Average Earnings |
| Male | 24 (47.1%) | $0 |
| Female | 27 (52.9%) | $0 |
| Total | 51 (100.0%) | $0 |
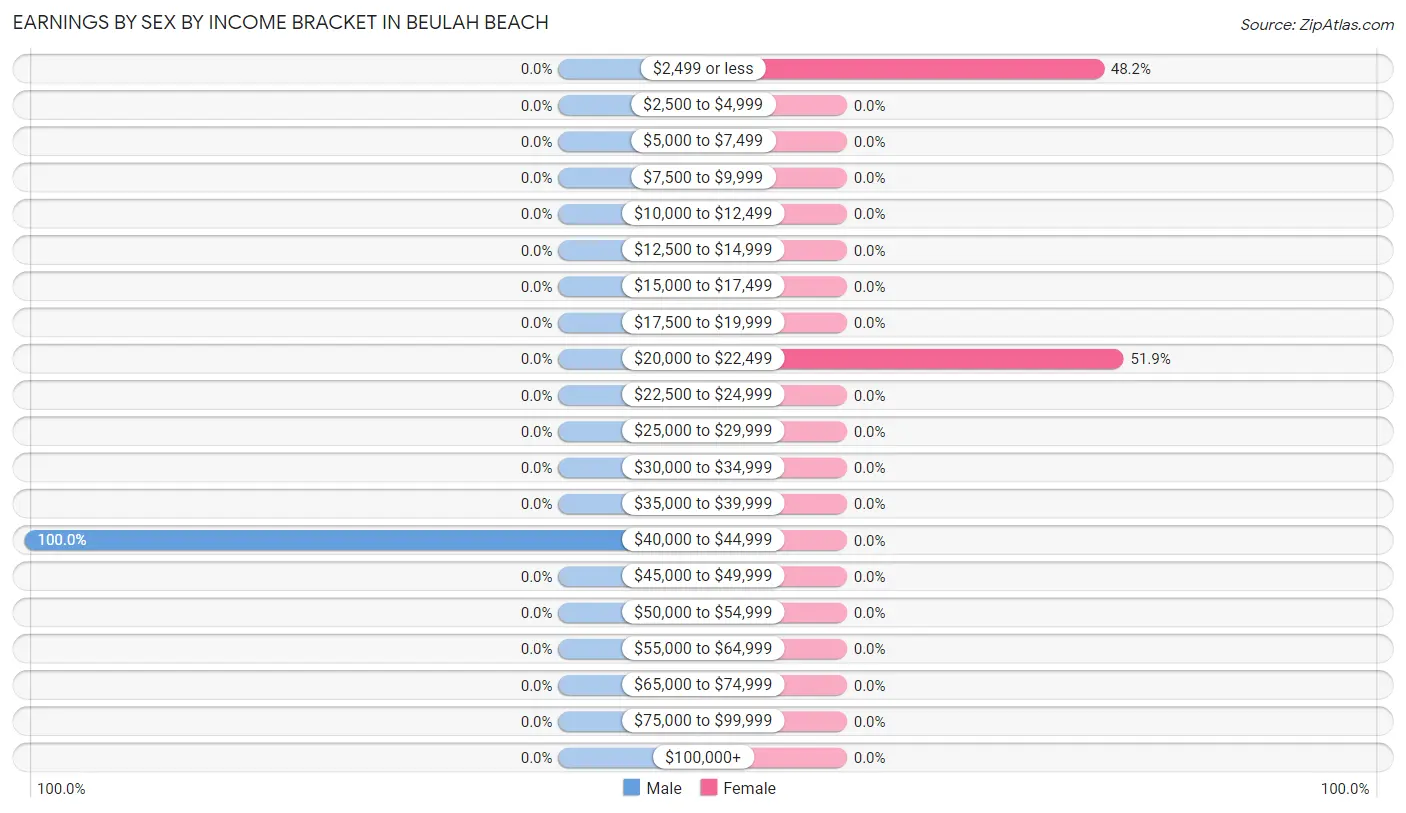
Earnings by Sex by Income Bracket in Beulah Beach
The most common earnings brackets in Beulah Beach are $40,000 to $44,999 for men (24 | 100.0%) and $20,000 to $22,499 for women (14 | 51.8%).
| Income | Male | Female |
| $2,499 or less | 0 (0.0%) | 13 (48.1%) |
| $2,500 to $4,999 | 0 (0.0%) | 0 (0.0%) |
| $5,000 to $7,499 | 0 (0.0%) | 0 (0.0%) |
| $7,500 to $9,999 | 0 (0.0%) | 0 (0.0%) |
| $10,000 to $12,499 | 0 (0.0%) | 0 (0.0%) |
| $12,500 to $14,999 | 0 (0.0%) | 0 (0.0%) |
| $15,000 to $17,499 | 0 (0.0%) | 0 (0.0%) |
| $17,500 to $19,999 | 0 (0.0%) | 0 (0.0%) |
| $20,000 to $22,499 | 0 (0.0%) | 14 (51.8%) |
| $22,500 to $24,999 | 0 (0.0%) | 0 (0.0%) |
| $25,000 to $29,999 | 0 (0.0%) | 0 (0.0%) |
| $30,000 to $34,999 | 0 (0.0%) | 0 (0.0%) |
| $35,000 to $39,999 | 0 (0.0%) | 0 (0.0%) |
| $40,000 to $44,999 | 24 (100.0%) | 0 (0.0%) |
| $45,000 to $49,999 | 0 (0.0%) | 0 (0.0%) |
| $50,000 to $54,999 | 0 (0.0%) | 0 (0.0%) |
| $55,000 to $64,999 | 0 (0.0%) | 0 (0.0%) |
| $65,000 to $74,999 | 0 (0.0%) | 0 (0.0%) |
| $75,000 to $99,999 | 0 (0.0%) | 0 (0.0%) |
| $100,000+ | 0 (0.0%) | 0 (0.0%) |
| Total | 24 (100.0%) | 27 (100.0%) |
Earnings by Sex by Educational Attainment in Beulah Beach
| Educational Attainment | Male Income | Female Income |
| Less than High School | - | - |
| High School Diploma | - | - |
| College or Associate's Degree | - | - |
| Bachelor's Degree | - | - |
| Graduate Degree | - | - |
| Total | - | - |
Family Income in Beulah Beach
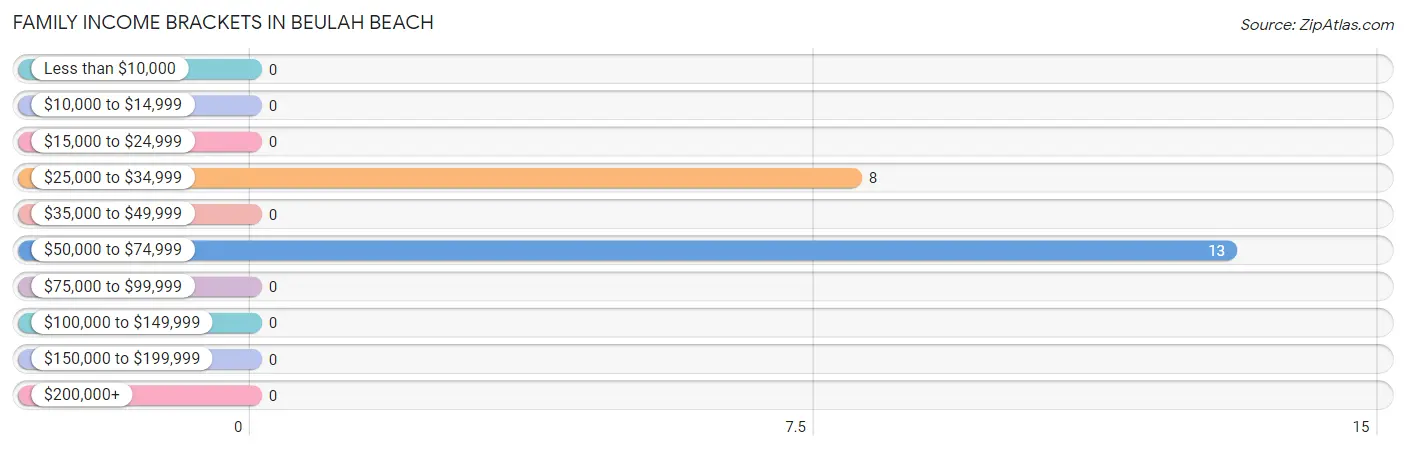
Family Income Brackets in Beulah Beach
According to the Beulah Beach family income data, there are 13 families falling into the $50,000 to $74,999 income range, which is the most common income bracket and makes up 61.9% of all families.
| Income Bracket | # Families | % Families |
| Less than $10,000 | 0 | 0.0% |
| $10,000 to $14,999 | 0 | 0.0% |
| $15,000 to $24,999 | 0 | 0.0% |
| $25,000 to $34,999 | 8 | 38.1% |
| $35,000 to $49,999 | 0 | 0.0% |
| $50,000 to $74,999 | 13 | 61.9% |
| $75,000 to $99,999 | 0 | 0.0% |
| $100,000 to $149,999 | 0 | 0.0% |
| $150,000 to $199,999 | 0 | 0.0% |
| $200,000+ | 0 | 0.0% |
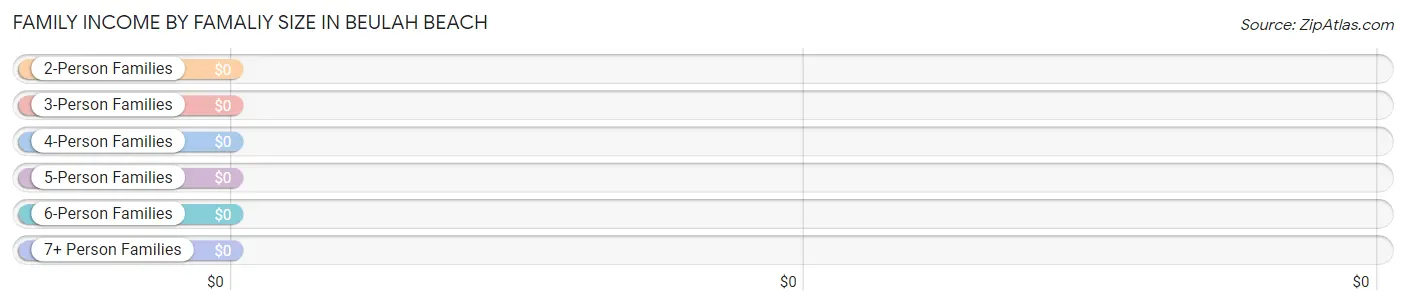
Family Income by Famaliy Size in Beulah Beach
| Income Bracket | # Families | Median Income |
| 2-Person Families | 21 (100.0%) | $0 |
| 3-Person Families | 0 (0.0%) | $0 |
| 4-Person Families | 0 (0.0%) | $0 |
| 5-Person Families | 0 (0.0%) | $0 |
| 6-Person Families | 0 (0.0%) | $0 |
| 7+ Person Families | 0 (0.0%) | $0 |
| Total | 21 (100.0%) | $0 |
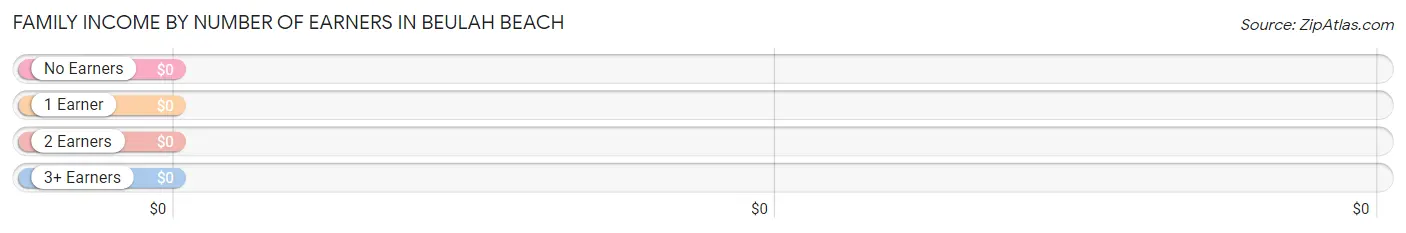
Family Income by Number of Earners in Beulah Beach
| Number of Earners | # Families | Median Income |
| No Earners | 8 (38.1%) | $0 |
| 1 Earner | 0 (0.0%) | $0 |
| 2 Earners | 13 (61.9%) | $0 |
| 3+ Earners | 0 (0.0%) | $0 |
| Total | 21 (100.0%) | $0 |
Household Income in Beulah Beach
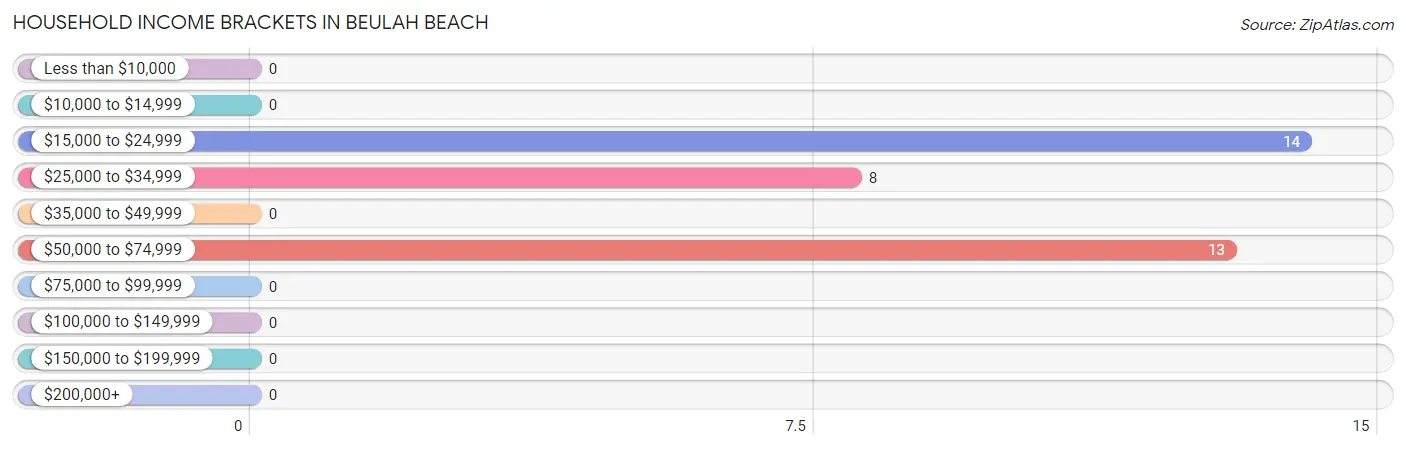
Household Income Brackets in Beulah Beach
With 14 households falling in the category, the $15,000 to $24,999 income range is the most frequent in Beulah Beach, accounting for 40.0% of all households.
| Income Bracket | # Households | % Households |
| Less than $10,000 | 0 | 0.0% |
| $10,000 to $14,999 | 0 | 0.0% |
| $15,000 to $24,999 | 14 | 40.0% |
| $25,000 to $34,999 | 8 | 22.9% |
| $35,000 to $49,999 | 0 | 0.0% |
| $50,000 to $74,999 | 13 | 37.1% |
| $75,000 to $99,999 | 0 | 0.0% |
| $100,000 to $149,999 | 0 | 0.0% |
| $150,000 to $199,999 | 0 | 0.0% |
| $200,000+ | 0 | 0.0% |
Household Income by Householder Age in Beulah Beach
| Income Bracket | # Households | Median Income |
| 15 to 24 Years | 0 (0.0%) | $0 |
| 25 to 44 Years | 14 (40.0%) | $0 |
| 45 to 64 Years | 0 (0.0%) | $0 |
| 65+ Years | 21 (60.0%) | $0 |
| Total | 35 (100.0%) | $0 |
Poverty in Beulah Beach
Income Below Poverty by Sex and Age in Beulah Beach
| Age Bracket | Male | Female |
| Under 5 Years | 0 (0.0%) | 0 (0.0%) |
| 5 Years | 0 (0.0%) | 0 (0.0%) |
| 6 to 11 Years | 0 (0.0%) | 0 (0.0%) |
| 12 to 14 Years | 0 (0.0%) | 0 (0.0%) |
| 15 Years | 0 (0.0%) | 0 (0.0%) |
| 16 and 17 Years | 0 (0.0%) | 0 (0.0%) |
| 18 to 24 Years | 0 (0.0%) | 0 (0.0%) |
| 25 to 34 Years | 0 (0.0%) | 0 (0.0%) |
| 35 to 44 Years | 0 (0.0%) | 0 (0.0%) |
| 45 to 54 Years | 0 (0.0%) | 0 (0.0%) |
| 55 to 64 Years | 0 (0.0%) | 0 (0.0%) |
| 65 to 74 Years | 0 (0.0%) | 0 (0.0%) |
| 75 Years and over | 0 (0.0%) | 0 (0.0%) |
| Total | 0 (0.0%) | 0 (0.0%) |
Income Above Poverty by Sex and Age in Beulah Beach
According to the poverty statistics in Beulah Beach, males aged 55 to 64 years and females aged 25 to 34 years are the age groups that are most secure financially, with 100.0% of males and 100.0% of females in these age groups living above the poverty line.
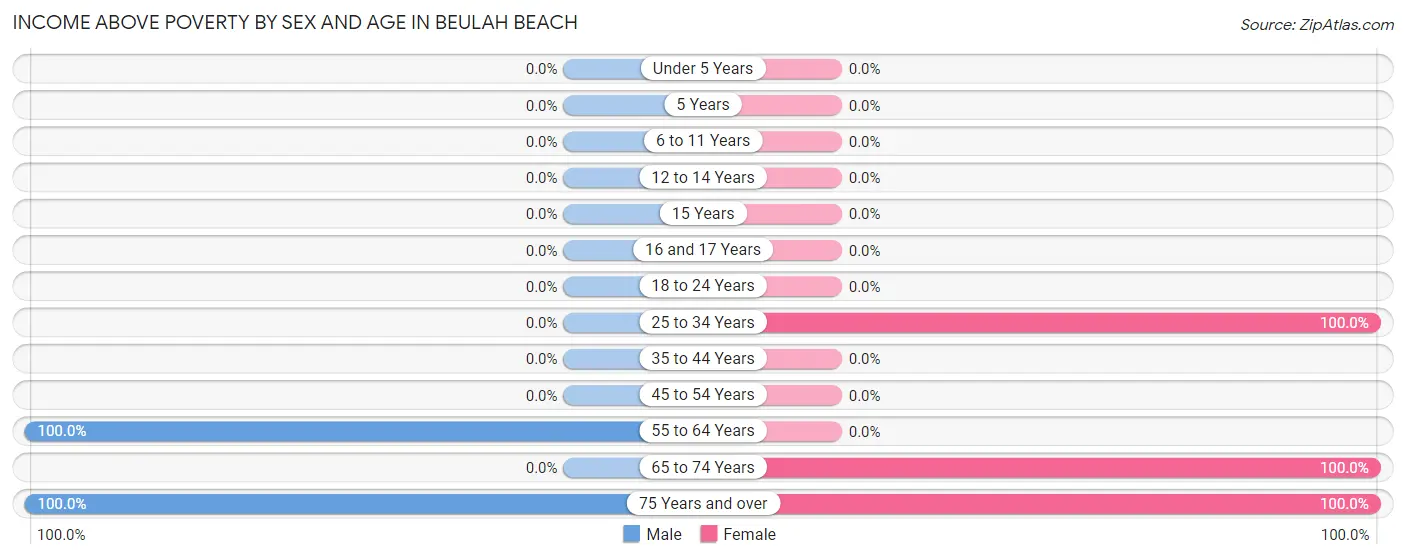
| Age Bracket | Male | Female |
| Under 5 Years | 0 (0.0%) | 0 (0.0%) |
| 5 Years | 0 (0.0%) | 0 (0.0%) |
| 6 to 11 Years | 0 (0.0%) | 0 (0.0%) |
| 12 to 14 Years | 0 (0.0%) | 0 (0.0%) |
| 15 Years | 0 (0.0%) | 0 (0.0%) |
| 16 and 17 Years | 0 (0.0%) | 0 (0.0%) |
| 18 to 24 Years | 0 (0.0%) | 0 (0.0%) |
| 25 to 34 Years | 0 (0.0%) | 14 (100.0%) |
| 35 to 44 Years | 0 (0.0%) | 0 (0.0%) |
| 45 to 54 Years | 0 (0.0%) | 0 (0.0%) |
| 55 to 64 Years | 24 (100.0%) | 0 (0.0%) |
| 65 to 74 Years | 0 (0.0%) | 13 (100.0%) |
| 75 Years and over | 8 (100.0%) | 8 (100.0%) |
| Total | 32 (100.0%) | 35 (100.0%) |
Income Below Poverty Among Married-Couple Families in Beulah Beach
| Children | Above Poverty | Below Poverty |
| No Children | 21 (100.0%) | 0 (0.0%) |
| 1 or 2 Children | 0 (0.0%) | 0 (0.0%) |
| 3 or 4 Children | 0 (0.0%) | 0 (0.0%) |
| 5 or more Children | 0 (0.0%) | 0 (0.0%) |
| Total | 21 (100.0%) | 0 (0.0%) |
Income Below Poverty Among Single-Parent Households in Beulah Beach
| Children | Single Father | Single Mother |
| No Children | 0 (0.0%) | 0 (0.0%) |
| 1 or 2 Children | 0 (0.0%) | 0 (0.0%) |
| 3 or 4 Children | 0 (0.0%) | 0 (0.0%) |
| 5 or more Children | 0 (0.0%) | 0 (0.0%) |
| Total | 0 (0.0%) | 0 (0.0%) |
Income Below Poverty Among Married-Couple vs Single-Parent Households in Beulah Beach
| Children | Married-Couple Families | Single-Parent Households |
| No Children | 0 (0.0%) | 0 (0.0%) |
| 1 or 2 Children | 0 (0.0%) | 0 (0.0%) |
| 3 or 4 Children | 0 (0.0%) | 0 (0.0%) |
| 5 or more Children | 0 (0.0%) | 0 (0.0%) |
| Total | 0 (0.0%) | 0 (0.0%) |
Race in Beulah Beach
The most populous races in Beulah Beach are Black / African American (37 | 55.2%), and White / Caucasian (30 | 44.8%).
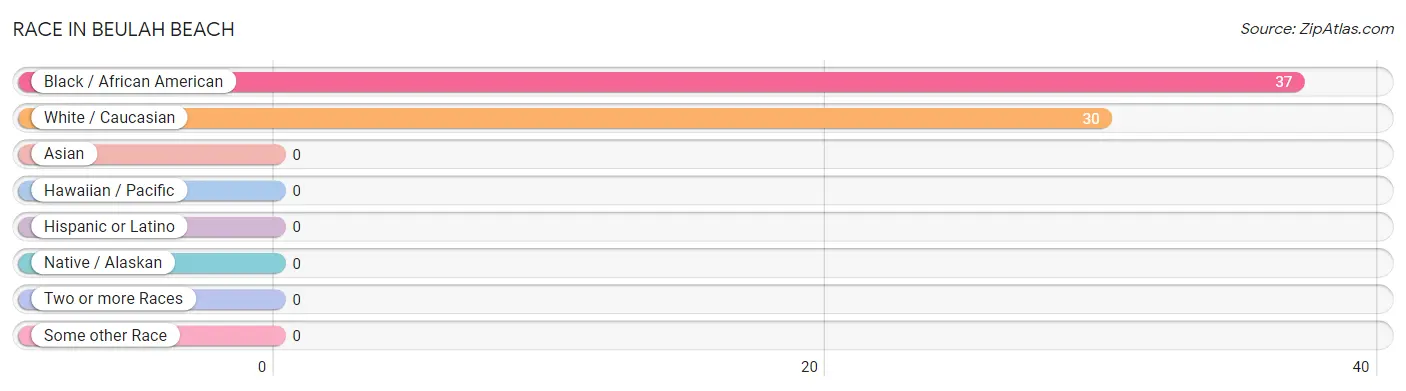
| Race | # Population | % Population |
| Asian | 0 | 0.0% |
| Black / African American | 37 | 55.2% |
| Hawaiian / Pacific | 0 | 0.0% |
| Hispanic or Latino | 0 | 0.0% |
| Native / Alaskan | 0 | 0.0% |
| White / Caucasian | 30 | 44.8% |
| Two or more Races | 0 | 0.0% |
| Some other Race | 0 | 0.0% |
| Total | 67 | 100.0% |
Ancestry in Beulah Beach
The most populous ancestries reported in Beulah Beach are Nigerian (24 | 35.8%), Subsaharan African (24 | 35.8%), German (16 | 23.9%), and English (14 | 20.9%), together accounting for 116.4% of all Beulah Beach residents.
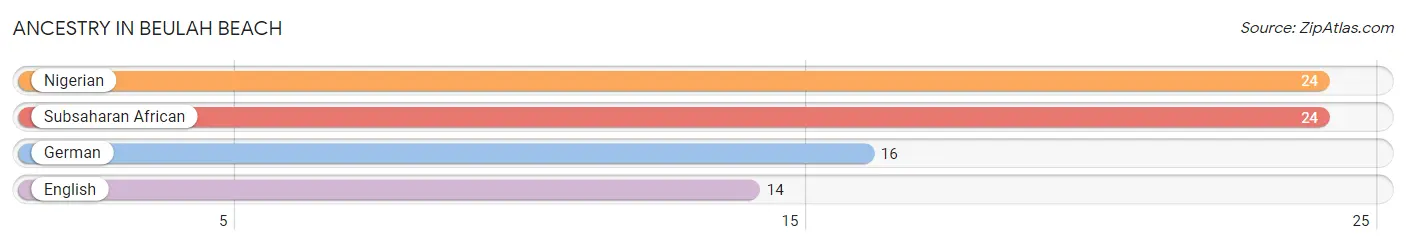
| Ancestry | # Population | % Population |
| English | 14 | 20.9% |
| German | 16 | 23.9% |
| Nigerian | 24 | 35.8% |
| Subsaharan African | 24 | 35.8% | View All 4 Rows |
Immigrants in Beulah Beach
The most numerous immigrant groups reported in Beulah Beach came from Africa (24 | 35.8%), Nigeria (24 | 35.8%), and Western Africa (24 | 35.8%), together accounting for 107.5% of all Beulah Beach residents.
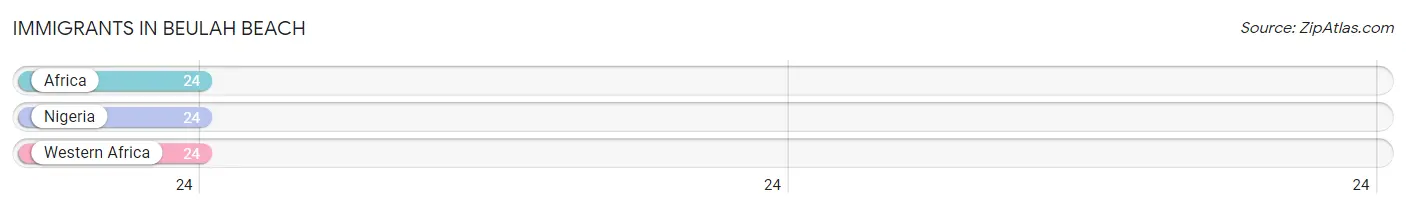
| Immigration Origin | # Population | % Population |
| Africa | 24 | 35.8% |
| Nigeria | 24 | 35.8% |
| Western Africa | 24 | 35.8% | View All 3 Rows |
Sex and Age in Beulah Beach
Sex and Age in Beulah Beach
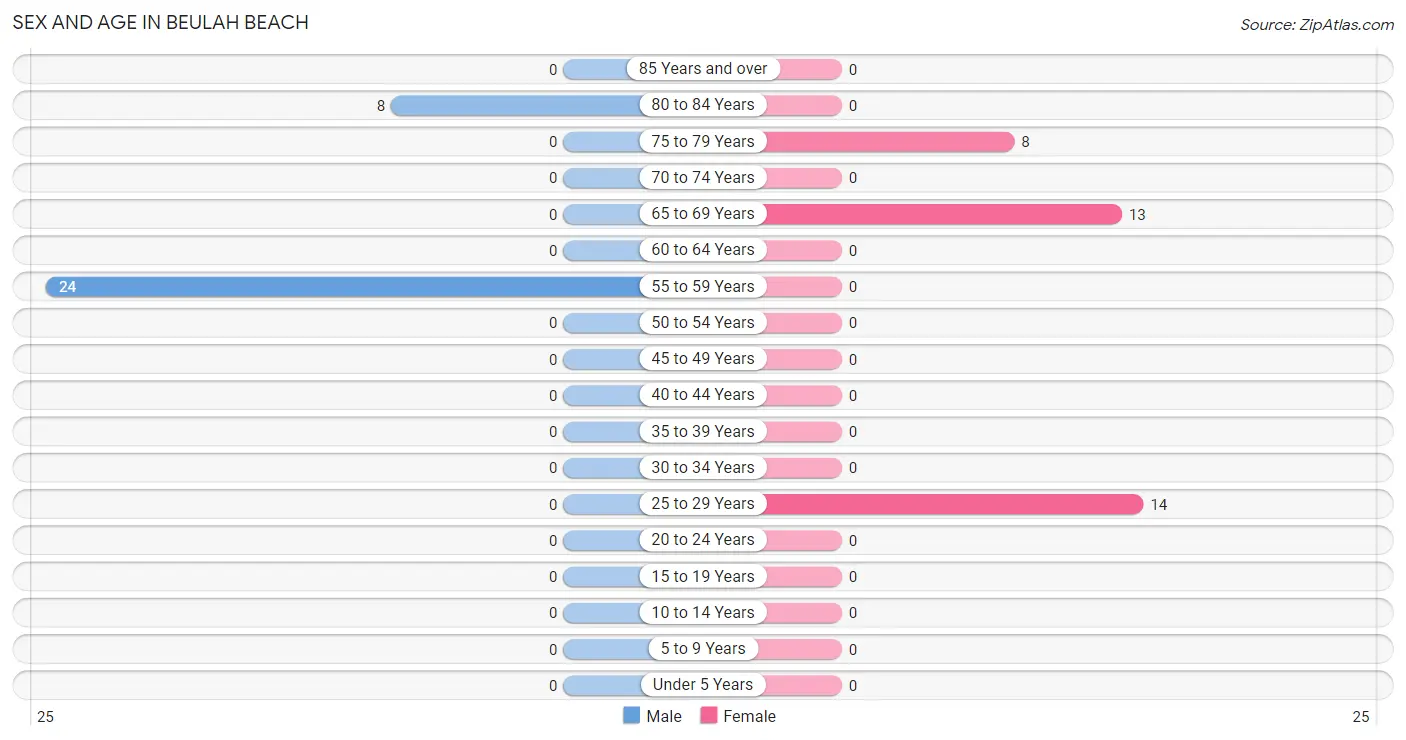
The most populous age groups in Beulah Beach are 55 to 59 Years (24 | 75.0%) for men and 25 to 29 Years (14 | 40.0%) for women.
| Age Bracket | Male | Female |
| Under 5 Years | 0 (0.0%) | 0 (0.0%) |
| 5 to 9 Years | 0 (0.0%) | 0 (0.0%) |
| 10 to 14 Years | 0 (0.0%) | 0 (0.0%) |
| 15 to 19 Years | 0 (0.0%) | 0 (0.0%) |
| 20 to 24 Years | 0 (0.0%) | 0 (0.0%) |
| 25 to 29 Years | 0 (0.0%) | 14 (40.0%) |
| 30 to 34 Years | 0 (0.0%) | 0 (0.0%) |
| 35 to 39 Years | 0 (0.0%) | 0 (0.0%) |
| 40 to 44 Years | 0 (0.0%) | 0 (0.0%) |
| 45 to 49 Years | 0 (0.0%) | 0 (0.0%) |
| 50 to 54 Years | 0 (0.0%) | 0 (0.0%) |
| 55 to 59 Years | 24 (75.0%) | 0 (0.0%) |
| 60 to 64 Years | 0 (0.0%) | 0 (0.0%) |
| 65 to 69 Years | 0 (0.0%) | 13 (37.1%) |
| 70 to 74 Years | 0 (0.0%) | 0 (0.0%) |
| 75 to 79 Years | 0 (0.0%) | 8 (22.9%) |
| 80 to 84 Years | 8 (25.0%) | 0 (0.0%) |
| 85 Years and over | 0 (0.0%) | 0 (0.0%) |
| Total | 32 (100.0%) | 35 (100.0%) |
Families and Households in Beulah Beach
Median Family Size in Beulah Beach
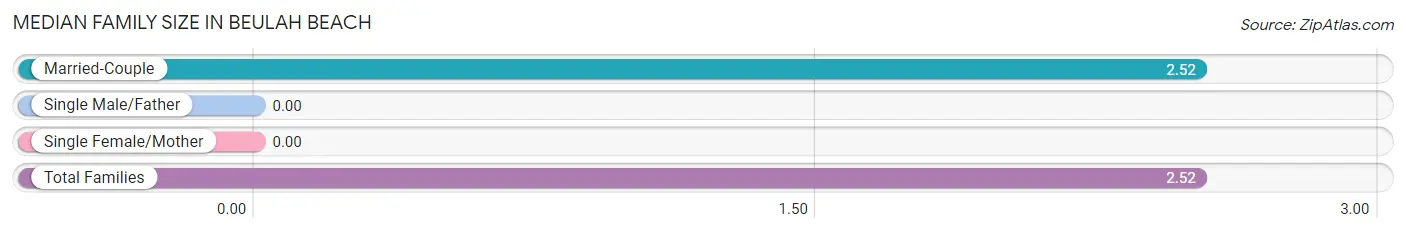
| Family Type | # Families | Family Size |
| Married-Couple | 21 (100.0%) | 2.52 |
| Single Male/Father | 0 (0.0%) | - |
| Single Female/Mother | 0 (0.0%) | - |
| Total Families | 21 (100.0%) | 2.52 |
Median Household Size in Beulah Beach
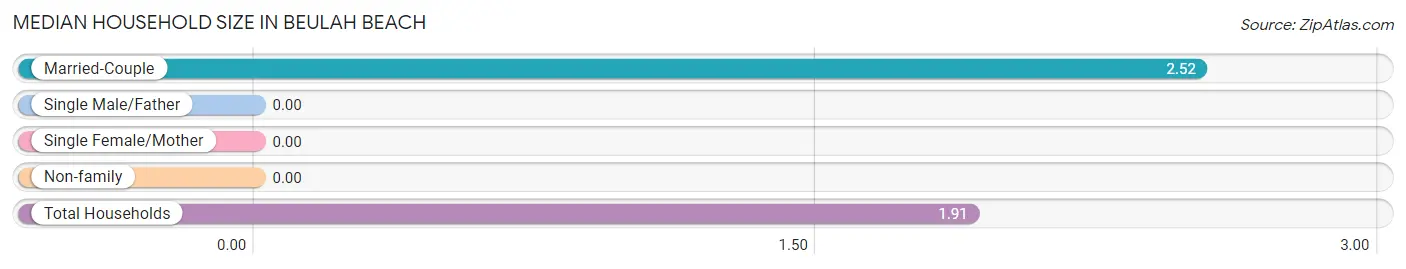
| Household Type | # Households | Household Size |
| Married-Couple | 21 (60.0%) | 2.52 |
| Single Male/Father | 0 (0.0%) | - |
| Single Female/Mother | 0 (0.0%) | - |
| Non-family | 14 (40.0%) | - |
| Total Households | 35 (100.0%) | 1.91 |
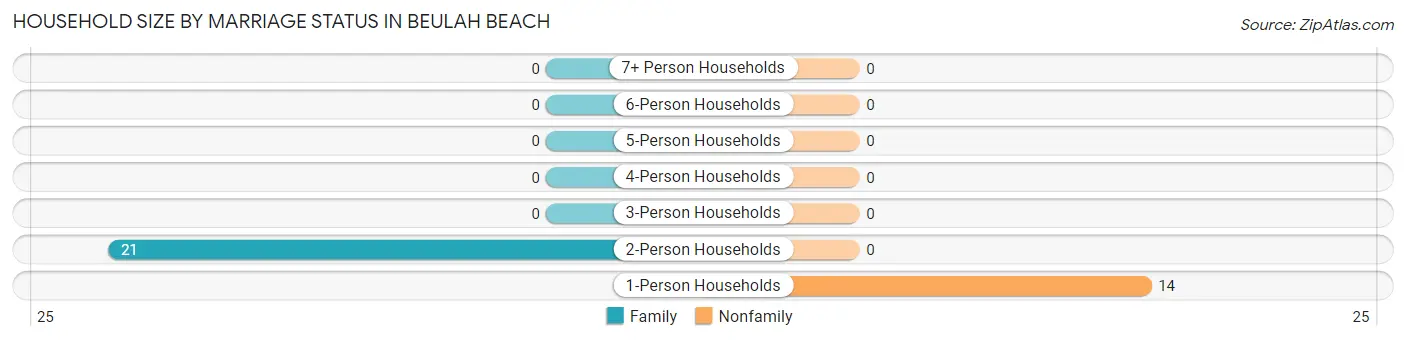
Household Size by Marriage Status in Beulah Beach
Out of a total of 35 households in Beulah Beach, 21 (60.0%) are family households, while 14 (40.0%) are nonfamily households. The most numerous type of family households are 2-person households, comprising 21, and the most common type of nonfamily households are 1-person households, comprising 14.
| Household Size | Family Households | Nonfamily Households |
| 1-Person Households | - | 14 (40.0%) |
| 2-Person Households | 21 (60.0%) | 0 (0.0%) |
| 3-Person Households | 0 (0.0%) | 0 (0.0%) |
| 4-Person Households | 0 (0.0%) | 0 (0.0%) |
| 5-Person Households | 0 (0.0%) | 0 (0.0%) |
| 6-Person Households | 0 (0.0%) | 0 (0.0%) |
| 7+ Person Households | 0 (0.0%) | 0 (0.0%) |
| Total | 21 (60.0%) | 14 (40.0%) |
Female Fertility in Beulah Beach
Fertility by Age in Beulah Beach
| Age Bracket | Women with Births | Births / 1,000 Women |
| 15 to 19 years | 0 (0.0%) | 0.0 |
| 20 to 34 years | 0 (0.0%) | 0.0 |
| 35 to 50 years | 0 (0.0%) | 0.0 |
| Total | 0 (0.0%) | 0.0 |
Fertility by Age by Marriage Status in Beulah Beach
| Age Bracket | Married | Unmarried |
| 15 to 19 years | 0 (0.0%) | 0 (0.0%) |
| 20 to 34 years | 0 (0.0%) | 0 (0.0%) |
| 35 to 50 years | 0 (0.0%) | 0 (0.0%) |
| Total | 0 (0.0%) | 0 (0.0%) |
Fertility by Education in Beulah Beach
| Educational Attainment | Women with Births | Births / 1,000 Women |
| Less than High School | 0 (0.0%) | 0.0 |
| High School Diploma | 0 (0.0%) | 0.0 |
| College or Associate's Degree | 0 (0.0%) | 0.0 |
| Bachelor's Degree | 0 (0.0%) | 0.0 |
| Graduate Degree | 0 (0.0%) | 0.0 |
| Total | 0 (0.0%) | 0.0 |
Fertility by Education by Marriage Status in Beulah Beach
| Educational Attainment | Married | Unmarried |
| Less than High School | 0 (0.0%) | 0 (0.0%) |
| High School Diploma | 0 (0.0%) | 0 (0.0%) |
| College or Associate's Degree | 0 (0.0%) | 0 (0.0%) |
| Bachelor's Degree | 0 (0.0%) | 0 (0.0%) |
| Graduate Degree | 0 (0.0%) | 0 (0.0%) |
| Total | 0 (0.0%) | 0 (0.0%) |
Employment Characteristics in Beulah Beach
Employment by Class of Employer in Beulah Beach
Among the 38 employed individuals in Beulah Beach, local government employees (24 | 63.2%), and not-for-profit organizations (14 | 36.8%) make up the most common classes of employment.
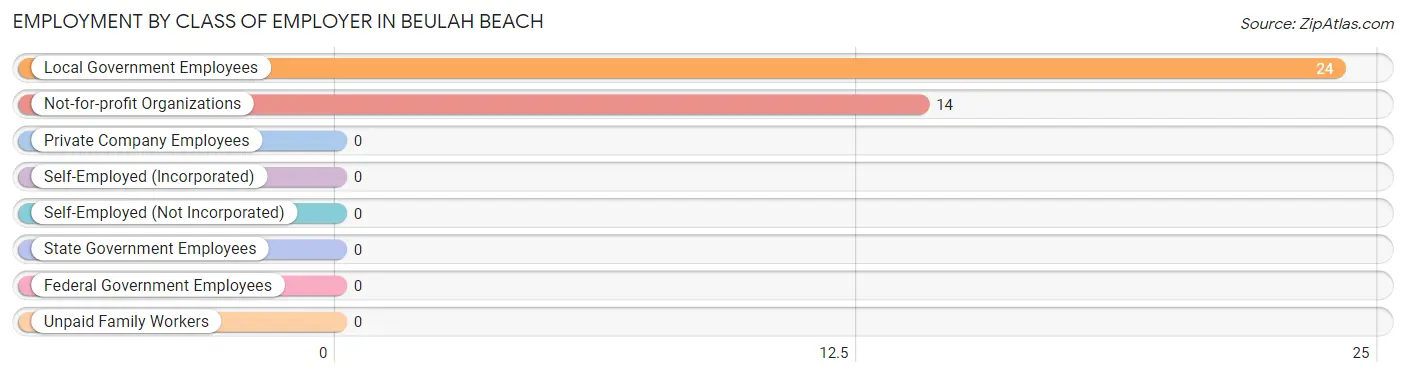
| Employer Class | # Employees | % Employees |
| Private Company Employees | 0 | 0.0% |
| Self-Employed (Incorporated) | 0 | 0.0% |
| Self-Employed (Not Incorporated) | 0 | 0.0% |
| Not-for-profit Organizations | 14 | 36.8% |
| Local Government Employees | 24 | 63.2% |
| State Government Employees | 0 | 0.0% |
| Federal Government Employees | 0 | 0.0% |
| Unpaid Family Workers | 0 | 0.0% |
| Total | 38 | 100.0% |
Employment Status by Age in Beulah Beach
According to the labor force statistics for Beulah Beach, out of the total population over 16 years of age (67), 76.1% or 51 individuals are in the labor force, with 25.5% or 13 of them unemployed. The age group with the highest labor force participation rate is 25 to 29 years, with 100.0% or 14 individuals in the labor force. Within the labor force, the 65 to 74 years age range has the highest percentage of unemployed individuals, with 100.0% or 13 of them being unemployed.
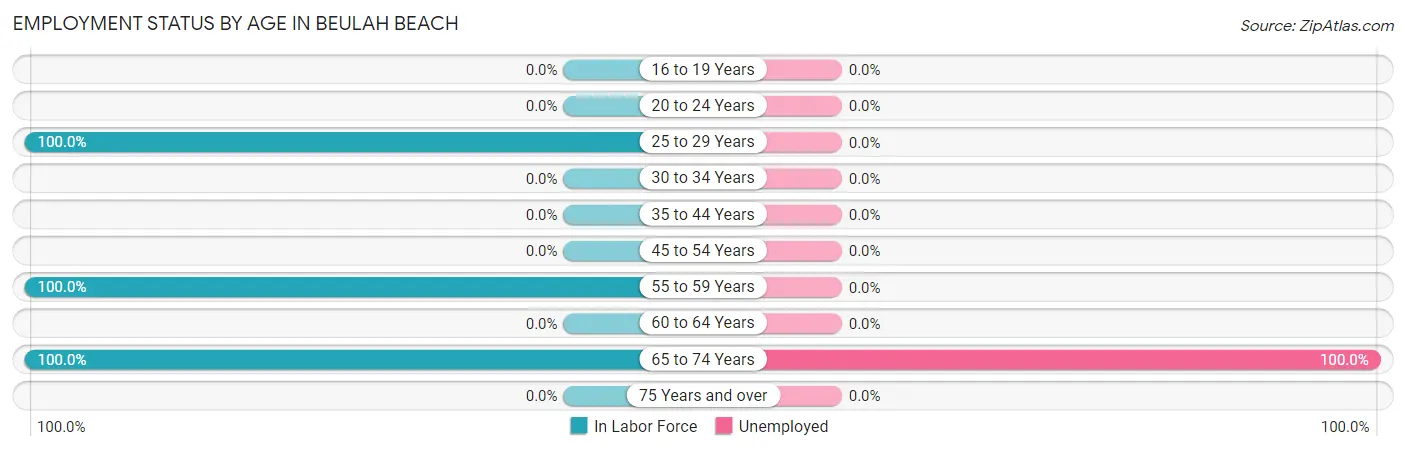
| Age Bracket | In Labor Force | Unemployed |
| 16 to 19 Years | 0 (0.0%) | 0 (0.0%) |
| 20 to 24 Years | 0 (0.0%) | 0 (0.0%) |
| 25 to 29 Years | 14 (100.0%) | 0 (0.0%) |
| 30 to 34 Years | 0 (0.0%) | 0 (0.0%) |
| 35 to 44 Years | 0 (0.0%) | 0 (0.0%) |
| 45 to 54 Years | 0 (0.0%) | 0 (0.0%) |
| 55 to 59 Years | 24 (100.0%) | 0 (0.0%) |
| 60 to 64 Years | 0 (0.0%) | 0 (0.0%) |
| 65 to 74 Years | 13 (100.0%) | 13 (100.0%) |
| 75 Years and over | 0 (0.0%) | 0 (0.0%) |
| Total | 51 (76.1%) | 13 (25.5%) |
Employment Status by Educational Attainment in Beulah Beach
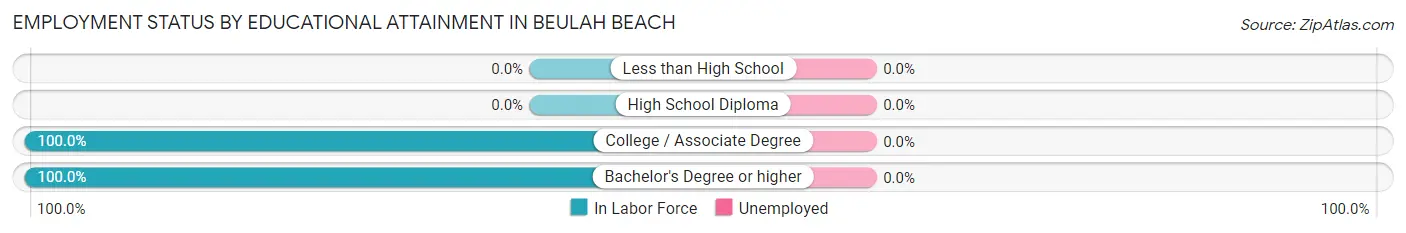
| Educational Attainment | In Labor Force | Unemployed |
| Less than High School | 0 (0.0%) | 0 (0.0%) |
| High School Diploma | 0 (0.0%) | 0 (0.0%) |
| College / Associate Degree | 24 (100.0%) | 0 (0.0%) |
| Bachelor's Degree or higher | 14 (100.0%) | 0 (0.0%) |
| Total | 38 (100.0%) | 0 (0.0%) |
Employment Occupations by Sex in Beulah Beach
Management, Business, Science and Arts Occupations
The most common Management, Business, Science and Arts occupations in Beulah Beach are , and Management (14 | 36.8%).
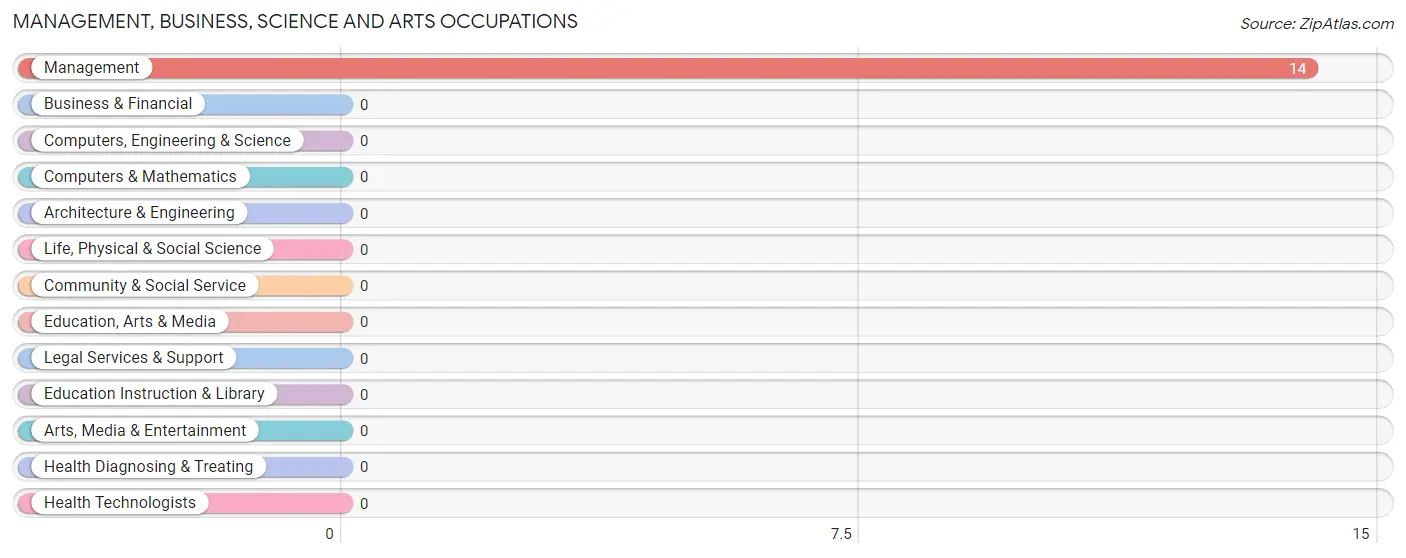
Management, Business, Science and Arts Occupations by Sex
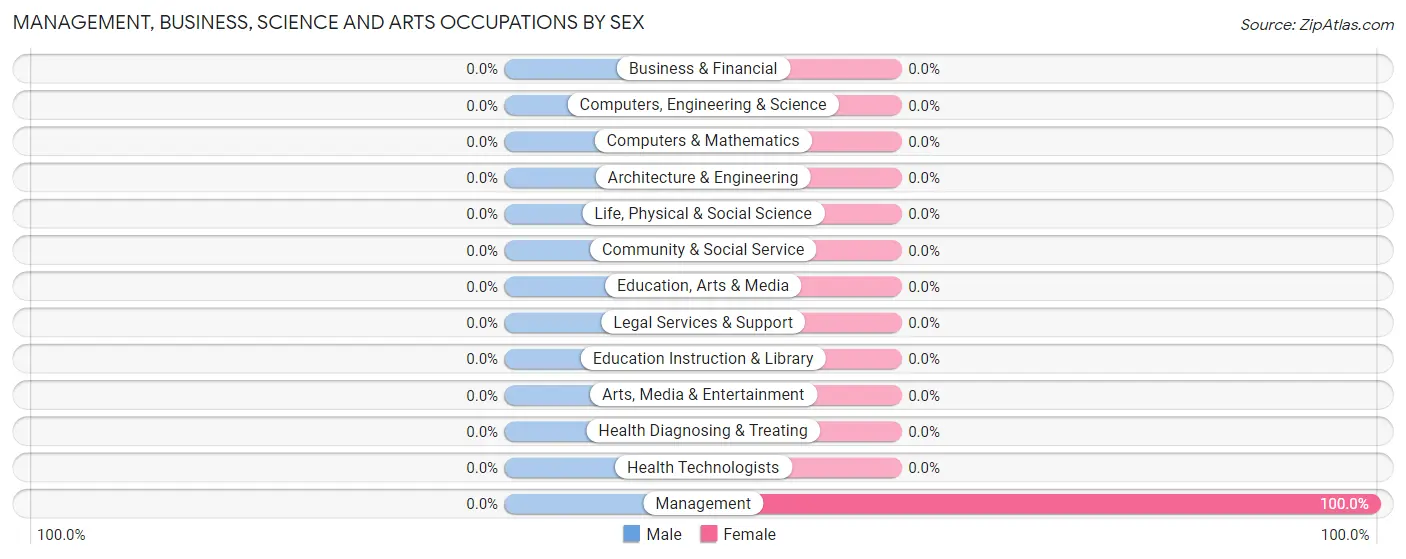
| Occupation | Male | Female |
| Management | 0 (0.0%) | 14 (100.0%) |
| Business & Financial | 0 (0.0%) | 0 (0.0%) |
| Computers, Engineering & Science | 0 (0.0%) | 0 (0.0%) |
| Computers & Mathematics | 0 (0.0%) | 0 (0.0%) |
| Architecture & Engineering | 0 (0.0%) | 0 (0.0%) |
| Life, Physical & Social Science | 0 (0.0%) | 0 (0.0%) |
| Community & Social Service | 0 (0.0%) | 0 (0.0%) |
| Education, Arts & Media | 0 (0.0%) | 0 (0.0%) |
| Legal Services & Support | 0 (0.0%) | 0 (0.0%) |
| Education Instruction & Library | 0 (0.0%) | 0 (0.0%) |
| Arts, Media & Entertainment | 0 (0.0%) | 0 (0.0%) |
| Health Diagnosing & Treating | 0 (0.0%) | 0 (0.0%) |
| Health Technologists | 0 (0.0%) | 0 (0.0%) |
| Total (Category) | 0 (0.0%) | 14 (100.0%) |
| Total (Overall) | 24 (63.2%) | 14 (36.8%) |
Services Occupations
The most common Services occupations in Beulah Beach are , and Cleaning & Maintenance (24 | 63.2%).
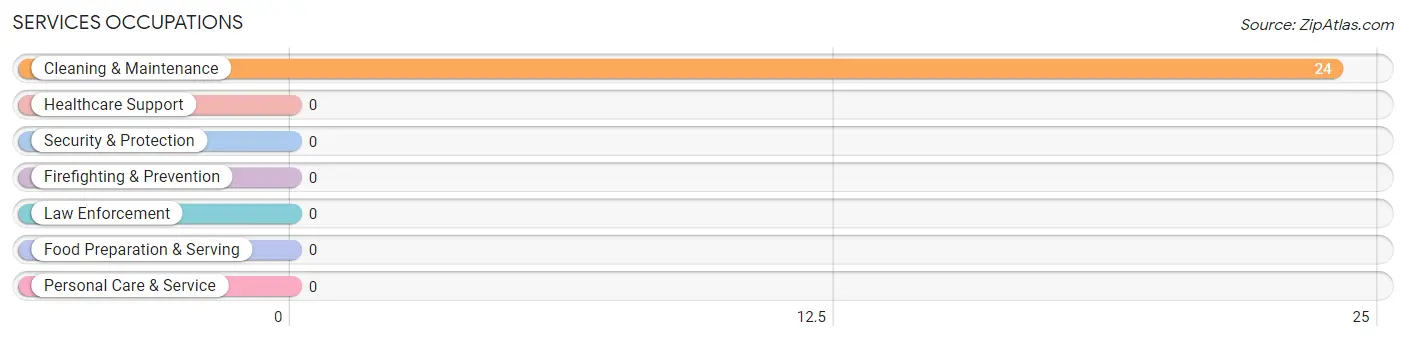
Services Occupations by Sex
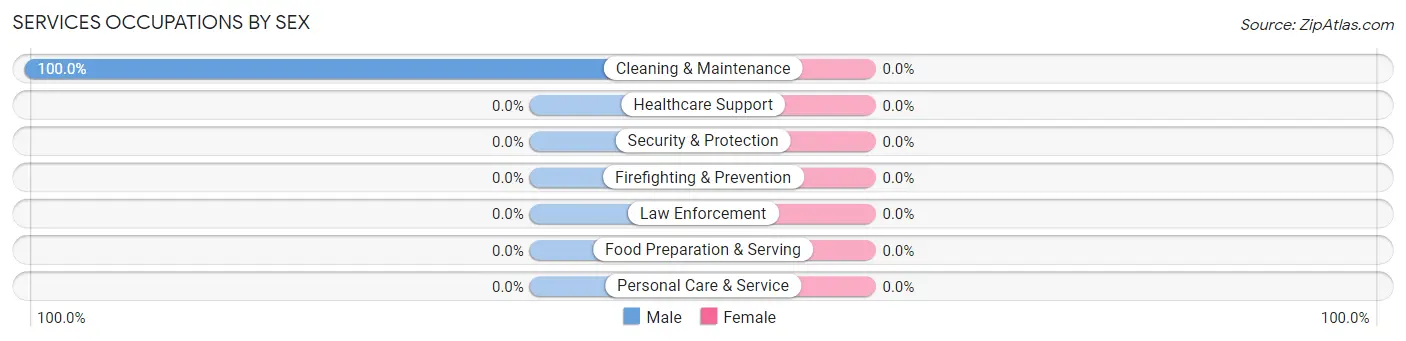
| Occupation | Male | Female |
| Healthcare Support | 0 (0.0%) | 0 (0.0%) |
| Security & Protection | 0 (0.0%) | 0 (0.0%) |
| Firefighting & Prevention | 0 (0.0%) | 0 (0.0%) |
| Law Enforcement | 0 (0.0%) | 0 (0.0%) |
| Food Preparation & Serving | 0 (0.0%) | 0 (0.0%) |
| Cleaning & Maintenance | 24 (100.0%) | 0 (0.0%) |
| Personal Care & Service | 0 (0.0%) | 0 (0.0%) |
| Total (Category) | 24 (100.0%) | 0 (0.0%) |
| Total (Overall) | 24 (63.2%) | 14 (36.8%) |
Sales and Office Occupations
Sales and Office Occupations by Sex
| Occupation | Male | Female |
| Sales & Related | 0 (0.0%) | 0 (0.0%) |
| Office & Administration | 0 (0.0%) | 0 (0.0%) |
| Total (Category) | 0 (0.0%) | 0 (0.0%) |
| Total (Overall) | 24 (63.2%) | 14 (36.8%) |
Natural Resources, Construction and Maintenance Occupations
Natural Resources, Construction and Maintenance Occupations by Sex
| Occupation | Male | Female |
| Farming, Fishing & Forestry | 0 (0.0%) | 0 (0.0%) |
| Construction & Extraction | 0 (0.0%) | 0 (0.0%) |
| Installation, Maintenance & Repair | 0 (0.0%) | 0 (0.0%) |
| Total (Category) | 0 (0.0%) | 0 (0.0%) |
| Total (Overall) | 24 (63.2%) | 14 (36.8%) |
Production, Transportation and Moving Occupations
Production, Transportation and Moving Occupations by Sex
| Occupation | Male | Female |
| Production | 0 (0.0%) | 0 (0.0%) |
| Transportation | 0 (0.0%) | 0 (0.0%) |
| Material Moving | 0 (0.0%) | 0 (0.0%) |
| Total (Category) | 0 (0.0%) | 0 (0.0%) |
| Total (Overall) | 24 (63.2%) | 14 (36.8%) |
Employment Industries by Sex in Beulah Beach
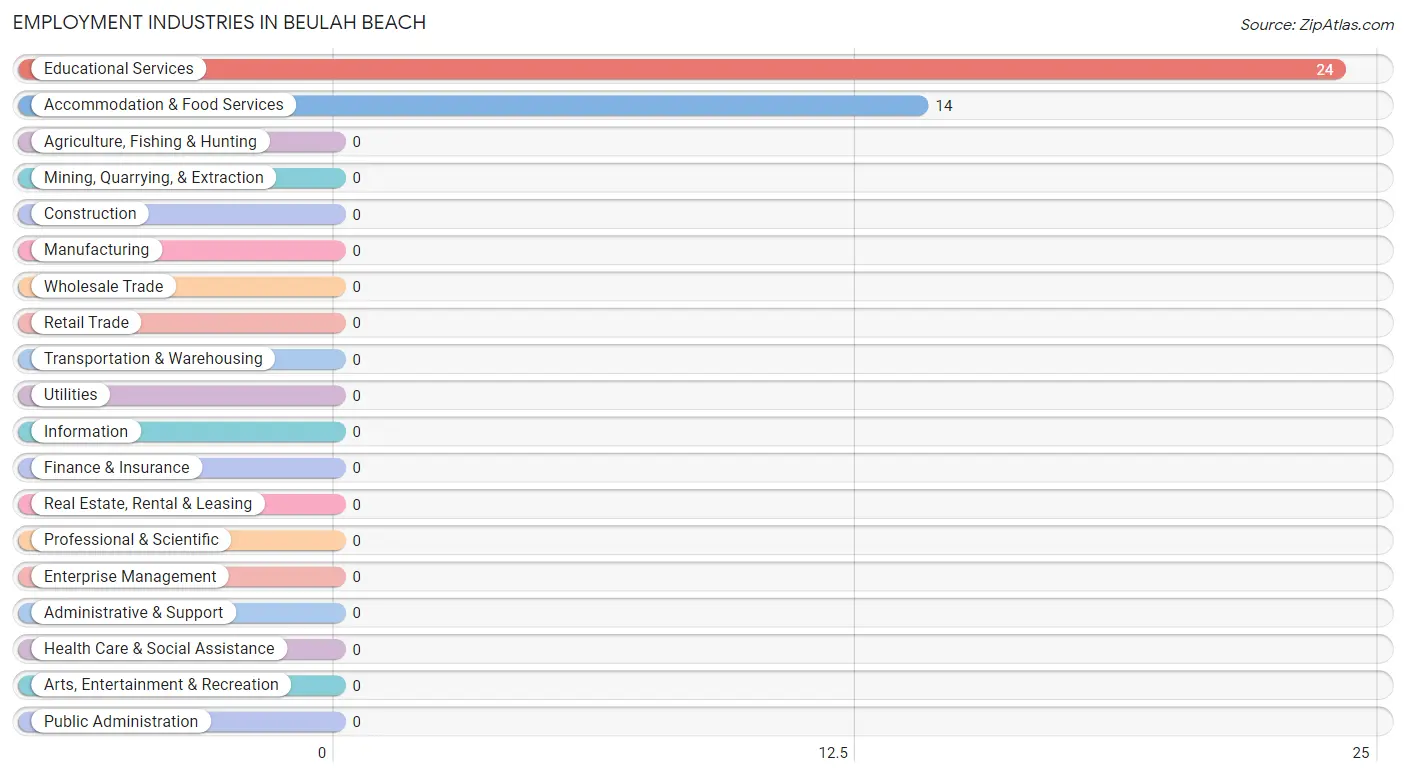
Employment Industries in Beulah Beach
The major employment industries in Beulah Beach include Educational Services (24 | 63.2%), and Accommodation & Food Services (14 | 36.8%).
Employment Industries by Sex in Beulah Beach
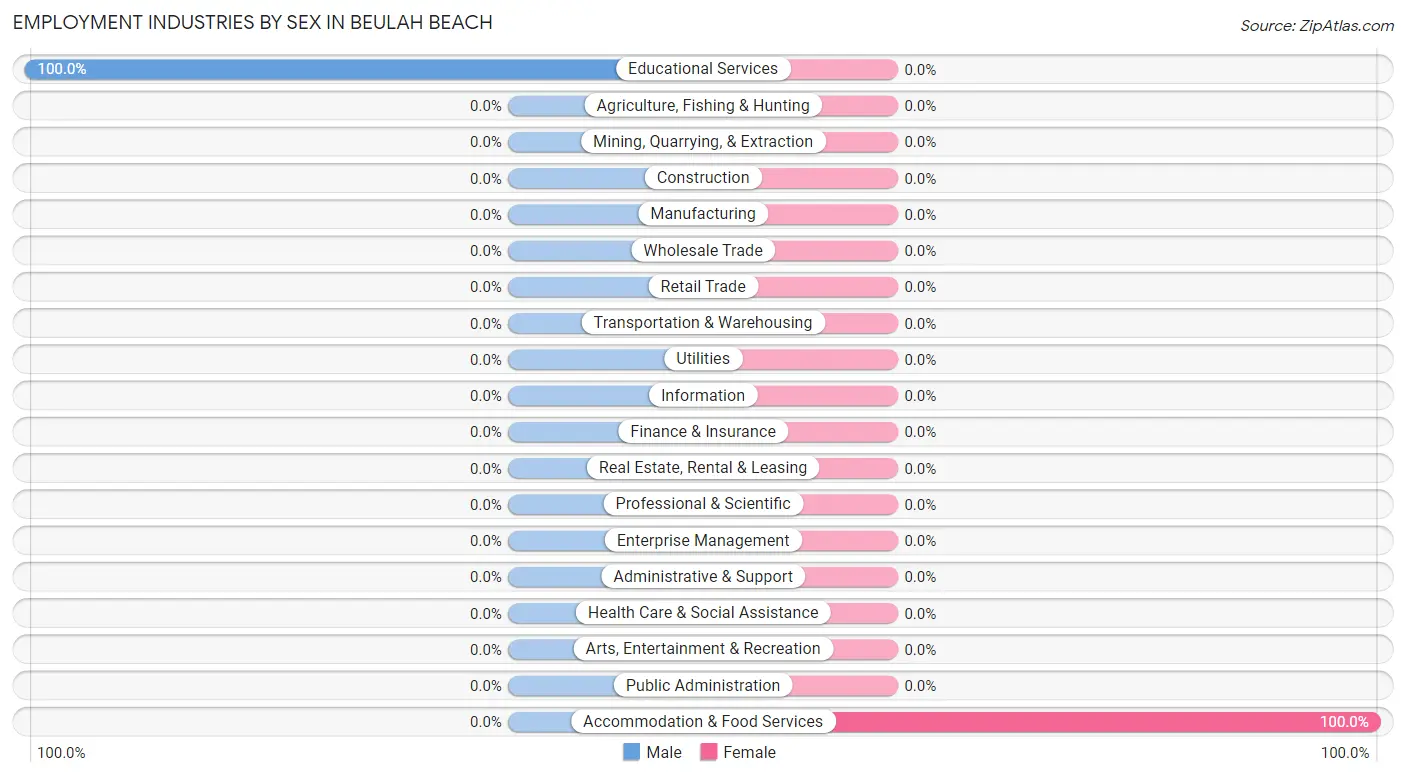
| Industry | Male | Female |
| Agriculture, Fishing & Hunting | 0 (0.0%) | 0 (0.0%) |
| Mining, Quarrying, & Extraction | 0 (0.0%) | 0 (0.0%) |
| Construction | 0 (0.0%) | 0 (0.0%) |
| Manufacturing | 0 (0.0%) | 0 (0.0%) |
| Wholesale Trade | 0 (0.0%) | 0 (0.0%) |
| Retail Trade | 0 (0.0%) | 0 (0.0%) |
| Transportation & Warehousing | 0 (0.0%) | 0 (0.0%) |
| Utilities | 0 (0.0%) | 0 (0.0%) |
| Information | 0 (0.0%) | 0 (0.0%) |
| Finance & Insurance | 0 (0.0%) | 0 (0.0%) |
| Real Estate, Rental & Leasing | 0 (0.0%) | 0 (0.0%) |
| Professional & Scientific | 0 (0.0%) | 0 (0.0%) |
| Enterprise Management | 0 (0.0%) | 0 (0.0%) |
| Administrative & Support | 0 (0.0%) | 0 (0.0%) |
| Educational Services | 24 (100.0%) | 0 (0.0%) |
| Health Care & Social Assistance | 0 (0.0%) | 0 (0.0%) |
| Arts, Entertainment & Recreation | 0 (0.0%) | 0 (0.0%) |
| Accommodation & Food Services | 0 (0.0%) | 14 (100.0%) |
| Public Administration | 0 (0.0%) | 0 (0.0%) |
| Total | 24 (63.2%) | 14 (36.8%) |
Education in Beulah Beach
School Enrollment in Beulah Beach
| School Level | # Students | % Students |
| Nursery / Preschool | 0 | 0.0% |
| Kindergarten | 0 | 0.0% |
| Elementary School | 0 | 0.0% |
| Middle School | 0 | 0.0% |
| High School | 0 | 0.0% |
| College / Undergraduate | 0 | 0.0% |
| Graduate / Professional | 0 | 0.0% |
| Total | 0 | 0.0% |
School Enrollment by Age by Funding Source in Beulah Beach
| Age Bracket | Public School | Private School |
| 3 to 4 Year Olds | 0 (0.0%) | 0 (0.0%) |
| 5 to 9 Year Old | 0 (0.0%) | 0 (0.0%) |
| 10 to 14 Year Olds | 0 (0.0%) | 0 (0.0%) |
| 15 to 17 Year Olds | 0 (0.0%) | 0 (0.0%) |
| 18 to 19 Year Olds | 0 (0.0%) | 0 (0.0%) |
| 20 to 24 Year Olds | 0 (0.0%) | 0 (0.0%) |
| 25 to 34 Year Olds | 0 (0.0%) | 0 (0.0%) |
| 35 Years and over | 0 (0.0%) | 0 (0.0%) |
| Total | 0 (0.0%) | 0 (0.0%) |
Educational Attainment by Field of Study in Beulah Beach
Education (14 | 63.6%), and liberal arts & history (8 | 36.4%) are the most common fields of study among 22 individuals in Beulah Beach who have obtained a bachelor's degree or higher.
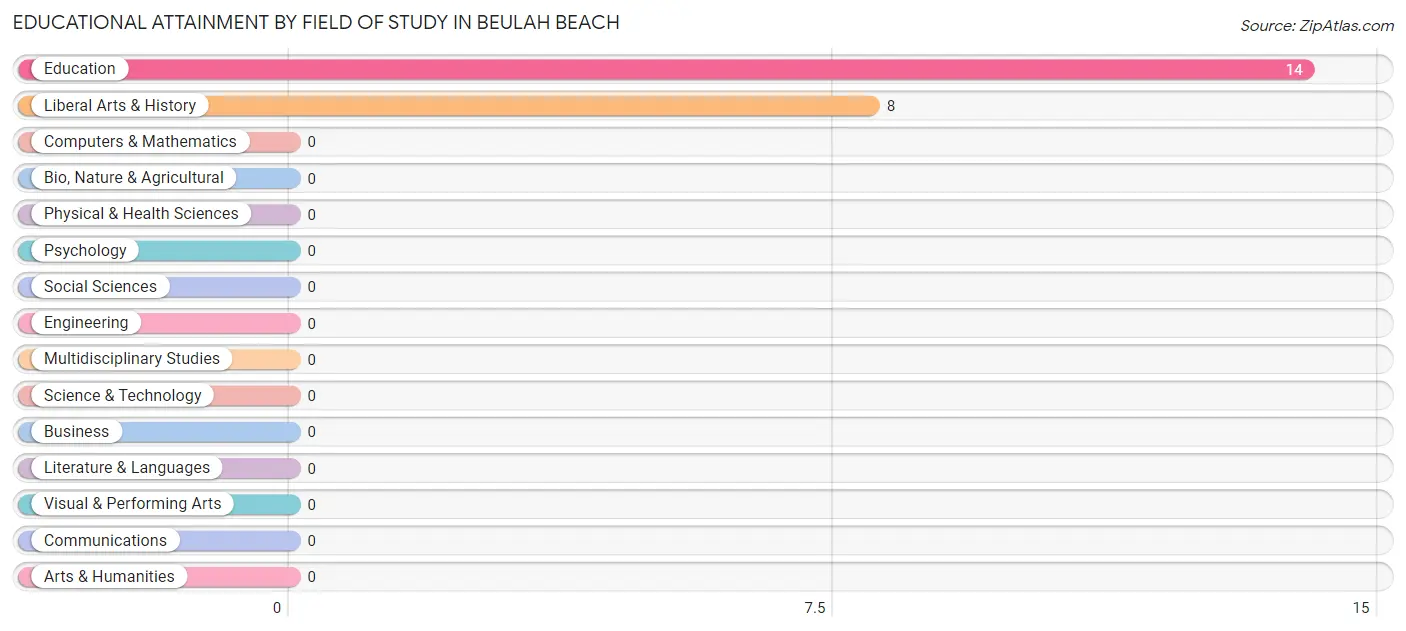
| Field of Study | # Graduates | % Graduates |
| Computers & Mathematics | 0 | 0.0% |
| Bio, Nature & Agricultural | 0 | 0.0% |
| Physical & Health Sciences | 0 | 0.0% |
| Psychology | 0 | 0.0% |
| Social Sciences | 0 | 0.0% |
| Engineering | 0 | 0.0% |
| Multidisciplinary Studies | 0 | 0.0% |
| Science & Technology | 0 | 0.0% |
| Business | 0 | 0.0% |
| Education | 14 | 63.6% |
| Literature & Languages | 0 | 0.0% |
| Liberal Arts & History | 8 | 36.4% |
| Visual & Performing Arts | 0 | 0.0% |
| Communications | 0 | 0.0% |
| Arts & Humanities | 0 | 0.0% |
| Total | 22 | 100.0% |
Transportation & Commute in Beulah Beach
Vehicle Availability by Sex in Beulah Beach
The most prevalent vehicle ownership categories in Beulah Beach are males with 3 vehicles (24, accounting for 100.0%) and females with 3 vehicles (0, making up 171.4%).
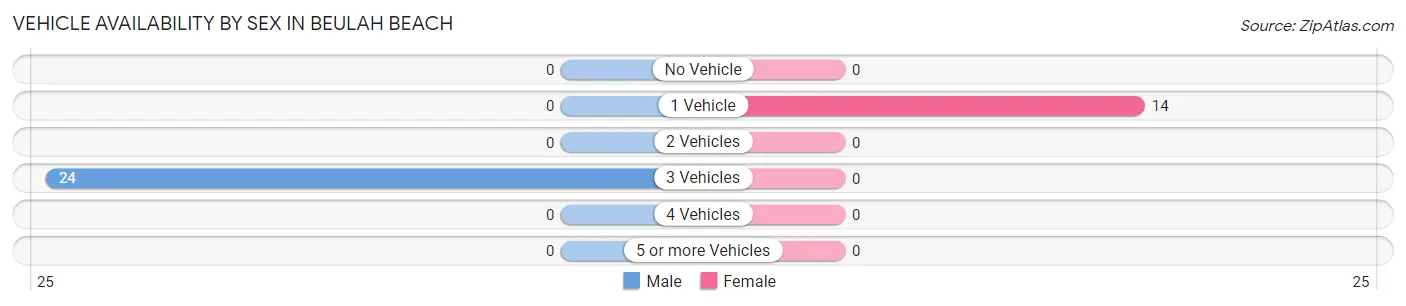
| Vehicles Available | Male | Female |
| No Vehicle | 0 (0.0%) | 0 (0.0%) |
| 1 Vehicle | 0 (0.0%) | 14 (100.0%) |
| 2 Vehicles | 0 (0.0%) | 0 (0.0%) |
| 3 Vehicles | 24 (100.0%) | 0 (0.0%) |
| 4 Vehicles | 0 (0.0%) | 0 (0.0%) |
| 5 or more Vehicles | 0 (0.0%) | 0 (0.0%) |
| Total | 24 (100.0%) | 14 (100.0%) |
Commute Time in Beulah Beach
The most frequently occuring commute durations in Beulah Beach are 60 to 89 minutes (24 commuters, 63.2%), less than 5 minutes (14 commuters, 36.8%), and 5 to 9 minutes (0 commuters, 0.0%).
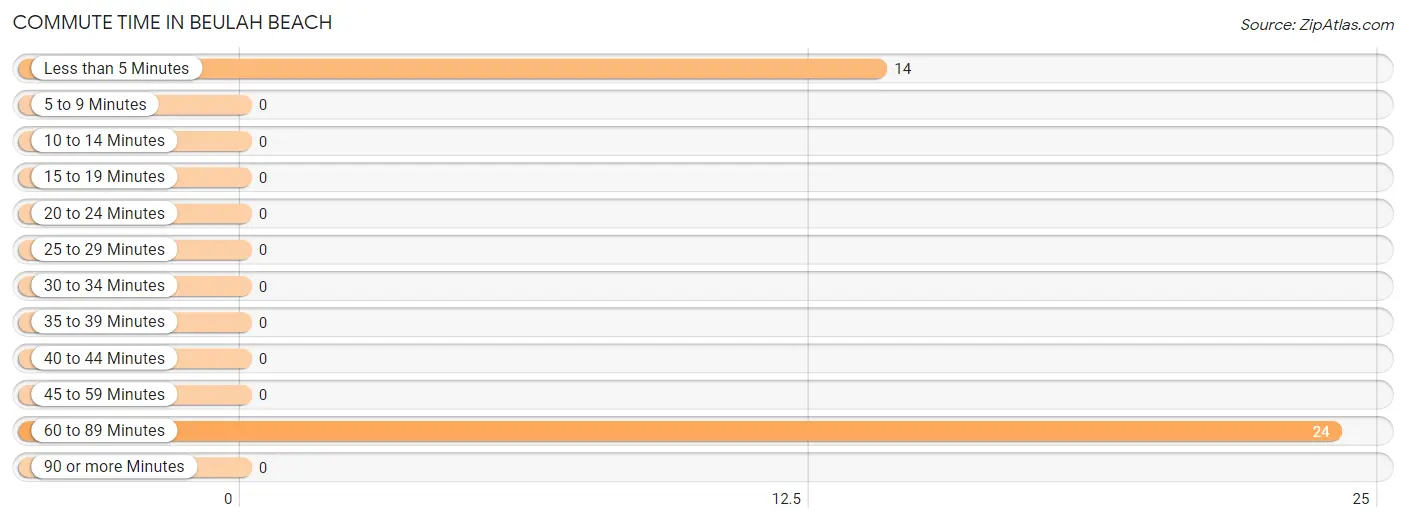
| Commute Time | # Commuters | % Commuters |
| Less than 5 Minutes | 14 | 36.8% |
| 5 to 9 Minutes | 0 | 0.0% |
| 10 to 14 Minutes | 0 | 0.0% |
| 15 to 19 Minutes | 0 | 0.0% |
| 20 to 24 Minutes | 0 | 0.0% |
| 25 to 29 Minutes | 0 | 0.0% |
| 30 to 34 Minutes | 0 | 0.0% |
| 35 to 39 Minutes | 0 | 0.0% |
| 40 to 44 Minutes | 0 | 0.0% |
| 45 to 59 Minutes | 0 | 0.0% |
| 60 to 89 Minutes | 24 | 63.2% |
| 90 or more Minutes | 0 | 0.0% |
Commute Time by Sex in Beulah Beach
The most common commute times in Beulah Beach are 60 to 89 minutes (24 commuters, 100.0%) for males and less than 5 minutes (14 commuters, 100.0%) for females.
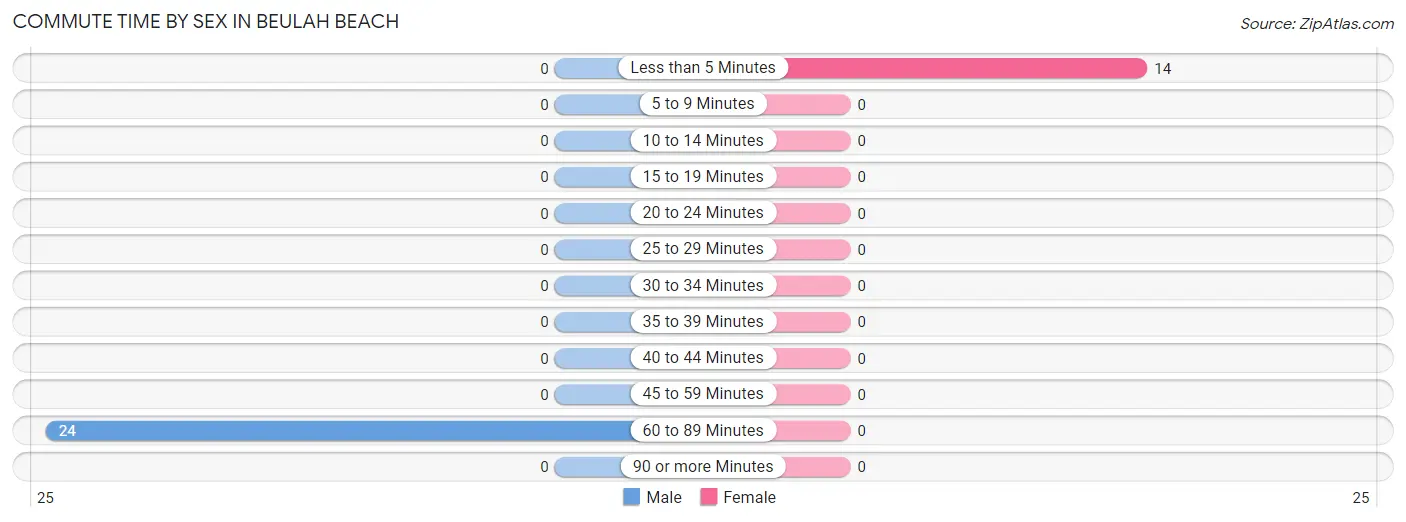
| Commute Time | Male | Female |
| Less than 5 Minutes | 0 (0.0%) | 14 (100.0%) |
| 5 to 9 Minutes | 0 (0.0%) | 0 (0.0%) |
| 10 to 14 Minutes | 0 (0.0%) | 0 (0.0%) |
| 15 to 19 Minutes | 0 (0.0%) | 0 (0.0%) |
| 20 to 24 Minutes | 0 (0.0%) | 0 (0.0%) |
| 25 to 29 Minutes | 0 (0.0%) | 0 (0.0%) |
| 30 to 34 Minutes | 0 (0.0%) | 0 (0.0%) |
| 35 to 39 Minutes | 0 (0.0%) | 0 (0.0%) |
| 40 to 44 Minutes | 0 (0.0%) | 0 (0.0%) |
| 45 to 59 Minutes | 0 (0.0%) | 0 (0.0%) |
| 60 to 89 Minutes | 24 (100.0%) | 0 (0.0%) |
| 90 or more Minutes | 0 (0.0%) | 0 (0.0%) |
Time of Departure to Work by Sex in Beulah Beach
The most frequent times of departure to work in Beulah Beach are 9:00 AM to 9:59 AM (24, 100.0%) for males and 8:30 AM to 8:59 AM (14, 100.0%) for females.
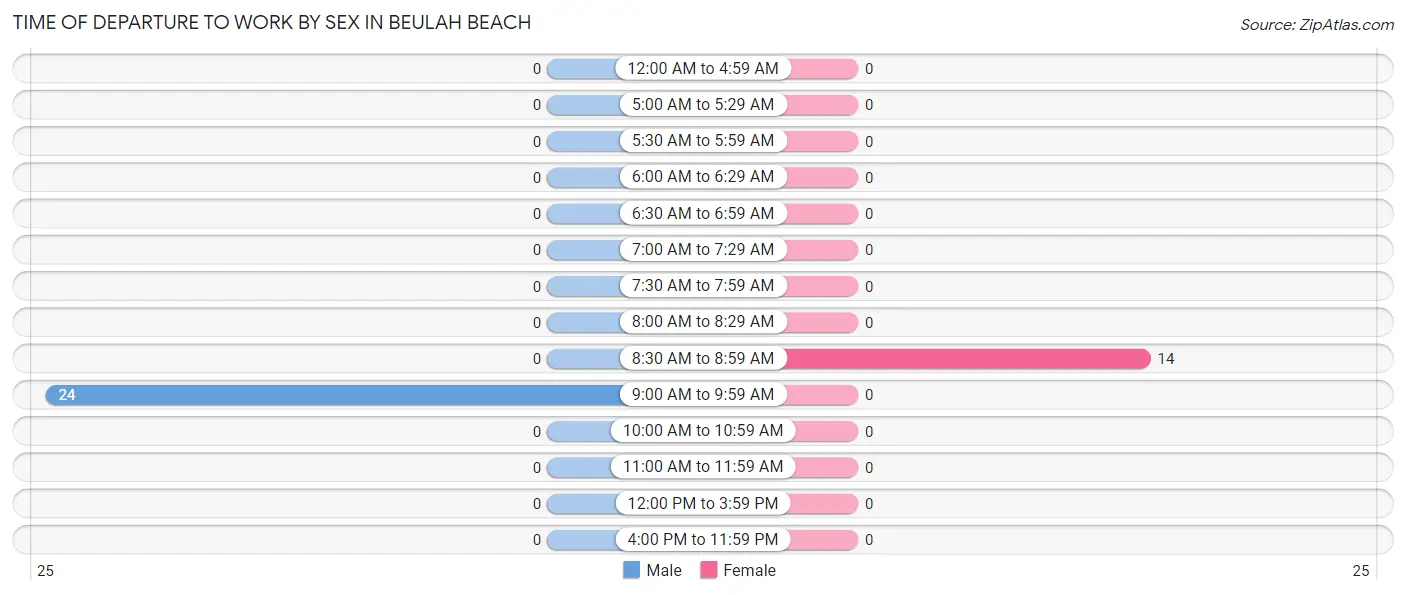
| Time of Departure | Male | Female |
| 12:00 AM to 4:59 AM | 0 (0.0%) | 0 (0.0%) |
| 5:00 AM to 5:29 AM | 0 (0.0%) | 0 (0.0%) |
| 5:30 AM to 5:59 AM | 0 (0.0%) | 0 (0.0%) |
| 6:00 AM to 6:29 AM | 0 (0.0%) | 0 (0.0%) |
| 6:30 AM to 6:59 AM | 0 (0.0%) | 0 (0.0%) |
| 7:00 AM to 7:29 AM | 0 (0.0%) | 0 (0.0%) |
| 7:30 AM to 7:59 AM | 0 (0.0%) | 0 (0.0%) |
| 8:00 AM to 8:29 AM | 0 (0.0%) | 0 (0.0%) |
| 8:30 AM to 8:59 AM | 0 (0.0%) | 14 (100.0%) |
| 9:00 AM to 9:59 AM | 24 (100.0%) | 0 (0.0%) |
| 10:00 AM to 10:59 AM | 0 (0.0%) | 0 (0.0%) |
| 11:00 AM to 11:59 AM | 0 (0.0%) | 0 (0.0%) |
| 12:00 PM to 3:59 PM | 0 (0.0%) | 0 (0.0%) |
| 4:00 PM to 11:59 PM | 0 (0.0%) | 0 (0.0%) |
| Total | 24 (100.0%) | 14 (100.0%) |
Housing Occupancy in Beulah Beach
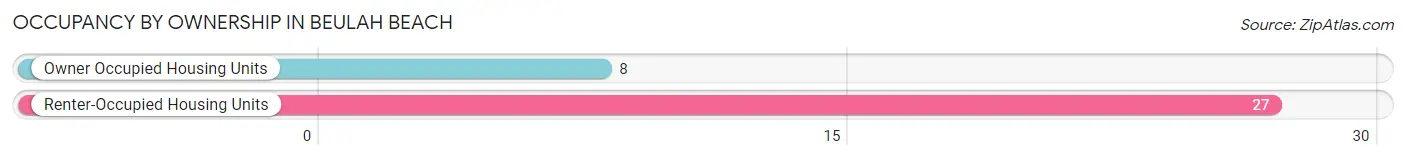
Occupancy by Ownership in Beulah Beach
Of the total 35 dwellings in Beulah Beach, owner-occupied units account for 8 (22.9%), while renter-occupied units make up 27 (77.1%).
| Occupancy | # Housing Units | % Housing Units |
| Owner Occupied Housing Units | 8 | 22.9% |
| Renter-Occupied Housing Units | 27 | 77.1% |
| Total Occupied Housing Units | 35 | 100.0% |
Occupancy by Household Size in Beulah Beach
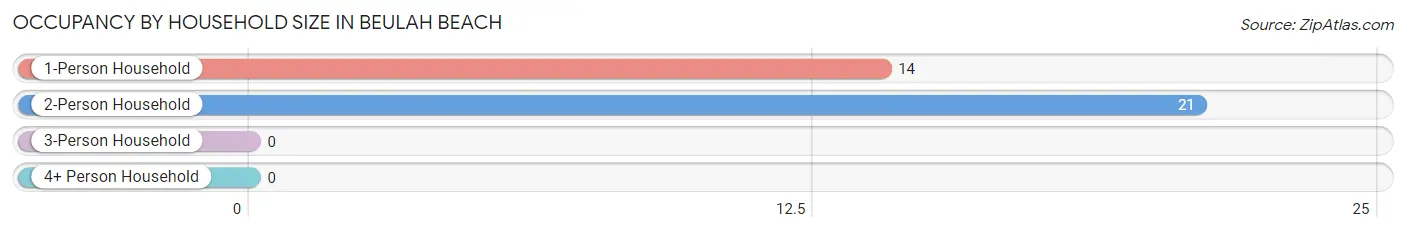
| Household Size | # Housing Units | % Housing Units |
| 1-Person Household | 14 | 40.0% |
| 2-Person Household | 21 | 60.0% |
| 3-Person Household | 0 | 0.0% |
| 4+ Person Household | 0 | 0.0% |
| Total Housing Units | 35 | 100.0% |
Occupancy by Ownership by Household Size in Beulah Beach
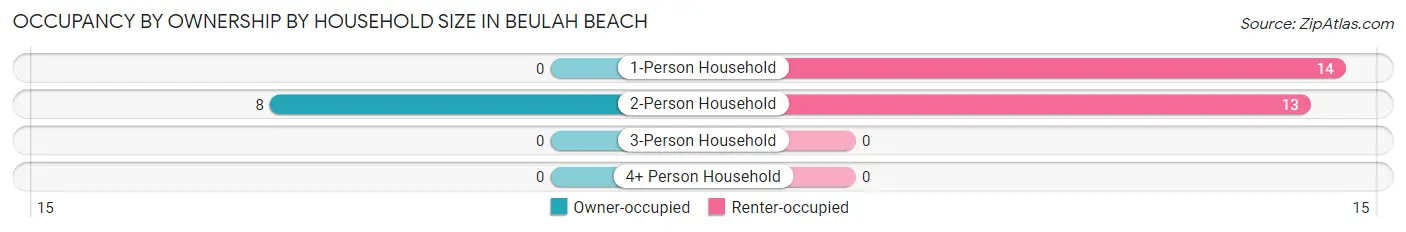
| Household Size | Owner-occupied | Renter-occupied |
| 1-Person Household | 0 (0.0%) | 14 (100.0%) |
| 2-Person Household | 8 (38.1%) | 13 (61.9%) |
| 3-Person Household | 0 (0.0%) | 0 (0.0%) |
| 4+ Person Household | 0 (0.0%) | 0 (0.0%) |
| Total Housing Units | 8 (22.9%) | 27 (77.1%) |
Occupancy by Educational Attainment in Beulah Beach
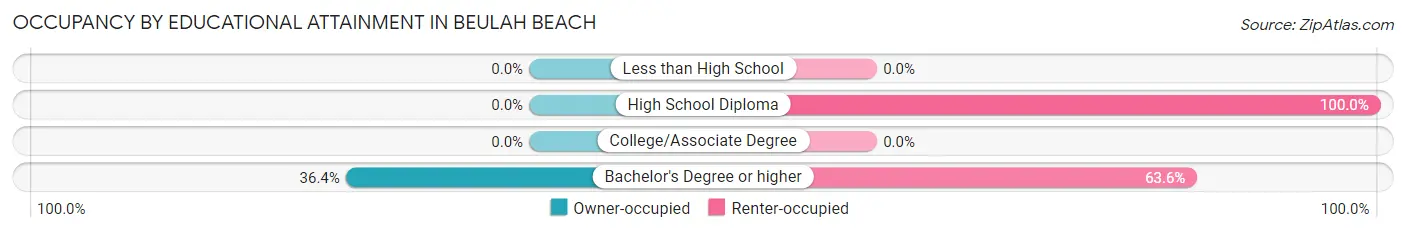
| Household Size | Owner-occupied | Renter-occupied |
| Less than High School | 0 (0.0%) | 0 (0.0%) |
| High School Diploma | 0 (0.0%) | 13 (100.0%) |
| College/Associate Degree | 0 (0.0%) | 0 (0.0%) |
| Bachelor's Degree or higher | 8 (36.4%) | 14 (63.6%) |
Occupancy by Age of Householder in Beulah Beach
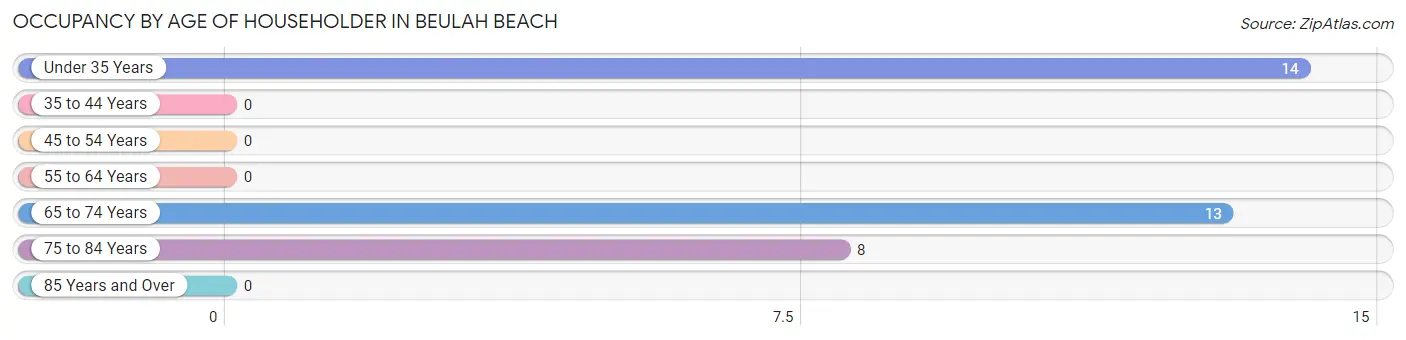
| Age Bracket | # Households | % Households |
| Under 35 Years | 14 | 40.0% |
| 35 to 44 Years | 0 | 0.0% |
| 45 to 54 Years | 0 | 0.0% |
| 55 to 64 Years | 0 | 0.0% |
| 65 to 74 Years | 13 | 37.1% |
| 75 to 84 Years | 8 | 22.9% |
| 85 Years and Over | 0 | 0.0% |
| Total | 35 | 100.0% |
Housing Finances in Beulah Beach
Median Income by Occupancy in Beulah Beach
| Occupancy Type | # Households | Median Income |
| Owner-Occupied | 8 (22.9%) | $0 |
| Renter-Occupied | 27 (77.1%) | $0 |
| Average | 35 (100.0%) | $0 |
Occupancy by Householder Income Bracket in Beulah Beach
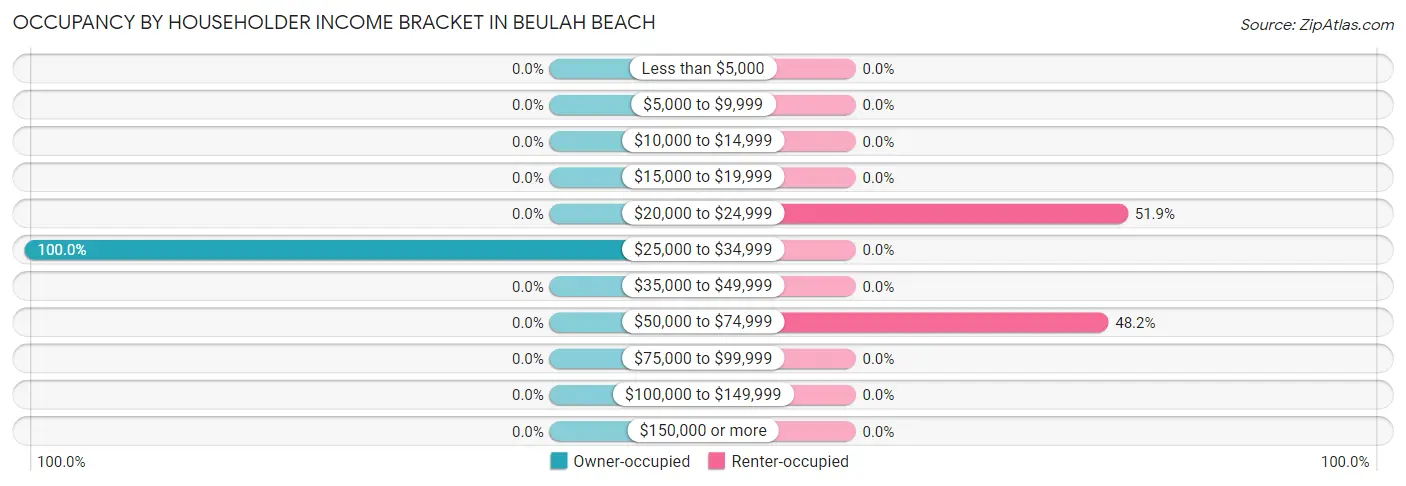
| Income Bracket | Owner-occupied | Renter-occupied |
| Less than $5,000 | 0 (0.0%) | 0 (0.0%) |
| $5,000 to $9,999 | 0 (0.0%) | 0 (0.0%) |
| $10,000 to $14,999 | 0 (0.0%) | 0 (0.0%) |
| $15,000 to $19,999 | 0 (0.0%) | 0 (0.0%) |
| $20,000 to $24,999 | 0 (0.0%) | 14 (51.8%) |
| $25,000 to $34,999 | 8 (100.0%) | 0 (0.0%) |
| $35,000 to $49,999 | 0 (0.0%) | 0 (0.0%) |
| $50,000 to $74,999 | 0 (0.0%) | 13 (48.1%) |
| $75,000 to $99,999 | 0 (0.0%) | 0 (0.0%) |
| $100,000 to $149,999 | 0 (0.0%) | 0 (0.0%) |
| $150,000 or more | 0 (0.0%) | 0 (0.0%) |
| Total | 8 (100.0%) | 27 (100.0%) |
Monthly Housing Cost Tiers in Beulah Beach
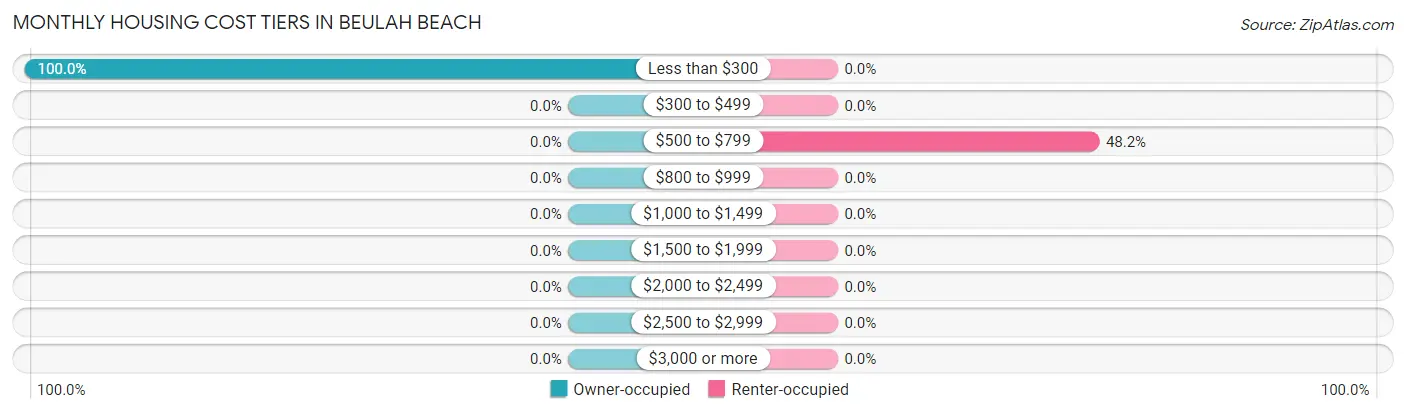
| Monthly Cost | Owner-occupied | Renter-occupied |
| Less than $300 | 8 (100.0%) | 0 (0.0%) |
| $300 to $499 | 0 (0.0%) | 0 (0.0%) |
| $500 to $799 | 0 (0.0%) | 13 (48.1%) |
| $800 to $999 | 0 (0.0%) | 0 (0.0%) |
| $1,000 to $1,499 | 0 (0.0%) | 0 (0.0%) |
| $1,500 to $1,999 | 0 (0.0%) | 0 (0.0%) |
| $2,000 to $2,499 | 0 (0.0%) | 0 (0.0%) |
| $2,500 to $2,999 | 0 (0.0%) | 0 (0.0%) |
| $3,000 or more | 0 (0.0%) | 0 (0.0%) |
| Total | 8 (100.0%) | 27 (100.0%) |
Physical Housing Characteristics in Beulah Beach
Housing Structures in Beulah Beach
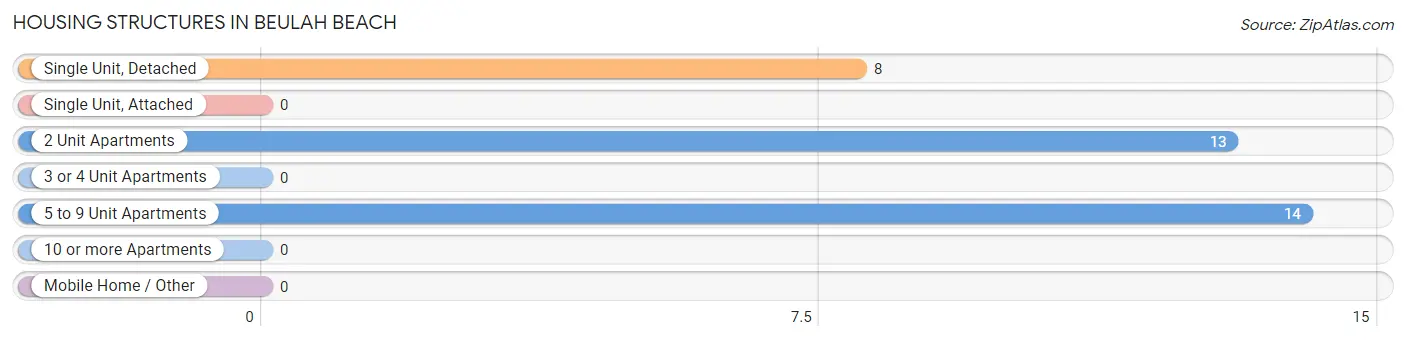
| Structure Type | # Housing Units | % Housing Units |
| Single Unit, Detached | 8 | 22.9% |
| Single Unit, Attached | 0 | 0.0% |
| 2 Unit Apartments | 13 | 37.1% |
| 3 or 4 Unit Apartments | 0 | 0.0% |
| 5 to 9 Unit Apartments | 14 | 40.0% |
| 10 or more Apartments | 0 | 0.0% |
| Mobile Home / Other | 0 | 0.0% |
| Total | 35 | 100.0% |
Housing Structures by Occupancy in Beulah Beach
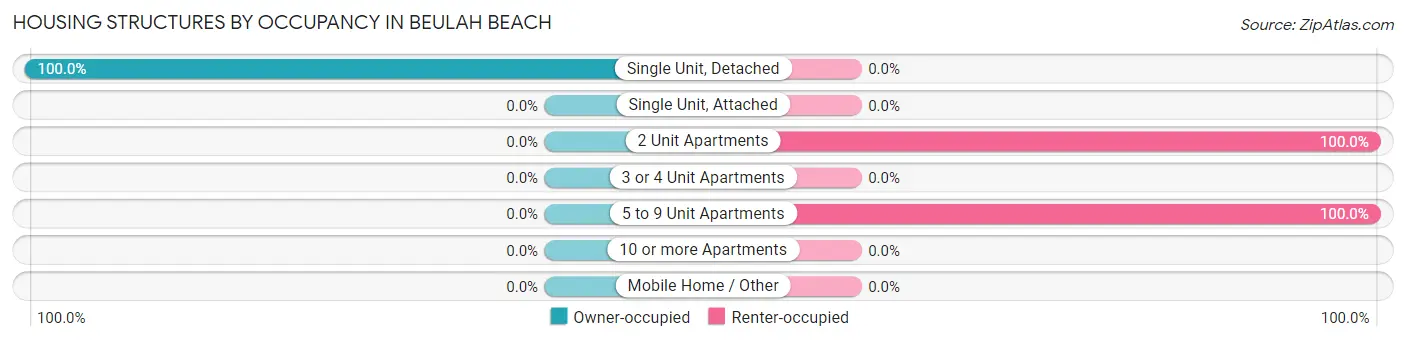
| Structure Type | Owner-occupied | Renter-occupied |
| Single Unit, Detached | 8 (100.0%) | 0 (0.0%) |
| Single Unit, Attached | 0 (0.0%) | 0 (0.0%) |
| 2 Unit Apartments | 0 (0.0%) | 13 (100.0%) |
| 3 or 4 Unit Apartments | 0 (0.0%) | 0 (0.0%) |
| 5 to 9 Unit Apartments | 0 (0.0%) | 14 (100.0%) |
| 10 or more Apartments | 0 (0.0%) | 0 (0.0%) |
| Mobile Home / Other | 0 (0.0%) | 0 (0.0%) |
| Total | 8 (22.9%) | 27 (77.1%) |
Housing Structures by Number of Rooms in Beulah Beach
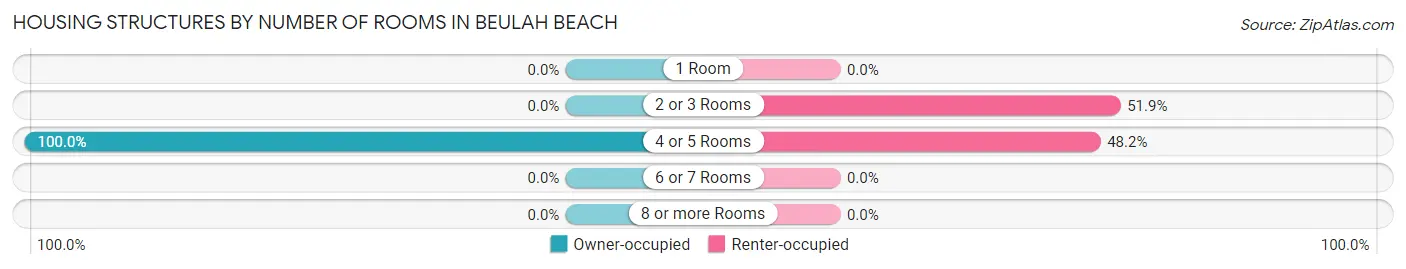
| Number of Rooms | Owner-occupied | Renter-occupied |
| 1 Room | 0 (0.0%) | 0 (0.0%) |
| 2 or 3 Rooms | 0 (0.0%) | 14 (51.8%) |
| 4 or 5 Rooms | 8 (100.0%) | 13 (48.1%) |
| 6 or 7 Rooms | 0 (0.0%) | 0 (0.0%) |
| 8 or more Rooms | 0 (0.0%) | 0 (0.0%) |
| Total | 8 (100.0%) | 27 (100.0%) |
Housing Structure by Heating Type in Beulah Beach
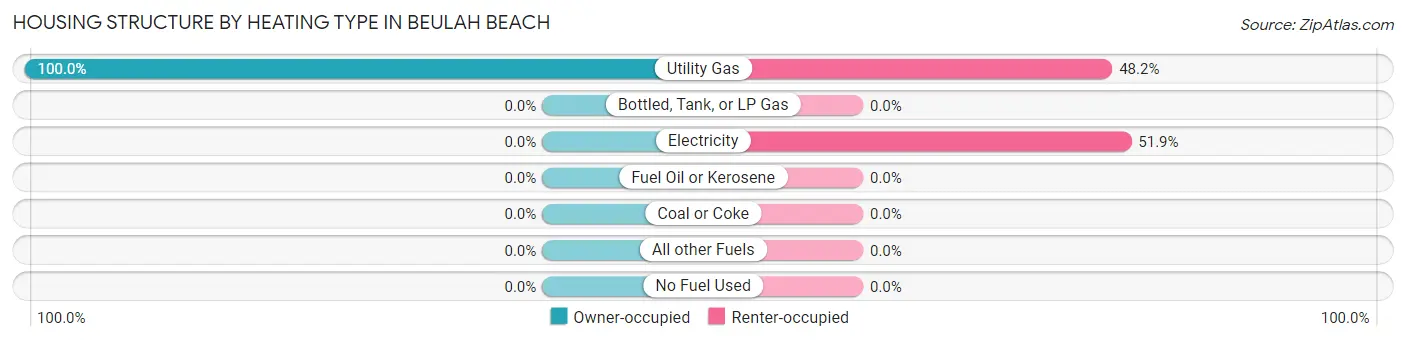
| Heating Type | Owner-occupied | Renter-occupied |
| Utility Gas | 8 (100.0%) | 13 (48.1%) |
| Bottled, Tank, or LP Gas | 0 (0.0%) | 0 (0.0%) |
| Electricity | 0 (0.0%) | 14 (51.8%) |
| Fuel Oil or Kerosene | 0 (0.0%) | 0 (0.0%) |
| Coal or Coke | 0 (0.0%) | 0 (0.0%) |
| All other Fuels | 0 (0.0%) | 0 (0.0%) |
| No Fuel Used | 0 (0.0%) | 0 (0.0%) |
| Total | 8 (100.0%) | 27 (100.0%) |
Household Vehicle Usage in Beulah Beach
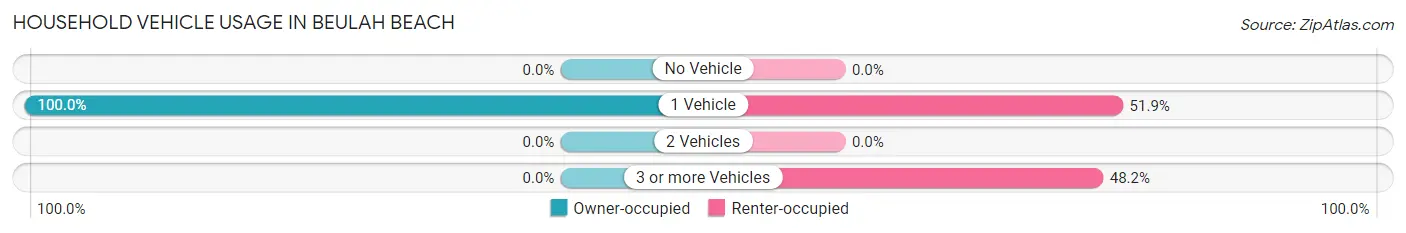
| Vehicles per Household | Owner-occupied | Renter-occupied |
| No Vehicle | 0 (0.0%) | 0 (0.0%) |
| 1 Vehicle | 8 (100.0%) | 14 (51.8%) |
| 2 Vehicles | 0 (0.0%) | 0 (0.0%) |
| 3 or more Vehicles | 0 (0.0%) | 13 (48.1%) |
| Total | 8 (100.0%) | 27 (100.0%) |
Real Estate & Mortgages in Beulah Beach
Real Estate and Mortgage Overview in Beulah Beach
| Characteristic | Without Mortgage | With Mortgage |
| Housing Units | 8 | 0 |
| Median Property Value | - | - |
| Median Household Income | - | - |
| Monthly Housing Costs | - | - |
| Real Estate Taxes | - | - |
Property Value by Mortgage Status in Beulah Beach
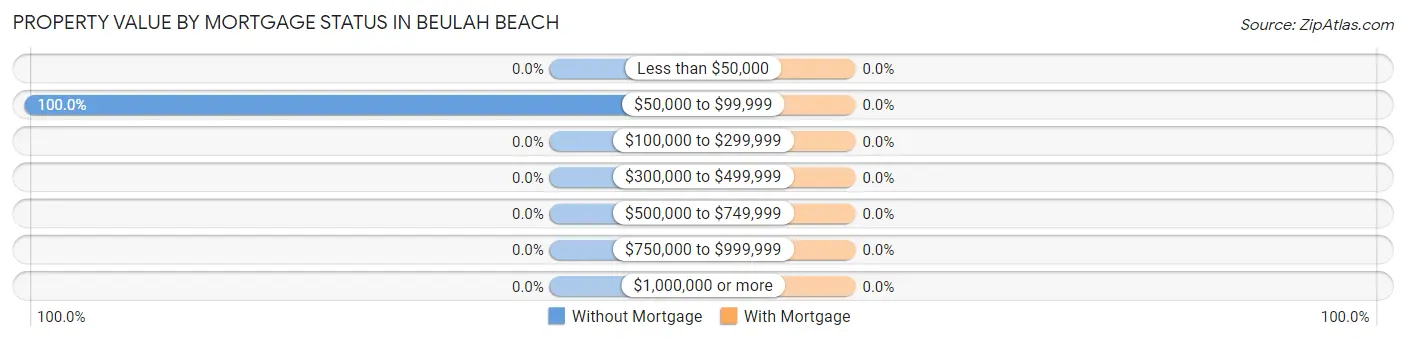
| Property Value | Without Mortgage | With Mortgage |
| Less than $50,000 | 0 (0.0%) | 0 (0.0%) |
| $50,000 to $99,999 | 8 (100.0%) | 0 (0.0%) |
| $100,000 to $299,999 | 0 (0.0%) | 0 (0.0%) |
| $300,000 to $499,999 | 0 (0.0%) | 0 (0.0%) |
| $500,000 to $749,999 | 0 (0.0%) | 0 (0.0%) |
| $750,000 to $999,999 | 0 (0.0%) | 0 (0.0%) |
| $1,000,000 or more | 0 (0.0%) | 0 (0.0%) |
| Total | 8 (100.0%) | 0 (0.0%) |
Household Income by Mortgage Status in Beulah Beach
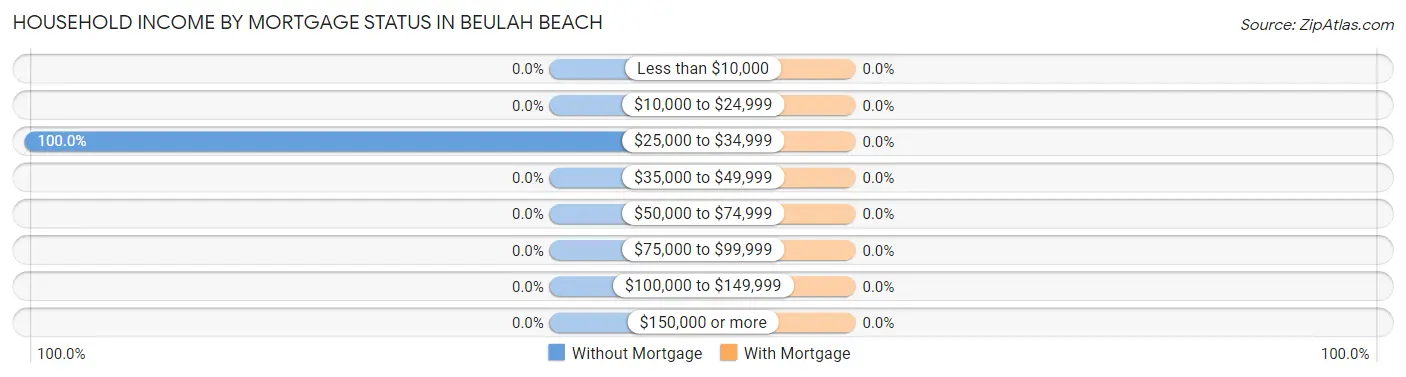
| Household Income | Without Mortgage | With Mortgage |
| Less than $10,000 | 0 (0.0%) | 0 (0.0%) |
| $10,000 to $24,999 | 0 (0.0%) | 0 (0.0%) |
| $25,000 to $34,999 | 8 (100.0%) | 0 (0.0%) |
| $35,000 to $49,999 | 0 (0.0%) | 0 (0.0%) |
| $50,000 to $74,999 | 0 (0.0%) | 0 (0.0%) |
| $75,000 to $99,999 | 0 (0.0%) | 0 (0.0%) |
| $100,000 to $149,999 | 0 (0.0%) | 0 (0.0%) |
| $150,000 or more | 0 (0.0%) | 0 (0.0%) |
| Total | 8 (100.0%) | 0 (0.0%) |
Property Value to Household Income Ratio in Beulah Beach
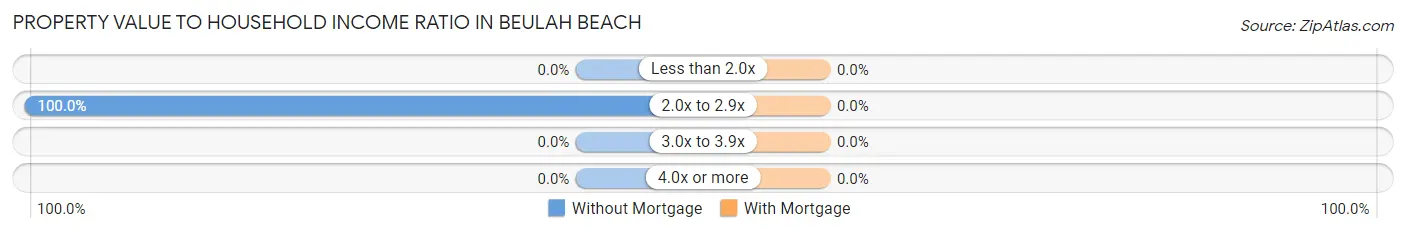
| Value-to-Income Ratio | Without Mortgage | With Mortgage |
| Less than 2.0x | 0 (0.0%) | 0 (0.0%) |
| 2.0x to 2.9x | 8 (100.0%) | 0 (0.0%) |
| 3.0x to 3.9x | 0 (0.0%) | 0 (0.0%) |
| 4.0x or more | 0 (0.0%) | 0 (0.0%) |
| Total | 8 (100.0%) | 0 (0.0%) |
Real Estate Taxes by Mortgage Status in Beulah Beach
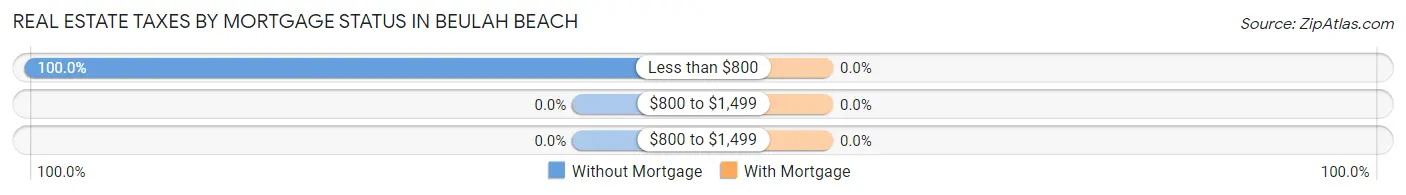
| Property Taxes | Without Mortgage | With Mortgage |
| Less than $800 | 8 (100.0%) | 0 (0.0%) |
| $800 to $1,499 | 0 (0.0%) | 0 (0.0%) |
| $800 to $1,499 | 0 (0.0%) | 0 (0.0%) |
| Total | 8 (100.0%) | 0 (0.0%) |
Health & Disability in Beulah Beach
Health Insurance Coverage by Age in Beulah Beach
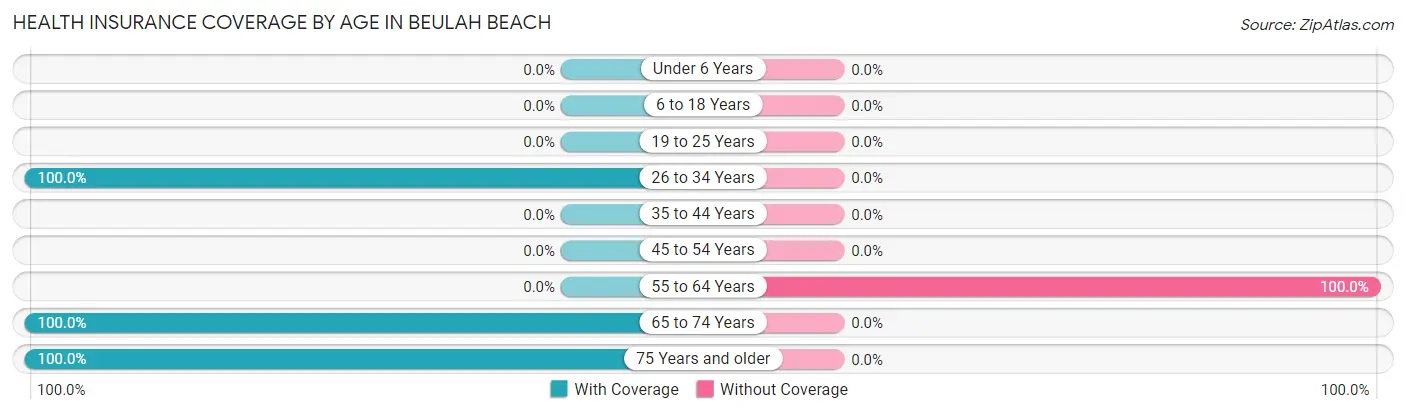
| Age Bracket | With Coverage | Without Coverage |
| Under 6 Years | 0 (0.0%) | 0 (0.0%) |
| 6 to 18 Years | 0 (0.0%) | 0 (0.0%) |
| 19 to 25 Years | 0 (0.0%) | 0 (0.0%) |
| 26 to 34 Years | 14 (100.0%) | 0 (0.0%) |
| 35 to 44 Years | 0 (0.0%) | 0 (0.0%) |
| 45 to 54 Years | 0 (0.0%) | 0 (0.0%) |
| 55 to 64 Years | 0 (0.0%) | 24 (100.0%) |
| 65 to 74 Years | 13 (100.0%) | 0 (0.0%) |
| 75 Years and older | 16 (100.0%) | 0 (0.0%) |
| Total | 43 (64.2%) | 24 (35.8%) |
Health Insurance Coverage by Citizenship Status in Beulah Beach
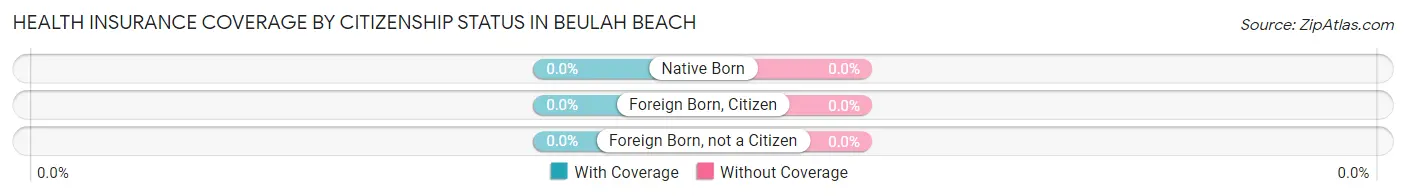
| Citizenship Status | With Coverage | Without Coverage |
| Native Born | 0 (0.0%) | 0 (0.0%) |
| Foreign Born, Citizen | 0 (0.0%) | 0 (0.0%) |
| Foreign Born, not a Citizen | 0 (0.0%) | 0 (0.0%) |
Health Insurance Coverage by Household Income in Beulah Beach
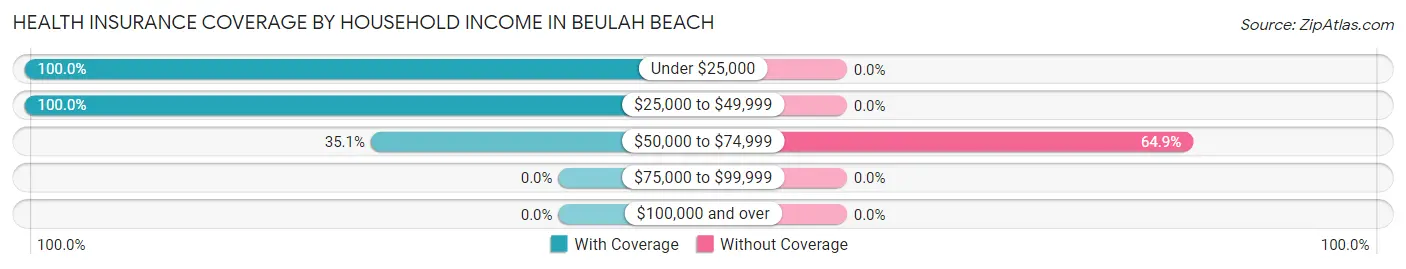
| Household Income | With Coverage | Without Coverage |
| Under $25,000 | 14 (100.0%) | 0 (0.0%) |
| $25,000 to $49,999 | 16 (100.0%) | 0 (0.0%) |
| $50,000 to $74,999 | 13 (35.1%) | 24 (64.9%) |
| $75,000 to $99,999 | 0 (0.0%) | 0 (0.0%) |
| $100,000 and over | 0 (0.0%) | 0 (0.0%) |
Public vs Private Health Insurance Coverage by Age in Beulah Beach
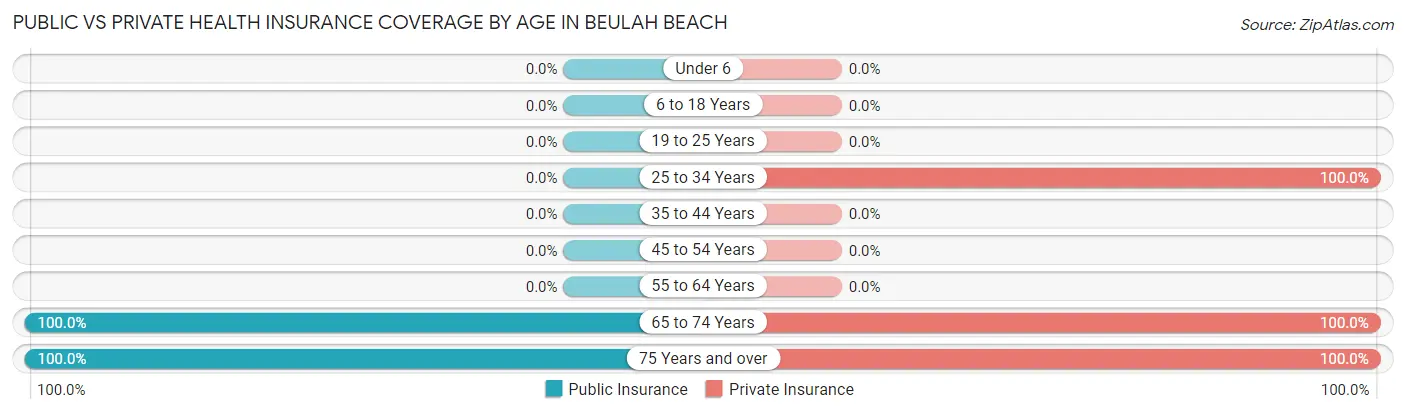
| Age Bracket | Public Insurance | Private Insurance |
| Under 6 | 0 (0.0%) | 0 (0.0%) |
| 6 to 18 Years | 0 (0.0%) | 0 (0.0%) |
| 19 to 25 Years | 0 (0.0%) | 0 (0.0%) |
| 25 to 34 Years | 0 (0.0%) | 14 (100.0%) |
| 35 to 44 Years | 0 (0.0%) | 0 (0.0%) |
| 45 to 54 Years | 0 (0.0%) | 0 (0.0%) |
| 55 to 64 Years | 0 (0.0%) | 0 (0.0%) |
| 65 to 74 Years | 13 (100.0%) | 13 (100.0%) |
| 75 Years and over | 16 (100.0%) | 16 (100.0%) |
| Total | 29 (43.3%) | 43 (64.2%) |
Disability Status by Sex by Age in Beulah Beach
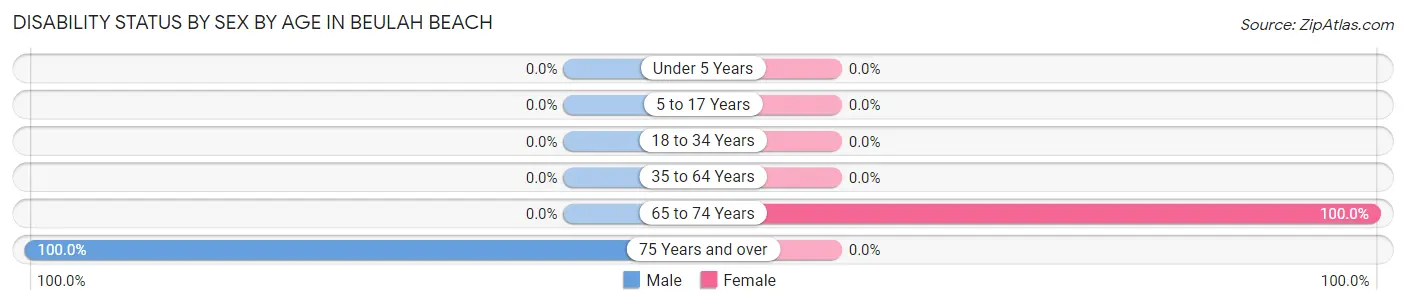
| Age Bracket | Male | Female |
| Under 5 Years | 0 (0.0%) | 0 (0.0%) |
| 5 to 17 Years | 0 (0.0%) | 0 (0.0%) |
| 18 to 34 Years | 0 (0.0%) | 0 (0.0%) |
| 35 to 64 Years | 0 (0.0%) | 0 (0.0%) |
| 65 to 74 Years | 0 (0.0%) | 13 (100.0%) |
| 75 Years and over | 8 (100.0%) | 0 (0.0%) |
Disability Class by Sex by Age in Beulah Beach
Disability Class: Hearing Difficulty
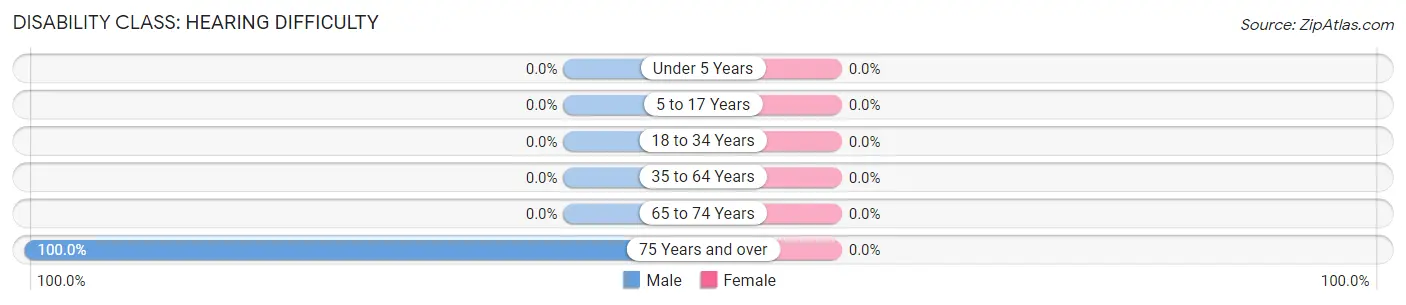
| Age Bracket | Male | Female |
| Under 5 Years | 0 (0.0%) | 0 (0.0%) |
| 5 to 17 Years | 0 (0.0%) | 0 (0.0%) |
| 18 to 34 Years | 0 (0.0%) | 0 (0.0%) |
| 35 to 64 Years | 0 (0.0%) | 0 (0.0%) |
| 65 to 74 Years | 0 (0.0%) | 0 (0.0%) |
| 75 Years and over | 8 (100.0%) | 0 (0.0%) |
Disability Class: Vision Difficulty
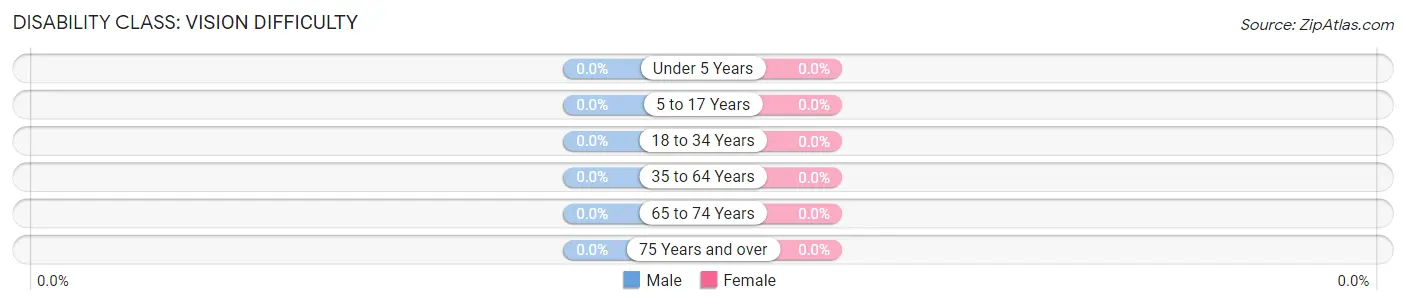
| Age Bracket | Male | Female |
| Under 5 Years | 0 (0.0%) | 0 (0.0%) |
| 5 to 17 Years | 0 (0.0%) | 0 (0.0%) |
| 18 to 34 Years | 0 (0.0%) | 0 (0.0%) |
| 35 to 64 Years | 0 (0.0%) | 0 (0.0%) |
| 65 to 74 Years | 0 (0.0%) | 0 (0.0%) |
| 75 Years and over | 0 (0.0%) | 0 (0.0%) |
Disability Class: Cognitive Difficulty

| Age Bracket | Male | Female |
| 5 to 17 Years | 0 (0.0%) | 0 (0.0%) |
| 18 to 34 Years | 0 (0.0%) | 0 (0.0%) |
| 35 to 64 Years | 0 (0.0%) | 0 (0.0%) |
| 65 to 74 Years | 0 (0.0%) | 0 (0.0%) |
| 75 Years and over | 0 (0.0%) | 0 (0.0%) |
Disability Class: Ambulatory Difficulty
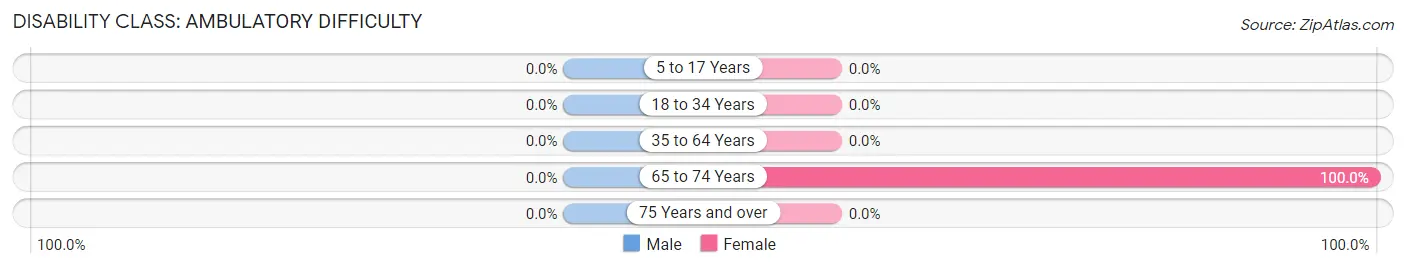
| Age Bracket | Male | Female |
| 5 to 17 Years | 0 (0.0%) | 0 (0.0%) |
| 18 to 34 Years | 0 (0.0%) | 0 (0.0%) |
| 35 to 64 Years | 0 (0.0%) | 0 (0.0%) |
| 65 to 74 Years | 0 (0.0%) | 13 (100.0%) |
| 75 Years and over | 0 (0.0%) | 0 (0.0%) |
Disability Class: Self-Care Difficulty
| Age Bracket | Male | Female |
| 5 to 17 Years | 0 (0.0%) | 0 (0.0%) |
| 18 to 34 Years | 0 (0.0%) | 0 (0.0%) |
| 35 to 64 Years | 0 (0.0%) | 0 (0.0%) |
| 65 to 74 Years | 0 (0.0%) | 0 (0.0%) |
| 75 Years and over | 0 (0.0%) | 0 (0.0%) |
Technology Access in Beulah Beach
Computing Device Access in Beulah Beach
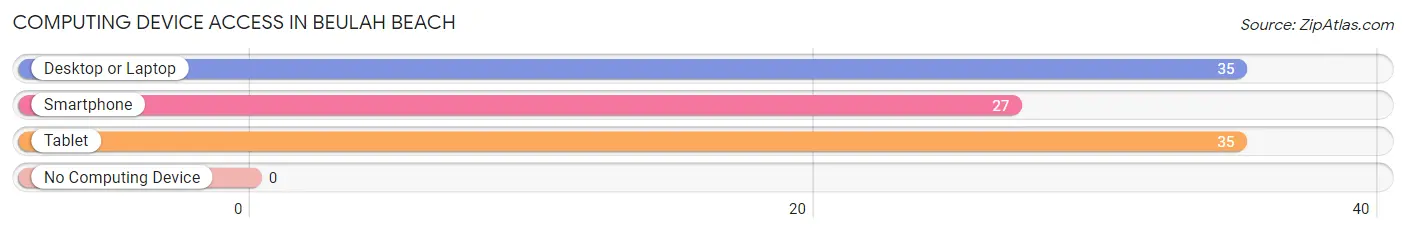
| Device Type | # Households | % Households |
| Desktop or Laptop | 35 | 100.0% |
| Smartphone | 27 | 77.1% |
| Tablet | 35 | 100.0% |
| No Computing Device | 0 | 0.0% |
| Total | 35 | 100.0% |
Internet Access in Beulah Beach
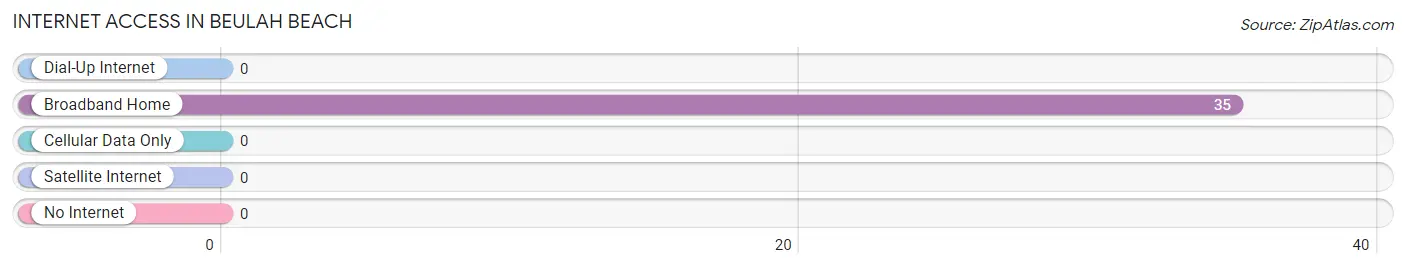
| Internet Type | # Households | % Households |
| Dial-Up Internet | 0 | 0.0% |
| Broadband Home | 35 | 100.0% |
| Cellular Data Only | 0 | 0.0% |
| Satellite Internet | 0 | 0.0% |
| No Internet | 0 | 0.0% |
| Total | 35 | 100.0% |
Beulah Beach Summary
Beulah Beach is a small unincorporated community located in Vermilion Township, Erie County, Ohio. It is situated on the south shore of Lake Erie, approximately 10 miles east of the city of Vermilion. The community is home to a small population of approximately 200 people.
History
Beulah Beach was founded in 1892 by a group of settlers from the nearby town of Vermilion. The settlers were looking for a place to build a summer resort and chose the area due to its beautiful views of Lake Erie. The original settlers named the area Beulah Beach after the biblical city of Beulah.
The first hotel in Beulah Beach was built in 1895 and was called the Beulah Beach Hotel. The hotel was a popular destination for vacationers and was known for its luxurious accommodations and amenities. The hotel was destroyed by a fire in 1910 and was never rebuilt.
In the early 1900s, Beulah Beach became a popular destination for wealthy vacationers from Cleveland and other nearby cities. The area was known for its beautiful beaches, fishing, and boating. The community also had a number of popular restaurants and bars.
In the 1920s, Beulah Beach began to decline in popularity as more people began to vacation in other areas of the country. The Great Depression also had a negative impact on the community as many of the wealthy vacationers stopped visiting the area.
In the 1950s, Beulah Beach began to experience a resurgence in popularity as more people began to visit the area for its beautiful beaches and recreational activities. The community also began to attract more permanent residents as the area became more developed.
Geography
Beulah Beach is located in Vermilion Township, Erie County, Ohio. It is situated on the south shore of Lake Erie, approximately 10 miles east of the city of Vermilion. The community is bordered by the towns of Huron and Vermilion to the west and east, respectively.
The area is characterized by flat terrain and is mostly covered in grasslands and woodlands. The community is home to a number of small lakes and ponds, as well as a number of creeks and streams.
Economy
Beulah Beach is a small, unincorporated community with a population of approximately 200 people. The community is primarily a residential area and does not have a large commercial or industrial base.
The primary source of income for the community is tourism. The area is known for its beautiful beaches and recreational activities, and is a popular destination for vacationers from Cleveland and other nearby cities. The community also has a number of restaurants and bars that attract visitors from the surrounding area.
Demographics
As of the 2010 census, Beulah Beach had a population of 200 people. The racial makeup of the community was 97.5% White, 0.5% African American, 0.5% Native American, 0.5% Asian, and 1.0% from other races.
The median household income in Beulah Beach was $45,000, and the median family income was $50,000. The per capita income was $20,000. Approximately 10.0% of the population was below the poverty line.
Common Questions
What is Per Capita Income in Beulah Beach?
Per Capita income in Beulah Beach is $27,967.
What is Inequality or Gini Index in Beulah Beach?
Inequality or Gini Index in Beulah Beach is 0.24.
What is the Total Population of Beulah Beach?
Total Population of Beulah Beach is 67.
What is the Total Male Population of Beulah Beach?
Total Male Population of Beulah Beach is 32.
What is the Total Female Population of Beulah Beach?
Total Female Population of Beulah Beach is 35.
What is the Ratio of Males per 100 Females in Beulah Beach?
There are 91.43 Males per 100 Females in Beulah Beach.
What is the Ratio of Females per 100 Males in Beulah Beach?
There are 109.38 Females per 100 Males in Beulah Beach.
What is the Median Population Age in Beulah Beach?
Median Population Age in Beulah Beach is 58.8 Years.
What is the Average Family Size in Beulah Beach
Average Family Size in Beulah Beach is 2.5 People.
What is the Average Household Size in Beulah Beach
Average Household Size in Beulah Beach is 1.9 People.
How Large is the Labor Force in Beulah Beach?
There are 51 People in the Labor Forcein in Beulah Beach.
What is the Percentage of People in the Labor Force in Beulah Beach?
76.1% of People are in the Labor Force in Beulah Beach.
What is the Unemployment Rate in Beulah Beach?
Unemployment Rate in Beulah Beach is 25.5%.