Trotwood, OH Map & Demographics
Trotwood Map
Trotwood Overview
$27,670
PER CAPITA INCOME
$58,540
AVG FAMILY INCOME
$46,442
AVG HOUSEHOLD INCOME
16.4%
WAGE / INCOME GAP [ % ]
83.6¢/ $1
WAGE / INCOME GAP [ $ ]
0.44
INEQUALITY / GINI INDEX
23,125
TOTAL POPULATION
9,857
MALE POPULATION
13,268
FEMALE POPULATION
74.29
MALES / 100 FEMALES
134.60
FEMALES / 100 MALES
44.4
MEDIAN AGE
3.0
AVG FAMILY SIZE
2.2
AVG HOUSEHOLD SIZE
10,998
LABOR FORCE [ PEOPLE ]
57.9%
PERCENT IN LABOR FORCE
8.4%
UNEMPLOYMENT RATE
Trotwood Area Codes
Income in Trotwood
Income Overview in Trotwood
Per Capita Income in Trotwood is $27,670, while median incomes of families and households are $58,540 and $46,442 respectively.
| Characteristic | Number | Measure |
| Per Capita Income | 23,125 | $27,670 |
| Median Family Income | 5,571 | $58,540 |
| Mean Family Income | 5,571 | $71,183 |
| Median Household Income | 10,233 | $46,442 |
| Mean Household Income | 10,233 | $59,982 |
| Income Deficit | 5,571 | $0 |
| Wage / Income Gap (%) | 23,125 | 16.35% |
| Wage / Income Gap ($) | 23,125 | 83.65¢ per $1 |
| Gini / Inequality Index | 23,125 | 0.44 |
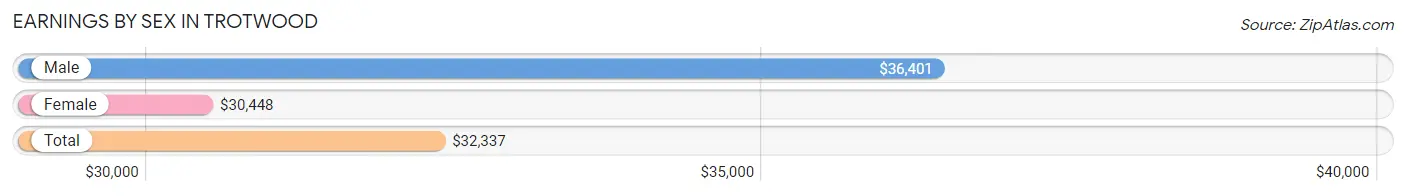
Earnings by Sex in Trotwood
Average Earnings in Trotwood are $32,337, $36,401 for men and $30,448 for women, a difference of 16.4%.
| Sex | Number | Average Earnings |
| Male | 5,054 (43.2%) | $36,401 |
| Female | 6,657 (56.8%) | $30,448 |
| Total | 11,711 (100.0%) | $32,337 |
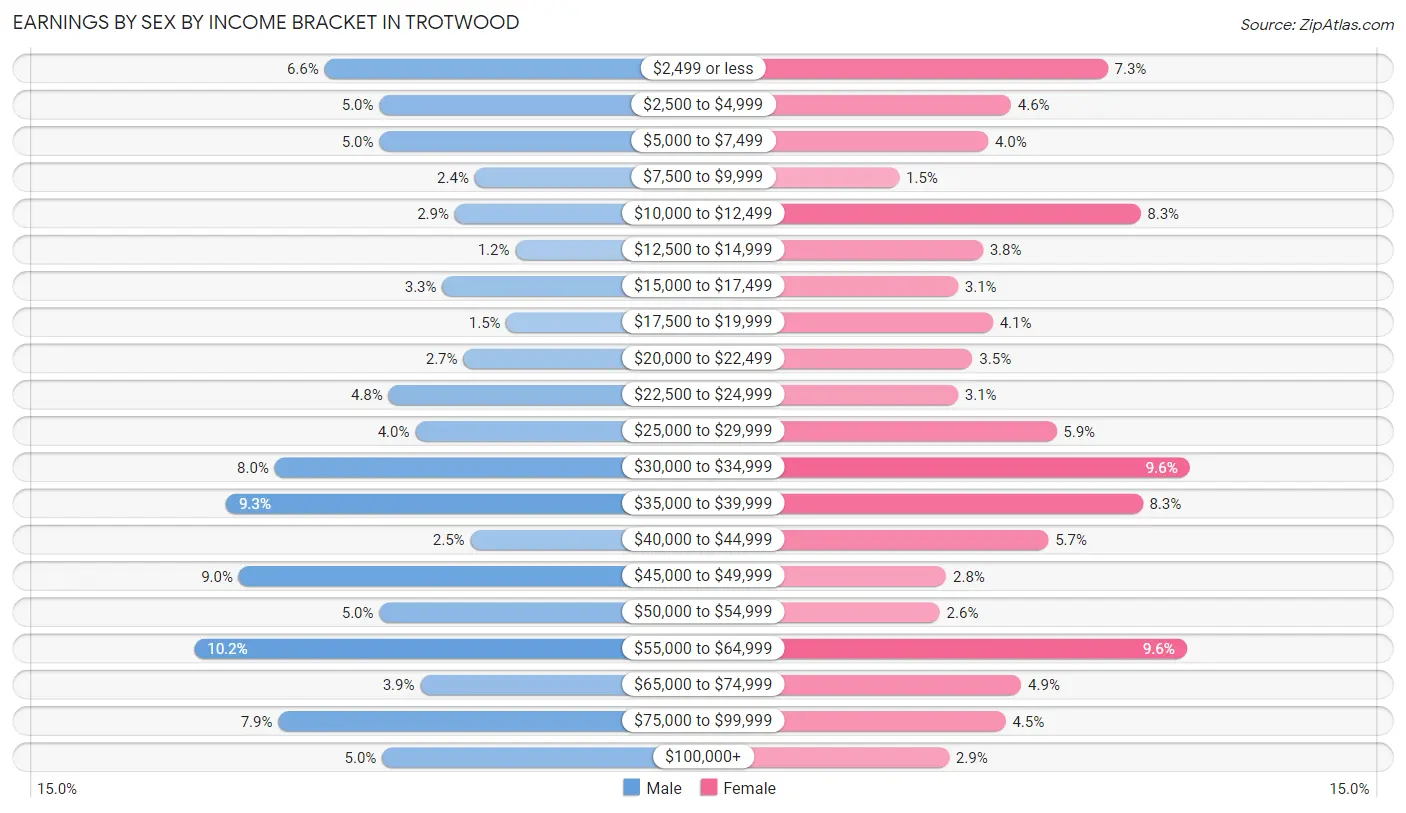
Earnings by Sex by Income Bracket in Trotwood
The most common earnings brackets in Trotwood are $55,000 to $64,999 for men (517 | 10.2%) and $30,000 to $34,999 for women (641 | 9.6%).
| Income | Male | Female |
| $2,499 or less | 332 (6.6%) | 488 (7.3%) |
| $2,500 to $4,999 | 254 (5.0%) | 307 (4.6%) |
| $5,000 to $7,499 | 254 (5.0%) | 264 (4.0%) |
| $7,500 to $9,999 | 119 (2.4%) | 98 (1.5%) |
| $10,000 to $12,499 | 147 (2.9%) | 549 (8.3%) |
| $12,500 to $14,999 | 61 (1.2%) | 254 (3.8%) |
| $15,000 to $17,499 | 165 (3.3%) | 208 (3.1%) |
| $17,500 to $19,999 | 74 (1.5%) | 273 (4.1%) |
| $20,000 to $22,499 | 135 (2.7%) | 235 (3.5%) |
| $22,500 to $24,999 | 241 (4.8%) | 208 (3.1%) |
| $25,000 to $29,999 | 203 (4.0%) | 392 (5.9%) |
| $30,000 to $34,999 | 403 (8.0%) | 641 (9.6%) |
| $35,000 to $39,999 | 472 (9.3%) | 553 (8.3%) |
| $40,000 to $44,999 | 125 (2.5%) | 377 (5.7%) |
| $45,000 to $49,999 | 454 (9.0%) | 186 (2.8%) |
| $50,000 to $54,999 | 254 (5.0%) | 174 (2.6%) |
| $55,000 to $64,999 | 517 (10.2%) | 636 (9.6%) |
| $65,000 to $74,999 | 196 (3.9%) | 326 (4.9%) |
| $75,000 to $99,999 | 398 (7.9%) | 297 (4.5%) |
| $100,000+ | 250 (5.0%) | 191 (2.9%) |
| Total | 5,054 (100.0%) | 6,657 (100.0%) |
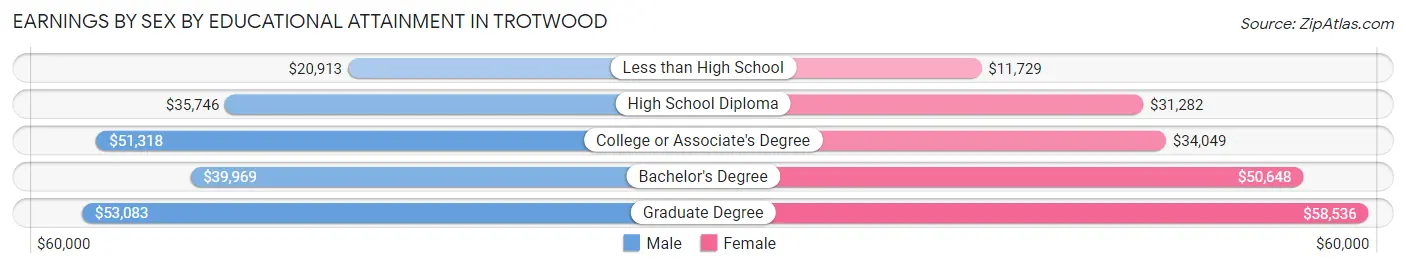
Earnings by Sex by Educational Attainment in Trotwood
Average earnings in Trotwood are $39,983 for men and $33,840 for women, a difference of 15.4%. Men with an educational attainment of graduate degree enjoy the highest average annual earnings of $53,083, while those with less than high school education earn the least with $20,913. Women with an educational attainment of graduate degree earn the most with the average annual earnings of $58,536, while those with less than high school education have the smallest earnings of $11,729.
| Educational Attainment | Male Income | Female Income |
| Less than High School | $20,913 | $11,729 |
| High School Diploma | $35,746 | $31,282 |
| College or Associate's Degree | $51,318 | $34,049 |
| Bachelor's Degree | $39,969 | $50,648 |
| Graduate Degree | $53,083 | $58,536 |
| Total | $39,983 | $33,840 |
Family Income in Trotwood
Family Income Brackets in Trotwood
According to the Trotwood family income data, there are 1,120 families falling into the $100,000 to $149,999 income range, which is the most common income bracket and makes up 20.1% of all families. Conversely, the $200,000+ income bracket is the least frequent group with only 117 families (2.1%) belonging to this category.
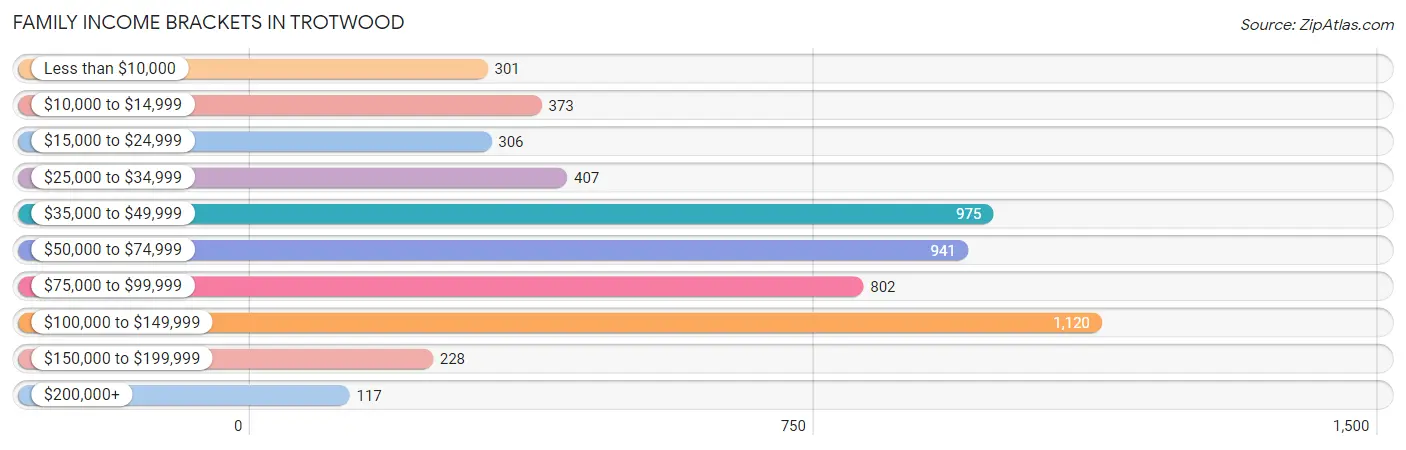
| Income Bracket | # Families | % Families |
| Less than $10,000 | 301 | 5.4% |
| $10,000 to $14,999 | 373 | 6.7% |
| $15,000 to $24,999 | 306 | 5.5% |
| $25,000 to $34,999 | 407 | 7.3% |
| $35,000 to $49,999 | 975 | 17.5% |
| $50,000 to $74,999 | 941 | 16.9% |
| $75,000 to $99,999 | 802 | 14.4% |
| $100,000 to $149,999 | 1,120 | 20.1% |
| $150,000 to $199,999 | 228 | 4.1% |
| $200,000+ | 117 | 2.1% |
Family Income by Famaliy Size in Trotwood
6-person families (179 | 3.2%) account for the highest median family income in Trotwood with $81,964 per family, while 2-person families (2,931 | 52.6%) have the highest median income of $29,904 per family member.
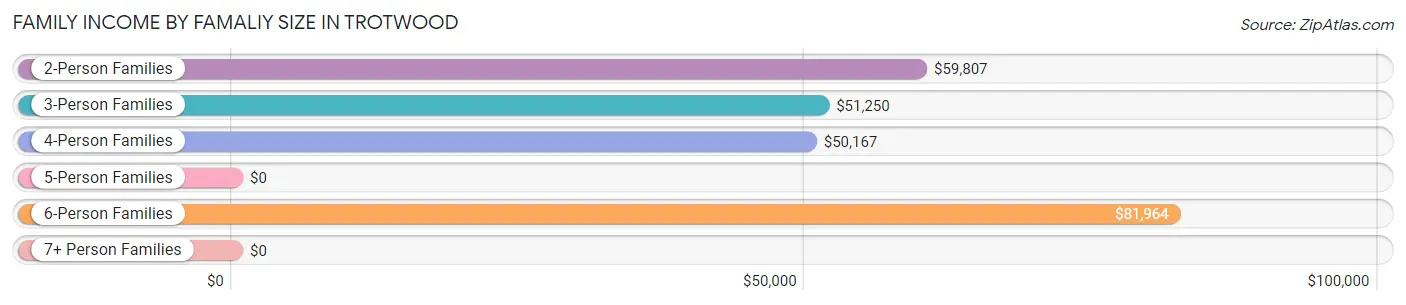
| Income Bracket | # Families | Median Income |
| 2-Person Families | 2,931 (52.6%) | $59,807 |
| 3-Person Families | 1,514 (27.2%) | $51,250 |
| 4-Person Families | 698 (12.5%) | $50,167 |
| 5-Person Families | 185 (3.3%) | $0 |
| 6-Person Families | 179 (3.2%) | $81,964 |
| 7+ Person Families | 64 (1.1%) | $0 |
| Total | 5,571 (100.0%) | $58,540 |
Family Income by Number of Earners in Trotwood
The median family income in Trotwood is $58,540, with families comprising 3+ earners (542) having the highest median family income of $113,095, while families with 1 earner (1,906) have the lowest median family income of $39,736, accounting for 9.7% and 34.2% of families, respectively.
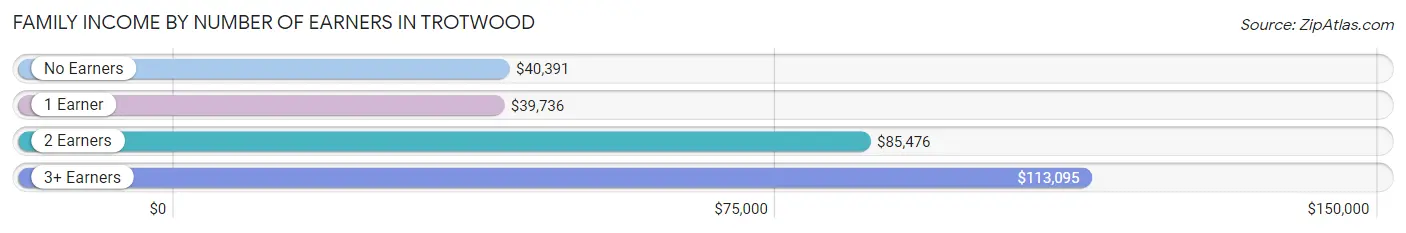
| Number of Earners | # Families | Median Income |
| No Earners | 903 (16.2%) | $40,391 |
| 1 Earner | 1,906 (34.2%) | $39,736 |
| 2 Earners | 2,220 (39.9%) | $85,476 |
| 3+ Earners | 542 (9.7%) | $113,095 |
| Total | 5,571 (100.0%) | $58,540 |
Household Income in Trotwood
Household Income Brackets in Trotwood
With 1,842 households falling in the category, the $35,000 to $49,999 income range is the most frequent in Trotwood, accounting for 18.0% of all households. In contrast, only 174 households (1.7%) fall into the $200,000+ income bracket, making it the least populous group.
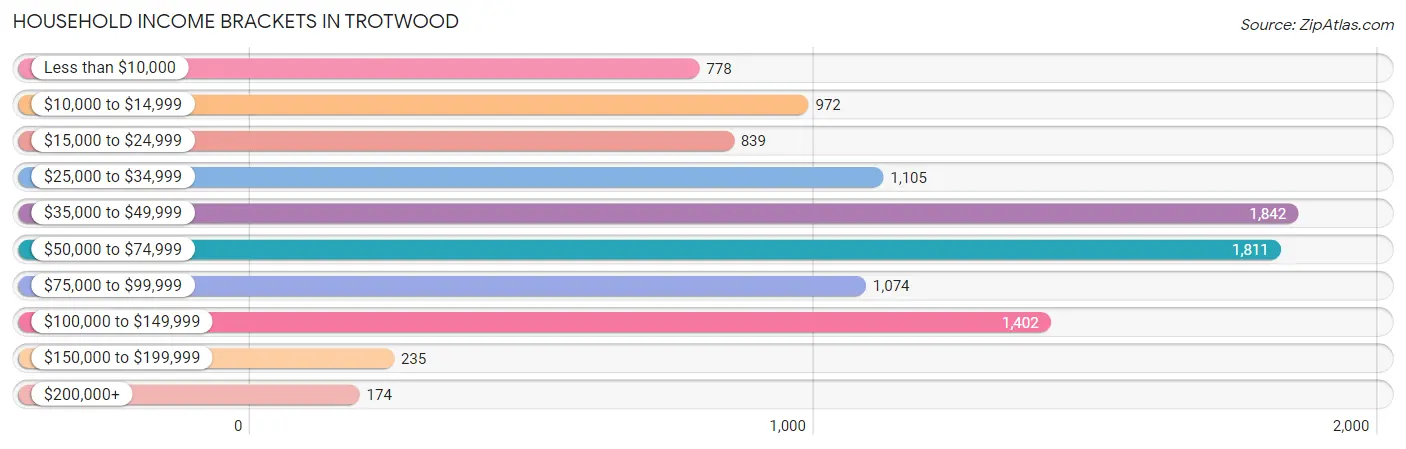
| Income Bracket | # Households | % Households |
| Less than $10,000 | 778 | 7.6% |
| $10,000 to $14,999 | 972 | 9.5% |
| $15,000 to $24,999 | 839 | 8.2% |
| $25,000 to $34,999 | 1,105 | 10.8% |
| $35,000 to $49,999 | 1,842 | 18.0% |
| $50,000 to $74,999 | 1,811 | 17.7% |
| $75,000 to $99,999 | 1,074 | 10.5% |
| $100,000 to $149,999 | 1,402 | 13.7% |
| $150,000 to $199,999 | 235 | 2.3% |
| $200,000+ | 174 | 1.7% |
Household Income by Householder Age in Trotwood
The median household income in Trotwood is $46,442, with the highest median household income of $59,724 found in the 45 to 64 years age bracket for the primary householder. A total of 3,902 households (38.1%) fall into this category. Meanwhile, the 15 to 24 years age bracket for the primary householder has the lowest median household income of $31,694, with 356 households (3.5%) in this group.
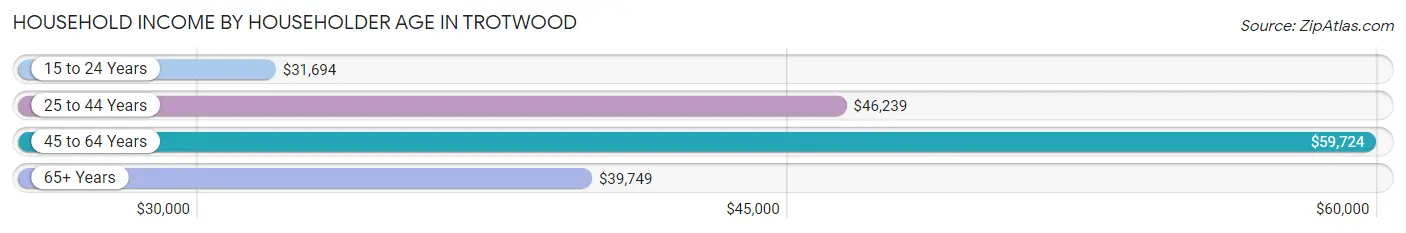
| Income Bracket | # Households | Median Income |
| 15 to 24 Years | 356 (3.5%) | $31,694 |
| 25 to 44 Years | 2,508 (24.5%) | $46,239 |
| 45 to 64 Years | 3,902 (38.1%) | $59,724 |
| 65+ Years | 3,467 (33.9%) | $39,749 |
| Total | 10,233 (100.0%) | $46,442 |
Poverty in Trotwood
Income Below Poverty by Sex and Age in Trotwood
With 21.6% poverty level for males and 25.4% for females among the residents of Trotwood, 5 year old males and 5 year old females are the most vulnerable to poverty, with 48 males (71.6%) and 214 females (74.6%) in their respective age groups living below the poverty level.
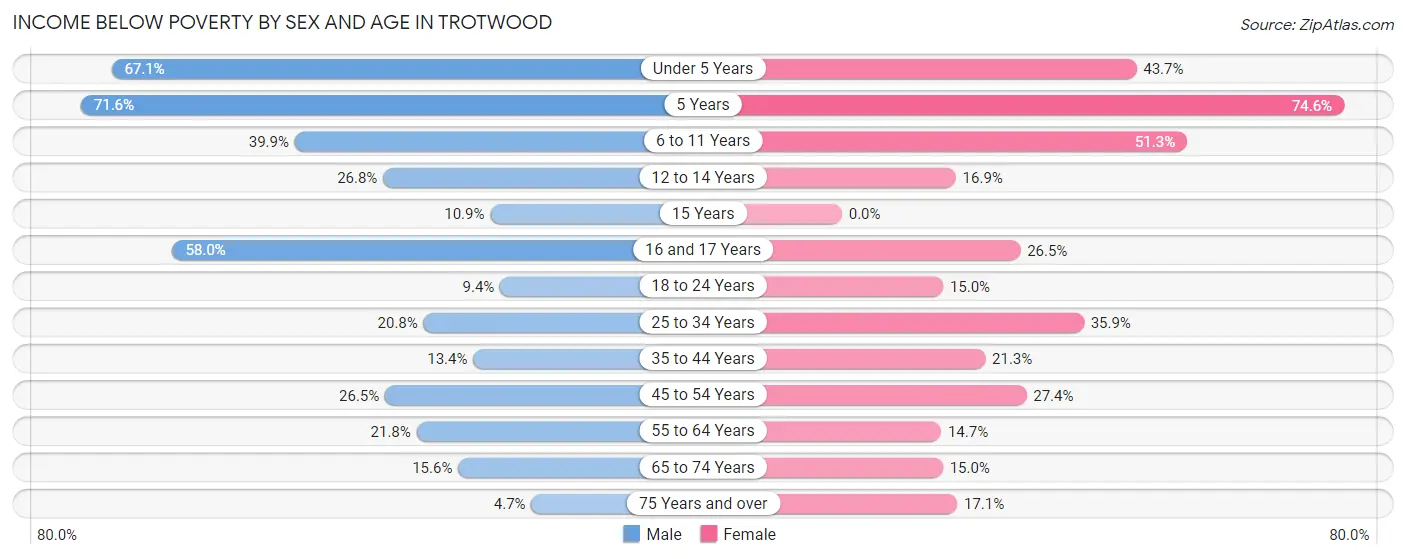
| Age Bracket | Male | Female |
| Under 5 Years | 155 (67.1%) | 349 (43.7%) |
| 5 Years | 48 (71.6%) | 214 (74.6%) |
| 6 to 11 Years | 276 (39.9%) | 473 (51.2%) |
| 12 to 14 Years | 84 (26.8%) | 92 (16.9%) |
| 15 Years | 14 (10.8%) | 0 (0.0%) |
| 16 and 17 Years | 148 (58.0%) | 98 (26.5%) |
| 18 to 24 Years | 90 (9.4%) | 140 (15.0%) |
| 25 to 34 Years | 216 (20.7%) | 435 (35.9%) |
| 35 to 44 Years | 190 (13.4%) | 310 (21.3%) |
| 45 to 54 Years | 374 (26.5%) | 432 (27.4%) |
| 55 to 64 Years | 275 (21.8%) | 272 (14.7%) |
| 65 to 74 Years | 168 (15.6%) | 237 (15.0%) |
| 75 Years and over | 36 (4.7%) | 232 (17.1%) |
| Total | 2,074 (21.6%) | 3,284 (25.4%) |
Income Above Poverty by Sex and Age in Trotwood
According to the poverty statistics in Trotwood, males aged 75 years and over and females aged 15 years are the age groups that are most secure financially, with 95.3% of males and 100.0% of females in these age groups living above the poverty line.
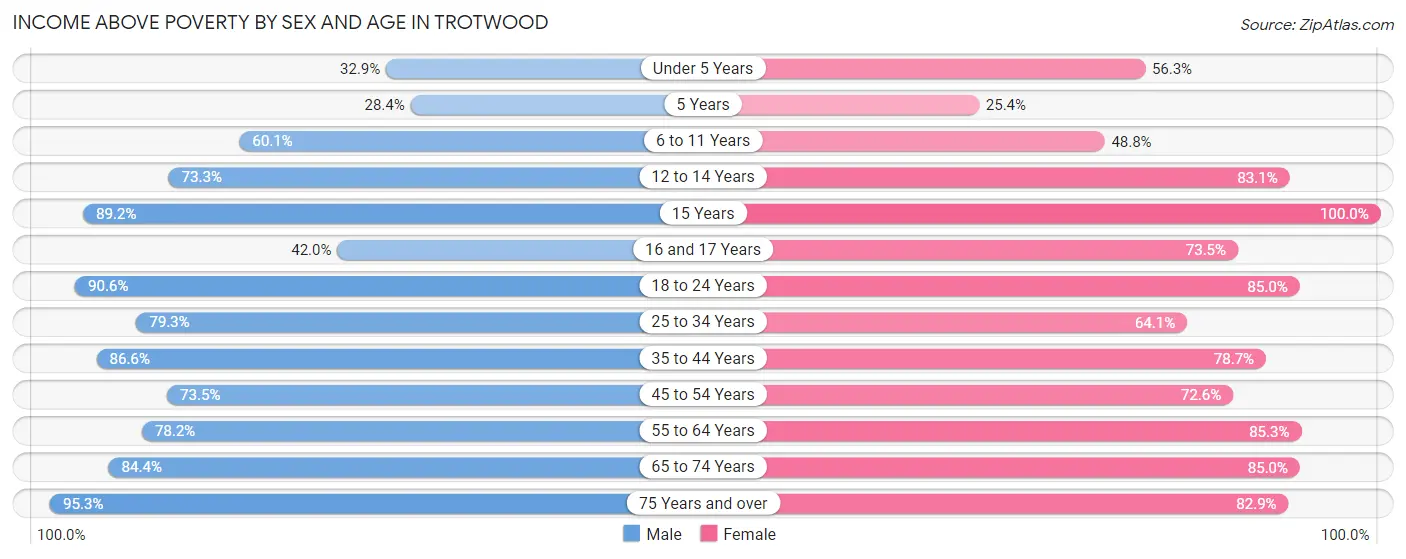
| Age Bracket | Male | Female |
| Under 5 Years | 76 (32.9%) | 449 (56.3%) |
| 5 Years | 19 (28.4%) | 73 (25.4%) |
| 6 to 11 Years | 416 (60.1%) | 450 (48.7%) |
| 12 to 14 Years | 230 (73.3%) | 452 (83.1%) |
| 15 Years | 115 (89.1%) | 45 (100.0%) |
| 16 and 17 Years | 107 (42.0%) | 272 (73.5%) |
| 18 to 24 Years | 869 (90.6%) | 792 (85.0%) |
| 25 to 34 Years | 825 (79.2%) | 776 (64.1%) |
| 35 to 44 Years | 1,231 (86.6%) | 1,147 (78.7%) |
| 45 to 54 Years | 1,039 (73.5%) | 1,145 (72.6%) |
| 55 to 64 Years | 987 (78.2%) | 1,574 (85.3%) |
| 65 to 74 Years | 908 (84.4%) | 1,345 (85.0%) |
| 75 Years and over | 724 (95.3%) | 1,124 (82.9%) |
| Total | 7,546 (78.4%) | 9,644 (74.6%) |
Income Below Poverty Among Married-Couple Families in Trotwood
The poverty statistics for married-couple families in Trotwood show that 10.1% or 280 of the total 2,775 families live below the poverty line. Families with 5 or more children have the highest poverty rate of 87.5%, comprising of 28 families. On the other hand, families with 1 or 2 children have the lowest poverty rate of 8.1%, which includes 45 families.
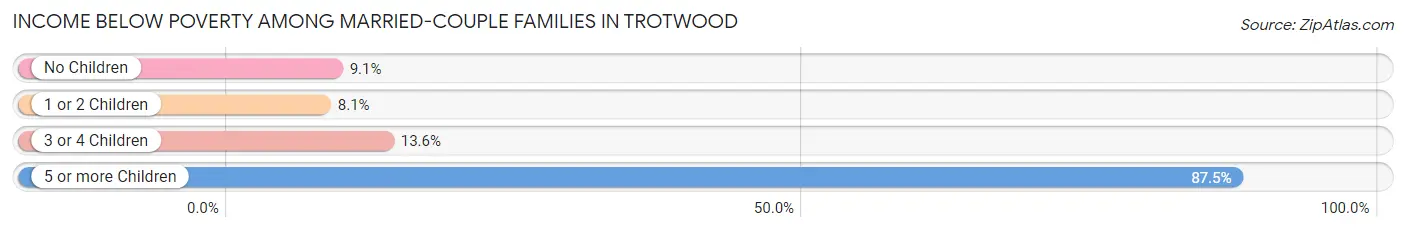
| Children | Above Poverty | Below Poverty |
| No Children | 1,826 (90.9%) | 183 (9.1%) |
| 1 or 2 Children | 512 (91.9%) | 45 (8.1%) |
| 3 or 4 Children | 153 (86.4%) | 24 (13.6%) |
| 5 or more Children | 4 (12.5%) | 28 (87.5%) |
| Total | 2,495 (89.9%) | 280 (10.1%) |
Income Below Poverty Among Single-Parent Households in Trotwood
According to the poverty data in Trotwood, 9.0% or 45 single-father households and 32.2% or 738 single-mother households are living below the poverty line. Among single-father households, those with 3 or 4 children have the highest poverty rate, with 10 households (40.0%) experiencing poverty. Likewise, among single-mother households, those with 5 or more children have the highest poverty rate, with 36 households (100.0%) falling below the poverty line.
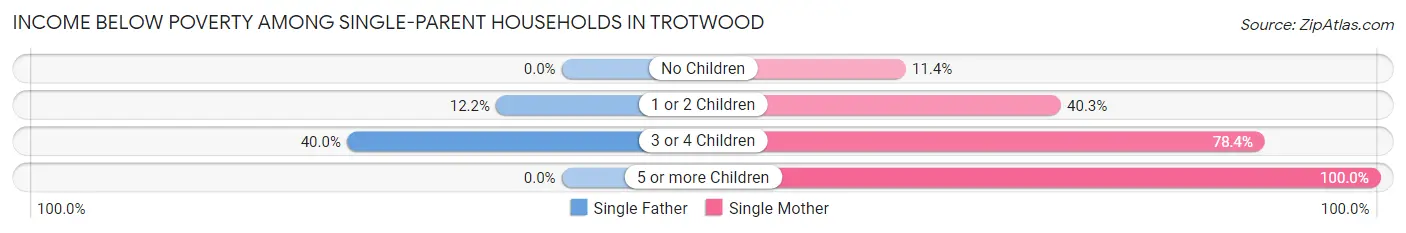
| Children | Single Father | Single Mother |
| No Children | 0 (0.0%) | 123 (11.4%) |
| 1 or 2 Children | 35 (12.2%) | 368 (40.3%) |
| 3 or 4 Children | 10 (40.0%) | 211 (78.4%) |
| 5 or more Children | 0 (0.0%) | 36 (100.0%) |
| Total | 45 (9.0%) | 738 (32.2%) |
Income Below Poverty Among Married-Couple vs Single-Parent Households in Trotwood
The poverty data for Trotwood shows that 280 of the married-couple family households (10.1%) and 783 of the single-parent households (28.0%) are living below the poverty level. Within the married-couple family households, those with 5 or more children have the highest poverty rate, with 28 households (87.5%) falling below the poverty line. Among the single-parent households, those with 5 or more children have the highest poverty rate, with 36 household (100.0%) living below poverty.
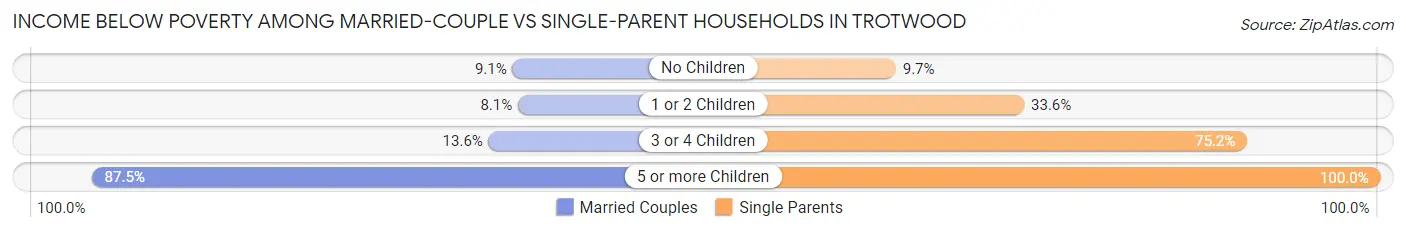
| Children | Married-Couple Families | Single-Parent Households |
| No Children | 183 (9.1%) | 123 (9.7%) |
| 1 or 2 Children | 45 (8.1%) | 403 (33.6%) |
| 3 or 4 Children | 24 (13.6%) | 221 (75.2%) |
| 5 or more Children | 28 (87.5%) | 36 (100.0%) |
| Total | 280 (10.1%) | 783 (28.0%) |
Race in Trotwood
The most populous races in Trotwood are Black / African American (15,022 | 65.0%), White / Caucasian (6,476 | 28.0%), and Two or more Races (1,403 | 6.1%).
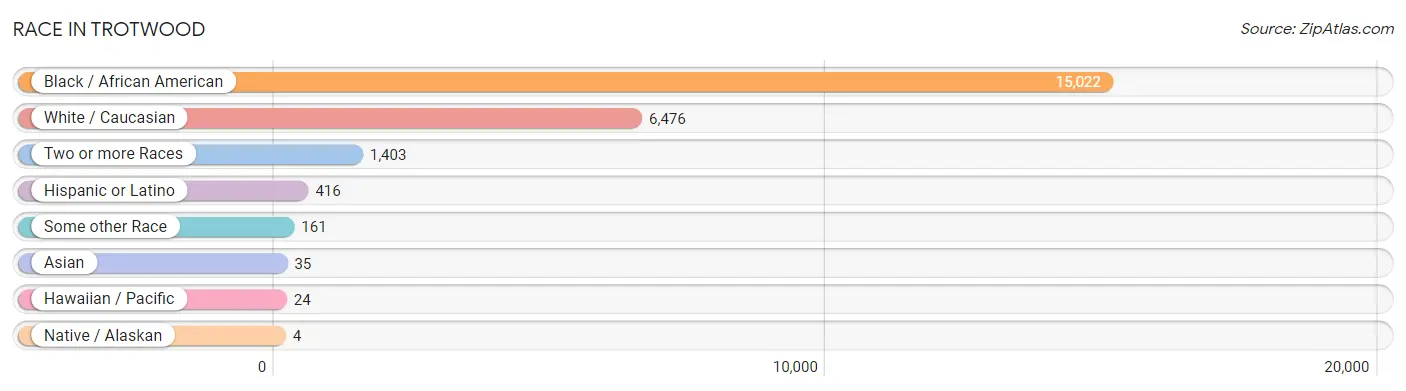
| Race | # Population | % Population |
| Asian | 35 | 0.2% |
| Black / African American | 15,022 | 65.0% |
| Hawaiian / Pacific | 24 | 0.1% |
| Hispanic or Latino | 416 | 1.8% |
| Native / Alaskan | 4 | 0.0% |
| White / Caucasian | 6,476 | 28.0% |
| Two or more Races | 1,403 | 6.1% |
| Some other Race | 161 | 0.7% |
| Total | 23,125 | 100.0% |
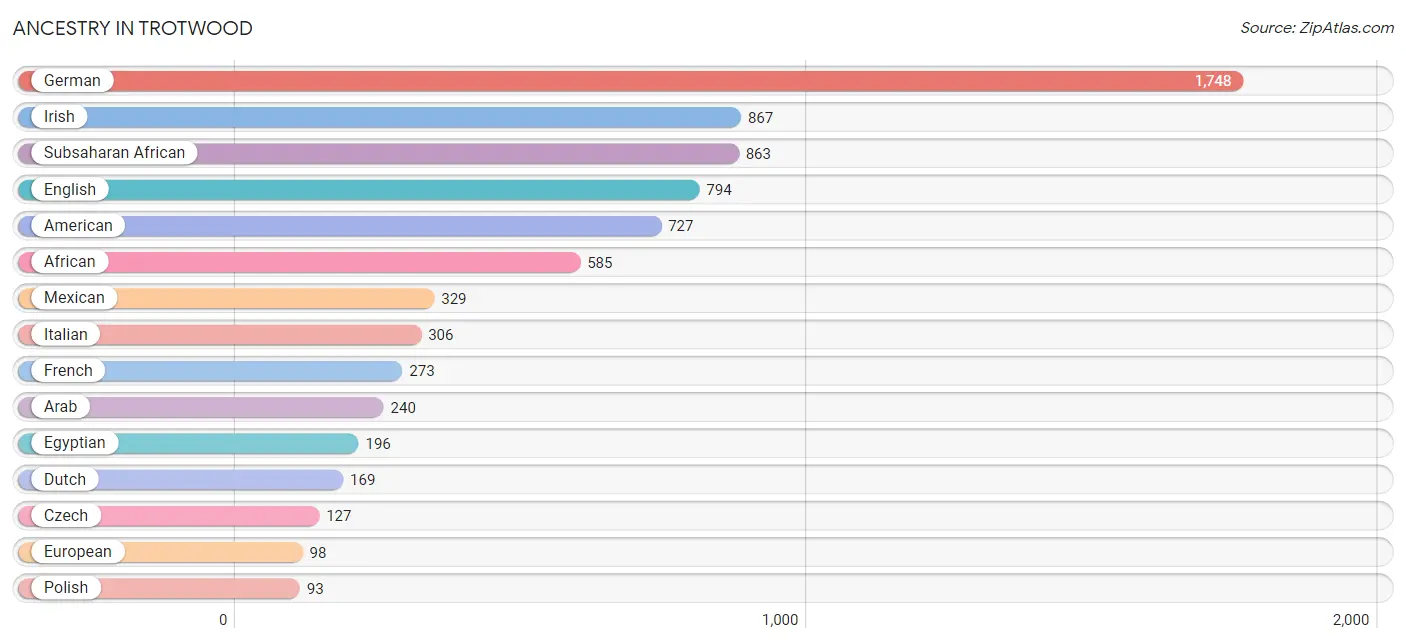
Ancestry in Trotwood
The most populous ancestries reported in Trotwood are German (1,748 | 7.6%), Irish (867 | 3.7%), Subsaharan African (863 | 3.7%), English (794 | 3.4%), and American (727 | 3.1%), together accounting for 21.6% of all Trotwood residents.
| Ancestry | # Population | % Population |
| African | 585 | 2.5% |
| American | 727 | 3.1% |
| Arab | 240 | 1.0% |
| Blackfeet | 9 | 0.0% |
| British | 28 | 0.1% |
| Cherokee | 34 | 0.2% |
| Colombian | 2 | 0.0% |
| Czech | 127 | 0.5% |
| Czechoslovakian | 10 | 0.0% |
| Dutch | 169 | 0.7% |
| Eastern European | 30 | 0.1% |
| Ecuadorian | 6 | 0.0% |
| Egyptian | 196 | 0.9% |
| English | 794 | 3.4% |
| Ethiopian | 49 | 0.2% |
| European | 98 | 0.4% |
| French | 273 | 1.2% |
| German | 1,748 | 7.6% |
| Greek | 16 | 0.1% |
| Guamanian / Chamorro | 4 | 0.0% |
| Hungarian | 14 | 0.1% |
| Indian (Asian) | 16 | 0.1% |
| Irish | 867 | 3.7% |
| Italian | 306 | 1.3% |
| Jamaican | 23 | 0.1% |
| Korean | 41 | 0.2% |
| Lebanese | 20 | 0.1% |
| Liberian | 9 | 0.0% |
| Mexican | 329 | 1.4% |
| Native Hawaiian | 16 | 0.1% |
| Nigerian | 15 | 0.1% |
| Polish | 93 | 0.4% |
| Puerto Rican | 29 | 0.1% |
| Romanian | 42 | 0.2% |
| Russian | 3 | 0.0% |
| Scandinavian | 21 | 0.1% |
| Scotch-Irish | 79 | 0.3% |
| Scottish | 74 | 0.3% |
| Sioux | 4 | 0.0% |
| Slavic | 3 | 0.0% |
| Slovak | 11 | 0.1% |
| South American | 8 | 0.0% |
| South American Indian | 2 | 0.0% |
| Spaniard | 27 | 0.1% |
| Spanish | 16 | 0.1% |
| Subsaharan African | 863 | 3.7% |
| Swedish | 18 | 0.1% |
| Swiss | 16 | 0.1% |
| Thai | 6 | 0.0% |
| Turkish | 8 | 0.0% |
| Ukrainian | 44 | 0.2% |
| Welsh | 80 | 0.4% | View All 52 Rows |
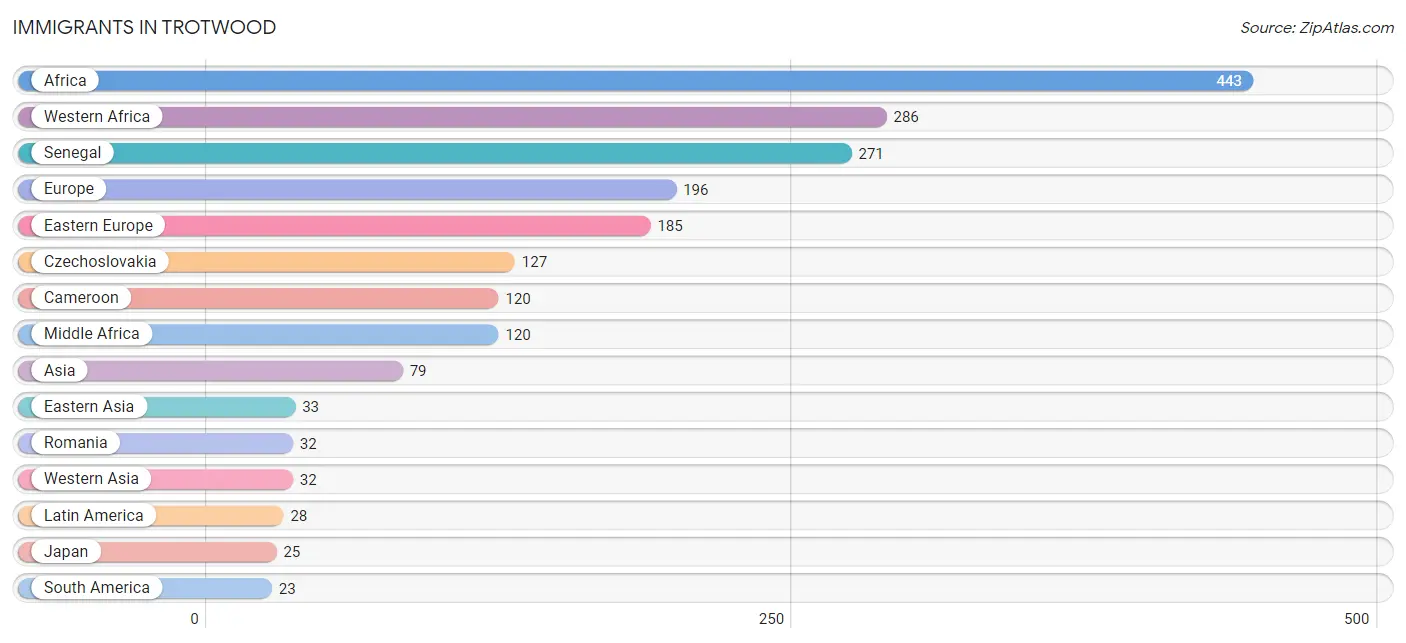
Immigrants in Trotwood
The most numerous immigrant groups reported in Trotwood came from Africa (443 | 1.9%), Western Africa (286 | 1.2%), Senegal (271 | 1.2%), Europe (196 | 0.9%), and Eastern Europe (185 | 0.8%), together accounting for 6.0% of all Trotwood residents.
| Immigration Origin | # Population | % Population |
| Africa | 443 | 1.9% |
| Asia | 79 | 0.3% |
| Cameroon | 120 | 0.5% |
| Caribbean | 5 | 0.0% |
| China | 8 | 0.0% |
| Colombia | 2 | 0.0% |
| Czechoslovakia | 127 | 0.5% |
| Eastern Africa | 20 | 0.1% |
| Eastern Asia | 33 | 0.1% |
| Eastern Europe | 185 | 0.8% |
| Ecuador | 3 | 0.0% |
| Ethiopia | 20 | 0.1% |
| Europe | 196 | 0.9% |
| Fiji | 6 | 0.0% |
| Germany | 8 | 0.0% |
| Guyana | 18 | 0.1% |
| Jamaica | 5 | 0.0% |
| Japan | 25 | 0.1% |
| Latin America | 28 | 0.1% |
| Liberia | 9 | 0.0% |
| Middle Africa | 120 | 0.5% |
| Nigeria | 6 | 0.0% |
| Northern Europe | 3 | 0.0% |
| Oceania | 13 | 0.1% |
| Philippines | 14 | 0.1% |
| Poland | 18 | 0.1% |
| Romania | 32 | 0.1% |
| Senegal | 271 | 1.2% |
| South America | 23 | 0.1% |
| South Eastern Asia | 14 | 0.1% |
| Turkey | 8 | 0.0% |
| Ukraine | 8 | 0.0% |
| Western Africa | 286 | 1.2% |
| Western Asia | 32 | 0.1% |
| Western Europe | 8 | 0.0% | View All 35 Rows |
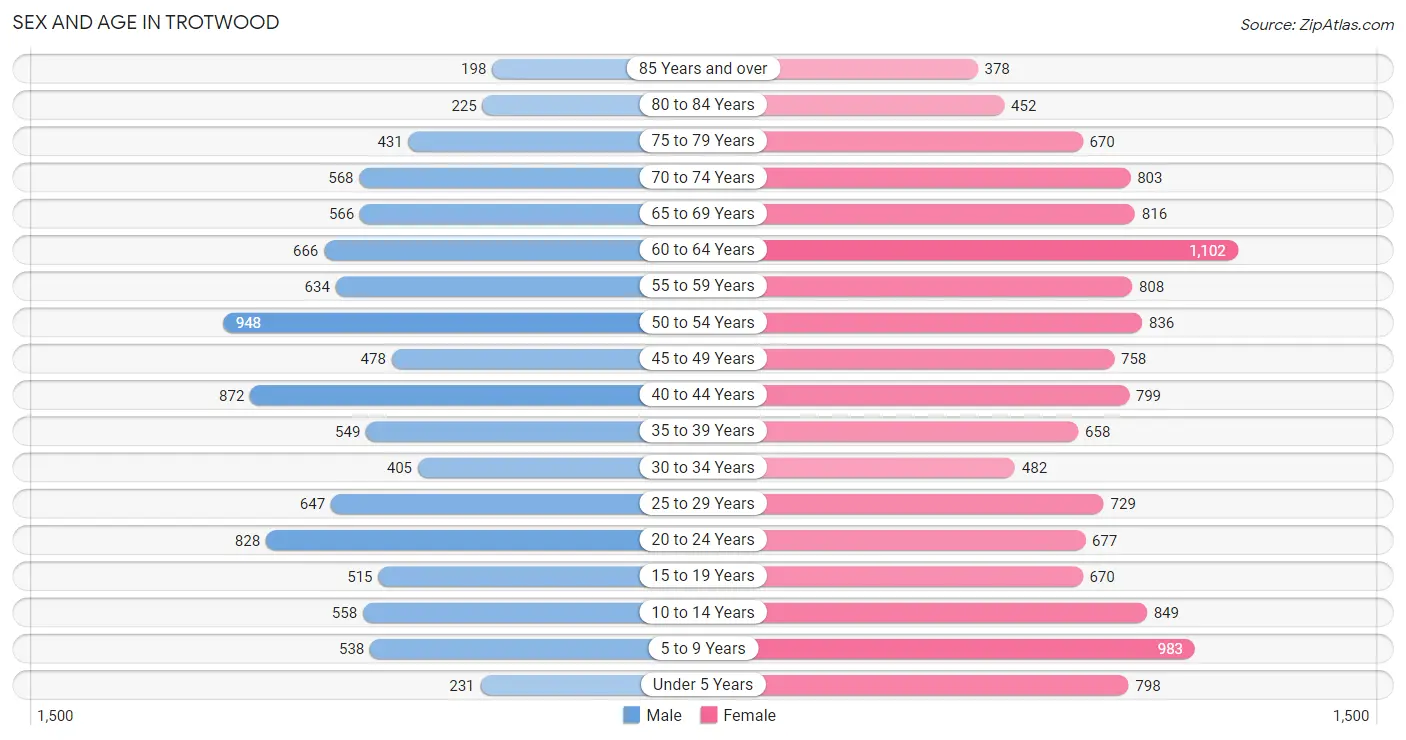
Sex and Age in Trotwood
Sex and Age in Trotwood
The most populous age groups in Trotwood are 50 to 54 Years (948 | 9.6%) for men and 60 to 64 Years (1,102 | 8.3%) for women.
| Age Bracket | Male | Female |
| Under 5 Years | 231 (2.3%) | 798 (6.0%) |
| 5 to 9 Years | 538 (5.5%) | 983 (7.4%) |
| 10 to 14 Years | 558 (5.7%) | 849 (6.4%) |
| 15 to 19 Years | 515 (5.2%) | 670 (5.1%) |
| 20 to 24 Years | 828 (8.4%) | 677 (5.1%) |
| 25 to 29 Years | 647 (6.6%) | 729 (5.5%) |
| 30 to 34 Years | 405 (4.1%) | 482 (3.6%) |
| 35 to 39 Years | 549 (5.6%) | 658 (5.0%) |
| 40 to 44 Years | 872 (8.8%) | 799 (6.0%) |
| 45 to 49 Years | 478 (4.9%) | 758 (5.7%) |
| 50 to 54 Years | 948 (9.6%) | 836 (6.3%) |
| 55 to 59 Years | 634 (6.4%) | 808 (6.1%) |
| 60 to 64 Years | 666 (6.8%) | 1,102 (8.3%) |
| 65 to 69 Years | 566 (5.7%) | 816 (6.1%) |
| 70 to 74 Years | 568 (5.8%) | 803 (6.0%) |
| 75 to 79 Years | 431 (4.4%) | 670 (5.1%) |
| 80 to 84 Years | 225 (2.3%) | 452 (3.4%) |
| 85 Years and over | 198 (2.0%) | 378 (2.9%) |
| Total | 9,857 (100.0%) | 13,268 (100.0%) |
Families and Households in Trotwood
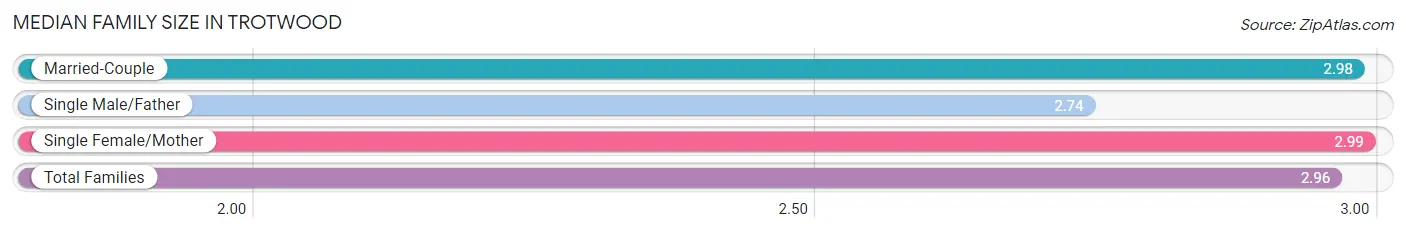
Median Family Size in Trotwood
The median family size in Trotwood is 2.96 persons per family, with single female/mother families (2,294 | 41.2%) accounting for the largest median family size of 2.99 persons per family. On the other hand, single male/father families (502 | 9.0%) represent the smallest median family size with 2.74 persons per family.
| Family Type | # Families | Family Size |
| Married-Couple | 2,775 (49.8%) | 2.98 |
| Single Male/Father | 502 (9.0%) | 2.74 |
| Single Female/Mother | 2,294 (41.2%) | 2.99 |
| Total Families | 5,571 (100.0%) | 2.96 |
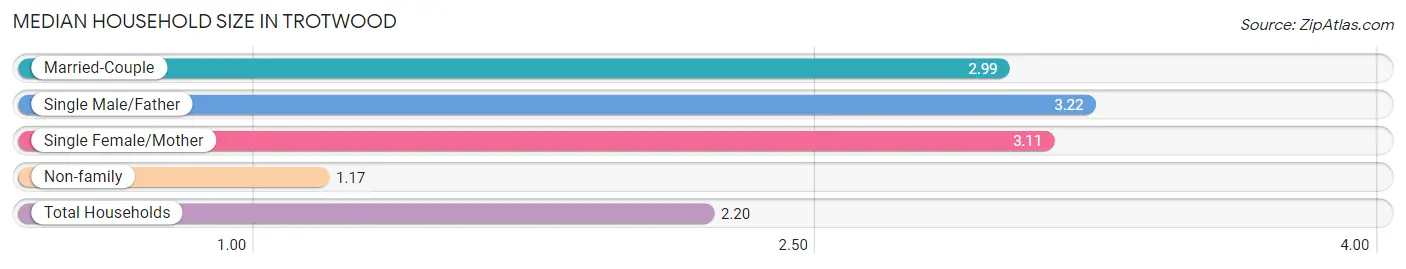
Median Household Size in Trotwood
The median household size in Trotwood is 2.20 persons per household, with single male/father households (502 | 4.9%) accounting for the largest median household size of 3.22 persons per household. non-family households (4,662 | 45.6%) represent the smallest median household size with 1.17 persons per household.
| Household Type | # Households | Household Size |
| Married-Couple | 2,775 (27.1%) | 2.99 |
| Single Male/Father | 502 (4.9%) | 3.22 |
| Single Female/Mother | 2,294 (22.4%) | 3.11 |
| Non-family | 4,662 (45.6%) | 1.17 |
| Total Households | 10,233 (100.0%) | 2.20 |
Household Size by Marriage Status in Trotwood
Out of a total of 10,233 households in Trotwood, 5,571 (54.4%) are family households, while 4,662 (45.6%) are nonfamily households. The most numerous type of family households are 2-person households, comprising 2,657, and the most common type of nonfamily households are 1-person households, comprising 4,115.
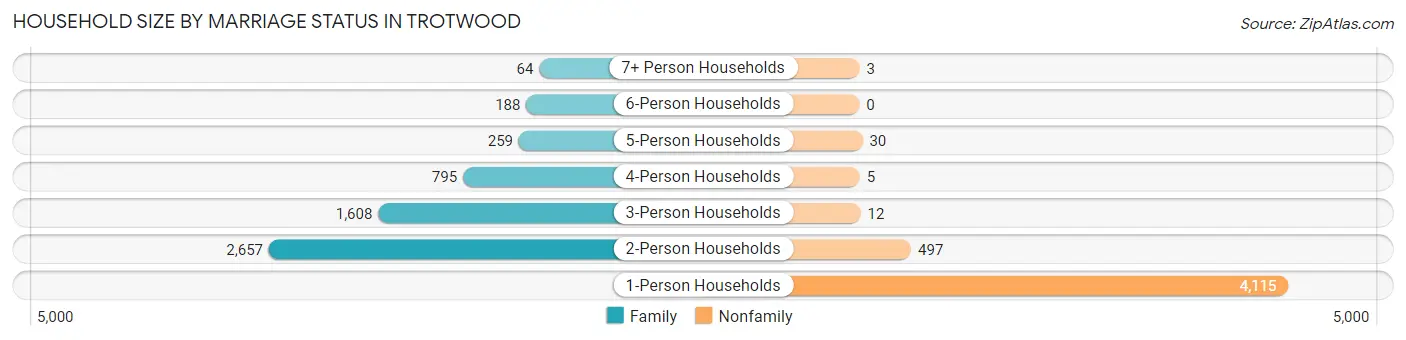
| Household Size | Family Households | Nonfamily Households |
| 1-Person Households | - | 4,115 (40.2%) |
| 2-Person Households | 2,657 (26.0%) | 497 (4.9%) |
| 3-Person Households | 1,608 (15.7%) | 12 (0.1%) |
| 4-Person Households | 795 (7.8%) | 5 (0.1%) |
| 5-Person Households | 259 (2.5%) | 30 (0.3%) |
| 6-Person Households | 188 (1.8%) | 0 (0.0%) |
| 7+ Person Households | 64 (0.6%) | 3 (0.0%) |
| Total | 5,571 (54.4%) | 4,662 (45.6%) |
Female Fertility in Trotwood
Fertility by Age in Trotwood
Average fertility rate in Trotwood is 34.0 births per 1,000 women. Women in the age bracket of 20 to 34 years have the highest fertility rate with 48.0 births per 1,000 women. Women in the age bracket of 20 to 34 years acount for 53.2% of all women with births.
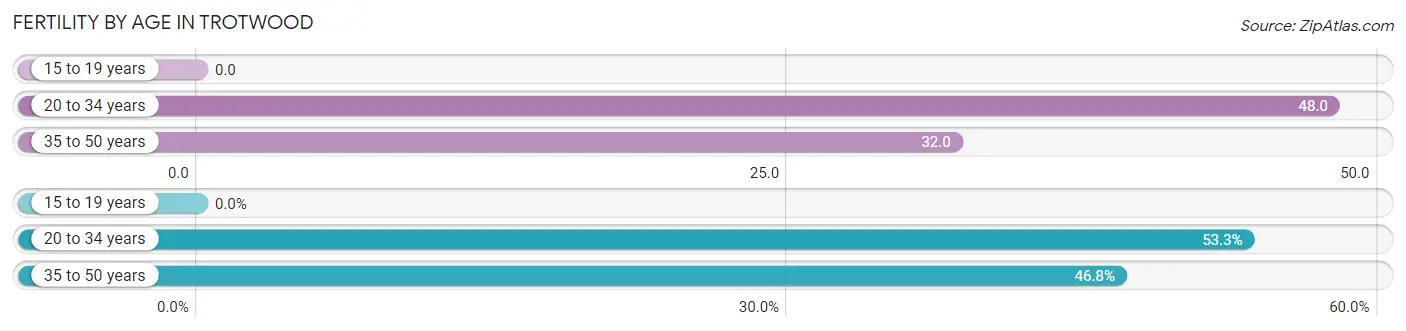
| Age Bracket | Women with Births | Births / 1,000 Women |
| 15 to 19 years | 0 (0.0%) | 0.0 |
| 20 to 34 years | 90 (53.2%) | 48.0 |
| 35 to 50 years | 79 (46.8%) | 32.0 |
| Total | 169 (100.0%) | 34.0 |
Fertility by Age by Marriage Status in Trotwood
69.8% of women with births (169) in Trotwood are married. The highest percentage of unmarried women with births falls into 20 to 34 years age bracket with 56.7% of them unmarried at the time of birth, while the lowest percentage of unmarried women with births belong to 35 to 50 years age bracket with 0.0% of them unmarried.
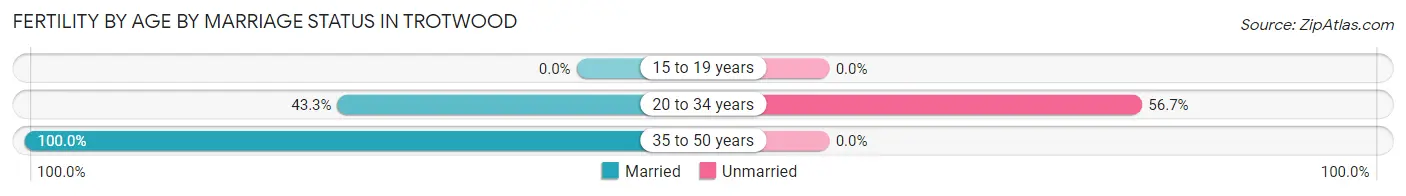
| Age Bracket | Married | Unmarried |
| 15 to 19 years | 0 (0.0%) | 0 (0.0%) |
| 20 to 34 years | 39 (43.3%) | 51 (56.7%) |
| 35 to 50 years | 79 (100.0%) | 0 (0.0%) |
| Total | 118 (69.8%) | 51 (30.2%) |
Fertility by Education in Trotwood
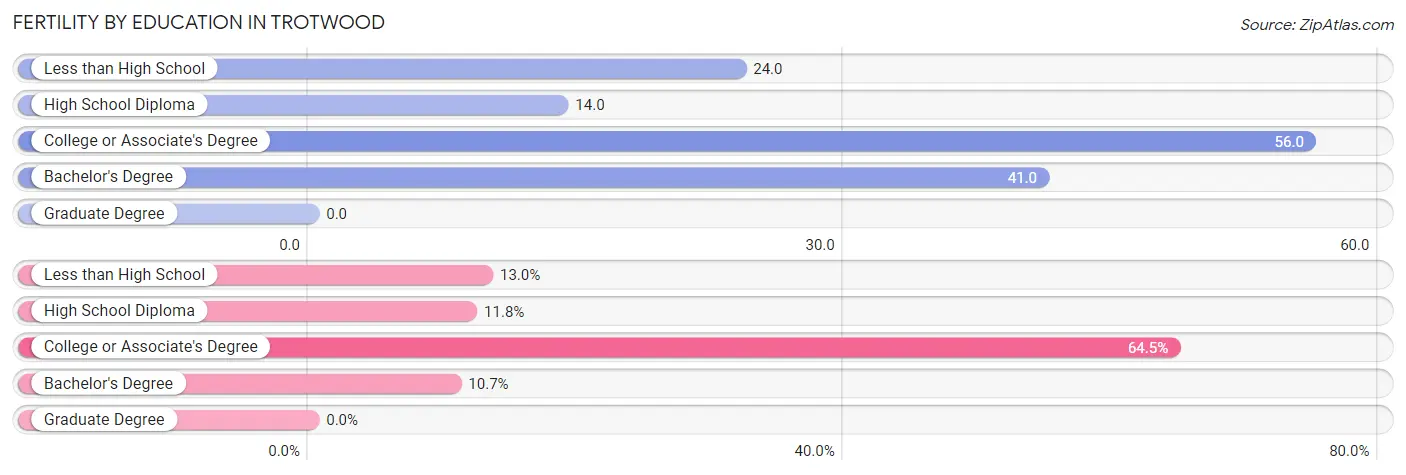
| Educational Attainment | Women with Births | Births / 1,000 Women |
| Less than High School | 22 (13.0%) | 24.0 |
| High School Diploma | 20 (11.8%) | 14.0 |
| College or Associate's Degree | 109 (64.5%) | 56.0 |
| Bachelor's Degree | 18 (10.6%) | 41.0 |
| Graduate Degree | 0 (0.0%) | 0.0 |
| Total | 169 (100.0%) | 34.0 |
Fertility by Education by Marriage Status in Trotwood
30.2% of women with births in Trotwood are unmarried. Women with the educational attainment of less than high school are most likely to be married with 100.0% of them married at childbirth, while women with the educational attainment of college or associate's degree are least likely to be married with 41.3% of them unmarried at childbirth.
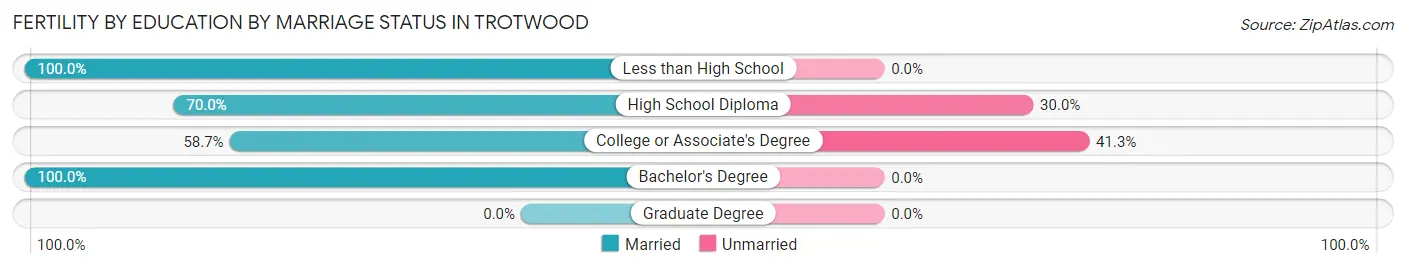
| Educational Attainment | Married | Unmarried |
| Less than High School | 22 (100.0%) | 0 (0.0%) |
| High School Diploma | 14 (70.0%) | 6 (30.0%) |
| College or Associate's Degree | 64 (58.7%) | 45 (41.3%) |
| Bachelor's Degree | 18 (100.0%) | 0 (0.0%) |
| Graduate Degree | 0 (0.0%) | 0 (0.0%) |
| Total | 118 (69.8%) | 51 (30.2%) |
Employment Characteristics in Trotwood
Employment by Class of Employer in Trotwood
Among the 9,491 employed individuals in Trotwood, private company employees (6,590 | 69.4%), local government employees (1,022 | 10.8%), and not-for-profit organizations (945 | 10.0%) make up the most common classes of employment.
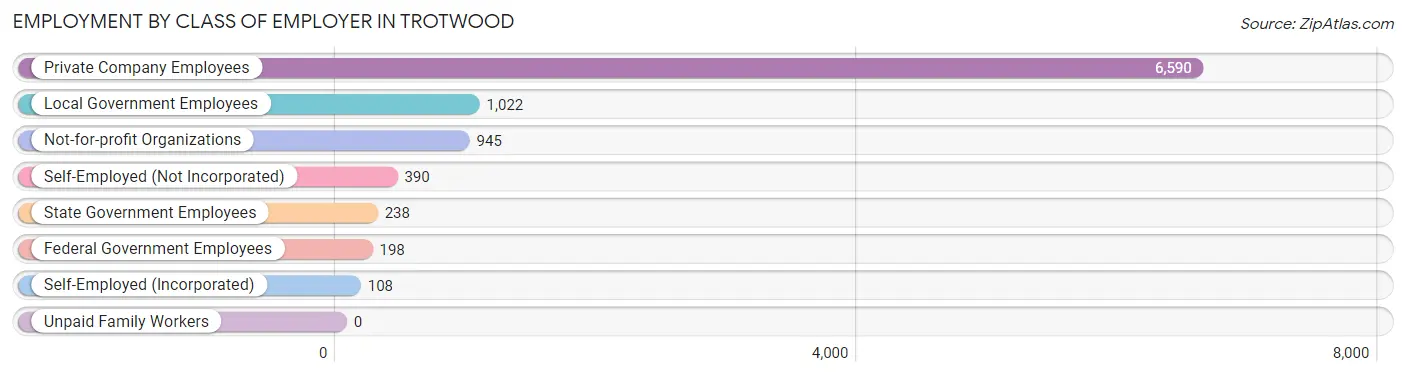
| Employer Class | # Employees | % Employees |
| Private Company Employees | 6,590 | 69.4% |
| Self-Employed (Incorporated) | 108 | 1.1% |
| Self-Employed (Not Incorporated) | 390 | 4.1% |
| Not-for-profit Organizations | 945 | 10.0% |
| Local Government Employees | 1,022 | 10.8% |
| State Government Employees | 238 | 2.5% |
| Federal Government Employees | 198 | 2.1% |
| Unpaid Family Workers | 0 | 0.0% |
| Total | 9,491 | 100.0% |
Employment Status by Age in Trotwood
According to the labor force statistics for Trotwood, out of the total population over 16 years of age (18,994), 57.9% or 10,998 individuals are in the labor force, with 8.4% or 924 of them unemployed. The age group with the highest labor force participation rate is 25 to 29 years, with 87.8% or 1,208 individuals in the labor force. Within the labor force, the 16 to 19 years age range has the highest percentage of unemployed individuals, with 46.4% or 162 of them being unemployed.
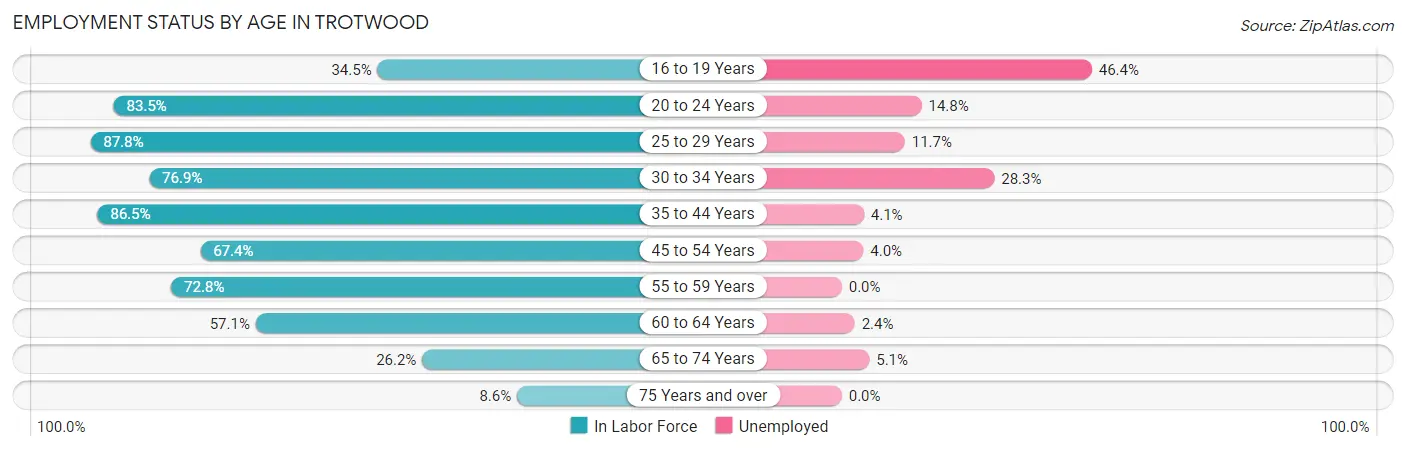
| Age Bracket | In Labor Force | Unemployed |
| 16 to 19 Years | 349 (34.5%) | 162 (46.4%) |
| 20 to 24 Years | 1,257 (83.5%) | 186 (14.8%) |
| 25 to 29 Years | 1,208 (87.8%) | 141 (11.7%) |
| 30 to 34 Years | 682 (76.9%) | 193 (28.3%) |
| 35 to 44 Years | 2,489 (86.5%) | 102 (4.1%) |
| 45 to 54 Years | 2,035 (67.4%) | 81 (4.0%) |
| 55 to 59 Years | 1,050 (72.8%) | 0 (0.0%) |
| 60 to 64 Years | 1,010 (57.1%) | 24 (2.4%) |
| 65 to 74 Years | 721 (26.2%) | 37 (5.1%) |
| 75 Years and over | 202 (8.6%) | 0 (0.0%) |
| Total | 10,998 (57.9%) | 924 (8.4%) |
Employment Status by Educational Attainment in Trotwood
According to labor force statistics for Trotwood, 74.5% of individuals (8,471) out of the total population between 25 and 64 years of age (11,371) are in the labor force, with 6.4% or 542 of them being unemployed. The group with the highest labor force participation rate are those with the educational attainment of college / associate degree, with 83.2% or 3,405 individuals in the labor force. Within the labor force, individuals with less than high school education have the highest percentage of unemployment, with 19.4% or 116 of them being unemployed.
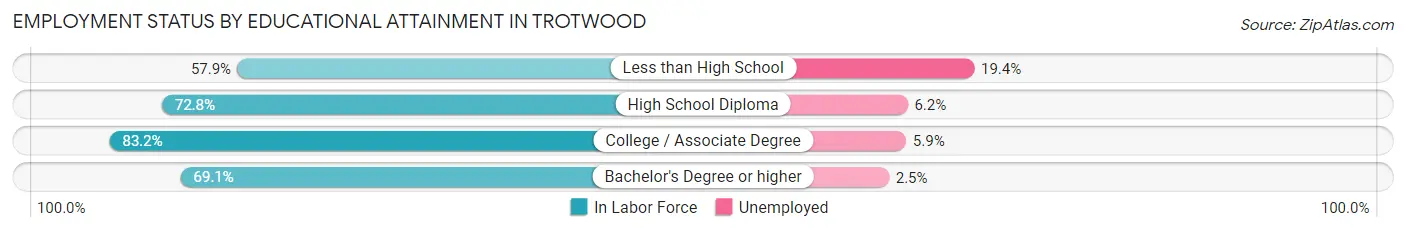
| Educational Attainment | In Labor Force | Unemployed |
| Less than High School | 598 (57.9%) | 200 (19.4%) |
| High School Diploma | 3,056 (72.8%) | 260 (6.2%) |
| College / Associate Degree | 3,405 (83.2%) | 241 (5.9%) |
| Bachelor's Degree or higher | 1,416 (69.1%) | 51 (2.5%) |
| Total | 8,471 (74.5%) | 728 (6.4%) |
Employment Occupations by Sex in Trotwood
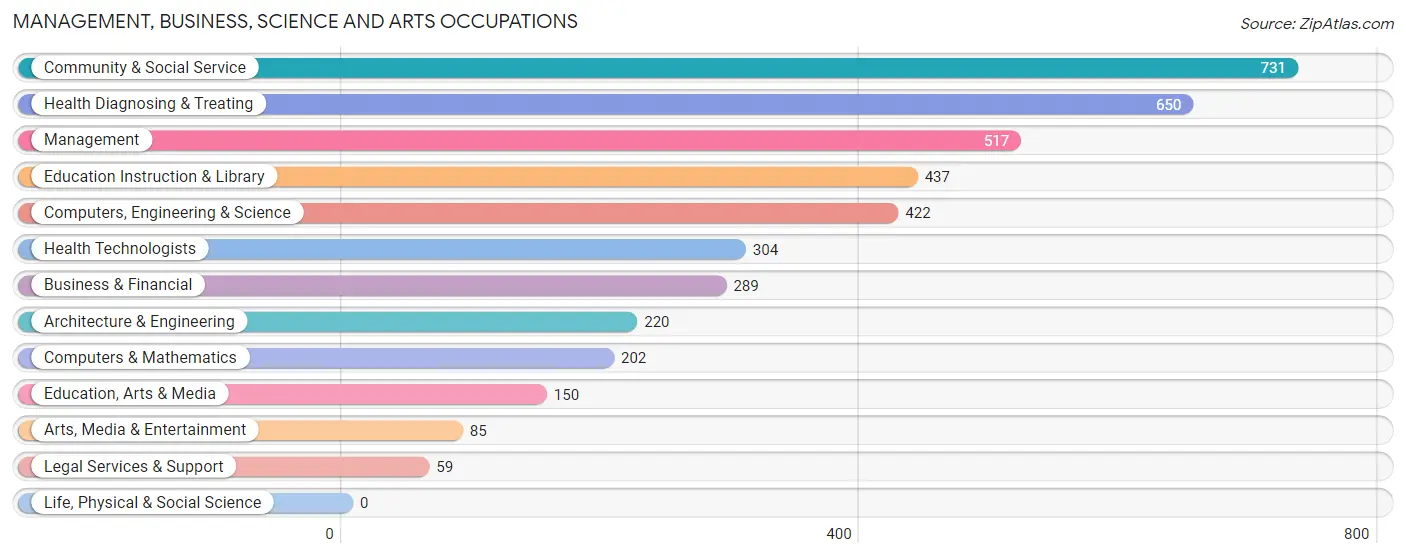
Management, Business, Science and Arts Occupations
The most common Management, Business, Science and Arts occupations in Trotwood are Community & Social Service (731 | 7.3%), Health Diagnosing & Treating (650 | 6.5%), Management (517 | 5.1%), Education Instruction & Library (437 | 4.3%), and Computers, Engineering & Science (422 | 4.2%).
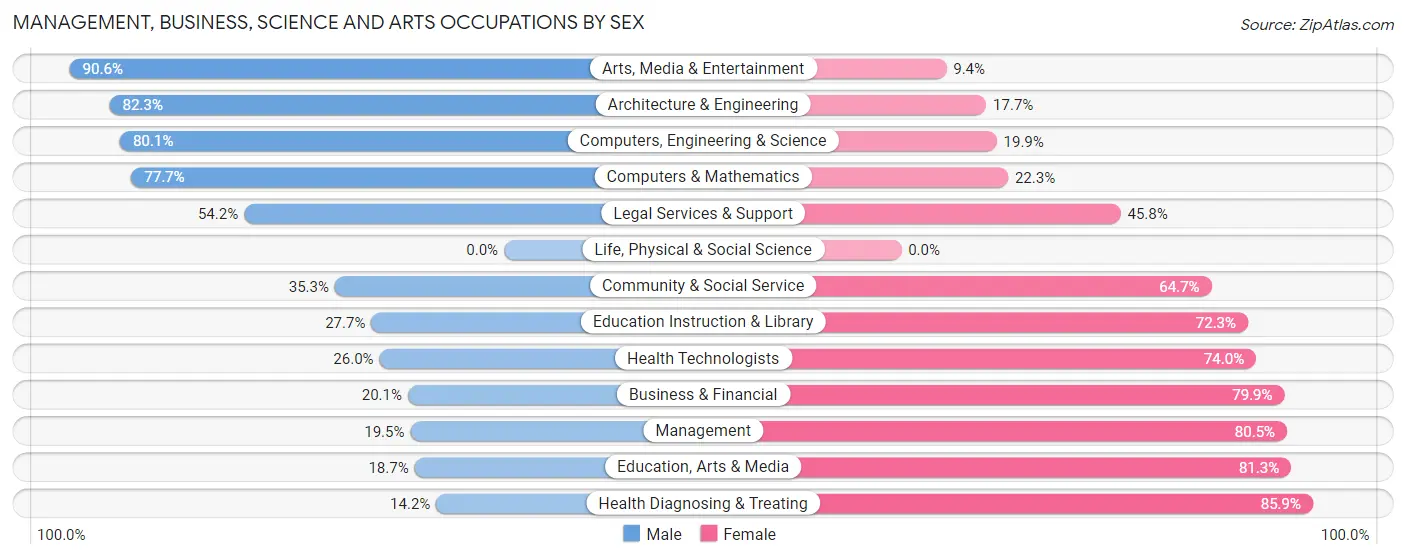
Management, Business, Science and Arts Occupations by Sex
Within the Management, Business, Science and Arts occupations in Trotwood, the most male-oriented occupations are Arts, Media & Entertainment (90.6%), Architecture & Engineering (82.3%), and Computers, Engineering & Science (80.1%), while the most female-oriented occupations are Health Diagnosing & Treating (85.9%), Education, Arts & Media (81.3%), and Management (80.5%).
| Occupation | Male | Female |
| Management | 101 (19.5%) | 416 (80.5%) |
| Business & Financial | 58 (20.1%) | 231 (79.9%) |
| Computers, Engineering & Science | 338 (80.1%) | 84 (19.9%) |
| Computers & Mathematics | 157 (77.7%) | 45 (22.3%) |
| Architecture & Engineering | 181 (82.3%) | 39 (17.7%) |
| Life, Physical & Social Science | 0 (0.0%) | 0 (0.0%) |
| Community & Social Service | 258 (35.3%) | 473 (64.7%) |
| Education, Arts & Media | 28 (18.7%) | 122 (81.3%) |
| Legal Services & Support | 32 (54.2%) | 27 (45.8%) |
| Education Instruction & Library | 121 (27.7%) | 316 (72.3%) |
| Arts, Media & Entertainment | 77 (90.6%) | 8 (9.4%) |
| Health Diagnosing & Treating | 92 (14.1%) | 558 (85.9%) |
| Health Technologists | 79 (26.0%) | 225 (74.0%) |
| Total (Category) | 847 (32.5%) | 1,762 (67.5%) |
| Total (Overall) | 4,532 (45.0%) | 5,530 (55.0%) |
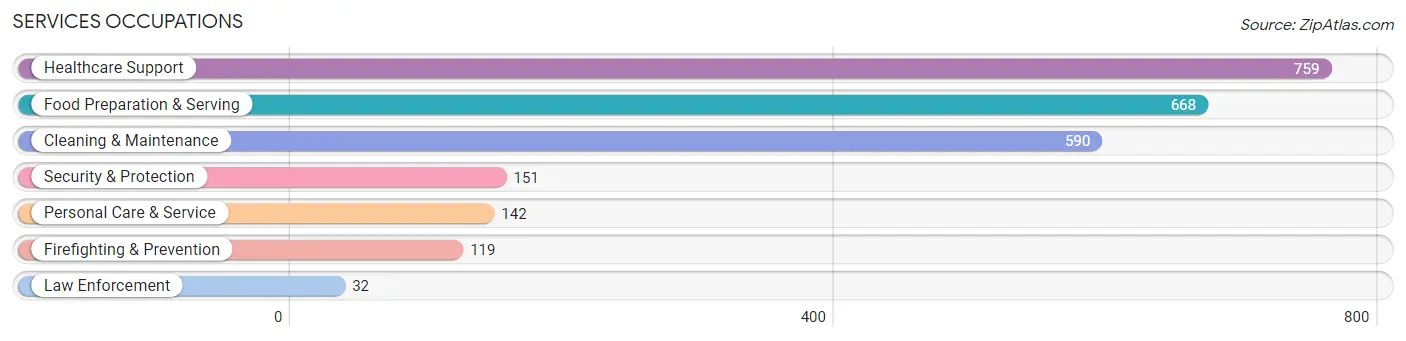
Services Occupations
The most common Services occupations in Trotwood are Healthcare Support (759 | 7.5%), Food Preparation & Serving (668 | 6.6%), Cleaning & Maintenance (590 | 5.9%), Security & Protection (151 | 1.5%), and Personal Care & Service (142 | 1.4%).
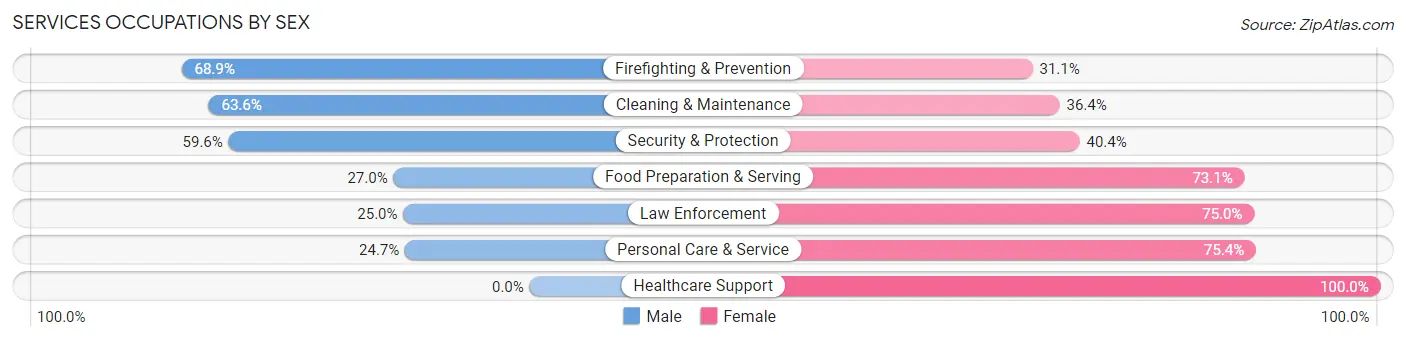
Services Occupations by Sex
Within the Services occupations in Trotwood, the most male-oriented occupations are Firefighting & Prevention (68.9%), Cleaning & Maintenance (63.6%), and Security & Protection (59.6%), while the most female-oriented occupations are Healthcare Support (100.0%), Personal Care & Service (75.3%), and Law Enforcement (75.0%).
| Occupation | Male | Female |
| Healthcare Support | 0 (0.0%) | 759 (100.0%) |
| Security & Protection | 90 (59.6%) | 61 (40.4%) |
| Firefighting & Prevention | 82 (68.9%) | 37 (31.1%) |
| Law Enforcement | 8 (25.0%) | 24 (75.0%) |
| Food Preparation & Serving | 180 (27.0%) | 488 (73.1%) |
| Cleaning & Maintenance | 375 (63.6%) | 215 (36.4%) |
| Personal Care & Service | 35 (24.6%) | 107 (75.3%) |
| Total (Category) | 680 (29.4%) | 1,630 (70.6%) |
| Total (Overall) | 4,532 (45.0%) | 5,530 (55.0%) |
Sales and Office Occupations
The most common Sales and Office occupations in Trotwood are Office & Administration (1,134 | 11.3%), and Sales & Related (604 | 6.0%).
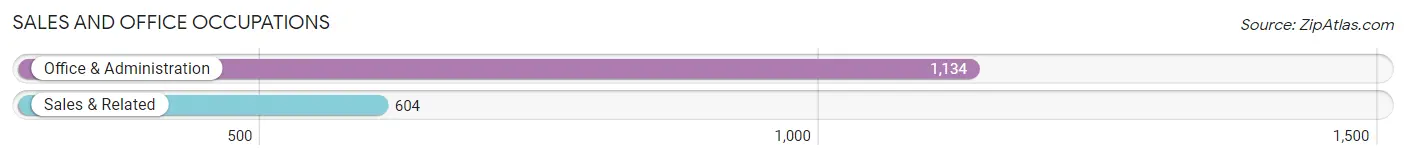
Sales and Office Occupations by Sex
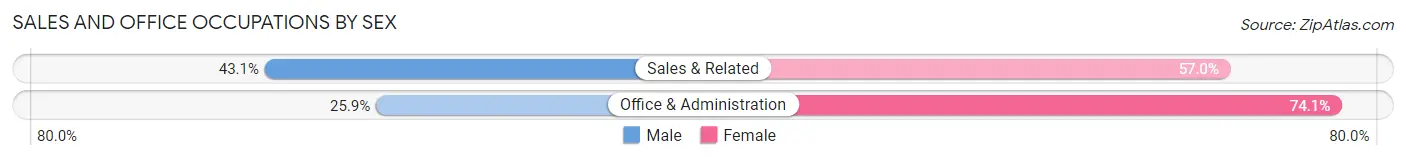
| Occupation | Male | Female |
| Sales & Related | 260 (43.0%) | 344 (57.0%) |
| Office & Administration | 294 (25.9%) | 840 (74.1%) |
| Total (Category) | 554 (31.9%) | 1,184 (68.1%) |
| Total (Overall) | 4,532 (45.0%) | 5,530 (55.0%) |
Natural Resources, Construction and Maintenance Occupations
The most common Natural Resources, Construction and Maintenance occupations in Trotwood are Construction & Extraction (379 | 3.8%), Installation, Maintenance & Repair (315 | 3.1%), and Farming, Fishing & Forestry (39 | 0.4%).
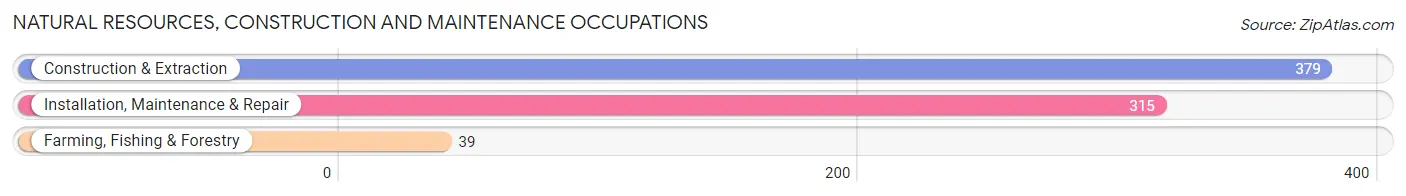
Natural Resources, Construction and Maintenance Occupations by Sex
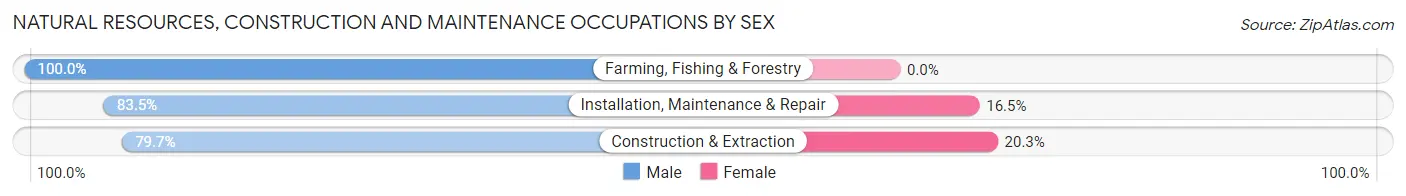
| Occupation | Male | Female |
| Farming, Fishing & Forestry | 39 (100.0%) | 0 (0.0%) |
| Construction & Extraction | 302 (79.7%) | 77 (20.3%) |
| Installation, Maintenance & Repair | 263 (83.5%) | 52 (16.5%) |
| Total (Category) | 604 (82.4%) | 129 (17.6%) |
| Total (Overall) | 4,532 (45.0%) | 5,530 (55.0%) |
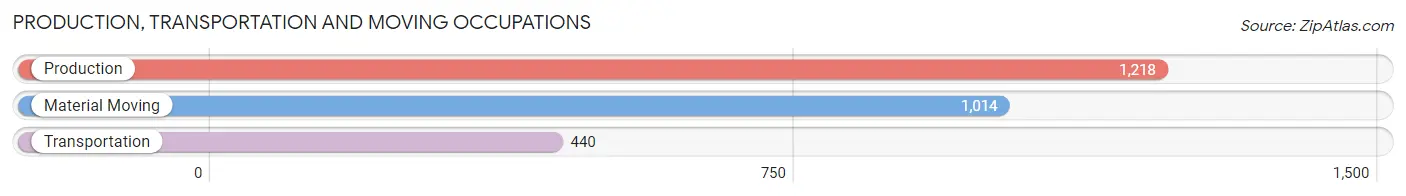
Production, Transportation and Moving Occupations
The most common Production, Transportation and Moving occupations in Trotwood are Production (1,218 | 12.1%), Material Moving (1,014 | 10.1%), and Transportation (440 | 4.4%).
Production, Transportation and Moving Occupations by Sex
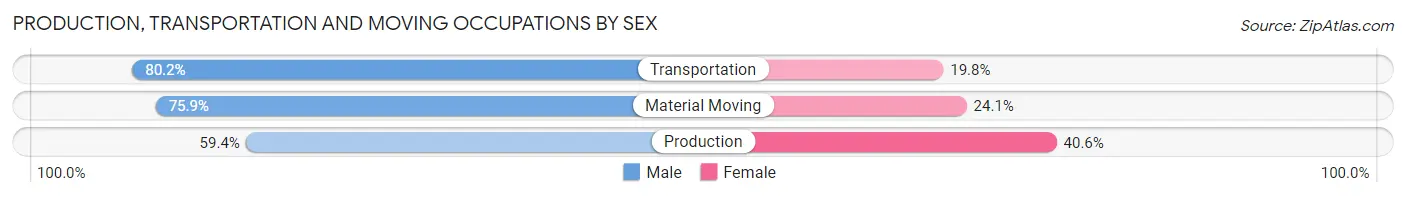
| Occupation | Male | Female |
| Production | 724 (59.4%) | 494 (40.6%) |
| Transportation | 353 (80.2%) | 87 (19.8%) |
| Material Moving | 770 (75.9%) | 244 (24.1%) |
| Total (Category) | 1,847 (69.1%) | 825 (30.9%) |
| Total (Overall) | 4,532 (45.0%) | 5,530 (55.0%) |
Employment Industries by Sex in Trotwood
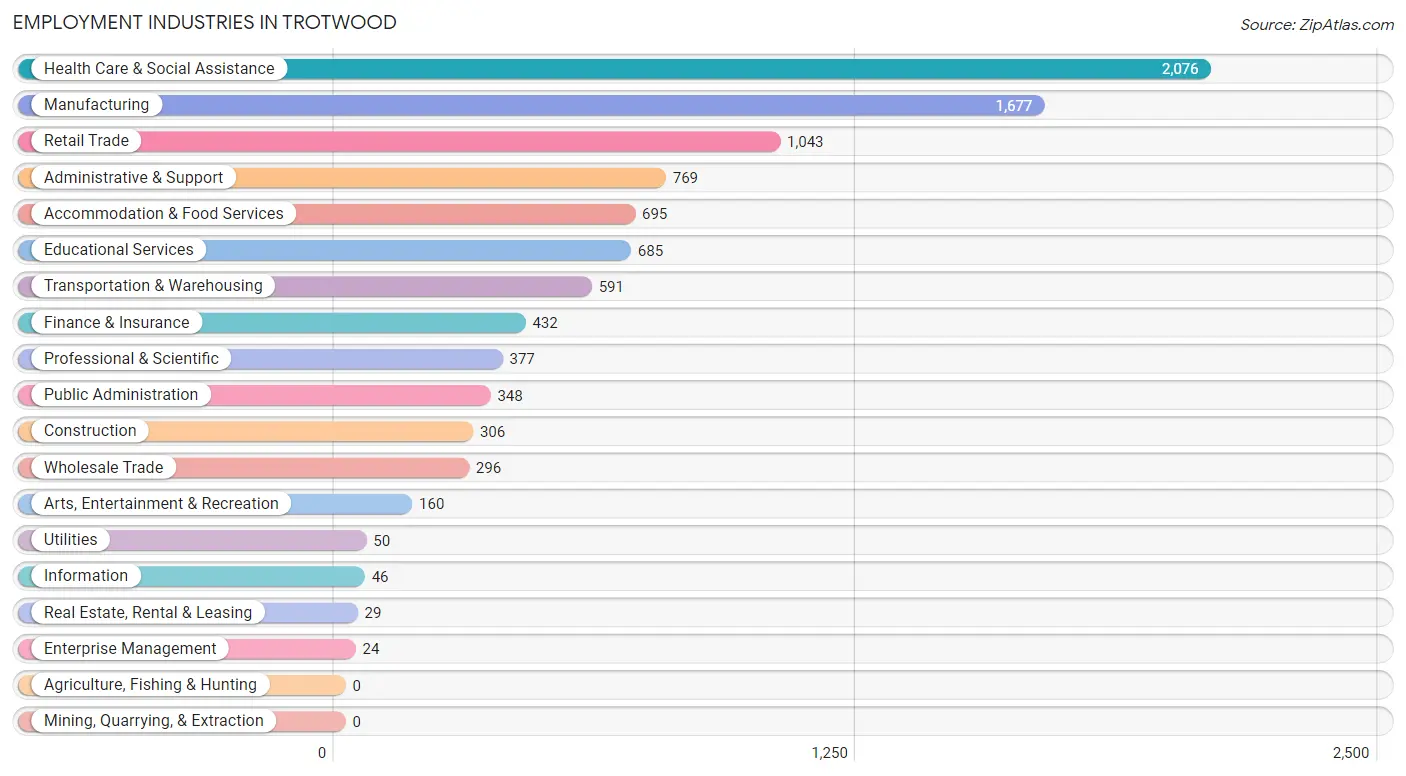
Employment Industries in Trotwood
The major employment industries in Trotwood include Health Care & Social Assistance (2,076 | 20.6%), Manufacturing (1,677 | 16.7%), Retail Trade (1,043 | 10.4%), Administrative & Support (769 | 7.6%), and Accommodation & Food Services (695 | 6.9%).
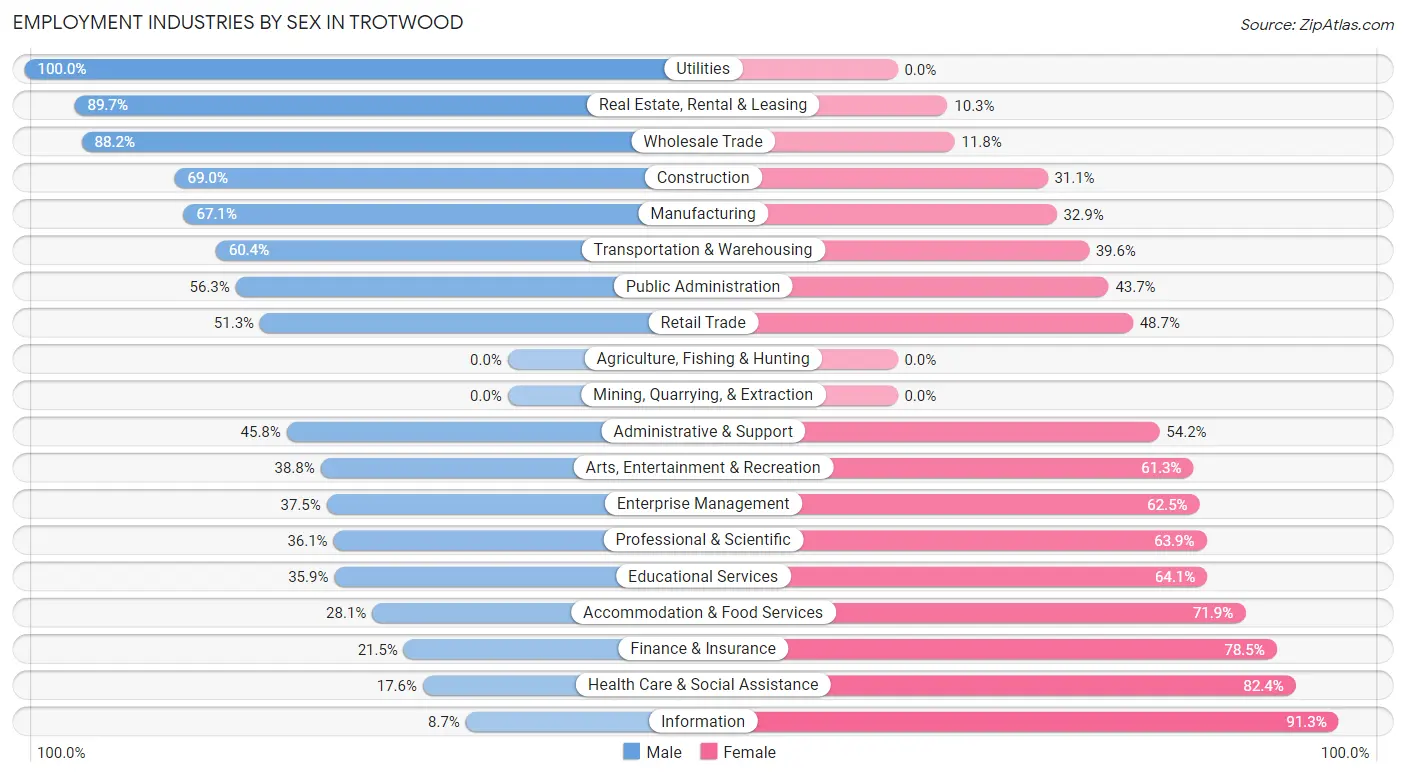
Employment Industries by Sex in Trotwood
The Trotwood industries that see more men than women are Utilities (100.0%), Real Estate, Rental & Leasing (89.7%), and Wholesale Trade (88.2%), whereas the industries that tend to have a higher number of women are Information (91.3%), Health Care & Social Assistance (82.4%), and Finance & Insurance (78.5%).
| Industry | Male | Female |
| Agriculture, Fishing & Hunting | 0 (0.0%) | 0 (0.0%) |
| Mining, Quarrying, & Extraction | 0 (0.0%) | 0 (0.0%) |
| Construction | 211 (69.0%) | 95 (31.0%) |
| Manufacturing | 1,125 (67.1%) | 552 (32.9%) |
| Wholesale Trade | 261 (88.2%) | 35 (11.8%) |
| Retail Trade | 535 (51.3%) | 508 (48.7%) |
| Transportation & Warehousing | 357 (60.4%) | 234 (39.6%) |
| Utilities | 50 (100.0%) | 0 (0.0%) |
| Information | 4 (8.7%) | 42 (91.3%) |
| Finance & Insurance | 93 (21.5%) | 339 (78.5%) |
| Real Estate, Rental & Leasing | 26 (89.7%) | 3 (10.3%) |
| Professional & Scientific | 136 (36.1%) | 241 (63.9%) |
| Enterprise Management | 9 (37.5%) | 15 (62.5%) |
| Administrative & Support | 352 (45.8%) | 417 (54.2%) |
| Educational Services | 246 (35.9%) | 439 (64.1%) |
| Health Care & Social Assistance | 365 (17.6%) | 1,711 (82.4%) |
| Arts, Entertainment & Recreation | 62 (38.8%) | 98 (61.3%) |
| Accommodation & Food Services | 195 (28.1%) | 500 (71.9%) |
| Public Administration | 196 (56.3%) | 152 (43.7%) |
| Total | 4,532 (45.0%) | 5,530 (55.0%) |
Education in Trotwood
School Enrollment in Trotwood
The most common levels of schooling among the 4,854 students in Trotwood are middle school (1,168 | 24.1%), elementary school (1,032 | 21.3%), and high school (1,032 | 21.3%).
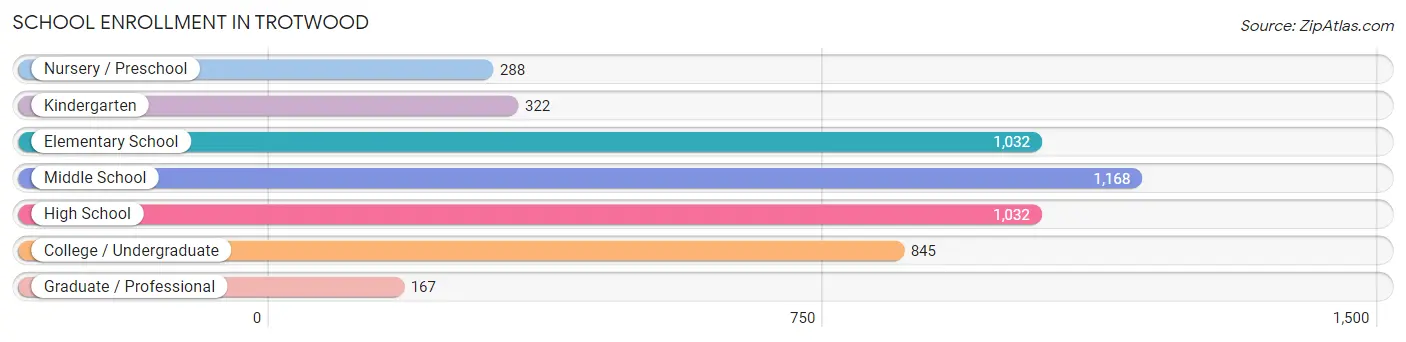
| School Level | # Students | % Students |
| Nursery / Preschool | 288 | 5.9% |
| Kindergarten | 322 | 6.6% |
| Elementary School | 1,032 | 21.3% |
| Middle School | 1,168 | 24.1% |
| High School | 1,032 | 21.3% |
| College / Undergraduate | 845 | 17.4% |
| Graduate / Professional | 167 | 3.4% |
| Total | 4,854 | 100.0% |
School Enrollment by Age by Funding Source in Trotwood
Out of a total of 4,854 students who are enrolled in schools in Trotwood, 592 (12.2%) attend a private institution, while the remaining 4,262 (87.8%) are enrolled in public schools. The age group of 20 to 24 year olds has the highest likelihood of being enrolled in private schools, with 104 (29.4% in the age bracket) enrolled. Conversely, the age group of 3 to 4 year olds has the lowest likelihood of being enrolled in a private school, with 184 (100.0% in the age bracket) attending a public institution.
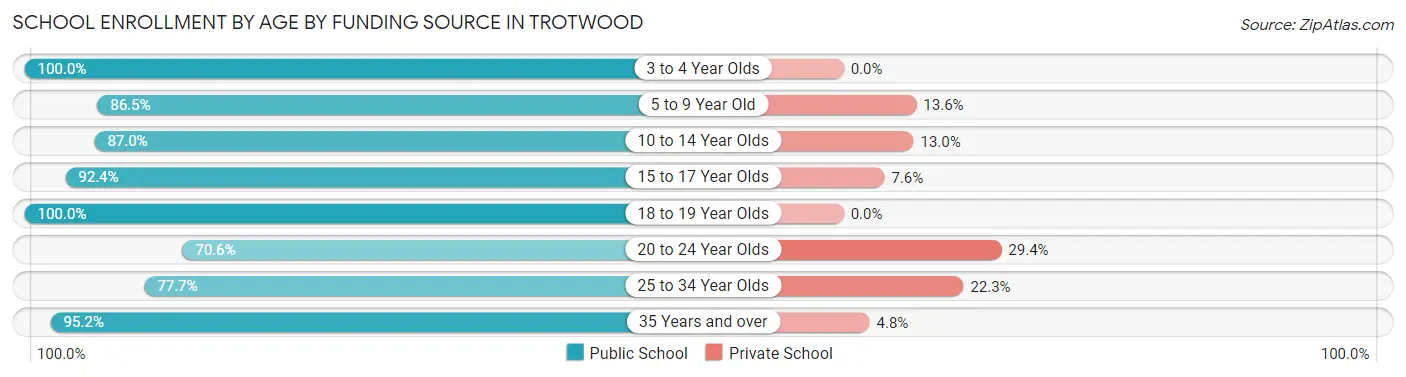
| Age Bracket | Public School | Private School |
| 3 to 4 Year Olds | 184 (100.0%) | 0 (0.0%) |
| 5 to 9 Year Old | 1,161 (86.5%) | 182 (13.6%) |
| 10 to 14 Year Olds | 1,216 (87.0%) | 182 (13.0%) |
| 15 to 17 Year Olds | 717 (92.4%) | 59 (7.6%) |
| 18 to 19 Year Olds | 288 (100.0%) | 0 (0.0%) |
| 20 to 24 Year Olds | 250 (70.6%) | 104 (29.4%) |
| 25 to 34 Year Olds | 188 (77.7%) | 54 (22.3%) |
| 35 Years and over | 256 (95.2%) | 13 (4.8%) |
| Total | 4,262 (87.8%) | 592 (12.2%) |
Educational Attainment by Field of Study in Trotwood
Education (800 | 24.5%), business (560 | 17.2%), science & technology (280 | 8.6%), arts & humanities (230 | 7.1%), and social sciences (225 | 6.9%) are the most common fields of study among 3,258 individuals in Trotwood who have obtained a bachelor's degree or higher.
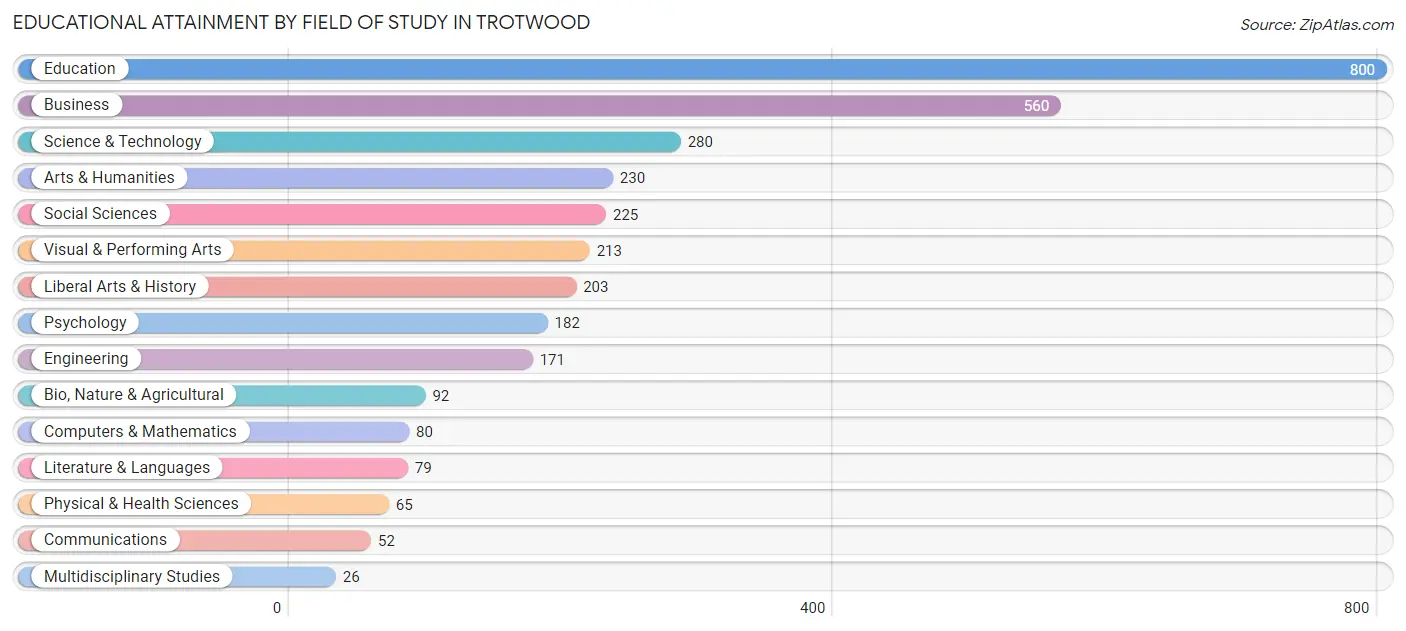
| Field of Study | # Graduates | % Graduates |
| Computers & Mathematics | 80 | 2.5% |
| Bio, Nature & Agricultural | 92 | 2.8% |
| Physical & Health Sciences | 65 | 2.0% |
| Psychology | 182 | 5.6% |
| Social Sciences | 225 | 6.9% |
| Engineering | 171 | 5.2% |
| Multidisciplinary Studies | 26 | 0.8% |
| Science & Technology | 280 | 8.6% |
| Business | 560 | 17.2% |
| Education | 800 | 24.5% |
| Literature & Languages | 79 | 2.4% |
| Liberal Arts & History | 203 | 6.2% |
| Visual & Performing Arts | 213 | 6.5% |
| Communications | 52 | 1.6% |
| Arts & Humanities | 230 | 7.1% |
| Total | 3,258 | 100.0% |
Transportation & Commute in Trotwood
Vehicle Availability by Sex in Trotwood
The most prevalent vehicle ownership categories in Trotwood are males with 1 vehicle (1,335, accounting for 30.9%) and females with 1 vehicle (1,946, making up 25.9%).
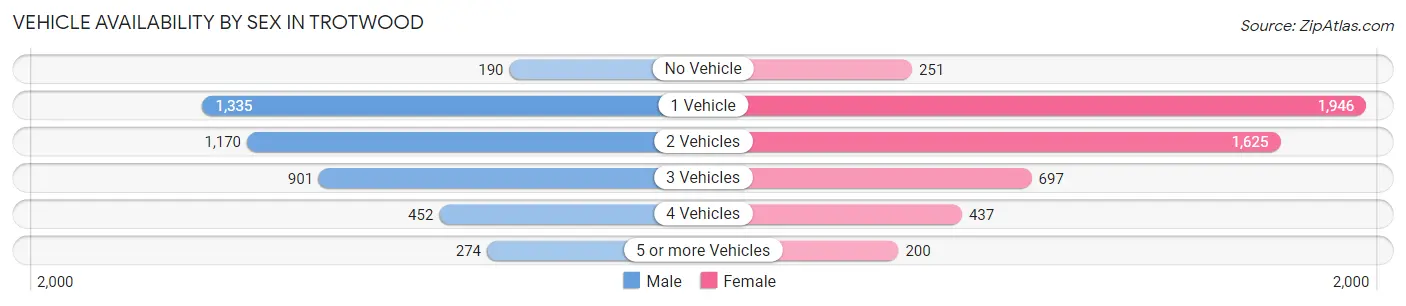
| Vehicles Available | Male | Female |
| No Vehicle | 190 (4.4%) | 251 (4.9%) |
| 1 Vehicle | 1,335 (30.9%) | 1,946 (37.7%) |
| 2 Vehicles | 1,170 (27.1%) | 1,625 (31.5%) |
| 3 Vehicles | 901 (20.8%) | 697 (13.5%) |
| 4 Vehicles | 452 (10.5%) | 437 (8.5%) |
| 5 or more Vehicles | 274 (6.3%) | 200 (3.9%) |
| Total | 4,322 (100.0%) | 5,156 (100.0%) |
Commute Time in Trotwood
The most frequently occuring commute durations in Trotwood are 15 to 19 minutes (1,714 commuters, 19.0%), 20 to 24 minutes (1,668 commuters, 18.5%), and 30 to 34 minutes (1,367 commuters, 15.2%).
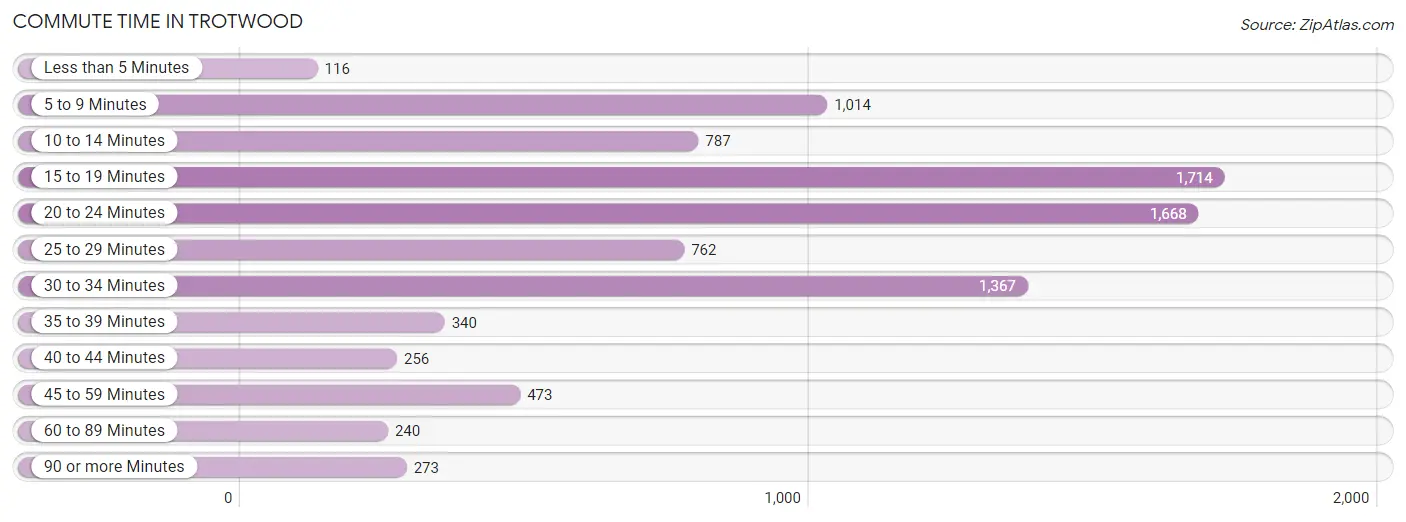
| Commute Time | # Commuters | % Commuters |
| Less than 5 Minutes | 116 | 1.3% |
| 5 to 9 Minutes | 1,014 | 11.3% |
| 10 to 14 Minutes | 787 | 8.7% |
| 15 to 19 Minutes | 1,714 | 19.0% |
| 20 to 24 Minutes | 1,668 | 18.5% |
| 25 to 29 Minutes | 762 | 8.5% |
| 30 to 34 Minutes | 1,367 | 15.2% |
| 35 to 39 Minutes | 340 | 3.8% |
| 40 to 44 Minutes | 256 | 2.8% |
| 45 to 59 Minutes | 473 | 5.2% |
| 60 to 89 Minutes | 240 | 2.7% |
| 90 or more Minutes | 273 | 3.0% |
Commute Time by Sex in Trotwood
The most common commute times in Trotwood are 20 to 24 minutes (809 commuters, 19.6%) for males and 15 to 19 minutes (952 commuters, 19.5%) for females.
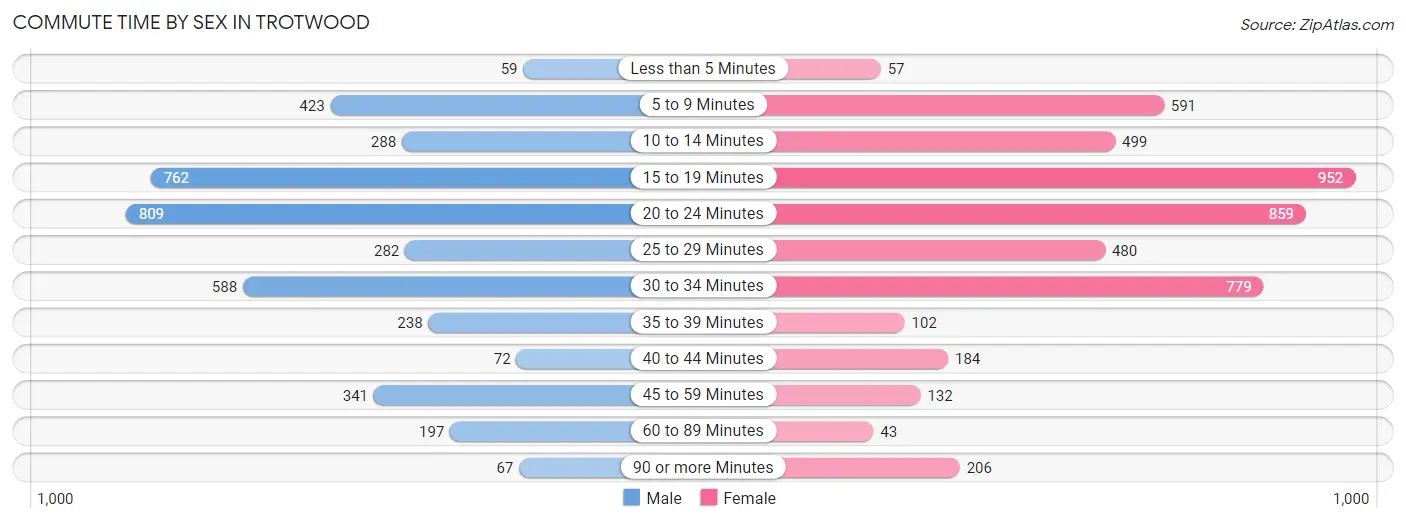
| Commute Time | Male | Female |
| Less than 5 Minutes | 59 (1.4%) | 57 (1.2%) |
| 5 to 9 Minutes | 423 (10.2%) | 591 (12.1%) |
| 10 to 14 Minutes | 288 (7.0%) | 499 (10.2%) |
| 15 to 19 Minutes | 762 (18.5%) | 952 (19.5%) |
| 20 to 24 Minutes | 809 (19.6%) | 859 (17.6%) |
| 25 to 29 Minutes | 282 (6.8%) | 480 (9.8%) |
| 30 to 34 Minutes | 588 (14.2%) | 779 (16.0%) |
| 35 to 39 Minutes | 238 (5.8%) | 102 (2.1%) |
| 40 to 44 Minutes | 72 (1.8%) | 184 (3.8%) |
| 45 to 59 Minutes | 341 (8.3%) | 132 (2.7%) |
| 60 to 89 Minutes | 197 (4.8%) | 43 (0.9%) |
| 90 or more Minutes | 67 (1.6%) | 206 (4.2%) |
Time of Departure to Work by Sex in Trotwood
The most frequent times of departure to work in Trotwood are 12:00 AM to 4:59 AM (557, 13.5%) for males and 12:00 PM to 3:59 PM (651, 13.3%) for females.
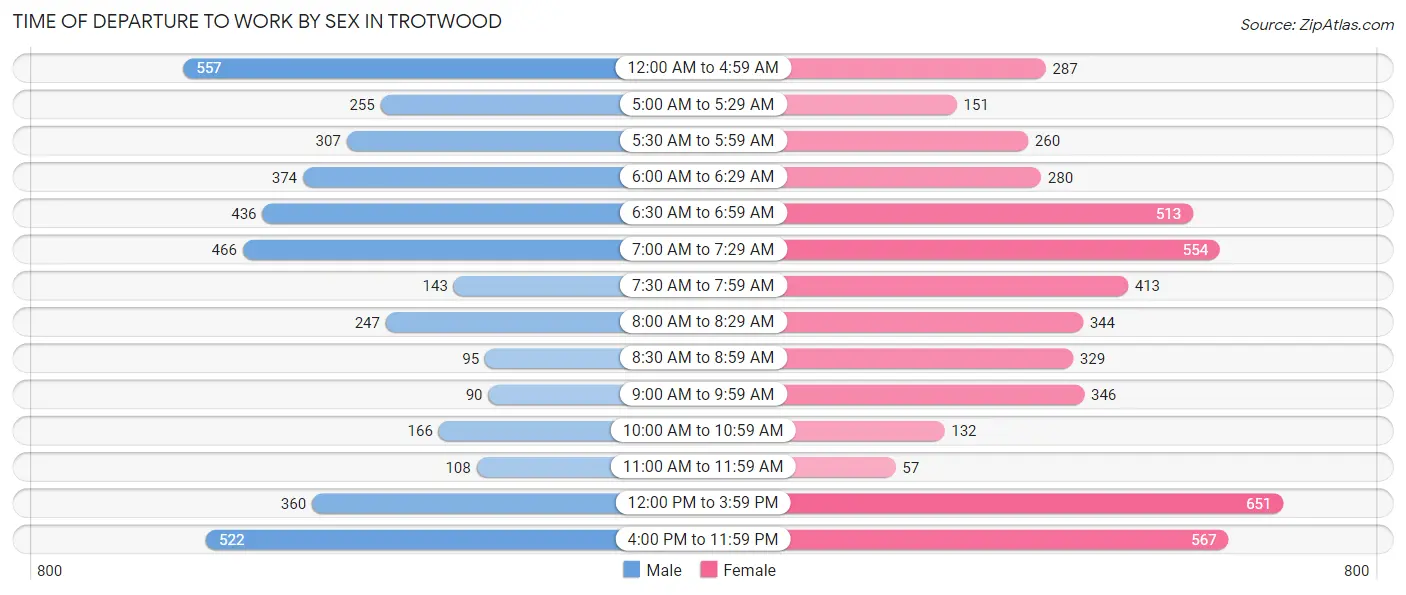
| Time of Departure | Male | Female |
| 12:00 AM to 4:59 AM | 557 (13.5%) | 287 (5.9%) |
| 5:00 AM to 5:29 AM | 255 (6.2%) | 151 (3.1%) |
| 5:30 AM to 5:59 AM | 307 (7.4%) | 260 (5.3%) |
| 6:00 AM to 6:29 AM | 374 (9.1%) | 280 (5.7%) |
| 6:30 AM to 6:59 AM | 436 (10.6%) | 513 (10.5%) |
| 7:00 AM to 7:29 AM | 466 (11.3%) | 554 (11.3%) |
| 7:30 AM to 7:59 AM | 143 (3.5%) | 413 (8.5%) |
| 8:00 AM to 8:29 AM | 247 (6.0%) | 344 (7.0%) |
| 8:30 AM to 8:59 AM | 95 (2.3%) | 329 (6.7%) |
| 9:00 AM to 9:59 AM | 90 (2.2%) | 346 (7.1%) |
| 10:00 AM to 10:59 AM | 166 (4.0%) | 132 (2.7%) |
| 11:00 AM to 11:59 AM | 108 (2.6%) | 57 (1.2%) |
| 12:00 PM to 3:59 PM | 360 (8.7%) | 651 (13.3%) |
| 4:00 PM to 11:59 PM | 522 (12.7%) | 567 (11.6%) |
| Total | 4,126 (100.0%) | 4,884 (100.0%) |
Housing Occupancy in Trotwood
Occupancy by Ownership in Trotwood
Of the total 10,233 dwellings in Trotwood, owner-occupied units account for 6,018 (58.8%), while renter-occupied units make up 4,215 (41.2%).
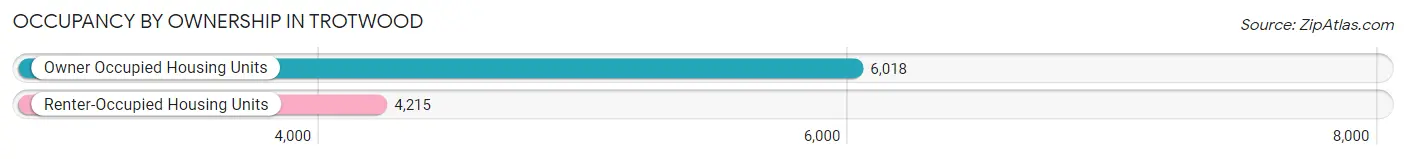
| Occupancy | # Housing Units | % Housing Units |
| Owner Occupied Housing Units | 6,018 | 58.8% |
| Renter-Occupied Housing Units | 4,215 | 41.2% |
| Total Occupied Housing Units | 10,233 | 100.0% |
Occupancy by Household Size in Trotwood
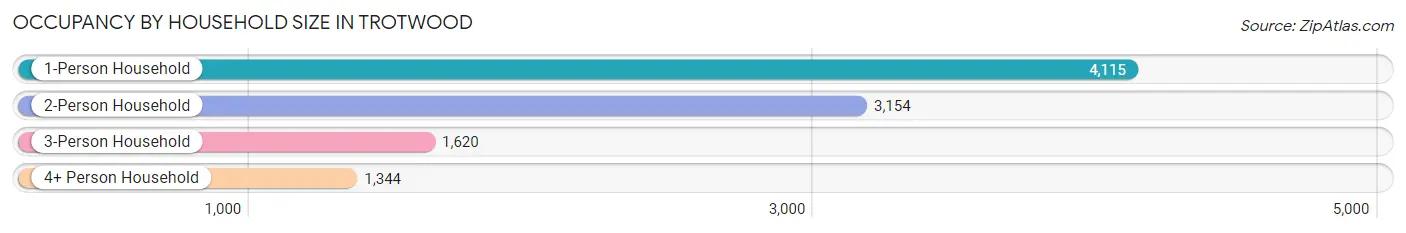
| Household Size | # Housing Units | % Housing Units |
| 1-Person Household | 4,115 | 40.2% |
| 2-Person Household | 3,154 | 30.8% |
| 3-Person Household | 1,620 | 15.8% |
| 4+ Person Household | 1,344 | 13.1% |
| Total Housing Units | 10,233 | 100.0% |
Occupancy by Ownership by Household Size in Trotwood
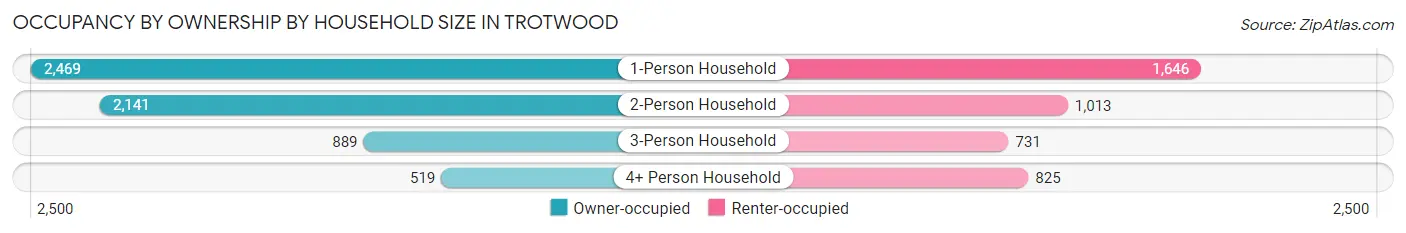
| Household Size | Owner-occupied | Renter-occupied |
| 1-Person Household | 2,469 (60.0%) | 1,646 (40.0%) |
| 2-Person Household | 2,141 (67.9%) | 1,013 (32.1%) |
| 3-Person Household | 889 (54.9%) | 731 (45.1%) |
| 4+ Person Household | 519 (38.6%) | 825 (61.4%) |
| Total Housing Units | 6,018 (58.8%) | 4,215 (41.2%) |
Occupancy by Educational Attainment in Trotwood
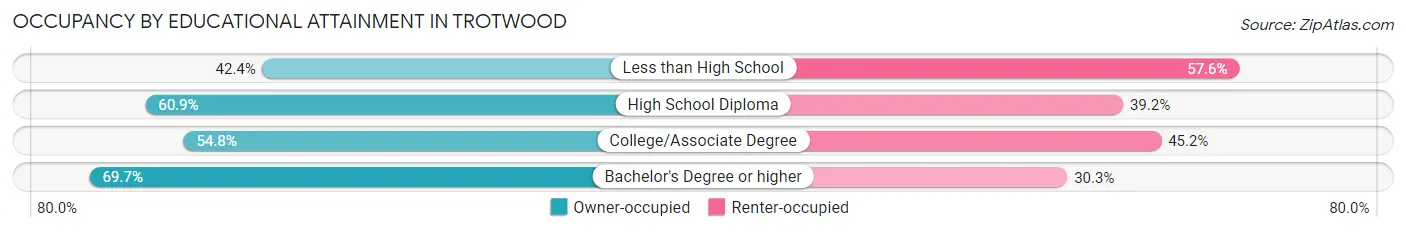
| Household Size | Owner-occupied | Renter-occupied |
| Less than High School | 338 (42.4%) | 459 (57.6%) |
| High School Diploma | 2,075 (60.9%) | 1,335 (39.2%) |
| College/Associate Degree | 2,186 (54.8%) | 1,804 (45.2%) |
| Bachelor's Degree or higher | 1,419 (69.7%) | 617 (30.3%) |
Occupancy by Age of Householder in Trotwood
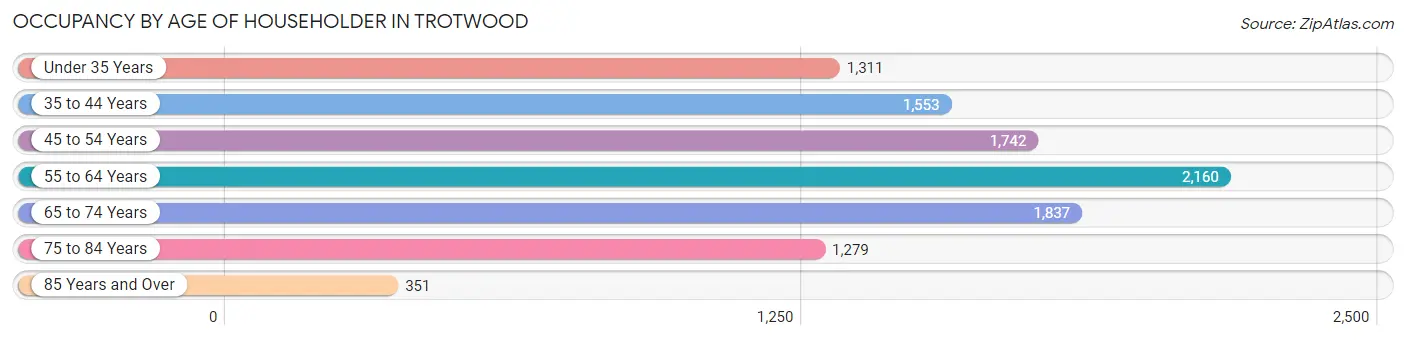
| Age Bracket | # Households | % Households |
| Under 35 Years | 1,311 | 12.8% |
| 35 to 44 Years | 1,553 | 15.2% |
| 45 to 54 Years | 1,742 | 17.0% |
| 55 to 64 Years | 2,160 | 21.1% |
| 65 to 74 Years | 1,837 | 17.9% |
| 75 to 84 Years | 1,279 | 12.5% |
| 85 Years and Over | 351 | 3.4% |
| Total | 10,233 | 100.0% |
Housing Finances in Trotwood
Median Income by Occupancy in Trotwood
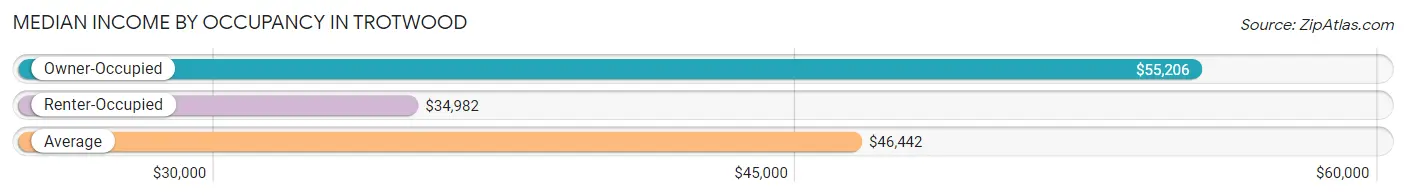
| Occupancy Type | # Households | Median Income |
| Owner-Occupied | 6,018 (58.8%) | $55,206 |
| Renter-Occupied | 4,215 (41.2%) | $34,982 |
| Average | 10,233 (100.0%) | $46,442 |
Occupancy by Householder Income Bracket in Trotwood
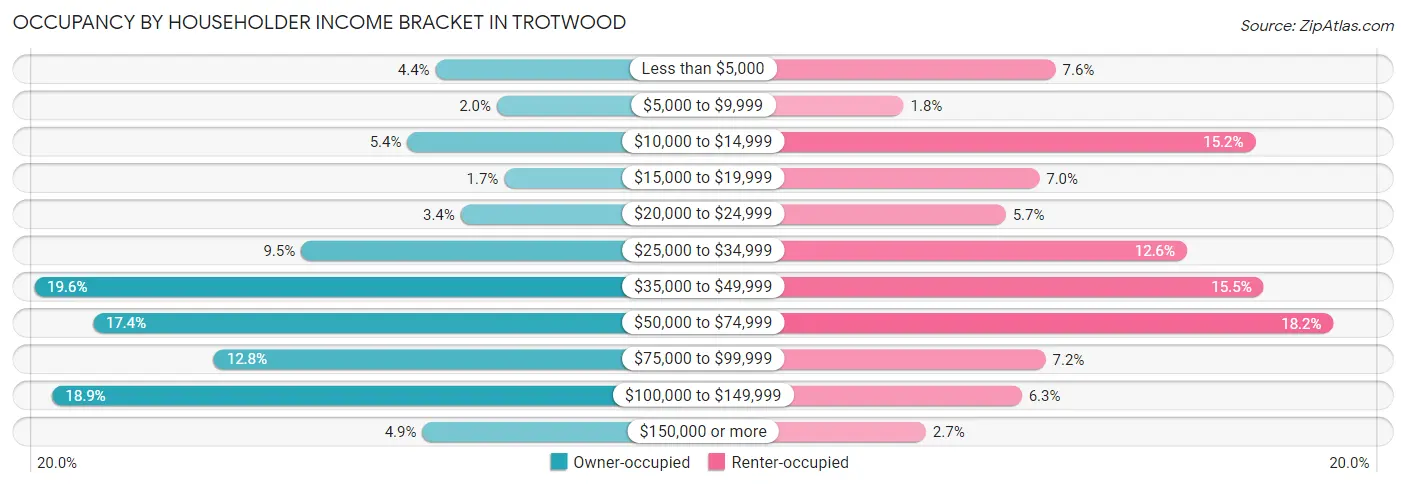
| Income Bracket | Owner-occupied | Renter-occupied |
| Less than $5,000 | 262 (4.3%) | 321 (7.6%) |
| $5,000 to $9,999 | 121 (2.0%) | 77 (1.8%) |
| $10,000 to $14,999 | 326 (5.4%) | 642 (15.2%) |
| $15,000 to $19,999 | 104 (1.7%) | 295 (7.0%) |
| $20,000 to $24,999 | 204 (3.4%) | 241 (5.7%) |
| $25,000 to $34,999 | 570 (9.5%) | 532 (12.6%) |
| $35,000 to $49,999 | 1,182 (19.6%) | 655 (15.5%) |
| $50,000 to $74,999 | 1,047 (17.4%) | 767 (18.2%) |
| $75,000 to $99,999 | 770 (12.8%) | 305 (7.2%) |
| $100,000 to $149,999 | 1,140 (18.9%) | 267 (6.3%) |
| $150,000 or more | 292 (4.9%) | 113 (2.7%) |
| Total | 6,018 (100.0%) | 4,215 (100.0%) |
Monthly Housing Cost Tiers in Trotwood
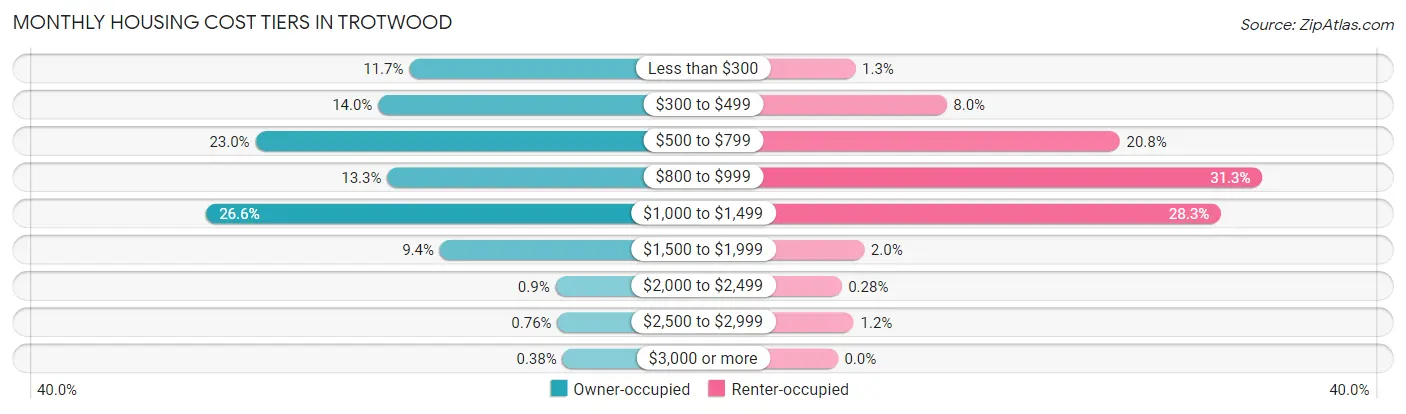
| Monthly Cost | Owner-occupied | Renter-occupied |
| Less than $300 | 702 (11.7%) | 55 (1.3%) |
| $300 to $499 | 840 (14.0%) | 338 (8.0%) |
| $500 to $799 | 1,384 (23.0%) | 876 (20.8%) |
| $800 to $999 | 800 (13.3%) | 1,319 (31.3%) |
| $1,000 to $1,499 | 1,602 (26.6%) | 1,191 (28.3%) |
| $1,500 to $1,999 | 567 (9.4%) | 82 (1.9%) |
| $2,000 to $2,499 | 54 (0.9%) | 12 (0.3%) |
| $2,500 to $2,999 | 46 (0.8%) | 50 (1.2%) |
| $3,000 or more | 23 (0.4%) | 0 (0.0%) |
| Total | 6,018 (100.0%) | 4,215 (100.0%) |
Physical Housing Characteristics in Trotwood
Housing Structures in Trotwood
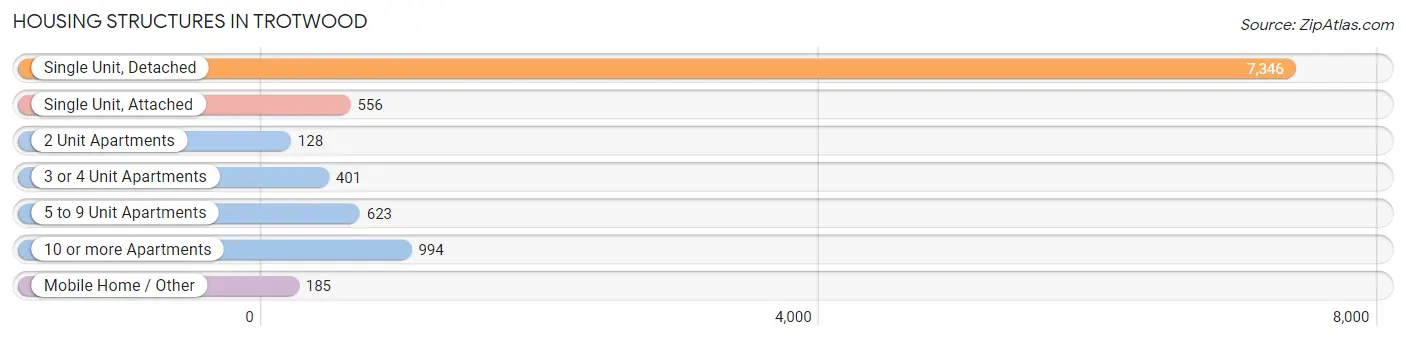
| Structure Type | # Housing Units | % Housing Units |
| Single Unit, Detached | 7,346 | 71.8% |
| Single Unit, Attached | 556 | 5.4% |
| 2 Unit Apartments | 128 | 1.3% |
| 3 or 4 Unit Apartments | 401 | 3.9% |
| 5 to 9 Unit Apartments | 623 | 6.1% |
| 10 or more Apartments | 994 | 9.7% |
| Mobile Home / Other | 185 | 1.8% |
| Total | 10,233 | 100.0% |
Housing Structures by Occupancy in Trotwood
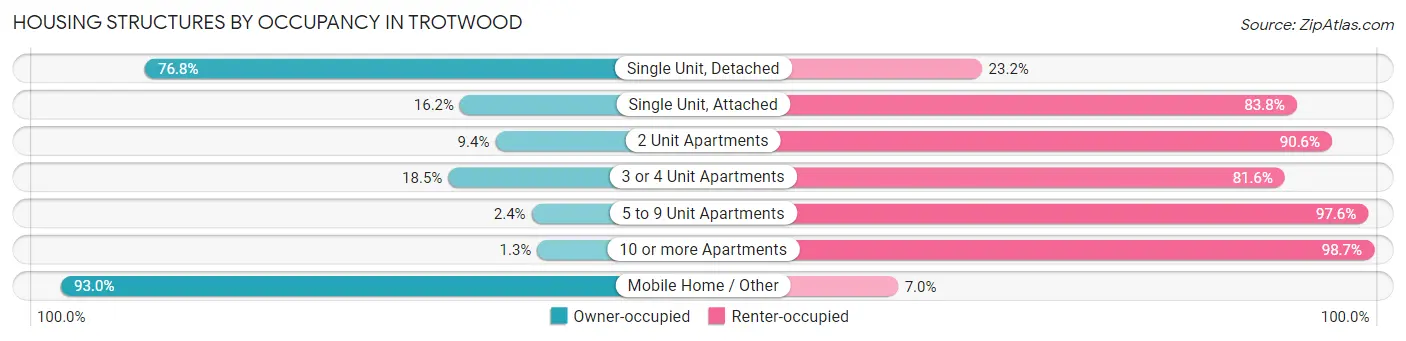
| Structure Type | Owner-occupied | Renter-occupied |
| Single Unit, Detached | 5,642 (76.8%) | 1,704 (23.2%) |
| Single Unit, Attached | 90 (16.2%) | 466 (83.8%) |
| 2 Unit Apartments | 12 (9.4%) | 116 (90.6%) |
| 3 or 4 Unit Apartments | 74 (18.4%) | 327 (81.6%) |
| 5 to 9 Unit Apartments | 15 (2.4%) | 608 (97.6%) |
| 10 or more Apartments | 13 (1.3%) | 981 (98.7%) |
| Mobile Home / Other | 172 (93.0%) | 13 (7.0%) |
| Total | 6,018 (58.8%) | 4,215 (41.2%) |
Housing Structures by Number of Rooms in Trotwood
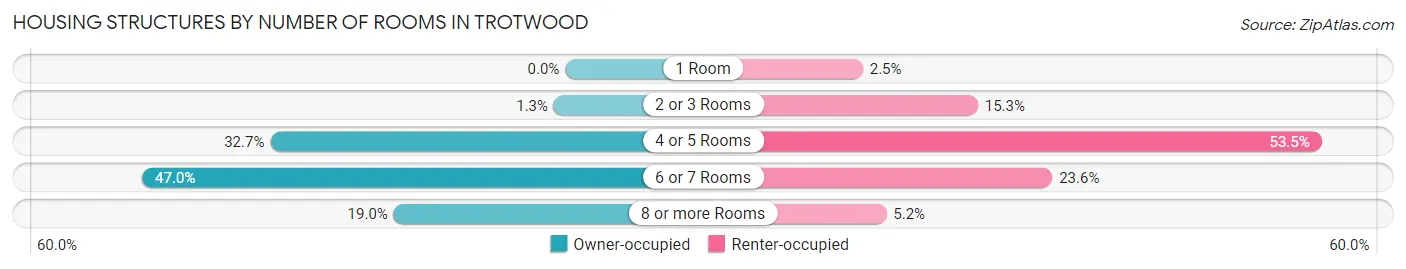
| Number of Rooms | Owner-occupied | Renter-occupied |
| 1 Room | 0 (0.0%) | 107 (2.5%) |
| 2 or 3 Rooms | 76 (1.3%) | 645 (15.3%) |
| 4 or 5 Rooms | 1,970 (32.7%) | 2,253 (53.4%) |
| 6 or 7 Rooms | 2,826 (47.0%) | 993 (23.6%) |
| 8 or more Rooms | 1,146 (19.0%) | 217 (5.1%) |
| Total | 6,018 (100.0%) | 4,215 (100.0%) |
Housing Structure by Heating Type in Trotwood
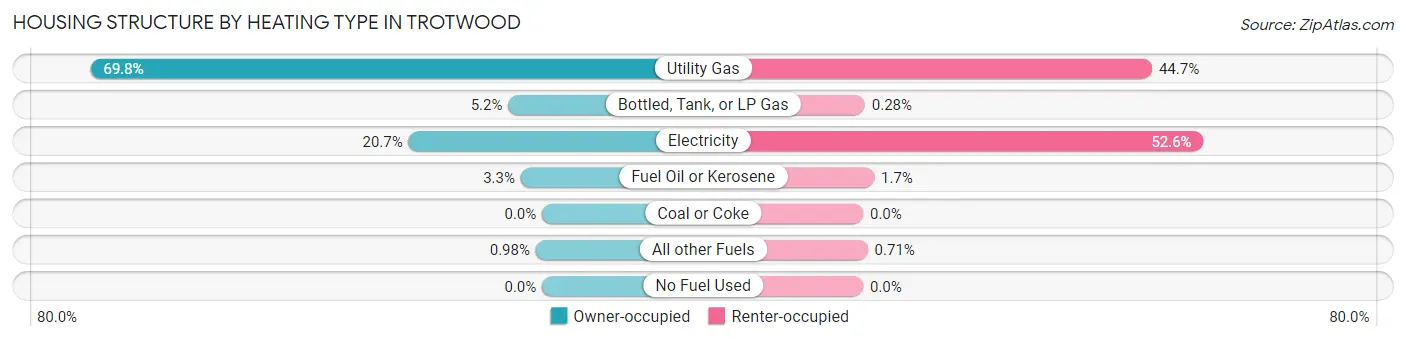
| Heating Type | Owner-occupied | Renter-occupied |
| Utility Gas | 4,203 (69.8%) | 1,883 (44.7%) |
| Bottled, Tank, or LP Gas | 315 (5.2%) | 12 (0.3%) |
| Electricity | 1,243 (20.6%) | 2,218 (52.6%) |
| Fuel Oil or Kerosene | 198 (3.3%) | 72 (1.7%) |
| Coal or Coke | 0 (0.0%) | 0 (0.0%) |
| All other Fuels | 59 (1.0%) | 30 (0.7%) |
| No Fuel Used | 0 (0.0%) | 0 (0.0%) |
| Total | 6,018 (100.0%) | 4,215 (100.0%) |
Household Vehicle Usage in Trotwood
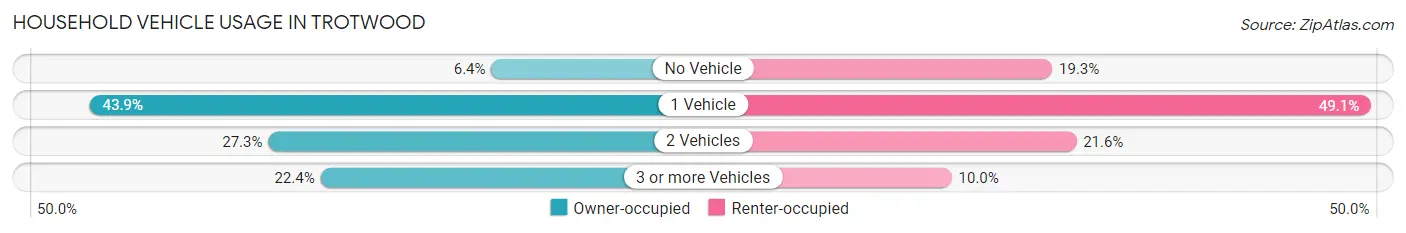
| Vehicles per Household | Owner-occupied | Renter-occupied |
| No Vehicle | 387 (6.4%) | 815 (19.3%) |
| 1 Vehicle | 2,644 (43.9%) | 2,070 (49.1%) |
| 2 Vehicles | 1,640 (27.3%) | 910 (21.6%) |
| 3 or more Vehicles | 1,347 (22.4%) | 420 (10.0%) |
| Total | 6,018 (100.0%) | 4,215 (100.0%) |
Real Estate & Mortgages in Trotwood
Real Estate and Mortgage Overview in Trotwood
| Characteristic | Without Mortgage | With Mortgage |
| Housing Units | 2,454 | 3,564 |
| Median Property Value | $77,100 | $98,100 |
| Median Household Income | $42,596 | $237 |
| Monthly Housing Costs | $444 | $23 |
| Real Estate Taxes | $1,556 | $115 |
Property Value by Mortgage Status in Trotwood
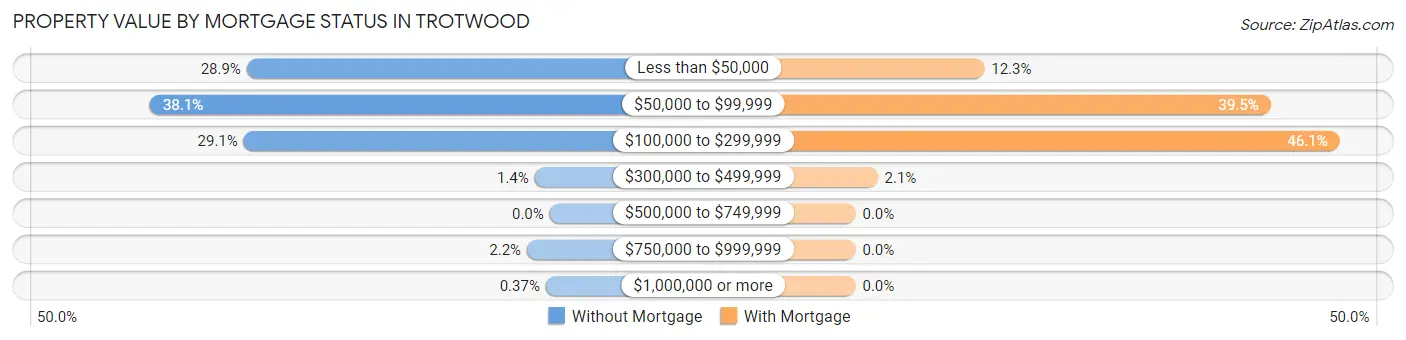
| Property Value | Without Mortgage | With Mortgage |
| Less than $50,000 | 708 (28.8%) | 437 (12.3%) |
| $50,000 to $99,999 | 934 (38.1%) | 1,409 (39.5%) |
| $100,000 to $299,999 | 715 (29.1%) | 1,643 (46.1%) |
| $300,000 to $499,999 | 35 (1.4%) | 75 (2.1%) |
| $500,000 to $749,999 | 0 (0.0%) | 0 (0.0%) |
| $750,000 to $999,999 | 53 (2.2%) | 0 (0.0%) |
| $1,000,000 or more | 9 (0.4%) | 0 (0.0%) |
| Total | 2,454 (100.0%) | 3,564 (100.0%) |
Household Income by Mortgage Status in Trotwood
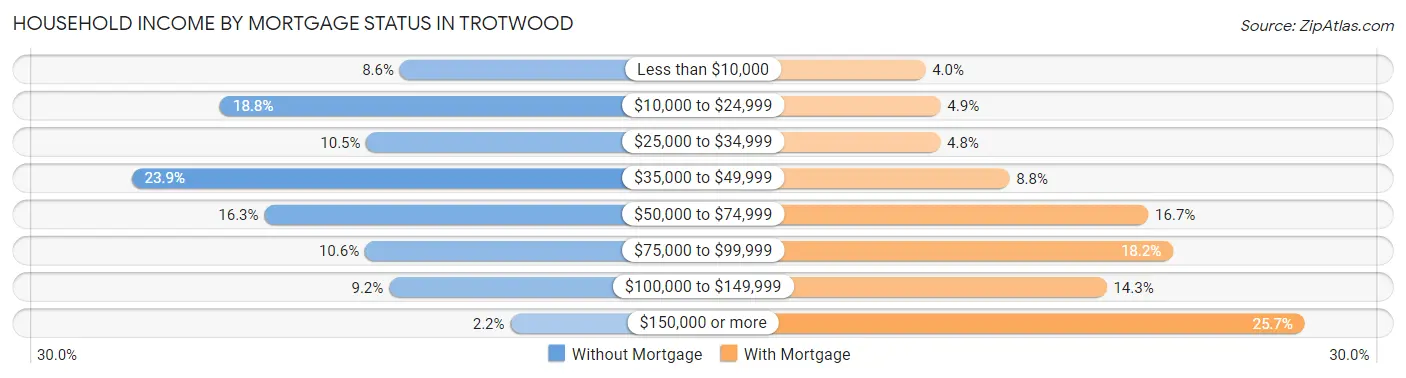
| Household Income | Without Mortgage | With Mortgage |
| Less than $10,000 | 210 (8.6%) | 142 (4.0%) |
| $10,000 to $24,999 | 462 (18.8%) | 173 (4.9%) |
| $25,000 to $34,999 | 257 (10.5%) | 172 (4.8%) |
| $35,000 to $49,999 | 586 (23.9%) | 313 (8.8%) |
| $50,000 to $74,999 | 400 (16.3%) | 596 (16.7%) |
| $75,000 to $99,999 | 259 (10.5%) | 647 (18.1%) |
| $100,000 to $149,999 | 225 (9.2%) | 511 (14.3%) |
| $150,000 or more | 55 (2.2%) | 915 (25.7%) |
| Total | 2,454 (100.0%) | 3,564 (100.0%) |
Property Value to Household Income Ratio in Trotwood
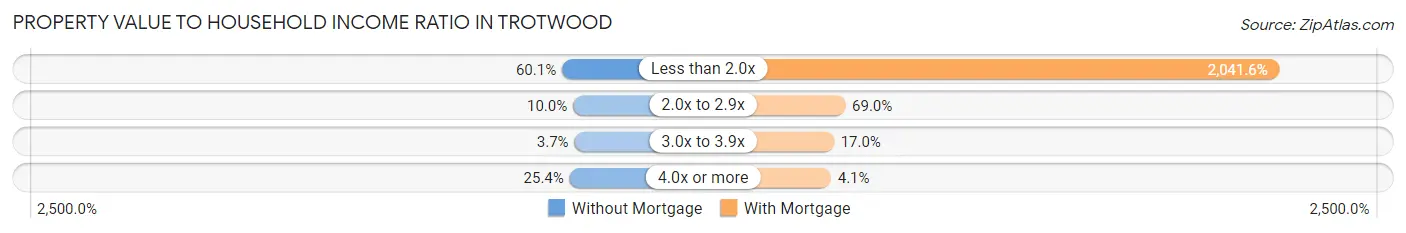
| Value-to-Income Ratio | Without Mortgage | With Mortgage |
| Less than 2.0x | 1,475 (60.1%) | 72,763 (2,041.6%) |
| 2.0x to 2.9x | 246 (10.0%) | 2,459 (69.0%) |
| 3.0x to 3.9x | 91 (3.7%) | 607 (17.0%) |
| 4.0x or more | 624 (25.4%) | 145 (4.1%) |
| Total | 2,454 (100.0%) | 3,564 (100.0%) |
Real Estate Taxes by Mortgage Status in Trotwood
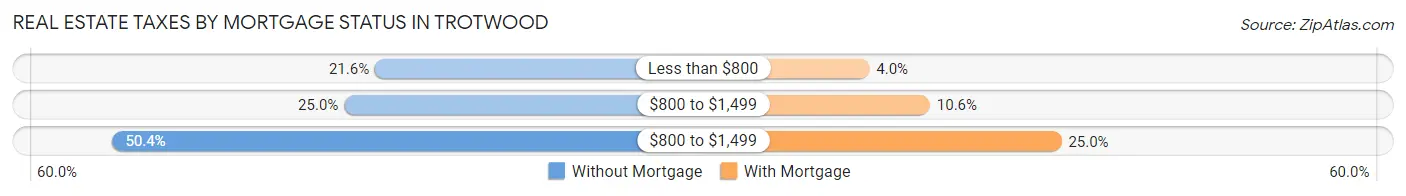
| Property Taxes | Without Mortgage | With Mortgage |
| Less than $800 | 530 (21.6%) | 142 (4.0%) |
| $800 to $1,499 | 613 (25.0%) | 378 (10.6%) |
| $800 to $1,499 | 1,236 (50.4%) | 892 (25.0%) |
| Total | 2,454 (100.0%) | 3,564 (100.0%) |
Health & Disability in Trotwood
Health Insurance Coverage by Age in Trotwood
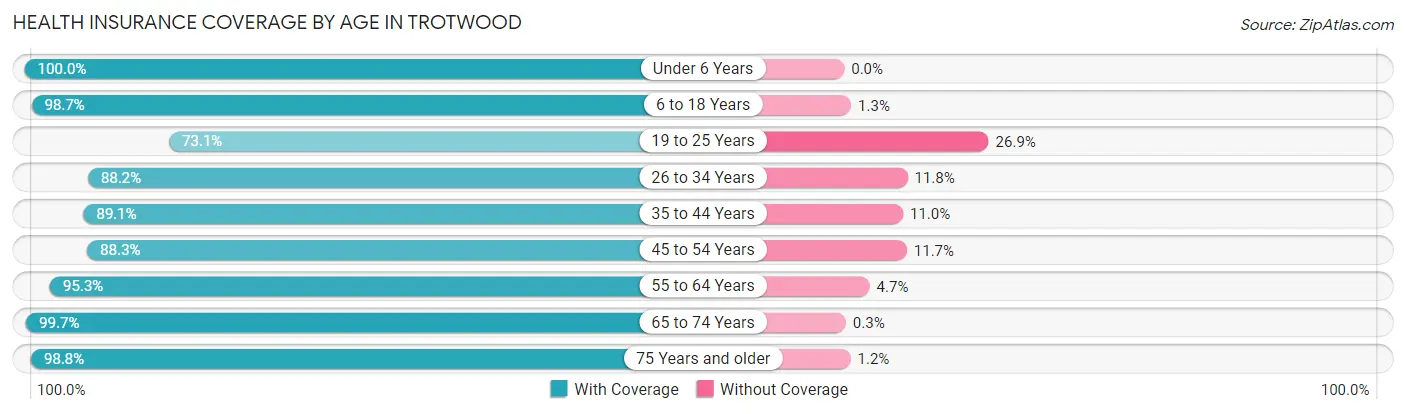
| Age Bracket | With Coverage | Without Coverage |
| Under 6 Years | 1,383 (100.0%) | 0 (0.0%) |
| 6 to 18 Years | 3,540 (98.7%) | 46 (1.3%) |
| 19 to 25 Years | 1,463 (73.1%) | 539 (26.9%) |
| 26 to 34 Years | 1,689 (88.2%) | 226 (11.8%) |
| 35 to 44 Years | 2,563 (89.0%) | 315 (11.0%) |
| 45 to 54 Years | 2,641 (88.3%) | 349 (11.7%) |
| 55 to 64 Years | 2,961 (95.3%) | 147 (4.7%) |
| 65 to 74 Years | 2,650 (99.7%) | 8 (0.3%) |
| 75 Years and older | 2,091 (98.8%) | 25 (1.2%) |
| Total | 20,981 (92.7%) | 1,655 (7.3%) |
Health Insurance Coverage by Citizenship Status in Trotwood
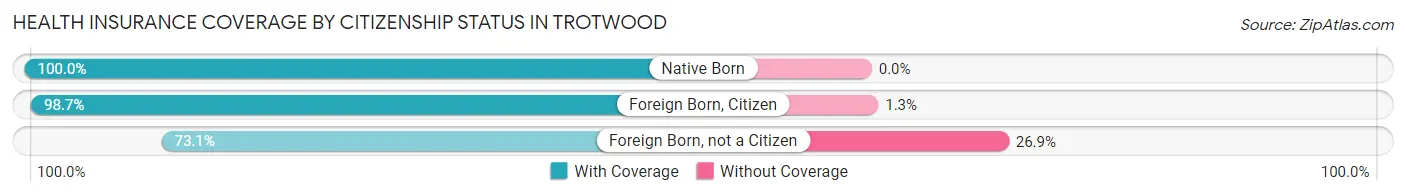
| Citizenship Status | With Coverage | Without Coverage |
| Native Born | 1,383 (100.0%) | 0 (0.0%) |
| Foreign Born, Citizen | 3,540 (98.7%) | 46 (1.3%) |
| Foreign Born, not a Citizen | 1,463 (73.1%) | 539 (26.9%) |
Health Insurance Coverage by Household Income in Trotwood
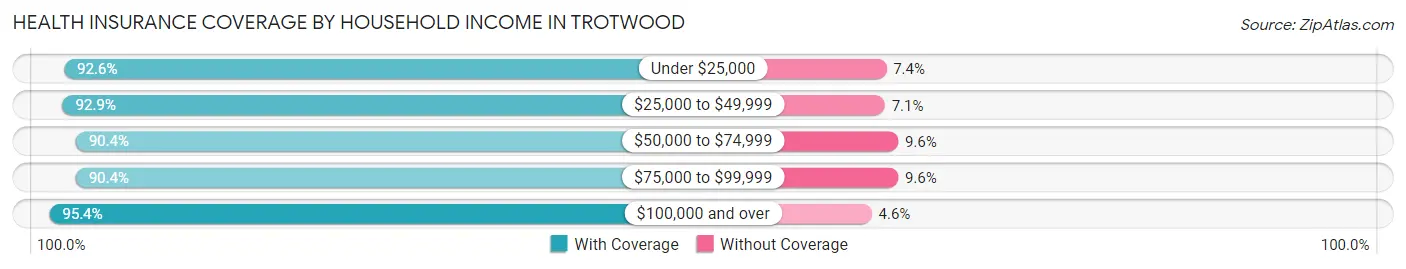
| Household Income | With Coverage | Without Coverage |
| Under $25,000 | 4,121 (92.6%) | 329 (7.4%) |
| $25,000 to $49,999 | 5,408 (92.9%) | 413 (7.1%) |
| $50,000 to $74,999 | 3,359 (90.4%) | 356 (9.6%) |
| $75,000 to $99,999 | 2,954 (90.4%) | 313 (9.6%) |
| $100,000 and over | 5,012 (95.4%) | 244 (4.6%) |
Public vs Private Health Insurance Coverage by Age in Trotwood
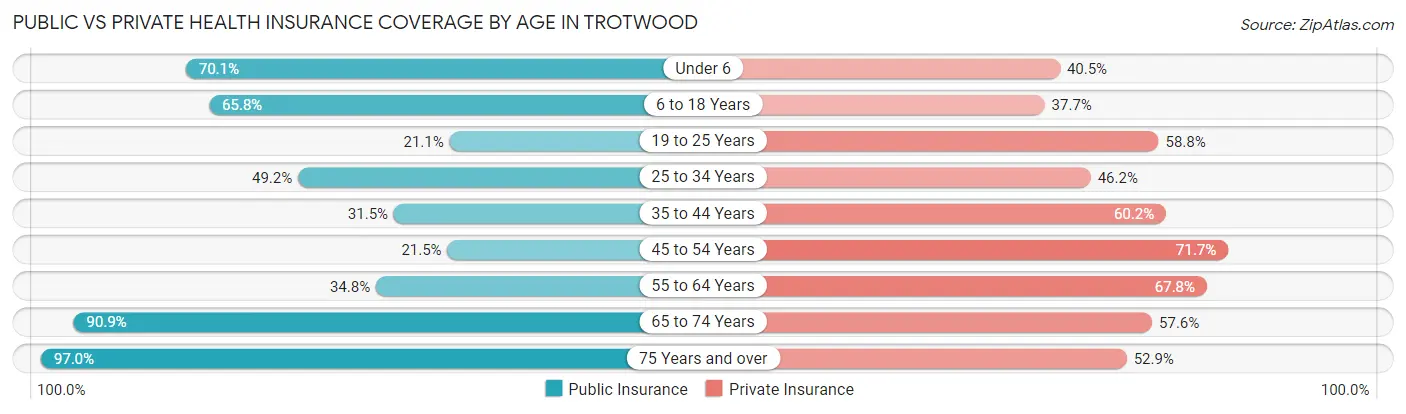
| Age Bracket | Public Insurance | Private Insurance |
| Under 6 | 969 (70.1%) | 560 (40.5%) |
| 6 to 18 Years | 2,359 (65.8%) | 1,350 (37.7%) |
| 19 to 25 Years | 423 (21.1%) | 1,177 (58.8%) |
| 25 to 34 Years | 943 (49.2%) | 885 (46.2%) |
| 35 to 44 Years | 905 (31.5%) | 1,732 (60.2%) |
| 45 to 54 Years | 643 (21.5%) | 2,144 (71.7%) |
| 55 to 64 Years | 1,081 (34.8%) | 2,106 (67.8%) |
| 65 to 74 Years | 2,417 (90.9%) | 1,531 (57.6%) |
| 75 Years and over | 2,052 (97.0%) | 1,119 (52.9%) |
| Total | 11,792 (52.1%) | 12,604 (55.7%) |
Disability Status by Sex by Age in Trotwood
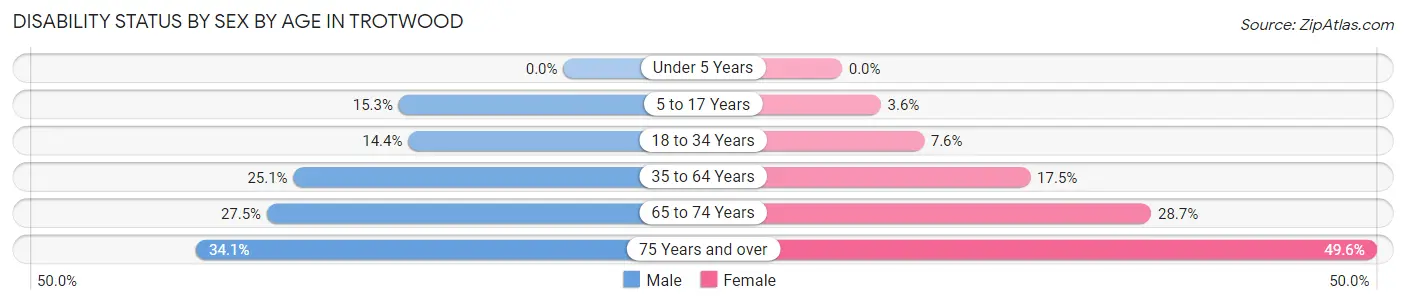
| Age Bracket | Male | Female |
| Under 5 Years | 0 (0.0%) | 0 (0.0%) |
| 5 to 17 Years | 226 (15.3%) | 81 (3.6%) |
| 18 to 34 Years | 286 (14.4%) | 163 (7.6%) |
| 35 to 64 Years | 1,026 (25.1%) | 853 (17.5%) |
| 65 to 74 Years | 296 (27.5%) | 454 (28.7%) |
| 75 Years and over | 259 (34.1%) | 673 (49.6%) |
Disability Class by Sex by Age in Trotwood
Disability Class: Hearing Difficulty
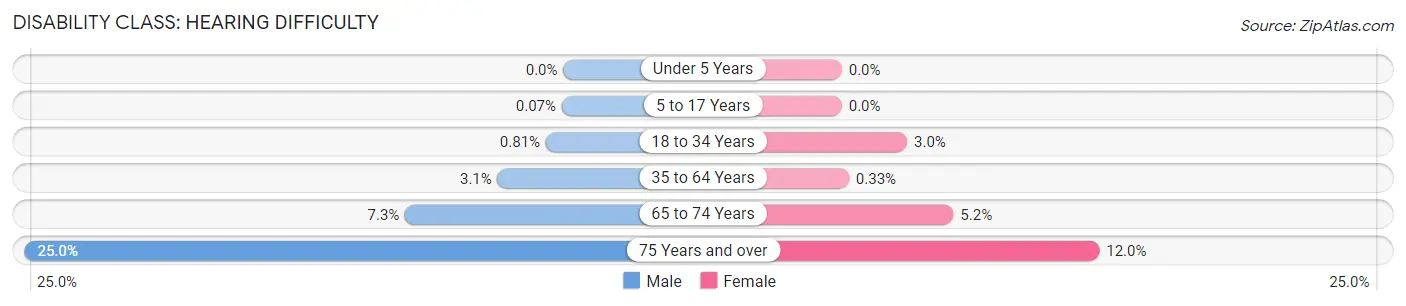
| Age Bracket | Male | Female |
| Under 5 Years | 0 (0.0%) | 0 (0.0%) |
| 5 to 17 Years | 1 (0.1%) | 0 (0.0%) |
| 18 to 34 Years | 16 (0.8%) | 65 (3.0%) |
| 35 to 64 Years | 125 (3.0%) | 16 (0.3%) |
| 65 to 74 Years | 79 (7.3%) | 82 (5.2%) |
| 75 Years and over | 190 (25.0%) | 162 (11.9%) |
Disability Class: Vision Difficulty
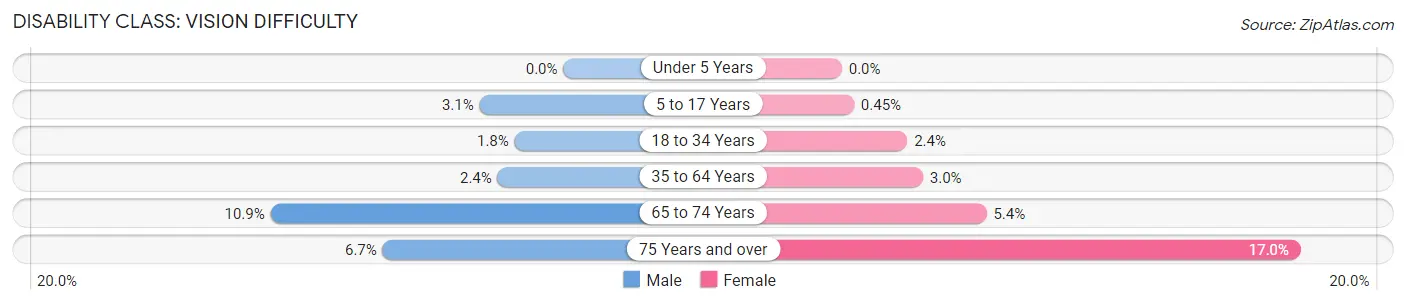
| Age Bracket | Male | Female |
| Under 5 Years | 0 (0.0%) | 0 (0.0%) |
| 5 to 17 Years | 46 (3.1%) | 10 (0.4%) |
| 18 to 34 Years | 36 (1.8%) | 52 (2.4%) |
| 35 to 64 Years | 100 (2.4%) | 147 (3.0%) |
| 65 to 74 Years | 117 (10.9%) | 85 (5.4%) |
| 75 Years and over | 51 (6.7%) | 231 (17.0%) |
Disability Class: Cognitive Difficulty
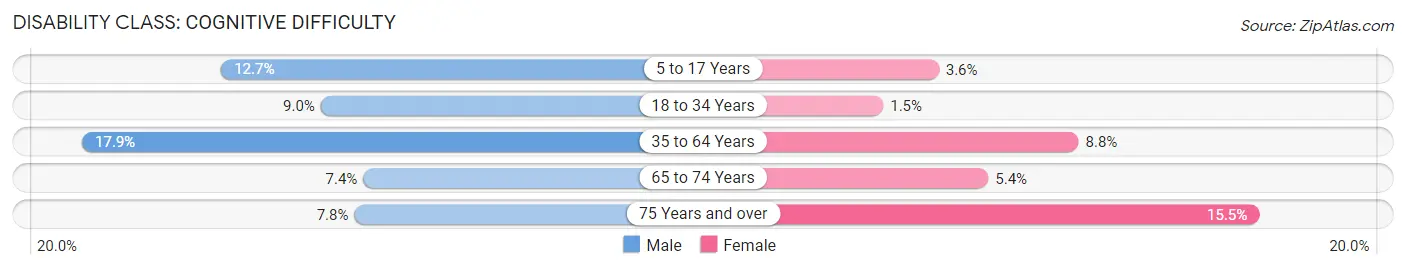
| Age Bracket | Male | Female |
| 5 to 17 Years | 188 (12.7%) | 81 (3.6%) |
| 18 to 34 Years | 179 (9.0%) | 33 (1.5%) |
| 35 to 64 Years | 732 (17.9%) | 429 (8.8%) |
| 65 to 74 Years | 80 (7.4%) | 86 (5.4%) |
| 75 Years and over | 59 (7.8%) | 210 (15.5%) |
Disability Class: Ambulatory Difficulty
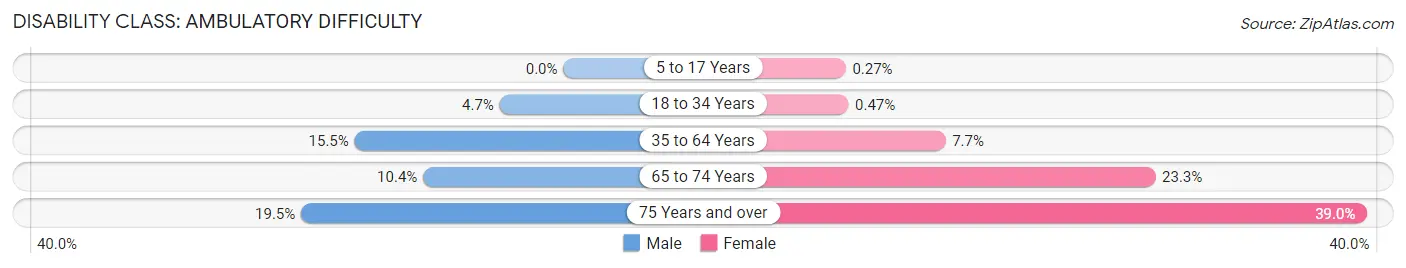
| Age Bracket | Male | Female |
| 5 to 17 Years | 0 (0.0%) | 6 (0.3%) |
| 18 to 34 Years | 94 (4.7%) | 10 (0.5%) |
| 35 to 64 Years | 635 (15.5%) | 375 (7.7%) |
| 65 to 74 Years | 112 (10.4%) | 368 (23.3%) |
| 75 Years and over | 148 (19.5%) | 529 (39.0%) |
Disability Class: Self-Care Difficulty
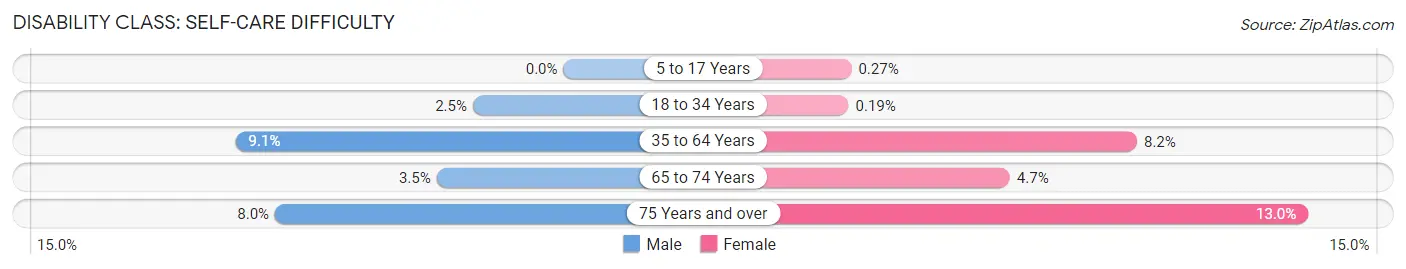
| Age Bracket | Male | Female |
| 5 to 17 Years | 0 (0.0%) | 6 (0.3%) |
| 18 to 34 Years | 50 (2.5%) | 4 (0.2%) |
| 35 to 64 Years | 374 (9.1%) | 401 (8.2%) |
| 65 to 74 Years | 38 (3.5%) | 74 (4.7%) |
| 75 Years and over | 61 (8.0%) | 176 (13.0%) |
Technology Access in Trotwood
Computing Device Access in Trotwood
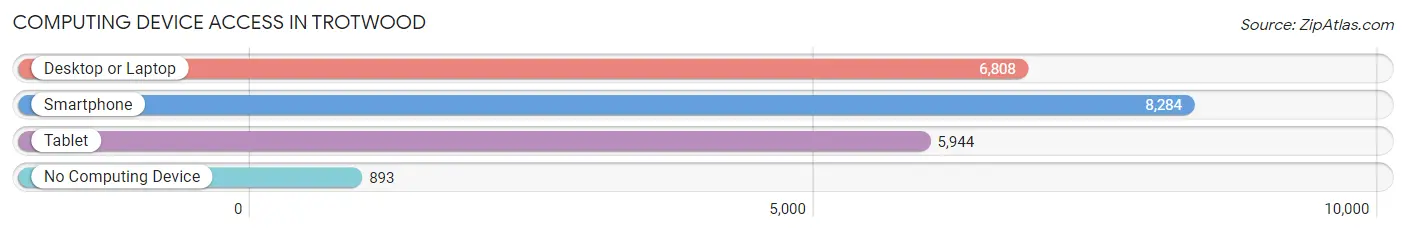
| Device Type | # Households | % Households |
| Desktop or Laptop | 6,808 | 66.5% |
| Smartphone | 8,284 | 80.9% |
| Tablet | 5,944 | 58.1% |
| No Computing Device | 893 | 8.7% |
| Total | 10,233 | 100.0% |
Internet Access in Trotwood
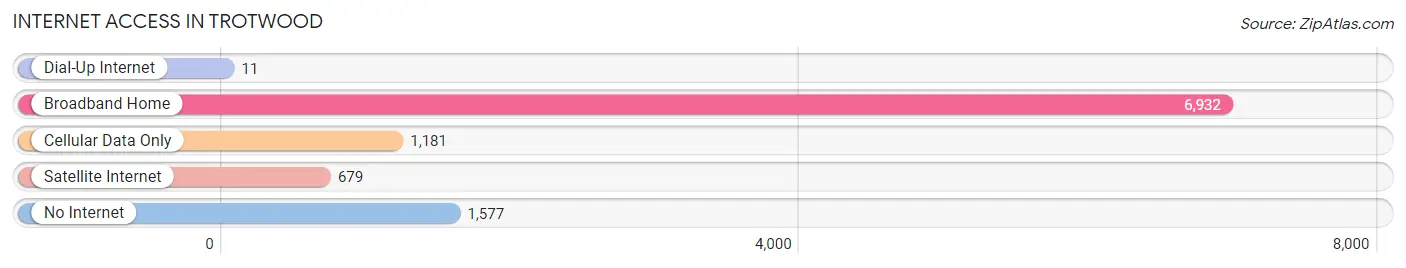
| Internet Type | # Households | % Households |
| Dial-Up Internet | 11 | 0.1% |
| Broadband Home | 6,932 | 67.7% |
| Cellular Data Only | 1,181 | 11.5% |
| Satellite Internet | 679 | 6.6% |
| No Internet | 1,577 | 15.4% |
| Total | 10,233 | 100.0% |
Trotwood Summary
Trotwood, Ohio is a small city located in Montgomery County, Ohio. It is part of the Dayton Metropolitan Statistical Area and is located just north of the city of Dayton. The city has a population of 24,431 as of the 2010 census, making it the second largest city in Montgomery County.
History
Trotwood was founded in 1817 by William Trotwood, a Revolutionary War veteran. The city was originally known as Trotwood Station, and was a stop on the Dayton and Michigan Railroad. The city was incorporated in 1834 and was named after William Trotwood.
In the late 19th century, Trotwood was a thriving agricultural community. The city was home to several large farms, and the area was known for its production of wheat, corn, and other crops.
In the early 20th century, Trotwood began to experience a period of growth and development. The city was home to several factories, including the Dayton Tire and Rubber Company, which was the largest employer in the city. The city also had a thriving business district, with several stores and restaurants.
Geography
Trotwood is located in Montgomery County, Ohio, just north of the city of Dayton. The city is situated on the Mad River, which flows through the city. The city is located in the Miami Valley region of Ohio, and is part of the Dayton Metropolitan Statistical Area.
The city has a total area of 8.7 square miles, of which 8.6 square miles is land and 0.1 square miles is water. The city is located at an elevation of 845 feet above sea level.
Economy
Trotwood has a diverse economy, with a variety of industries and businesses. The city is home to several large employers, including the Dayton Tire and Rubber Company, which is the largest employer in the city. Other major employers include the Dayton Public Schools, the Montgomery County Board of Education, and the Dayton International Airport.
The city also has a thriving retail sector, with several stores and restaurants located in the city. The city is also home to several industrial parks, which are home to a variety of businesses.
Demographics
As of the 2010 census, the city had a population of 24,431. The racial makeup of the city was 79.3% White, 16.2% African American, 0.3% Native American, 1.2% Asian, 0.1% Pacific Islander, 1.2% from other races, and 1.9% from two or more races. Hispanic or Latino of any race were 3.2% of the population.
The median income for a household in the city was $37,945, and the median income for a family was $45,945. The per capita income for the city was $19,845. About 16.2% of families and 19.2% of the population were below the poverty line, including 28.2% of those under age 18 and 11.2% of those age 65 or over.
Common Questions
What is Per Capita Income in Trotwood?
Per Capita income in Trotwood is $27,670.
What is the Median Family Income in Trotwood?
Median Family Income in Trotwood is $58,540.
What is the Median Household income in Trotwood?
Median Household Income in Trotwood is $46,442.
What is Income or Wage Gap in Trotwood?
Income or Wage Gap in Trotwood is 16.4%.
Women in Trotwood earn 83.6 cents for every dollar earned by a man.
What is Inequality or Gini Index in Trotwood?
Inequality or Gini Index in Trotwood is 0.44.
What is the Total Population of Trotwood?
Total Population of Trotwood is 23,125.
What is the Total Male Population of Trotwood?
Total Male Population of Trotwood is 9,857.
What is the Total Female Population of Trotwood?
Total Female Population of Trotwood is 13,268.
What is the Ratio of Males per 100 Females in Trotwood?
There are 74.29 Males per 100 Females in Trotwood.
What is the Ratio of Females per 100 Males in Trotwood?
There are 134.60 Females per 100 Males in Trotwood.
What is the Median Population Age in Trotwood?
Median Population Age in Trotwood is 44.4 Years.
What is the Average Family Size in Trotwood
Average Family Size in Trotwood is 3.0 People.
What is the Average Household Size in Trotwood
Average Household Size in Trotwood is 2.2 People.
How Large is the Labor Force in Trotwood?
There are 10,998 People in the Labor Forcein in Trotwood.
What is the Percentage of People in the Labor Force in Trotwood?
57.9% of People are in the Labor Force in Trotwood.
What is the Unemployment Rate in Trotwood?
Unemployment Rate in Trotwood is 8.4%.