Whitehall, OH Map & Demographics
Whitehall Map
Whitehall Overview
$25,315
PER CAPITA INCOME
$54,990
AVG FAMILY INCOME
$47,879
AVG HOUSEHOLD INCOME
7.8%
WAGE / INCOME GAP [ % ]
92.2¢/ $1
WAGE / INCOME GAP [ $ ]
$8,441
FAMILY INCOME DEFICIT
0.43
INEQUALITY / GINI INDEX
20,035
TOTAL POPULATION
10,021
MALE POPULATION
10,014
FEMALE POPULATION
100.07
MALES / 100 FEMALES
99.93
FEMALES / 100 MALES
36.6
MEDIAN AGE
3.2
AVG FAMILY SIZE
2.5
AVG HOUSEHOLD SIZE
10,533
LABOR FORCE [ PEOPLE ]
67.6%
PERCENT IN LABOR FORCE
10.6%
UNEMPLOYMENT RATE
Whitehall Area Codes
Income in Whitehall
Income Overview in Whitehall
Per Capita Income in Whitehall is $25,315, while median incomes of families and households are $54,990 and $47,879 respectively.
| Characteristic | Number | Measure |
| Per Capita Income | 20,035 | $25,315 |
| Median Family Income | 4,743 | $54,990 |
| Mean Family Income | 4,743 | $72,927 |
| Median Household Income | 8,131 | $47,879 |
| Mean Household Income | 8,131 | $61,317 |
| Income Deficit | 4,743 | $8,441 |
| Wage / Income Gap (%) | 20,035 | 7.75% |
| Wage / Income Gap ($) | 20,035 | 92.25¢ per $1 |
| Gini / Inequality Index | 20,035 | 0.43 |
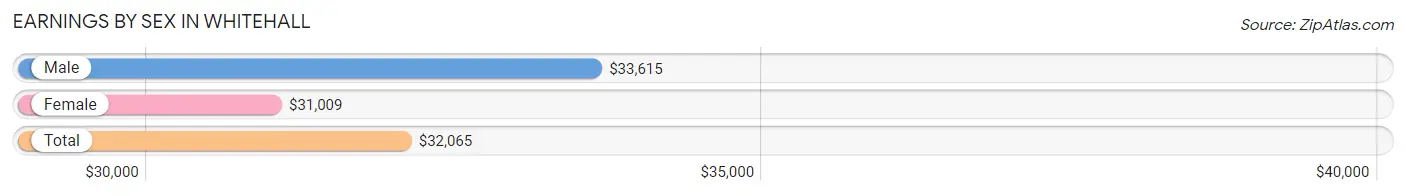
Earnings by Sex in Whitehall
Average Earnings in Whitehall are $32,065, $33,615 for men and $31,009 for women, a difference of 7.7%.
| Sex | Number | Average Earnings |
| Male | 5,389 (51.2%) | $33,615 |
| Female | 5,129 (48.8%) | $31,009 |
| Total | 10,518 (100.0%) | $32,065 |
Earnings by Sex by Income Bracket in Whitehall
The most common earnings brackets in Whitehall are $25,000 to $29,999 for men (586 | 10.9%) and $30,000 to $34,999 for women (673 | 13.1%).
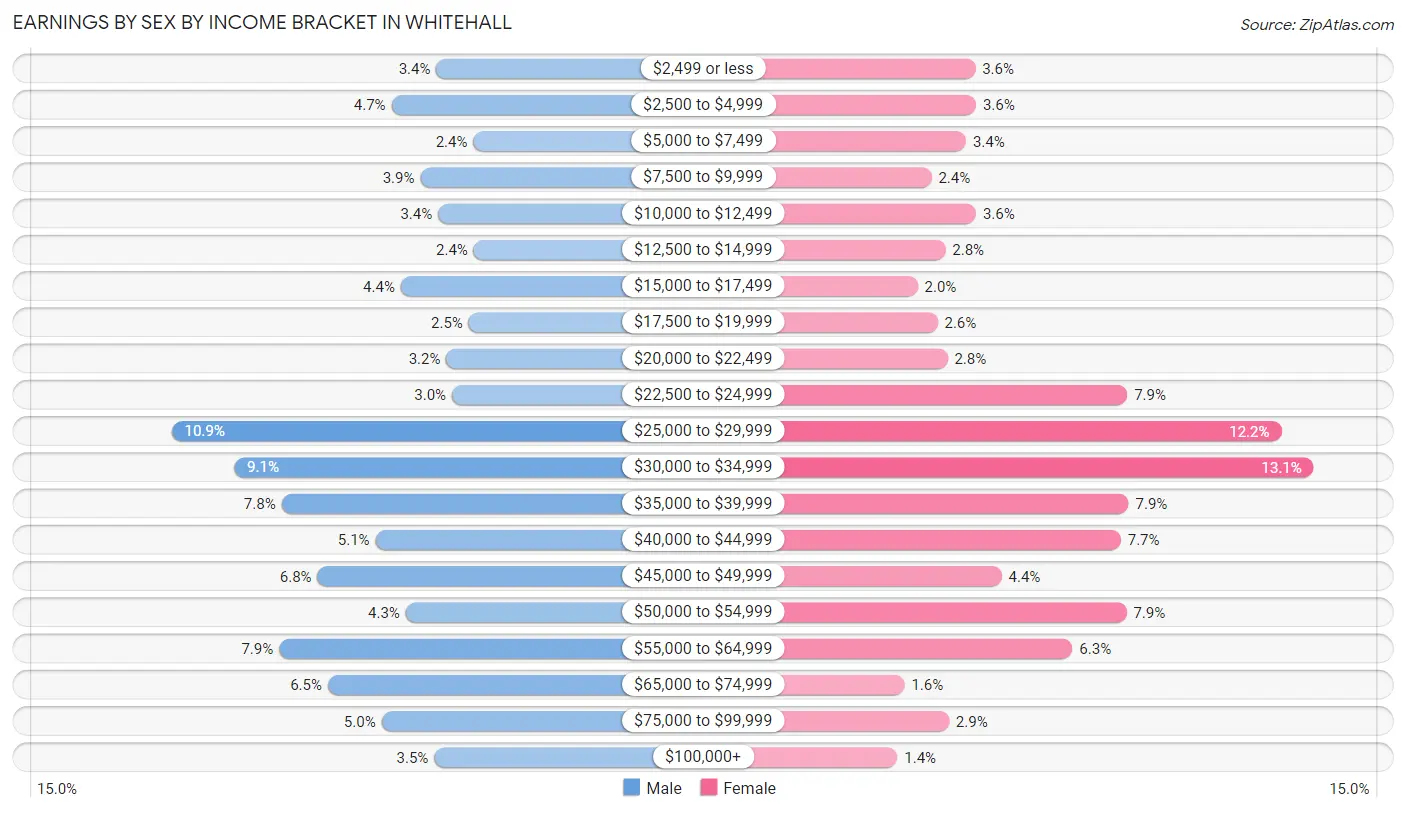
| Income | Male | Female |
| $2,499 or less | 185 (3.4%) | 185 (3.6%) |
| $2,500 to $4,999 | 253 (4.7%) | 186 (3.6%) |
| $5,000 to $7,499 | 129 (2.4%) | 172 (3.4%) |
| $7,500 to $9,999 | 209 (3.9%) | 122 (2.4%) |
| $10,000 to $12,499 | 182 (3.4%) | 186 (3.6%) |
| $12,500 to $14,999 | 128 (2.4%) | 142 (2.8%) |
| $15,000 to $17,499 | 239 (4.4%) | 102 (2.0%) |
| $17,500 to $19,999 | 136 (2.5%) | 131 (2.5%) |
| $20,000 to $22,499 | 170 (3.2%) | 145 (2.8%) |
| $22,500 to $24,999 | 161 (3.0%) | 404 (7.9%) |
| $25,000 to $29,999 | 586 (10.9%) | 626 (12.2%) |
| $30,000 to $34,999 | 491 (9.1%) | 673 (13.1%) |
| $35,000 to $39,999 | 419 (7.8%) | 406 (7.9%) |
| $40,000 to $44,999 | 277 (5.1%) | 395 (7.7%) |
| $45,000 to $49,999 | 365 (6.8%) | 223 (4.3%) |
| $50,000 to $54,999 | 231 (4.3%) | 403 (7.9%) |
| $55,000 to $64,999 | 423 (7.9%) | 325 (6.3%) |
| $65,000 to $74,999 | 349 (6.5%) | 83 (1.6%) |
| $75,000 to $99,999 | 268 (5.0%) | 147 (2.9%) |
| $100,000+ | 188 (3.5%) | 73 (1.4%) |
| Total | 5,389 (100.0%) | 5,129 (100.0%) |
Earnings by Sex by Educational Attainment in Whitehall
Average earnings in Whitehall are $36,578 for men and $32,546 for women, a difference of 11.0%. Men with an educational attainment of bachelor's degree enjoy the highest average annual earnings of $47,861, while those with less than high school education earn the least with $28,750. Women with an educational attainment of bachelor's degree earn the most with the average annual earnings of $40,972, while those with high school diploma education have the smallest earnings of $31,324.
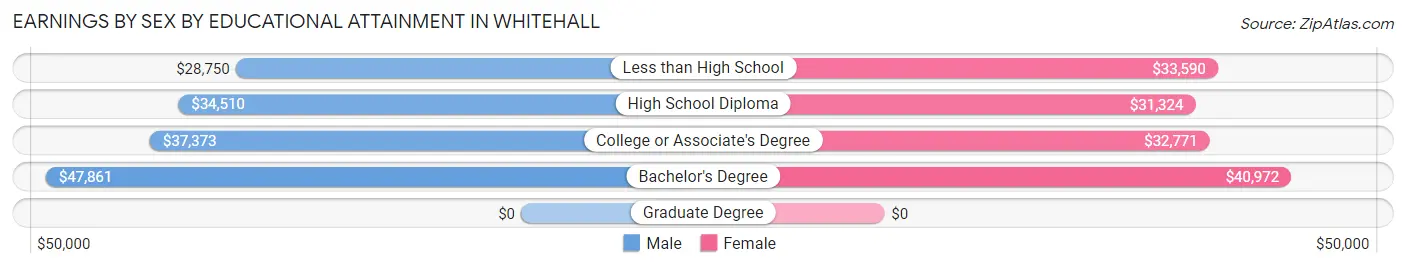
| Educational Attainment | Male Income | Female Income |
| Less than High School | $28,750 | $33,590 |
| High School Diploma | $34,510 | $31,324 |
| College or Associate's Degree | $37,373 | $32,771 |
| Bachelor's Degree | $47,861 | $40,972 |
| Graduate Degree | - | - |
| Total | $36,578 | $32,546 |
Family Income in Whitehall
Family Income Brackets in Whitehall
According to the Whitehall family income data, there are 1,058 families falling into the $50,000 to $74,999 income range, which is the most common income bracket and makes up 22.3% of all families. Conversely, the $10,000 to $14,999 income bracket is the least frequent group with only 76 families (1.6%) belonging to this category.
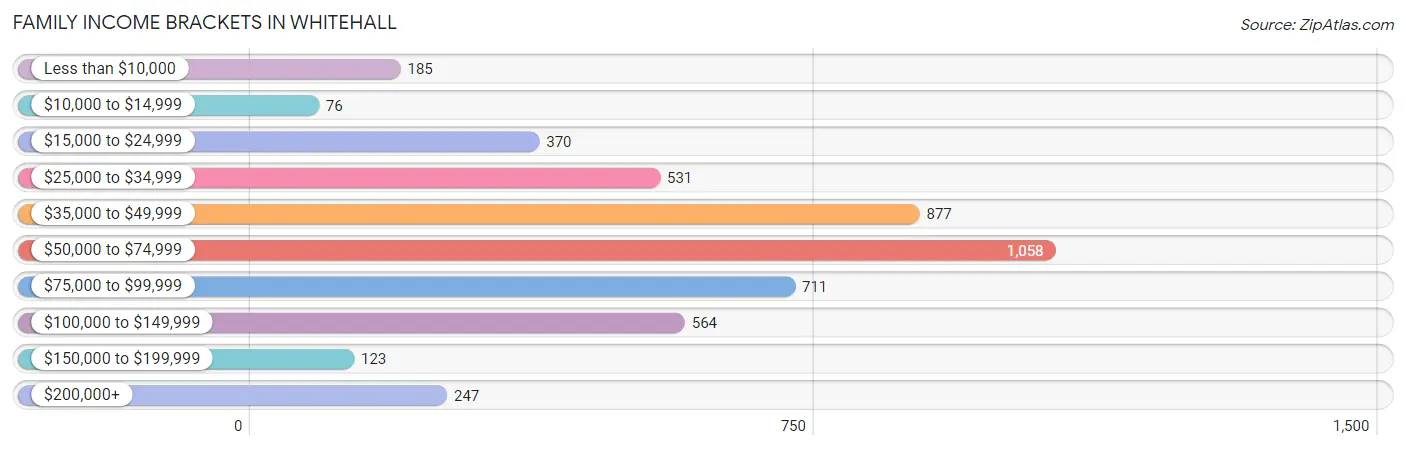
| Income Bracket | # Families | % Families |
| Less than $10,000 | 185 | 3.9% |
| $10,000 to $14,999 | 76 | 1.6% |
| $15,000 to $24,999 | 370 | 7.8% |
| $25,000 to $34,999 | 531 | 11.2% |
| $35,000 to $49,999 | 877 | 18.5% |
| $50,000 to $74,999 | 1,058 | 22.3% |
| $75,000 to $99,999 | 711 | 15.0% |
| $100,000 to $149,999 | 564 | 11.9% |
| $150,000 to $199,999 | 123 | 2.6% |
| $200,000+ | 247 | 5.2% |
Family Income by Famaliy Size in Whitehall
6-person families (183 | 3.9%) account for the highest median family income in Whitehall with $91,705 per family, while 2-person families (1,939 | 40.9%) have the highest median income of $27,163 per family member.
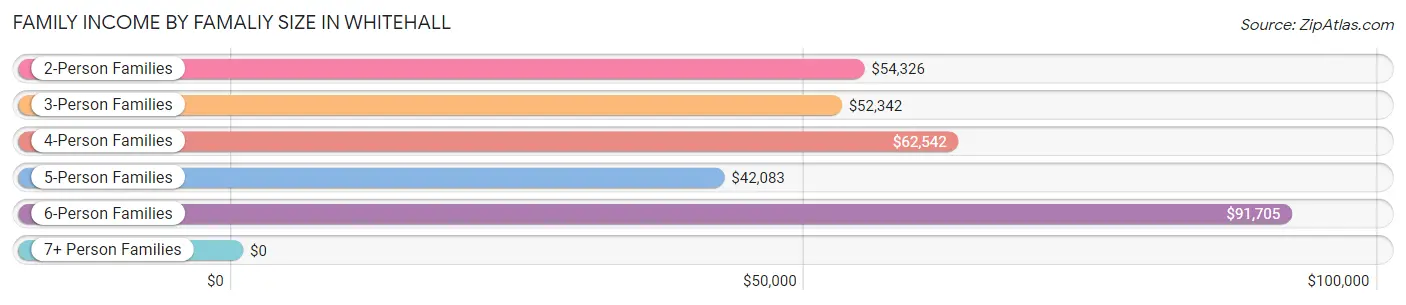
| Income Bracket | # Families | Median Income |
| 2-Person Families | 1,939 (40.9%) | $54,326 |
| 3-Person Families | 1,168 (24.6%) | $52,342 |
| 4-Person Families | 1,059 (22.3%) | $62,542 |
| 5-Person Families | 325 (6.9%) | $42,083 |
| 6-Person Families | 183 (3.9%) | $91,705 |
| 7+ Person Families | 69 (1.5%) | $0 |
| Total | 4,743 (100.0%) | $54,990 |
Family Income by Number of Earners in Whitehall
The median family income in Whitehall is $54,990, with families comprising 3+ earners (640) having the highest median family income of $97,375, while families with no earners (538) have the lowest median family income of $34,012, accounting for 13.5% and 11.3% of families, respectively.
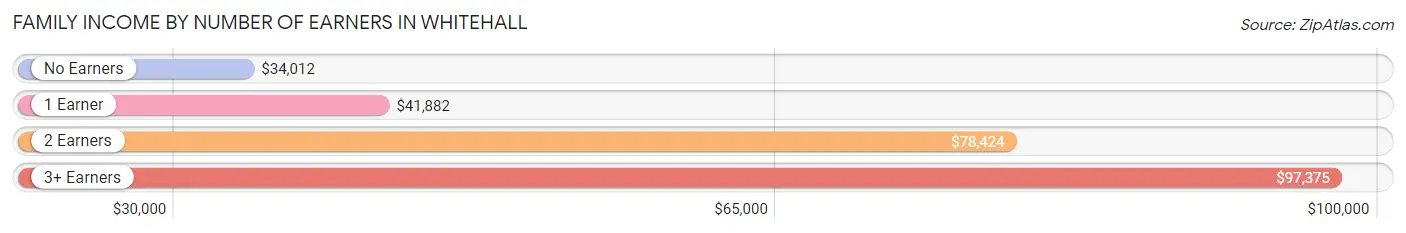
| Number of Earners | # Families | Median Income |
| No Earners | 538 (11.3%) | $34,012 |
| 1 Earner | 2,190 (46.2%) | $41,882 |
| 2 Earners | 1,375 (29.0%) | $78,424 |
| 3+ Earners | 640 (13.5%) | $97,375 |
| Total | 4,743 (100.0%) | $54,990 |
Household Income in Whitehall
Household Income Brackets in Whitehall
With 1,699 households falling in the category, the $50,000 to $74,999 income range is the most frequent in Whitehall, accounting for 20.9% of all households. In contrast, only 163 households (2.0%) fall into the $150,000 to $199,999 income bracket, making it the least populous group.
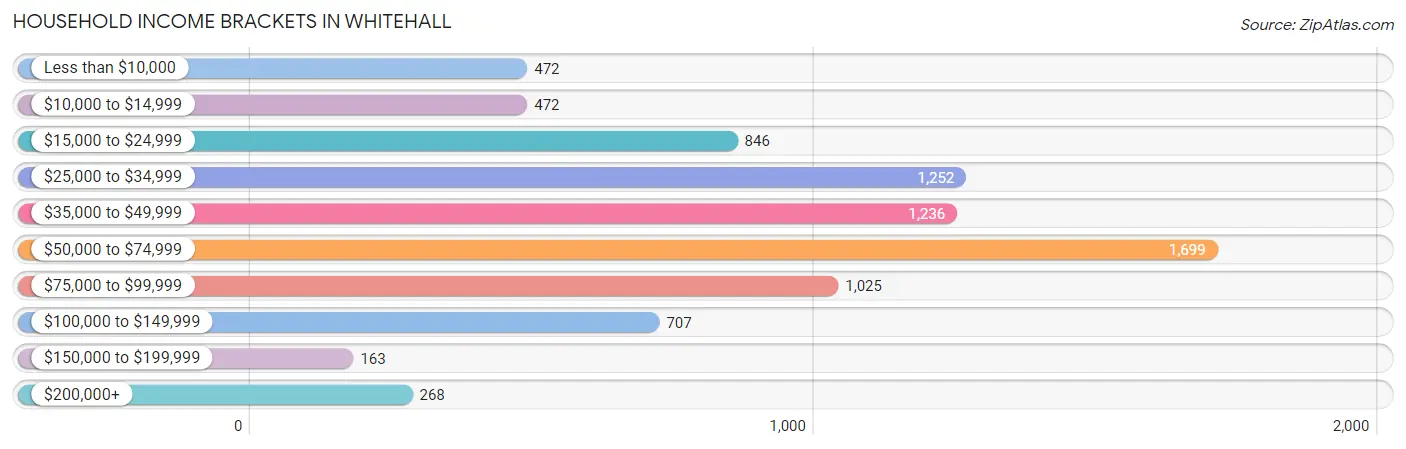
| Income Bracket | # Households | % Households |
| Less than $10,000 | 472 | 5.8% |
| $10,000 to $14,999 | 472 | 5.8% |
| $15,000 to $24,999 | 846 | 10.4% |
| $25,000 to $34,999 | 1,252 | 15.4% |
| $35,000 to $49,999 | 1,236 | 15.2% |
| $50,000 to $74,999 | 1,699 | 20.9% |
| $75,000 to $99,999 | 1,025 | 12.6% |
| $100,000 to $149,999 | 707 | 8.7% |
| $150,000 to $199,999 | 163 | 2.0% |
| $200,000+ | 268 | 3.3% |
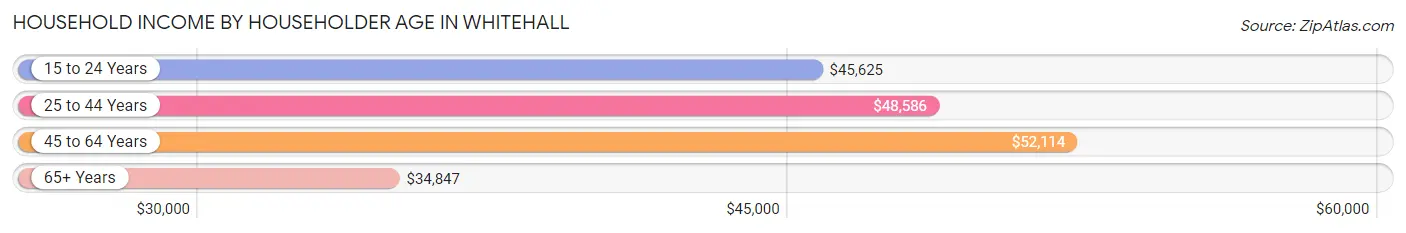
Household Income by Householder Age in Whitehall
The median household income in Whitehall is $47,879, with the highest median household income of $52,114 found in the 45 to 64 years age bracket for the primary householder. A total of 2,979 households (36.6%) fall into this category. Meanwhile, the 65+ years age bracket for the primary householder has the lowest median household income of $34,847, with 1,616 households (19.9%) in this group.
| Income Bracket | # Households | Median Income |
| 15 to 24 Years | 340 (4.2%) | $45,625 |
| 25 to 44 Years | 3,196 (39.3%) | $48,586 |
| 45 to 64 Years | 2,979 (36.6%) | $52,114 |
| 65+ Years | 1,616 (19.9%) | $34,847 |
| Total | 8,131 (100.0%) | $47,879 |
Poverty in Whitehall
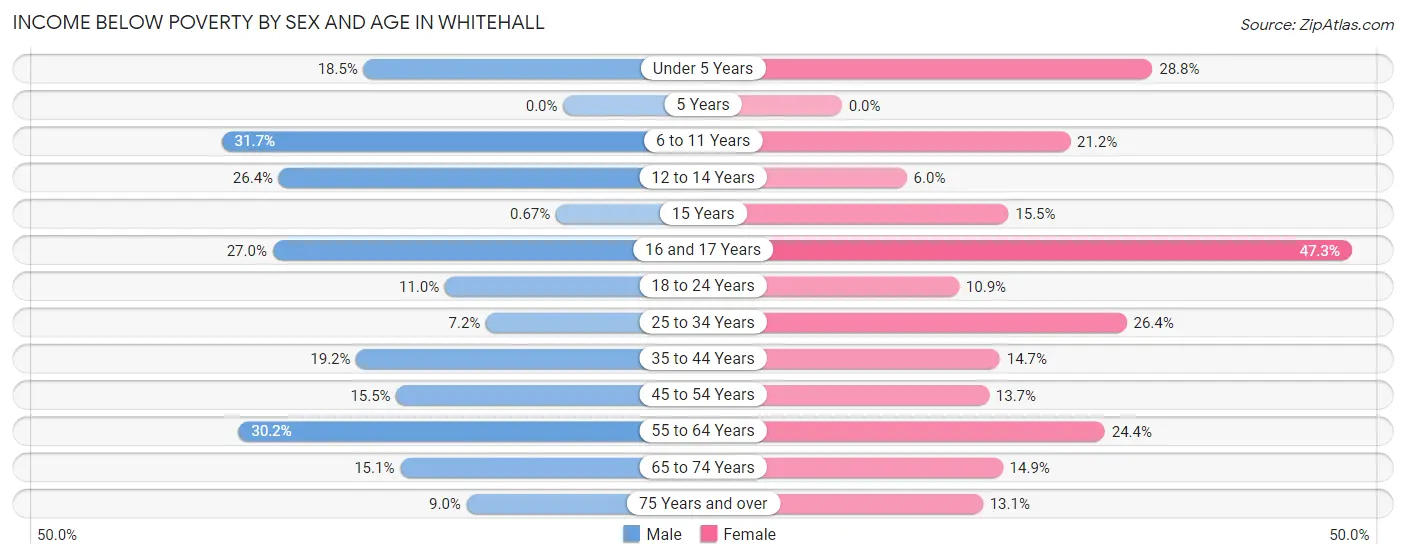
Income Below Poverty by Sex and Age in Whitehall
With 18.0% poverty level for males and 18.1% for females among the residents of Whitehall, 6 to 11 year old males and 16 and 17 year old females are the most vulnerable to poverty, with 254 males (31.7%) and 62 females (47.3%) in their respective age groups living below the poverty level.
| Age Bracket | Male | Female |
| Under 5 Years | 126 (18.5%) | 179 (28.8%) |
| 5 Years | 0 (0.0%) | 0 (0.0%) |
| 6 to 11 Years | 254 (31.7%) | 144 (21.2%) |
| 12 to 14 Years | 156 (26.4%) | 31 (6.0%) |
| 15 Years | 1 (0.7%) | 15 (15.5%) |
| 16 and 17 Years | 106 (27.0%) | 62 (47.3%) |
| 18 to 24 Years | 99 (11.0%) | 81 (10.9%) |
| 25 to 34 Years | 102 (7.2%) | 361 (26.4%) |
| 35 to 44 Years | 282 (19.2%) | 275 (14.7%) |
| 45 to 54 Years | 232 (15.5%) | 174 (13.7%) |
| 55 to 64 Years | 320 (30.2%) | 268 (24.4%) |
| 65 to 74 Years | 81 (15.1%) | 113 (14.9%) |
| 75 Years and over | 34 (9.0%) | 84 (13.1%) |
| Total | 1,793 (18.0%) | 1,787 (18.1%) |
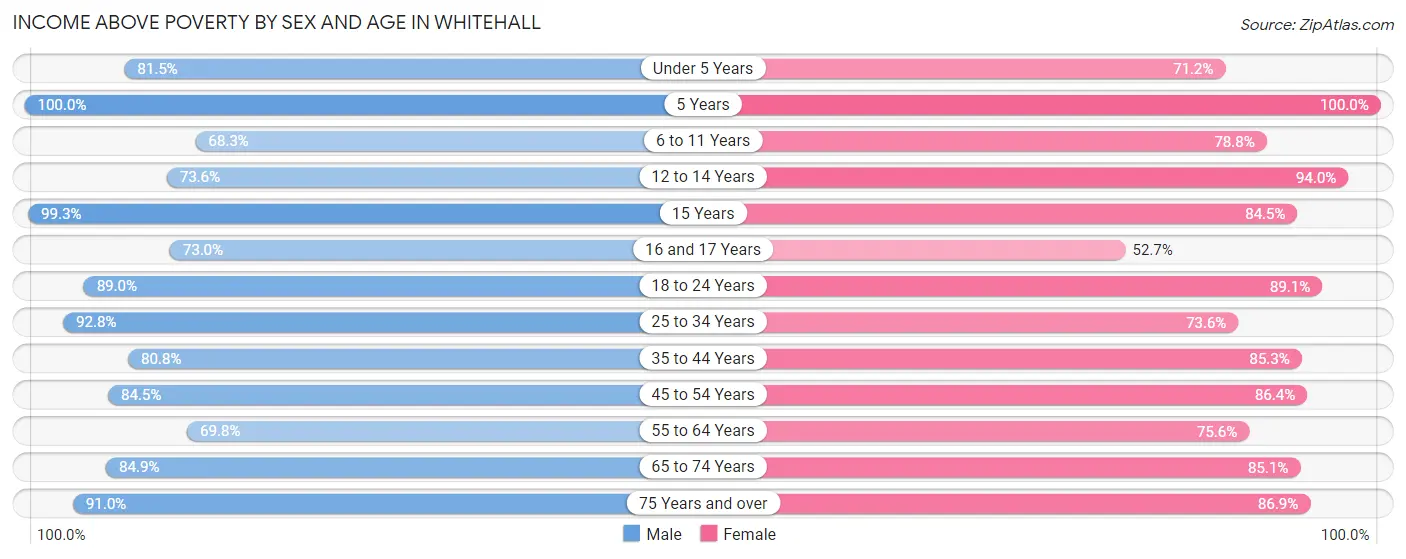
Income Above Poverty by Sex and Age in Whitehall
According to the poverty statistics in Whitehall, males aged 5 years and females aged 5 years are the age groups that are most secure financially, with 100.0% of males and 100.0% of females in these age groups living above the poverty line.
| Age Bracket | Male | Female |
| Under 5 Years | 554 (81.5%) | 442 (71.2%) |
| 5 Years | 93 (100.0%) | 79 (100.0%) |
| 6 to 11 Years | 547 (68.3%) | 536 (78.8%) |
| 12 to 14 Years | 435 (73.6%) | 484 (94.0%) |
| 15 Years | 148 (99.3%) | 82 (84.5%) |
| 16 and 17 Years | 287 (73.0%) | 69 (52.7%) |
| 18 to 24 Years | 803 (89.0%) | 664 (89.1%) |
| 25 to 34 Years | 1,323 (92.8%) | 1,005 (73.6%) |
| 35 to 44 Years | 1,186 (80.8%) | 1,599 (85.3%) |
| 45 to 54 Years | 1,266 (84.5%) | 1,101 (86.4%) |
| 55 to 64 Years | 741 (69.8%) | 830 (75.6%) |
| 65 to 74 Years | 454 (84.9%) | 644 (85.1%) |
| 75 Years and over | 345 (91.0%) | 558 (86.9%) |
| Total | 8,182 (82.0%) | 8,093 (81.9%) |
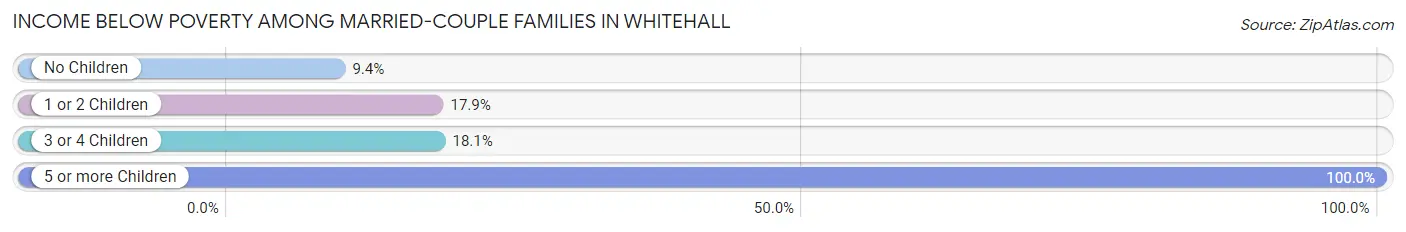
Income Below Poverty Among Married-Couple Families in Whitehall
The poverty statistics for married-couple families in Whitehall show that 14.2% or 330 of the total 2,327 families live below the poverty line. Families with 5 or more children have the highest poverty rate of 100.0%, comprising of 28 families. On the other hand, families with no children have the lowest poverty rate of 9.3%, which includes 120 families.
| Children | Above Poverty | Below Poverty |
| No Children | 1,163 (90.6%) | 120 (9.3%) |
| 1 or 2 Children | 716 (82.1%) | 156 (17.9%) |
| 3 or 4 Children | 118 (81.9%) | 26 (18.1%) |
| 5 or more Children | 0 (0.0%) | 28 (100.0%) |
| Total | 1,997 (85.8%) | 330 (14.2%) |
Income Below Poverty Among Single-Parent Households in Whitehall
According to the poverty data in Whitehall, 14.3% or 121 single-father households and 18.6% or 292 single-mother households are living below the poverty line. Among single-father households, those with 1 or 2 children have the highest poverty rate, with 91 households (22.9%) experiencing poverty. Likewise, among single-mother households, those with 3 or 4 children have the highest poverty rate, with 82 households (25.3%) falling below the poverty line.
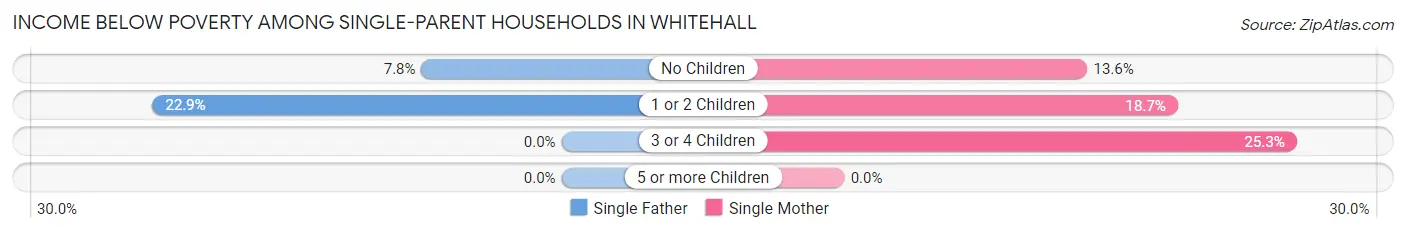
| Children | Single Father | Single Mother |
| No Children | 30 (7.8%) | 54 (13.6%) |
| 1 or 2 Children | 91 (22.9%) | 156 (18.7%) |
| 3 or 4 Children | 0 (0.0%) | 82 (25.3%) |
| 5 or more Children | 0 (0.0%) | 0 (0.0%) |
| Total | 121 (14.3%) | 292 (18.6%) |
Income Below Poverty Among Married-Couple vs Single-Parent Households in Whitehall
The poverty data for Whitehall shows that 330 of the married-couple family households (14.2%) and 413 of the single-parent households (17.1%) are living below the poverty level. Within the married-couple family households, those with 5 or more children have the highest poverty rate, with 28 households (100.0%) falling below the poverty line. Among the single-parent households, those with 3 or 4 children have the highest poverty rate, with 82 household (21.1%) living below poverty.
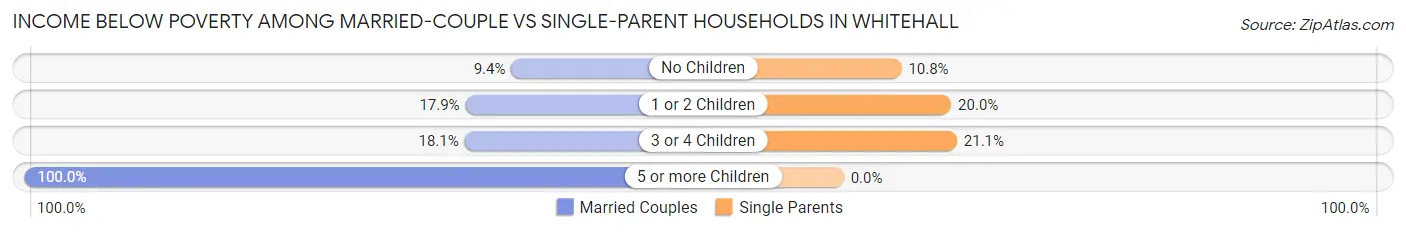
| Children | Married-Couple Families | Single-Parent Households |
| No Children | 120 (9.3%) | 84 (10.8%) |
| 1 or 2 Children | 156 (17.9%) | 247 (20.0%) |
| 3 or 4 Children | 26 (18.1%) | 82 (21.1%) |
| 5 or more Children | 28 (100.0%) | 0 (0.0%) |
| Total | 330 (14.2%) | 413 (17.1%) |
Race in Whitehall
The most populous races in Whitehall are White / Caucasian (8,775 | 43.8%), Black / African American (8,337 | 41.6%), and Hispanic or Latino (2,033 | 10.2%).
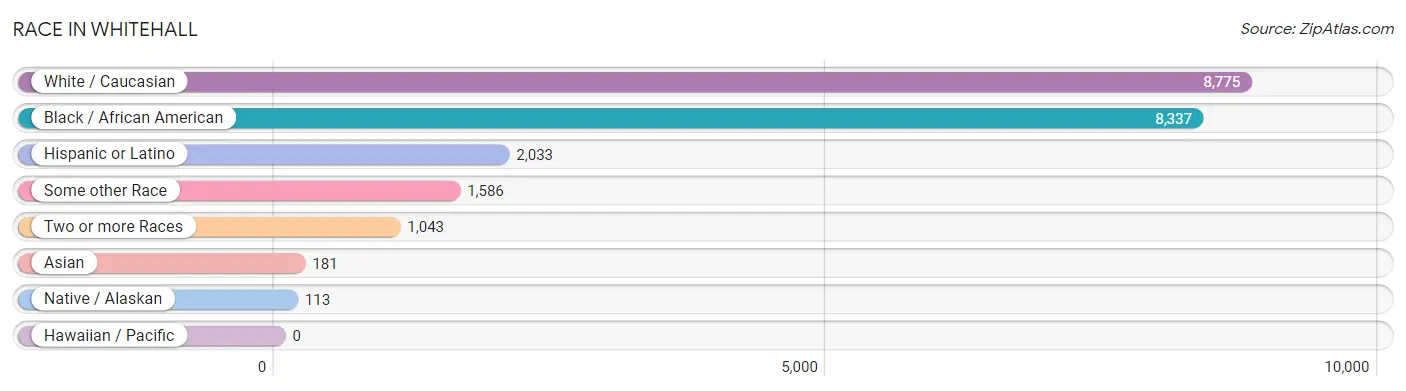
| Race | # Population | % Population |
| Asian | 181 | 0.9% |
| Black / African American | 8,337 | 41.6% |
| Hawaiian / Pacific | 0 | 0.0% |
| Hispanic or Latino | 2,033 | 10.2% |
| Native / Alaskan | 113 | 0.6% |
| White / Caucasian | 8,775 | 43.8% |
| Two or more Races | 1,043 | 5.2% |
| Some other Race | 1,586 | 7.9% |
| Total | 20,035 | 100.0% |
Ancestry in Whitehall
The most populous ancestries reported in Whitehall are German (1,893 | 9.5%), Subsaharan African (1,865 | 9.3%), Irish (1,404 | 7.0%), Mexican (1,056 | 5.3%), and English (999 | 5.0%), together accounting for 36.0% of all Whitehall residents.
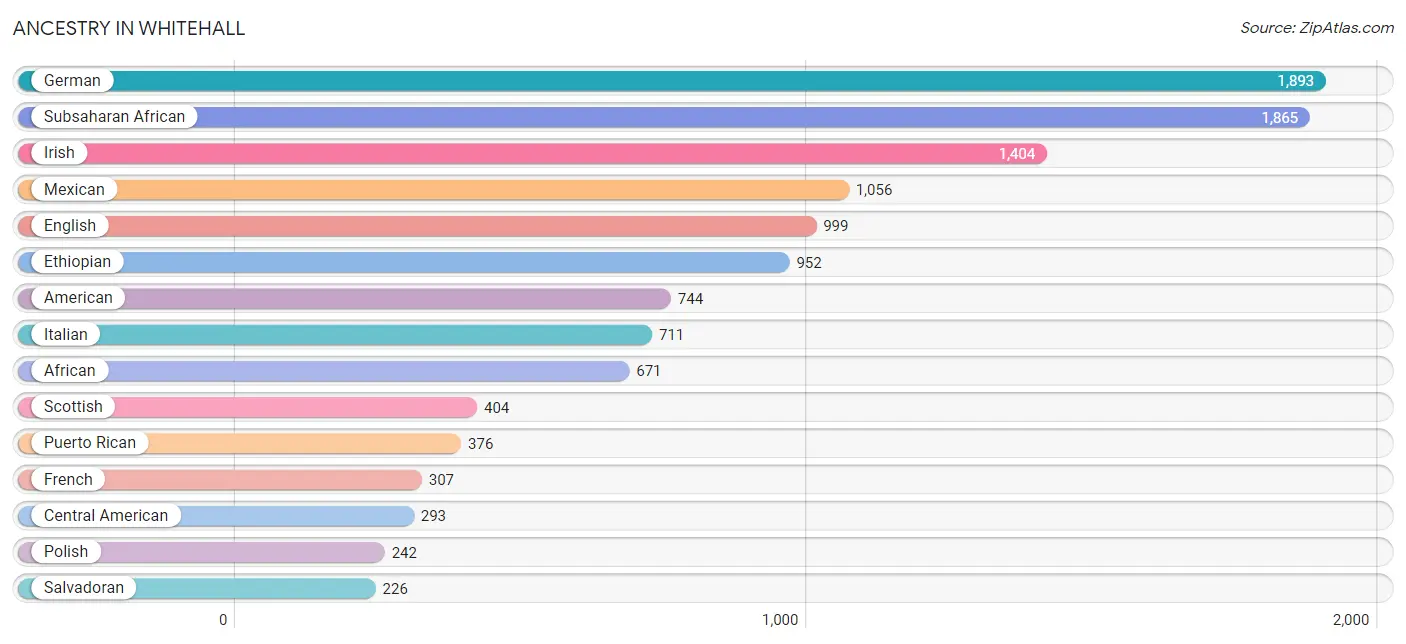
| Ancestry | # Population | % Population |
| African | 671 | 3.4% |
| American | 744 | 3.7% |
| Arab | 58 | 0.3% |
| Austrian | 19 | 0.1% |
| Belgian | 10 | 0.1% |
| Blackfeet | 2 | 0.0% |
| British | 115 | 0.6% |
| British West Indian | 31 | 0.2% |
| Canadian | 17 | 0.1% |
| Central American | 293 | 1.5% |
| Central American Indian | 80 | 0.4% |
| Cherokee | 79 | 0.4% |
| Cree | 3 | 0.0% |
| Croatian | 9 | 0.0% |
| Cuban | 10 | 0.1% |
| Czech | 113 | 0.6% |
| Danish | 8 | 0.0% |
| Delaware | 2 | 0.0% |
| Dominican | 38 | 0.2% |
| Dutch | 43 | 0.2% |
| Eastern European | 33 | 0.2% |
| Ecuadorian | 5 | 0.0% |
| English | 999 | 5.0% |
| Estonian | 20 | 0.1% |
| Ethiopian | 952 | 4.8% |
| European | 110 | 0.5% |
| Finnish | 7 | 0.0% |
| French | 307 | 1.5% |
| French Canadian | 54 | 0.3% |
| German | 1,893 | 9.5% |
| Ghanaian | 21 | 0.1% |
| Greek | 98 | 0.5% |
| Guatemalan | 48 | 0.2% |
| Guyanese | 2 | 0.0% |
| Haitian | 61 | 0.3% |
| Hungarian | 68 | 0.3% |
| Indian (Asian) | 38 | 0.2% |
| Irish | 1,404 | 7.0% |
| Italian | 711 | 3.5% |
| Jamaican | 70 | 0.4% |
| Japanese | 26 | 0.1% |
| Korean | 31 | 0.2% |
| Lithuanian | 55 | 0.3% |
| Macedonian | 12 | 0.1% |
| Mexican | 1,056 | 5.3% |
| Mexican American Indian | 8 | 0.0% |
| Moroccan | 58 | 0.3% |
| Nicaraguan | 19 | 0.1% |
| Nigerian | 115 | 0.6% |
| Norwegian | 7 | 0.0% |
| Pakistani | 8 | 0.0% |
| Pennsylvania German | 10 | 0.1% |
| Peruvian | 64 | 0.3% |
| Polish | 242 | 1.2% |
| Portuguese | 8 | 0.0% |
| Puerto Rican | 376 | 1.9% |
| Romanian | 23 | 0.1% |
| Salvadoran | 226 | 1.1% |
| Scandinavian | 73 | 0.4% |
| Scotch-Irish | 71 | 0.4% |
| Scottish | 404 | 2.0% |
| Seminole | 6 | 0.0% |
| Senegalese | 8 | 0.0% |
| Sioux | 4 | 0.0% |
| Slavic | 27 | 0.1% |
| Slovak | 11 | 0.1% |
| Somali | 18 | 0.1% |
| South American | 69 | 0.3% |
| Spanish | 158 | 0.8% |
| Subsaharan African | 1,865 | 9.3% |
| Swedish | 8 | 0.0% |
| Swiss | 93 | 0.5% |
| Thai | 49 | 0.2% |
| Ukrainian | 19 | 0.1% |
| Vietnamese | 49 | 0.2% |
| Welsh | 180 | 0.9% |
| West Indian | 39 | 0.2% | View All 77 Rows |
Immigrants in Whitehall
The most numerous immigrant groups reported in Whitehall came from Africa (1,996 | 10.0%), Eastern Africa (1,520 | 7.6%), Ethiopia (1,352 | 6.8%), Latin America (830 | 4.1%), and Central America (670 | 3.3%), together accounting for 31.8% of all Whitehall residents.
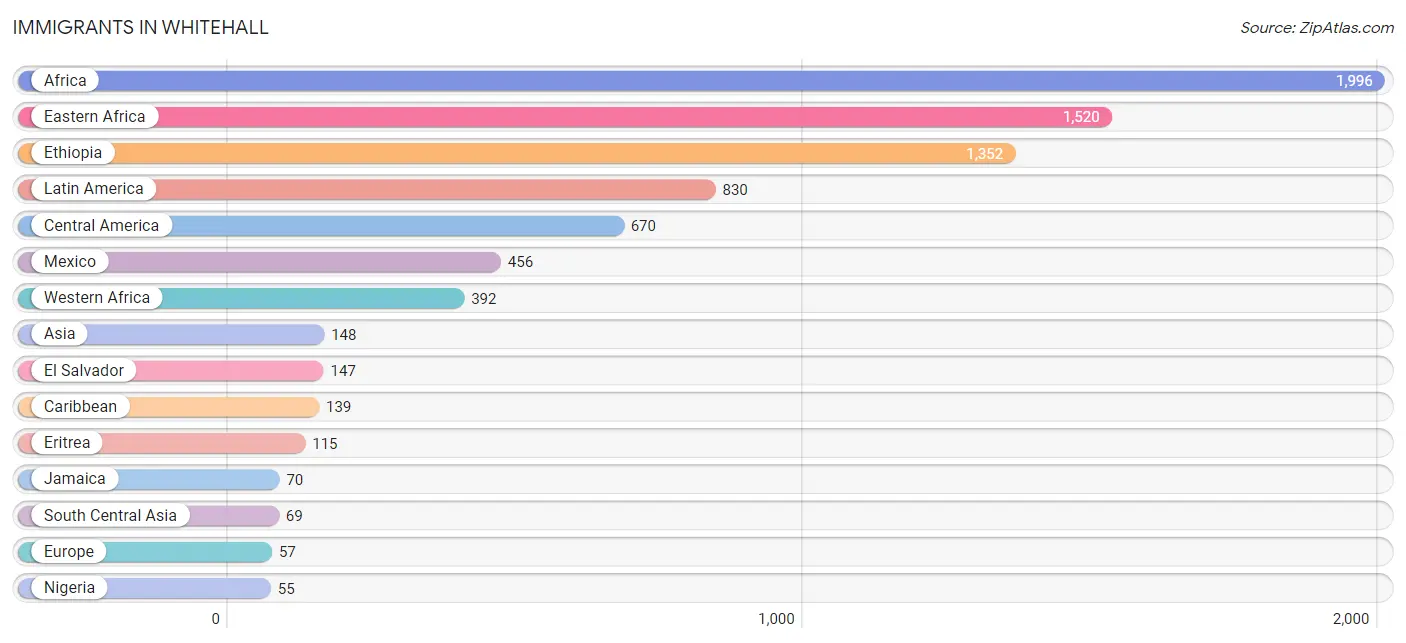
| Immigration Origin | # Population | % Population |
| Africa | 1,996 | 10.0% |
| Asia | 148 | 0.7% |
| Bangladesh | 40 | 0.2% |
| Belgium | 10 | 0.1% |
| Cambodia | 8 | 0.0% |
| Caribbean | 139 | 0.7% |
| Central America | 670 | 3.3% |
| China | 29 | 0.1% |
| Cuba | 10 | 0.1% |
| Dominica | 31 | 0.2% |
| Dominican Republic | 7 | 0.0% |
| Eastern Africa | 1,520 | 7.6% |
| Eastern Asia | 29 | 0.1% |
| Eastern Europe | 28 | 0.1% |
| El Salvador | 147 | 0.7% |
| England | 5 | 0.0% |
| Eritrea | 115 | 0.6% |
| Ethiopia | 1,352 | 6.8% |
| Europe | 57 | 0.3% |
| Germany | 14 | 0.1% |
| Ghana | 21 | 0.1% |
| Guatemala | 48 | 0.2% |
| Guyana | 2 | 0.0% |
| Haiti | 21 | 0.1% |
| Jamaica | 70 | 0.4% |
| Kenya | 53 | 0.3% |
| Latin America | 830 | 4.1% |
| Liberia | 27 | 0.1% |
| Mexico | 456 | 2.3% |
| Morocco | 23 | 0.1% |
| Nicaragua | 19 | 0.1% |
| Nigeria | 55 | 0.3% |
| Northern Africa | 43 | 0.2% |
| Northern Europe | 5 | 0.0% |
| Peru | 19 | 0.1% |
| Philippines | 27 | 0.1% |
| Poland | 9 | 0.0% |
| Senegal | 8 | 0.0% |
| Sierra Leone | 28 | 0.1% |
| South America | 21 | 0.1% |
| South Central Asia | 69 | 0.3% |
| South Eastern Asia | 50 | 0.3% |
| Sri Lanka | 29 | 0.1% |
| Sudan | 20 | 0.1% |
| Thailand | 15 | 0.1% |
| Ukraine | 19 | 0.1% |
| Western Africa | 392 | 2.0% |
| Western Europe | 24 | 0.1% | View All 48 Rows |
Sex and Age in Whitehall
Sex and Age in Whitehall
The most populous age groups in Whitehall are 50 to 54 Years (948 | 9.5%) for men and 35 to 39 Years (1,051 | 10.5%) for women.
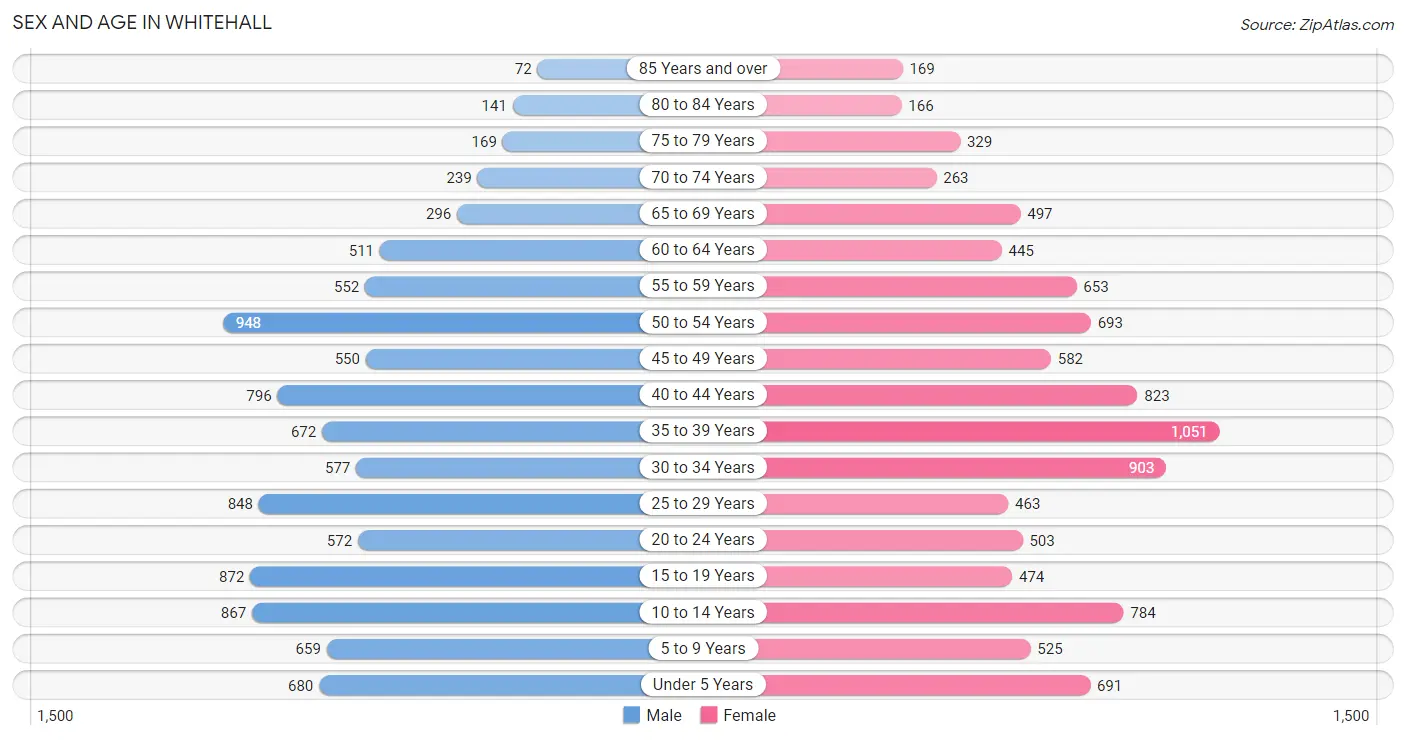
| Age Bracket | Male | Female |
| Under 5 Years | 680 (6.8%) | 691 (6.9%) |
| 5 to 9 Years | 659 (6.6%) | 525 (5.2%) |
| 10 to 14 Years | 867 (8.6%) | 784 (7.8%) |
| 15 to 19 Years | 872 (8.7%) | 474 (4.7%) |
| 20 to 24 Years | 572 (5.7%) | 503 (5.0%) |
| 25 to 29 Years | 848 (8.5%) | 463 (4.6%) |
| 30 to 34 Years | 577 (5.8%) | 903 (9.0%) |
| 35 to 39 Years | 672 (6.7%) | 1,051 (10.5%) |
| 40 to 44 Years | 796 (7.9%) | 823 (8.2%) |
| 45 to 49 Years | 550 (5.5%) | 582 (5.8%) |
| 50 to 54 Years | 948 (9.5%) | 693 (6.9%) |
| 55 to 59 Years | 552 (5.5%) | 653 (6.5%) |
| 60 to 64 Years | 511 (5.1%) | 445 (4.4%) |
| 65 to 69 Years | 296 (2.9%) | 497 (5.0%) |
| 70 to 74 Years | 239 (2.4%) | 263 (2.6%) |
| 75 to 79 Years | 169 (1.7%) | 329 (3.3%) |
| 80 to 84 Years | 141 (1.4%) | 166 (1.7%) |
| 85 Years and over | 72 (0.7%) | 169 (1.7%) |
| Total | 10,021 (100.0%) | 10,014 (100.0%) |
Families and Households in Whitehall
Median Family Size in Whitehall
The median family size in Whitehall is 3.20 persons per family, with single female/mother families (1,570 | 33.1%) accounting for the largest median family size of 3.33 persons per family. On the other hand, single male/father families (846 | 17.8%) represent the smallest median family size with 2.63 persons per family.
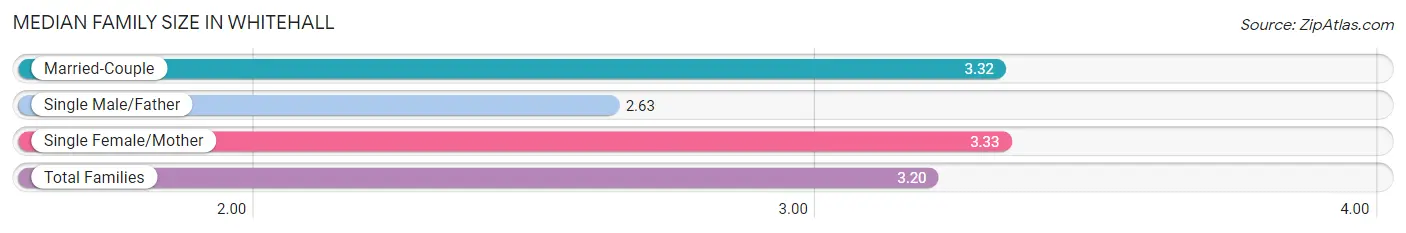
| Family Type | # Families | Family Size |
| Married-Couple | 2,327 (49.1%) | 3.32 |
| Single Male/Father | 846 (17.8%) | 2.63 |
| Single Female/Mother | 1,570 (33.1%) | 3.33 |
| Total Families | 4,743 (100.0%) | 3.20 |
Median Household Size in Whitehall
The median household size in Whitehall is 2.46 persons per household, with single female/mother households (1,570 | 19.3%) accounting for the largest median household size of 3.52 persons per household. non-family households (3,388 | 41.7%) represent the smallest median household size with 1.21 persons per household.
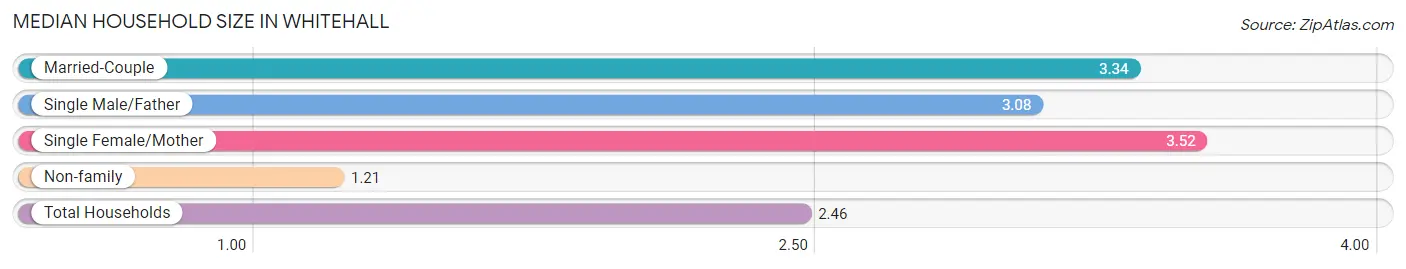
| Household Type | # Households | Household Size |
| Married-Couple | 2,327 (28.6%) | 3.34 |
| Single Male/Father | 846 (10.4%) | 3.08 |
| Single Female/Mother | 1,570 (19.3%) | 3.52 |
| Non-family | 3,388 (41.7%) | 1.21 |
| Total Households | 8,131 (100.0%) | 2.46 |
Household Size by Marriage Status in Whitehall
Out of a total of 8,131 households in Whitehall, 4,743 (58.3%) are family households, while 3,388 (41.7%) are nonfamily households. The most numerous type of family households are 2-person households, comprising 1,766, and the most common type of nonfamily households are 1-person households, comprising 2,895.
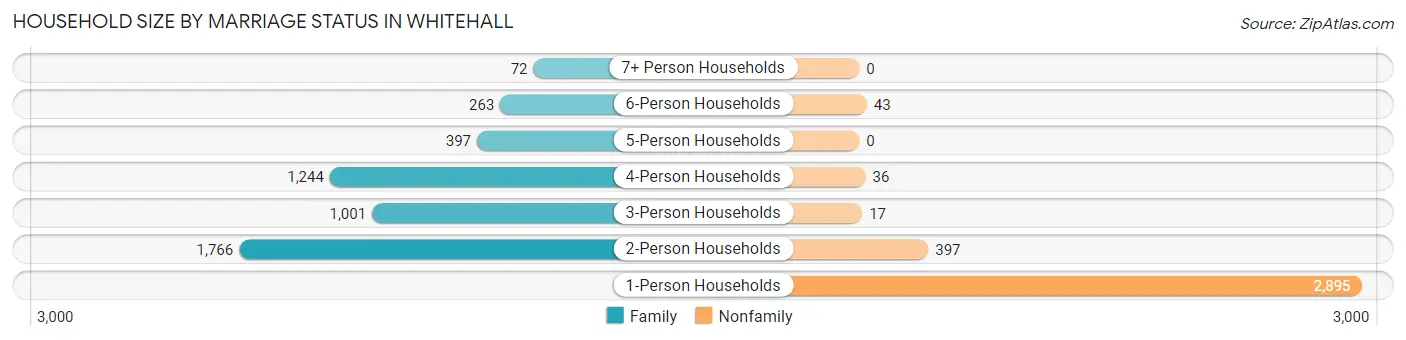
| Household Size | Family Households | Nonfamily Households |
| 1-Person Households | - | 2,895 (35.6%) |
| 2-Person Households | 1,766 (21.7%) | 397 (4.9%) |
| 3-Person Households | 1,001 (12.3%) | 17 (0.2%) |
| 4-Person Households | 1,244 (15.3%) | 36 (0.4%) |
| 5-Person Households | 397 (4.9%) | 0 (0.0%) |
| 6-Person Households | 263 (3.2%) | 43 (0.5%) |
| 7+ Person Households | 72 (0.9%) | 0 (0.0%) |
| Total | 4,743 (58.3%) | 3,388 (41.7%) |
Female Fertility in Whitehall
Fertility by Age in Whitehall
Average fertility rate in Whitehall is 46.0 births per 1,000 women. Women in the age bracket of 20 to 34 years have the highest fertility rate with 100.0 births per 1,000 women. Women in the age bracket of 20 to 34 years acount for 83.5% of all women with births.
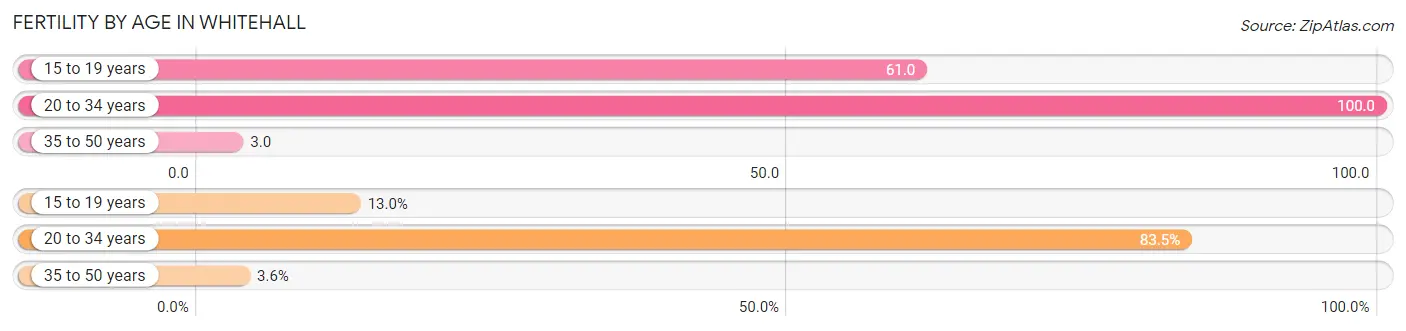
| Age Bracket | Women with Births | Births / 1,000 Women |
| 15 to 19 years | 29 (13.0%) | 61.0 |
| 20 to 34 years | 187 (83.5%) | 100.0 |
| 35 to 50 years | 8 (3.6%) | 3.0 |
| Total | 224 (100.0%) | 46.0 |
Fertility by Age by Marriage Status in Whitehall
11.2% of women with births (224) in Whitehall are married. The highest percentage of unmarried women with births falls into 15 to 19 years age bracket with 100.0% of them unmarried at the time of birth, while the lowest percentage of unmarried women with births belong to 35 to 50 years age bracket with 0.0% of them unmarried.
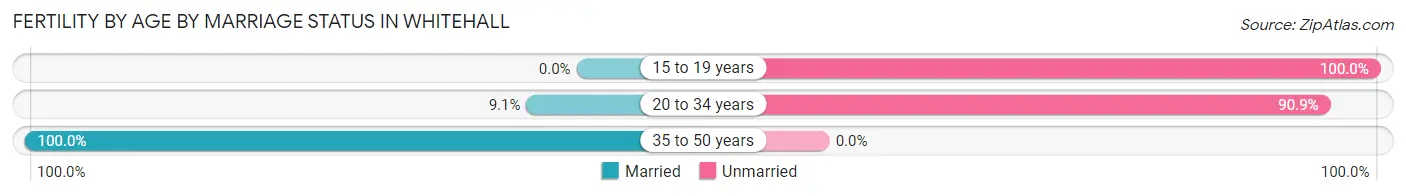
| Age Bracket | Married | Unmarried |
| 15 to 19 years | 0 (0.0%) | 29 (100.0%) |
| 20 to 34 years | 17 (9.1%) | 170 (90.9%) |
| 35 to 50 years | 8 (100.0%) | 0 (0.0%) |
| Total | 25 (11.2%) | 199 (88.8%) |
Fertility by Education in Whitehall
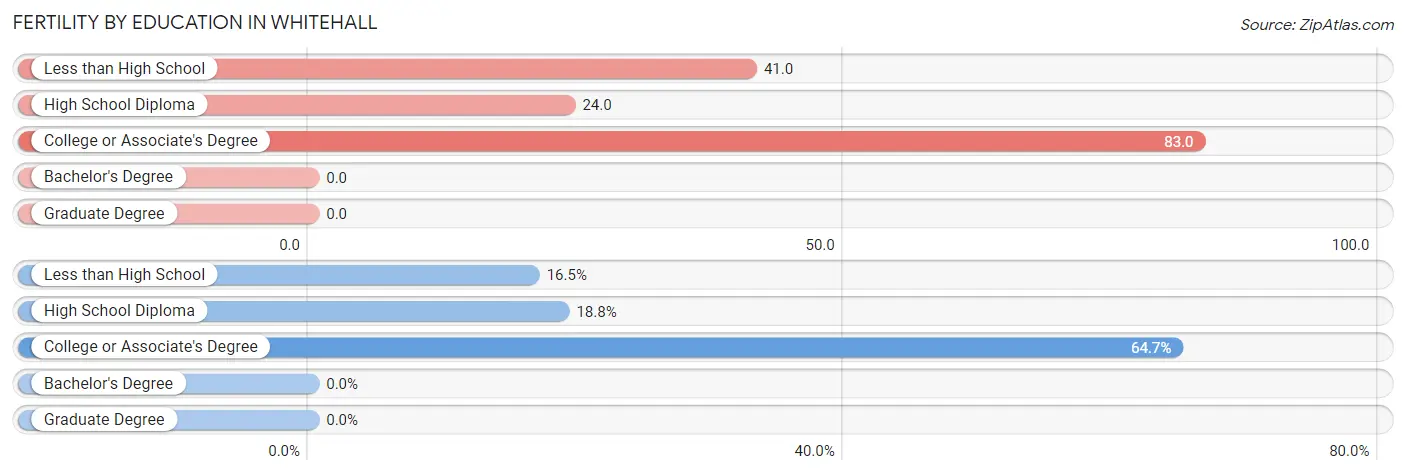
| Educational Attainment | Women with Births | Births / 1,000 Women |
| Less than High School | 37 (16.5%) | 41.0 |
| High School Diploma | 42 (18.8%) | 24.0 |
| College or Associate's Degree | 145 (64.7%) | 83.0 |
| Bachelor's Degree | 0 (0.0%) | 0.0 |
| Graduate Degree | 0 (0.0%) | 0.0 |
| Total | 224 (100.0%) | 46.0 |
Fertility by Education by Marriage Status in Whitehall
88.8% of women with births in Whitehall are unmarried. Women with the educational attainment of less than high school are most likely to be married with 21.6% of them married at childbirth, while women with the educational attainment of high school diploma are least likely to be married with 100.0% of them unmarried at childbirth.
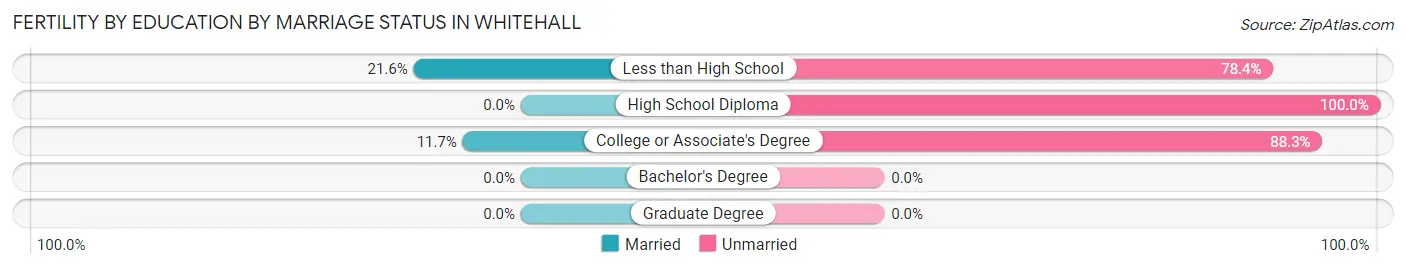
| Educational Attainment | Married | Unmarried |
| Less than High School | 8 (21.6%) | 29 (78.4%) |
| High School Diploma | 0 (0.0%) | 42 (100.0%) |
| College or Associate's Degree | 17 (11.7%) | 128 (88.3%) |
| Bachelor's Degree | 0 (0.0%) | 0 (0.0%) |
| Graduate Degree | 0 (0.0%) | 0 (0.0%) |
| Total | 25 (11.2%) | 199 (88.8%) |
Employment Characteristics in Whitehall
Employment by Class of Employer in Whitehall
Among the 9,141 employed individuals in Whitehall, private company employees (7,129 | 78.0%), not-for-profit organizations (544 | 5.9%), and local government employees (470 | 5.1%) make up the most common classes of employment.
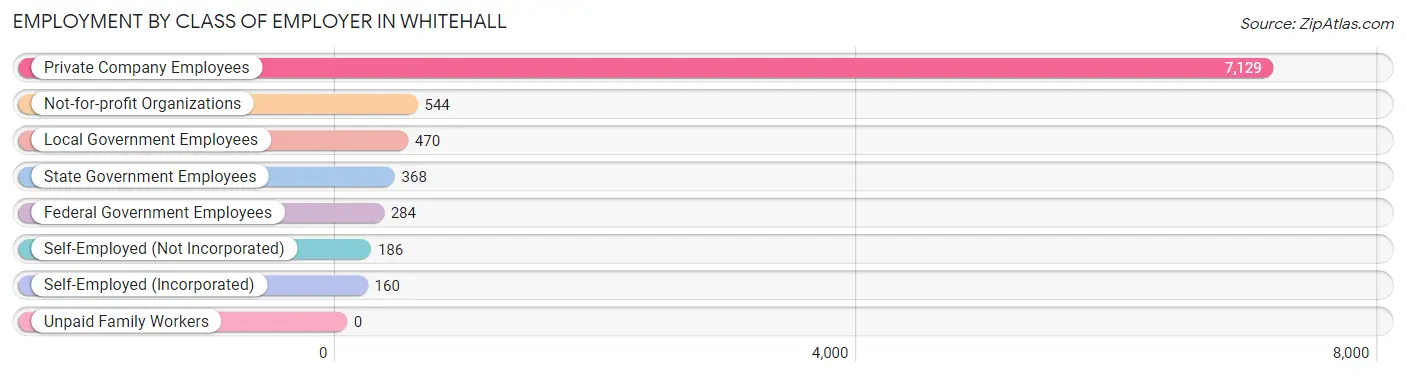
| Employer Class | # Employees | % Employees |
| Private Company Employees | 7,129 | 78.0% |
| Self-Employed (Incorporated) | 160 | 1.8% |
| Self-Employed (Not Incorporated) | 186 | 2.0% |
| Not-for-profit Organizations | 544 | 5.9% |
| Local Government Employees | 470 | 5.1% |
| State Government Employees | 368 | 4.0% |
| Federal Government Employees | 284 | 3.1% |
| Unpaid Family Workers | 0 | 0.0% |
| Total | 9,141 | 100.0% |
Employment Status by Age in Whitehall
According to the labor force statistics for Whitehall, out of the total population over 16 years of age (15,581), 67.6% or 10,533 individuals are in the labor force, with 10.6% or 1,116 of them unemployed. The age group with the highest labor force participation rate is 25 to 29 years, with 90.4% or 1,185 individuals in the labor force. Within the labor force, the 75 years and over age range has the highest percentage of unemployed individuals, with 32.5% or 40 of them being unemployed.
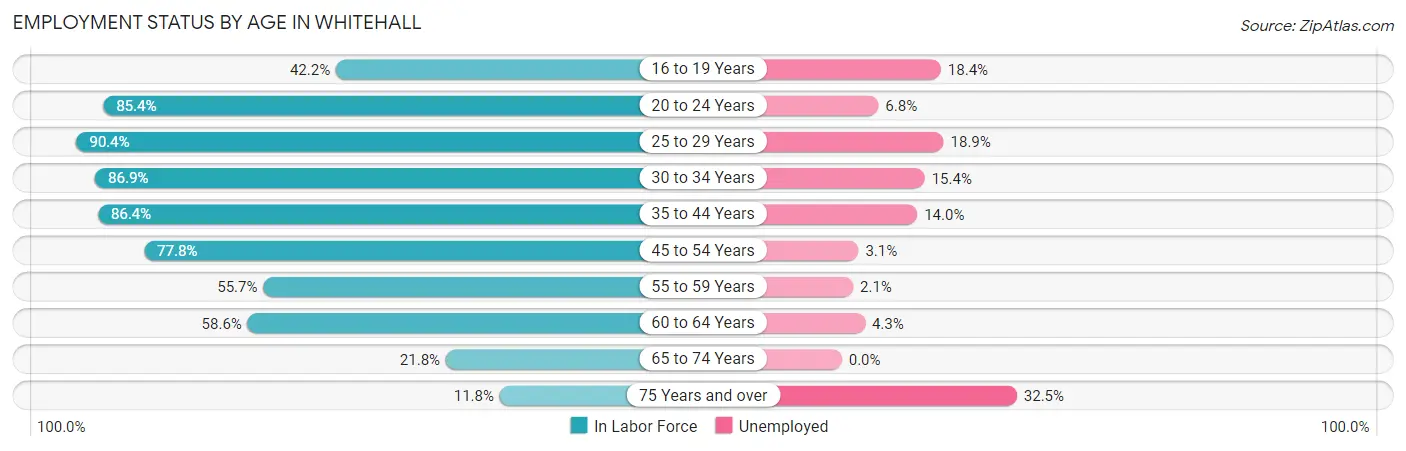
| Age Bracket | In Labor Force | Unemployed |
| 16 to 19 Years | 463 (42.2%) | 85 (18.4%) |
| 20 to 24 Years | 918 (85.4%) | 62 (6.8%) |
| 25 to 29 Years | 1,185 (90.4%) | 224 (18.9%) |
| 30 to 34 Years | 1,286 (86.9%) | 198 (15.4%) |
| 35 to 44 Years | 2,887 (86.4%) | 404 (14.0%) |
| 45 to 54 Years | 2,157 (77.8%) | 67 (3.1%) |
| 55 to 59 Years | 671 (55.7%) | 14 (2.1%) |
| 60 to 64 Years | 560 (58.6%) | 24 (4.3%) |
| 65 to 74 Years | 282 (21.8%) | 0 (0.0%) |
| 75 Years and over | 123 (11.8%) | 40 (32.5%) |
| Total | 10,533 (67.6%) | 1,116 (10.6%) |
Employment Status by Educational Attainment in Whitehall
According to labor force statistics for Whitehall, 79.0% of individuals (8,743) out of the total population between 25 and 64 years of age (11,067) are in the labor force, with 10.7% or 936 of them being unemployed. The group with the highest labor force participation rate are those with the educational attainment of bachelor's degree or higher, with 88.9% or 1,372 individuals in the labor force. Within the labor force, individuals with high school diploma education have the highest percentage of unemployment, with 14.5% or 564 of them being unemployed.
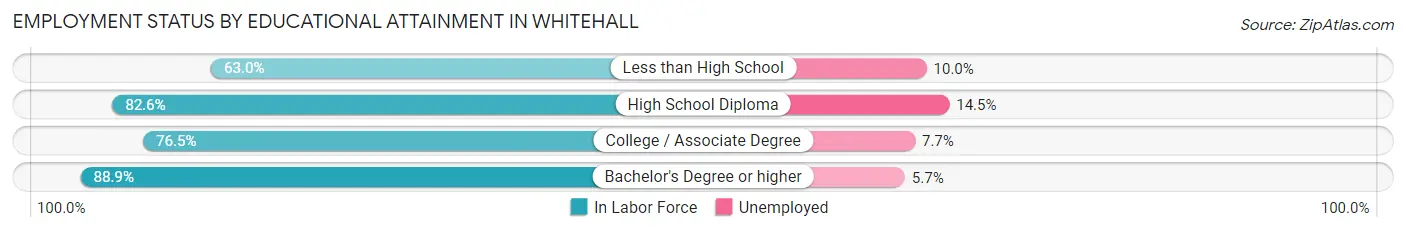
| Educational Attainment | In Labor Force | Unemployed |
| Less than High School | 910 (63.0%) | 144 (10.0%) |
| High School Diploma | 3,893 (82.6%) | 683 (14.5%) |
| College / Associate Degree | 2,575 (76.5%) | 259 (7.7%) |
| Bachelor's Degree or higher | 1,372 (88.9%) | 88 (5.7%) |
| Total | 8,743 (79.0%) | 1,184 (10.7%) |
Employment Occupations by Sex in Whitehall
Management, Business, Science and Arts Occupations
The most common Management, Business, Science and Arts occupations in Whitehall are Management (747 | 8.0%), Community & Social Service (541 | 5.8%), Education Instruction & Library (377 | 4.0%), Business & Financial (333 | 3.5%), and Computers, Engineering & Science (272 | 2.9%).
Management, Business, Science and Arts Occupations by Sex
Within the Management, Business, Science and Arts occupations in Whitehall, the most male-oriented occupations are Arts, Media & Entertainment (88.5%), Architecture & Engineering (76.5%), and Computers & Mathematics (75.0%), while the most female-oriented occupations are Health Technologists (100.0%), Health Diagnosing & Treating (84.5%), and Education Instruction & Library (81.4%).
| Occupation | Male | Female |
| Management | 493 (66.0%) | 254 (34.0%) |
| Business & Financial | 171 (51.3%) | 162 (48.6%) |
| Computers, Engineering & Science | 199 (73.2%) | 73 (26.8%) |
| Computers & Mathematics | 114 (75.0%) | 38 (25.0%) |
| Architecture & Engineering | 52 (76.5%) | 16 (23.5%) |
| Life, Physical & Social Science | 33 (63.5%) | 19 (36.5%) |
| Community & Social Service | 158 (29.2%) | 383 (70.8%) |
| Education, Arts & Media | 21 (30.4%) | 48 (69.6%) |
| Legal Services & Support | 13 (38.2%) | 21 (61.8%) |
| Education Instruction & Library | 70 (18.6%) | 307 (81.4%) |
| Arts, Media & Entertainment | 54 (88.5%) | 7 (11.5%) |
| Health Diagnosing & Treating | 32 (15.5%) | 174 (84.5%) |
| Health Technologists | 0 (0.0%) | 138 (100.0%) |
| Total (Category) | 1,053 (50.2%) | 1,046 (49.8%) |
| Total (Overall) | 4,897 (52.1%) | 4,505 (47.9%) |
Services Occupations
The most common Services occupations in Whitehall are Cleaning & Maintenance (598 | 6.4%), Food Preparation & Serving (543 | 5.8%), Healthcare Support (425 | 4.5%), Personal Care & Service (195 | 2.1%), and Security & Protection (92 | 1.0%).
Services Occupations by Sex
Within the Services occupations in Whitehall, the most male-oriented occupations are Security & Protection (100.0%), Firefighting & Prevention (100.0%), and Law Enforcement (100.0%), while the most female-oriented occupations are Healthcare Support (88.2%), Personal Care & Service (77.4%), and Food Preparation & Serving (49.5%).
| Occupation | Male | Female |
| Healthcare Support | 50 (11.8%) | 375 (88.2%) |
| Security & Protection | 92 (100.0%) | 0 (0.0%) |
| Firefighting & Prevention | 21 (100.0%) | 0 (0.0%) |
| Law Enforcement | 71 (100.0%) | 0 (0.0%) |
| Food Preparation & Serving | 274 (50.5%) | 269 (49.5%) |
| Cleaning & Maintenance | 354 (59.2%) | 244 (40.8%) |
| Personal Care & Service | 44 (22.6%) | 151 (77.4%) |
| Total (Category) | 814 (43.9%) | 1,039 (56.1%) |
| Total (Overall) | 4,897 (52.1%) | 4,505 (47.9%) |
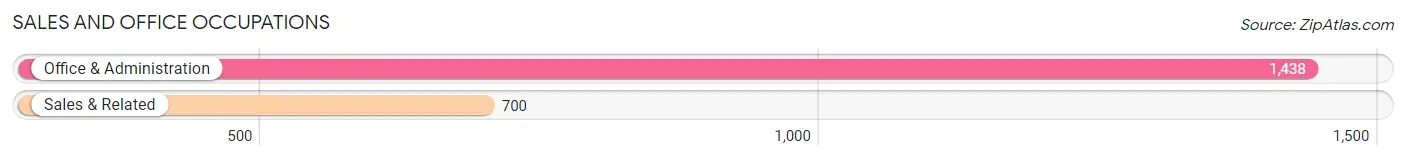
Sales and Office Occupations
The most common Sales and Office occupations in Whitehall are Office & Administration (1,438 | 15.3%), and Sales & Related (700 | 7.4%).
Sales and Office Occupations by Sex
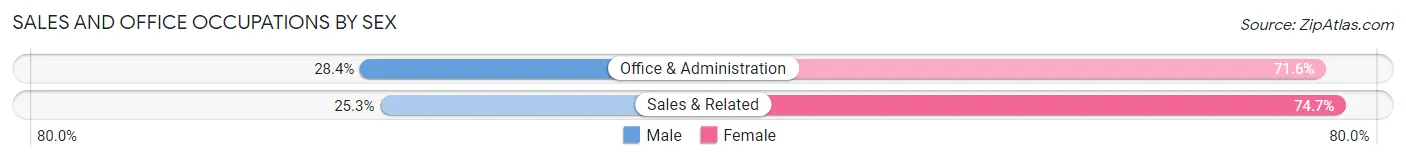
| Occupation | Male | Female |
| Sales & Related | 177 (25.3%) | 523 (74.7%) |
| Office & Administration | 408 (28.4%) | 1,030 (71.6%) |
| Total (Category) | 585 (27.4%) | 1,553 (72.6%) |
| Total (Overall) | 4,897 (52.1%) | 4,505 (47.9%) |
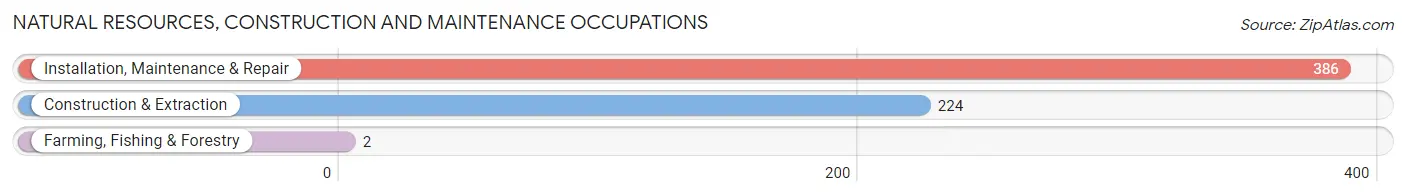
Natural Resources, Construction and Maintenance Occupations
The most common Natural Resources, Construction and Maintenance occupations in Whitehall are Installation, Maintenance & Repair (386 | 4.1%), Construction & Extraction (224 | 2.4%), and Farming, Fishing & Forestry (2 | 0.0%).
Natural Resources, Construction and Maintenance Occupations by Sex
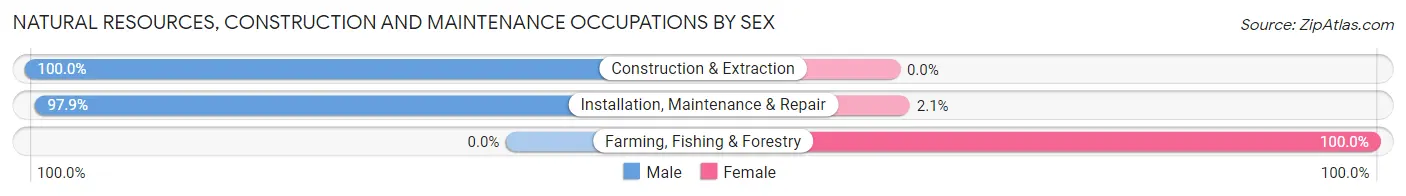
| Occupation | Male | Female |
| Farming, Fishing & Forestry | 0 (0.0%) | 2 (100.0%) |
| Construction & Extraction | 224 (100.0%) | 0 (0.0%) |
| Installation, Maintenance & Repair | 378 (97.9%) | 8 (2.1%) |
| Total (Category) | 602 (98.4%) | 10 (1.6%) |
| Total (Overall) | 4,897 (52.1%) | 4,505 (47.9%) |
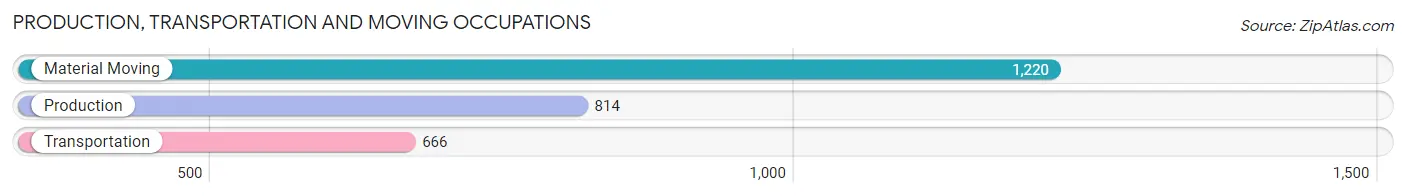
Production, Transportation and Moving Occupations
The most common Production, Transportation and Moving occupations in Whitehall are Material Moving (1,220 | 13.0%), Production (814 | 8.7%), and Transportation (666 | 7.1%).
Production, Transportation and Moving Occupations by Sex
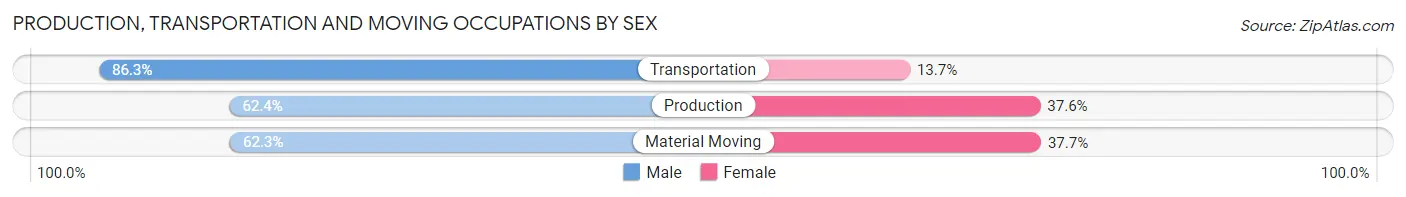
| Occupation | Male | Female |
| Production | 508 (62.4%) | 306 (37.6%) |
| Transportation | 575 (86.3%) | 91 (13.7%) |
| Material Moving | 760 (62.3%) | 460 (37.7%) |
| Total (Category) | 1,843 (68.3%) | 857 (31.7%) |
| Total (Overall) | 4,897 (52.1%) | 4,505 (47.9%) |
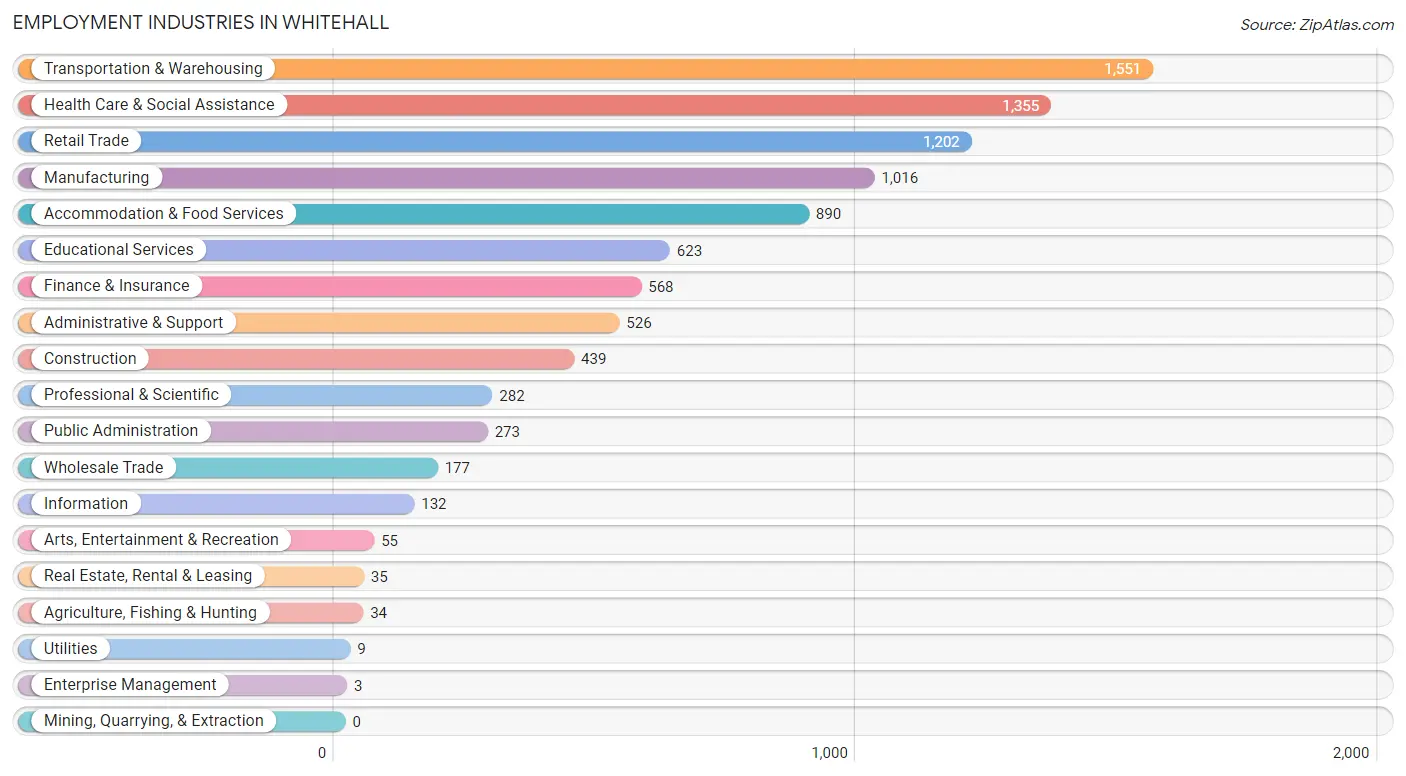
Employment Industries by Sex in Whitehall
Employment Industries in Whitehall
The major employment industries in Whitehall include Transportation & Warehousing (1,551 | 16.5%), Health Care & Social Assistance (1,355 | 14.4%), Retail Trade (1,202 | 12.8%), Manufacturing (1,016 | 10.8%), and Accommodation & Food Services (890 | 9.5%).
Employment Industries by Sex in Whitehall
The Whitehall industries that see more men than women are Agriculture, Fishing & Hunting (100.0%), Utilities (100.0%), and Construction (88.4%), whereas the industries that tend to have a higher number of women are Enterprise Management (100.0%), Health Care & Social Assistance (78.2%), and Finance & Insurance (76.2%).
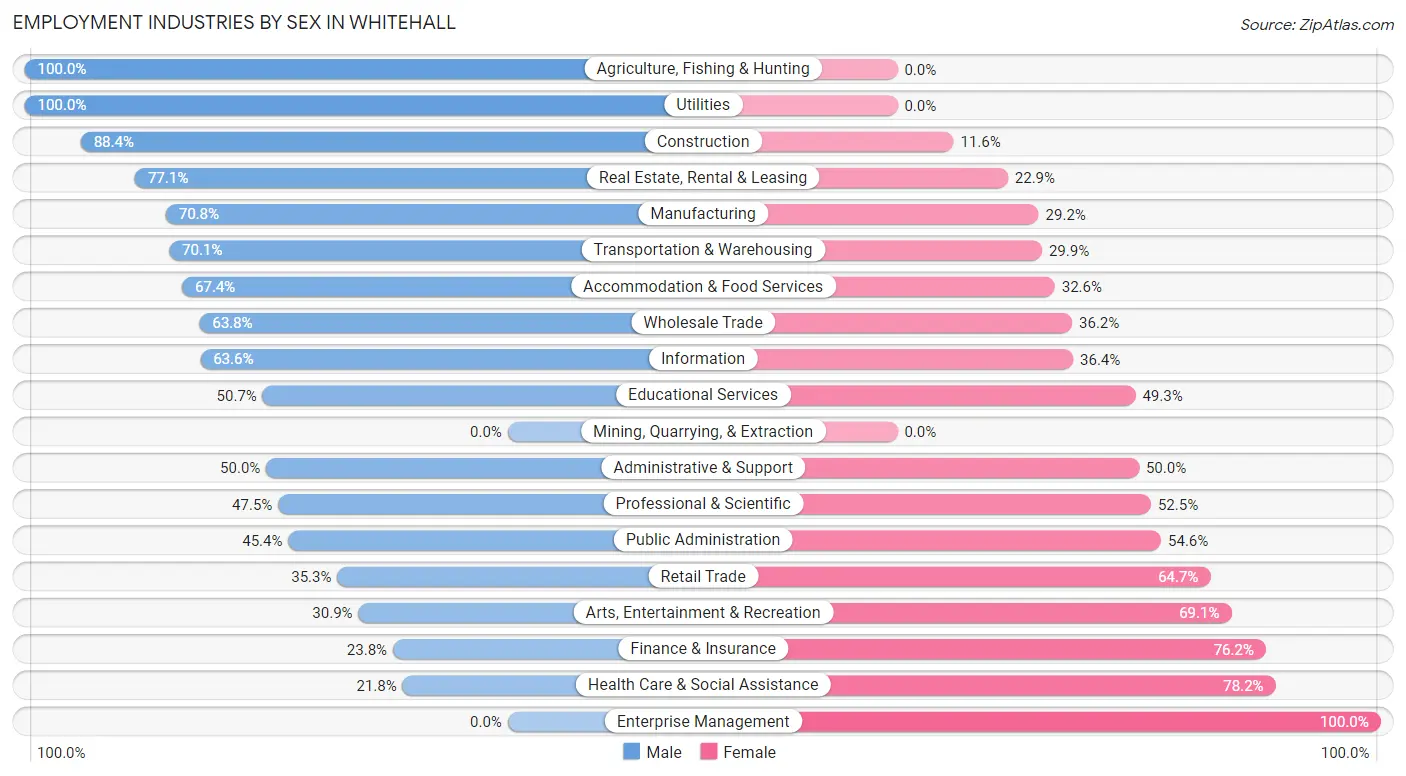
| Industry | Male | Female |
| Agriculture, Fishing & Hunting | 34 (100.0%) | 0 (0.0%) |
| Mining, Quarrying, & Extraction | 0 (0.0%) | 0 (0.0%) |
| Construction | 388 (88.4%) | 51 (11.6%) |
| Manufacturing | 719 (70.8%) | 297 (29.2%) |
| Wholesale Trade | 113 (63.8%) | 64 (36.2%) |
| Retail Trade | 424 (35.3%) | 778 (64.7%) |
| Transportation & Warehousing | 1,087 (70.1%) | 464 (29.9%) |
| Utilities | 9 (100.0%) | 0 (0.0%) |
| Information | 84 (63.6%) | 48 (36.4%) |
| Finance & Insurance | 135 (23.8%) | 433 (76.2%) |
| Real Estate, Rental & Leasing | 27 (77.1%) | 8 (22.9%) |
| Professional & Scientific | 134 (47.5%) | 148 (52.5%) |
| Enterprise Management | 0 (0.0%) | 3 (100.0%) |
| Administrative & Support | 263 (50.0%) | 263 (50.0%) |
| Educational Services | 316 (50.7%) | 307 (49.3%) |
| Health Care & Social Assistance | 295 (21.8%) | 1,060 (78.2%) |
| Arts, Entertainment & Recreation | 17 (30.9%) | 38 (69.1%) |
| Accommodation & Food Services | 600 (67.4%) | 290 (32.6%) |
| Public Administration | 124 (45.4%) | 149 (54.6%) |
| Total | 4,897 (52.1%) | 4,505 (47.9%) |
Education in Whitehall
School Enrollment in Whitehall
The most common levels of schooling among the 4,531 students in Whitehall are middle school (1,420 | 31.3%), elementary school (1,047 | 23.1%), and high school (995 | 22.0%).
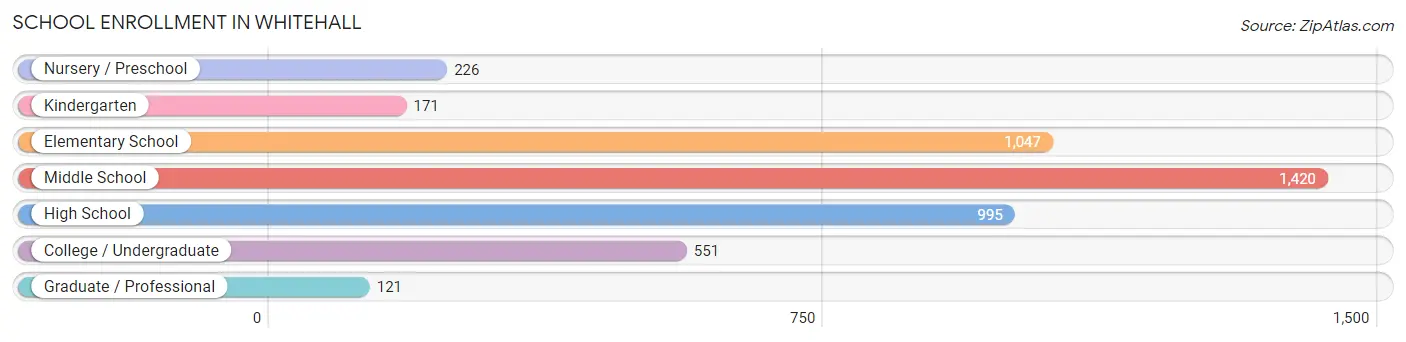
| School Level | # Students | % Students |
| Nursery / Preschool | 226 | 5.0% |
| Kindergarten | 171 | 3.8% |
| Elementary School | 1,047 | 23.1% |
| Middle School | 1,420 | 31.3% |
| High School | 995 | 22.0% |
| College / Undergraduate | 551 | 12.2% |
| Graduate / Professional | 121 | 2.7% |
| Total | 4,531 | 100.0% |
School Enrollment by Age by Funding Source in Whitehall
Out of a total of 4,531 students who are enrolled in schools in Whitehall, 530 (11.7%) attend a private institution, while the remaining 4,001 (88.3%) are enrolled in public schools. The age group of 35 years and over has the highest likelihood of being enrolled in private schools, with 88 (41.1% in the age bracket) enrolled. Conversely, the age group of 10 to 14 year olds has the lowest likelihood of being enrolled in a private school, with 1,569 (97.5% in the age bracket) attending a public institution.
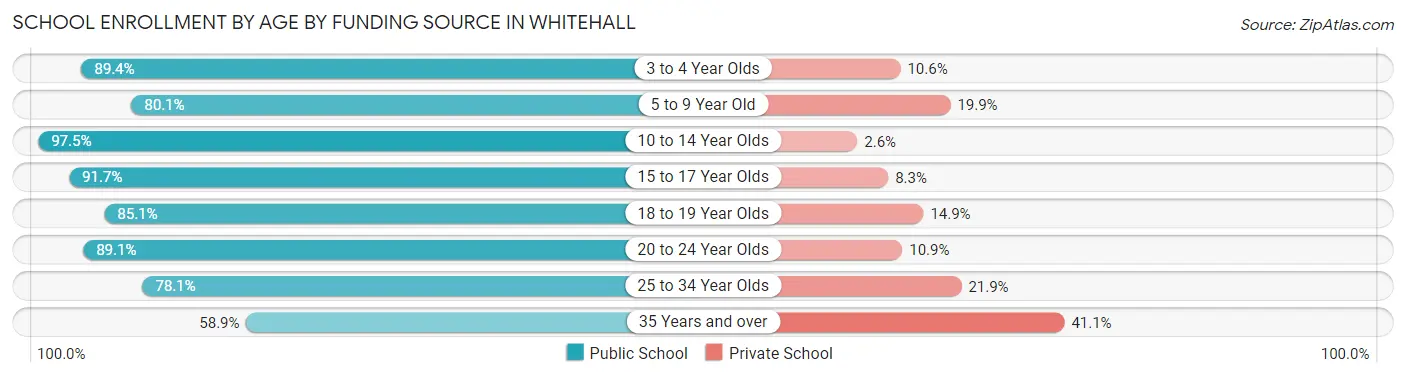
| Age Bracket | Public School | Private School |
| 3 to 4 Year Olds | 169 (89.4%) | 20 (10.6%) |
| 5 to 9 Year Old | 902 (80.1%) | 224 (19.9%) |
| 10 to 14 Year Olds | 1,569 (97.5%) | 41 (2.5%) |
| 15 to 17 Year Olds | 696 (91.7%) | 63 (8.3%) |
| 18 to 19 Year Olds | 212 (85.1%) | 37 (14.9%) |
| 20 to 24 Year Olds | 204 (89.1%) | 25 (10.9%) |
| 25 to 34 Year Olds | 121 (78.1%) | 34 (21.9%) |
| 35 Years and over | 126 (58.9%) | 88 (41.1%) |
| Total | 4,001 (88.3%) | 530 (11.7%) |
Educational Attainment by Field of Study in Whitehall
Business (353 | 16.3%), education (352 | 16.3%), arts & humanities (297 | 13.8%), social sciences (223 | 10.3%), and science & technology (204 | 9.4%) are the most common fields of study among 2,160 individuals in Whitehall who have obtained a bachelor's degree or higher.
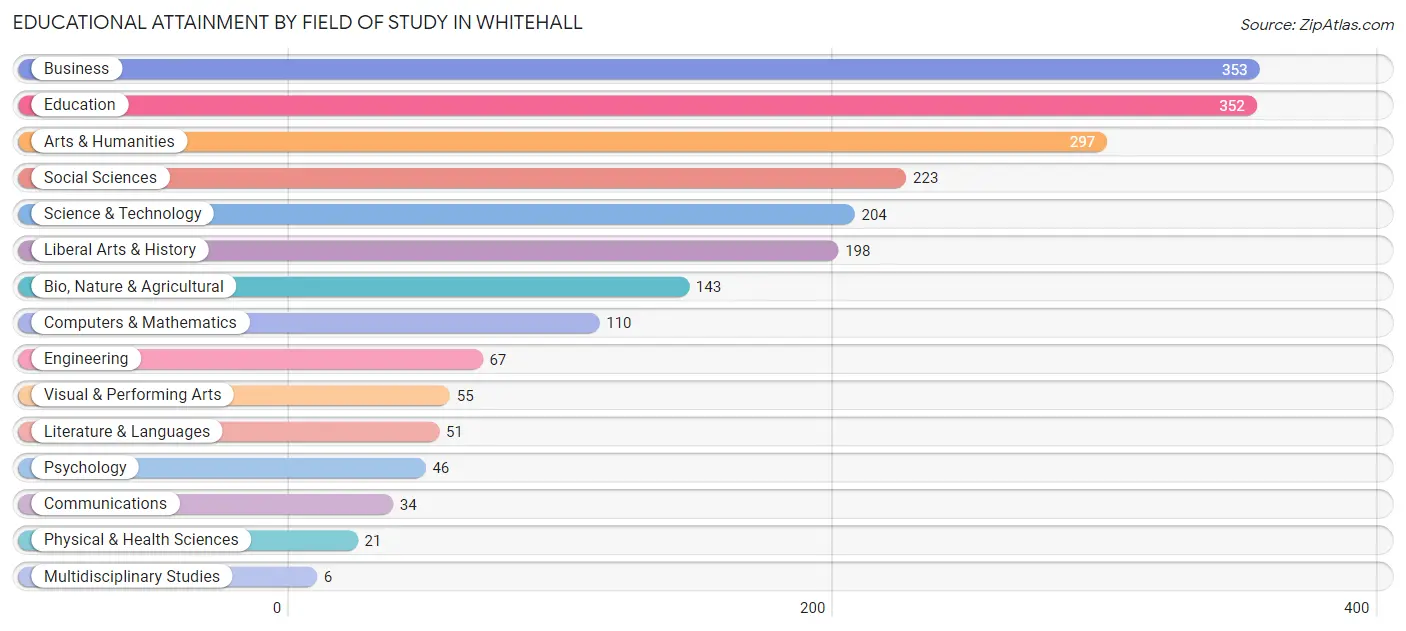
| Field of Study | # Graduates | % Graduates |
| Computers & Mathematics | 110 | 5.1% |
| Bio, Nature & Agricultural | 143 | 6.6% |
| Physical & Health Sciences | 21 | 1.0% |
| Psychology | 46 | 2.1% |
| Social Sciences | 223 | 10.3% |
| Engineering | 67 | 3.1% |
| Multidisciplinary Studies | 6 | 0.3% |
| Science & Technology | 204 | 9.4% |
| Business | 353 | 16.3% |
| Education | 352 | 16.3% |
| Literature & Languages | 51 | 2.4% |
| Liberal Arts & History | 198 | 9.2% |
| Visual & Performing Arts | 55 | 2.5% |
| Communications | 34 | 1.6% |
| Arts & Humanities | 297 | 13.8% |
| Total | 2,160 | 100.0% |
Transportation & Commute in Whitehall
Vehicle Availability by Sex in Whitehall
The most prevalent vehicle ownership categories in Whitehall are males with 2 vehicles (2,196, accounting for 46.3%) and females with 2 vehicles (1,422, making up 49.9%).
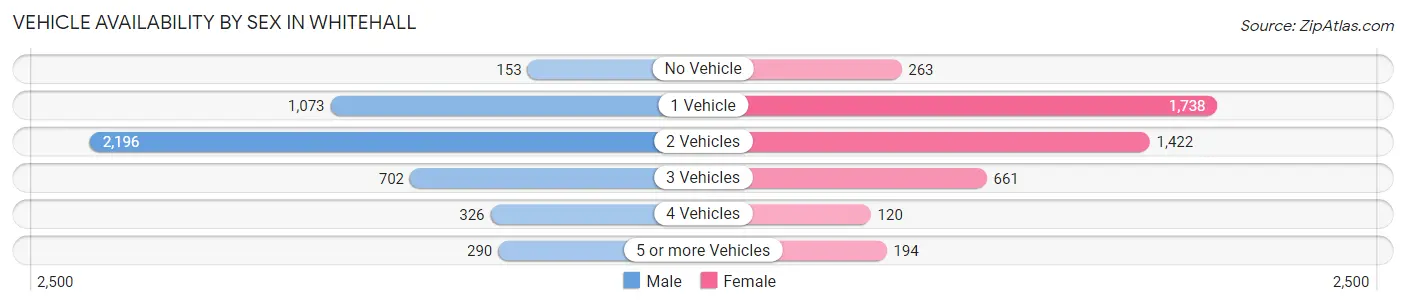
| Vehicles Available | Male | Female |
| No Vehicle | 153 (3.2%) | 263 (6.0%) |
| 1 Vehicle | 1,073 (22.6%) | 1,738 (39.5%) |
| 2 Vehicles | 2,196 (46.3%) | 1,422 (32.3%) |
| 3 Vehicles | 702 (14.8%) | 661 (15.0%) |
| 4 Vehicles | 326 (6.9%) | 120 (2.7%) |
| 5 or more Vehicles | 290 (6.1%) | 194 (4.4%) |
| Total | 4,740 (100.0%) | 4,398 (100.0%) |
Commute Time in Whitehall
The most frequently occuring commute durations in Whitehall are 20 to 24 minutes (1,926 commuters, 22.7%), 30 to 34 minutes (1,570 commuters, 18.5%), and 15 to 19 minutes (1,201 commuters, 14.1%).
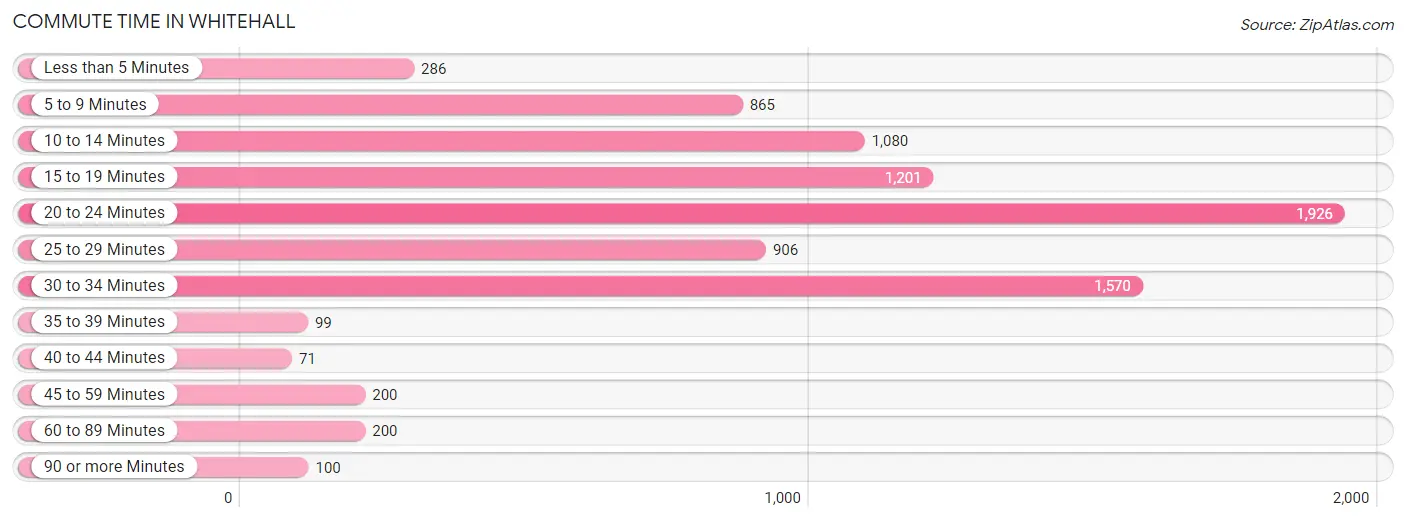
| Commute Time | # Commuters | % Commuters |
| Less than 5 Minutes | 286 | 3.4% |
| 5 to 9 Minutes | 865 | 10.2% |
| 10 to 14 Minutes | 1,080 | 12.7% |
| 15 to 19 Minutes | 1,201 | 14.1% |
| 20 to 24 Minutes | 1,926 | 22.7% |
| 25 to 29 Minutes | 906 | 10.6% |
| 30 to 34 Minutes | 1,570 | 18.5% |
| 35 to 39 Minutes | 99 | 1.2% |
| 40 to 44 Minutes | 71 | 0.8% |
| 45 to 59 Minutes | 200 | 2.4% |
| 60 to 89 Minutes | 200 | 2.4% |
| 90 or more Minutes | 100 | 1.2% |
Commute Time by Sex in Whitehall
The most common commute times in Whitehall are 20 to 24 minutes (894 commuters, 19.8%) for males and 20 to 24 minutes (1,032 commuters, 25.8%) for females.
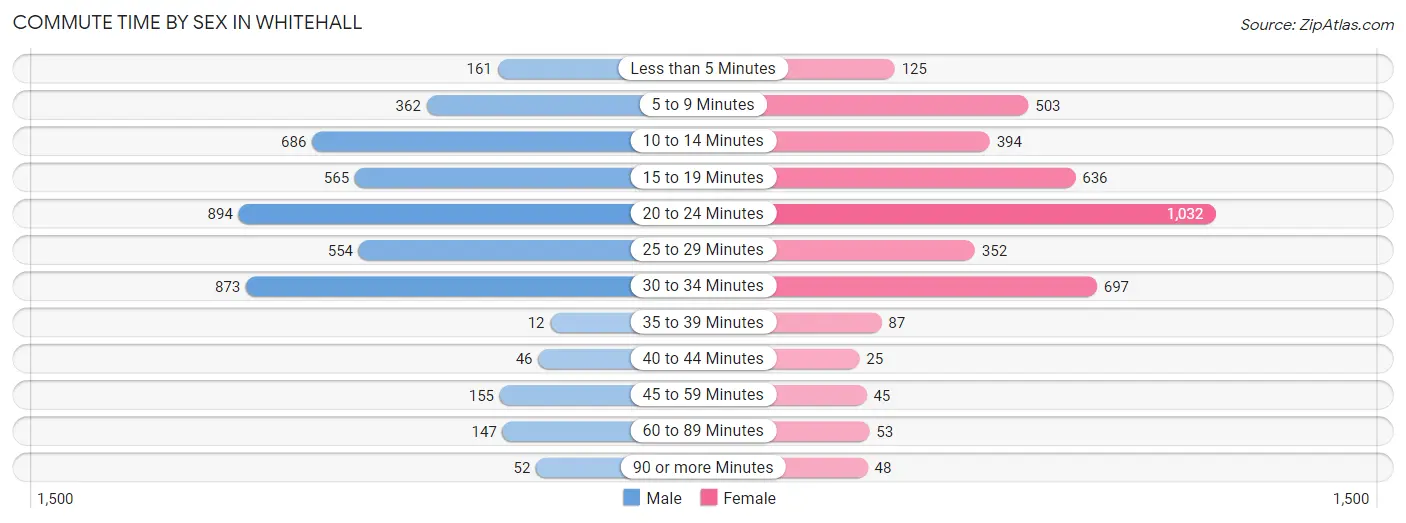
| Commute Time | Male | Female |
| Less than 5 Minutes | 161 (3.6%) | 125 (3.1%) |
| 5 to 9 Minutes | 362 (8.0%) | 503 (12.6%) |
| 10 to 14 Minutes | 686 (15.2%) | 394 (9.9%) |
| 15 to 19 Minutes | 565 (12.5%) | 636 (15.9%) |
| 20 to 24 Minutes | 894 (19.8%) | 1,032 (25.8%) |
| 25 to 29 Minutes | 554 (12.3%) | 352 (8.8%) |
| 30 to 34 Minutes | 873 (19.4%) | 697 (17.4%) |
| 35 to 39 Minutes | 12 (0.3%) | 87 (2.2%) |
| 40 to 44 Minutes | 46 (1.0%) | 25 (0.6%) |
| 45 to 59 Minutes | 155 (3.4%) | 45 (1.1%) |
| 60 to 89 Minutes | 147 (3.3%) | 53 (1.3%) |
| 90 or more Minutes | 52 (1.1%) | 48 (1.2%) |
Time of Departure to Work by Sex in Whitehall
The most frequent times of departure to work in Whitehall are 12:00 AM to 4:59 AM (688, 15.3%) for males and 6:30 AM to 6:59 AM (780, 19.5%) for females.
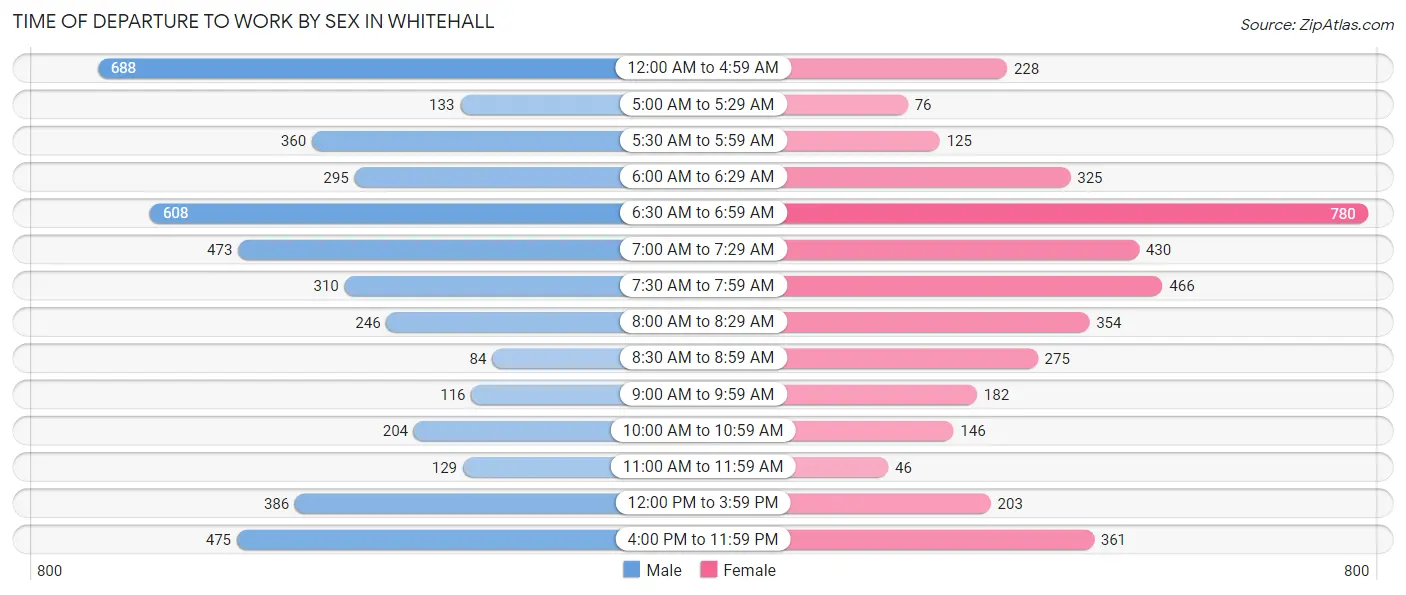
| Time of Departure | Male | Female |
| 12:00 AM to 4:59 AM | 688 (15.3%) | 228 (5.7%) |
| 5:00 AM to 5:29 AM | 133 (2.9%) | 76 (1.9%) |
| 5:30 AM to 5:59 AM | 360 (8.0%) | 125 (3.1%) |
| 6:00 AM to 6:29 AM | 295 (6.6%) | 325 (8.1%) |
| 6:30 AM to 6:59 AM | 608 (13.5%) | 780 (19.5%) |
| 7:00 AM to 7:29 AM | 473 (10.5%) | 430 (10.8%) |
| 7:30 AM to 7:59 AM | 310 (6.9%) | 466 (11.7%) |
| 8:00 AM to 8:29 AM | 246 (5.5%) | 354 (8.9%) |
| 8:30 AM to 8:59 AM | 84 (1.9%) | 275 (6.9%) |
| 9:00 AM to 9:59 AM | 116 (2.6%) | 182 (4.5%) |
| 10:00 AM to 10:59 AM | 204 (4.5%) | 146 (3.6%) |
| 11:00 AM to 11:59 AM | 129 (2.9%) | 46 (1.1%) |
| 12:00 PM to 3:59 PM | 386 (8.6%) | 203 (5.1%) |
| 4:00 PM to 11:59 PM | 475 (10.5%) | 361 (9.0%) |
| Total | 4,507 (100.0%) | 3,997 (100.0%) |
Housing Occupancy in Whitehall
Occupancy by Ownership in Whitehall
Of the total 8,131 dwellings in Whitehall, owner-occupied units account for 3,353 (41.2%), while renter-occupied units make up 4,778 (58.8%).
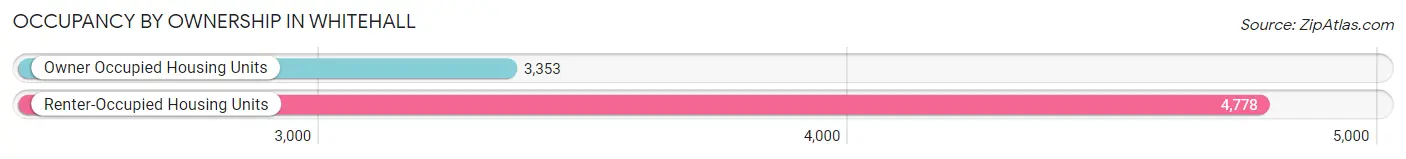
| Occupancy | # Housing Units | % Housing Units |
| Owner Occupied Housing Units | 3,353 | 41.2% |
| Renter-Occupied Housing Units | 4,778 | 58.8% |
| Total Occupied Housing Units | 8,131 | 100.0% |
Occupancy by Household Size in Whitehall
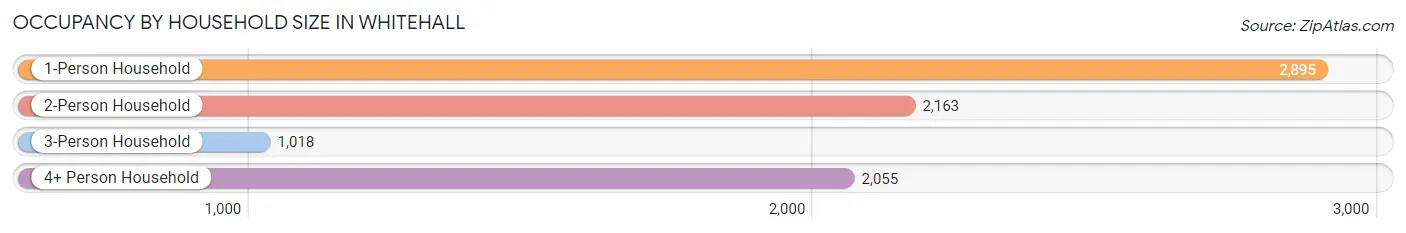
| Household Size | # Housing Units | % Housing Units |
| 1-Person Household | 2,895 | 35.6% |
| 2-Person Household | 2,163 | 26.6% |
| 3-Person Household | 1,018 | 12.5% |
| 4+ Person Household | 2,055 | 25.3% |
| Total Housing Units | 8,131 | 100.0% |
Occupancy by Ownership by Household Size in Whitehall
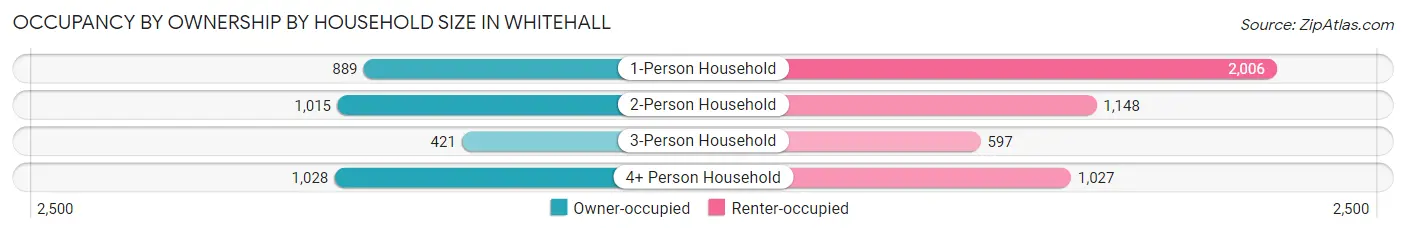
| Household Size | Owner-occupied | Renter-occupied |
| 1-Person Household | 889 (30.7%) | 2,006 (69.3%) |
| 2-Person Household | 1,015 (46.9%) | 1,148 (53.1%) |
| 3-Person Household | 421 (41.4%) | 597 (58.6%) |
| 4+ Person Household | 1,028 (50.0%) | 1,027 (50.0%) |
| Total Housing Units | 3,353 (41.2%) | 4,778 (58.8%) |
Occupancy by Educational Attainment in Whitehall
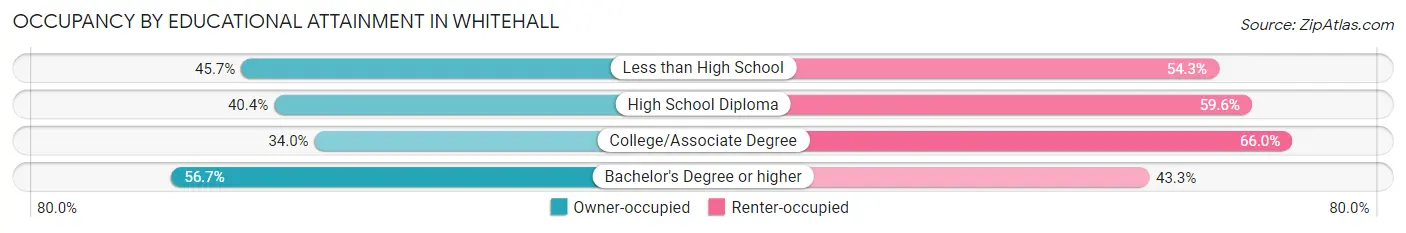
| Household Size | Owner-occupied | Renter-occupied |
| Less than High School | 463 (45.7%) | 551 (54.3%) |
| High School Diploma | 1,418 (40.4%) | 2,088 (59.6%) |
| College/Associate Degree | 864 (34.0%) | 1,675 (66.0%) |
| Bachelor's Degree or higher | 608 (56.7%) | 464 (43.3%) |
Occupancy by Age of Householder in Whitehall
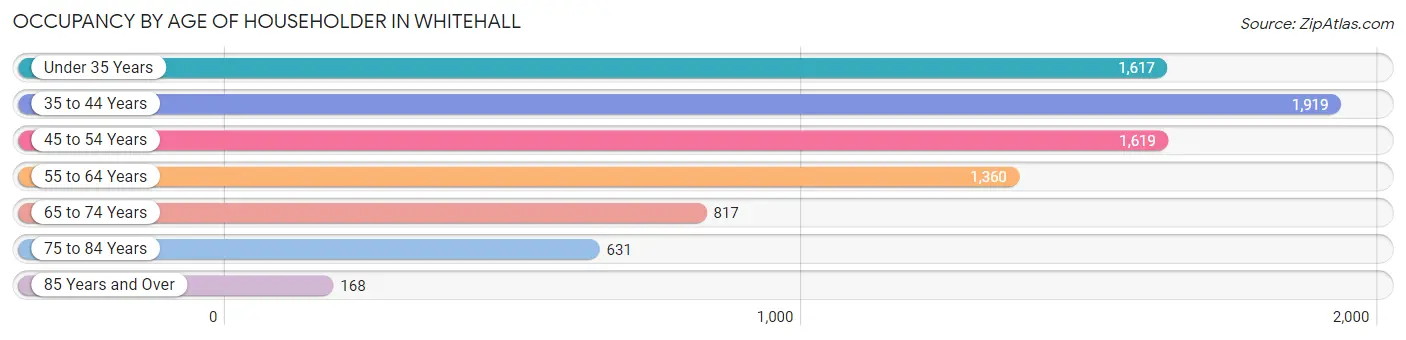
| Age Bracket | # Households | % Households |
| Under 35 Years | 1,617 | 19.9% |
| 35 to 44 Years | 1,919 | 23.6% |
| 45 to 54 Years | 1,619 | 19.9% |
| 55 to 64 Years | 1,360 | 16.7% |
| 65 to 74 Years | 817 | 10.1% |
| 75 to 84 Years | 631 | 7.8% |
| 85 Years and Over | 168 | 2.1% |
| Total | 8,131 | 100.0% |
Housing Finances in Whitehall
Median Income by Occupancy in Whitehall
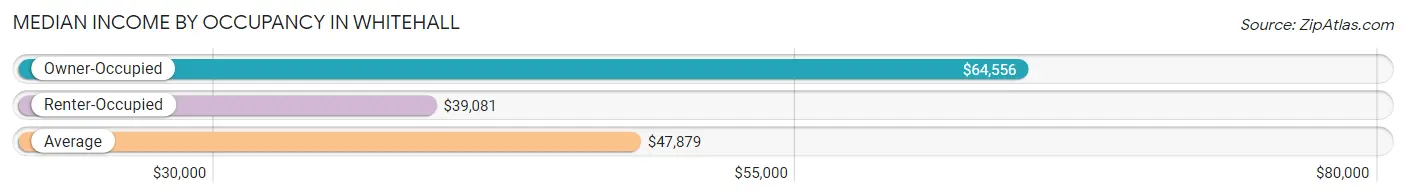
| Occupancy Type | # Households | Median Income |
| Owner-Occupied | 3,353 (41.2%) | $64,556 |
| Renter-Occupied | 4,778 (58.8%) | $39,081 |
| Average | 8,131 (100.0%) | $47,879 |
Occupancy by Householder Income Bracket in Whitehall
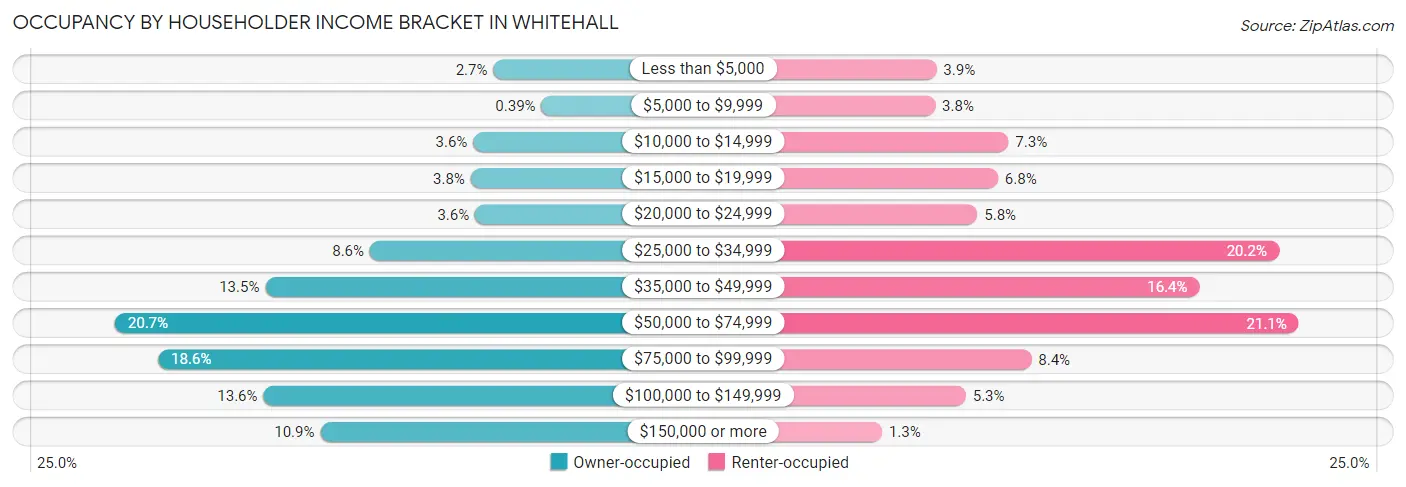
| Income Bracket | Owner-occupied | Renter-occupied |
| Less than $5,000 | 90 (2.7%) | 184 (3.8%) |
| $5,000 to $9,999 | 13 (0.4%) | 181 (3.8%) |
| $10,000 to $14,999 | 122 (3.6%) | 348 (7.3%) |
| $15,000 to $19,999 | 126 (3.8%) | 324 (6.8%) |
| $20,000 to $24,999 | 119 (3.5%) | 277 (5.8%) |
| $25,000 to $34,999 | 287 (8.6%) | 963 (20.2%) |
| $35,000 to $49,999 | 454 (13.5%) | 782 (16.4%) |
| $50,000 to $74,999 | 694 (20.7%) | 1,008 (21.1%) |
| $75,000 to $99,999 | 625 (18.6%) | 400 (8.4%) |
| $100,000 to $149,999 | 457 (13.6%) | 251 (5.2%) |
| $150,000 or more | 366 (10.9%) | 60 (1.3%) |
| Total | 3,353 (100.0%) | 4,778 (100.0%) |
Monthly Housing Cost Tiers in Whitehall
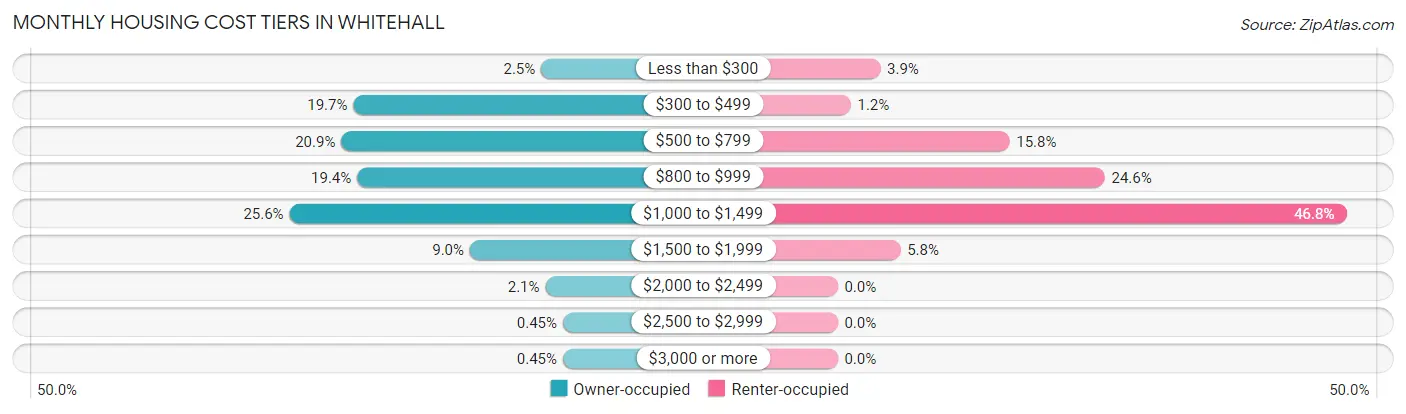
| Monthly Cost | Owner-occupied | Renter-occupied |
| Less than $300 | 82 (2.5%) | 188 (3.9%) |
| $300 to $499 | 662 (19.7%) | 58 (1.2%) |
| $500 to $799 | 699 (20.8%) | 756 (15.8%) |
| $800 to $999 | 650 (19.4%) | 1,175 (24.6%) |
| $1,000 to $1,499 | 859 (25.6%) | 2,238 (46.8%) |
| $1,500 to $1,999 | 302 (9.0%) | 276 (5.8%) |
| $2,000 to $2,499 | 69 (2.1%) | 0 (0.0%) |
| $2,500 to $2,999 | 15 (0.4%) | 0 (0.0%) |
| $3,000 or more | 15 (0.4%) | 0 (0.0%) |
| Total | 3,353 (100.0%) | 4,778 (100.0%) |
Physical Housing Characteristics in Whitehall
Housing Structures in Whitehall
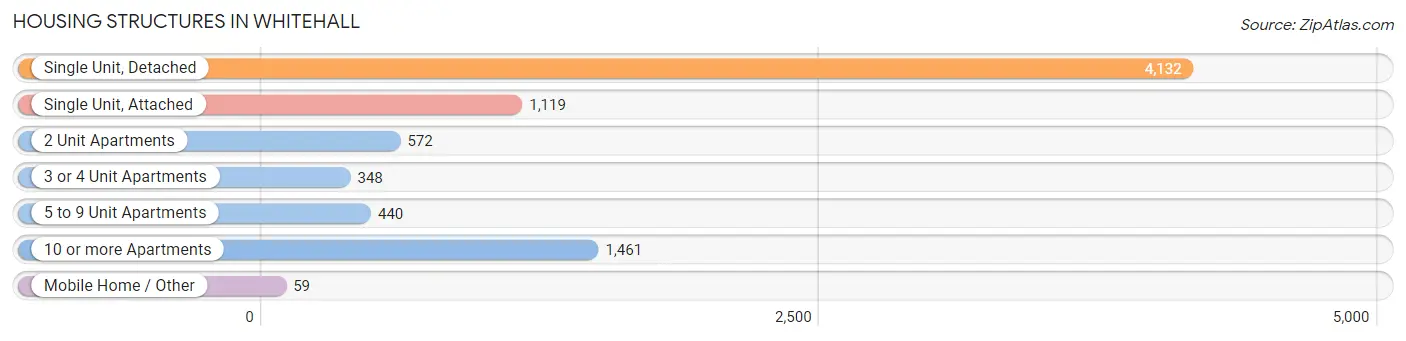
| Structure Type | # Housing Units | % Housing Units |
| Single Unit, Detached | 4,132 | 50.8% |
| Single Unit, Attached | 1,119 | 13.8% |
| 2 Unit Apartments | 572 | 7.0% |
| 3 or 4 Unit Apartments | 348 | 4.3% |
| 5 to 9 Unit Apartments | 440 | 5.4% |
| 10 or more Apartments | 1,461 | 18.0% |
| Mobile Home / Other | 59 | 0.7% |
| Total | 8,131 | 100.0% |
Housing Structures by Occupancy in Whitehall
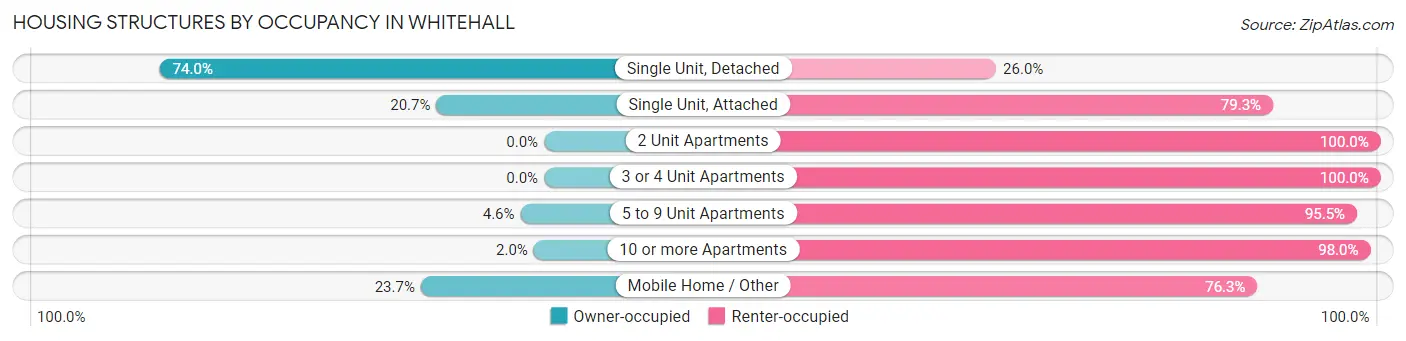
| Structure Type | Owner-occupied | Renter-occupied |
| Single Unit, Detached | 3,058 (74.0%) | 1,074 (26.0%) |
| Single Unit, Attached | 232 (20.7%) | 887 (79.3%) |
| 2 Unit Apartments | 0 (0.0%) | 572 (100.0%) |
| 3 or 4 Unit Apartments | 0 (0.0%) | 348 (100.0%) |
| 5 to 9 Unit Apartments | 20 (4.5%) | 420 (95.5%) |
| 10 or more Apartments | 29 (2.0%) | 1,432 (98.0%) |
| Mobile Home / Other | 14 (23.7%) | 45 (76.3%) |
| Total | 3,353 (41.2%) | 4,778 (58.8%) |
Housing Structures by Number of Rooms in Whitehall
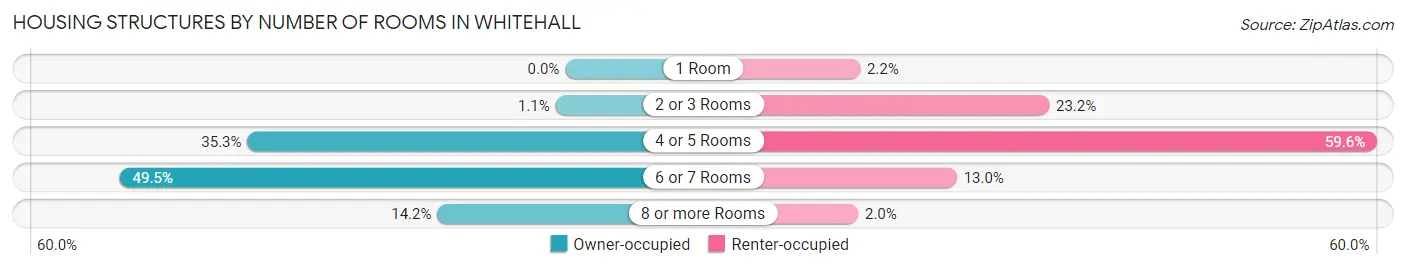
| Number of Rooms | Owner-occupied | Renter-occupied |
| 1 Room | 0 (0.0%) | 106 (2.2%) |
| 2 or 3 Rooms | 36 (1.1%) | 1,109 (23.2%) |
| 4 or 5 Rooms | 1,183 (35.3%) | 2,848 (59.6%) |
| 6 or 7 Rooms | 1,658 (49.4%) | 619 (13.0%) |
| 8 or more Rooms | 476 (14.2%) | 96 (2.0%) |
| Total | 3,353 (100.0%) | 4,778 (100.0%) |
Housing Structure by Heating Type in Whitehall
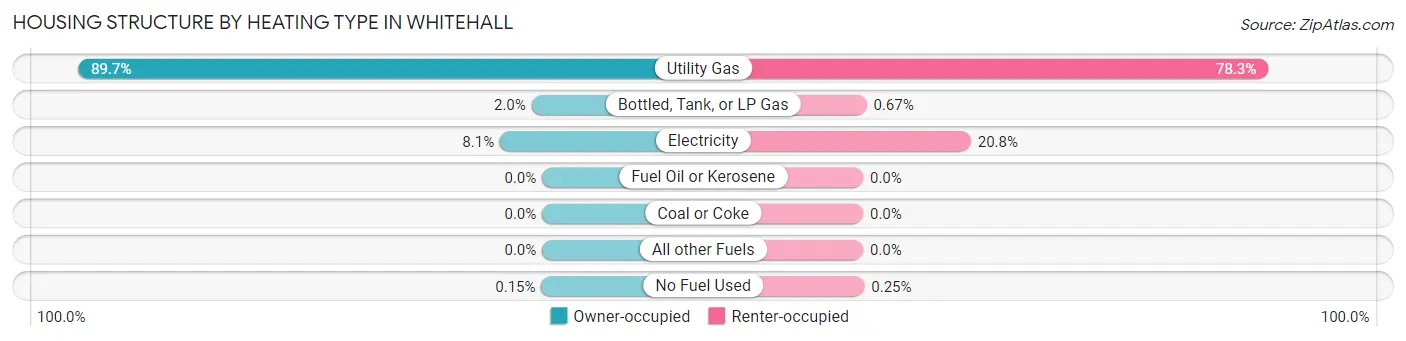
| Heating Type | Owner-occupied | Renter-occupied |
| Utility Gas | 3,007 (89.7%) | 3,739 (78.2%) |
| Bottled, Tank, or LP Gas | 68 (2.0%) | 32 (0.7%) |
| Electricity | 273 (8.1%) | 995 (20.8%) |
| Fuel Oil or Kerosene | 0 (0.0%) | 0 (0.0%) |
| Coal or Coke | 0 (0.0%) | 0 (0.0%) |
| All other Fuels | 0 (0.0%) | 0 (0.0%) |
| No Fuel Used | 5 (0.2%) | 12 (0.3%) |
| Total | 3,353 (100.0%) | 4,778 (100.0%) |
Household Vehicle Usage in Whitehall
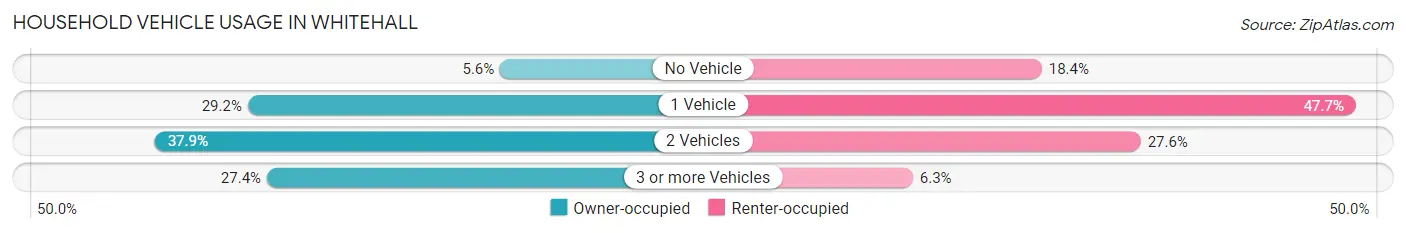
| Vehicles per Household | Owner-occupied | Renter-occupied |
| No Vehicle | 188 (5.6%) | 878 (18.4%) |
| 1 Vehicle | 978 (29.2%) | 2,278 (47.7%) |
| 2 Vehicles | 1,269 (37.9%) | 1,319 (27.6%) |
| 3 or more Vehicles | 918 (27.4%) | 303 (6.3%) |
| Total | 3,353 (100.0%) | 4,778 (100.0%) |
Real Estate & Mortgages in Whitehall
Real Estate and Mortgage Overview in Whitehall
| Characteristic | Without Mortgage | With Mortgage |
| Housing Units | 1,165 | 2,188 |
| Median Property Value | $125,100 | $124,800 |
| Median Household Income | $58,125 | $308 |
| Monthly Housing Costs | $481 | $15 |
| Real Estate Taxes | $1,676 | $23 |
Property Value by Mortgage Status in Whitehall
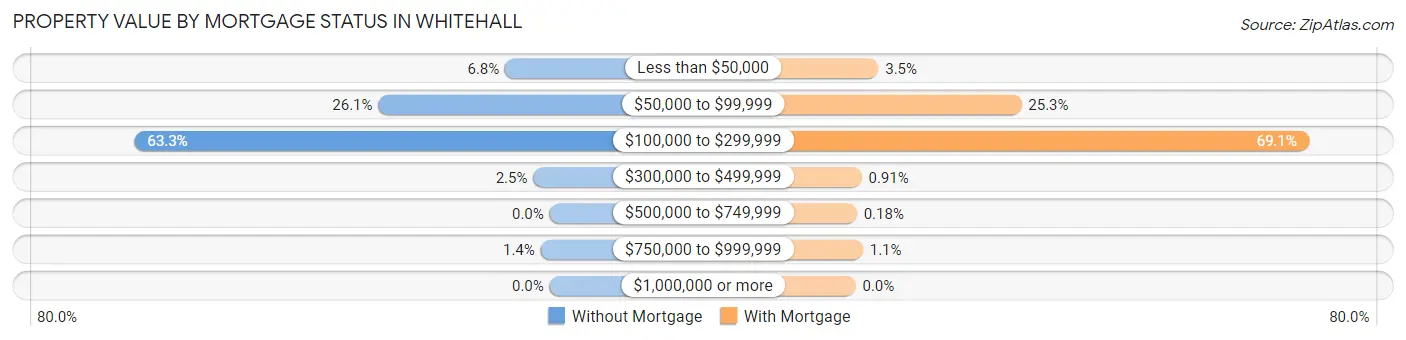
| Property Value | Without Mortgage | With Mortgage |
| Less than $50,000 | 79 (6.8%) | 76 (3.5%) |
| $50,000 to $99,999 | 304 (26.1%) | 553 (25.3%) |
| $100,000 to $299,999 | 737 (63.3%) | 1,511 (69.1%) |
| $300,000 to $499,999 | 29 (2.5%) | 20 (0.9%) |
| $500,000 to $749,999 | 0 (0.0%) | 4 (0.2%) |
| $750,000 to $999,999 | 16 (1.4%) | 24 (1.1%) |
| $1,000,000 or more | 0 (0.0%) | 0 (0.0%) |
| Total | 1,165 (100.0%) | 2,188 (100.0%) |
Household Income by Mortgage Status in Whitehall
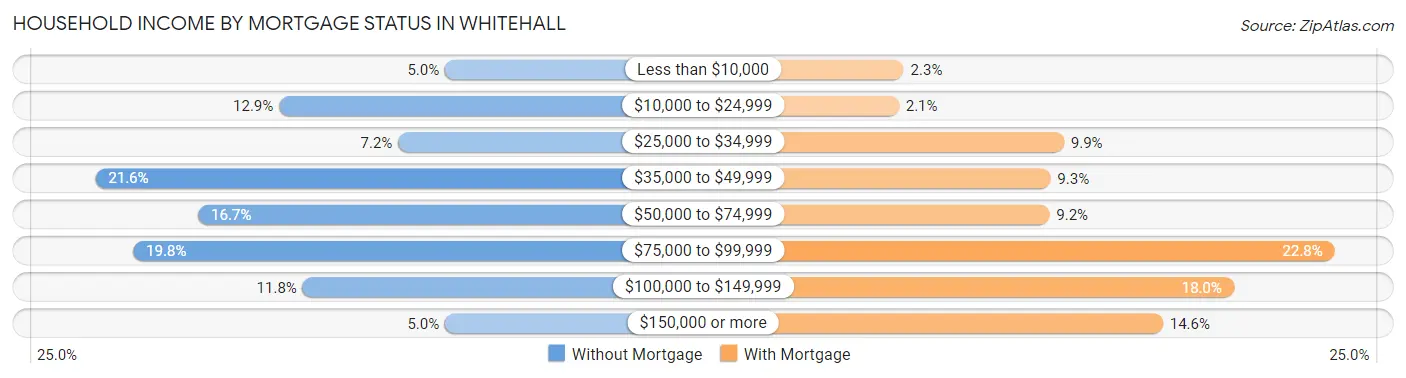
| Household Income | Without Mortgage | With Mortgage |
| Less than $10,000 | 58 (5.0%) | 50 (2.3%) |
| $10,000 to $24,999 | 150 (12.9%) | 45 (2.1%) |
| $25,000 to $34,999 | 84 (7.2%) | 217 (9.9%) |
| $35,000 to $49,999 | 252 (21.6%) | 203 (9.3%) |
| $50,000 to $74,999 | 195 (16.7%) | 202 (9.2%) |
| $75,000 to $99,999 | 231 (19.8%) | 499 (22.8%) |
| $100,000 to $149,999 | 137 (11.8%) | 394 (18.0%) |
| $150,000 or more | 58 (5.0%) | 320 (14.6%) |
| Total | 1,165 (100.0%) | 2,188 (100.0%) |
Property Value to Household Income Ratio in Whitehall
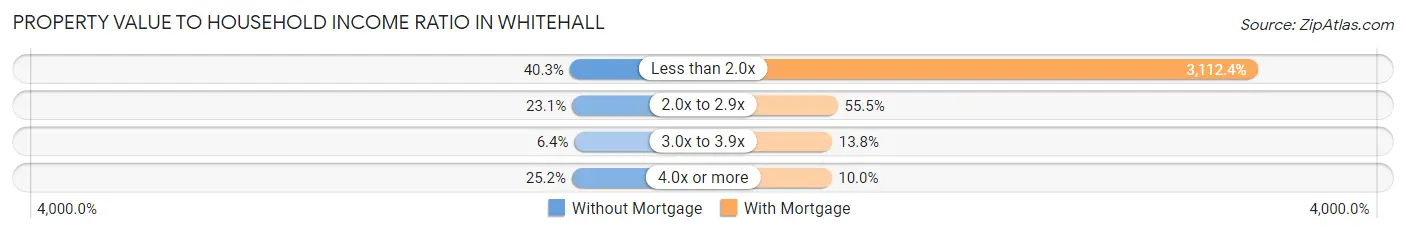
| Value-to-Income Ratio | Without Mortgage | With Mortgage |
| Less than 2.0x | 469 (40.3%) | 68,100 (3,112.4%) |
| 2.0x to 2.9x | 269 (23.1%) | 1,215 (55.5%) |
| 3.0x to 3.9x | 75 (6.4%) | 302 (13.8%) |
| 4.0x or more | 294 (25.2%) | 219 (10.0%) |
| Total | 1,165 (100.0%) | 2,188 (100.0%) |
Real Estate Taxes by Mortgage Status in Whitehall
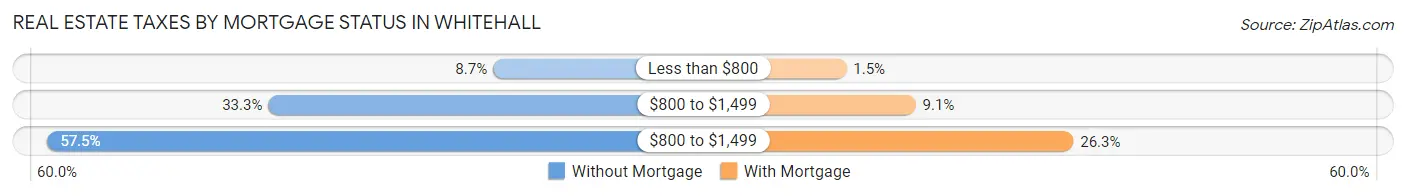
| Property Taxes | Without Mortgage | With Mortgage |
| Less than $800 | 101 (8.7%) | 32 (1.5%) |
| $800 to $1,499 | 388 (33.3%) | 198 (9.0%) |
| $800 to $1,499 | 670 (57.5%) | 576 (26.3%) |
| Total | 1,165 (100.0%) | 2,188 (100.0%) |
Health & Disability in Whitehall
Health Insurance Coverage by Age in Whitehall
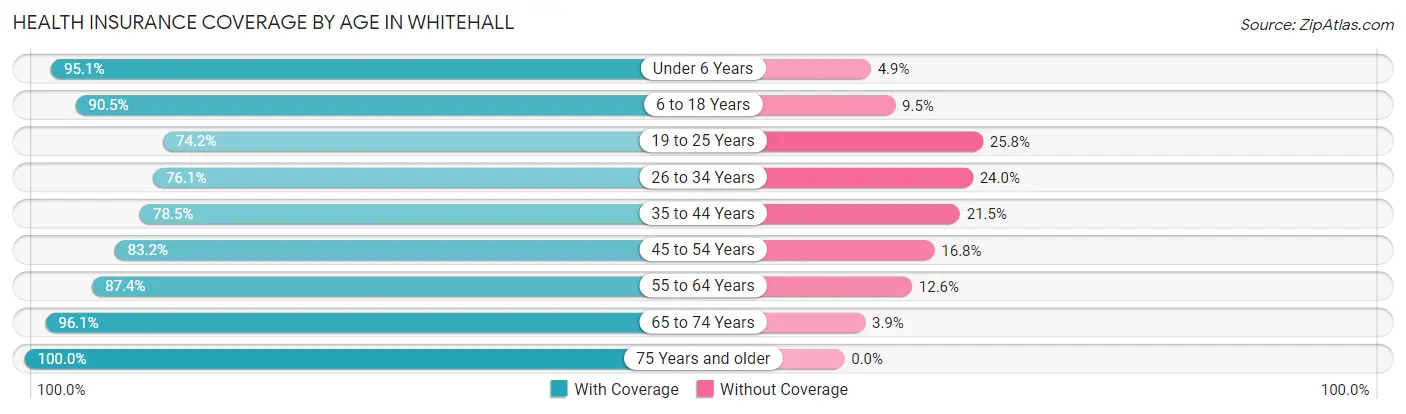
| Age Bracket | With Coverage | Without Coverage |
| Under 6 Years | 1,467 (95.1%) | 76 (4.9%) |
| 6 to 18 Years | 3,325 (90.5%) | 348 (9.5%) |
| 19 to 25 Years | 1,191 (74.2%) | 415 (25.8%) |
| 26 to 34 Years | 1,962 (76.0%) | 618 (23.9%) |
| 35 to 44 Years | 2,622 (78.5%) | 720 (21.5%) |
| 45 to 54 Years | 2,307 (83.2%) | 466 (16.8%) |
| 55 to 64 Years | 1,887 (87.4%) | 272 (12.6%) |
| 65 to 74 Years | 1,242 (96.1%) | 50 (3.9%) |
| 75 Years and older | 1,021 (100.0%) | 0 (0.0%) |
| Total | 17,024 (85.2%) | 2,965 (14.8%) |
Health Insurance Coverage by Citizenship Status in Whitehall
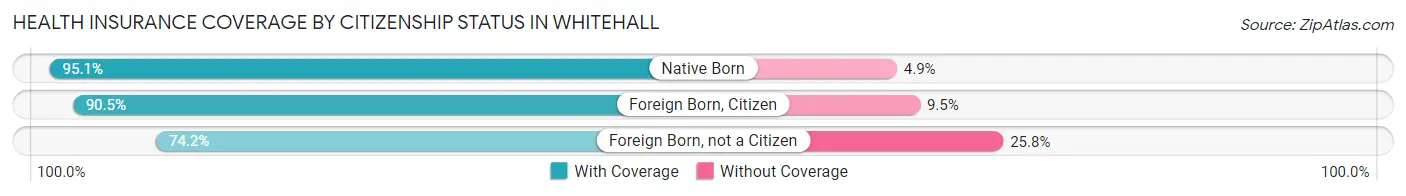
| Citizenship Status | With Coverage | Without Coverage |
| Native Born | 1,467 (95.1%) | 76 (4.9%) |
| Foreign Born, Citizen | 3,325 (90.5%) | 348 (9.5%) |
| Foreign Born, not a Citizen | 1,191 (74.2%) | 415 (25.8%) |
Health Insurance Coverage by Household Income in Whitehall
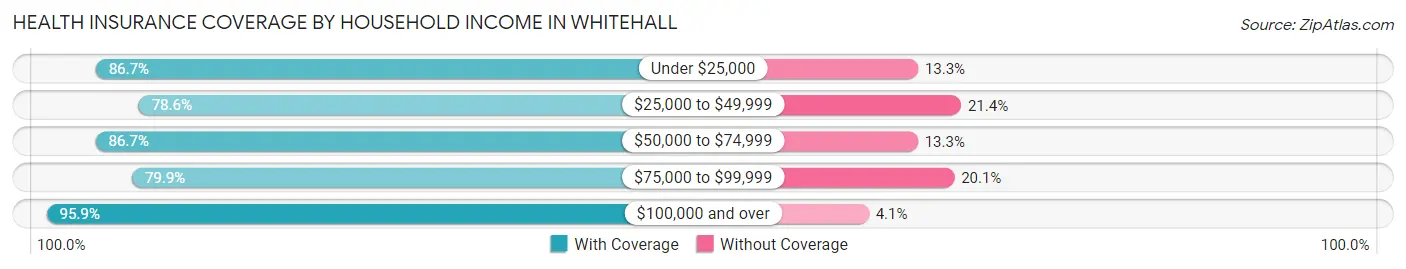
| Household Income | With Coverage | Without Coverage |
| Under $25,000 | 2,366 (86.7%) | 364 (13.3%) |
| $25,000 to $49,999 | 4,429 (78.6%) | 1,205 (21.4%) |
| $50,000 to $74,999 | 3,890 (86.7%) | 596 (13.3%) |
| $75,000 to $99,999 | 2,529 (79.9%) | 637 (20.1%) |
| $100,000 and over | 3,800 (95.9%) | 163 (4.1%) |
Public vs Private Health Insurance Coverage by Age in Whitehall
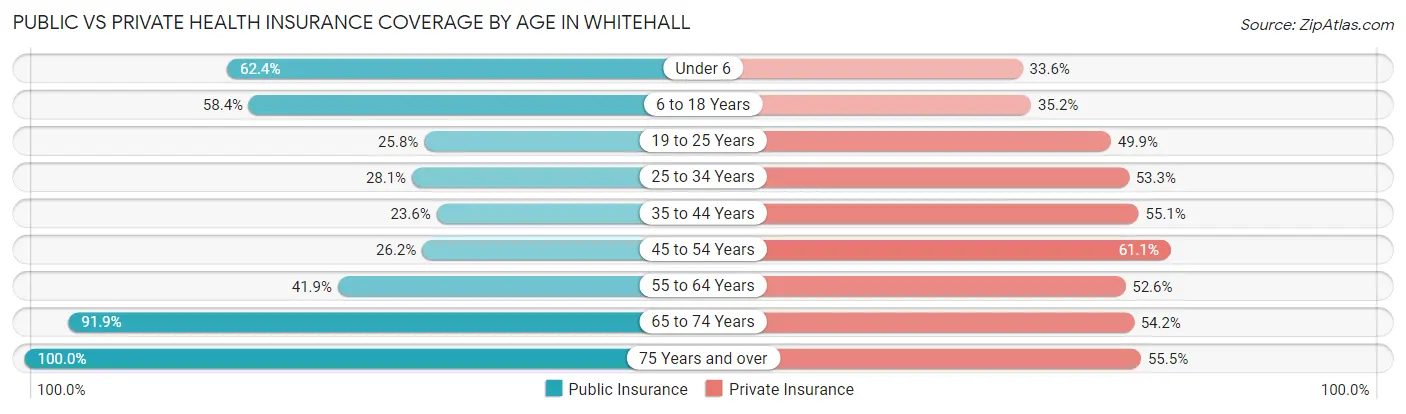
| Age Bracket | Public Insurance | Private Insurance |
| Under 6 | 963 (62.4%) | 518 (33.6%) |
| 6 to 18 Years | 2,144 (58.4%) | 1,291 (35.1%) |
| 19 to 25 Years | 415 (25.8%) | 802 (49.9%) |
| 25 to 34 Years | 725 (28.1%) | 1,374 (53.3%) |
| 35 to 44 Years | 787 (23.5%) | 1,841 (55.1%) |
| 45 to 54 Years | 727 (26.2%) | 1,693 (61.1%) |
| 55 to 64 Years | 904 (41.9%) | 1,136 (52.6%) |
| 65 to 74 Years | 1,187 (91.9%) | 700 (54.2%) |
| 75 Years and over | 1,021 (100.0%) | 567 (55.5%) |
| Total | 8,873 (44.4%) | 9,922 (49.6%) |
Disability Status by Sex by Age in Whitehall
| Age Bracket | Male | Female |
| Under 5 Years | 0 (0.0%) | 0 (0.0%) |
| 5 to 17 Years | 159 (7.7%) | 122 (7.9%) |
| 18 to 34 Years | 166 (7.2%) | 182 (8.6%) |
| 35 to 64 Years | 348 (8.6%) | 975 (23.0%) |
| 65 to 74 Years | 235 (43.9%) | 243 (32.1%) |
| 75 Years and over | 221 (58.3%) | 306 (47.7%) |
Disability Class by Sex by Age in Whitehall
Disability Class: Hearing Difficulty
| Age Bracket | Male | Female |
| Under 5 Years | 0 (0.0%) | 0 (0.0%) |
| 5 to 17 Years | 19 (0.9%) | 0 (0.0%) |
| 18 to 34 Years | 0 (0.0%) | 25 (1.2%) |
| 35 to 64 Years | 24 (0.6%) | 123 (2.9%) |
| 65 to 74 Years | 37 (6.9%) | 40 (5.3%) |
| 75 Years and over | 148 (39.1%) | 78 (12.1%) |
Disability Class: Vision Difficulty
| Age Bracket | Male | Female |
| Under 5 Years | 0 (0.0%) | 0 (0.0%) |
| 5 to 17 Years | 9 (0.4%) | 40 (2.6%) |
| 18 to 34 Years | 10 (0.4%) | 58 (2.8%) |
| 35 to 64 Years | 21 (0.5%) | 132 (3.1%) |
| 65 to 74 Years | 13 (2.4%) | 97 (12.8%) |
| 75 Years and over | 47 (12.4%) | 90 (14.0%) |
Disability Class: Cognitive Difficulty
| Age Bracket | Male | Female |
| 5 to 17 Years | 123 (5.9%) | 53 (3.5%) |
| 18 to 34 Years | 145 (6.3%) | 75 (3.5%) |
| 35 to 64 Years | 161 (4.0%) | 281 (6.6%) |
| 65 to 74 Years | 79 (14.8%) | 90 (11.9%) |
| 75 Years and over | 119 (31.4%) | 74 (11.5%) |
Disability Class: Ambulatory Difficulty
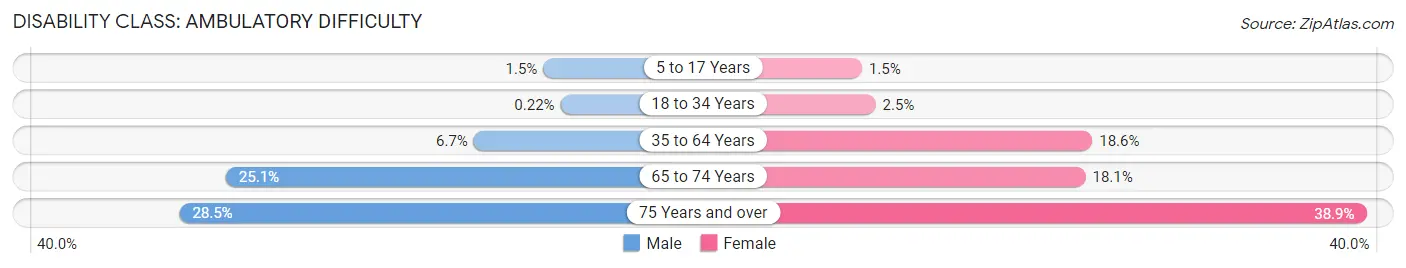
| Age Bracket | Male | Female |
| 5 to 17 Years | 31 (1.5%) | 23 (1.5%) |
| 18 to 34 Years | 5 (0.2%) | 53 (2.5%) |
| 35 to 64 Years | 268 (6.7%) | 790 (18.6%) |
| 65 to 74 Years | 134 (25.1%) | 137 (18.1%) |
| 75 Years and over | 108 (28.5%) | 250 (38.9%) |
Disability Class: Self-Care Difficulty
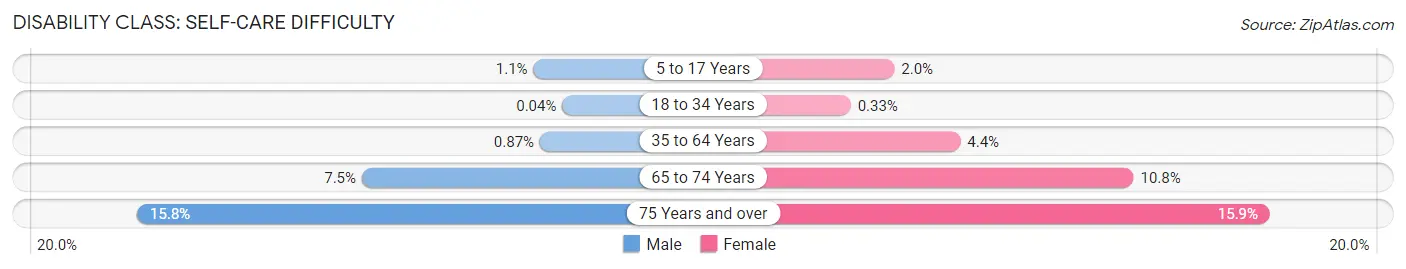
| Age Bracket | Male | Female |
| 5 to 17 Years | 23 (1.1%) | 30 (1.9%) |
| 18 to 34 Years | 1 (0.0%) | 7 (0.3%) |
| 35 to 64 Years | 35 (0.9%) | 187 (4.4%) |
| 65 to 74 Years | 40 (7.5%) | 82 (10.8%) |
| 75 Years and over | 60 (15.8%) | 102 (15.9%) |
Technology Access in Whitehall
Computing Device Access in Whitehall
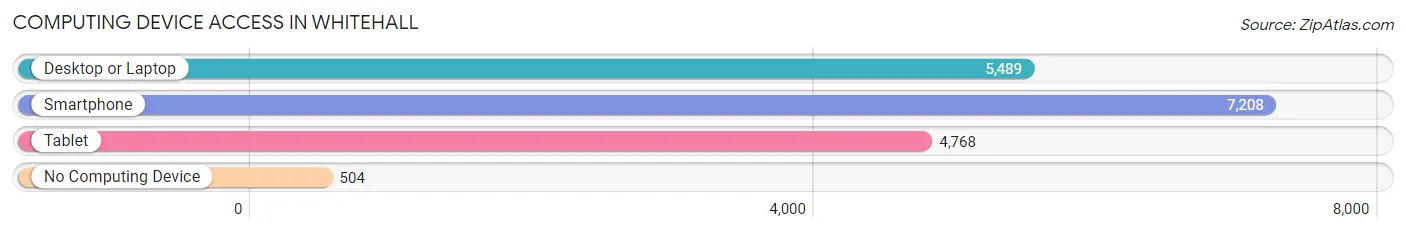
| Device Type | # Households | % Households |
| Desktop or Laptop | 5,489 | 67.5% |
| Smartphone | 7,208 | 88.6% |
| Tablet | 4,768 | 58.6% |
| No Computing Device | 504 | 6.2% |
| Total | 8,131 | 100.0% |
Internet Access in Whitehall
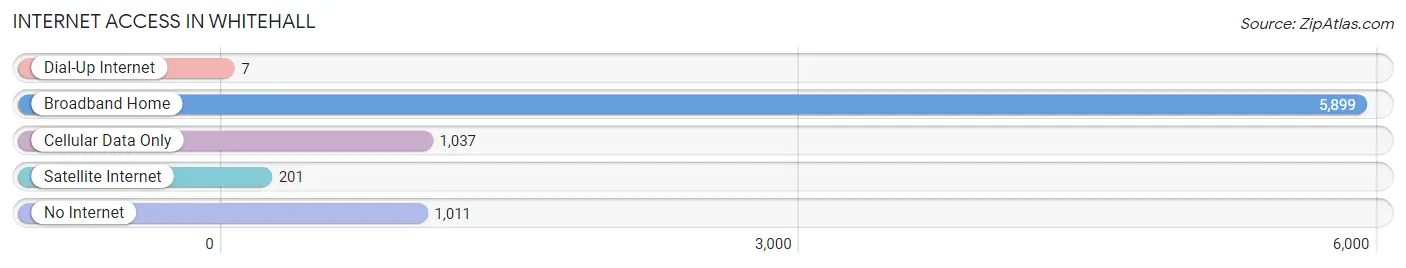
| Internet Type | # Households | % Households |
| Dial-Up Internet | 7 | 0.1% |
| Broadband Home | 5,899 | 72.6% |
| Cellular Data Only | 1,037 | 12.8% |
| Satellite Internet | 201 | 2.5% |
| No Internet | 1,011 | 12.4% |
| Total | 8,131 | 100.0% |
Whitehall Summary
History
Whitehall, Ohio is a city located in Franklin County, Ohio. It is a suburb of Columbus, the state capital, and is located just east of the city. Whitehall was founded in 1837 by John White, a Revolutionary War veteran, and was originally known as White’s Settlement. The city was incorporated in 1952 and has since grown to a population of 18,062 as of the 2010 census.
Whitehall has a rich history that dates back to the early 1800s. The city was originally part of the Virginia Military District, which was established in 1788 to provide land grants to veterans of the Revolutionary War. John White was one of the veterans who received a land grant in the area and he established White’s Settlement in 1837. The settlement was later renamed Whitehall in 1845.
Whitehall was a small farming community until the 1950s when it began to experience rapid growth due to its proximity to Columbus. The city was officially incorporated in 1952 and has since become a popular suburb of Columbus. The city has experienced steady growth since then and is now home to a variety of businesses, including retail stores, restaurants, and office buildings.
Geography
Whitehall is located in Franklin County, Ohio, just east of Columbus. The city is situated on the banks of the Big Walnut Creek and is bordered by the cities of Bexley, Reynoldsburg, and Gahanna. Whitehall covers an area of 8.3 square miles and has a population of 18,062 as of the 2010 census.
The city is located in the Central Lowlands region of Ohio and is characterized by flat terrain and rolling hills. The climate in Whitehall is humid continental, with hot summers and cold winters. The average annual temperature is around 50 degrees Fahrenheit and the average annual precipitation is around 40 inches.
Economy
Whitehall’s economy is largely based on retail and services. The city is home to a variety of retail stores, restaurants, and office buildings. The city is also home to several large employers, including the Ohio State University Wexner Medical Center, the Ohio State University College of Medicine, and the Ohio State University College of Nursing.
The city’s largest employer is the Ohio State University Wexner Medical Center, which employs over 5,000 people. Other major employers in the city include the Ohio State University College of Medicine, the Ohio State University College of Nursing, and the Ohio State University College of Veterinary Medicine.
Demographics
As of the 2010 census, Whitehall had a population of 18,062. The racial makeup of the city was 79.2% White, 11.3% African American, 0.3% Native American, 2.2% Asian, 0.1% Pacific Islander, 4.2% from other races, and 2.9% from two or more races. Hispanic or Latino of any race were 8.2% of the population.
The median income for a household in Whitehall was $45,945 and the median income for a family was $54,945. The per capita income for the city was $22,945. About 8.2% of families and 10.3% of the population were below the poverty line, including 14.2% of those under age 18 and 6.2% of those age 65 or over.
Common Questions
What is Per Capita Income in Whitehall?
Per Capita income in Whitehall is $25,315.
What is the Median Family Income in Whitehall?
Median Family Income in Whitehall is $54,990.
What is the Median Household income in Whitehall?
Median Household Income in Whitehall is $47,879.
What is Income or Wage Gap in Whitehall?
Income or Wage Gap in Whitehall is 7.8%.
Women in Whitehall earn 92.2 cents for every dollar earned by a man.
What is Family Income Deficit in Whitehall?
Family Income Deficit in Whitehall is $8,441.
Families that are below poverty line in Whitehall earn $8,441 less on average than the poverty threshold level.
What is Inequality or Gini Index in Whitehall?
Inequality or Gini Index in Whitehall is 0.43.
What is the Total Population of Whitehall?
Total Population of Whitehall is 20,035.
What is the Total Male Population of Whitehall?
Total Male Population of Whitehall is 10,021.
What is the Total Female Population of Whitehall?
Total Female Population of Whitehall is 10,014.
What is the Ratio of Males per 100 Females in Whitehall?
There are 100.07 Males per 100 Females in Whitehall.
What is the Ratio of Females per 100 Males in Whitehall?
There are 99.93 Females per 100 Males in Whitehall.
What is the Median Population Age in Whitehall?
Median Population Age in Whitehall is 36.6 Years.
What is the Average Family Size in Whitehall
Average Family Size in Whitehall is 3.2 People.
What is the Average Household Size in Whitehall
Average Household Size in Whitehall is 2.5 People.
How Large is the Labor Force in Whitehall?
There are 10,533 People in the Labor Forcein in Whitehall.
What is the Percentage of People in the Labor Force in Whitehall?
67.6% of People are in the Labor Force in Whitehall.
What is the Unemployment Rate in Whitehall?
Unemployment Rate in Whitehall is 10.6%.