Cuyahoga Heights, OH Map & Demographics
Cuyahoga Heights Map
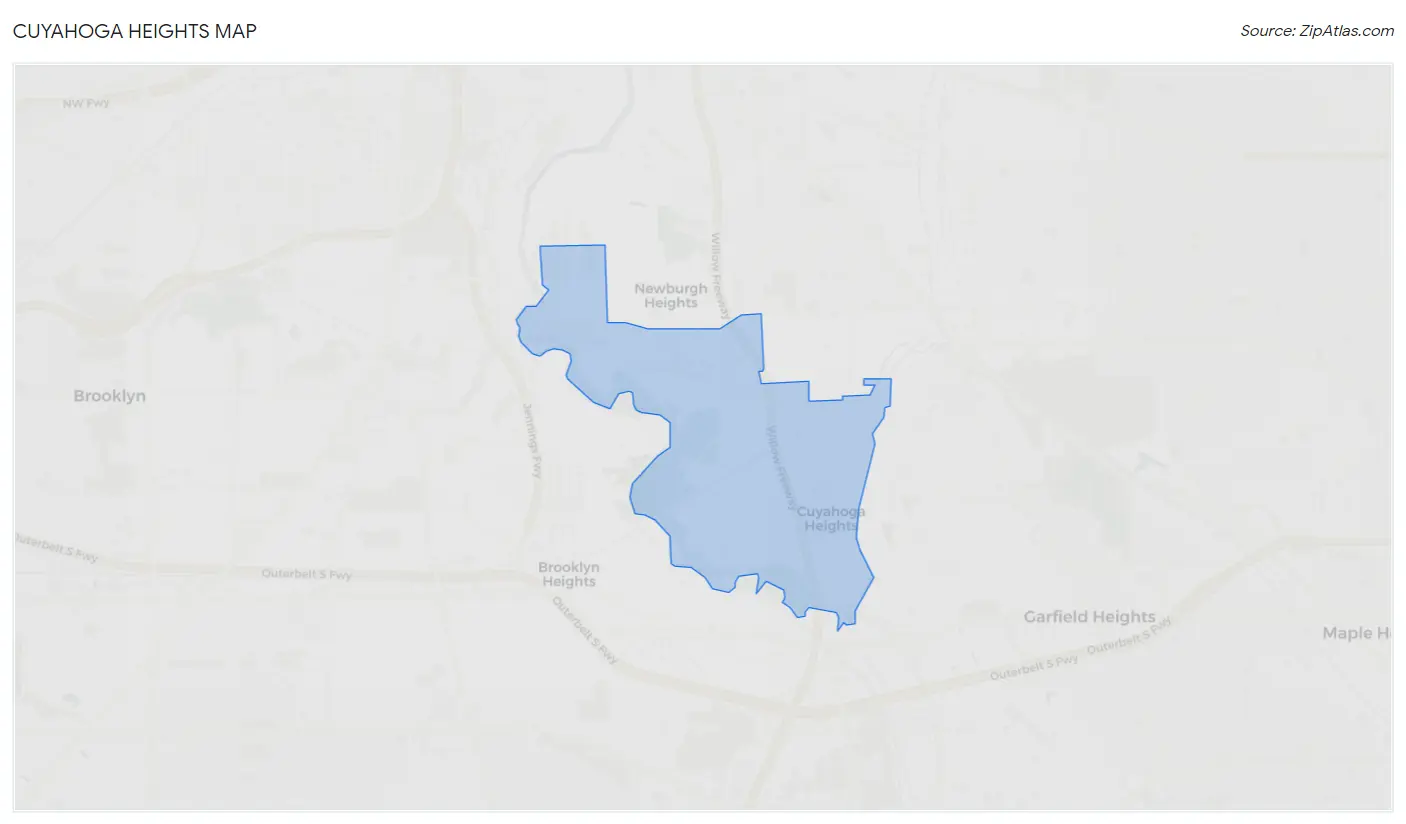
Cuyahoga Heights Overview
$33,687
PER CAPITA INCOME
$93,929
AVG FAMILY INCOME
$73,229
AVG HOUSEHOLD INCOME
15.5%
WAGE / INCOME GAP [ % ]
84.5¢/ $1
WAGE / INCOME GAP [ $ ]
0.38
INEQUALITY / GINI INDEX
627
TOTAL POPULATION
288
MALE POPULATION
339
FEMALE POPULATION
84.96
MALES / 100 FEMALES
117.71
FEMALES / 100 MALES
43.7
MEDIAN AGE
3.1
AVG FAMILY SIZE
2.5
AVG HOUSEHOLD SIZE
329
LABOR FORCE [ PEOPLE ]
66.3%
PERCENT IN LABOR FORCE
8.5%
UNEMPLOYMENT RATE
Income in Cuyahoga Heights
Income Overview in Cuyahoga Heights
Per Capita Income in Cuyahoga Heights is $33,687, while median incomes of families and households are $93,929 and $73,229 respectively.
| Characteristic | Number | Measure |
| Per Capita Income | 627 | $33,687 |
| Median Family Income | 142 | $93,929 |
| Mean Family Income | 142 | $98,644 |
| Median Household Income | 255 | $73,229 |
| Mean Household Income | 255 | $80,856 |
| Income Deficit | 142 | $0 |
| Wage / Income Gap (%) | 627 | 15.46% |
| Wage / Income Gap ($) | 627 | 84.54¢ per $1 |
| Gini / Inequality Index | 627 | 0.38 |
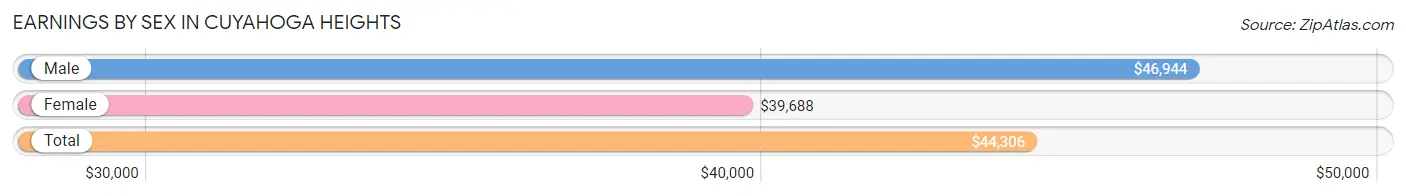
Earnings by Sex in Cuyahoga Heights
Average Earnings in Cuyahoga Heights are $44,306, $46,944 for men and $39,688 for women, a difference of 15.5%.
| Sex | Number | Average Earnings |
| Male | 150 (47.0%) | $46,944 |
| Female | 169 (53.0%) | $39,688 |
| Total | 319 (100.0%) | $44,306 |
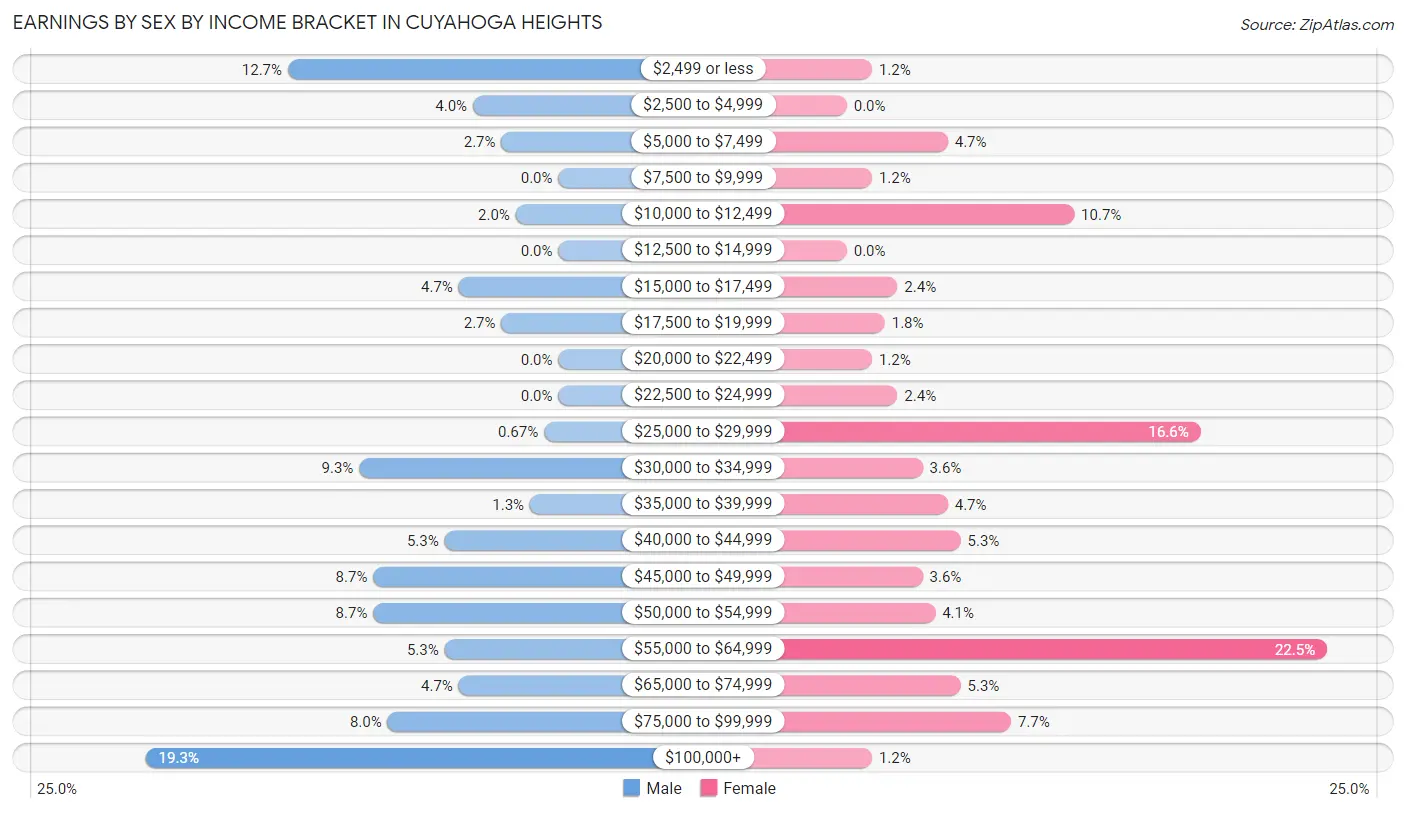
Earnings by Sex by Income Bracket in Cuyahoga Heights
The most common earnings brackets in Cuyahoga Heights are $100,000+ for men (29 | 19.3%) and $55,000 to $64,999 for women (38 | 22.5%).
| Income | Male | Female |
| $2,499 or less | 19 (12.7%) | 2 (1.2%) |
| $2,500 to $4,999 | 6 (4.0%) | 0 (0.0%) |
| $5,000 to $7,499 | 4 (2.7%) | 8 (4.7%) |
| $7,500 to $9,999 | 0 (0.0%) | 2 (1.2%) |
| $10,000 to $12,499 | 3 (2.0%) | 18 (10.6%) |
| $12,500 to $14,999 | 0 (0.0%) | 0 (0.0%) |
| $15,000 to $17,499 | 7 (4.7%) | 4 (2.4%) |
| $17,500 to $19,999 | 4 (2.7%) | 3 (1.8%) |
| $20,000 to $22,499 | 0 (0.0%) | 2 (1.2%) |
| $22,500 to $24,999 | 0 (0.0%) | 4 (2.4%) |
| $25,000 to $29,999 | 1 (0.7%) | 28 (16.6%) |
| $30,000 to $34,999 | 14 (9.3%) | 6 (3.5%) |
| $35,000 to $39,999 | 2 (1.3%) | 8 (4.7%) |
| $40,000 to $44,999 | 8 (5.3%) | 9 (5.3%) |
| $45,000 to $49,999 | 13 (8.7%) | 6 (3.5%) |
| $50,000 to $54,999 | 13 (8.7%) | 7 (4.1%) |
| $55,000 to $64,999 | 8 (5.3%) | 38 (22.5%) |
| $65,000 to $74,999 | 7 (4.7%) | 9 (5.3%) |
| $75,000 to $99,999 | 12 (8.0%) | 13 (7.7%) |
| $100,000+ | 29 (19.3%) | 2 (1.2%) |
| Total | 150 (100.0%) | 169 (100.0%) |
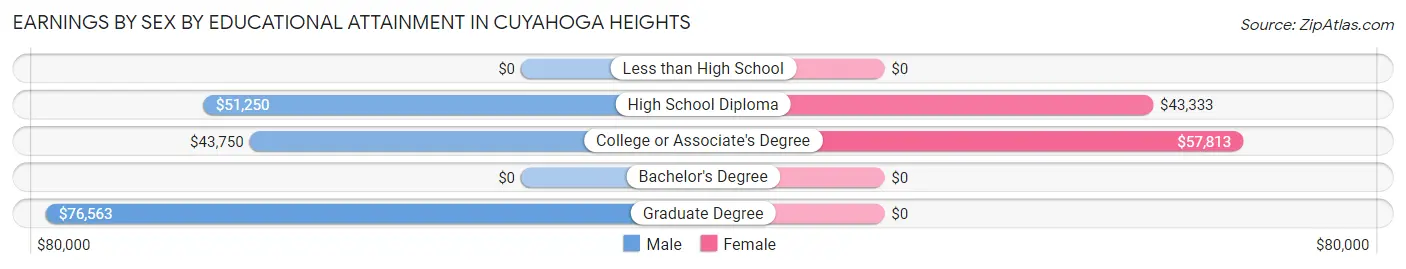
Earnings by Sex by Educational Attainment in Cuyahoga Heights
Average earnings in Cuyahoga Heights are $49,688 for men and $50,833 for women, a difference of 2.2%. Men with an educational attainment of graduate degree enjoy the highest average annual earnings of $76,563, while those with college or associate's degree education earn the least with $43,750. Women with an educational attainment of college or associate's degree earn the most with the average annual earnings of $57,813, while those with high school diploma education have the smallest earnings of $43,333.
| Educational Attainment | Male Income | Female Income |
| Less than High School | - | - |
| High School Diploma | $51,250 | $43,333 |
| College or Associate's Degree | $43,750 | $57,813 |
| Bachelor's Degree | - | - |
| Graduate Degree | $76,563 | $0 |
| Total | $49,688 | $50,833 |
Family Income in Cuyahoga Heights
Family Income Brackets in Cuyahoga Heights
According to the Cuyahoga Heights family income data, there are 45 families falling into the $100,000 to $149,999 income range, which is the most common income bracket and makes up 31.7% of all families.
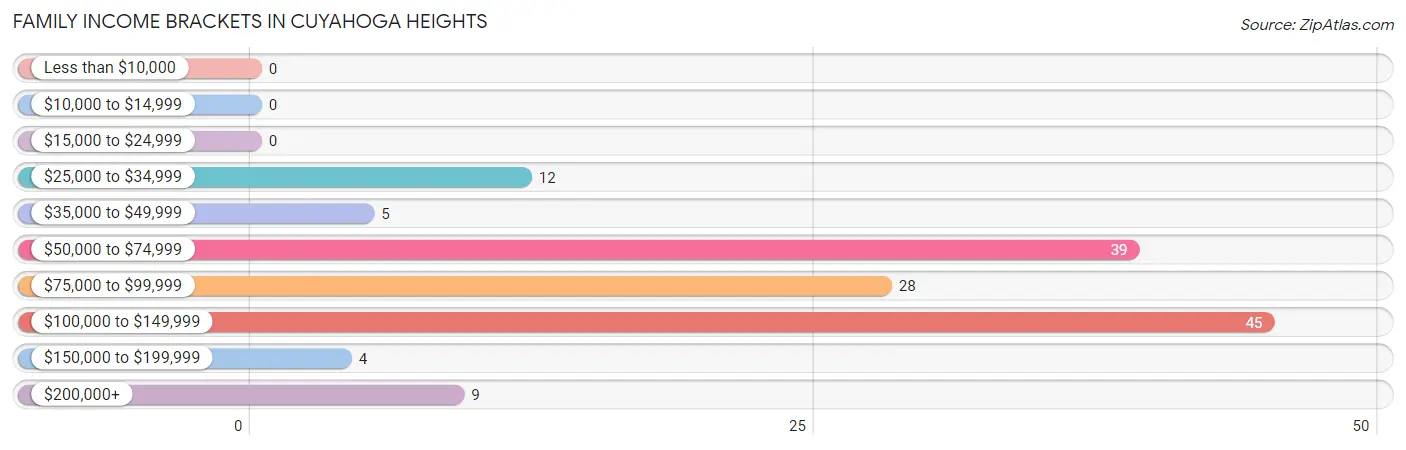
| Income Bracket | # Families | % Families |
| Less than $10,000 | 0 | 0.0% |
| $10,000 to $14,999 | 0 | 0.0% |
| $15,000 to $24,999 | 0 | 0.0% |
| $25,000 to $34,999 | 12 | 8.5% |
| $35,000 to $49,999 | 5 | 3.5% |
| $50,000 to $74,999 | 39 | 27.5% |
| $75,000 to $99,999 | 28 | 19.7% |
| $100,000 to $149,999 | 45 | 31.7% |
| $150,000 to $199,999 | 4 | 2.8% |
| $200,000+ | 9 | 6.3% |
Family Income by Famaliy Size in Cuyahoga Heights
2-person families (59 | 41.5%) account for the highest median family income in Cuyahoga Heights with $94,464 per family, while 2-person families (59 | 41.5%) have the highest median income of $47,232 per family member.
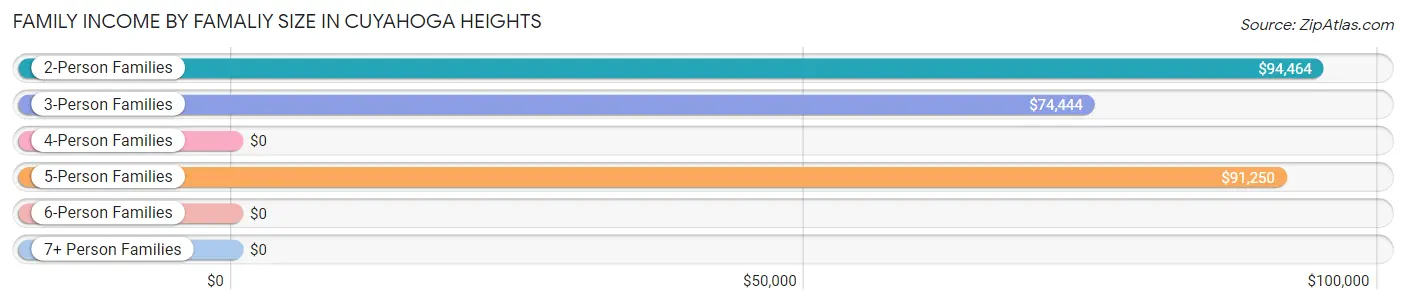
| Income Bracket | # Families | Median Income |
| 2-Person Families | 59 (41.5%) | $94,464 |
| 3-Person Families | 40 (28.2%) | $74,444 |
| 4-Person Families | 19 (13.4%) | $0 |
| 5-Person Families | 20 (14.1%) | $91,250 |
| 6-Person Families | 4 (2.8%) | $0 |
| 7+ Person Families | 0 (0.0%) | $0 |
| Total | 142 (100.0%) | $93,929 |
Family Income by Number of Earners in Cuyahoga Heights
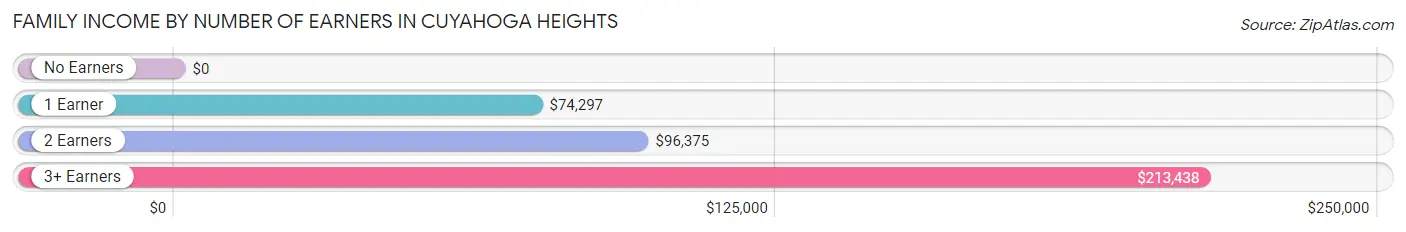
| Number of Earners | # Families | Median Income |
| No Earners | 1 (0.7%) | $0 |
| 1 Earner | 71 (50.0%) | $74,297 |
| 2 Earners | 59 (41.5%) | $96,375 |
| 3+ Earners | 11 (7.7%) | $213,438 |
| Total | 142 (100.0%) | $93,929 |
Household Income in Cuyahoga Heights
Household Income Brackets in Cuyahoga Heights
With 73 households falling in the category, the $100,000 to $149,999 income range is the most frequent in Cuyahoga Heights, accounting for 28.6% of all households. In contrast, only 4 households (1.6%) fall into the $150,000 to $199,999 income bracket, making it the least populous group.
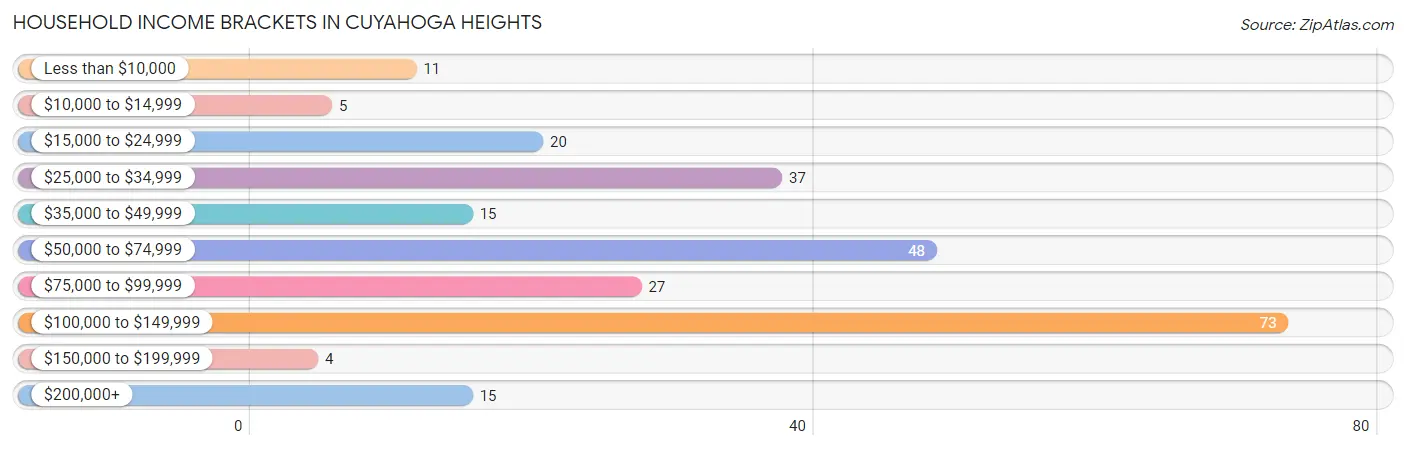
| Income Bracket | # Households | % Households |
| Less than $10,000 | 11 | 4.3% |
| $10,000 to $14,999 | 5 | 2.0% |
| $15,000 to $24,999 | 20 | 7.8% |
| $25,000 to $34,999 | 37 | 14.5% |
| $35,000 to $49,999 | 15 | 5.9% |
| $50,000 to $74,999 | 48 | 18.8% |
| $75,000 to $99,999 | 27 | 10.6% |
| $100,000 to $149,999 | 73 | 28.6% |
| $150,000 to $199,999 | 4 | 1.6% |
| $200,000+ | 15 | 5.9% |
Household Income by Householder Age in Cuyahoga Heights
The median household income in Cuyahoga Heights is $73,229, with the highest median household income of $105,385 found in the 25 to 44 years age bracket for the primary householder. A total of 66 households (25.9%) fall into this category.
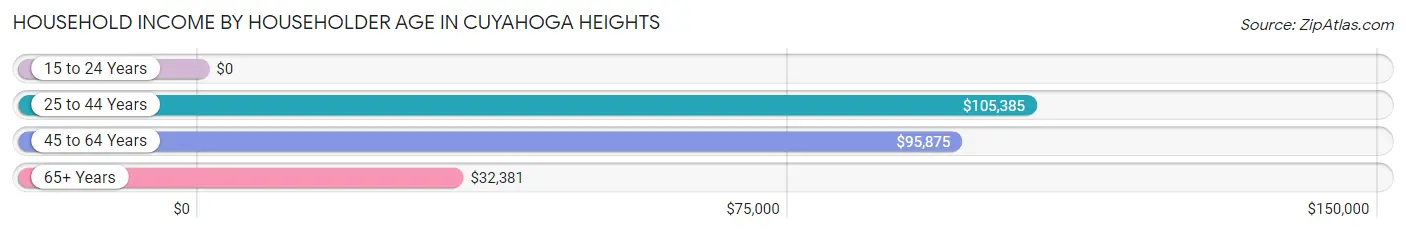
| Income Bracket | # Households | Median Income |
| 15 to 24 Years | 0 (0.0%) | $0 |
| 25 to 44 Years | 66 (25.9%) | $105,385 |
| 45 to 64 Years | 89 (34.9%) | $95,875 |
| 65+ Years | 100 (39.2%) | $32,381 |
| Total | 255 (100.0%) | $73,229 |
Poverty in Cuyahoga Heights
Income Below Poverty by Sex and Age in Cuyahoga Heights
With 5.6% poverty level for males and 7.1% for females among the residents of Cuyahoga Heights, 55 to 64 year old males and 25 to 34 year old females are the most vulnerable to poverty, with 6 males (17.1%) and 12 females (40.0%) in their respective age groups living below the poverty level.
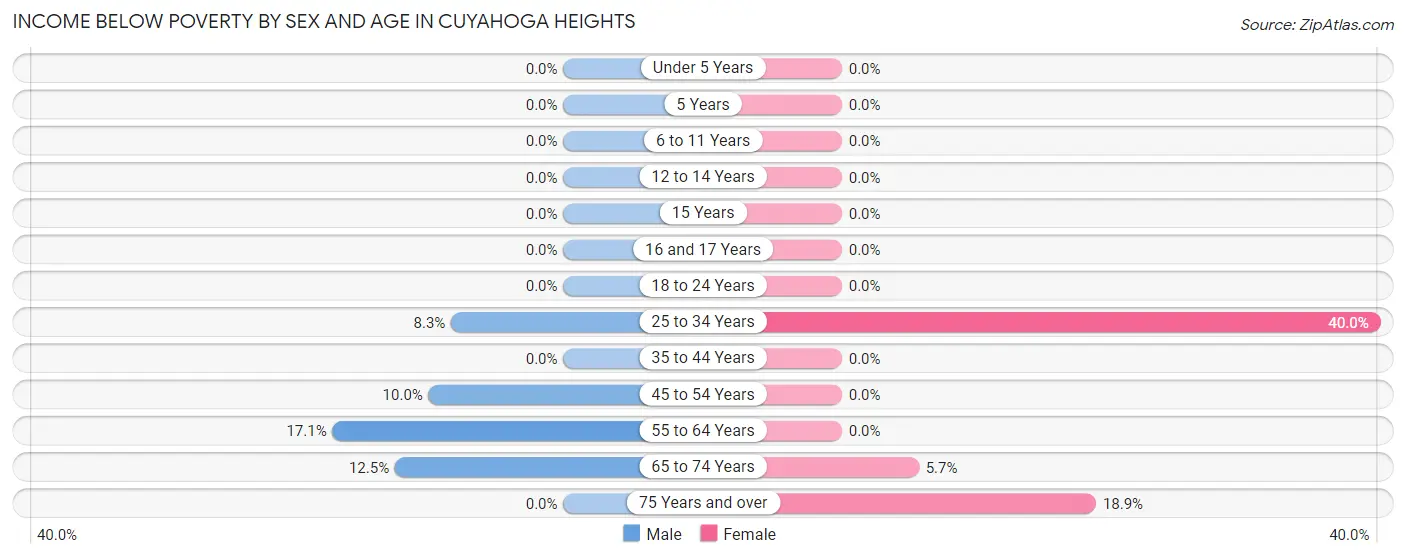
| Age Bracket | Male | Female |
| Under 5 Years | 0 (0.0%) | 0 (0.0%) |
| 5 Years | 0 (0.0%) | 0 (0.0%) |
| 6 to 11 Years | 0 (0.0%) | 0 (0.0%) |
| 12 to 14 Years | 0 (0.0%) | 0 (0.0%) |
| 15 Years | 0 (0.0%) | 0 (0.0%) |
| 16 and 17 Years | 0 (0.0%) | 0 (0.0%) |
| 18 to 24 Years | 0 (0.0%) | 0 (0.0%) |
| 25 to 34 Years | 3 (8.3%) | 12 (40.0%) |
| 35 to 44 Years | 0 (0.0%) | 0 (0.0%) |
| 45 to 54 Years | 5 (10.0%) | 0 (0.0%) |
| 55 to 64 Years | 6 (17.1%) | 0 (0.0%) |
| 65 to 74 Years | 2 (12.5%) | 2 (5.7%) |
| 75 Years and over | 0 (0.0%) | 10 (18.9%) |
| Total | 16 (5.6%) | 24 (7.1%) |
Income Above Poverty by Sex and Age in Cuyahoga Heights
According to the poverty statistics in Cuyahoga Heights, males aged under 5 years and females aged under 5 years are the age groups that are most secure financially, with 100.0% of males and 100.0% of females in these age groups living above the poverty line.
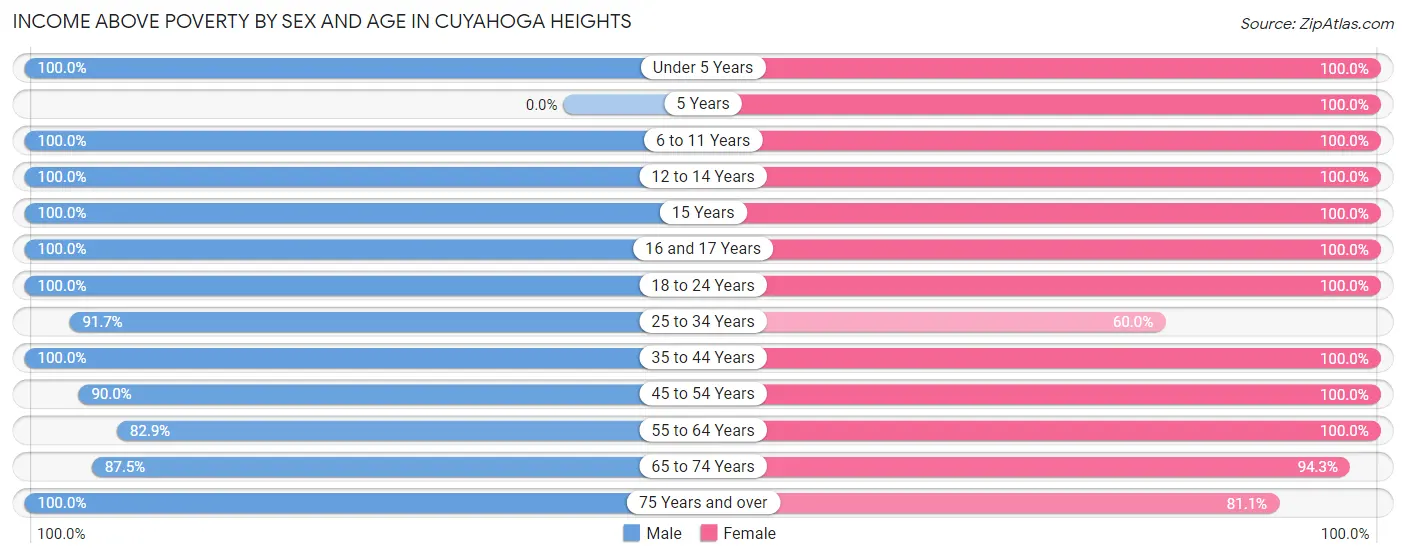
| Age Bracket | Male | Female |
| Under 5 Years | 42 (100.0%) | 16 (100.0%) |
| 5 Years | 0 (0.0%) | 2 (100.0%) |
| 6 to 11 Years | 15 (100.0%) | 19 (100.0%) |
| 12 to 14 Years | 18 (100.0%) | 13 (100.0%) |
| 15 Years | 4 (100.0%) | 2 (100.0%) |
| 16 and 17 Years | 4 (100.0%) | 6 (100.0%) |
| 18 to 24 Years | 18 (100.0%) | 29 (100.0%) |
| 25 to 34 Years | 33 (91.7%) | 18 (60.0%) |
| 35 to 44 Years | 39 (100.0%) | 53 (100.0%) |
| 45 to 54 Years | 45 (90.0%) | 43 (100.0%) |
| 55 to 64 Years | 29 (82.9%) | 38 (100.0%) |
| 65 to 74 Years | 14 (87.5%) | 33 (94.3%) |
| 75 Years and over | 11 (100.0%) | 43 (81.1%) |
| Total | 272 (94.4%) | 315 (92.9%) |
Income Below Poverty Among Married-Couple Families in Cuyahoga Heights
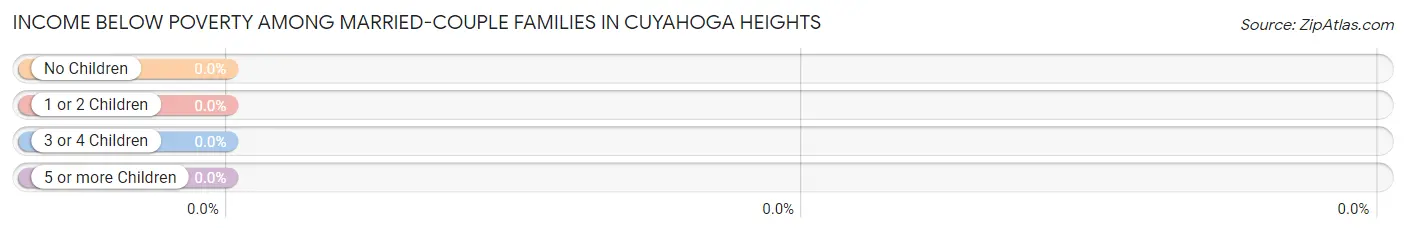
| Children | Above Poverty | Below Poverty |
| No Children | 33 (100.0%) | 0 (0.0%) |
| 1 or 2 Children | 19 (100.0%) | 0 (0.0%) |
| 3 or 4 Children | 0 (0.0%) | 0 (0.0%) |
| 5 or more Children | 0 (0.0%) | 0 (0.0%) |
| Total | 52 (100.0%) | 0 (0.0%) |
Income Below Poverty Among Single-Parent Households in Cuyahoga Heights
| Children | Single Father | Single Mother |
| No Children | 0 (0.0%) | 0 (0.0%) |
| 1 or 2 Children | 0 (0.0%) | 0 (0.0%) |
| 3 or 4 Children | 0 (0.0%) | 0 (0.0%) |
| 5 or more Children | 0 (0.0%) | 0 (0.0%) |
| Total | 0 (0.0%) | 0 (0.0%) |
Income Below Poverty Among Married-Couple vs Single-Parent Households in Cuyahoga Heights
| Children | Married-Couple Families | Single-Parent Households |
| No Children | 0 (0.0%) | 0 (0.0%) |
| 1 or 2 Children | 0 (0.0%) | 0 (0.0%) |
| 3 or 4 Children | 0 (0.0%) | 0 (0.0%) |
| 5 or more Children | 0 (0.0%) | 0 (0.0%) |
| Total | 0 (0.0%) | 0 (0.0%) |
Race in Cuyahoga Heights
The most populous races in Cuyahoga Heights are White / Caucasian (585 | 93.3%), Asian (25 | 4.0%), and Two or more Races (14 | 2.2%).
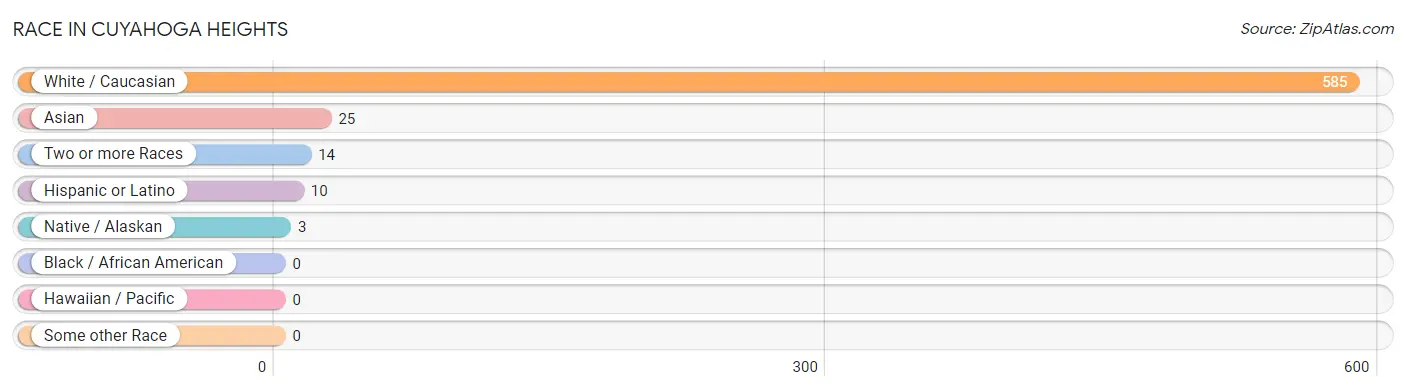
| Race | # Population | % Population |
| Asian | 25 | 4.0% |
| Black / African American | 0 | 0.0% |
| Hawaiian / Pacific | 0 | 0.0% |
| Hispanic or Latino | 10 | 1.6% |
| Native / Alaskan | 3 | 0.5% |
| White / Caucasian | 585 | 93.3% |
| Two or more Races | 14 | 2.2% |
| Some other Race | 0 | 0.0% |
| Total | 627 | 100.0% |
Ancestry in Cuyahoga Heights
The most populous ancestries reported in Cuyahoga Heights are German (150 | 23.9%), Polish (138 | 22.0%), Italian (117 | 18.7%), Irish (95 | 15.1%), and English (70 | 11.2%), together accounting for 90.9% of all Cuyahoga Heights residents.
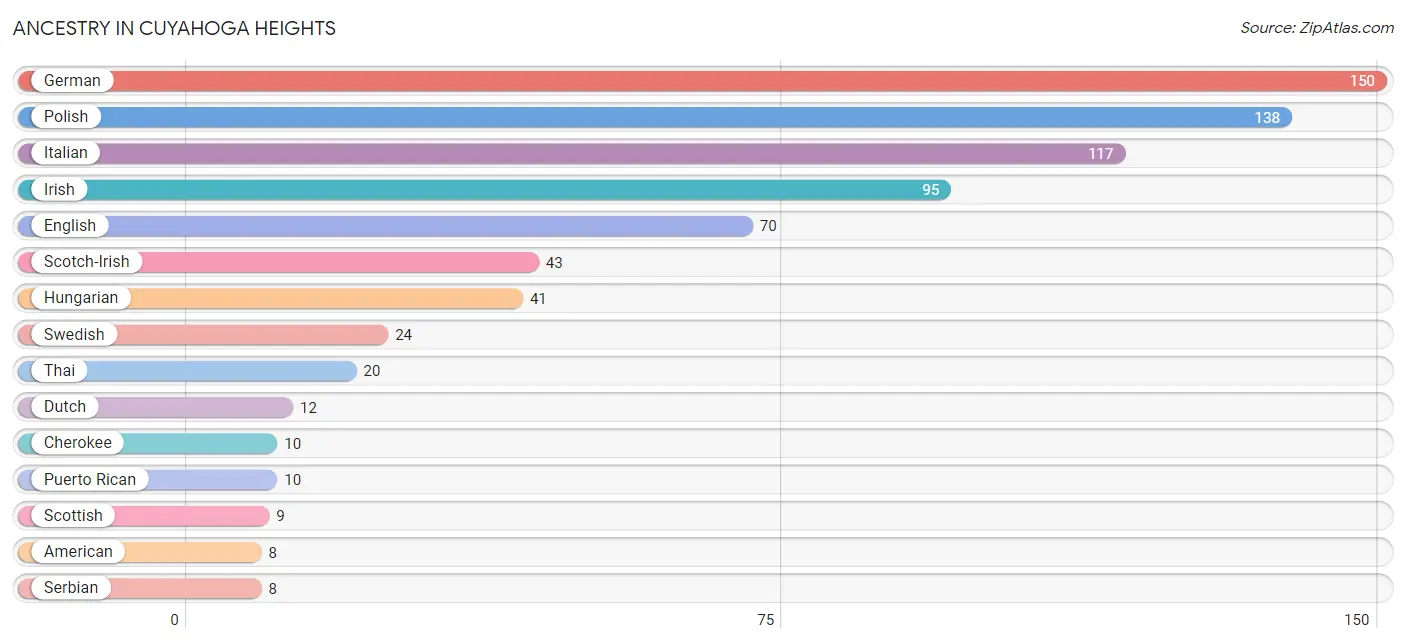
| Ancestry | # Population | % Population |
| American | 8 | 1.3% |
| Arab | 3 | 0.5% |
| Belgian | 2 | 0.3% |
| Bhutanese | 5 | 0.8% |
| Canadian | 1 | 0.2% |
| Cherokee | 10 | 1.6% |
| Croatian | 4 | 0.6% |
| Czech | 7 | 1.1% |
| Danish | 2 | 0.3% |
| Dutch | 12 | 1.9% |
| Eastern European | 3 | 0.5% |
| English | 70 | 11.2% |
| European | 2 | 0.3% |
| German | 150 | 23.9% |
| Greek | 3 | 0.5% |
| Hungarian | 41 | 6.5% |
| Irish | 95 | 15.1% |
| Italian | 117 | 18.7% |
| Lebanese | 3 | 0.5% |
| Polish | 138 | 22.0% |
| Puerto Rican | 10 | 1.6% |
| Romanian | 2 | 0.3% |
| Scotch-Irish | 43 | 6.9% |
| Scottish | 9 | 1.4% |
| Serbian | 8 | 1.3% |
| Slovak | 8 | 1.3% |
| Slovene | 3 | 0.5% |
| Swedish | 24 | 3.8% |
| Swiss | 2 | 0.3% |
| Thai | 20 | 3.2% |
| Welsh | 3 | 0.5% | View All 31 Rows |
Immigrants in Cuyahoga Heights
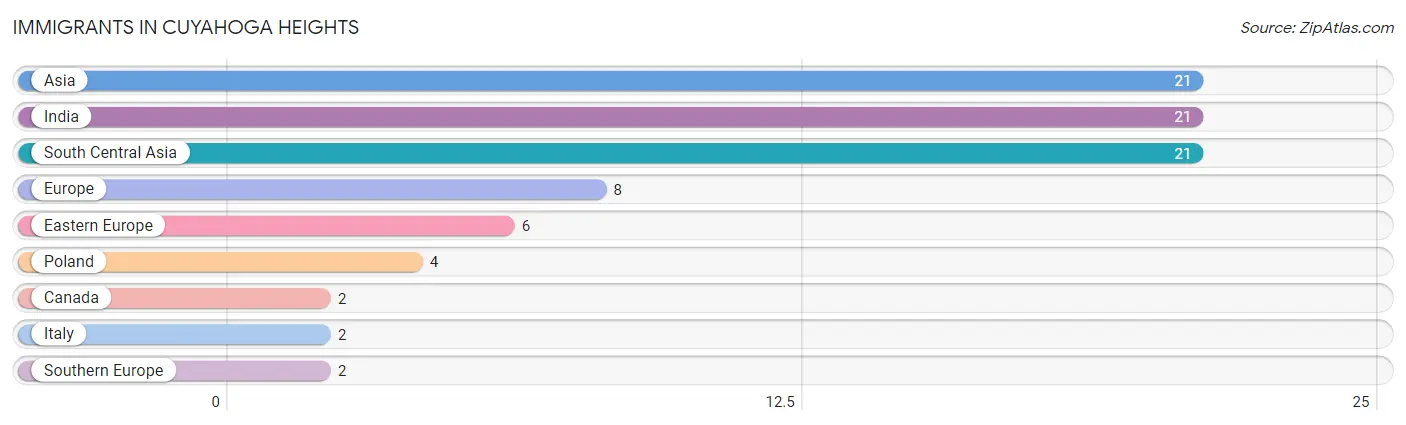
The most numerous immigrant groups reported in Cuyahoga Heights came from Asia (21 | 3.4%), India (21 | 3.4%), South Central Asia (21 | 3.4%), Europe (8 | 1.3%), and Eastern Europe (6 | 1.0%), together accounting for 12.3% of all Cuyahoga Heights residents.
| Immigration Origin | # Population | % Population |
| Asia | 21 | 3.4% |
| Canada | 2 | 0.3% |
| Eastern Europe | 6 | 1.0% |
| Europe | 8 | 1.3% |
| India | 21 | 3.4% |
| Italy | 2 | 0.3% |
| Poland | 4 | 0.6% |
| South Central Asia | 21 | 3.4% |
| Southern Europe | 2 | 0.3% | View All 9 Rows |
Sex and Age in Cuyahoga Heights
Sex and Age in Cuyahoga Heights
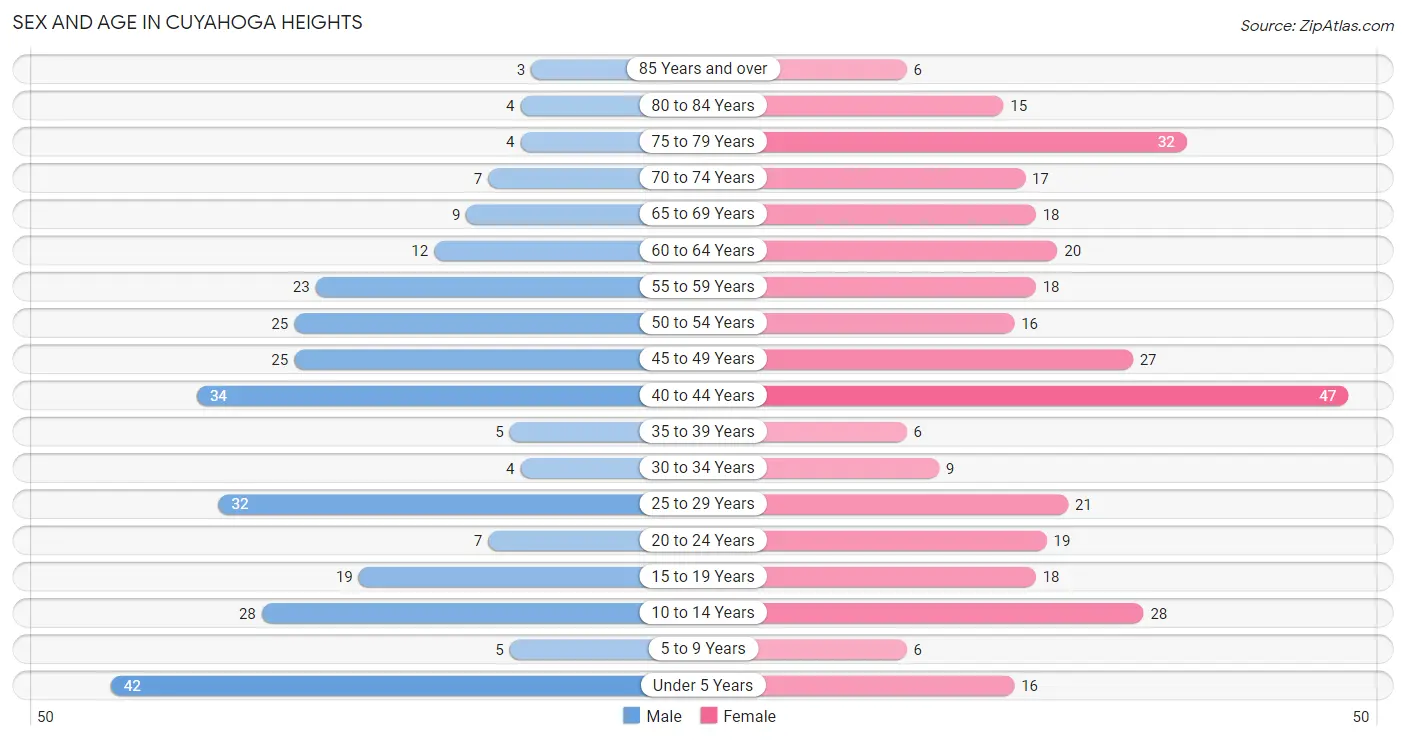
The most populous age groups in Cuyahoga Heights are Under 5 Years (42 | 14.6%) for men and 40 to 44 Years (47 | 13.9%) for women.
| Age Bracket | Male | Female |
| Under 5 Years | 42 (14.6%) | 16 (4.7%) |
| 5 to 9 Years | 5 (1.7%) | 6 (1.8%) |
| 10 to 14 Years | 28 (9.7%) | 28 (8.3%) |
| 15 to 19 Years | 19 (6.6%) | 18 (5.3%) |
| 20 to 24 Years | 7 (2.4%) | 19 (5.6%) |
| 25 to 29 Years | 32 (11.1%) | 21 (6.2%) |
| 30 to 34 Years | 4 (1.4%) | 9 (2.6%) |
| 35 to 39 Years | 5 (1.7%) | 6 (1.8%) |
| 40 to 44 Years | 34 (11.8%) | 47 (13.9%) |
| 45 to 49 Years | 25 (8.7%) | 27 (8.0%) |
| 50 to 54 Years | 25 (8.7%) | 16 (4.7%) |
| 55 to 59 Years | 23 (8.0%) | 18 (5.3%) |
| 60 to 64 Years | 12 (4.2%) | 20 (5.9%) |
| 65 to 69 Years | 9 (3.1%) | 18 (5.3%) |
| 70 to 74 Years | 7 (2.4%) | 17 (5.0%) |
| 75 to 79 Years | 4 (1.4%) | 32 (9.4%) |
| 80 to 84 Years | 4 (1.4%) | 15 (4.4%) |
| 85 Years and over | 3 (1.0%) | 6 (1.8%) |
| Total | 288 (100.0%) | 339 (100.0%) |
Families and Households in Cuyahoga Heights
Median Family Size in Cuyahoga Heights
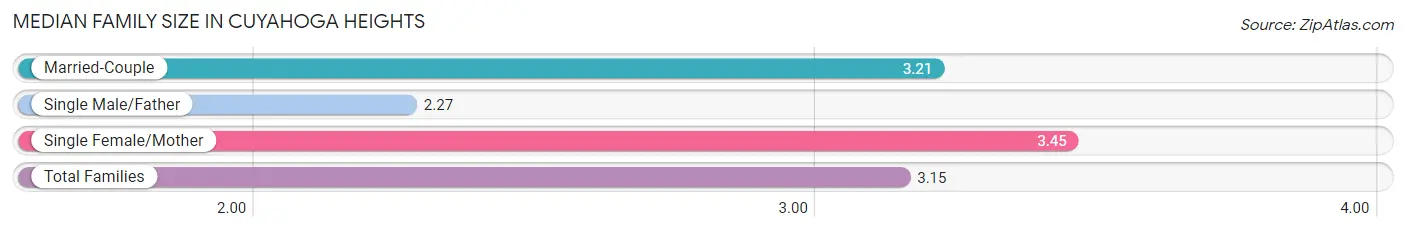
The median family size in Cuyahoga Heights is 3.15 persons per family, with single female/mother families (64 | 45.1%) accounting for the largest median family size of 3.45 persons per family. On the other hand, single male/father families (26 | 18.3%) represent the smallest median family size with 2.27 persons per family.
| Family Type | # Families | Family Size |
| Married-Couple | 52 (36.6%) | 3.21 |
| Single Male/Father | 26 (18.3%) | 2.27 |
| Single Female/Mother | 64 (45.1%) | 3.45 |
| Total Families | 142 (100.0%) | 3.15 |
Median Household Size in Cuyahoga Heights
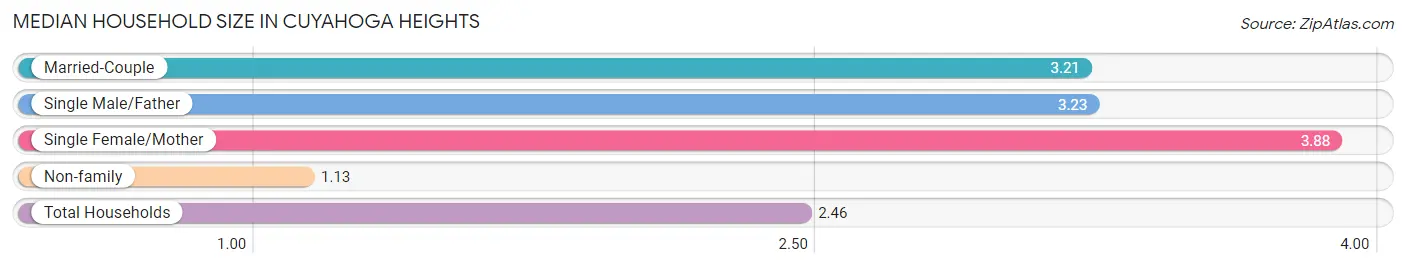
The median household size in Cuyahoga Heights is 2.46 persons per household, with single female/mother households (64 | 25.1%) accounting for the largest median household size of 3.88 persons per household. non-family households (113 | 44.3%) represent the smallest median household size with 1.13 persons per household.
| Household Type | # Households | Household Size |
| Married-Couple | 52 (20.4%) | 3.21 |
| Single Male/Father | 26 (10.2%) | 3.23 |
| Single Female/Mother | 64 (25.1%) | 3.88 |
| Non-family | 113 (44.3%) | 1.13 |
| Total Households | 255 (100.0%) | 2.46 |
Household Size by Marriage Status in Cuyahoga Heights
Out of a total of 255 households in Cuyahoga Heights, 142 (55.7%) are family households, while 113 (44.3%) are nonfamily households. The most numerous type of family households are 3-person households, comprising 39, and the most common type of nonfamily households are 1-person households, comprising 98.
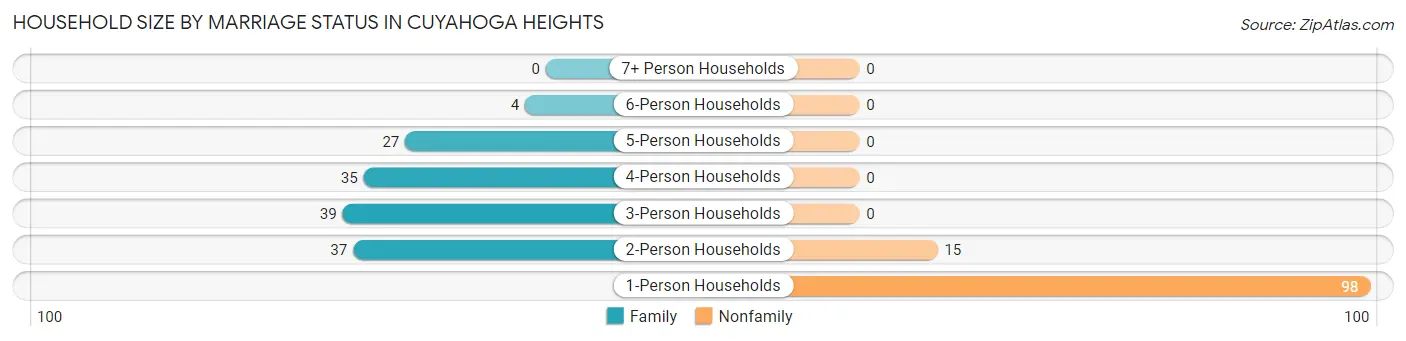
| Household Size | Family Households | Nonfamily Households |
| 1-Person Households | - | 98 (38.4%) |
| 2-Person Households | 37 (14.5%) | 15 (5.9%) |
| 3-Person Households | 39 (15.3%) | 0 (0.0%) |
| 4-Person Households | 35 (13.7%) | 0 (0.0%) |
| 5-Person Households | 27 (10.6%) | 0 (0.0%) |
| 6-Person Households | 4 (1.6%) | 0 (0.0%) |
| 7+ Person Households | 0 (0.0%) | 0 (0.0%) |
| Total | 142 (55.7%) | 113 (44.3%) |
Female Fertility in Cuyahoga Heights
Fertility by Age in Cuyahoga Heights
Average fertility rate in Cuyahoga Heights is 48.0 births per 1,000 women. Women in the age bracket of 20 to 34 years have the highest fertility rate with 102.0 births per 1,000 women. Women in the age bracket of 20 to 34 years acount for 71.4% of all women with births.
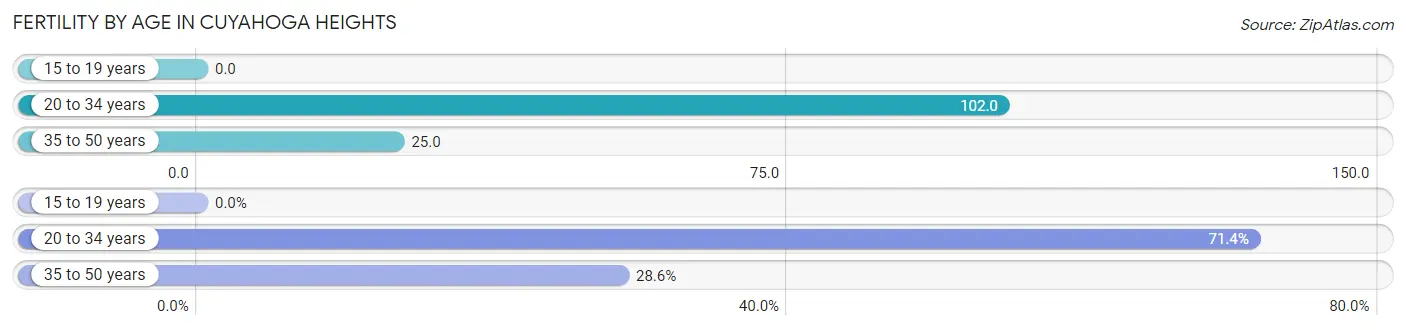
| Age Bracket | Women with Births | Births / 1,000 Women |
| 15 to 19 years | 0 (0.0%) | 0.0 |
| 20 to 34 years | 5 (71.4%) | 102.0 |
| 35 to 50 years | 2 (28.6%) | 25.0 |
| Total | 7 (100.0%) | 48.0 |
Fertility by Age by Marriage Status in Cuyahoga Heights
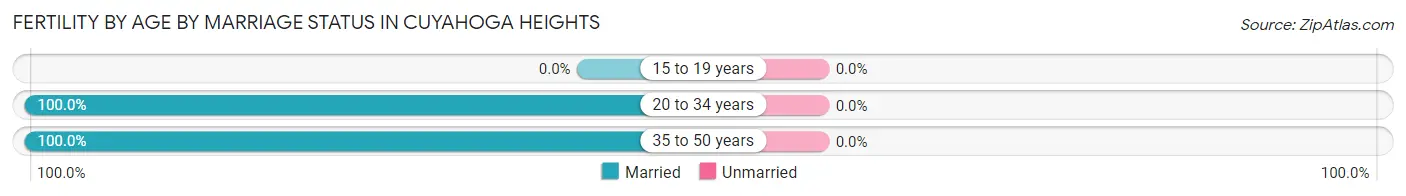
| Age Bracket | Married | Unmarried |
| 15 to 19 years | 0 (0.0%) | 0 (0.0%) |
| 20 to 34 years | 5 (100.0%) | 0 (0.0%) |
| 35 to 50 years | 2 (100.0%) | 0 (0.0%) |
| Total | 7 (100.0%) | 0 (0.0%) |
Fertility by Education in Cuyahoga Heights
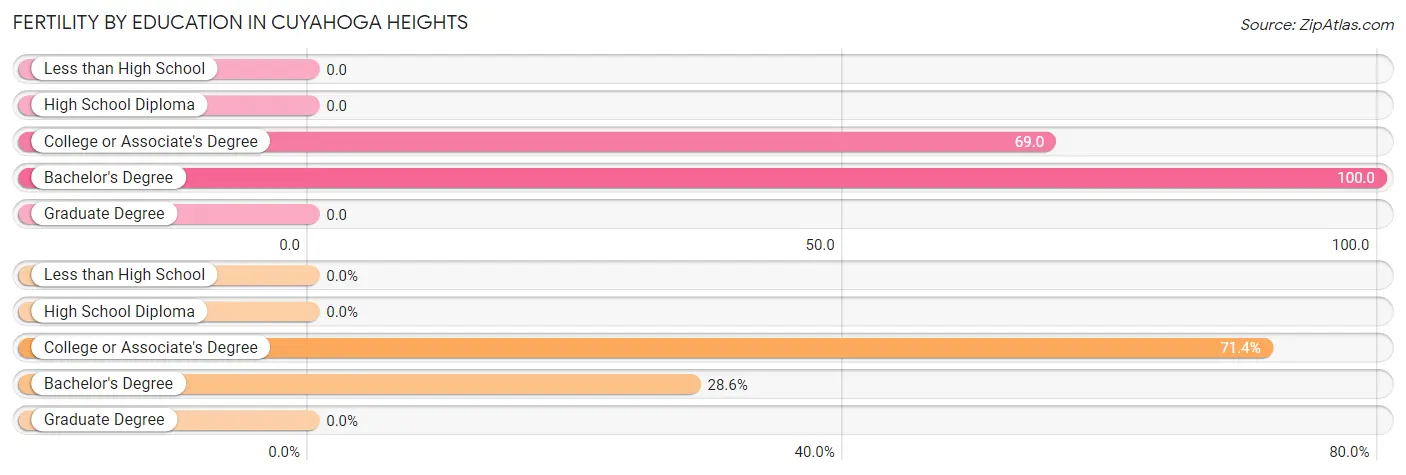
| Educational Attainment | Women with Births | Births / 1,000 Women |
| Less than High School | 0 (0.0%) | 0.0 |
| High School Diploma | 0 (0.0%) | 0.0 |
| College or Associate's Degree | 5 (71.4%) | 69.0 |
| Bachelor's Degree | 2 (28.6%) | 100.0 |
| Graduate Degree | 0 (0.0%) | 0.0 |
| Total | 7 (100.0%) | 48.0 |
Fertility by Education by Marriage Status in Cuyahoga Heights
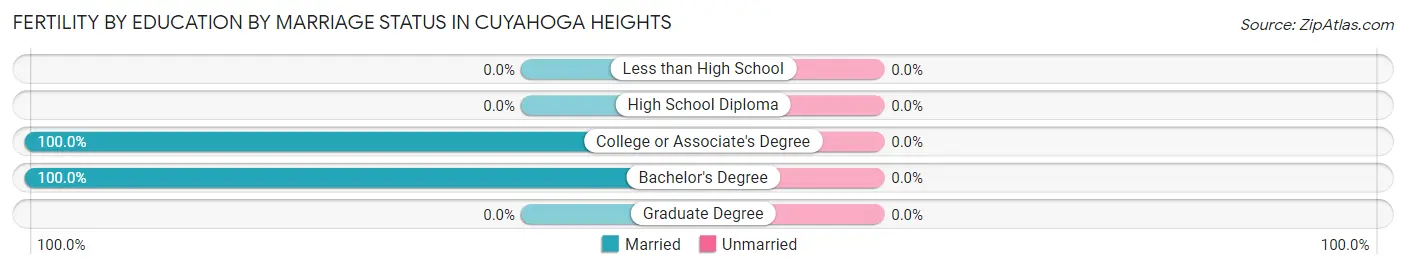
| Educational Attainment | Married | Unmarried |
| Less than High School | 0 (0.0%) | 0 (0.0%) |
| High School Diploma | 0 (0.0%) | 0 (0.0%) |
| College or Associate's Degree | 5 (100.0%) | 0 (0.0%) |
| Bachelor's Degree | 2 (100.0%) | 0 (0.0%) |
| Graduate Degree | 0 (0.0%) | 0 (0.0%) |
| Total | 7 (100.0%) | 0 (0.0%) |
Employment Characteristics in Cuyahoga Heights
Employment by Class of Employer in Cuyahoga Heights
Among the 298 employed individuals in Cuyahoga Heights, private company employees (175 | 58.7%), local government employees (71 | 23.8%), and federal government employees (17 | 5.7%) make up the most common classes of employment.
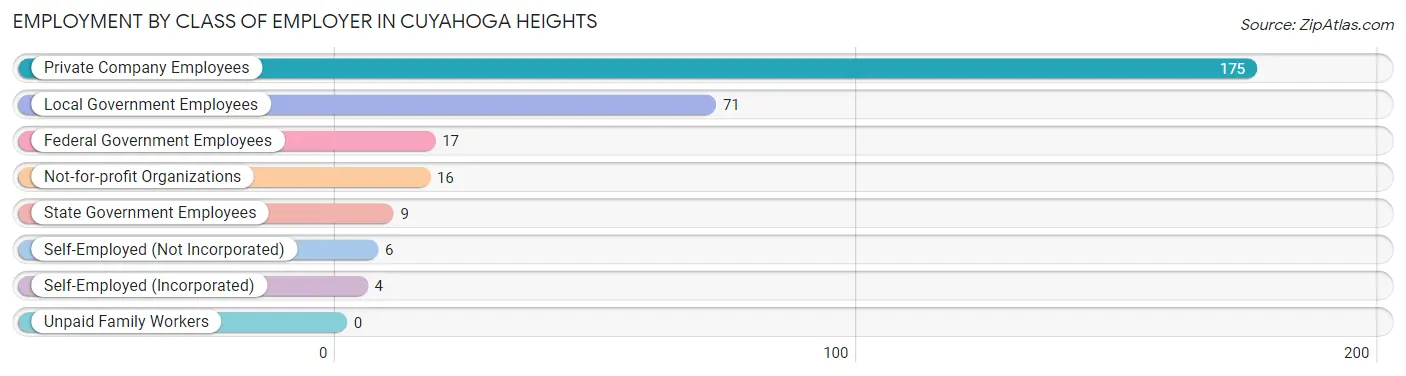
| Employer Class | # Employees | % Employees |
| Private Company Employees | 175 | 58.7% |
| Self-Employed (Incorporated) | 4 | 1.3% |
| Self-Employed (Not Incorporated) | 6 | 2.0% |
| Not-for-profit Organizations | 16 | 5.4% |
| Local Government Employees | 71 | 23.8% |
| State Government Employees | 9 | 3.0% |
| Federal Government Employees | 17 | 5.7% |
| Unpaid Family Workers | 0 | 0.0% |
| Total | 298 | 100.0% |
Employment Status by Age in Cuyahoga Heights
According to the labor force statistics for Cuyahoga Heights, out of the total population over 16 years of age (496), 66.3% or 329 individuals are in the labor force, with 8.5% or 28 of them unemployed. The age group with the highest labor force participation rate is 20 to 24 years, with 100.0% or 26 individuals in the labor force. Within the labor force, the 75 years and over age range has the highest percentage of unemployed individuals, with 100.0% or 3 of them being unemployed.
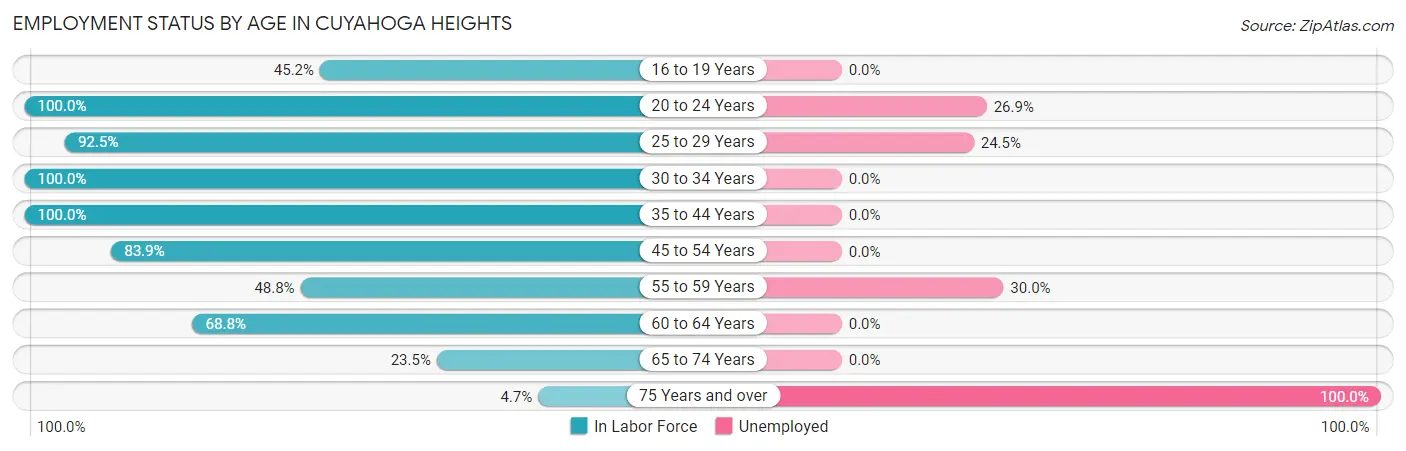
| Age Bracket | In Labor Force | Unemployed |
| 16 to 19 Years | 14 (45.2%) | 0 (0.0%) |
| 20 to 24 Years | 26 (100.0%) | 7 (26.9%) |
| 25 to 29 Years | 49 (92.5%) | 12 (24.5%) |
| 30 to 34 Years | 13 (100.0%) | 0 (0.0%) |
| 35 to 44 Years | 92 (100.0%) | 0 (0.0%) |
| 45 to 54 Years | 78 (83.9%) | 0 (0.0%) |
| 55 to 59 Years | 20 (48.8%) | 6 (30.0%) |
| 60 to 64 Years | 22 (68.8%) | 0 (0.0%) |
| 65 to 74 Years | 12 (23.5%) | 0 (0.0%) |
| 75 Years and over | 3 (4.7%) | 3 (100.0%) |
| Total | 329 (66.3%) | 28 (8.5%) |
Employment Status by Educational Attainment in Cuyahoga Heights
According to labor force statistics for Cuyahoga Heights, 84.6% of individuals (274) out of the total population between 25 and 64 years of age (324) are in the labor force, with 6.6% or 18 of them being unemployed. The group with the highest labor force participation rate are those with the educational attainment of high school diploma, with 88.6% or 101 individuals in the labor force. Within the labor force, individuals with college / associate degree education have the highest percentage of unemployment, with 12.1% or 14 of them being unemployed.
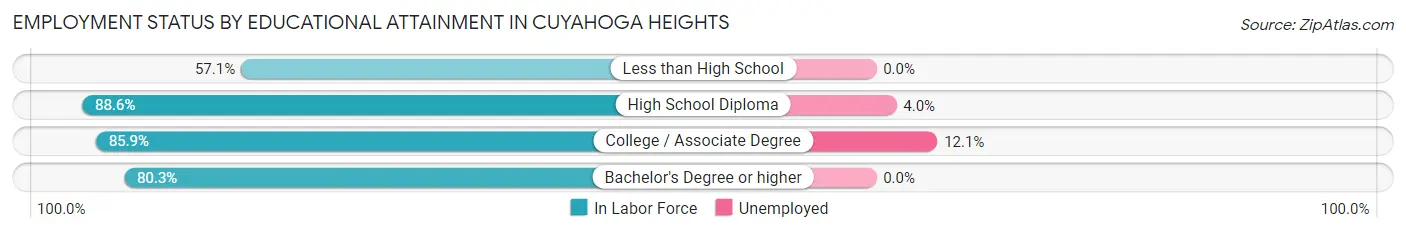
| Educational Attainment | In Labor Force | Unemployed |
| Less than High School | 8 (57.1%) | 0 (0.0%) |
| High School Diploma | 101 (88.6%) | 5 (4.0%) |
| College / Associate Degree | 116 (85.9%) | 16 (12.1%) |
| Bachelor's Degree or higher | 49 (80.3%) | 0 (0.0%) |
| Total | 274 (84.6%) | 21 (6.6%) |
Employment Occupations by Sex in Cuyahoga Heights
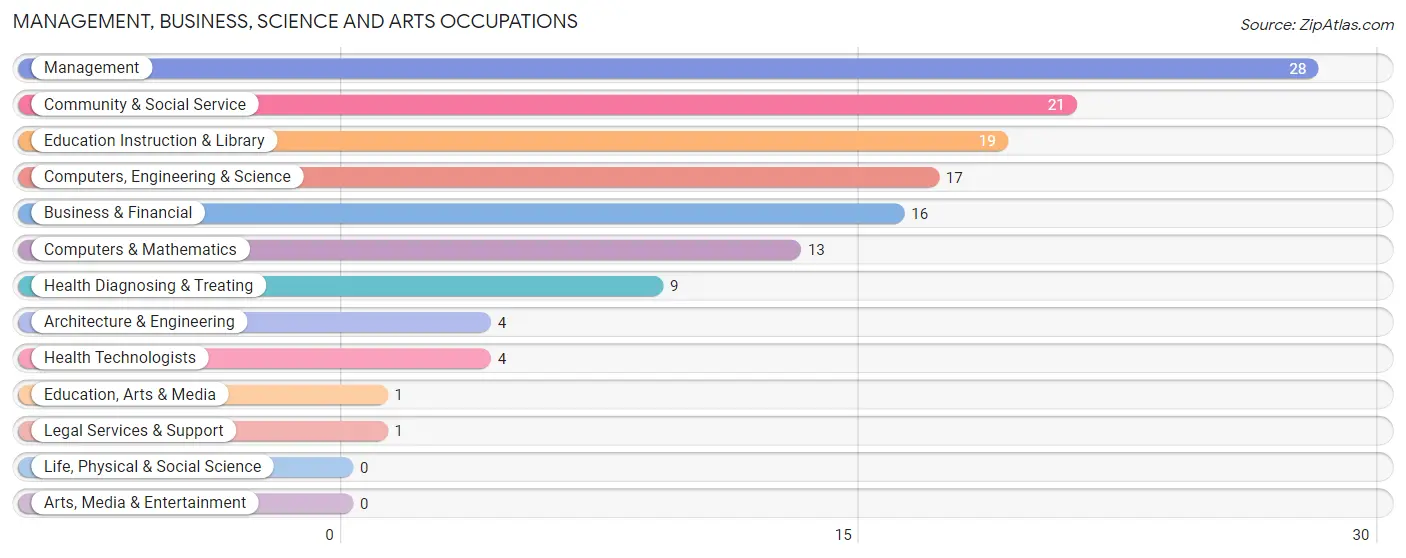
Management, Business, Science and Arts Occupations
The most common Management, Business, Science and Arts occupations in Cuyahoga Heights are Management (28 | 9.3%), Community & Social Service (21 | 7.0%), Education Instruction & Library (19 | 6.3%), Computers, Engineering & Science (17 | 5.7%), and Business & Financial (16 | 5.3%).
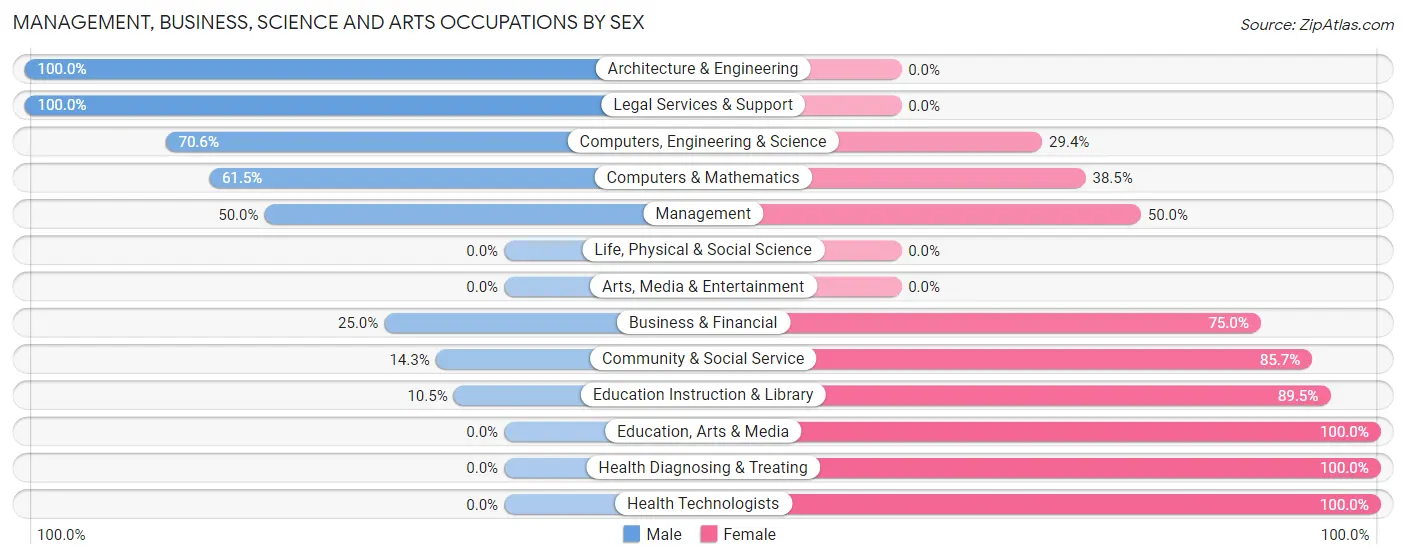
Management, Business, Science and Arts Occupations by Sex
Within the Management, Business, Science and Arts occupations in Cuyahoga Heights, the most male-oriented occupations are Architecture & Engineering (100.0%), Legal Services & Support (100.0%), and Computers, Engineering & Science (70.6%), while the most female-oriented occupations are Education, Arts & Media (100.0%), Health Diagnosing & Treating (100.0%), and Health Technologists (100.0%).
| Occupation | Male | Female |
| Management | 14 (50.0%) | 14 (50.0%) |
| Business & Financial | 4 (25.0%) | 12 (75.0%) |
| Computers, Engineering & Science | 12 (70.6%) | 5 (29.4%) |
| Computers & Mathematics | 8 (61.5%) | 5 (38.5%) |
| Architecture & Engineering | 4 (100.0%) | 0 (0.0%) |
| Life, Physical & Social Science | 0 (0.0%) | 0 (0.0%) |
| Community & Social Service | 3 (14.3%) | 18 (85.7%) |
| Education, Arts & Media | 0 (0.0%) | 1 (100.0%) |
| Legal Services & Support | 1 (100.0%) | 0 (0.0%) |
| Education Instruction & Library | 2 (10.5%) | 17 (89.5%) |
| Arts, Media & Entertainment | 0 (0.0%) | 0 (0.0%) |
| Health Diagnosing & Treating | 0 (0.0%) | 9 (100.0%) |
| Health Technologists | 0 (0.0%) | 4 (100.0%) |
| Total (Category) | 33 (36.3%) | 58 (63.7%) |
| Total (Overall) | 132 (43.9%) | 169 (56.1%) |
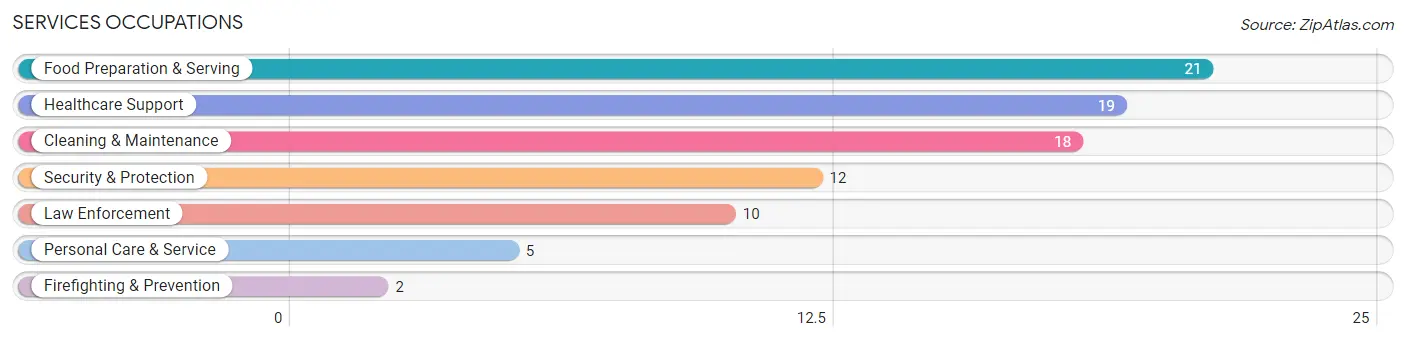
Services Occupations
The most common Services occupations in Cuyahoga Heights are Food Preparation & Serving (21 | 7.0%), Healthcare Support (19 | 6.3%), Cleaning & Maintenance (18 | 6.0%), Security & Protection (12 | 4.0%), and Law Enforcement (10 | 3.3%).
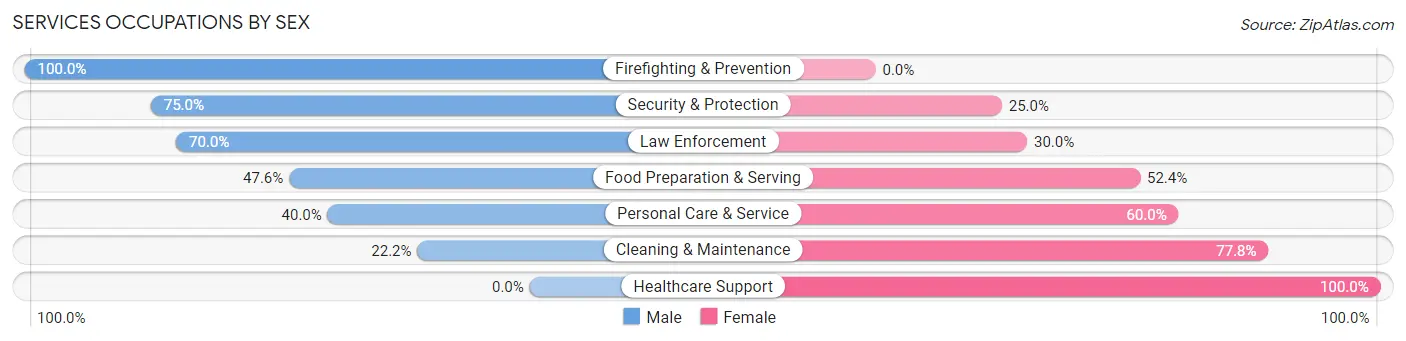
Services Occupations by Sex
Within the Services occupations in Cuyahoga Heights, the most male-oriented occupations are Firefighting & Prevention (100.0%), Security & Protection (75.0%), and Law Enforcement (70.0%), while the most female-oriented occupations are Healthcare Support (100.0%), Cleaning & Maintenance (77.8%), and Personal Care & Service (60.0%).
| Occupation | Male | Female |
| Healthcare Support | 0 (0.0%) | 19 (100.0%) |
| Security & Protection | 9 (75.0%) | 3 (25.0%) |
| Firefighting & Prevention | 2 (100.0%) | 0 (0.0%) |
| Law Enforcement | 7 (70.0%) | 3 (30.0%) |
| Food Preparation & Serving | 10 (47.6%) | 11 (52.4%) |
| Cleaning & Maintenance | 4 (22.2%) | 14 (77.8%) |
| Personal Care & Service | 2 (40.0%) | 3 (60.0%) |
| Total (Category) | 25 (33.3%) | 50 (66.7%) |
| Total (Overall) | 132 (43.9%) | 169 (56.1%) |
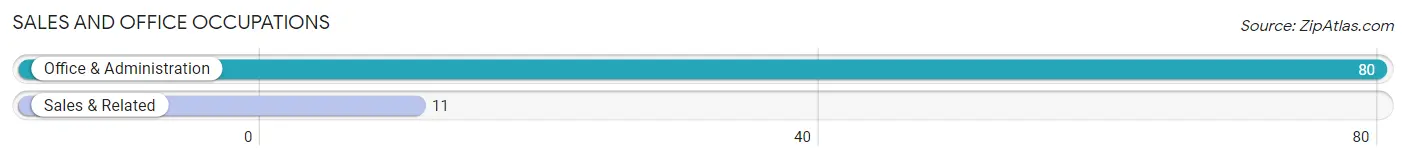
Sales and Office Occupations
The most common Sales and Office occupations in Cuyahoga Heights are Office & Administration (80 | 26.6%), and Sales & Related (11 | 3.6%).
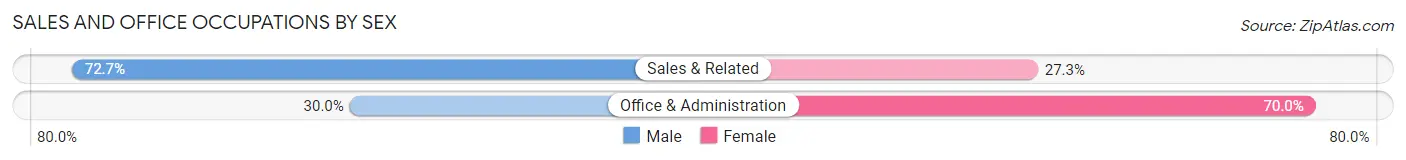
Sales and Office Occupations by Sex
| Occupation | Male | Female |
| Sales & Related | 8 (72.7%) | 3 (27.3%) |
| Office & Administration | 24 (30.0%) | 56 (70.0%) |
| Total (Category) | 32 (35.2%) | 59 (64.8%) |
| Total (Overall) | 132 (43.9%) | 169 (56.1%) |
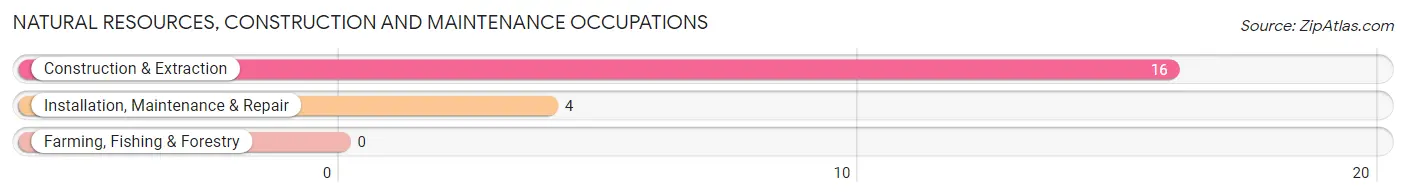
Natural Resources, Construction and Maintenance Occupations
The most common Natural Resources, Construction and Maintenance occupations in Cuyahoga Heights are Construction & Extraction (16 | 5.3%), and Installation, Maintenance & Repair (4 | 1.3%).
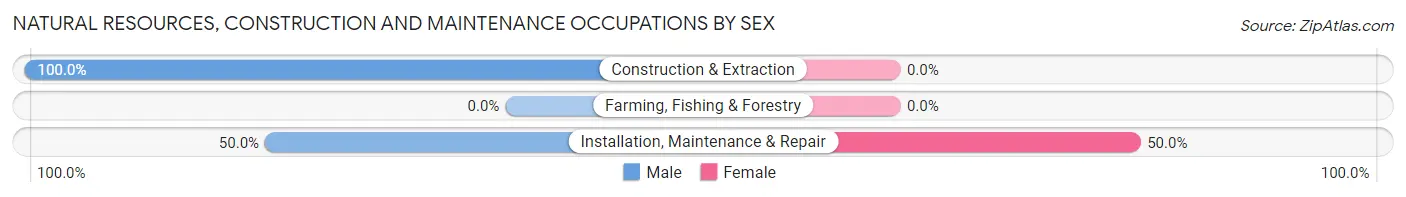
Natural Resources, Construction and Maintenance Occupations by Sex
| Occupation | Male | Female |
| Farming, Fishing & Forestry | 0 (0.0%) | 0 (0.0%) |
| Construction & Extraction | 16 (100.0%) | 0 (0.0%) |
| Installation, Maintenance & Repair | 2 (50.0%) | 2 (50.0%) |
| Total (Category) | 18 (90.0%) | 2 (10.0%) |
| Total (Overall) | 132 (43.9%) | 169 (56.1%) |
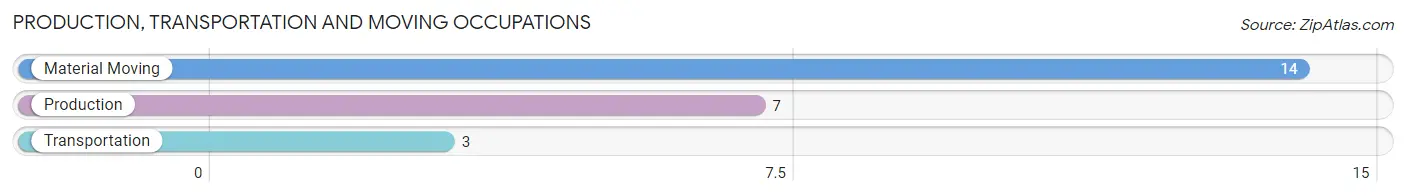
Production, Transportation and Moving Occupations
The most common Production, Transportation and Moving occupations in Cuyahoga Heights are Material Moving (14 | 4.6%), Production (7 | 2.3%), and Transportation (3 | 1.0%).
Production, Transportation and Moving Occupations by Sex
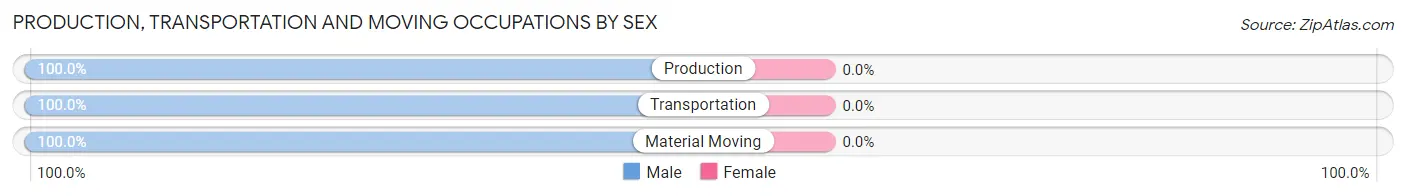
| Occupation | Male | Female |
| Production | 7 (100.0%) | 0 (0.0%) |
| Transportation | 3 (100.0%) | 0 (0.0%) |
| Material Moving | 14 (100.0%) | 0 (0.0%) |
| Total (Category) | 24 (100.0%) | 0 (0.0%) |
| Total (Overall) | 132 (43.9%) | 169 (56.1%) |
Employment Industries by Sex in Cuyahoga Heights
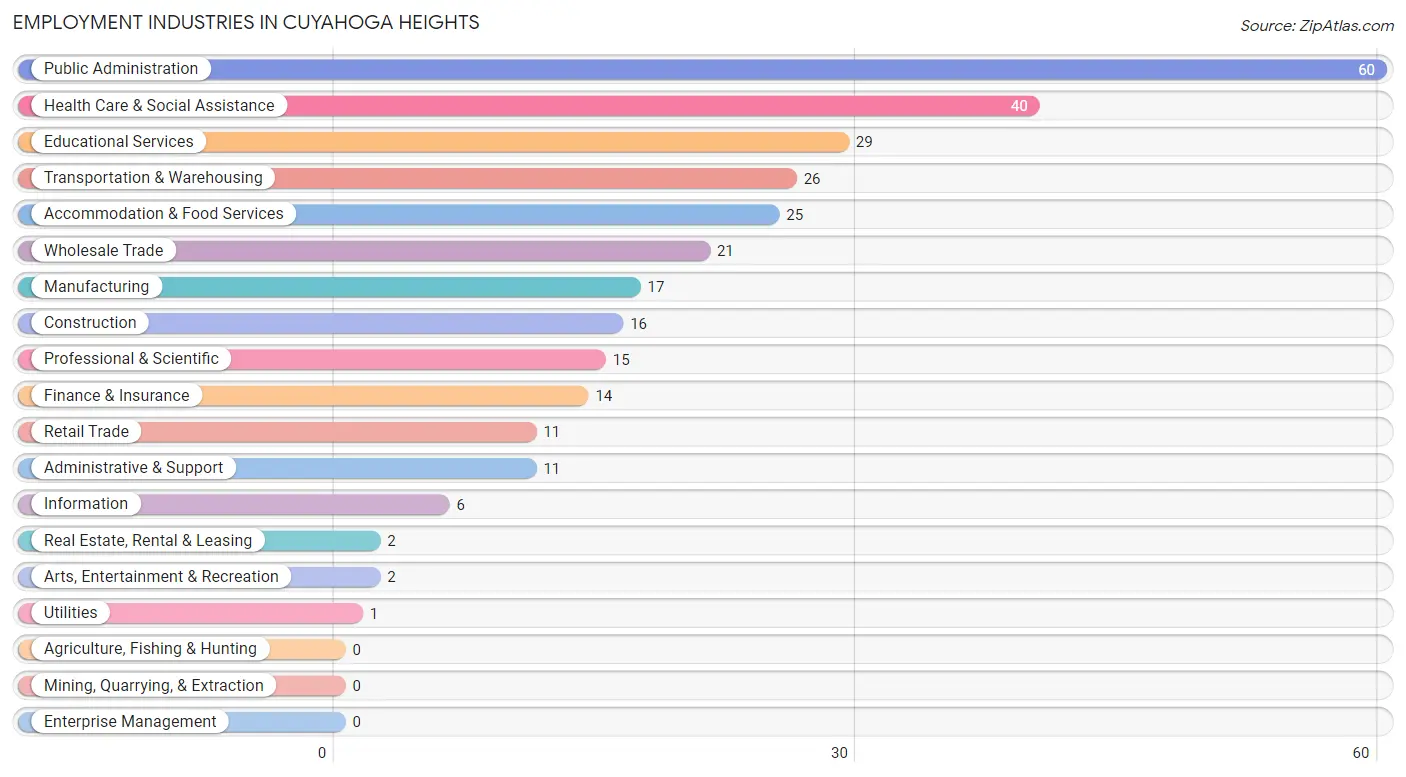
Employment Industries in Cuyahoga Heights
The major employment industries in Cuyahoga Heights include Public Administration (60 | 19.9%), Health Care & Social Assistance (40 | 13.3%), Educational Services (29 | 9.6%), Transportation & Warehousing (26 | 8.6%), and Accommodation & Food Services (25 | 8.3%).
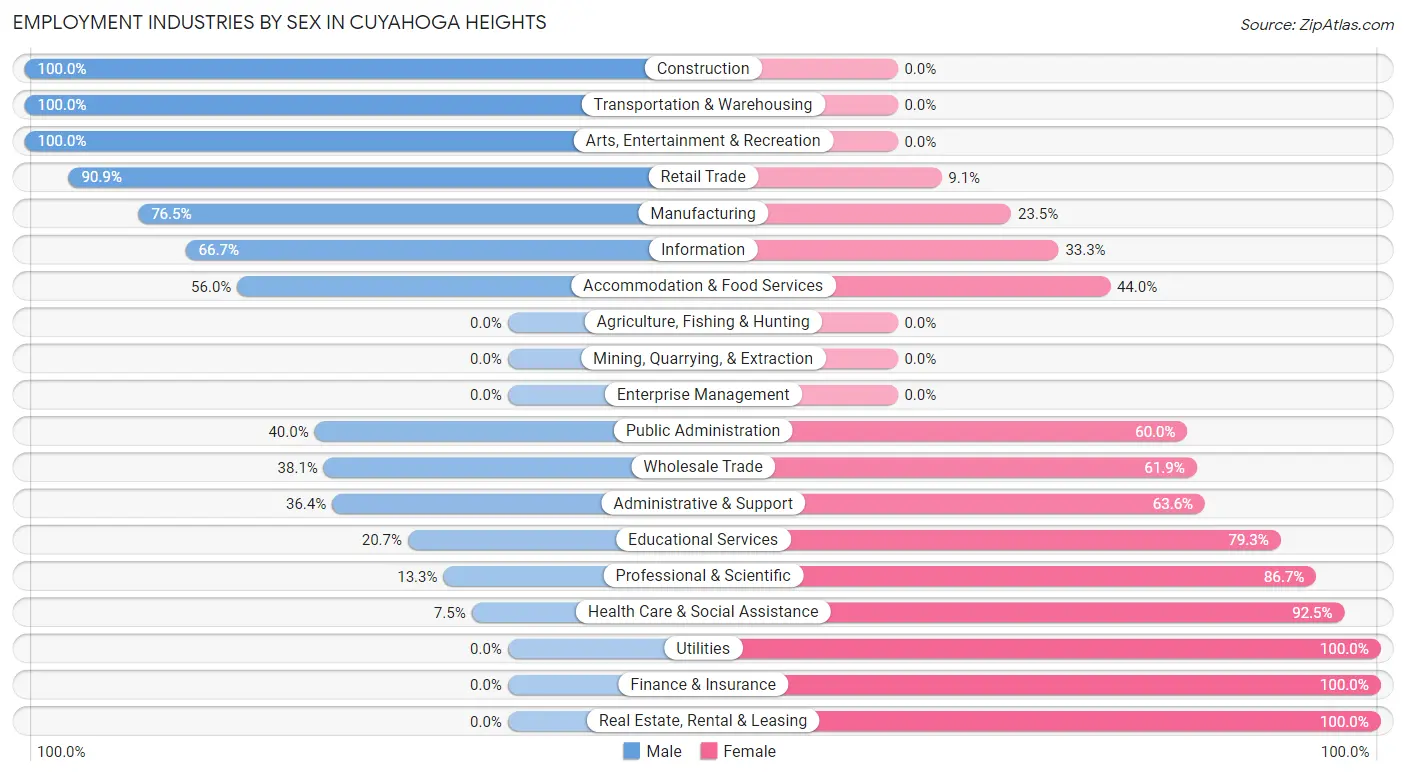
Employment Industries by Sex in Cuyahoga Heights
The Cuyahoga Heights industries that see more men than women are Construction (100.0%), Transportation & Warehousing (100.0%), and Arts, Entertainment & Recreation (100.0%), whereas the industries that tend to have a higher number of women are Utilities (100.0%), Finance & Insurance (100.0%), and Real Estate, Rental & Leasing (100.0%).
| Industry | Male | Female |
| Agriculture, Fishing & Hunting | 0 (0.0%) | 0 (0.0%) |
| Mining, Quarrying, & Extraction | 0 (0.0%) | 0 (0.0%) |
| Construction | 16 (100.0%) | 0 (0.0%) |
| Manufacturing | 13 (76.5%) | 4 (23.5%) |
| Wholesale Trade | 8 (38.1%) | 13 (61.9%) |
| Retail Trade | 10 (90.9%) | 1 (9.1%) |
| Transportation & Warehousing | 26 (100.0%) | 0 (0.0%) |
| Utilities | 0 (0.0%) | 1 (100.0%) |
| Information | 4 (66.7%) | 2 (33.3%) |
| Finance & Insurance | 0 (0.0%) | 14 (100.0%) |
| Real Estate, Rental & Leasing | 0 (0.0%) | 2 (100.0%) |
| Professional & Scientific | 2 (13.3%) | 13 (86.7%) |
| Enterprise Management | 0 (0.0%) | 0 (0.0%) |
| Administrative & Support | 4 (36.4%) | 7 (63.6%) |
| Educational Services | 6 (20.7%) | 23 (79.3%) |
| Health Care & Social Assistance | 3 (7.5%) | 37 (92.5%) |
| Arts, Entertainment & Recreation | 2 (100.0%) | 0 (0.0%) |
| Accommodation & Food Services | 14 (56.0%) | 11 (44.0%) |
| Public Administration | 24 (40.0%) | 36 (60.0%) |
| Total | 132 (43.9%) | 169 (56.1%) |
Education in Cuyahoga Heights
School Enrollment in Cuyahoga Heights
The most common levels of schooling among the 124 students in Cuyahoga Heights are middle school (47 | 37.9%), high school (25 | 20.2%), and college / undergraduate (24 | 19.4%).
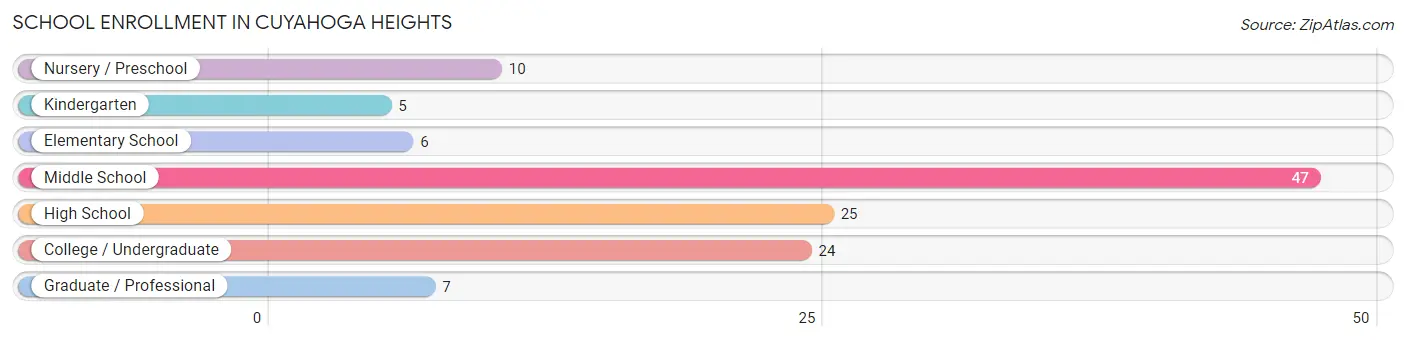
| School Level | # Students | % Students |
| Nursery / Preschool | 10 | 8.1% |
| Kindergarten | 5 | 4.0% |
| Elementary School | 6 | 4.8% |
| Middle School | 47 | 37.9% |
| High School | 25 | 20.2% |
| College / Undergraduate | 24 | 19.4% |
| Graduate / Professional | 7 | 5.7% |
| Total | 124 | 100.0% |
School Enrollment by Age by Funding Source in Cuyahoga Heights
Out of a total of 124 students who are enrolled in schools in Cuyahoga Heights, 10 (8.1%) attend a private institution, while the remaining 114 (91.9%) are enrolled in public schools. The age group of 20 to 24 year olds has the highest likelihood of being enrolled in private schools, with 10 (100.0% in the age bracket) enrolled. Conversely, the age group of 3 to 4 year olds has the lowest likelihood of being enrolled in a private school, with 10 (100.0% in the age bracket) attending a public institution.
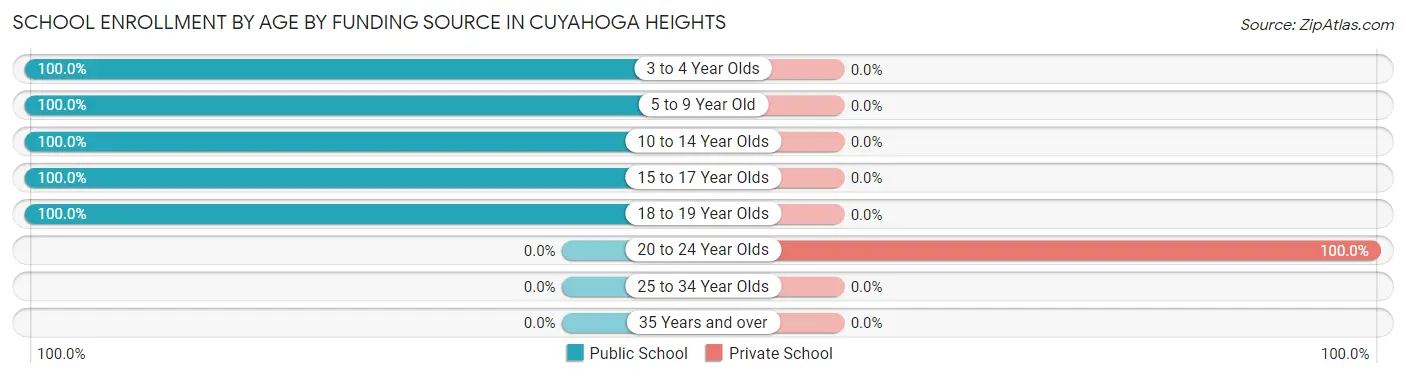
| Age Bracket | Public School | Private School |
| 3 to 4 Year Olds | 10 (100.0%) | 0 (0.0%) |
| 5 to 9 Year Old | 11 (100.0%) | 0 (0.0%) |
| 10 to 14 Year Olds | 56 (100.0%) | 0 (0.0%) |
| 15 to 17 Year Olds | 16 (100.0%) | 0 (0.0%) |
| 18 to 19 Year Olds | 21 (100.0%) | 0 (0.0%) |
| 20 to 24 Year Olds | 0 (0.0%) | 10 (100.0%) |
| 25 to 34 Year Olds | 0 (0.0%) | 0 (0.0%) |
| 35 Years and over | 0 (0.0%) | 0 (0.0%) |
| Total | 114 (91.9%) | 10 (8.1%) |
Educational Attainment by Field of Study in Cuyahoga Heights
Business (23 | 27.7%), social sciences (11 | 13.3%), arts & humanities (9 | 10.8%), computers & mathematics (8 | 9.6%), and education (8 | 9.6%) are the most common fields of study among 83 individuals in Cuyahoga Heights who have obtained a bachelor's degree or higher.
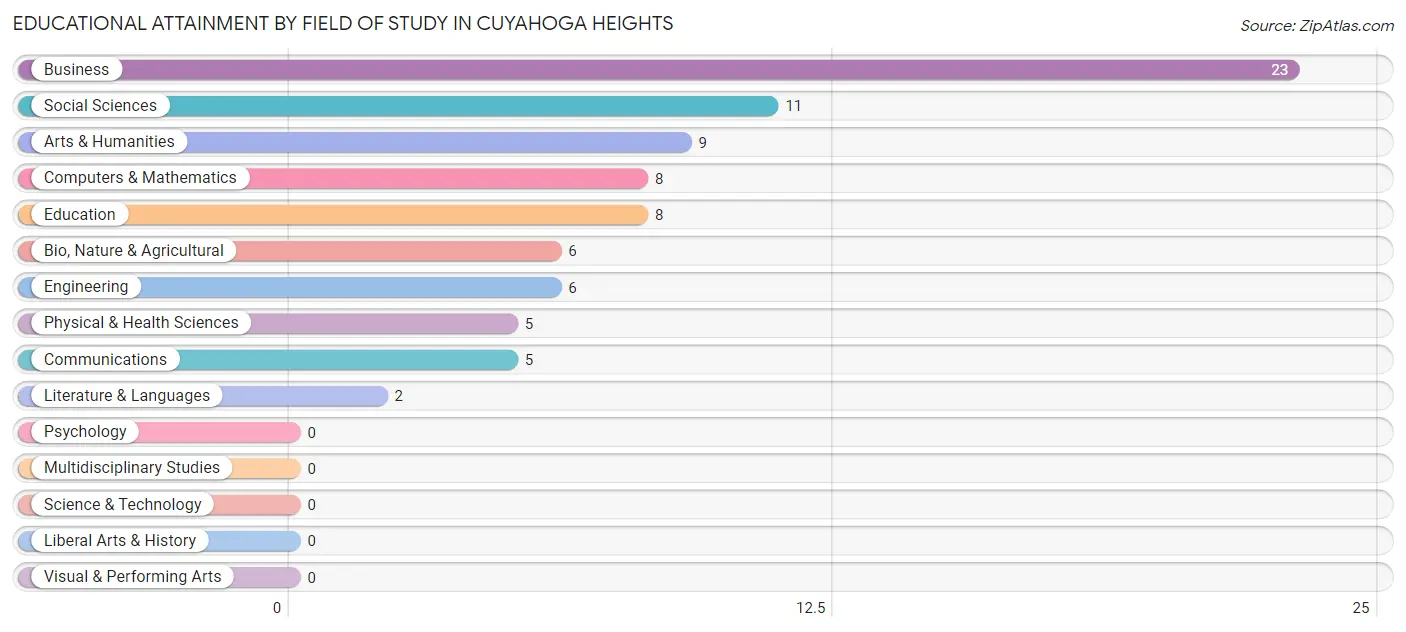
| Field of Study | # Graduates | % Graduates |
| Computers & Mathematics | 8 | 9.6% |
| Bio, Nature & Agricultural | 6 | 7.2% |
| Physical & Health Sciences | 5 | 6.0% |
| Psychology | 0 | 0.0% |
| Social Sciences | 11 | 13.3% |
| Engineering | 6 | 7.2% |
| Multidisciplinary Studies | 0 | 0.0% |
| Science & Technology | 0 | 0.0% |
| Business | 23 | 27.7% |
| Education | 8 | 9.6% |
| Literature & Languages | 2 | 2.4% |
| Liberal Arts & History | 0 | 0.0% |
| Visual & Performing Arts | 0 | 0.0% |
| Communications | 5 | 6.0% |
| Arts & Humanities | 9 | 10.8% |
| Total | 83 | 100.0% |
Transportation & Commute in Cuyahoga Heights
Vehicle Availability by Sex in Cuyahoga Heights
The most prevalent vehicle ownership categories in Cuyahoga Heights are males with 2 vehicles (68, accounting for 52.3%) and females with 2 vehicles (82, making up 40.5%).
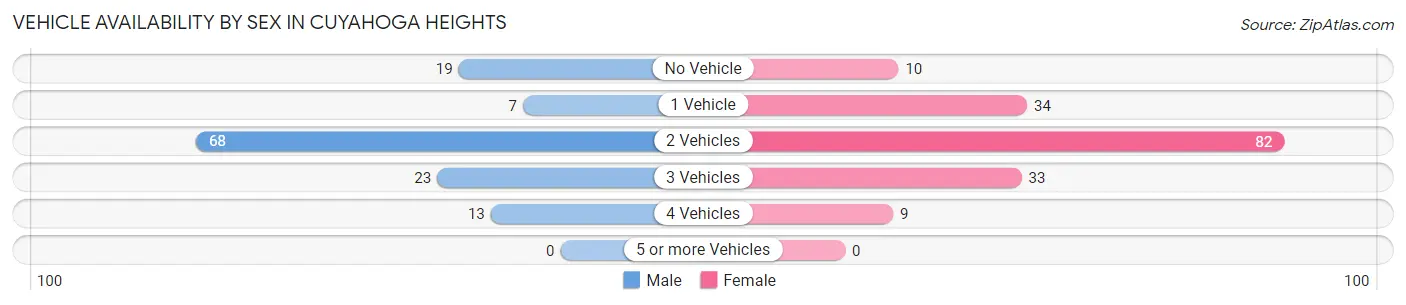
| Vehicles Available | Male | Female |
| No Vehicle | 19 (14.6%) | 10 (5.9%) |
| 1 Vehicle | 7 (5.4%) | 34 (20.2%) |
| 2 Vehicles | 68 (52.3%) | 82 (48.8%) |
| 3 Vehicles | 23 (17.7%) | 33 (19.6%) |
| 4 Vehicles | 13 (10.0%) | 9 (5.4%) |
| 5 or more Vehicles | 0 (0.0%) | 0 (0.0%) |
| Total | 130 (100.0%) | 168 (100.0%) |
Commute Time in Cuyahoga Heights
The most frequently occuring commute durations in Cuyahoga Heights are 15 to 19 minutes (46 commuters, 15.9%), 20 to 24 minutes (42 commuters, 14.5%), and 10 to 14 minutes (36 commuters, 12.5%).
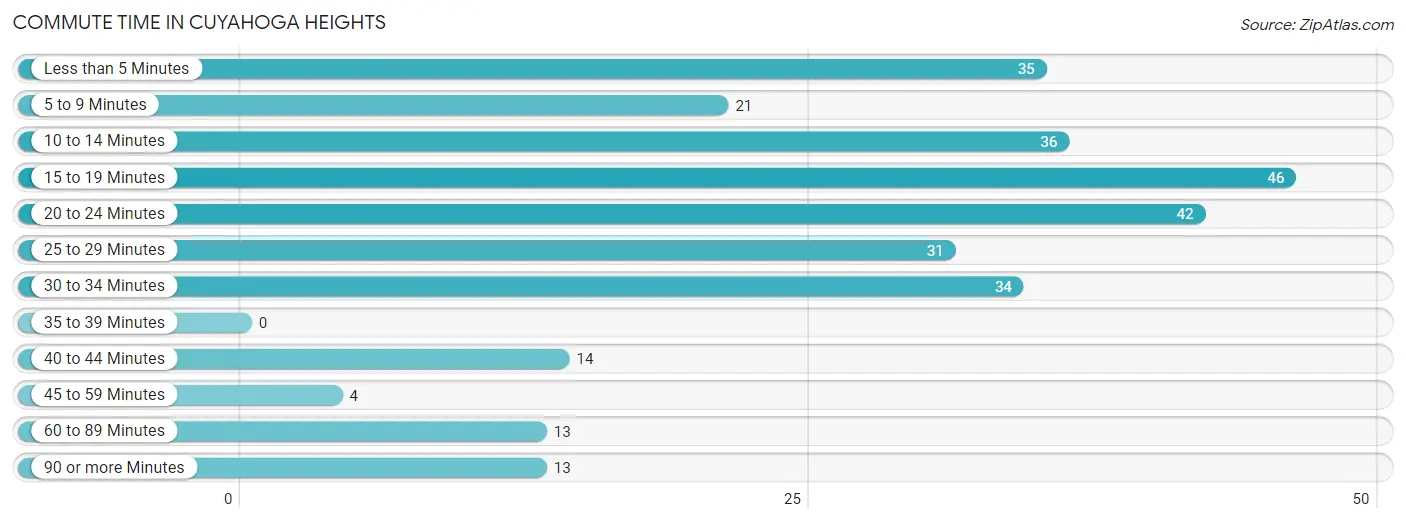
| Commute Time | # Commuters | % Commuters |
| Less than 5 Minutes | 35 | 12.1% |
| 5 to 9 Minutes | 21 | 7.3% |
| 10 to 14 Minutes | 36 | 12.5% |
| 15 to 19 Minutes | 46 | 15.9% |
| 20 to 24 Minutes | 42 | 14.5% |
| 25 to 29 Minutes | 31 | 10.7% |
| 30 to 34 Minutes | 34 | 11.8% |
| 35 to 39 Minutes | 0 | 0.0% |
| 40 to 44 Minutes | 14 | 4.8% |
| 45 to 59 Minutes | 4 | 1.4% |
| 60 to 89 Minutes | 13 | 4.5% |
| 90 or more Minutes | 13 | 4.5% |
Commute Time by Sex in Cuyahoga Heights
The most common commute times in Cuyahoga Heights are less than 5 minutes (28 commuters, 22.1%) for males and 10 to 14 minutes (36 commuters, 22.2%) for females.
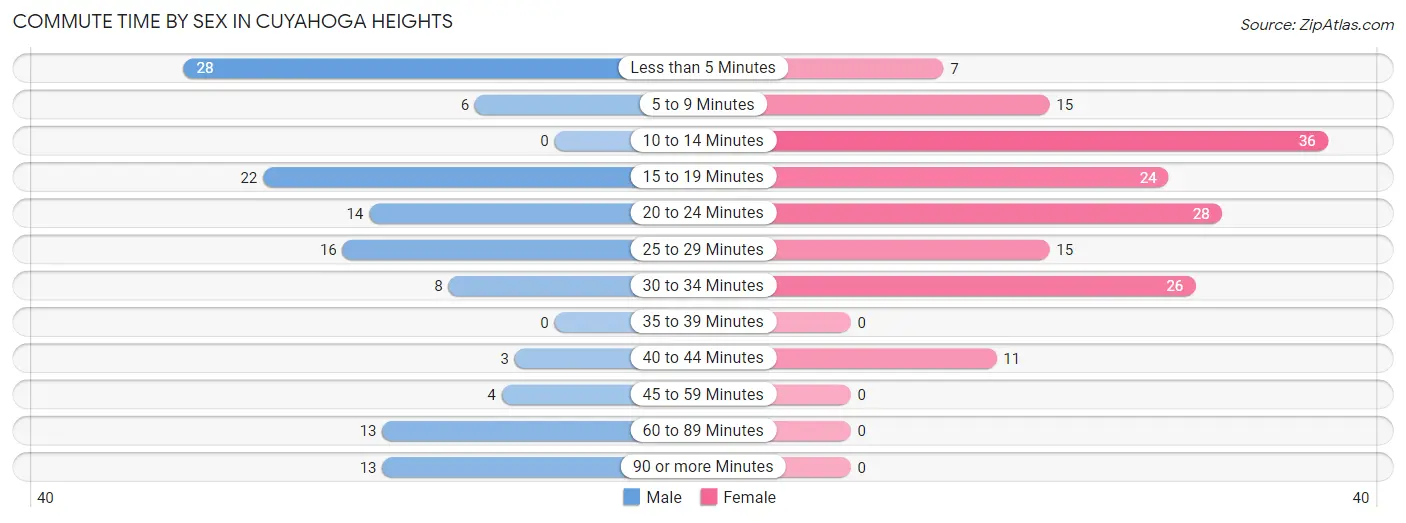
| Commute Time | Male | Female |
| Less than 5 Minutes | 28 (22.1%) | 7 (4.3%) |
| 5 to 9 Minutes | 6 (4.7%) | 15 (9.3%) |
| 10 to 14 Minutes | 0 (0.0%) | 36 (22.2%) |
| 15 to 19 Minutes | 22 (17.3%) | 24 (14.8%) |
| 20 to 24 Minutes | 14 (11.0%) | 28 (17.3%) |
| 25 to 29 Minutes | 16 (12.6%) | 15 (9.3%) |
| 30 to 34 Minutes | 8 (6.3%) | 26 (16.1%) |
| 35 to 39 Minutes | 0 (0.0%) | 0 (0.0%) |
| 40 to 44 Minutes | 3 (2.4%) | 11 (6.8%) |
| 45 to 59 Minutes | 4 (3.2%) | 0 (0.0%) |
| 60 to 89 Minutes | 13 (10.2%) | 0 (0.0%) |
| 90 or more Minutes | 13 (10.2%) | 0 (0.0%) |
Time of Departure to Work by Sex in Cuyahoga Heights
The most frequent times of departure to work in Cuyahoga Heights are 7:30 AM to 7:59 AM (38, 29.9%) for males and 7:30 AM to 7:59 AM (41, 25.3%) for females.
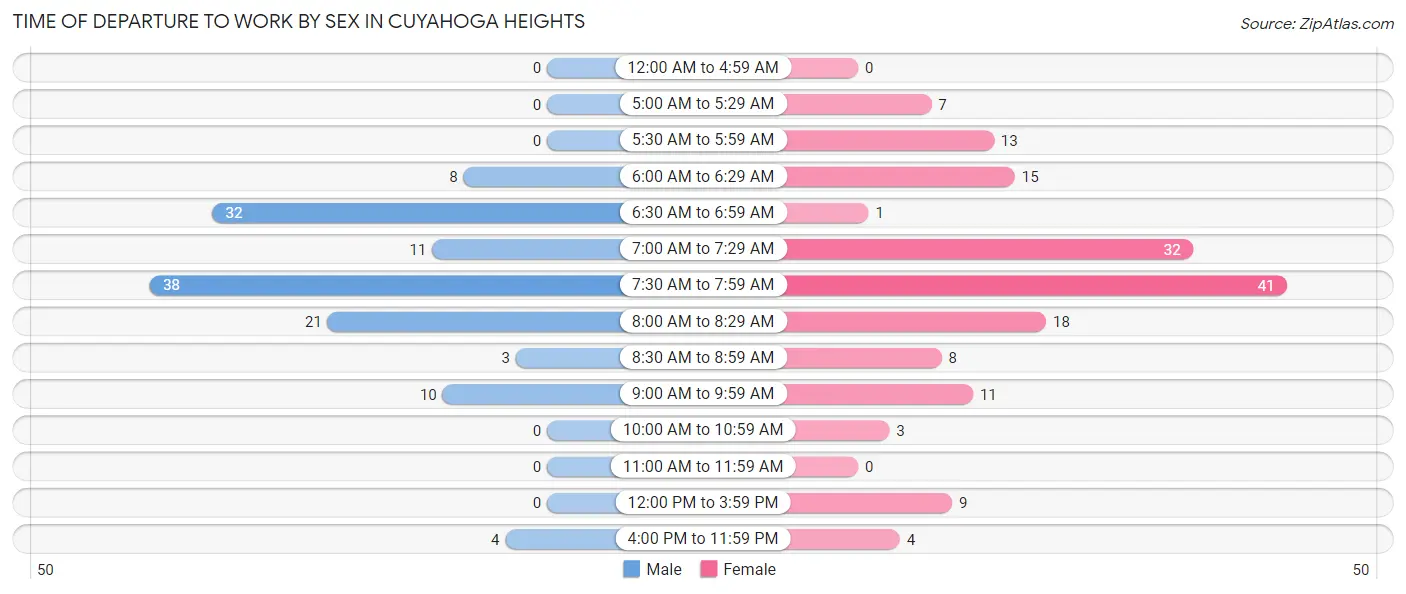
| Time of Departure | Male | Female |
| 12:00 AM to 4:59 AM | 0 (0.0%) | 0 (0.0%) |
| 5:00 AM to 5:29 AM | 0 (0.0%) | 7 (4.3%) |
| 5:30 AM to 5:59 AM | 0 (0.0%) | 13 (8.0%) |
| 6:00 AM to 6:29 AM | 8 (6.3%) | 15 (9.3%) |
| 6:30 AM to 6:59 AM | 32 (25.2%) | 1 (0.6%) |
| 7:00 AM to 7:29 AM | 11 (8.7%) | 32 (19.8%) |
| 7:30 AM to 7:59 AM | 38 (29.9%) | 41 (25.3%) |
| 8:00 AM to 8:29 AM | 21 (16.5%) | 18 (11.1%) |
| 8:30 AM to 8:59 AM | 3 (2.4%) | 8 (4.9%) |
| 9:00 AM to 9:59 AM | 10 (7.9%) | 11 (6.8%) |
| 10:00 AM to 10:59 AM | 0 (0.0%) | 3 (1.8%) |
| 11:00 AM to 11:59 AM | 0 (0.0%) | 0 (0.0%) |
| 12:00 PM to 3:59 PM | 0 (0.0%) | 9 (5.6%) |
| 4:00 PM to 11:59 PM | 4 (3.2%) | 4 (2.5%) |
| Total | 127 (100.0%) | 162 (100.0%) |
Housing Occupancy in Cuyahoga Heights
Occupancy by Ownership in Cuyahoga Heights
Of the total 255 dwellings in Cuyahoga Heights, owner-occupied units account for 180 (70.6%), while renter-occupied units make up 75 (29.4%).
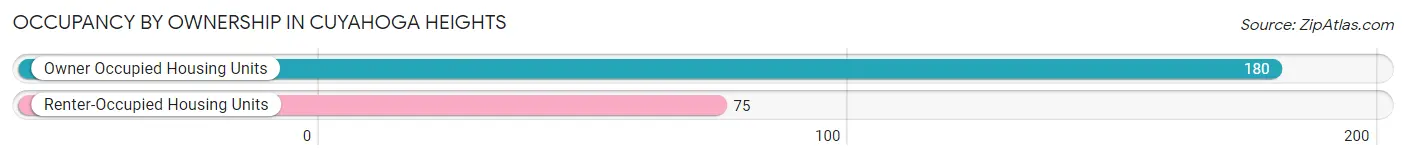
| Occupancy | # Housing Units | % Housing Units |
| Owner Occupied Housing Units | 180 | 70.6% |
| Renter-Occupied Housing Units | 75 | 29.4% |
| Total Occupied Housing Units | 255 | 100.0% |
Occupancy by Household Size in Cuyahoga Heights
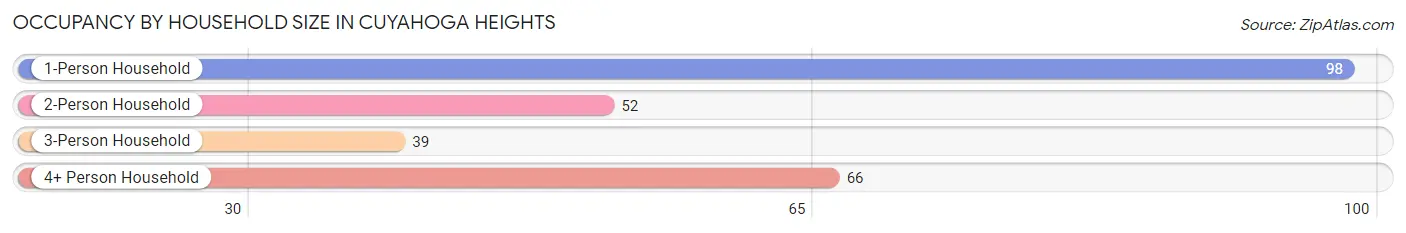
| Household Size | # Housing Units | % Housing Units |
| 1-Person Household | 98 | 38.4% |
| 2-Person Household | 52 | 20.4% |
| 3-Person Household | 39 | 15.3% |
| 4+ Person Household | 66 | 25.9% |
| Total Housing Units | 255 | 100.0% |
Occupancy by Ownership by Household Size in Cuyahoga Heights
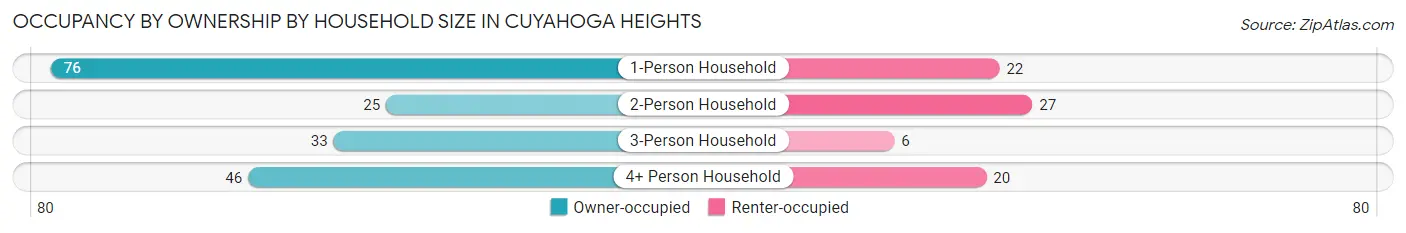
| Household Size | Owner-occupied | Renter-occupied |
| 1-Person Household | 76 (77.5%) | 22 (22.5%) |
| 2-Person Household | 25 (48.1%) | 27 (51.9%) |
| 3-Person Household | 33 (84.6%) | 6 (15.4%) |
| 4+ Person Household | 46 (69.7%) | 20 (30.3%) |
| Total Housing Units | 180 (70.6%) | 75 (29.4%) |
Occupancy by Educational Attainment in Cuyahoga Heights
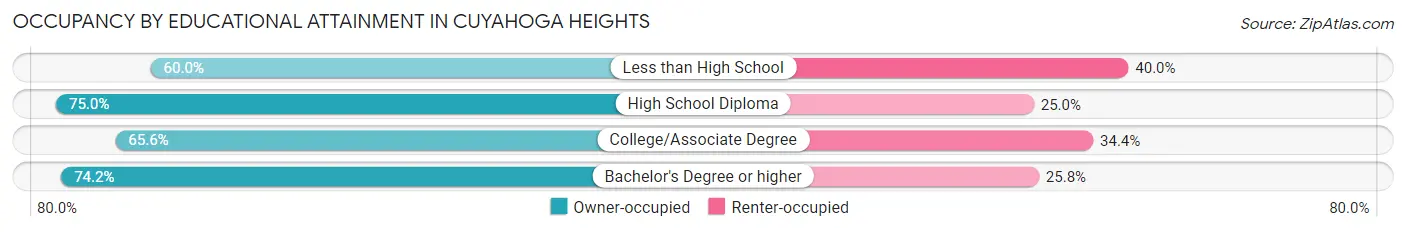
| Household Size | Owner-occupied | Renter-occupied |
| Less than High School | 9 (60.0%) | 6 (40.0%) |
| High School Diploma | 87 (75.0%) | 29 (25.0%) |
| College/Associate Degree | 61 (65.6%) | 32 (34.4%) |
| Bachelor's Degree or higher | 23 (74.2%) | 8 (25.8%) |
Occupancy by Age of Householder in Cuyahoga Heights
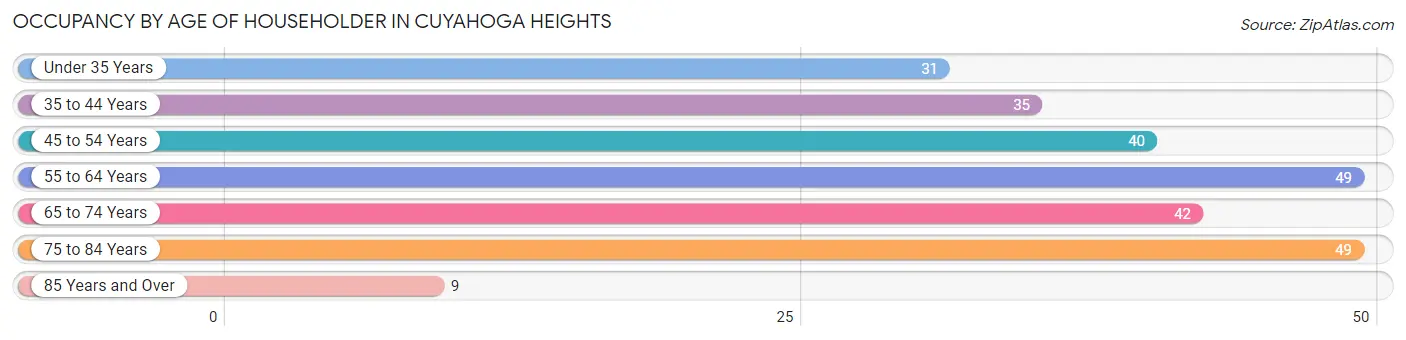
| Age Bracket | # Households | % Households |
| Under 35 Years | 31 | 12.2% |
| 35 to 44 Years | 35 | 13.7% |
| 45 to 54 Years | 40 | 15.7% |
| 55 to 64 Years | 49 | 19.2% |
| 65 to 74 Years | 42 | 16.5% |
| 75 to 84 Years | 49 | 19.2% |
| 85 Years and Over | 9 | 3.5% |
| Total | 255 | 100.0% |
Housing Finances in Cuyahoga Heights
Median Income by Occupancy in Cuyahoga Heights
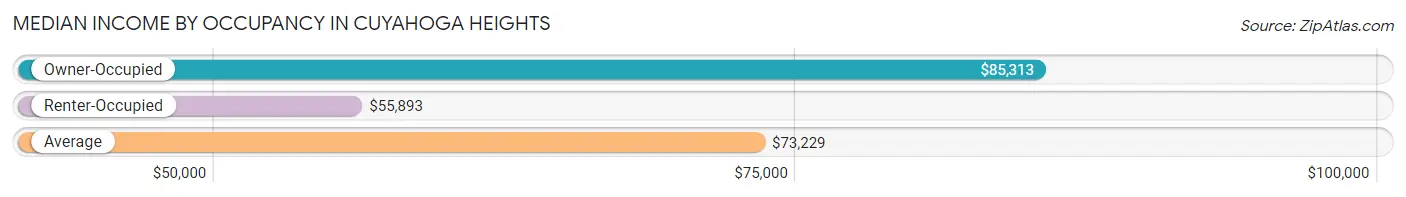
| Occupancy Type | # Households | Median Income |
| Owner-Occupied | 180 (70.6%) | $85,313 |
| Renter-Occupied | 75 (29.4%) | $55,893 |
| Average | 255 (100.0%) | $73,229 |
Occupancy by Householder Income Bracket in Cuyahoga Heights
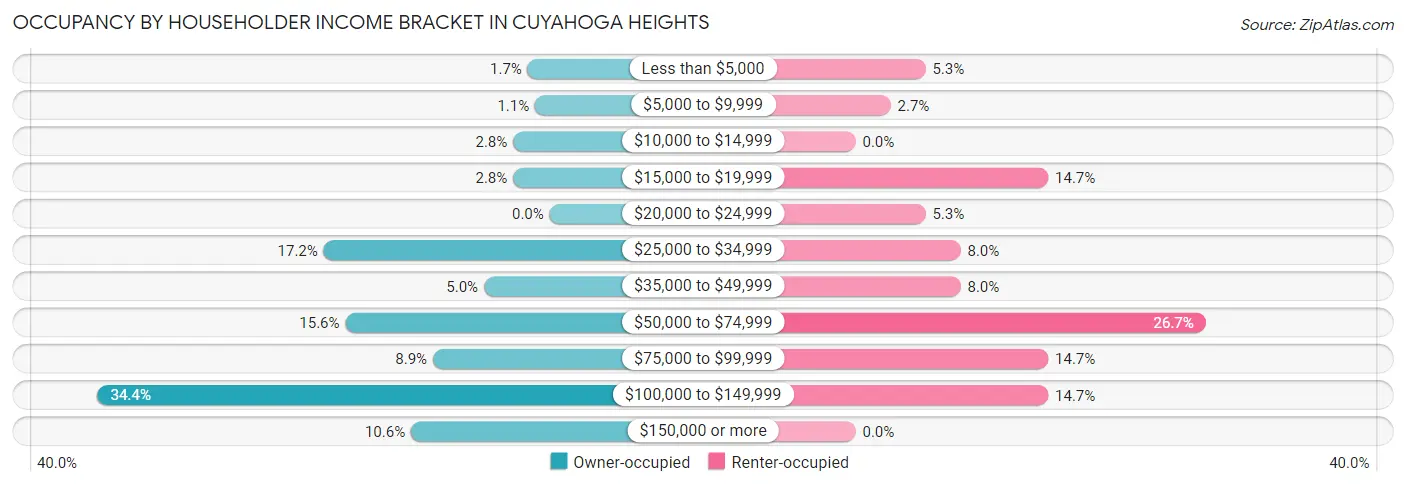
| Income Bracket | Owner-occupied | Renter-occupied |
| Less than $5,000 | 3 (1.7%) | 4 (5.3%) |
| $5,000 to $9,999 | 2 (1.1%) | 2 (2.7%) |
| $10,000 to $14,999 | 5 (2.8%) | 0 (0.0%) |
| $15,000 to $19,999 | 5 (2.8%) | 11 (14.7%) |
| $20,000 to $24,999 | 0 (0.0%) | 4 (5.3%) |
| $25,000 to $34,999 | 31 (17.2%) | 6 (8.0%) |
| $35,000 to $49,999 | 9 (5.0%) | 6 (8.0%) |
| $50,000 to $74,999 | 28 (15.6%) | 20 (26.7%) |
| $75,000 to $99,999 | 16 (8.9%) | 11 (14.7%) |
| $100,000 to $149,999 | 62 (34.4%) | 11 (14.7%) |
| $150,000 or more | 19 (10.6%) | 0 (0.0%) |
| Total | 180 (100.0%) | 75 (100.0%) |
Monthly Housing Cost Tiers in Cuyahoga Heights
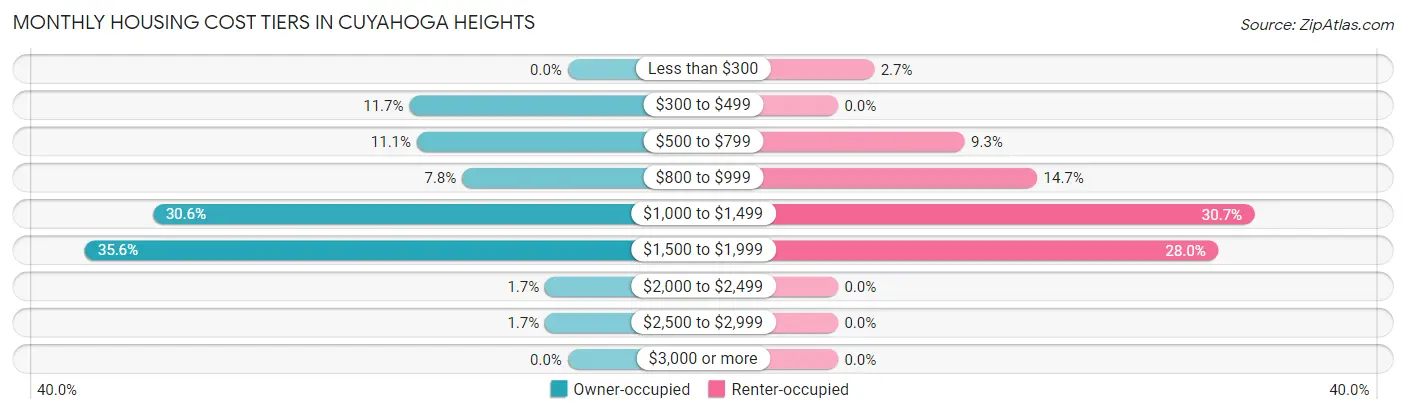
| Monthly Cost | Owner-occupied | Renter-occupied |
| Less than $300 | 0 (0.0%) | 2 (2.7%) |
| $300 to $499 | 21 (11.7%) | 0 (0.0%) |
| $500 to $799 | 20 (11.1%) | 7 (9.3%) |
| $800 to $999 | 14 (7.8%) | 11 (14.7%) |
| $1,000 to $1,499 | 55 (30.6%) | 23 (30.7%) |
| $1,500 to $1,999 | 64 (35.6%) | 21 (28.0%) |
| $2,000 to $2,499 | 3 (1.7%) | 0 (0.0%) |
| $2,500 to $2,999 | 3 (1.7%) | 0 (0.0%) |
| $3,000 or more | 0 (0.0%) | 0 (0.0%) |
| Total | 180 (100.0%) | 75 (100.0%) |
Physical Housing Characteristics in Cuyahoga Heights
Housing Structures in Cuyahoga Heights
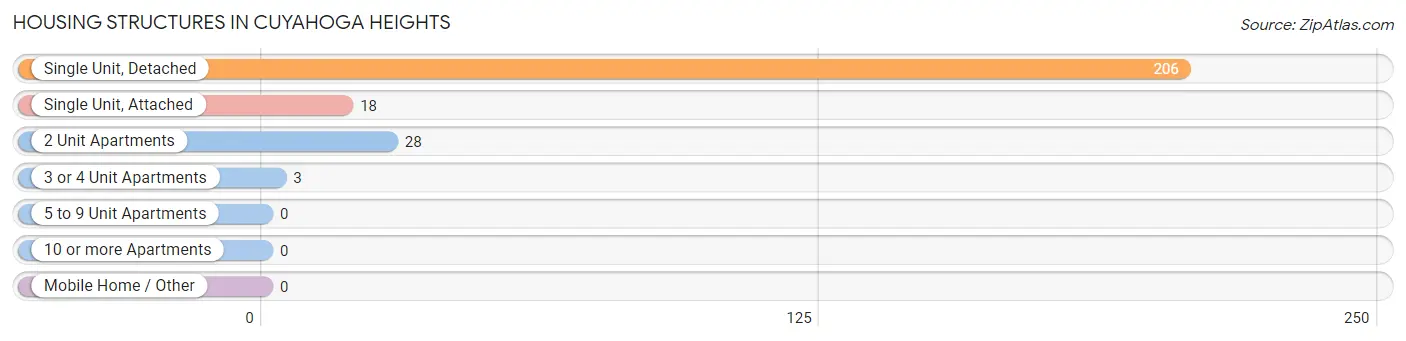
| Structure Type | # Housing Units | % Housing Units |
| Single Unit, Detached | 206 | 80.8% |
| Single Unit, Attached | 18 | 7.1% |
| 2 Unit Apartments | 28 | 11.0% |
| 3 or 4 Unit Apartments | 3 | 1.2% |
| 5 to 9 Unit Apartments | 0 | 0.0% |
| 10 or more Apartments | 0 | 0.0% |
| Mobile Home / Other | 0 | 0.0% |
| Total | 255 | 100.0% |
Housing Structures by Occupancy in Cuyahoga Heights
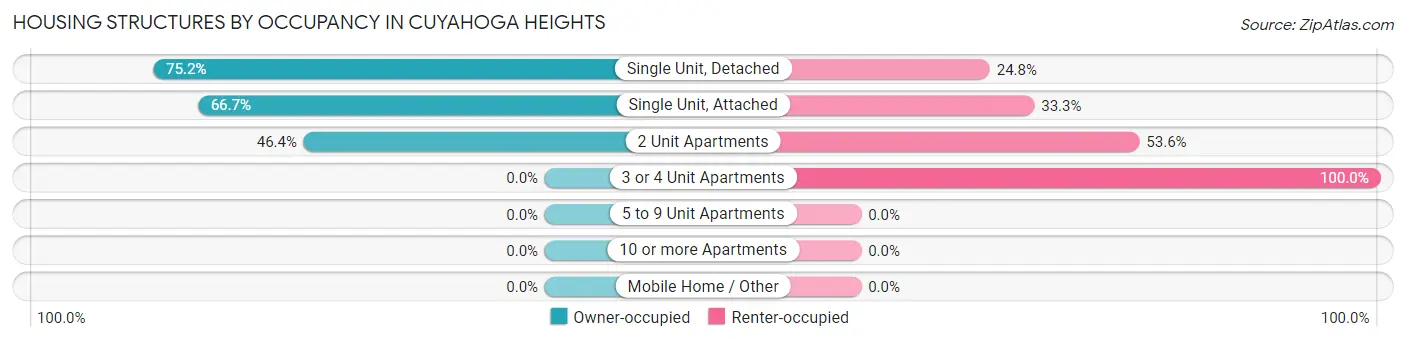
| Structure Type | Owner-occupied | Renter-occupied |
| Single Unit, Detached | 155 (75.2%) | 51 (24.8%) |
| Single Unit, Attached | 12 (66.7%) | 6 (33.3%) |
| 2 Unit Apartments | 13 (46.4%) | 15 (53.6%) |
| 3 or 4 Unit Apartments | 0 (0.0%) | 3 (100.0%) |
| 5 to 9 Unit Apartments | 0 (0.0%) | 0 (0.0%) |
| 10 or more Apartments | 0 (0.0%) | 0 (0.0%) |
| Mobile Home / Other | 0 (0.0%) | 0 (0.0%) |
| Total | 180 (70.6%) | 75 (29.4%) |
Housing Structures by Number of Rooms in Cuyahoga Heights
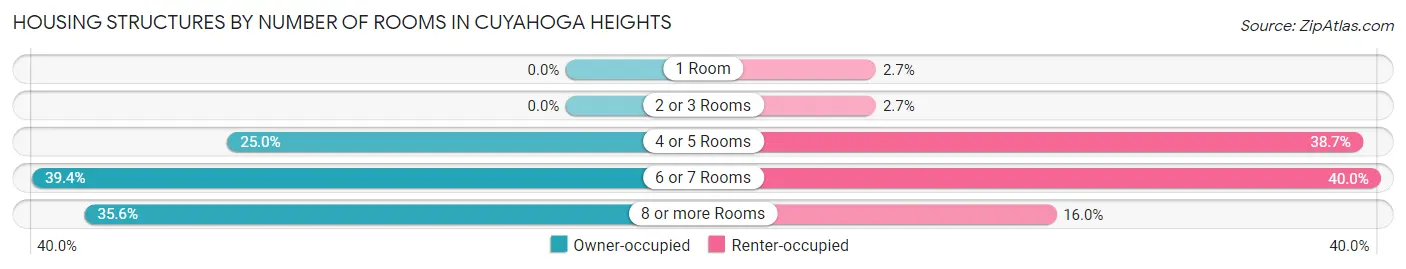
| Number of Rooms | Owner-occupied | Renter-occupied |
| 1 Room | 0 (0.0%) | 2 (2.7%) |
| 2 or 3 Rooms | 0 (0.0%) | 2 (2.7%) |
| 4 or 5 Rooms | 45 (25.0%) | 29 (38.7%) |
| 6 or 7 Rooms | 71 (39.4%) | 30 (40.0%) |
| 8 or more Rooms | 64 (35.6%) | 12 (16.0%) |
| Total | 180 (100.0%) | 75 (100.0%) |
Housing Structure by Heating Type in Cuyahoga Heights
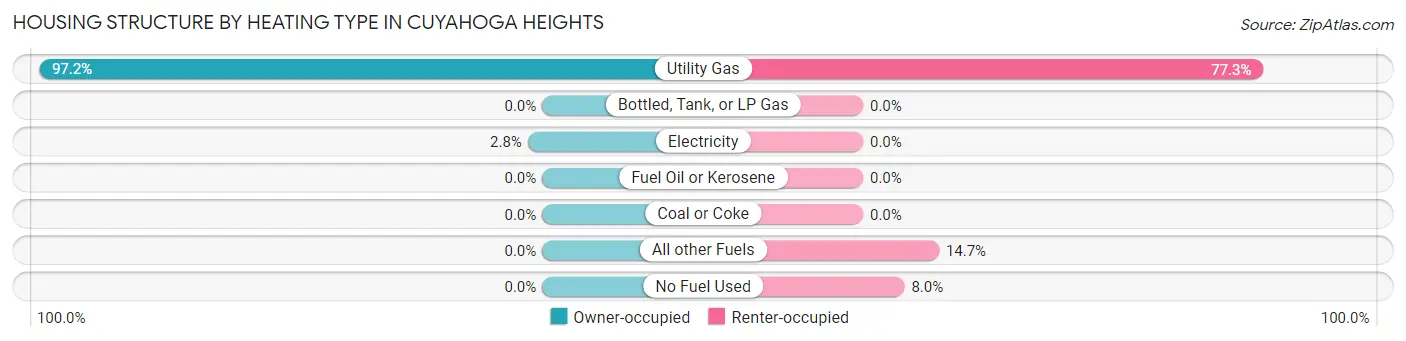
| Heating Type | Owner-occupied | Renter-occupied |
| Utility Gas | 175 (97.2%) | 58 (77.3%) |
| Bottled, Tank, or LP Gas | 0 (0.0%) | 0 (0.0%) |
| Electricity | 5 (2.8%) | 0 (0.0%) |
| Fuel Oil or Kerosene | 0 (0.0%) | 0 (0.0%) |
| Coal or Coke | 0 (0.0%) | 0 (0.0%) |
| All other Fuels | 0 (0.0%) | 11 (14.7%) |
| No Fuel Used | 0 (0.0%) | 6 (8.0%) |
| Total | 180 (100.0%) | 75 (100.0%) |
Household Vehicle Usage in Cuyahoga Heights
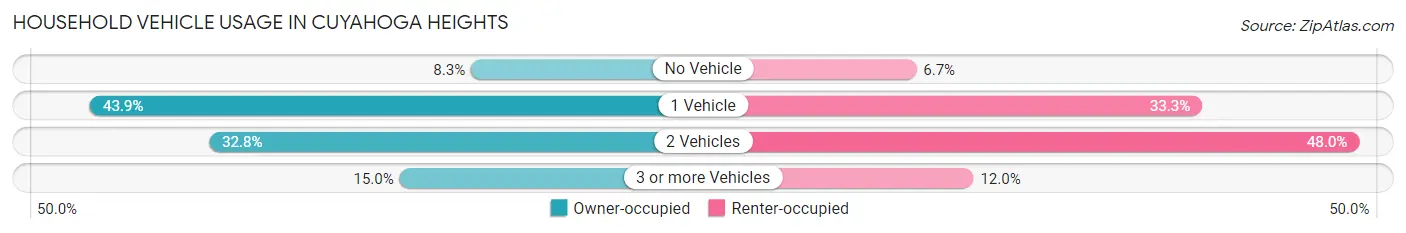
| Vehicles per Household | Owner-occupied | Renter-occupied |
| No Vehicle | 15 (8.3%) | 5 (6.7%) |
| 1 Vehicle | 79 (43.9%) | 25 (33.3%) |
| 2 Vehicles | 59 (32.8%) | 36 (48.0%) |
| 3 or more Vehicles | 27 (15.0%) | 9 (12.0%) |
| Total | 180 (100.0%) | 75 (100.0%) |
Real Estate & Mortgages in Cuyahoga Heights
Real Estate and Mortgage Overview in Cuyahoga Heights
| Characteristic | Without Mortgage | With Mortgage |
| Housing Units | 42 | 138 |
| Median Property Value | $171,900 | $200,000 |
| Median Household Income | $58,750 | $13 |
| Monthly Housing Costs | $500 | $0 |
| Real Estate Taxes | $2,619 | $0 |
Property Value by Mortgage Status in Cuyahoga Heights
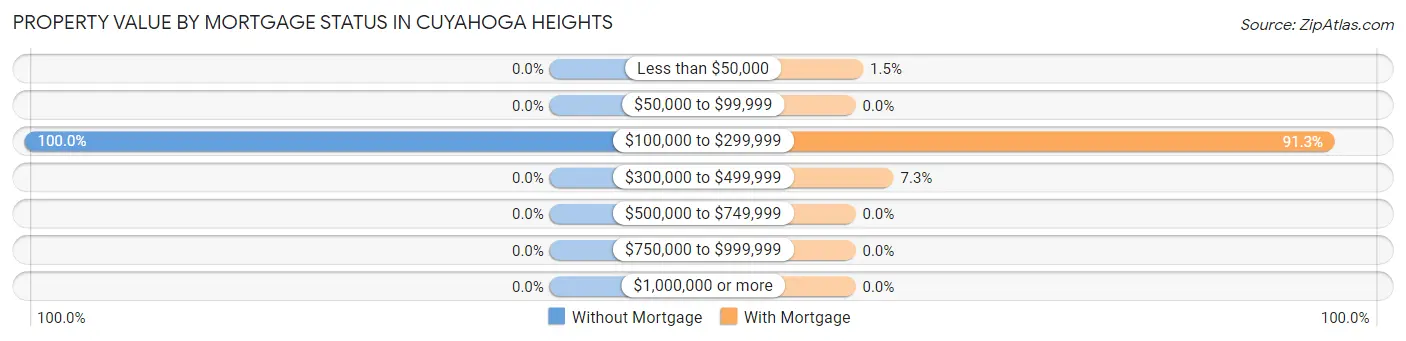
| Property Value | Without Mortgage | With Mortgage |
| Less than $50,000 | 0 (0.0%) | 2 (1.5%) |
| $50,000 to $99,999 | 0 (0.0%) | 0 (0.0%) |
| $100,000 to $299,999 | 42 (100.0%) | 126 (91.3%) |
| $300,000 to $499,999 | 0 (0.0%) | 10 (7.2%) |
| $500,000 to $749,999 | 0 (0.0%) | 0 (0.0%) |
| $750,000 to $999,999 | 0 (0.0%) | 0 (0.0%) |
| $1,000,000 or more | 0 (0.0%) | 0 (0.0%) |
| Total | 42 (100.0%) | 138 (100.0%) |
Household Income by Mortgage Status in Cuyahoga Heights
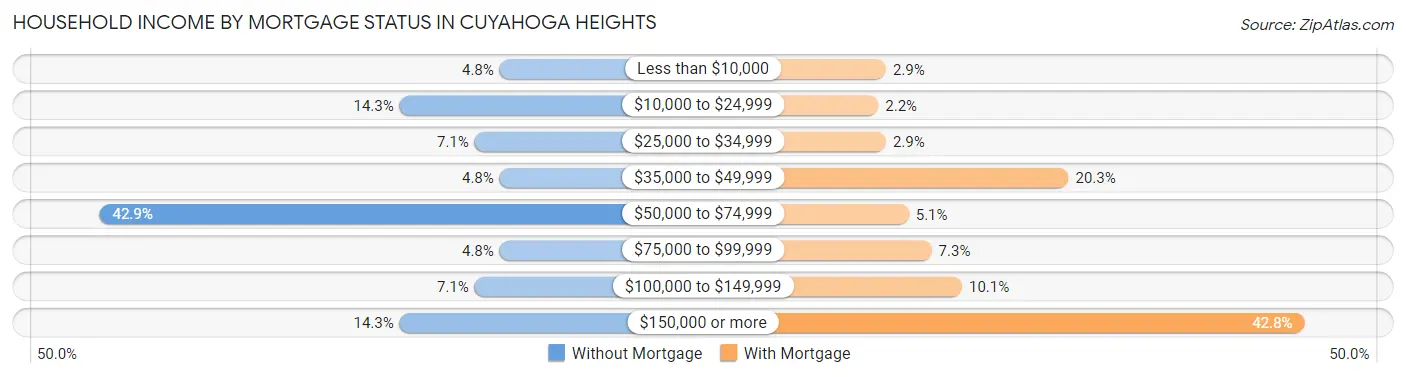
| Household Income | Without Mortgage | With Mortgage |
| Less than $10,000 | 2 (4.8%) | 4 (2.9%) |
| $10,000 to $24,999 | 6 (14.3%) | 3 (2.2%) |
| $25,000 to $34,999 | 3 (7.1%) | 4 (2.9%) |
| $35,000 to $49,999 | 2 (4.8%) | 28 (20.3%) |
| $50,000 to $74,999 | 18 (42.9%) | 7 (5.1%) |
| $75,000 to $99,999 | 2 (4.8%) | 10 (7.2%) |
| $100,000 to $149,999 | 3 (7.1%) | 14 (10.1%) |
| $150,000 or more | 6 (14.3%) | 59 (42.7%) |
| Total | 42 (100.0%) | 138 (100.0%) |
Property Value to Household Income Ratio in Cuyahoga Heights
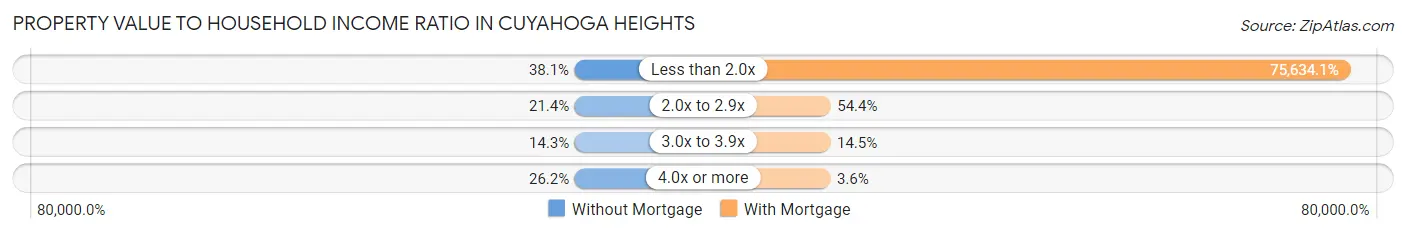
| Value-to-Income Ratio | Without Mortgage | With Mortgage |
| Less than 2.0x | 16 (38.1%) | 104,375 (75,634.1%) |
| 2.0x to 2.9x | 9 (21.4%) | 75 (54.3%) |
| 3.0x to 3.9x | 6 (14.3%) | 20 (14.5%) |
| 4.0x or more | 11 (26.2%) | 5 (3.6%) |
| Total | 42 (100.0%) | 138 (100.0%) |
Real Estate Taxes by Mortgage Status in Cuyahoga Heights
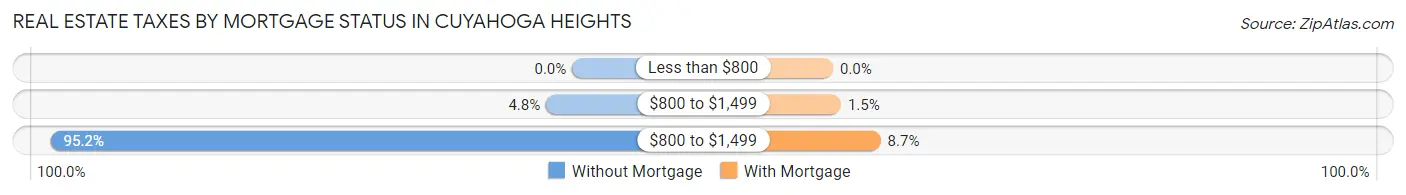
| Property Taxes | Without Mortgage | With Mortgage |
| Less than $800 | 0 (0.0%) | 0 (0.0%) |
| $800 to $1,499 | 2 (4.8%) | 2 (1.5%) |
| $800 to $1,499 | 40 (95.2%) | 12 (8.7%) |
| Total | 42 (100.0%) | 138 (100.0%) |
Health & Disability in Cuyahoga Heights
Health Insurance Coverage by Age in Cuyahoga Heights
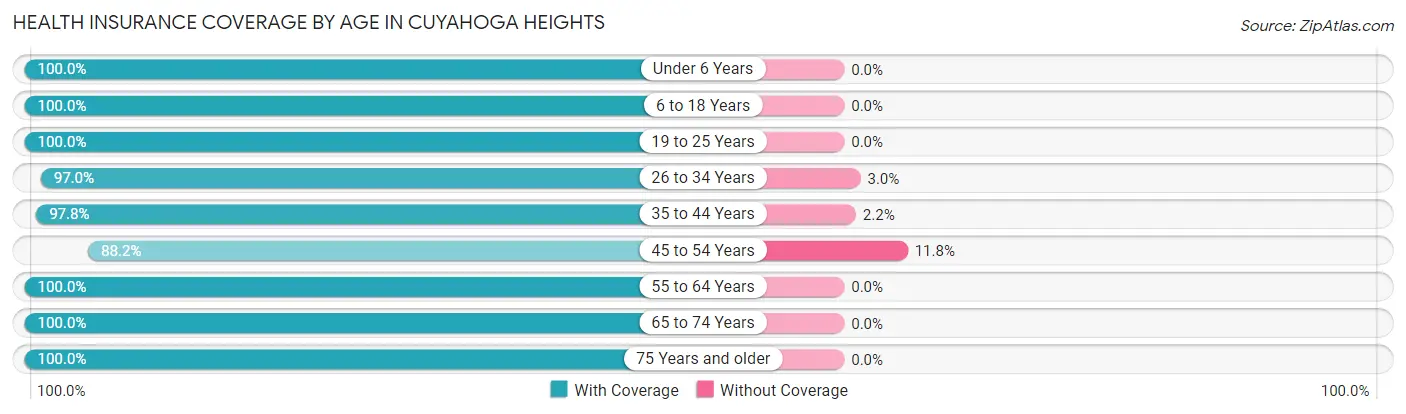
| Age Bracket | With Coverage | Without Coverage |
| Under 6 Years | 60 (100.0%) | 0 (0.0%) |
| 6 to 18 Years | 91 (100.0%) | 0 (0.0%) |
| 19 to 25 Years | 37 (100.0%) | 0 (0.0%) |
| 26 to 34 Years | 64 (97.0%) | 2 (3.0%) |
| 35 to 44 Years | 90 (97.8%) | 2 (2.2%) |
| 45 to 54 Years | 82 (88.2%) | 11 (11.8%) |
| 55 to 64 Years | 73 (100.0%) | 0 (0.0%) |
| 65 to 74 Years | 51 (100.0%) | 0 (0.0%) |
| 75 Years and older | 64 (100.0%) | 0 (0.0%) |
| Total | 612 (97.6%) | 15 (2.4%) |
Health Insurance Coverage by Citizenship Status in Cuyahoga Heights
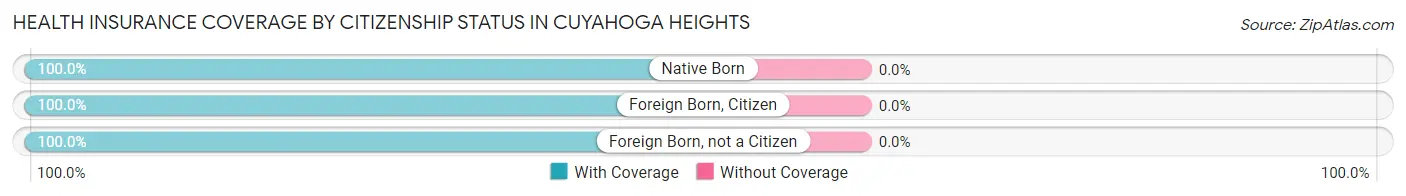
| Citizenship Status | With Coverage | Without Coverage |
| Native Born | 60 (100.0%) | 0 (0.0%) |
| Foreign Born, Citizen | 91 (100.0%) | 0 (0.0%) |
| Foreign Born, not a Citizen | 37 (100.0%) | 0 (0.0%) |
Health Insurance Coverage by Household Income in Cuyahoga Heights
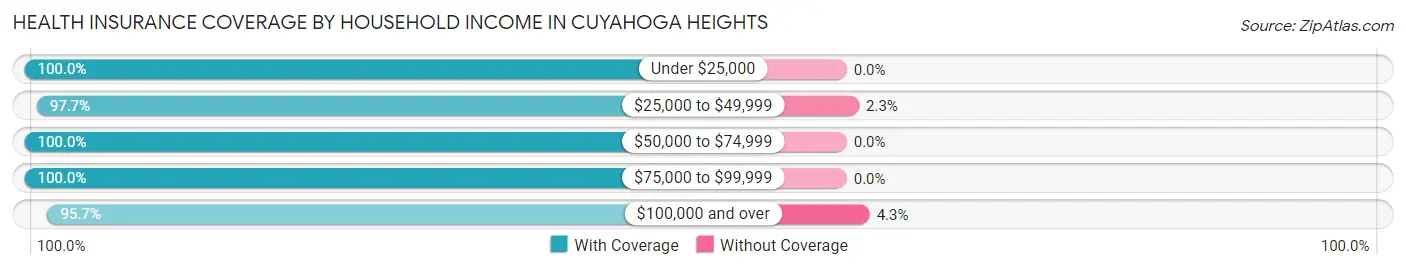
| Household Income | With Coverage | Without Coverage |
| Under $25,000 | 38 (100.0%) | 0 (0.0%) |
| $25,000 to $49,999 | 85 (97.7%) | 2 (2.3%) |
| $50,000 to $74,999 | 93 (100.0%) | 0 (0.0%) |
| $75,000 to $99,999 | 106 (100.0%) | 0 (0.0%) |
| $100,000 and over | 290 (95.7%) | 13 (4.3%) |
Public vs Private Health Insurance Coverage by Age in Cuyahoga Heights
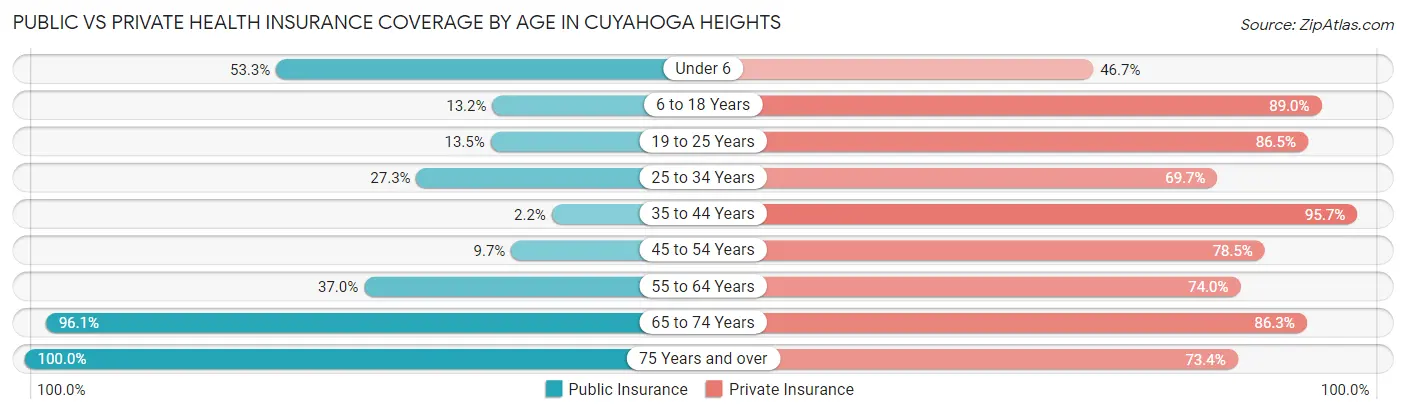
| Age Bracket | Public Insurance | Private Insurance |
| Under 6 | 32 (53.3%) | 28 (46.7%) |
| 6 to 18 Years | 12 (13.2%) | 81 (89.0%) |
| 19 to 25 Years | 5 (13.5%) | 32 (86.5%) |
| 25 to 34 Years | 18 (27.3%) | 46 (69.7%) |
| 35 to 44 Years | 2 (2.2%) | 88 (95.7%) |
| 45 to 54 Years | 9 (9.7%) | 73 (78.5%) |
| 55 to 64 Years | 27 (37.0%) | 54 (74.0%) |
| 65 to 74 Years | 49 (96.1%) | 44 (86.3%) |
| 75 Years and over | 64 (100.0%) | 47 (73.4%) |
| Total | 218 (34.8%) | 493 (78.6%) |
Disability Status by Sex by Age in Cuyahoga Heights
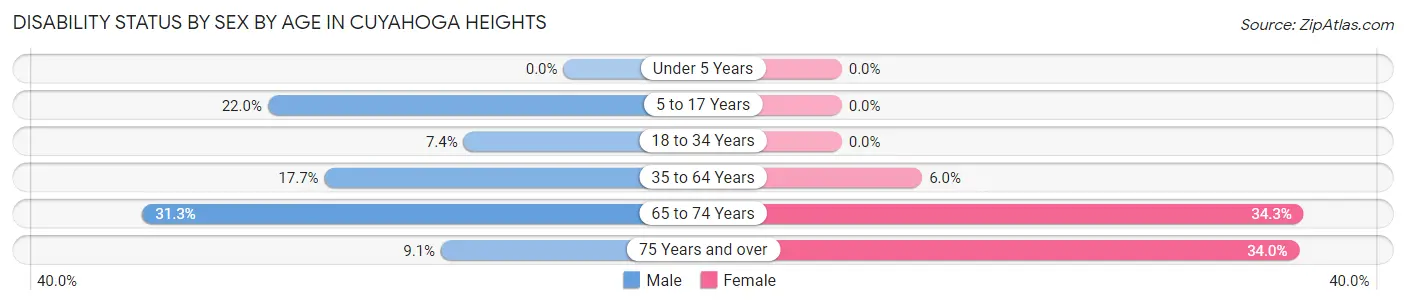
| Age Bracket | Male | Female |
| Under 5 Years | 0 (0.0%) | 0 (0.0%) |
| 5 to 17 Years | 9 (22.0%) | 0 (0.0%) |
| 18 to 34 Years | 4 (7.4%) | 0 (0.0%) |
| 35 to 64 Years | 22 (17.7%) | 8 (6.0%) |
| 65 to 74 Years | 5 (31.2%) | 12 (34.3%) |
| 75 Years and over | 1 (9.1%) | 18 (34.0%) |
Disability Class by Sex by Age in Cuyahoga Heights
Disability Class: Hearing Difficulty
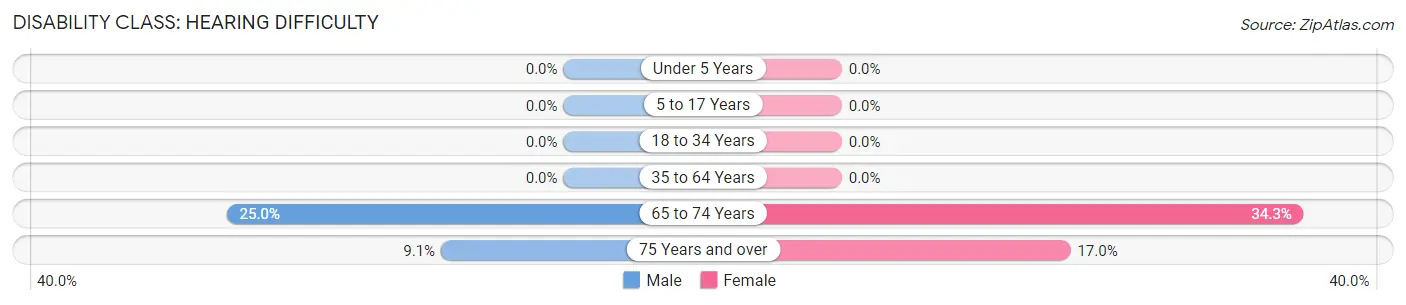
| Age Bracket | Male | Female |
| Under 5 Years | 0 (0.0%) | 0 (0.0%) |
| 5 to 17 Years | 0 (0.0%) | 0 (0.0%) |
| 18 to 34 Years | 0 (0.0%) | 0 (0.0%) |
| 35 to 64 Years | 0 (0.0%) | 0 (0.0%) |
| 65 to 74 Years | 4 (25.0%) | 12 (34.3%) |
| 75 Years and over | 1 (9.1%) | 9 (17.0%) |
Disability Class: Vision Difficulty
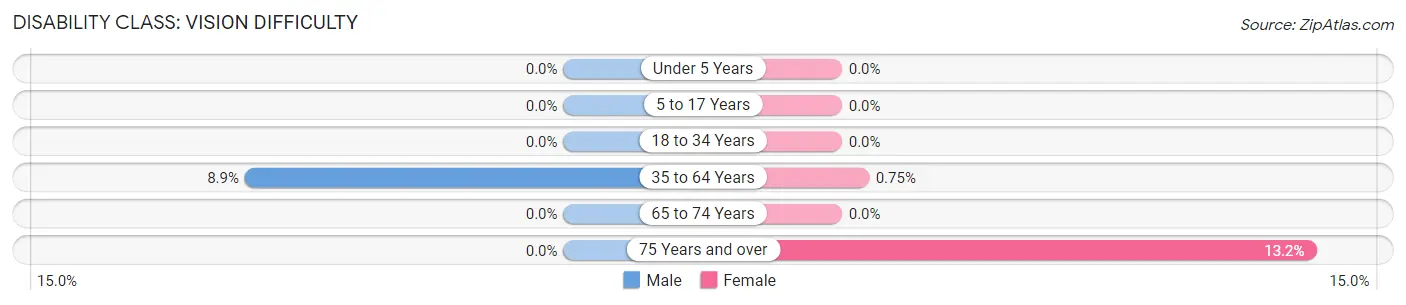
| Age Bracket | Male | Female |
| Under 5 Years | 0 (0.0%) | 0 (0.0%) |
| 5 to 17 Years | 0 (0.0%) | 0 (0.0%) |
| 18 to 34 Years | 0 (0.0%) | 0 (0.0%) |
| 35 to 64 Years | 11 (8.9%) | 1 (0.7%) |
| 65 to 74 Years | 0 (0.0%) | 0 (0.0%) |
| 75 Years and over | 0 (0.0%) | 7 (13.2%) |
Disability Class: Cognitive Difficulty
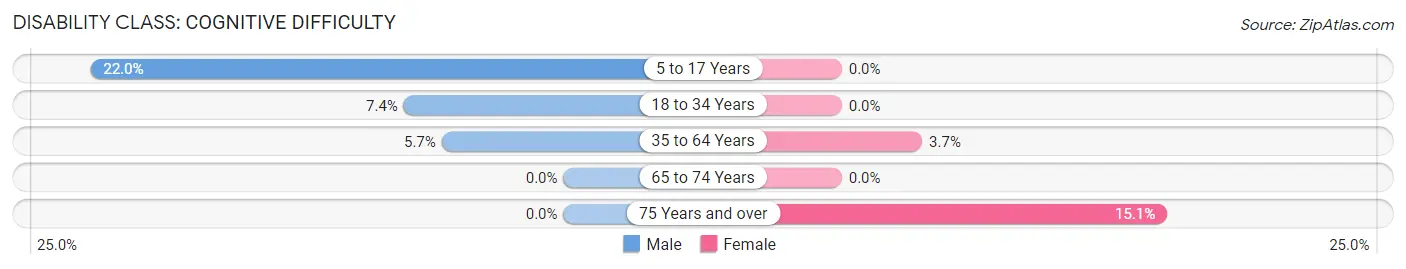
| Age Bracket | Male | Female |
| 5 to 17 Years | 9 (22.0%) | 0 (0.0%) |
| 18 to 34 Years | 4 (7.4%) | 0 (0.0%) |
| 35 to 64 Years | 7 (5.7%) | 5 (3.7%) |
| 65 to 74 Years | 0 (0.0%) | 0 (0.0%) |
| 75 Years and over | 0 (0.0%) | 8 (15.1%) |
Disability Class: Ambulatory Difficulty
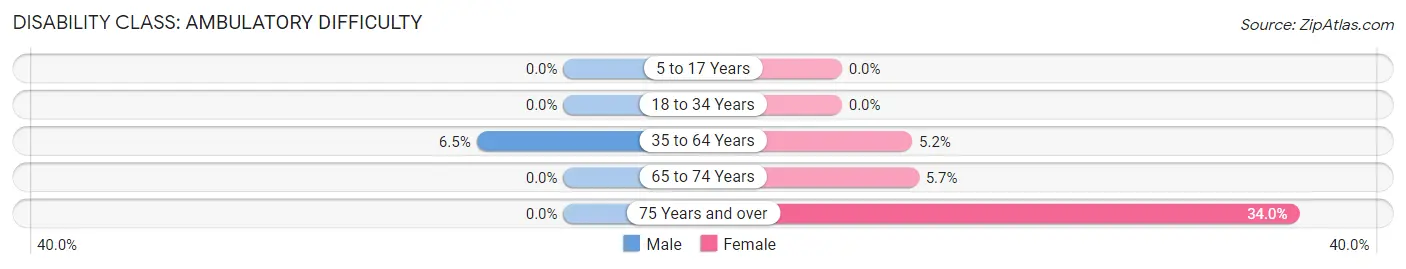
| Age Bracket | Male | Female |
| 5 to 17 Years | 0 (0.0%) | 0 (0.0%) |
| 18 to 34 Years | 0 (0.0%) | 0 (0.0%) |
| 35 to 64 Years | 8 (6.5%) | 7 (5.2%) |
| 65 to 74 Years | 0 (0.0%) | 2 (5.7%) |
| 75 Years and over | 0 (0.0%) | 18 (34.0%) |
Disability Class: Self-Care Difficulty
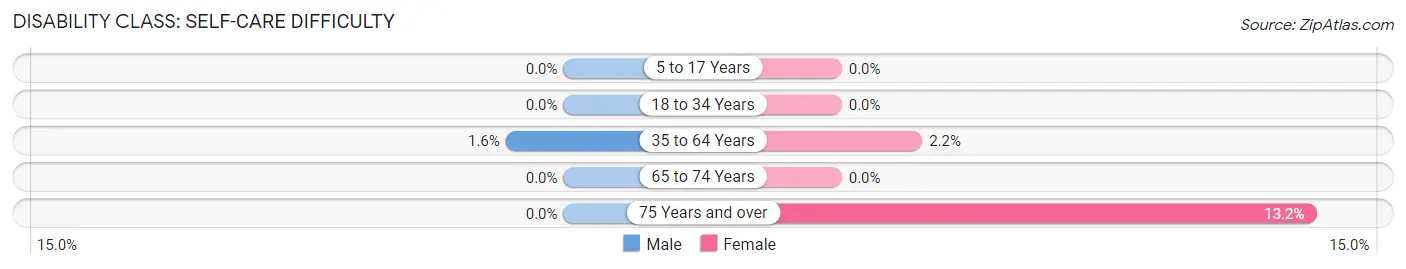
| Age Bracket | Male | Female |
| 5 to 17 Years | 0 (0.0%) | 0 (0.0%) |
| 18 to 34 Years | 0 (0.0%) | 0 (0.0%) |
| 35 to 64 Years | 2 (1.6%) | 3 (2.2%) |
| 65 to 74 Years | 0 (0.0%) | 0 (0.0%) |
| 75 Years and over | 0 (0.0%) | 7 (13.2%) |
Technology Access in Cuyahoga Heights
Computing Device Access in Cuyahoga Heights
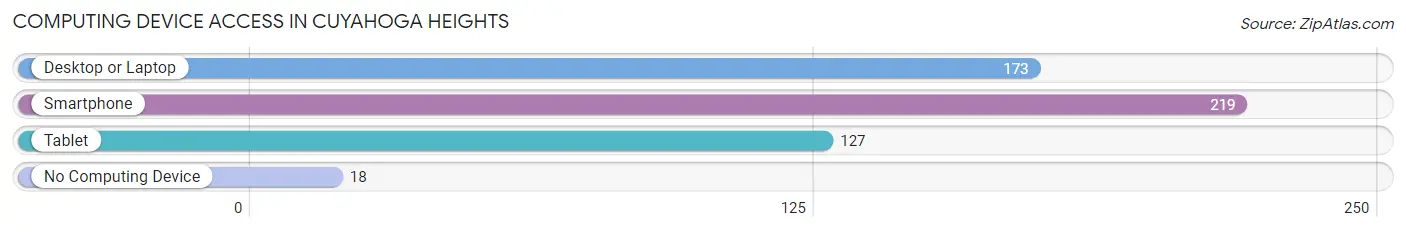
| Device Type | # Households | % Households |
| Desktop or Laptop | 173 | 67.8% |
| Smartphone | 219 | 85.9% |
| Tablet | 127 | 49.8% |
| No Computing Device | 18 | 7.1% |
| Total | 255 | 100.0% |
Internet Access in Cuyahoga Heights
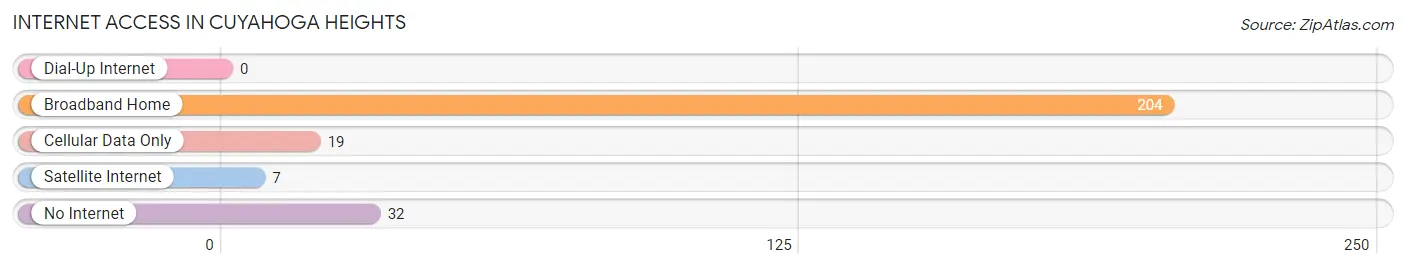
| Internet Type | # Households | % Households |
| Dial-Up Internet | 0 | 0.0% |
| Broadband Home | 204 | 80.0% |
| Cellular Data Only | 19 | 7.4% |
| Satellite Internet | 7 | 2.8% |
| No Internet | 32 | 12.6% |
| Total | 255 | 100.0% |
Cuyahoga Heights Summary
Cuyahoga Heights is a village located in Cuyahoga County, Ohio, United States. The village is situated on the east bank of the Cuyahoga River, approximately 8 miles south of downtown Cleveland. As of the 2010 census, the village had a population of 1,817.
History
The area that is now Cuyahoga Heights was originally inhabited by the Iroquois and Erie Native American tribes. The first European settlers arrived in the area in the late 1700s. The village was officially incorporated in 1921.
The village was originally a farming community, but in the early 1900s, the area began to experience rapid industrial growth. The village was home to several factories, including the Cuyahoga Steel Company, which was founded in 1921. The steel company was the largest employer in the village and provided jobs for many of the residents.
The village experienced a period of decline in the mid-1900s, as many of the factories closed and the population decreased. However, in recent years, the village has experienced a resurgence, with new businesses and housing developments being built.
Geography
Cuyahoga Heights is located at 41°25'25" North, 81°41'45" West (41.423, -81.696). The village is situated on the east bank of the Cuyahoga River, approximately 8 miles south of downtown Cleveland.
The village has a total area of 1.2 square miles, all of which is land. The terrain is mostly flat, with some rolling hills.
Demographics
As of the 2010 census, there were 1,817 people, 745 households, and 486 families residing in the village. The population density was 1,521.7 people per square mile. The racial makeup of the village was 94.2% White, 2.2% African American, 0.3% Native American, 0.7% Asian, 0.1% Pacific Islander, 0.7% from other races, and 1.8% from two or more races. Hispanic or Latino of any race were 2.2% of the population.
The median age in the village was 43.2 years. 22.2% of residents were under the age of 18; 6.7% were between the ages of 18 and 24; 22.7% were from 25 to 44; 32.2% were from 45 to 64; and 16.2% were 65 years of age or older. The gender makeup of the village was 48.2% male and 51.8% female.
Economy
The economy of Cuyahoga Heights is largely based on manufacturing and retail. The village is home to several factories, including the Cuyahoga Steel Company, which was founded in 1921. The steel company is the largest employer in the village and provides jobs for many of the residents.
The village also has several retail stores, including a grocery store, a hardware store, and a pharmacy. There are also several restaurants and bars in the village.
The median household income in the village was $50,945 in 2017. The per capita income was $25,945. About 8.2% of the population was below the poverty line.
Common Questions
What is Per Capita Income in Cuyahoga Heights?
Per Capita income in Cuyahoga Heights is $33,687.
What is the Median Family Income in Cuyahoga Heights?
Median Family Income in Cuyahoga Heights is $93,929.
What is the Median Household income in Cuyahoga Heights?
Median Household Income in Cuyahoga Heights is $73,229.
What is Income or Wage Gap in Cuyahoga Heights?
Income or Wage Gap in Cuyahoga Heights is 15.5%.
Women in Cuyahoga Heights earn 84.5 cents for every dollar earned by a man.
What is Inequality or Gini Index in Cuyahoga Heights?
Inequality or Gini Index in Cuyahoga Heights is 0.38.
What is the Total Population of Cuyahoga Heights?
Total Population of Cuyahoga Heights is 627.
What is the Total Male Population of Cuyahoga Heights?
Total Male Population of Cuyahoga Heights is 288.
What is the Total Female Population of Cuyahoga Heights?
Total Female Population of Cuyahoga Heights is 339.
What is the Ratio of Males per 100 Females in Cuyahoga Heights?
There are 84.96 Males per 100 Females in Cuyahoga Heights.
What is the Ratio of Females per 100 Males in Cuyahoga Heights?
There are 117.71 Females per 100 Males in Cuyahoga Heights.
What is the Median Population Age in Cuyahoga Heights?
Median Population Age in Cuyahoga Heights is 43.7 Years.
What is the Average Family Size in Cuyahoga Heights
Average Family Size in Cuyahoga Heights is 3.1 People.
What is the Average Household Size in Cuyahoga Heights
Average Household Size in Cuyahoga Heights is 2.5 People.
How Large is the Labor Force in Cuyahoga Heights?
There are 329 People in the Labor Forcein in Cuyahoga Heights.
What is the Percentage of People in the Labor Force in Cuyahoga Heights?
66.3% of People are in the Labor Force in Cuyahoga Heights.
What is the Unemployment Rate in Cuyahoga Heights?
Unemployment Rate in Cuyahoga Heights is 8.5%.