White Oak, OH Map & Demographics
White Oak Map
White Oak Overview
$39,936
PER CAPITA INCOME
$106,968
AVG FAMILY INCOME
$71,465
AVG HOUSEHOLD INCOME
33.9%
WAGE / INCOME GAP [ % ]
66.1¢/ $1
WAGE / INCOME GAP [ $ ]
$13,093
FAMILY INCOME DEFICIT
0.43
INEQUALITY / GINI INDEX
19,101
TOTAL POPULATION
9,307
MALE POPULATION
9,794
FEMALE POPULATION
95.03
MALES / 100 FEMALES
105.23
FEMALES / 100 MALES
38.3
MEDIAN AGE
3.0
AVG FAMILY SIZE
2.4
AVG HOUSEHOLD SIZE
10,603
LABOR FORCE [ PEOPLE ]
71.1%
PERCENT IN LABOR FORCE
3.8%
UNEMPLOYMENT RATE
Income in White Oak
Income Overview in White Oak
Per Capita Income in White Oak is $39,936, while median incomes of families and households are $106,968 and $71,465 respectively.
| Characteristic | Number | Measure |
| Per Capita Income | 19,101 | $39,936 |
| Median Family Income | 4,818 | $106,968 |
| Mean Family Income | 4,818 | $119,153 |
| Median Household Income | 7,941 | $71,465 |
| Mean Household Income | 7,941 | $94,336 |
| Income Deficit | 4,818 | $13,093 |
| Wage / Income Gap (%) | 19,101 | 33.87% |
| Wage / Income Gap ($) | 19,101 | 66.13¢ per $1 |
| Gini / Inequality Index | 19,101 | 0.43 |
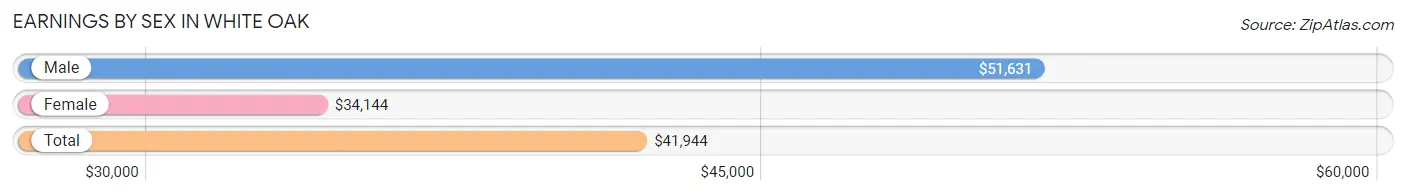
Earnings by Sex in White Oak
Average Earnings in White Oak are $41,944, $51,631 for men and $34,144 for women, a difference of 33.9%.
| Sex | Number | Average Earnings |
| Male | 5,459 (49.3%) | $51,631 |
| Female | 5,611 (50.7%) | $34,144 |
| Total | 11,070 (100.0%) | $41,944 |
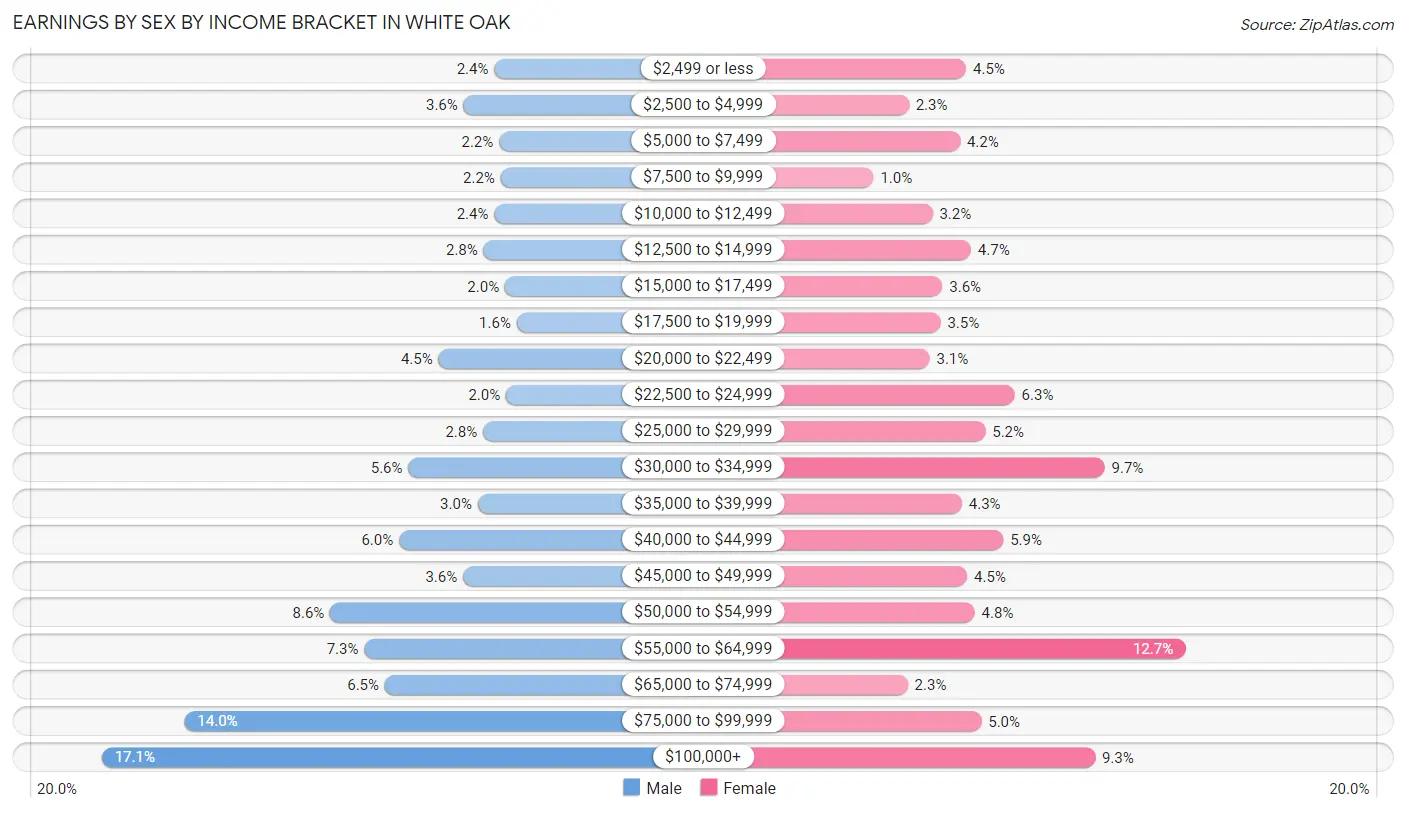
Earnings by Sex by Income Bracket in White Oak
The most common earnings brackets in White Oak are $100,000+ for men (934 | 17.1%) and $55,000 to $64,999 for women (711 | 12.7%).
| Income | Male | Female |
| $2,499 or less | 131 (2.4%) | 251 (4.5%) |
| $2,500 to $4,999 | 194 (3.5%) | 130 (2.3%) |
| $5,000 to $7,499 | 121 (2.2%) | 238 (4.2%) |
| $7,500 to $9,999 | 118 (2.2%) | 56 (1.0%) |
| $10,000 to $12,499 | 131 (2.4%) | 180 (3.2%) |
| $12,500 to $14,999 | 153 (2.8%) | 261 (4.6%) |
| $15,000 to $17,499 | 109 (2.0%) | 201 (3.6%) |
| $17,500 to $19,999 | 85 (1.6%) | 197 (3.5%) |
| $20,000 to $22,499 | 245 (4.5%) | 174 (3.1%) |
| $22,500 to $24,999 | 107 (2.0%) | 353 (6.3%) |
| $25,000 to $29,999 | 154 (2.8%) | 291 (5.2%) |
| $30,000 to $34,999 | 307 (5.6%) | 542 (9.7%) |
| $35,000 to $39,999 | 165 (3.0%) | 242 (4.3%) |
| $40,000 to $44,999 | 326 (6.0%) | 329 (5.9%) |
| $45,000 to $49,999 | 195 (3.6%) | 253 (4.5%) |
| $50,000 to $54,999 | 467 (8.6%) | 269 (4.8%) |
| $55,000 to $64,999 | 397 (7.3%) | 711 (12.7%) |
| $65,000 to $74,999 | 355 (6.5%) | 128 (2.3%) |
| $75,000 to $99,999 | 765 (14.0%) | 283 (5.0%) |
| $100,000+ | 934 (17.1%) | 522 (9.3%) |
| Total | 5,459 (100.0%) | 5,611 (100.0%) |
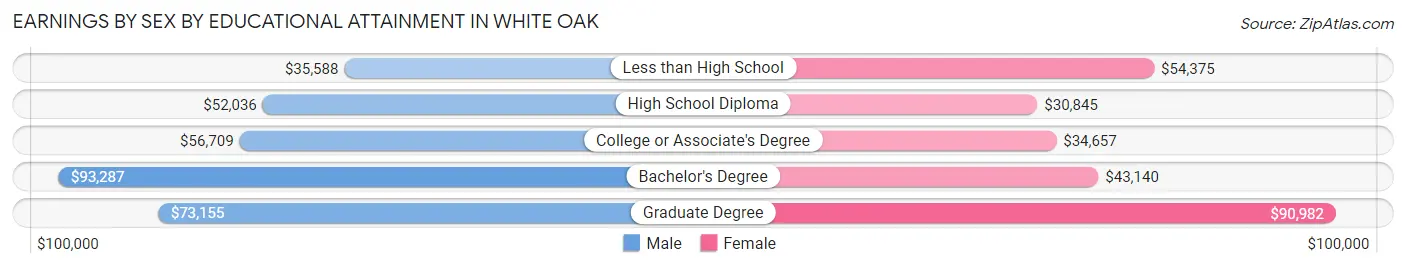
Earnings by Sex by Educational Attainment in White Oak
Average earnings in White Oak are $57,386 for men and $39,972 for women, a difference of 30.3%. Men with an educational attainment of bachelor's degree enjoy the highest average annual earnings of $93,287, while those with less than high school education earn the least with $35,588. Women with an educational attainment of graduate degree earn the most with the average annual earnings of $90,982, while those with high school diploma education have the smallest earnings of $30,845.
| Educational Attainment | Male Income | Female Income |
| Less than High School | $35,588 | $54,375 |
| High School Diploma | $52,036 | $30,845 |
| College or Associate's Degree | $56,709 | $34,657 |
| Bachelor's Degree | $93,287 | $43,140 |
| Graduate Degree | $73,155 | $90,982 |
| Total | $57,386 | $39,972 |
Family Income in White Oak
Family Income Brackets in White Oak
According to the White Oak family income data, there are 1,272 families falling into the $100,000 to $149,999 income range, which is the most common income bracket and makes up 26.4% of all families. Conversely, the $10,000 to $14,999 income bracket is the least frequent group with only 19 families (0.4%) belonging to this category.
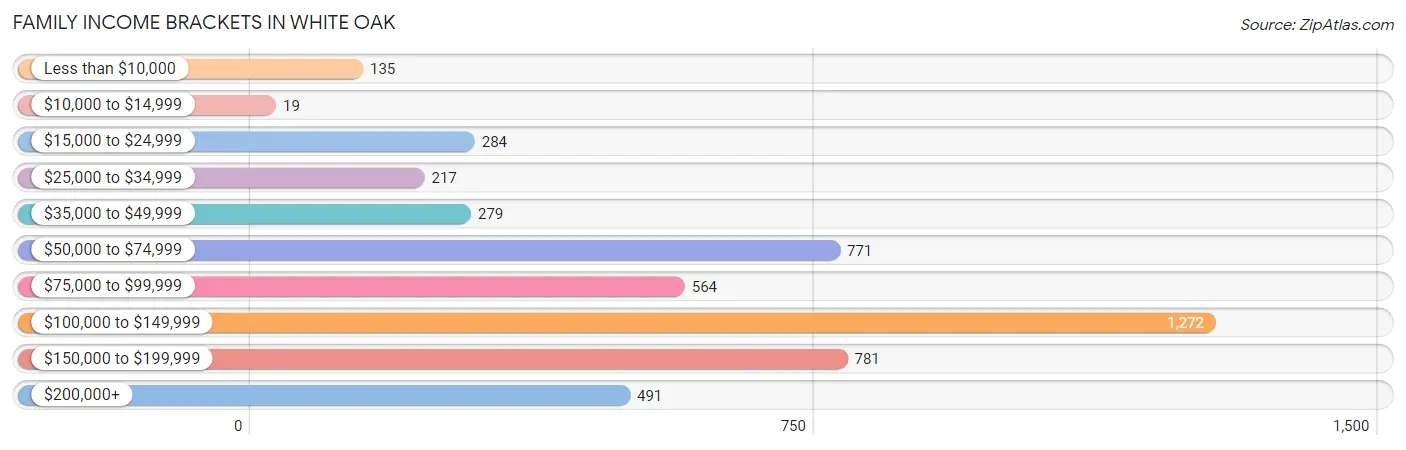
| Income Bracket | # Families | % Families |
| Less than $10,000 | 135 | 2.8% |
| $10,000 to $14,999 | 19 | 0.4% |
| $15,000 to $24,999 | 284 | 5.9% |
| $25,000 to $34,999 | 217 | 4.5% |
| $35,000 to $49,999 | 279 | 5.8% |
| $50,000 to $74,999 | 771 | 16.0% |
| $75,000 to $99,999 | 564 | 11.7% |
| $100,000 to $149,999 | 1,272 | 26.4% |
| $150,000 to $199,999 | 781 | 16.2% |
| $200,000+ | 491 | 10.2% |
Family Income by Famaliy Size in White Oak
6-person families (166 | 3.5%) account for the highest median family income in White Oak with $183,203 per family, while 2-person families (2,569 | 53.3%) have the highest median income of $41,690 per family member.
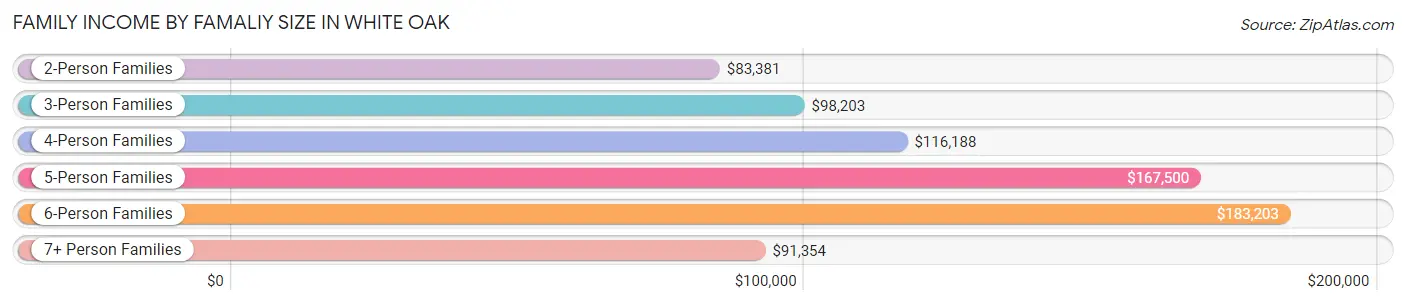
| Income Bracket | # Families | Median Income |
| 2-Person Families | 2,569 (53.3%) | $83,381 |
| 3-Person Families | 807 (16.8%) | $98,203 |
| 4-Person Families | 897 (18.6%) | $116,188 |
| 5-Person Families | 318 (6.6%) | $167,500 |
| 6-Person Families | 166 (3.5%) | $183,203 |
| 7+ Person Families | 61 (1.3%) | $91,354 |
| Total | 4,818 (100.0%) | $106,968 |
Family Income by Number of Earners in White Oak
The median family income in White Oak is $106,968, with families comprising 3+ earners (621) having the highest median family income of $180,949, while families with no earners (774) have the lowest median family income of $50,926, accounting for 12.9% and 16.1% of families, respectively.
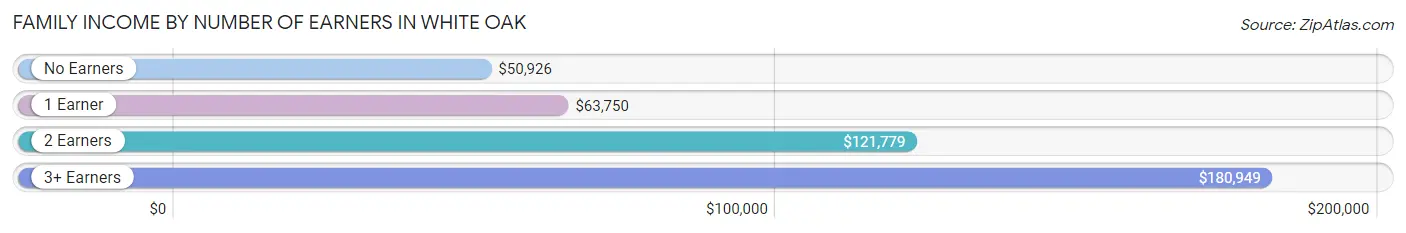
| Number of Earners | # Families | Median Income |
| No Earners | 774 (16.1%) | $50,926 |
| 1 Earner | 1,234 (25.6%) | $63,750 |
| 2 Earners | 2,189 (45.4%) | $121,779 |
| 3+ Earners | 621 (12.9%) | $180,949 |
| Total | 4,818 (100.0%) | $106,968 |
Household Income in White Oak
Household Income Brackets in White Oak
With 1,556 households falling in the category, the $100,000 to $149,999 income range is the most frequent in White Oak, accounting for 19.6% of all households. In contrast, only 206 households (2.6%) fall into the less than $10,000 income bracket, making it the least populous group.
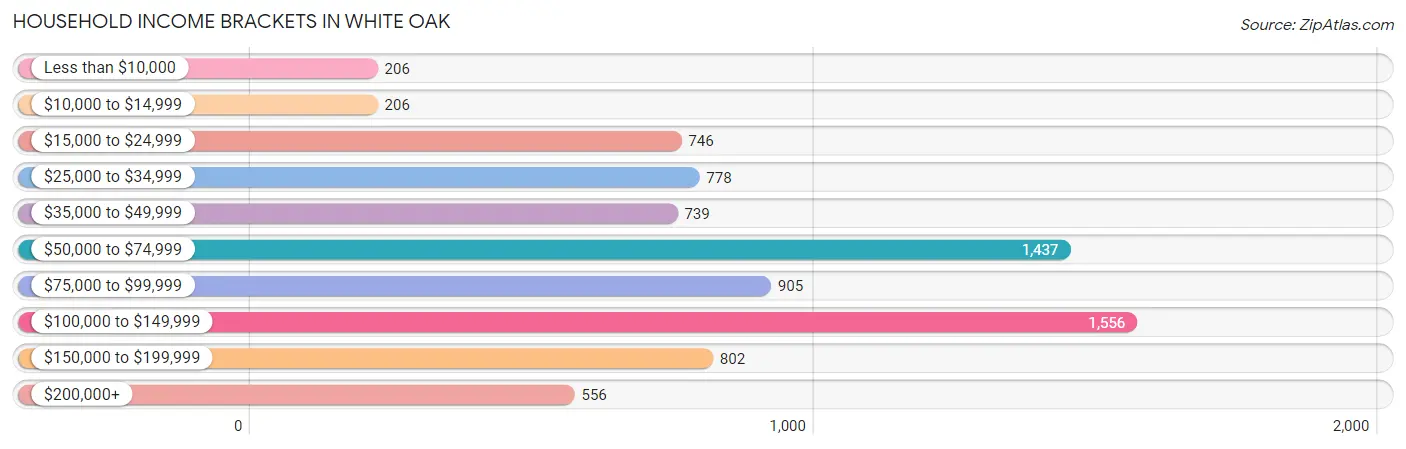
| Income Bracket | # Households | % Households |
| Less than $10,000 | 206 | 2.6% |
| $10,000 to $14,999 | 206 | 2.6% |
| $15,000 to $24,999 | 746 | 9.4% |
| $25,000 to $34,999 | 778 | 9.8% |
| $35,000 to $49,999 | 739 | 9.3% |
| $50,000 to $74,999 | 1,437 | 18.1% |
| $75,000 to $99,999 | 905 | 11.4% |
| $100,000 to $149,999 | 1,556 | 19.6% |
| $150,000 to $199,999 | 802 | 10.1% |
| $200,000+ | 556 | 7.0% |
Household Income by Householder Age in White Oak
The median household income in White Oak is $71,465, with the highest median household income of $97,164 found in the 25 to 44 years age bracket for the primary householder. A total of 2,300 households (29.0%) fall into this category. Meanwhile, the 65+ years age bracket for the primary householder has the lowest median household income of $49,813, with 2,027 households (25.5%) in this group.
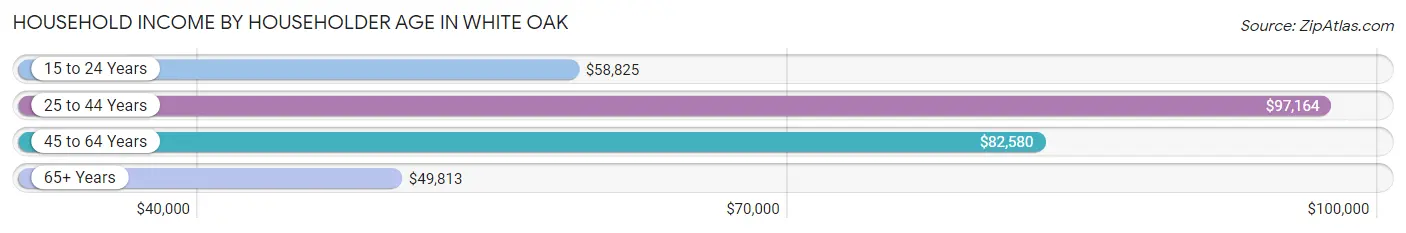
| Income Bracket | # Households | Median Income |
| 15 to 24 Years | 313 (3.9%) | $58,825 |
| 25 to 44 Years | 2,300 (29.0%) | $97,164 |
| 45 to 64 Years | 3,301 (41.6%) | $82,580 |
| 65+ Years | 2,027 (25.5%) | $49,813 |
| Total | 7,941 (100.0%) | $71,465 |
Poverty in White Oak
Income Below Poverty by Sex and Age in White Oak
With 8.2% poverty level for males and 6.6% for females among the residents of White Oak, 18 to 24 year old males and 5 year old females are the most vulnerable to poverty, with 199 males (24.2%) and 31 females (25.4%) in their respective age groups living below the poverty level.
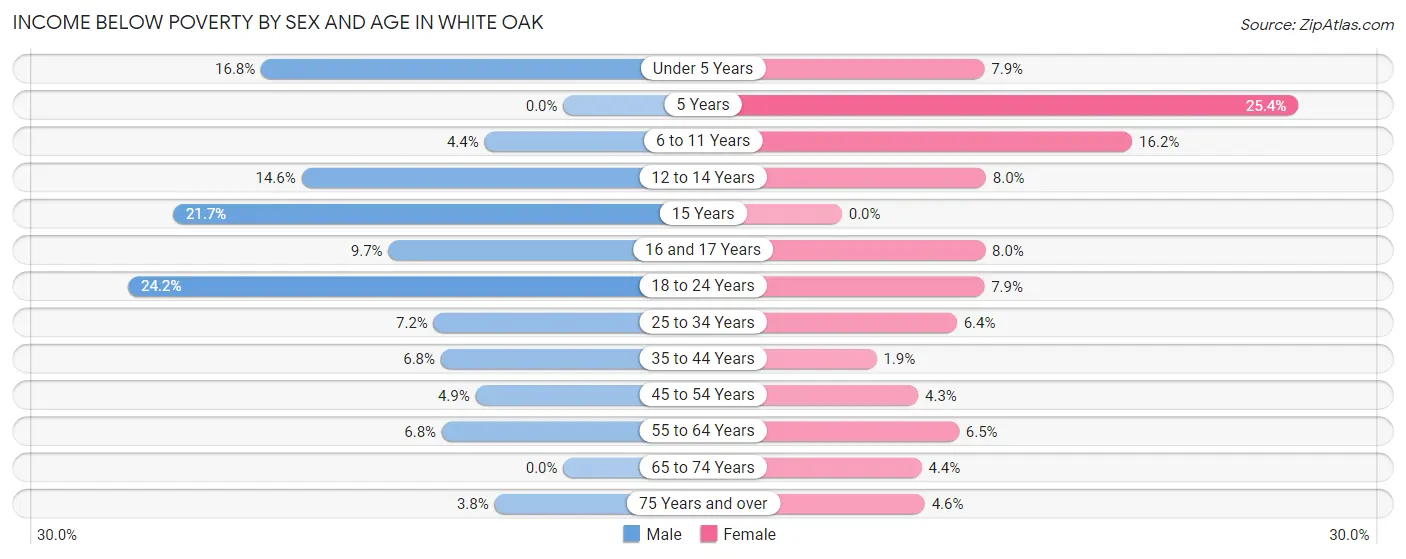
| Age Bracket | Male | Female |
| Under 5 Years | 87 (16.8%) | 62 (7.9%) |
| 5 Years | 0 (0.0%) | 31 (25.4%) |
| 6 to 11 Years | 34 (4.4%) | 119 (16.2%) |
| 12 to 14 Years | 57 (14.6%) | 15 (8.0%) |
| 15 Years | 15 (21.7%) | 0 (0.0%) |
| 16 and 17 Years | 15 (9.7%) | 13 (8.0%) |
| 18 to 24 Years | 199 (24.2%) | 59 (7.9%) |
| 25 to 34 Years | 92 (7.2%) | 77 (6.4%) |
| 35 to 44 Years | 67 (6.8%) | 20 (1.9%) |
| 45 to 54 Years | 48 (4.9%) | 53 (4.3%) |
| 55 to 64 Years | 95 (6.8%) | 113 (6.5%) |
| 65 to 74 Years | 0 (0.0%) | 42 (4.4%) |
| 75 Years and over | 19 (3.8%) | 35 (4.6%) |
| Total | 728 (8.2%) | 639 (6.6%) |
Income Above Poverty by Sex and Age in White Oak
According to the poverty statistics in White Oak, males aged 5 years and females aged 15 years are the age groups that are most secure financially, with 100.0% of males and 100.0% of females in these age groups living above the poverty line.
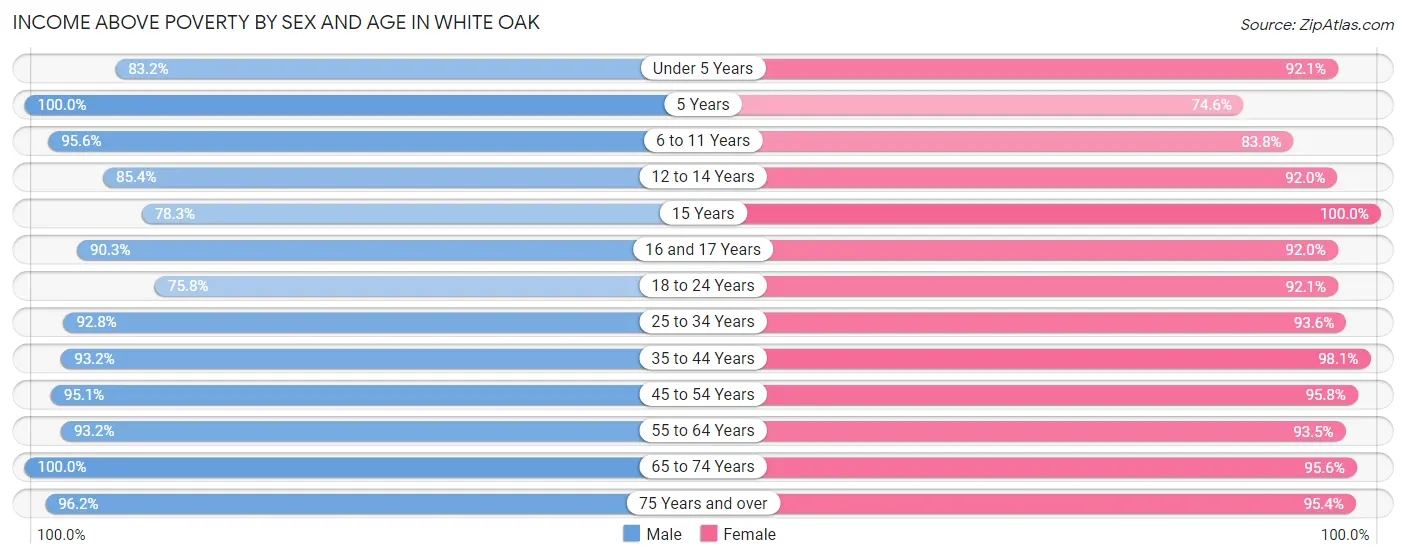
| Age Bracket | Male | Female |
| Under 5 Years | 430 (83.2%) | 719 (92.1%) |
| 5 Years | 47 (100.0%) | 91 (74.6%) |
| 6 to 11 Years | 741 (95.6%) | 617 (83.8%) |
| 12 to 14 Years | 334 (85.4%) | 172 (92.0%) |
| 15 Years | 54 (78.3%) | 97 (100.0%) |
| 16 and 17 Years | 139 (90.3%) | 150 (92.0%) |
| 18 to 24 Years | 622 (75.8%) | 685 (92.1%) |
| 25 to 34 Years | 1,182 (92.8%) | 1,127 (93.6%) |
| 35 to 44 Years | 916 (93.2%) | 1,015 (98.1%) |
| 45 to 54 Years | 934 (95.1%) | 1,194 (95.8%) |
| 55 to 64 Years | 1,310 (93.2%) | 1,620 (93.5%) |
| 65 to 74 Years | 962 (100.0%) | 904 (95.6%) |
| 75 Years and over | 477 (96.2%) | 723 (95.4%) |
| Total | 8,148 (91.8%) | 9,114 (93.4%) |
Income Below Poverty Among Married-Couple Families in White Oak
The poverty statistics for married-couple families in White Oak show that 1.3% or 43 of the total 3,407 families live below the poverty line. Families with 5 or more children have the highest poverty rate of 100.0%, comprising of 11 families. On the other hand, families with 1 or 2 children have the lowest poverty rate of 0.0%, which includes 0 families.
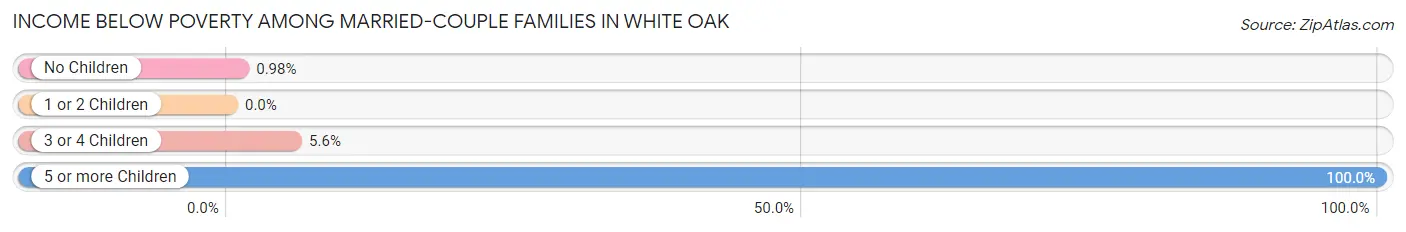
| Children | Above Poverty | Below Poverty |
| No Children | 2,124 (99.0%) | 21 (1.0%) |
| 1 or 2 Children | 1,054 (100.0%) | 0 (0.0%) |
| 3 or 4 Children | 186 (94.4%) | 11 (5.6%) |
| 5 or more Children | 0 (0.0%) | 11 (100.0%) |
| Total | 3,364 (98.7%) | 43 (1.3%) |
Income Below Poverty Among Single-Parent Households in White Oak
According to the poverty data in White Oak, 12.4% or 65 single-father households and 13.8% or 122 single-mother households are living below the poverty line. Among single-father households, those with no children have the highest poverty rate, with 20 households (23.0%) experiencing poverty. Likewise, among single-mother households, those with 3 or 4 children have the highest poverty rate, with 17 households (32.7%) falling below the poverty line.
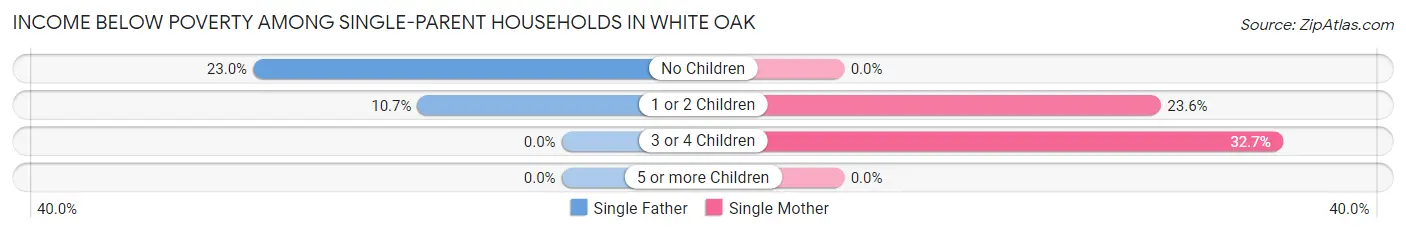
| Children | Single Father | Single Mother |
| No Children | 20 (23.0%) | 0 (0.0%) |
| 1 or 2 Children | 45 (10.7%) | 105 (23.6%) |
| 3 or 4 Children | 0 (0.0%) | 17 (32.7%) |
| 5 or more Children | 0 (0.0%) | 0 (0.0%) |
| Total | 65 (12.4%) | 122 (13.8%) |
Income Below Poverty Among Married-Couple vs Single-Parent Households in White Oak
The poverty data for White Oak shows that 43 of the married-couple family households (1.3%) and 187 of the single-parent households (13.3%) are living below the poverty level. Within the married-couple family households, those with 5 or more children have the highest poverty rate, with 11 households (100.0%) falling below the poverty line. Among the single-parent households, those with 3 or 4 children have the highest poverty rate, with 17 household (23.9%) living below poverty.
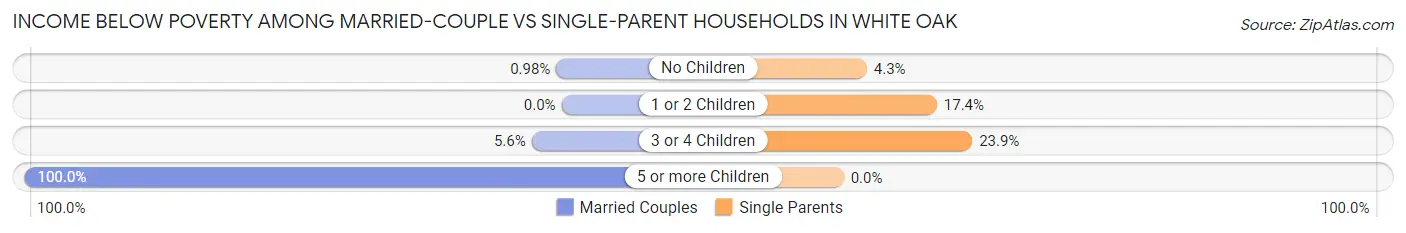
| Children | Married-Couple Families | Single-Parent Households |
| No Children | 21 (1.0%) | 20 (4.3%) |
| 1 or 2 Children | 0 (0.0%) | 150 (17.4%) |
| 3 or 4 Children | 11 (5.6%) | 17 (23.9%) |
| 5 or more Children | 11 (100.0%) | 0 (0.0%) |
| Total | 43 (1.3%) | 187 (13.3%) |
Race in White Oak
The most populous races in White Oak are White / Caucasian (13,523 | 70.8%), Black / African American (2,679 | 14.0%), and Asian (1,398 | 7.3%).
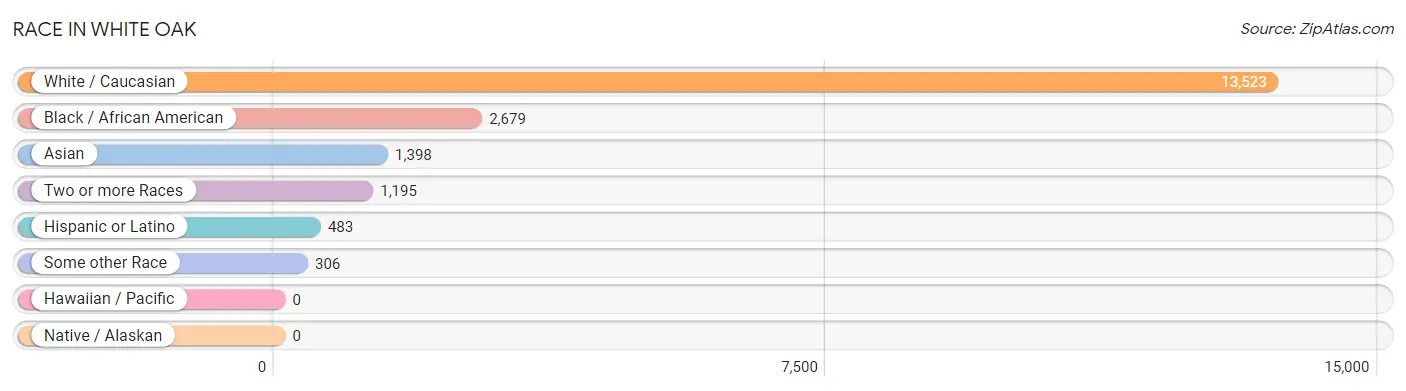
| Race | # Population | % Population |
| Asian | 1,398 | 7.3% |
| Black / African American | 2,679 | 14.0% |
| Hawaiian / Pacific | 0 | 0.0% |
| Hispanic or Latino | 483 | 2.5% |
| Native / Alaskan | 0 | 0.0% |
| White / Caucasian | 13,523 | 70.8% |
| Two or more Races | 1,195 | 6.3% |
| Some other Race | 306 | 1.6% |
| Total | 19,101 | 100.0% |
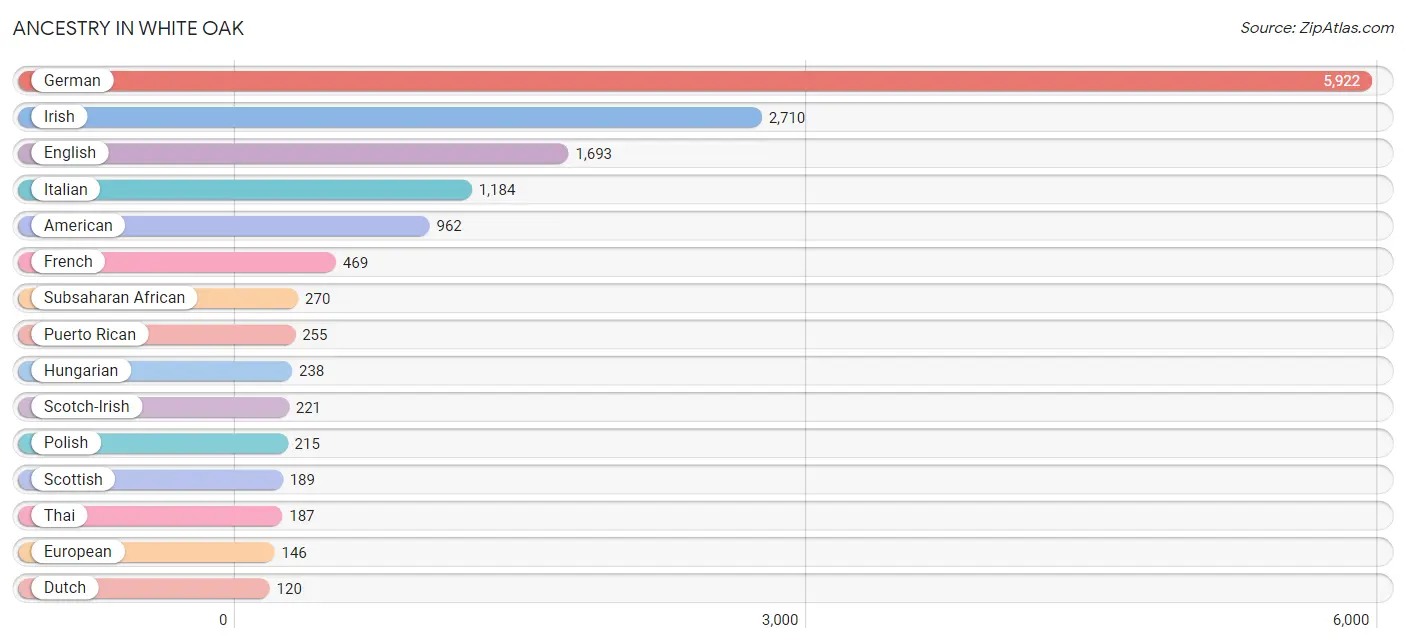
Ancestry in White Oak
The most populous ancestries reported in White Oak are German (5,922 | 31.0%), Irish (2,710 | 14.2%), English (1,693 | 8.9%), Italian (1,184 | 6.2%), and American (962 | 5.0%), together accounting for 65.3% of all White Oak residents.
| Ancestry | # Population | % Population |
| African | 5 | 0.0% |
| Alsatian | 18 | 0.1% |
| American | 962 | 5.0% |
| Arab | 23 | 0.1% |
| Austrian | 5 | 0.0% |
| Bhutanese | 21 | 0.1% |
| British | 42 | 0.2% |
| British West Indian | 7 | 0.0% |
| Burmese | 14 | 0.1% |
| Celtic | 12 | 0.1% |
| Central American | 50 | 0.3% |
| Cherokee | 62 | 0.3% |
| Colombian | 32 | 0.2% |
| Czechoslovakian | 5 | 0.0% |
| Dominican | 5 | 0.0% |
| Dutch | 120 | 0.6% |
| English | 1,693 | 8.9% |
| European | 146 | 0.8% |
| Finnish | 6 | 0.0% |
| French | 469 | 2.5% |
| German | 5,922 | 31.0% |
| Ghanaian | 38 | 0.2% |
| Greek | 114 | 0.6% |
| Honduran | 17 | 0.1% |
| Hungarian | 238 | 1.3% |
| Indian (Asian) | 45 | 0.2% |
| Irish | 2,710 | 14.2% |
| Italian | 1,184 | 6.2% |
| Korean | 46 | 0.2% |
| Lithuanian | 36 | 0.2% |
| Luxembourger | 7 | 0.0% |
| Mexican | 119 | 0.6% |
| Mongolian | 95 | 0.5% |
| Nigerian | 105 | 0.5% |
| Northern European | 25 | 0.1% |
| Norwegian | 43 | 0.2% |
| Panamanian | 33 | 0.2% |
| Polish | 215 | 1.1% |
| Puerto Rican | 255 | 1.3% |
| Romanian | 36 | 0.2% |
| Russian | 39 | 0.2% |
| Scandinavian | 47 | 0.3% |
| Scotch-Irish | 221 | 1.2% |
| Scottish | 189 | 1.0% |
| Senegalese | 63 | 0.3% |
| Slovak | 7 | 0.0% |
| Slovene | 14 | 0.1% |
| South American | 32 | 0.2% |
| Spanish | 22 | 0.1% |
| Sri Lankan | 24 | 0.1% |
| Subsaharan African | 270 | 1.4% |
| Swedish | 44 | 0.2% |
| Swiss | 11 | 0.1% |
| Thai | 187 | 1.0% |
| Welsh | 83 | 0.4% | View All 55 Rows |
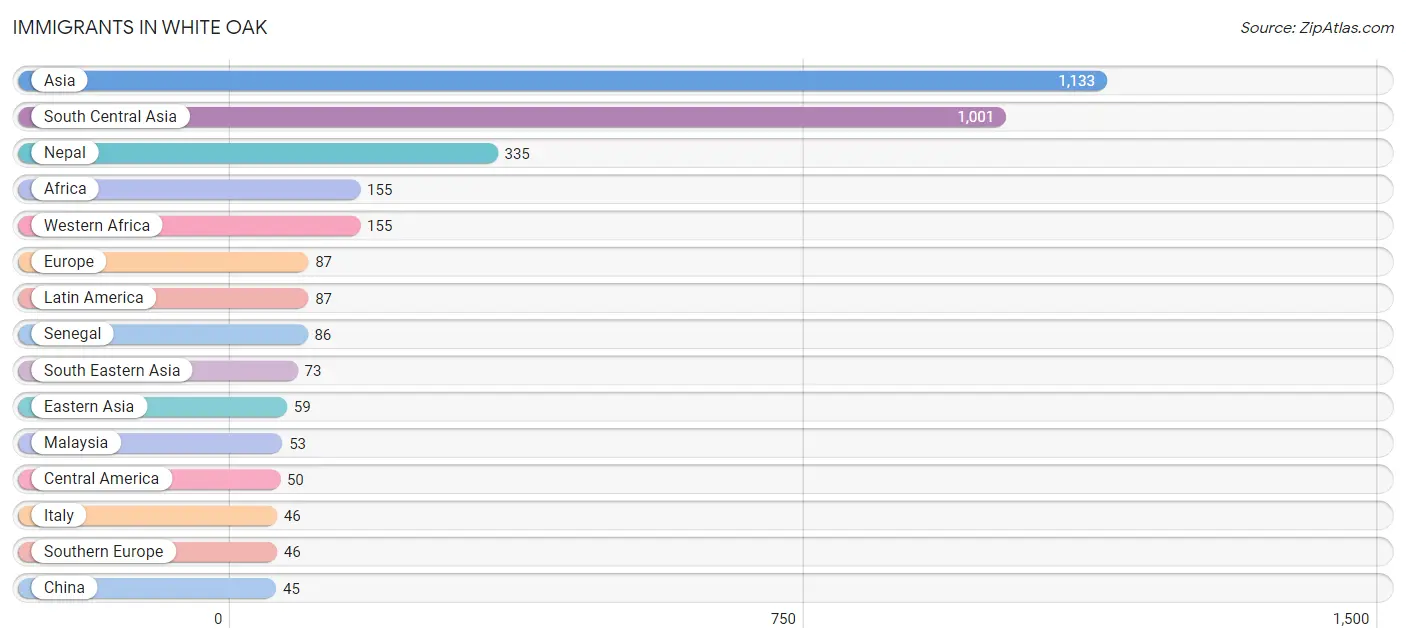
Immigrants in White Oak
The most numerous immigrant groups reported in White Oak came from Asia (1,133 | 5.9%), South Central Asia (1,001 | 5.2%), Nepal (335 | 1.8%), Africa (155 | 0.8%), and Western Africa (155 | 0.8%), together accounting for 14.5% of all White Oak residents.
| Immigration Origin | # Population | % Population |
| Africa | 155 | 0.8% |
| Asia | 1,133 | 5.9% |
| Caribbean | 5 | 0.0% |
| Central America | 50 | 0.3% |
| China | 45 | 0.2% |
| Dominica | 3 | 0.0% |
| Dominican Republic | 2 | 0.0% |
| Eastern Asia | 59 | 0.3% |
| Eastern Europe | 22 | 0.1% |
| Europe | 87 | 0.5% |
| Germany | 3 | 0.0% |
| Ghana | 38 | 0.2% |
| Honduras | 17 | 0.1% |
| Hong Kong | 14 | 0.1% |
| Italy | 46 | 0.2% |
| Korea | 14 | 0.1% |
| Latin America | 87 | 0.5% |
| Malaysia | 53 | 0.3% |
| Nepal | 335 | 1.8% |
| Netherlands | 16 | 0.1% |
| Nigeria | 31 | 0.2% |
| Panama | 33 | 0.2% |
| Philippines | 20 | 0.1% |
| Russia | 16 | 0.1% |
| Senegal | 86 | 0.4% |
| Serbia | 6 | 0.0% |
| South America | 32 | 0.2% |
| South Central Asia | 1,001 | 5.2% |
| South Eastern Asia | 73 | 0.4% |
| Southern Europe | 46 | 0.2% |
| Western Africa | 155 | 0.8% |
| Western Europe | 19 | 0.1% | View All 32 Rows |
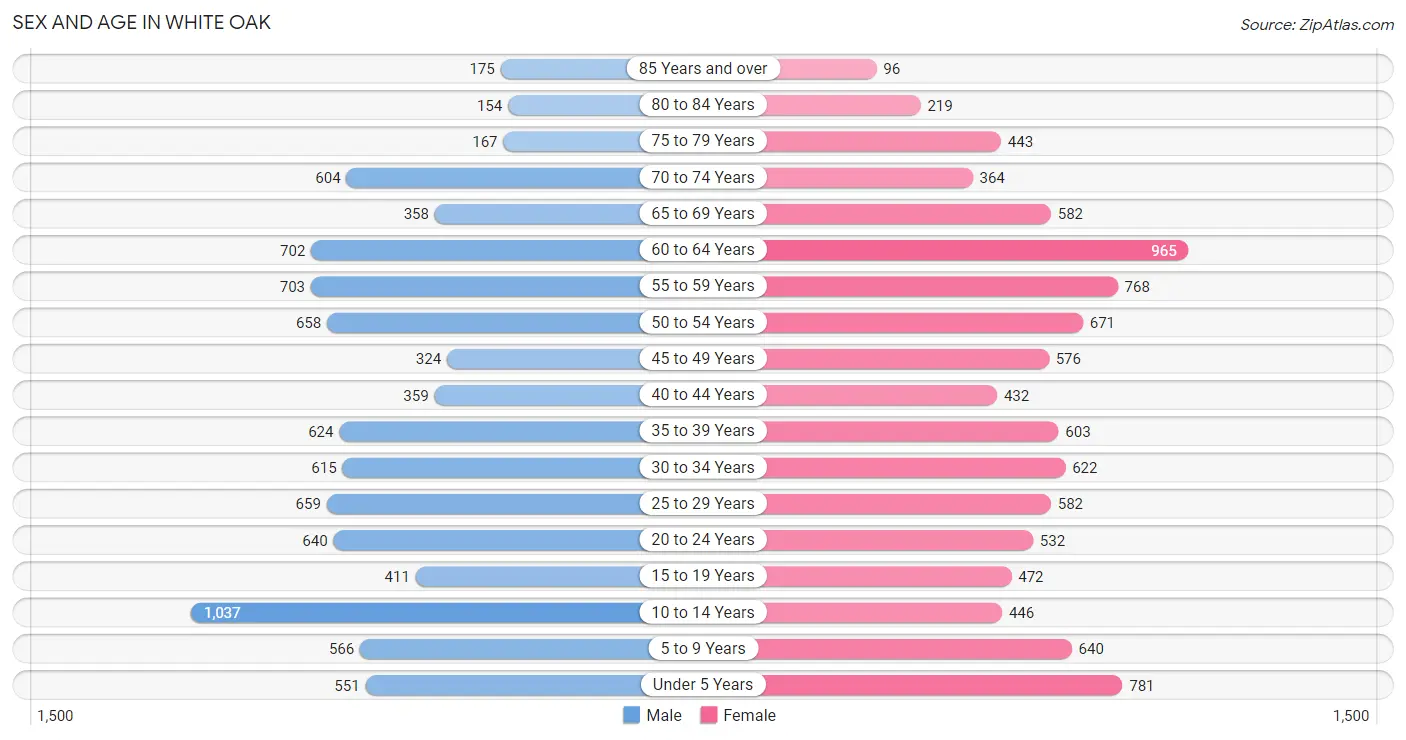
Sex and Age in White Oak
Sex and Age in White Oak
The most populous age groups in White Oak are 10 to 14 Years (1,037 | 11.1%) for men and 60 to 64 Years (965 | 9.9%) for women.
| Age Bracket | Male | Female |
| Under 5 Years | 551 (5.9%) | 781 (8.0%) |
| 5 to 9 Years | 566 (6.1%) | 640 (6.5%) |
| 10 to 14 Years | 1,037 (11.1%) | 446 (4.5%) |
| 15 to 19 Years | 411 (4.4%) | 472 (4.8%) |
| 20 to 24 Years | 640 (6.9%) | 532 (5.4%) |
| 25 to 29 Years | 659 (7.1%) | 582 (5.9%) |
| 30 to 34 Years | 615 (6.6%) | 622 (6.4%) |
| 35 to 39 Years | 624 (6.7%) | 603 (6.2%) |
| 40 to 44 Years | 359 (3.9%) | 432 (4.4%) |
| 45 to 49 Years | 324 (3.5%) | 576 (5.9%) |
| 50 to 54 Years | 658 (7.1%) | 671 (6.9%) |
| 55 to 59 Years | 703 (7.5%) | 768 (7.8%) |
| 60 to 64 Years | 702 (7.5%) | 965 (9.9%) |
| 65 to 69 Years | 358 (3.8%) | 582 (5.9%) |
| 70 to 74 Years | 604 (6.5%) | 364 (3.7%) |
| 75 to 79 Years | 167 (1.8%) | 443 (4.5%) |
| 80 to 84 Years | 154 (1.7%) | 219 (2.2%) |
| 85 Years and over | 175 (1.9%) | 96 (1.0%) |
| Total | 9,307 (100.0%) | 9,794 (100.0%) |
Families and Households in White Oak
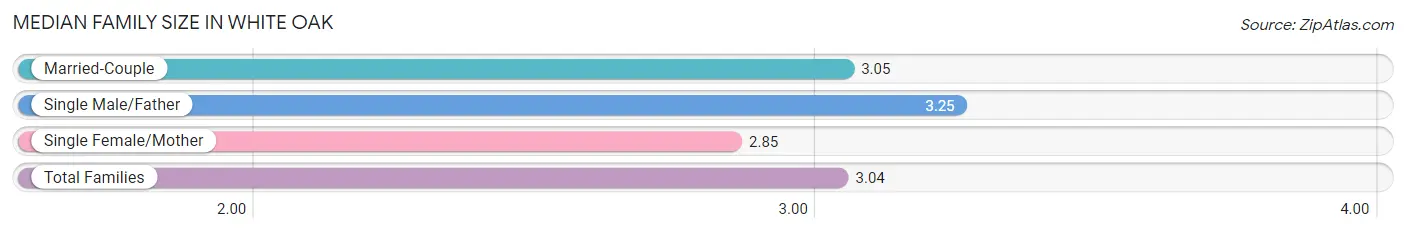
Median Family Size in White Oak
The median family size in White Oak is 3.04 persons per family, with single male/father families (525 | 10.9%) accounting for the largest median family size of 3.25 persons per family. On the other hand, single female/mother families (886 | 18.4%) represent the smallest median family size with 2.85 persons per family.
| Family Type | # Families | Family Size |
| Married-Couple | 3,407 (70.7%) | 3.05 |
| Single Male/Father | 525 (10.9%) | 3.25 |
| Single Female/Mother | 886 (18.4%) | 2.85 |
| Total Families | 4,818 (100.0%) | 3.04 |
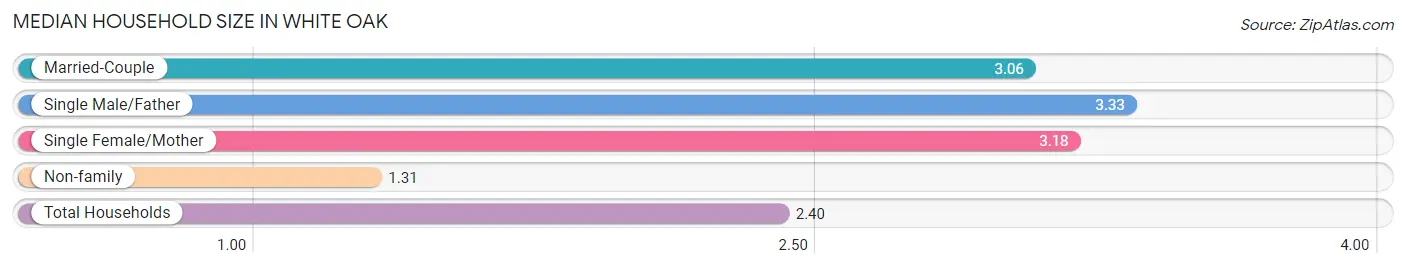
Median Household Size in White Oak
The median household size in White Oak is 2.40 persons per household, with single male/father households (525 | 6.6%) accounting for the largest median household size of 3.33 persons per household. non-family households (3,123 | 39.3%) represent the smallest median household size with 1.31 persons per household.
| Household Type | # Households | Household Size |
| Married-Couple | 3,407 (42.9%) | 3.06 |
| Single Male/Father | 525 (6.6%) | 3.33 |
| Single Female/Mother | 886 (11.2%) | 3.18 |
| Non-family | 3,123 (39.3%) | 1.31 |
| Total Households | 7,941 (100.0%) | 2.40 |
Household Size by Marriage Status in White Oak
Out of a total of 7,941 households in White Oak, 4,818 (60.7%) are family households, while 3,123 (39.3%) are nonfamily households. The most numerous type of family households are 2-person households, comprising 2,499, and the most common type of nonfamily households are 1-person households, comprising 2,458.
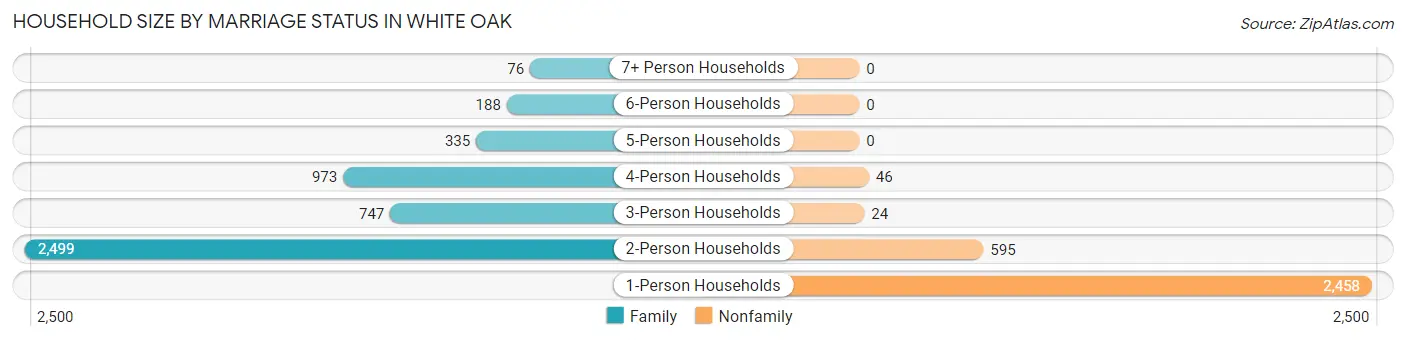
| Household Size | Family Households | Nonfamily Households |
| 1-Person Households | - | 2,458 (30.9%) |
| 2-Person Households | 2,499 (31.5%) | 595 (7.5%) |
| 3-Person Households | 747 (9.4%) | 24 (0.3%) |
| 4-Person Households | 973 (12.2%) | 46 (0.6%) |
| 5-Person Households | 335 (4.2%) | 0 (0.0%) |
| 6-Person Households | 188 (2.4%) | 0 (0.0%) |
| 7+ Person Households | 76 (1.0%) | 0 (0.0%) |
| Total | 4,818 (60.7%) | 3,123 (39.3%) |
Female Fertility in White Oak
Fertility by Age in White Oak
Average fertility rate in White Oak is 91.0 births per 1,000 women. Women in the age bracket of 35 to 50 years have the highest fertility rate with 117.0 births per 1,000 women. Women in the age bracket of 35 to 50 years acount for 56.4% of all women with births.
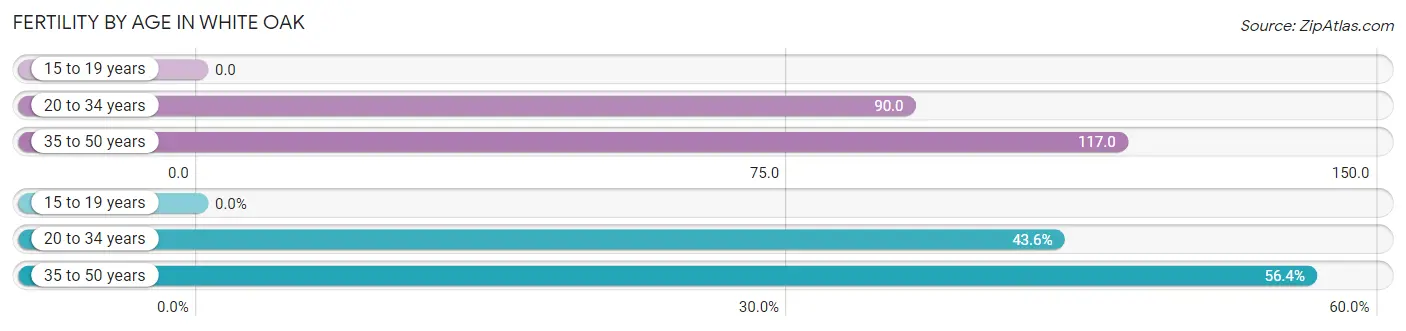
| Age Bracket | Women with Births | Births / 1,000 Women |
| 15 to 19 years | 0 (0.0%) | 0.0 |
| 20 to 34 years | 156 (43.6%) | 90.0 |
| 35 to 50 years | 202 (56.4%) | 117.0 |
| Total | 358 (100.0%) | 91.0 |
Fertility by Age by Marriage Status in White Oak
87.4% of women with births (358) in White Oak are married. The highest percentage of unmarried women with births falls into 35 to 50 years age bracket with 13.9% of them unmarried at the time of birth, while the lowest percentage of unmarried women with births belong to 20 to 34 years age bracket with 10.9% of them unmarried.
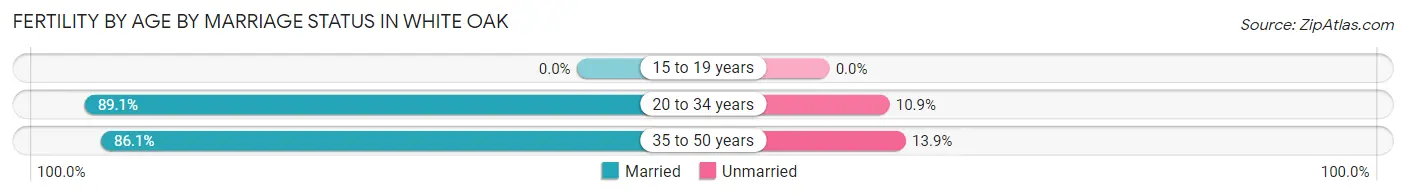
| Age Bracket | Married | Unmarried |
| 15 to 19 years | 0 (0.0%) | 0 (0.0%) |
| 20 to 34 years | 139 (89.1%) | 17 (10.9%) |
| 35 to 50 years | 174 (86.1%) | 28 (13.9%) |
| Total | 313 (87.4%) | 45 (12.6%) |
Fertility by Education in White Oak
Average fertility rate in White Oak is 91.0 births per 1,000 women. Women with the education attainment of bachelor's degree have the highest fertility rate of 194.0 births per 1,000 women, while women with the education attainment of graduate degree have the lowest fertility at 34.0 births per 1,000 women. Women with the education attainment of bachelor's degree represent 54.7% of all women with births.
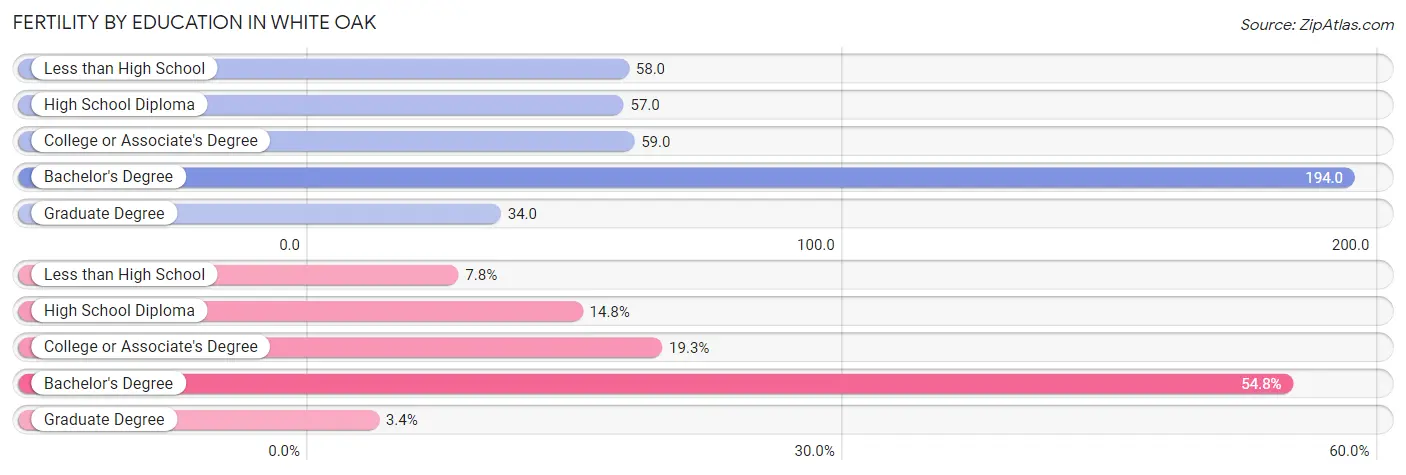
| Educational Attainment | Women with Births | Births / 1,000 Women |
| Less than High School | 28 (7.8%) | 58.0 |
| High School Diploma | 53 (14.8%) | 57.0 |
| College or Associate's Degree | 69 (19.3%) | 59.0 |
| Bachelor's Degree | 196 (54.7%) | 194.0 |
| Graduate Degree | 12 (3.4%) | 34.0 |
| Total | 358 (100.0%) | 91.0 |
Fertility by Education by Marriage Status in White Oak
12.6% of women with births in White Oak are unmarried. Women with the educational attainment of less than high school are most likely to be married with 100.0% of them married at childbirth, while women with the educational attainment of high school diploma are least likely to be married with 84.9% of them unmarried at childbirth.
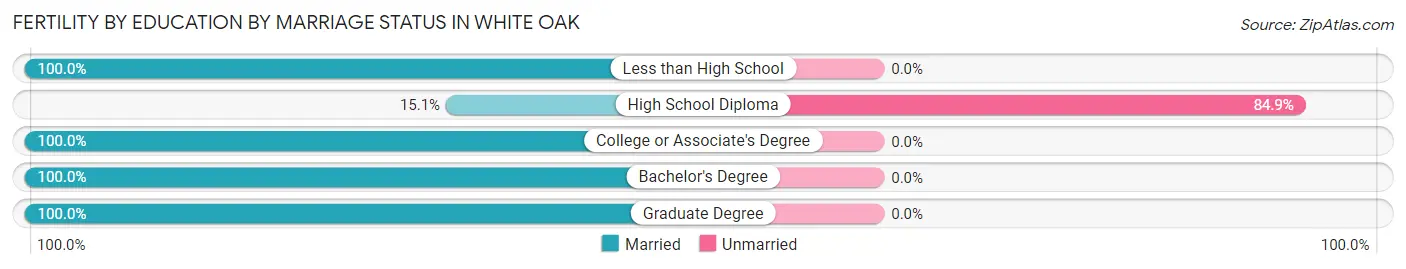
| Educational Attainment | Married | Unmarried |
| Less than High School | 28 (100.0%) | 0 (0.0%) |
| High School Diploma | 8 (15.1%) | 45 (84.9%) |
| College or Associate's Degree | 69 (100.0%) | 0 (0.0%) |
| Bachelor's Degree | 196 (100.0%) | 0 (0.0%) |
| Graduate Degree | 12 (100.0%) | 0 (0.0%) |
| Total | 313 (87.4%) | 45 (12.6%) |
Employment Characteristics in White Oak
Employment by Class of Employer in White Oak
Among the 10,015 employed individuals in White Oak, private company employees (7,228 | 72.2%), not-for-profit organizations (1,100 | 11.0%), and local government employees (629 | 6.3%) make up the most common classes of employment.
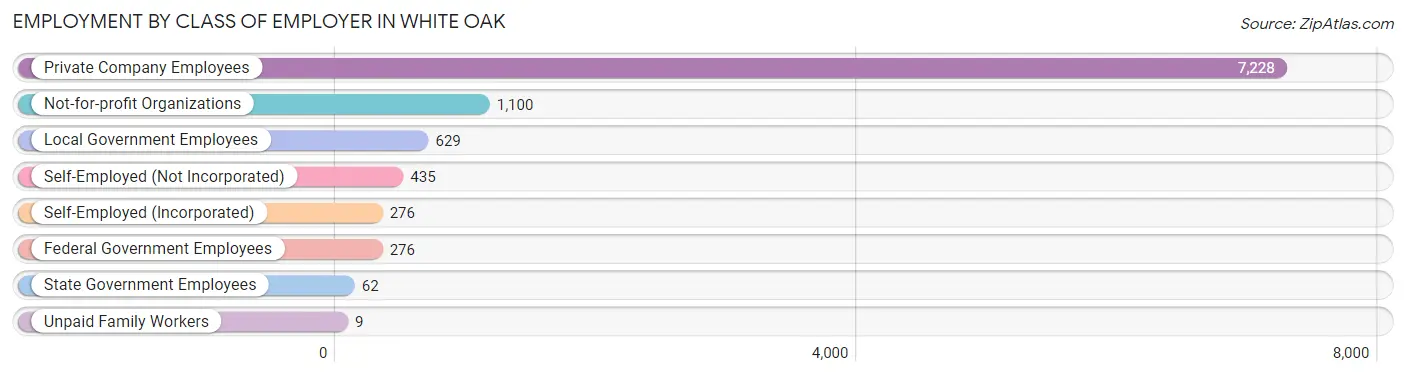
| Employer Class | # Employees | % Employees |
| Private Company Employees | 7,228 | 72.2% |
| Self-Employed (Incorporated) | 276 | 2.8% |
| Self-Employed (Not Incorporated) | 435 | 4.3% |
| Not-for-profit Organizations | 1,100 | 11.0% |
| Local Government Employees | 629 | 6.3% |
| State Government Employees | 62 | 0.6% |
| Federal Government Employees | 276 | 2.8% |
| Unpaid Family Workers | 9 | 0.1% |
| Total | 10,015 | 100.0% |
Employment Status by Age in White Oak
According to the labor force statistics for White Oak, out of the total population over 16 years of age (14,913), 71.1% or 10,603 individuals are in the labor force, with 3.8% or 403 of them unemployed. The age group with the highest labor force participation rate is 25 to 29 years, with 99.0% or 1,229 individuals in the labor force. Within the labor force, the 45 to 54 years age range has the highest percentage of unemployed individuals, with 7.7% or 150 of them being unemployed.
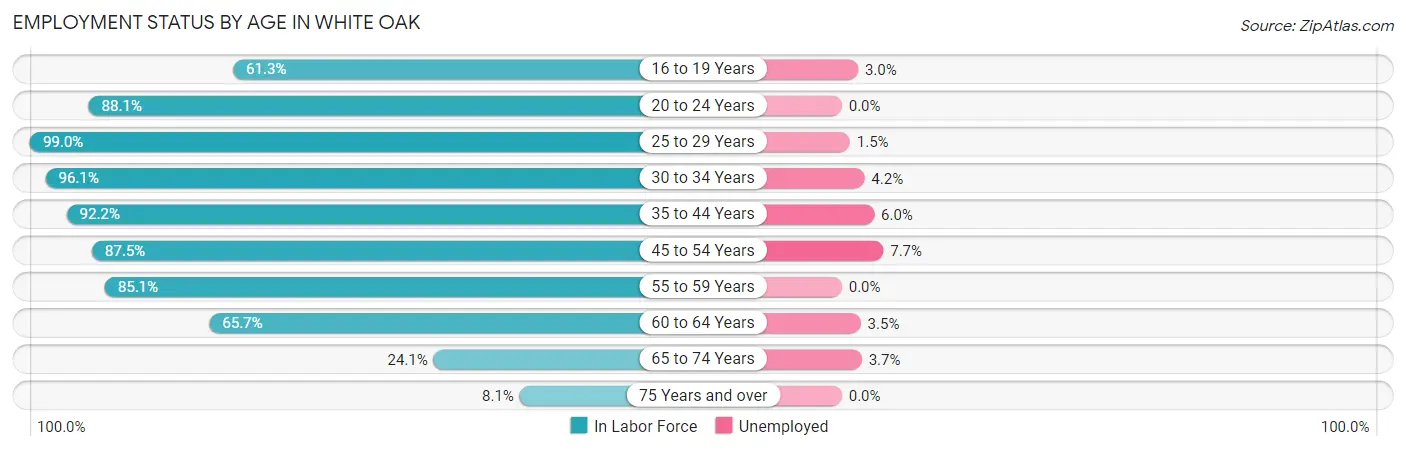
| Age Bracket | In Labor Force | Unemployed |
| 16 to 19 Years | 439 (61.3%) | 13 (3.0%) |
| 20 to 24 Years | 1,033 (88.1%) | 0 (0.0%) |
| 25 to 29 Years | 1,229 (99.0%) | 18 (1.5%) |
| 30 to 34 Years | 1,189 (96.1%) | 50 (4.2%) |
| 35 to 44 Years | 1,861 (92.2%) | 112 (6.0%) |
| 45 to 54 Years | 1,950 (87.5%) | 150 (7.7%) |
| 55 to 59 Years | 1,252 (85.1%) | 0 (0.0%) |
| 60 to 64 Years | 1,095 (65.7%) | 38 (3.5%) |
| 65 to 74 Years | 460 (24.1%) | 17 (3.7%) |
| 75 Years and over | 102 (8.1%) | 0 (0.0%) |
| Total | 10,603 (71.1%) | 403 (3.8%) |
Employment Status by Educational Attainment in White Oak
According to labor force statistics for White Oak, 87.0% of individuals (8,581) out of the total population between 25 and 64 years of age (9,863) are in the labor force, with 4.3% or 369 of them being unemployed. The group with the highest labor force participation rate are those with the educational attainment of bachelor's degree or higher, with 91.5% or 3,052 individuals in the labor force. Within the labor force, individuals with less than high school education have the highest percentage of unemployment, with 8.9% or 44 of them being unemployed.
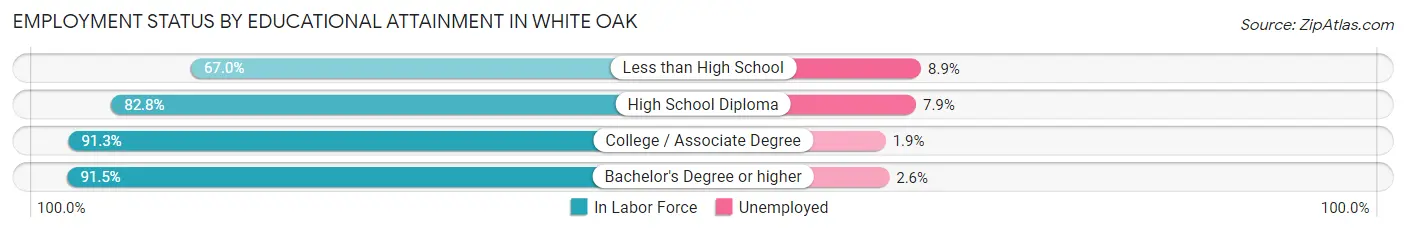
| Educational Attainment | In Labor Force | Unemployed |
| Less than High School | 492 (67.0%) | 65 (8.9%) |
| High School Diploma | 2,509 (82.8%) | 239 (7.9%) |
| College / Associate Degree | 2,524 (91.3%) | 53 (1.9%) |
| Bachelor's Degree or higher | 3,052 (91.5%) | 87 (2.6%) |
| Total | 8,581 (87.0%) | 424 (4.3%) |
Employment Occupations by Sex in White Oak
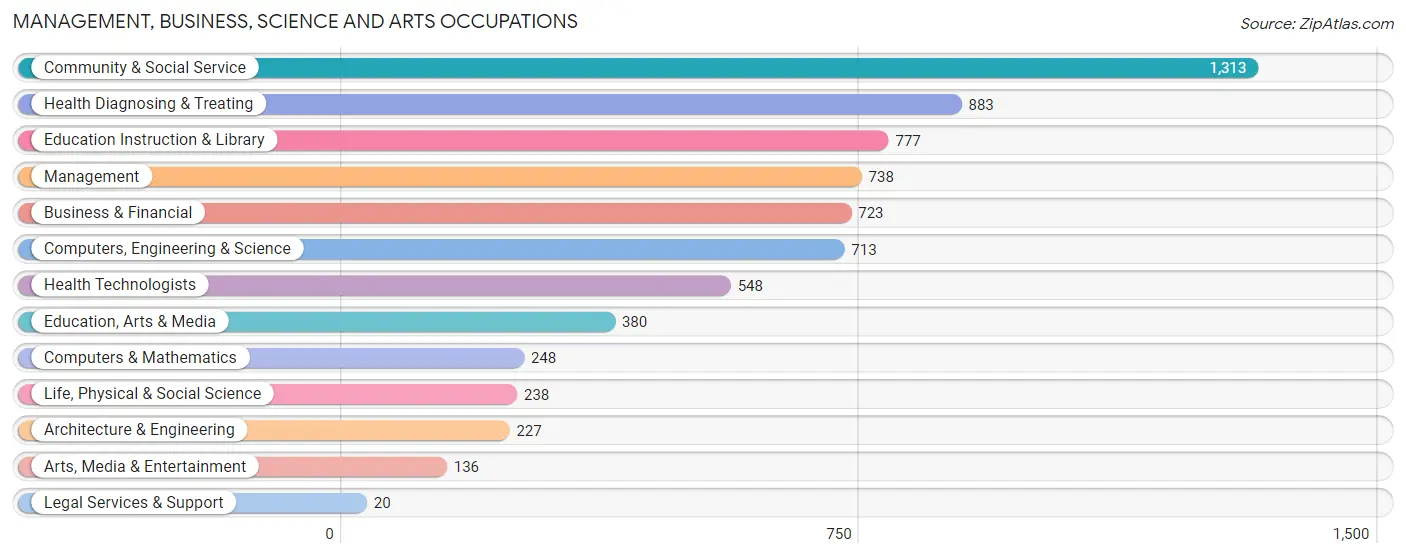
Management, Business, Science and Arts Occupations
The most common Management, Business, Science and Arts occupations in White Oak are Community & Social Service (1,313 | 12.9%), Health Diagnosing & Treating (883 | 8.6%), Education Instruction & Library (777 | 7.6%), Management (738 | 7.2%), and Business & Financial (723 | 7.1%).
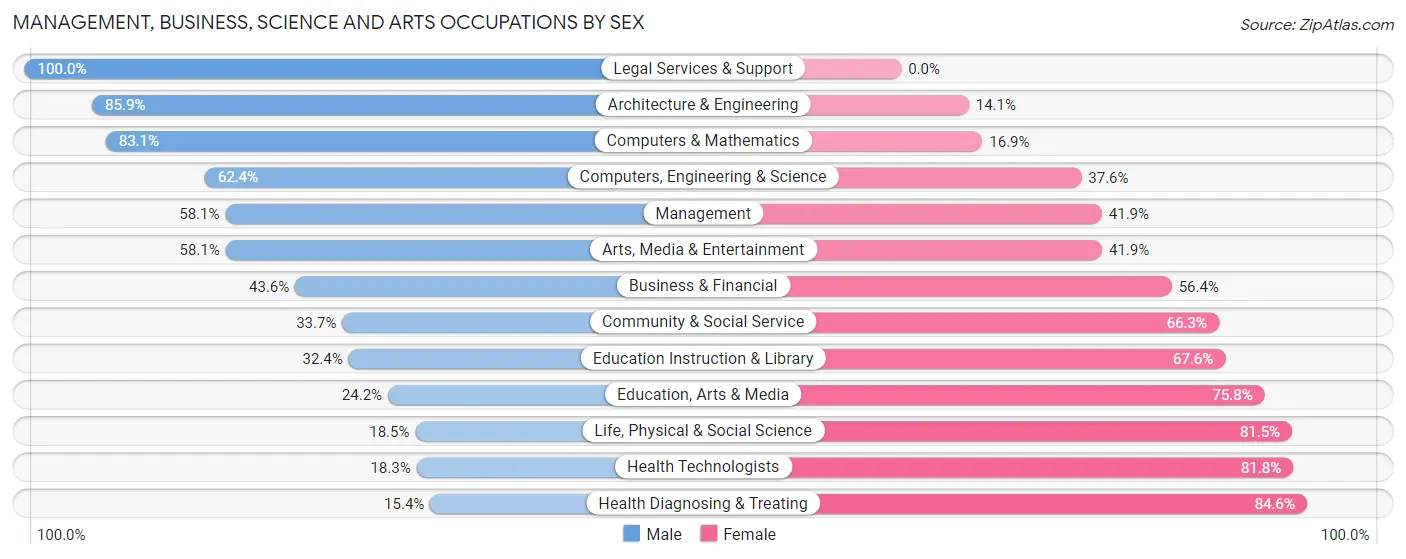
Management, Business, Science and Arts Occupations by Sex
Within the Management, Business, Science and Arts occupations in White Oak, the most male-oriented occupations are Legal Services & Support (100.0%), Architecture & Engineering (85.9%), and Computers & Mathematics (83.1%), while the most female-oriented occupations are Health Diagnosing & Treating (84.6%), Health Technologists (81.8%), and Life, Physical & Social Science (81.5%).
| Occupation | Male | Female |
| Management | 429 (58.1%) | 309 (41.9%) |
| Business & Financial | 315 (43.6%) | 408 (56.4%) |
| Computers, Engineering & Science | 445 (62.4%) | 268 (37.6%) |
| Computers & Mathematics | 206 (83.1%) | 42 (16.9%) |
| Architecture & Engineering | 195 (85.9%) | 32 (14.1%) |
| Life, Physical & Social Science | 44 (18.5%) | 194 (81.5%) |
| Community & Social Service | 443 (33.7%) | 870 (66.3%) |
| Education, Arts & Media | 92 (24.2%) | 288 (75.8%) |
| Legal Services & Support | 20 (100.0%) | 0 (0.0%) |
| Education Instruction & Library | 252 (32.4%) | 525 (67.6%) |
| Arts, Media & Entertainment | 79 (58.1%) | 57 (41.9%) |
| Health Diagnosing & Treating | 136 (15.4%) | 747 (84.6%) |
| Health Technologists | 100 (18.2%) | 448 (81.8%) |
| Total (Category) | 1,768 (40.5%) | 2,602 (59.5%) |
| Total (Overall) | 4,999 (49.0%) | 5,211 (51.0%) |
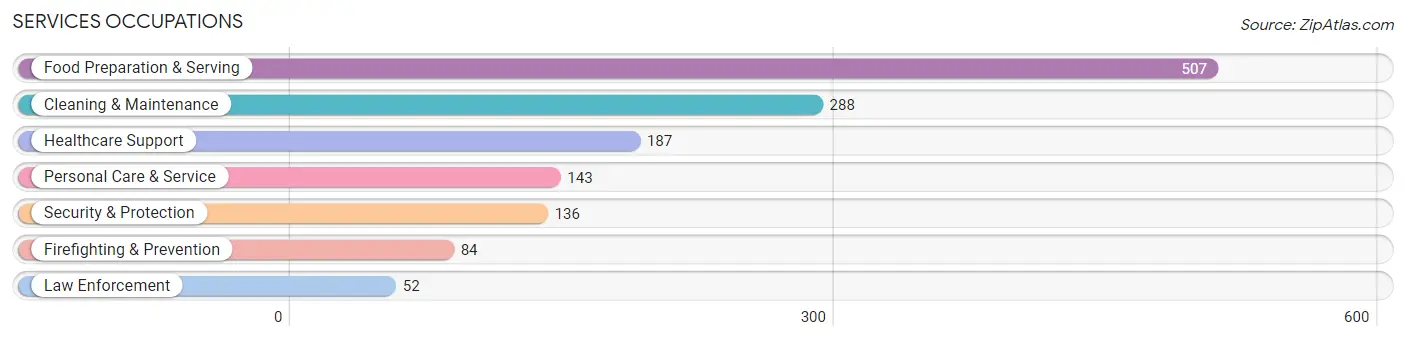
Services Occupations
The most common Services occupations in White Oak are Food Preparation & Serving (507 | 5.0%), Cleaning & Maintenance (288 | 2.8%), Healthcare Support (187 | 1.8%), Personal Care & Service (143 | 1.4%), and Security & Protection (136 | 1.3%).
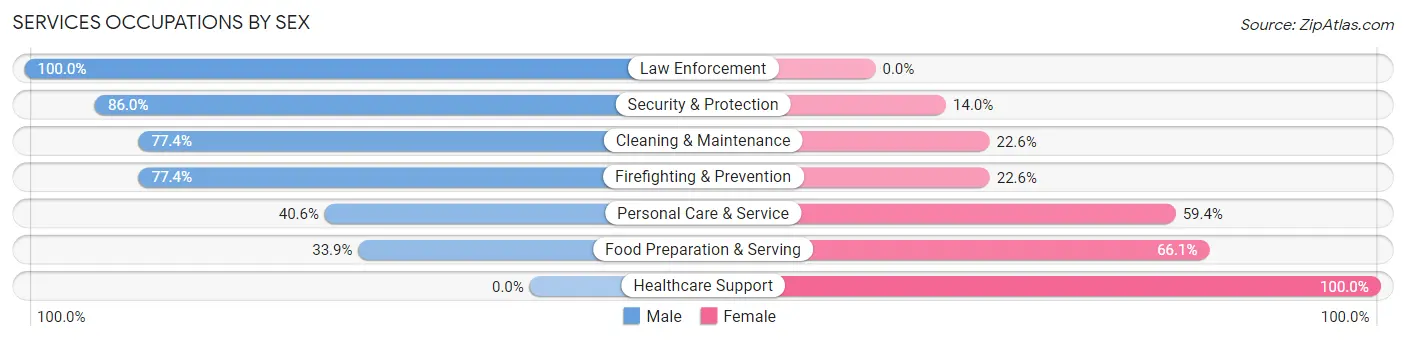
Services Occupations by Sex
Within the Services occupations in White Oak, the most male-oriented occupations are Law Enforcement (100.0%), Security & Protection (86.0%), and Cleaning & Maintenance (77.4%), while the most female-oriented occupations are Healthcare Support (100.0%), Food Preparation & Serving (66.1%), and Personal Care & Service (59.4%).
| Occupation | Male | Female |
| Healthcare Support | 0 (0.0%) | 187 (100.0%) |
| Security & Protection | 117 (86.0%) | 19 (14.0%) |
| Firefighting & Prevention | 65 (77.4%) | 19 (22.6%) |
| Law Enforcement | 52 (100.0%) | 0 (0.0%) |
| Food Preparation & Serving | 172 (33.9%) | 335 (66.1%) |
| Cleaning & Maintenance | 223 (77.4%) | 65 (22.6%) |
| Personal Care & Service | 58 (40.6%) | 85 (59.4%) |
| Total (Category) | 570 (45.2%) | 691 (54.8%) |
| Total (Overall) | 4,999 (49.0%) | 5,211 (51.0%) |
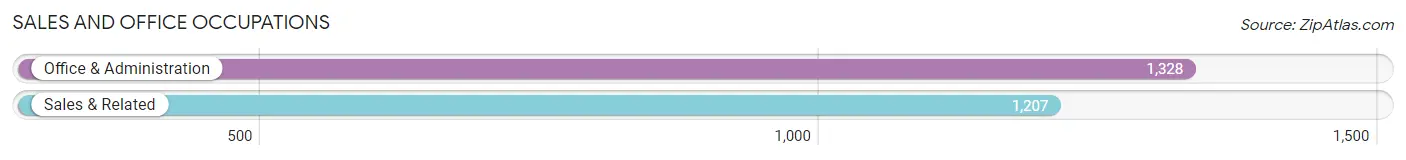
Sales and Office Occupations
The most common Sales and Office occupations in White Oak are Office & Administration (1,328 | 13.0%), and Sales & Related (1,207 | 11.8%).
Sales and Office Occupations by Sex
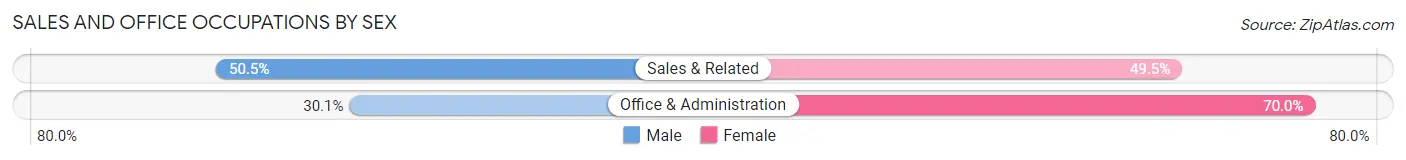
| Occupation | Male | Female |
| Sales & Related | 610 (50.5%) | 597 (49.5%) |
| Office & Administration | 399 (30.0%) | 929 (70.0%) |
| Total (Category) | 1,009 (39.8%) | 1,526 (60.2%) |
| Total (Overall) | 4,999 (49.0%) | 5,211 (51.0%) |
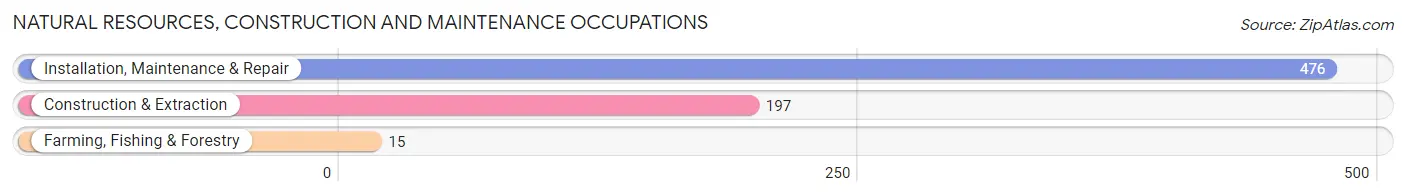
Natural Resources, Construction and Maintenance Occupations
The most common Natural Resources, Construction and Maintenance occupations in White Oak are Installation, Maintenance & Repair (476 | 4.7%), Construction & Extraction (197 | 1.9%), and Farming, Fishing & Forestry (15 | 0.2%).
Natural Resources, Construction and Maintenance Occupations by Sex
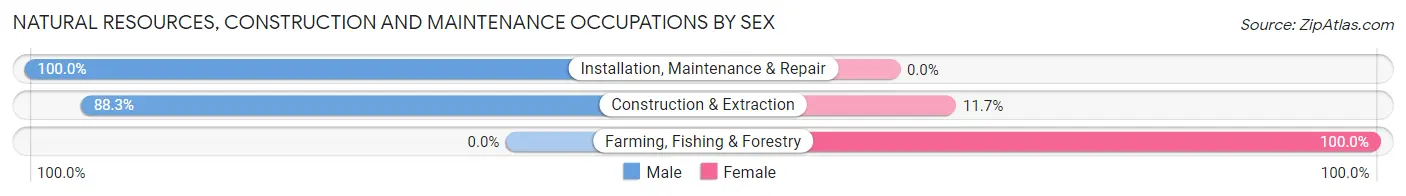
| Occupation | Male | Female |
| Farming, Fishing & Forestry | 0 (0.0%) | 15 (100.0%) |
| Construction & Extraction | 174 (88.3%) | 23 (11.7%) |
| Installation, Maintenance & Repair | 476 (100.0%) | 0 (0.0%) |
| Total (Category) | 650 (94.5%) | 38 (5.5%) |
| Total (Overall) | 4,999 (49.0%) | 5,211 (51.0%) |
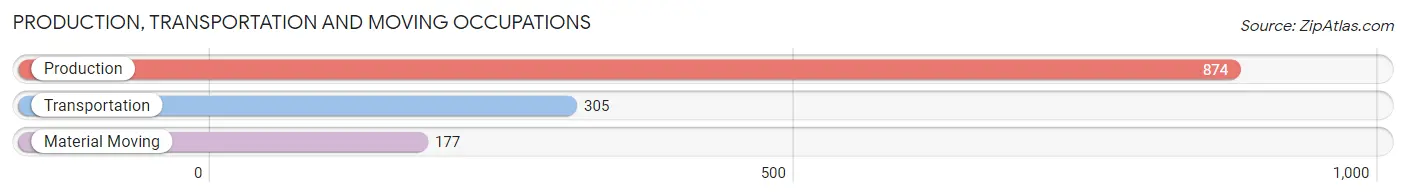
Production, Transportation and Moving Occupations
The most common Production, Transportation and Moving occupations in White Oak are Production (874 | 8.6%), Transportation (305 | 3.0%), and Material Moving (177 | 1.7%).
Production, Transportation and Moving Occupations by Sex
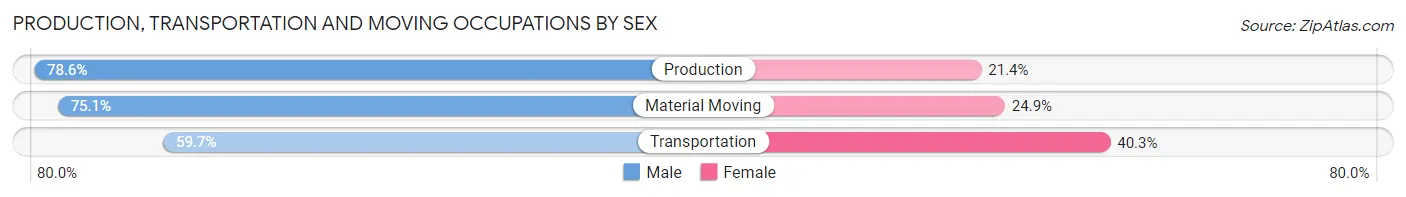
| Occupation | Male | Female |
| Production | 687 (78.6%) | 187 (21.4%) |
| Transportation | 182 (59.7%) | 123 (40.3%) |
| Material Moving | 133 (75.1%) | 44 (24.9%) |
| Total (Category) | 1,002 (73.9%) | 354 (26.1%) |
| Total (Overall) | 4,999 (49.0%) | 5,211 (51.0%) |
Employment Industries by Sex in White Oak
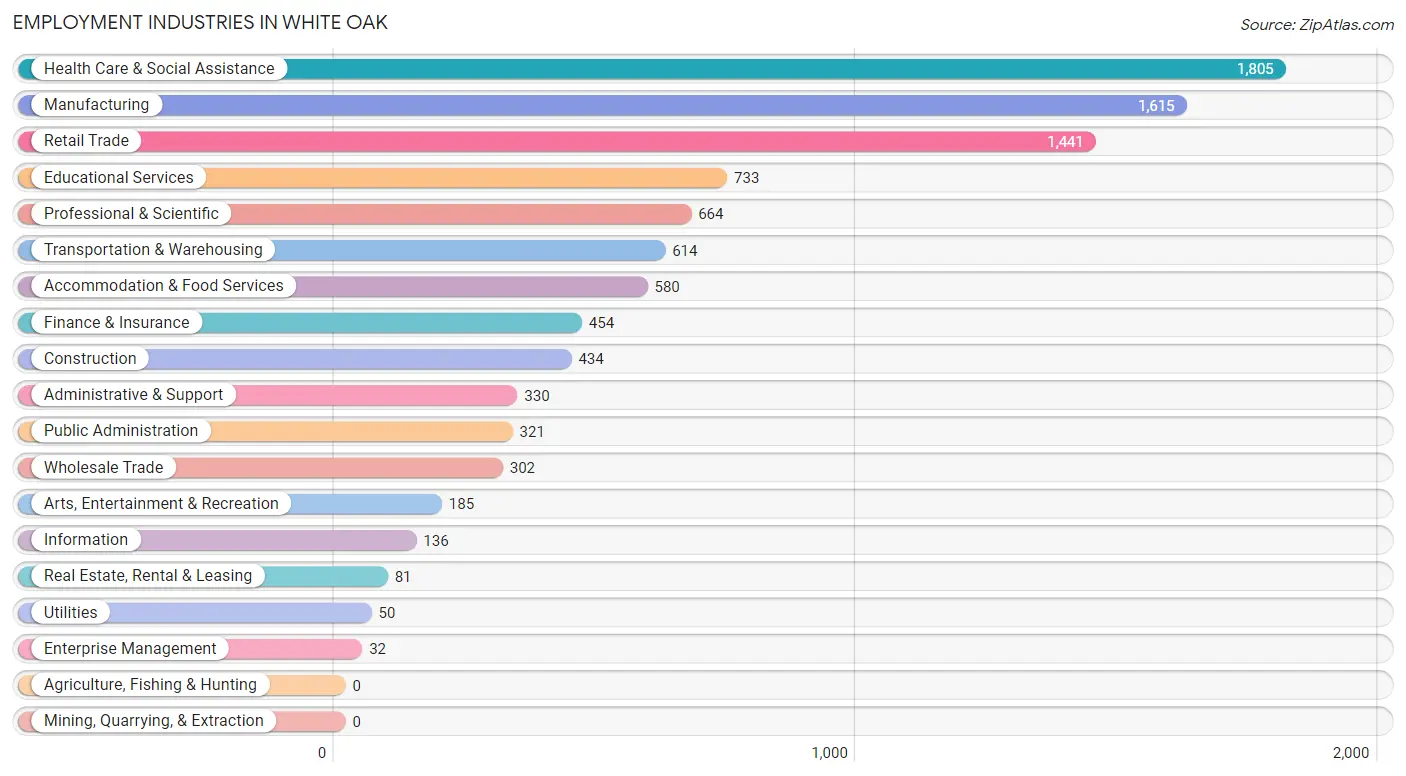
Employment Industries in White Oak
The major employment industries in White Oak include Health Care & Social Assistance (1,805 | 17.7%), Manufacturing (1,615 | 15.8%), Retail Trade (1,441 | 14.1%), Educational Services (733 | 7.2%), and Professional & Scientific (664 | 6.5%).
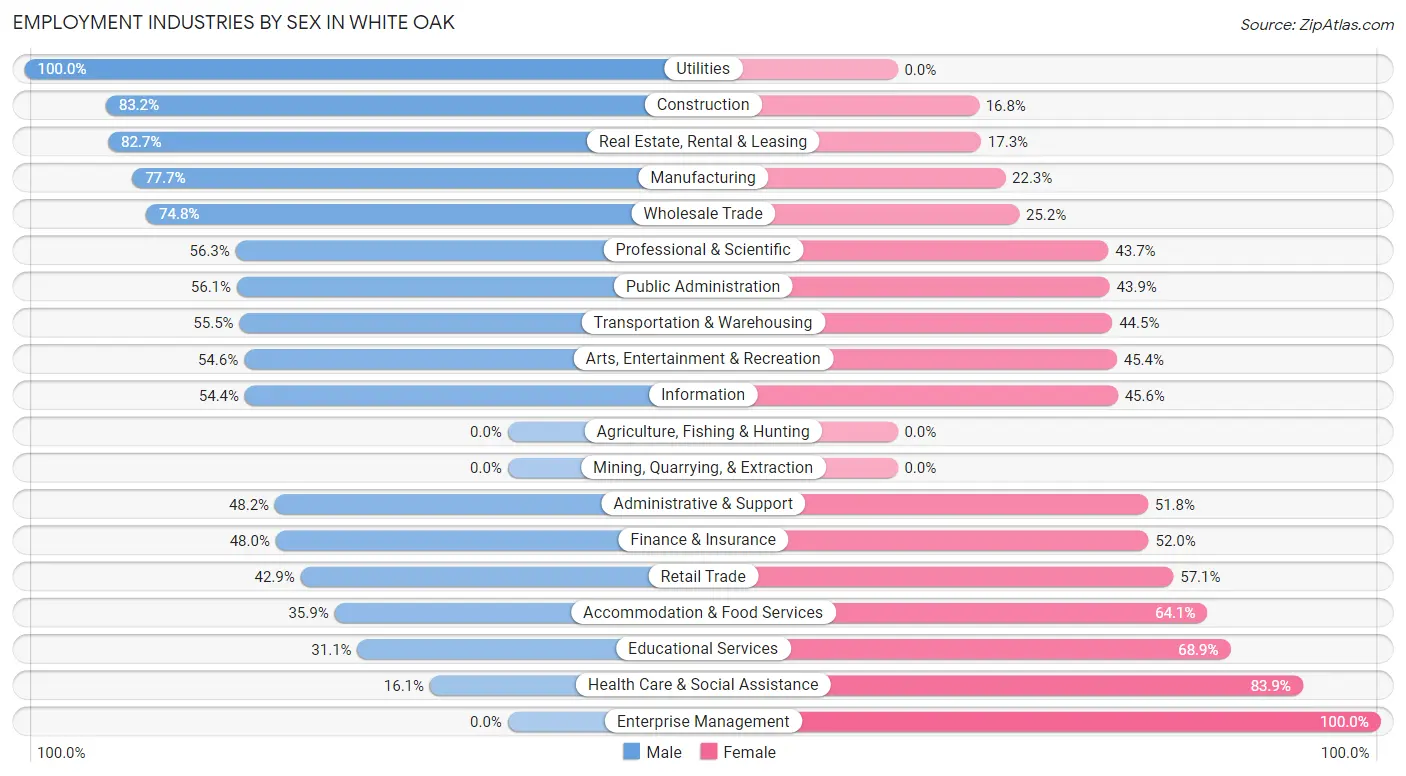
Employment Industries by Sex in White Oak
The White Oak industries that see more men than women are Utilities (100.0%), Construction (83.2%), and Real Estate, Rental & Leasing (82.7%), whereas the industries that tend to have a higher number of women are Enterprise Management (100.0%), Health Care & Social Assistance (83.9%), and Educational Services (68.9%).
| Industry | Male | Female |
| Agriculture, Fishing & Hunting | 0 (0.0%) | 0 (0.0%) |
| Mining, Quarrying, & Extraction | 0 (0.0%) | 0 (0.0%) |
| Construction | 361 (83.2%) | 73 (16.8%) |
| Manufacturing | 1,255 (77.7%) | 360 (22.3%) |
| Wholesale Trade | 226 (74.8%) | 76 (25.2%) |
| Retail Trade | 618 (42.9%) | 823 (57.1%) |
| Transportation & Warehousing | 341 (55.5%) | 273 (44.5%) |
| Utilities | 50 (100.0%) | 0 (0.0%) |
| Information | 74 (54.4%) | 62 (45.6%) |
| Finance & Insurance | 218 (48.0%) | 236 (52.0%) |
| Real Estate, Rental & Leasing | 67 (82.7%) | 14 (17.3%) |
| Professional & Scientific | 374 (56.3%) | 290 (43.7%) |
| Enterprise Management | 0 (0.0%) | 32 (100.0%) |
| Administrative & Support | 159 (48.2%) | 171 (51.8%) |
| Educational Services | 228 (31.1%) | 505 (68.9%) |
| Health Care & Social Assistance | 291 (16.1%) | 1,514 (83.9%) |
| Arts, Entertainment & Recreation | 101 (54.6%) | 84 (45.4%) |
| Accommodation & Food Services | 208 (35.9%) | 372 (64.1%) |
| Public Administration | 180 (56.1%) | 141 (43.9%) |
| Total | 4,999 (49.0%) | 5,211 (51.0%) |
Education in White Oak
School Enrollment in White Oak
The most common levels of schooling among the 4,355 students in White Oak are middle school (1,264 | 29.0%), elementary school (1,120 | 25.7%), and high school (780 | 17.9%).
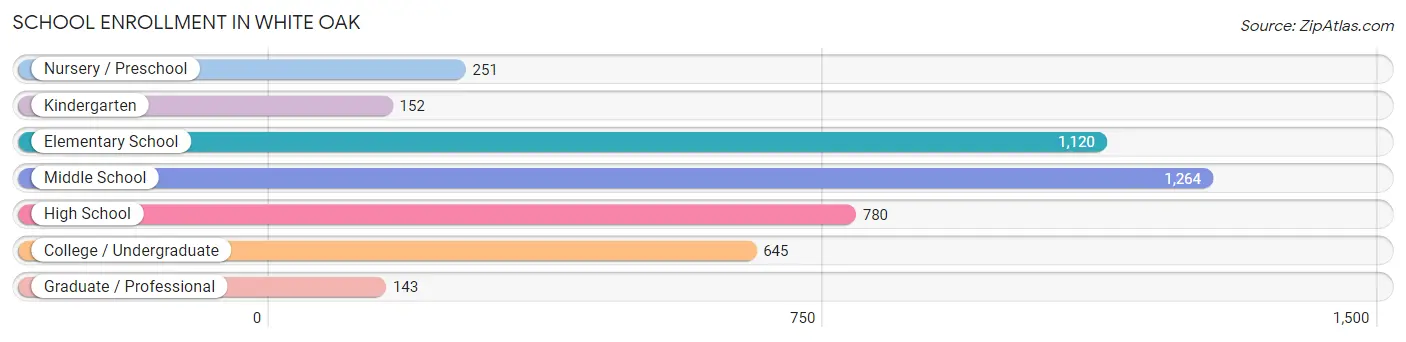
| School Level | # Students | % Students |
| Nursery / Preschool | 251 | 5.8% |
| Kindergarten | 152 | 3.5% |
| Elementary School | 1,120 | 25.7% |
| Middle School | 1,264 | 29.0% |
| High School | 780 | 17.9% |
| College / Undergraduate | 645 | 14.8% |
| Graduate / Professional | 143 | 3.3% |
| Total | 4,355 | 100.0% |
School Enrollment by Age by Funding Source in White Oak
Out of a total of 4,355 students who are enrolled in schools in White Oak, 1,054 (24.2%) attend a private institution, while the remaining 3,301 (75.8%) are enrolled in public schools. The age group of 18 to 19 year olds has the highest likelihood of being enrolled in private schools, with 115 (38.5% in the age bracket) enrolled. Conversely, the age group of 10 to 14 year olds has the lowest likelihood of being enrolled in a private school, with 1,197 (81.5% in the age bracket) attending a public institution.
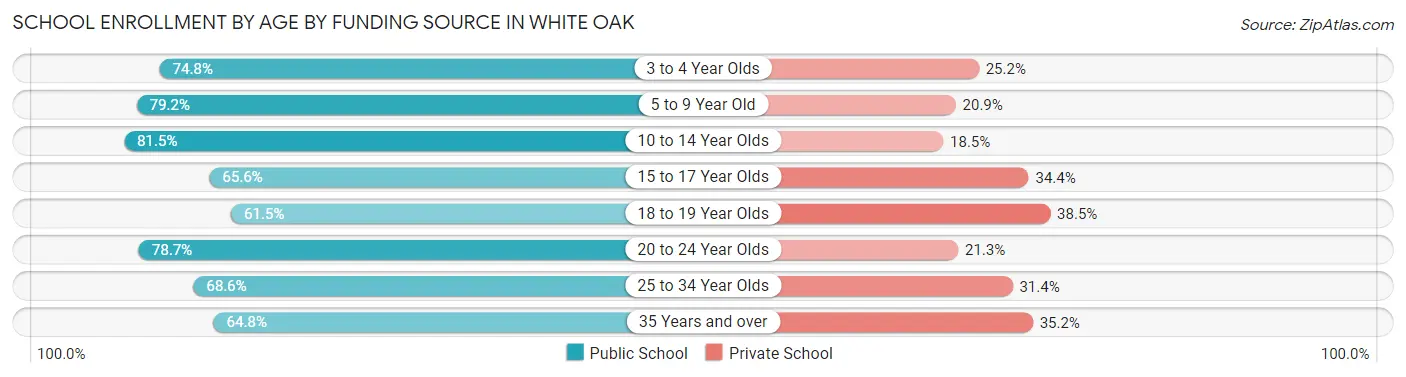
| Age Bracket | Public School | Private School |
| 3 to 4 Year Olds | 116 (74.8%) | 39 (25.2%) |
| 5 to 9 Year Old | 949 (79.1%) | 250 (20.8%) |
| 10 to 14 Year Olds | 1,197 (81.5%) | 272 (18.5%) |
| 15 to 17 Year Olds | 320 (65.6%) | 168 (34.4%) |
| 18 to 19 Year Olds | 184 (61.5%) | 115 (38.5%) |
| 20 to 24 Year Olds | 266 (78.7%) | 72 (21.3%) |
| 25 to 34 Year Olds | 133 (68.6%) | 61 (31.4%) |
| 35 Years and over | 138 (64.8%) | 75 (35.2%) |
| Total | 3,301 (75.8%) | 1,054 (24.2%) |
Educational Attainment by Field of Study in White Oak
Business (1,049 | 23.3%), education (674 | 14.9%), science & technology (530 | 11.7%), arts & humanities (443 | 9.8%), and physical & health sciences (330 | 7.3%) are the most common fields of study among 4,512 individuals in White Oak who have obtained a bachelor's degree or higher.
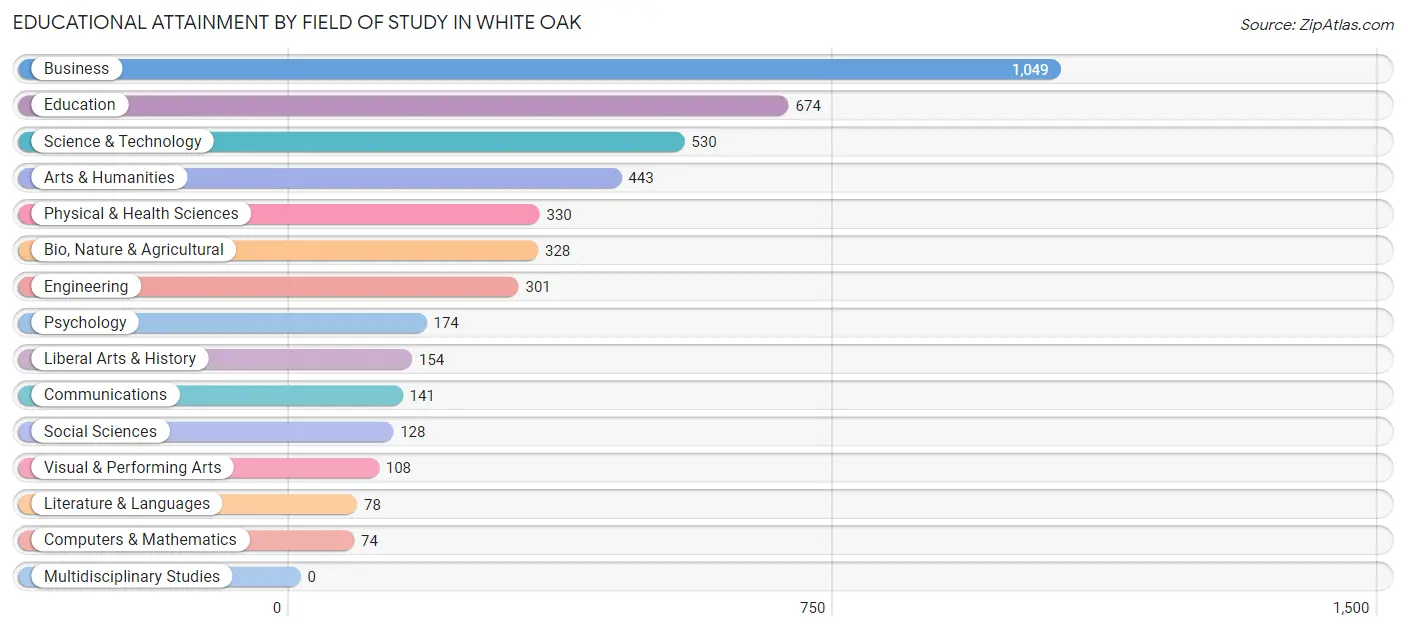
| Field of Study | # Graduates | % Graduates |
| Computers & Mathematics | 74 | 1.6% |
| Bio, Nature & Agricultural | 328 | 7.3% |
| Physical & Health Sciences | 330 | 7.3% |
| Psychology | 174 | 3.9% |
| Social Sciences | 128 | 2.8% |
| Engineering | 301 | 6.7% |
| Multidisciplinary Studies | 0 | 0.0% |
| Science & Technology | 530 | 11.7% |
| Business | 1,049 | 23.3% |
| Education | 674 | 14.9% |
| Literature & Languages | 78 | 1.7% |
| Liberal Arts & History | 154 | 3.4% |
| Visual & Performing Arts | 108 | 2.4% |
| Communications | 141 | 3.1% |
| Arts & Humanities | 443 | 9.8% |
| Total | 4,512 | 100.0% |
Transportation & Commute in White Oak
Vehicle Availability by Sex in White Oak
The most prevalent vehicle ownership categories in White Oak are males with 2 vehicles (1,946, accounting for 39.2%) and females with 2 vehicles (1,922, making up 38.6%).
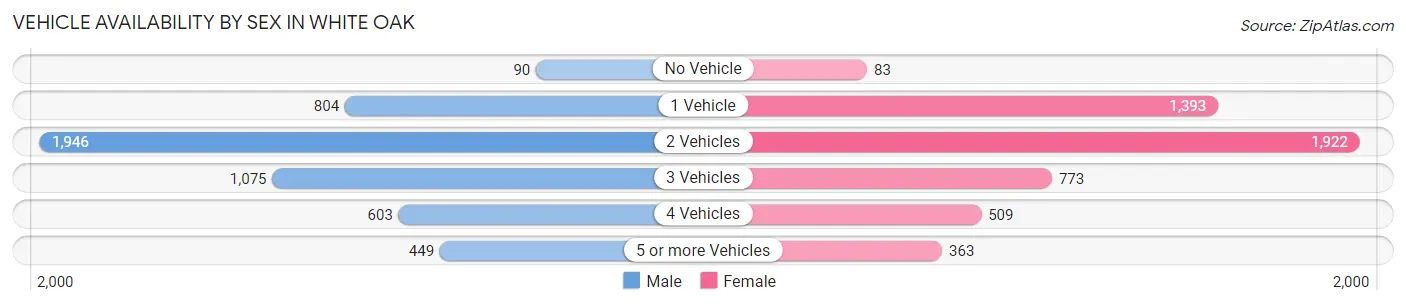
| Vehicles Available | Male | Female |
| No Vehicle | 90 (1.8%) | 83 (1.7%) |
| 1 Vehicle | 804 (16.2%) | 1,393 (27.6%) |
| 2 Vehicles | 1,946 (39.2%) | 1,922 (38.1%) |
| 3 Vehicles | 1,075 (21.6%) | 773 (15.3%) |
| 4 Vehicles | 603 (12.1%) | 509 (10.1%) |
| 5 or more Vehicles | 449 (9.0%) | 363 (7.2%) |
| Total | 4,967 (100.0%) | 5,043 (100.0%) |
Commute Time in White Oak
The most frequently occuring commute durations in White Oak are 30 to 34 minutes (1,631 commuters, 18.6%), 20 to 24 minutes (1,594 commuters, 18.1%), and 15 to 19 minutes (1,530 commuters, 17.4%).
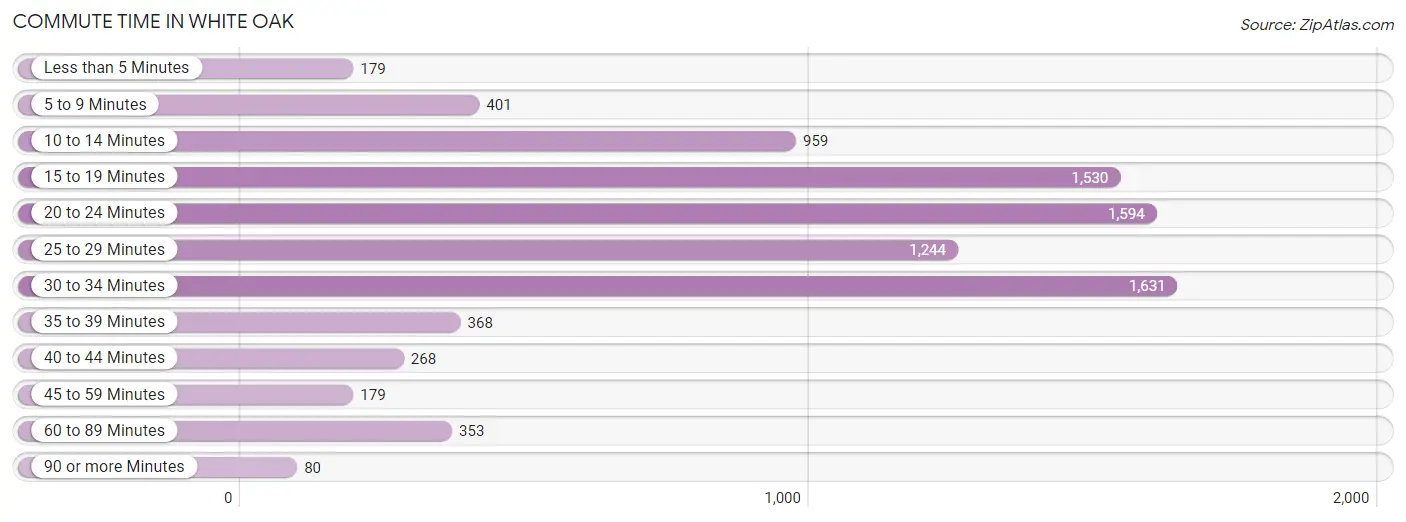
| Commute Time | # Commuters | % Commuters |
| Less than 5 Minutes | 179 | 2.0% |
| 5 to 9 Minutes | 401 | 4.6% |
| 10 to 14 Minutes | 959 | 10.9% |
| 15 to 19 Minutes | 1,530 | 17.4% |
| 20 to 24 Minutes | 1,594 | 18.1% |
| 25 to 29 Minutes | 1,244 | 14.2% |
| 30 to 34 Minutes | 1,631 | 18.6% |
| 35 to 39 Minutes | 368 | 4.2% |
| 40 to 44 Minutes | 268 | 3.0% |
| 45 to 59 Minutes | 179 | 2.0% |
| 60 to 89 Minutes | 353 | 4.0% |
| 90 or more Minutes | 80 | 0.9% |
Commute Time by Sex in White Oak
The most common commute times in White Oak are 20 to 24 minutes (894 commuters, 20.2%) for males and 15 to 19 minutes (820 commuters, 18.8%) for females.
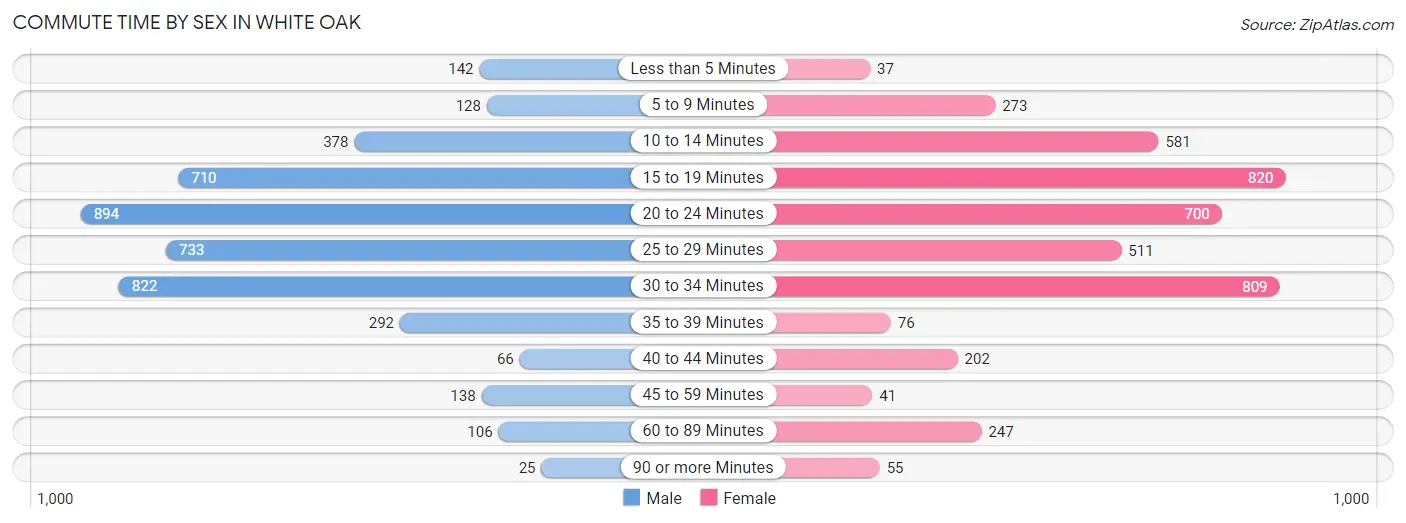
| Commute Time | Male | Female |
| Less than 5 Minutes | 142 (3.2%) | 37 (0.9%) |
| 5 to 9 Minutes | 128 (2.9%) | 273 (6.3%) |
| 10 to 14 Minutes | 378 (8.5%) | 581 (13.4%) |
| 15 to 19 Minutes | 710 (16.0%) | 820 (18.8%) |
| 20 to 24 Minutes | 894 (20.2%) | 700 (16.1%) |
| 25 to 29 Minutes | 733 (16.5%) | 511 (11.7%) |
| 30 to 34 Minutes | 822 (18.5%) | 809 (18.6%) |
| 35 to 39 Minutes | 292 (6.6%) | 76 (1.8%) |
| 40 to 44 Minutes | 66 (1.5%) | 202 (4.6%) |
| 45 to 59 Minutes | 138 (3.1%) | 41 (0.9%) |
| 60 to 89 Minutes | 106 (2.4%) | 247 (5.7%) |
| 90 or more Minutes | 25 (0.6%) | 55 (1.3%) |
Time of Departure to Work by Sex in White Oak
The most frequent times of departure to work in White Oak are 7:00 AM to 7:29 AM (751, 16.9%) for males and 7:00 AM to 7:29 AM (680, 15.6%) for females.
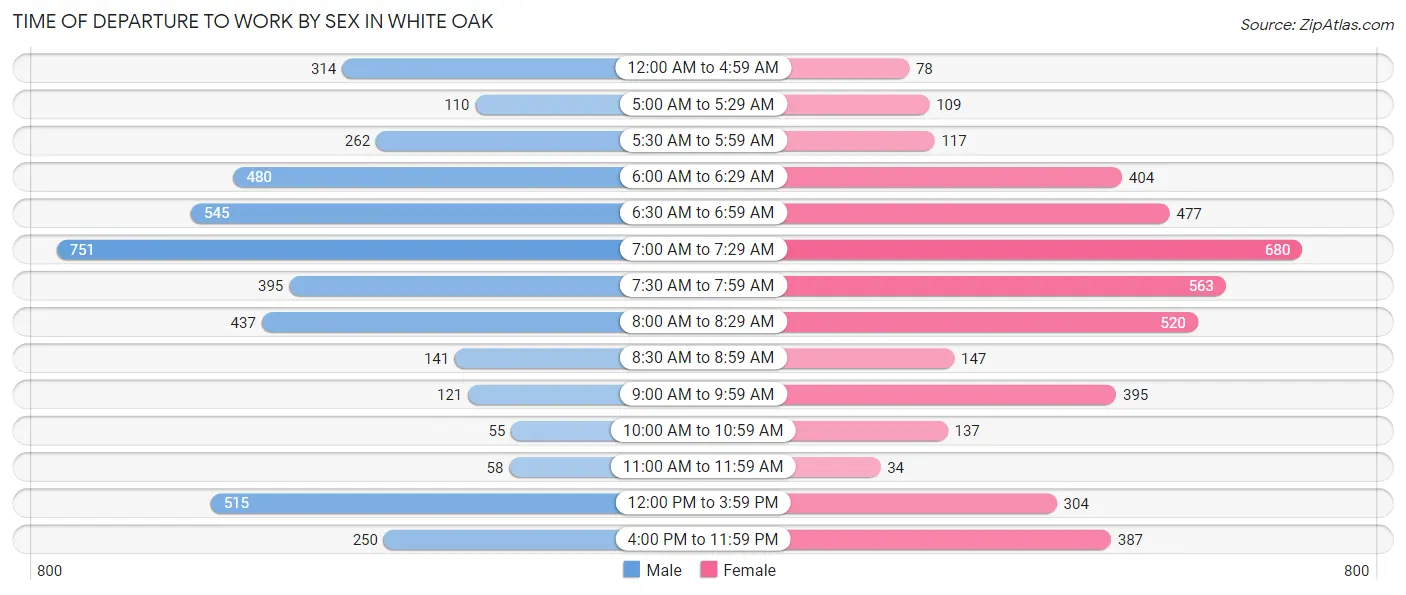
| Time of Departure | Male | Female |
| 12:00 AM to 4:59 AM | 314 (7.1%) | 78 (1.8%) |
| 5:00 AM to 5:29 AM | 110 (2.5%) | 109 (2.5%) |
| 5:30 AM to 5:59 AM | 262 (5.9%) | 117 (2.7%) |
| 6:00 AM to 6:29 AM | 480 (10.8%) | 404 (9.3%) |
| 6:30 AM to 6:59 AM | 545 (12.3%) | 477 (11.0%) |
| 7:00 AM to 7:29 AM | 751 (16.9%) | 680 (15.6%) |
| 7:30 AM to 7:59 AM | 395 (8.9%) | 563 (12.9%) |
| 8:00 AM to 8:29 AM | 437 (9.9%) | 520 (11.9%) |
| 8:30 AM to 8:59 AM | 141 (3.2%) | 147 (3.4%) |
| 9:00 AM to 9:59 AM | 121 (2.7%) | 395 (9.1%) |
| 10:00 AM to 10:59 AM | 55 (1.2%) | 137 (3.2%) |
| 11:00 AM to 11:59 AM | 58 (1.3%) | 34 (0.8%) |
| 12:00 PM to 3:59 PM | 515 (11.6%) | 304 (7.0%) |
| 4:00 PM to 11:59 PM | 250 (5.6%) | 387 (8.9%) |
| Total | 4,434 (100.0%) | 4,352 (100.0%) |
Housing Occupancy in White Oak
Occupancy by Ownership in White Oak
Of the total 7,941 dwellings in White Oak, owner-occupied units account for 5,679 (71.5%), while renter-occupied units make up 2,262 (28.5%).
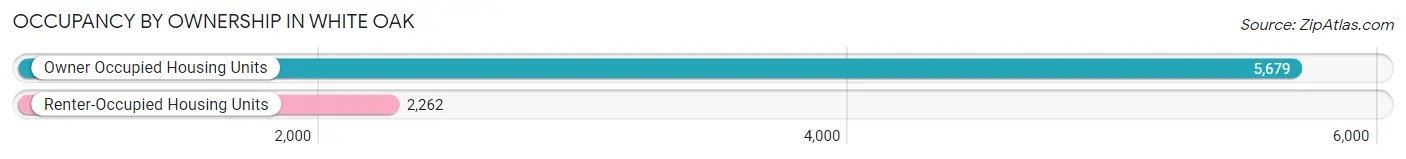
| Occupancy | # Housing Units | % Housing Units |
| Owner Occupied Housing Units | 5,679 | 71.5% |
| Renter-Occupied Housing Units | 2,262 | 28.5% |
| Total Occupied Housing Units | 7,941 | 100.0% |
Occupancy by Household Size in White Oak
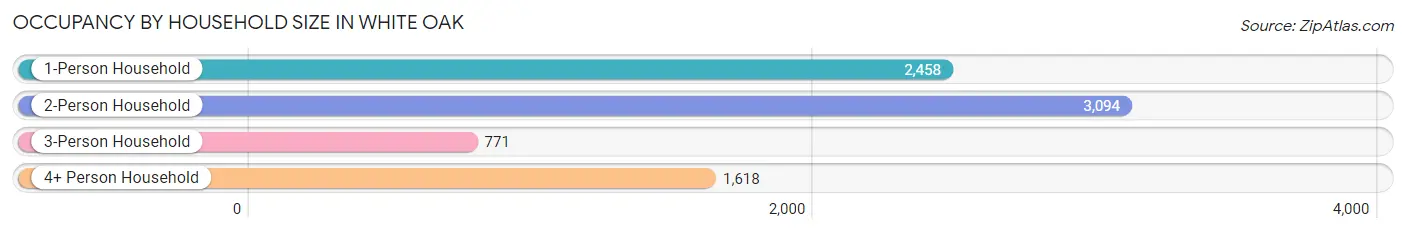
| Household Size | # Housing Units | % Housing Units |
| 1-Person Household | 2,458 | 30.9% |
| 2-Person Household | 3,094 | 39.0% |
| 3-Person Household | 771 | 9.7% |
| 4+ Person Household | 1,618 | 20.4% |
| Total Housing Units | 7,941 | 100.0% |
Occupancy by Ownership by Household Size in White Oak
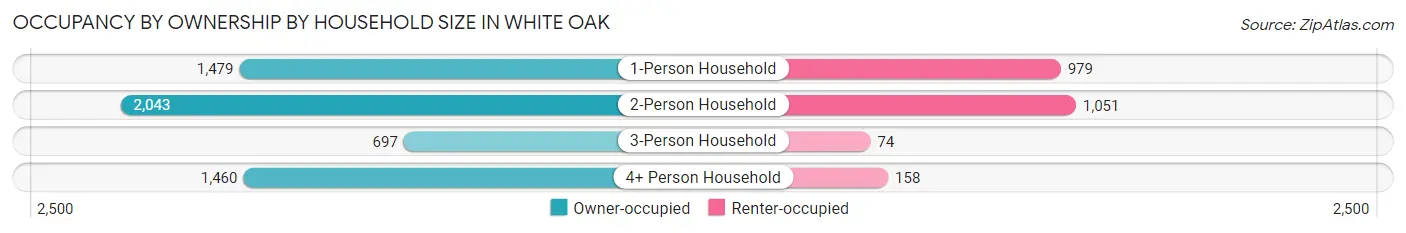
| Household Size | Owner-occupied | Renter-occupied |
| 1-Person Household | 1,479 (60.2%) | 979 (39.8%) |
| 2-Person Household | 2,043 (66.0%) | 1,051 (34.0%) |
| 3-Person Household | 697 (90.4%) | 74 (9.6%) |
| 4+ Person Household | 1,460 (90.2%) | 158 (9.8%) |
| Total Housing Units | 5,679 (71.5%) | 2,262 (28.5%) |
Occupancy by Educational Attainment in White Oak
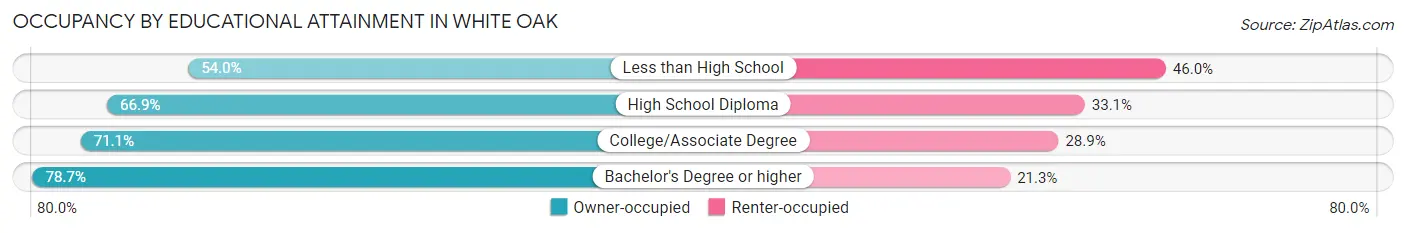
| Household Size | Owner-occupied | Renter-occupied |
| Less than High School | 234 (54.0%) | 199 (46.0%) |
| High School Diploma | 1,560 (66.9%) | 772 (33.1%) |
| College/Associate Degree | 1,767 (71.1%) | 719 (28.9%) |
| Bachelor's Degree or higher | 2,118 (78.7%) | 572 (21.3%) |
Occupancy by Age of Householder in White Oak
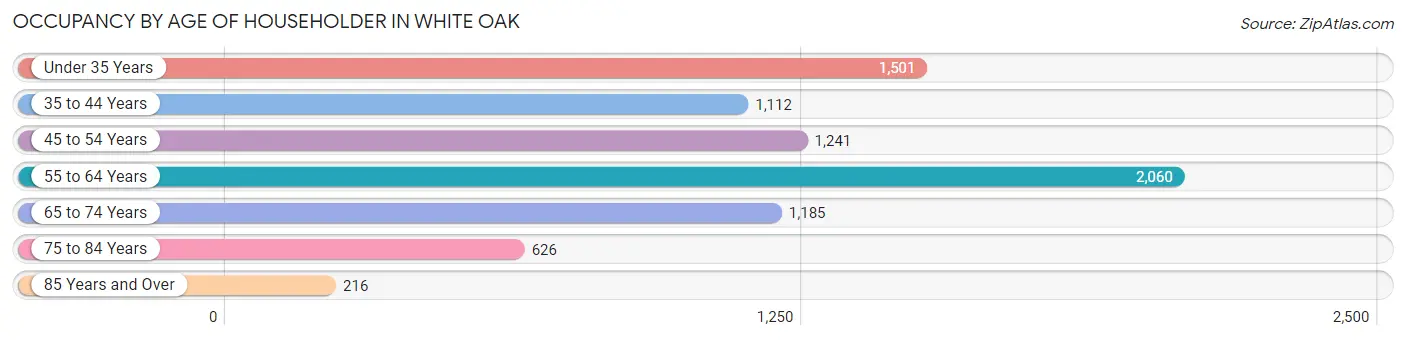
| Age Bracket | # Households | % Households |
| Under 35 Years | 1,501 | 18.9% |
| 35 to 44 Years | 1,112 | 14.0% |
| 45 to 54 Years | 1,241 | 15.6% |
| 55 to 64 Years | 2,060 | 25.9% |
| 65 to 74 Years | 1,185 | 14.9% |
| 75 to 84 Years | 626 | 7.9% |
| 85 Years and Over | 216 | 2.7% |
| Total | 7,941 | 100.0% |
Housing Finances in White Oak
Median Income by Occupancy in White Oak
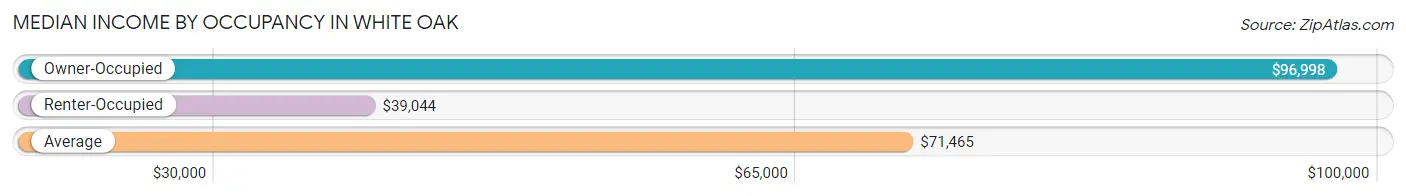
| Occupancy Type | # Households | Median Income |
| Owner-Occupied | 5,679 (71.5%) | $96,998 |
| Renter-Occupied | 2,262 (28.5%) | $39,044 |
| Average | 7,941 (100.0%) | $71,465 |
Occupancy by Householder Income Bracket in White Oak
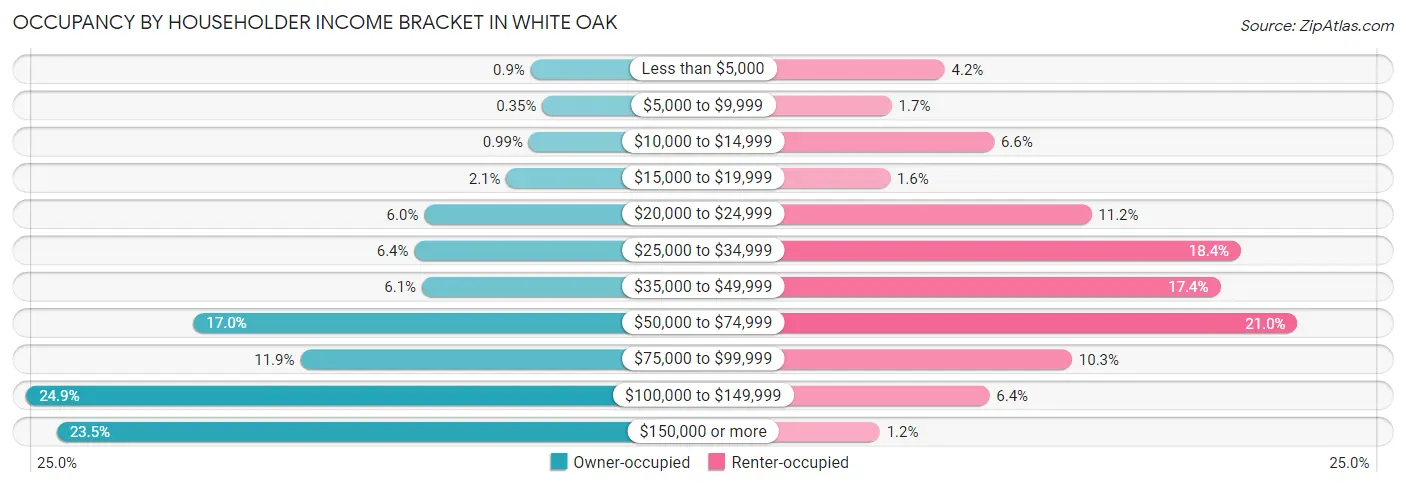
| Income Bracket | Owner-occupied | Renter-occupied |
| Less than $5,000 | 51 (0.9%) | 96 (4.2%) |
| $5,000 to $9,999 | 20 (0.4%) | 39 (1.7%) |
| $10,000 to $14,999 | 56 (1.0%) | 149 (6.6%) |
| $15,000 to $19,999 | 117 (2.1%) | 37 (1.6%) |
| $20,000 to $24,999 | 339 (6.0%) | 254 (11.2%) |
| $25,000 to $34,999 | 366 (6.4%) | 415 (18.3%) |
| $35,000 to $49,999 | 345 (6.1%) | 393 (17.4%) |
| $50,000 to $74,999 | 963 (17.0%) | 476 (21.0%) |
| $75,000 to $99,999 | 674 (11.9%) | 233 (10.3%) |
| $100,000 to $149,999 | 1,415 (24.9%) | 144 (6.4%) |
| $150,000 or more | 1,333 (23.5%) | 26 (1.1%) |
| Total | 5,679 (100.0%) | 2,262 (100.0%) |
Monthly Housing Cost Tiers in White Oak
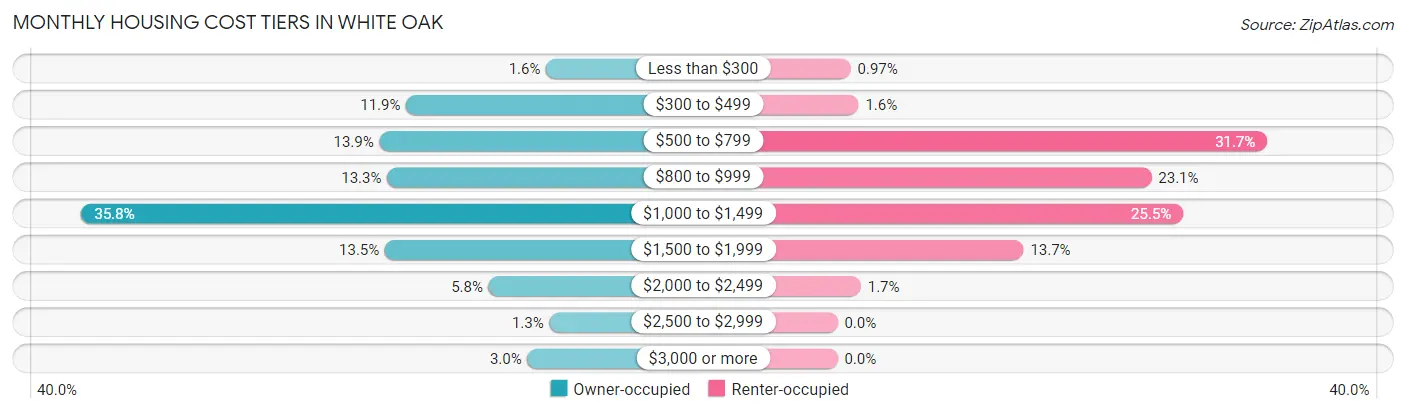
| Monthly Cost | Owner-occupied | Renter-occupied |
| Less than $300 | 90 (1.6%) | 22 (1.0%) |
| $300 to $499 | 675 (11.9%) | 35 (1.5%) |
| $500 to $799 | 787 (13.9%) | 716 (31.7%) |
| $800 to $999 | 755 (13.3%) | 523 (23.1%) |
| $1,000 to $1,499 | 2,034 (35.8%) | 576 (25.5%) |
| $1,500 to $1,999 | 764 (13.5%) | 310 (13.7%) |
| $2,000 to $2,499 | 330 (5.8%) | 39 (1.7%) |
| $2,500 to $2,999 | 76 (1.3%) | 0 (0.0%) |
| $3,000 or more | 168 (3.0%) | 0 (0.0%) |
| Total | 5,679 (100.0%) | 2,262 (100.0%) |
Physical Housing Characteristics in White Oak
Housing Structures in White Oak
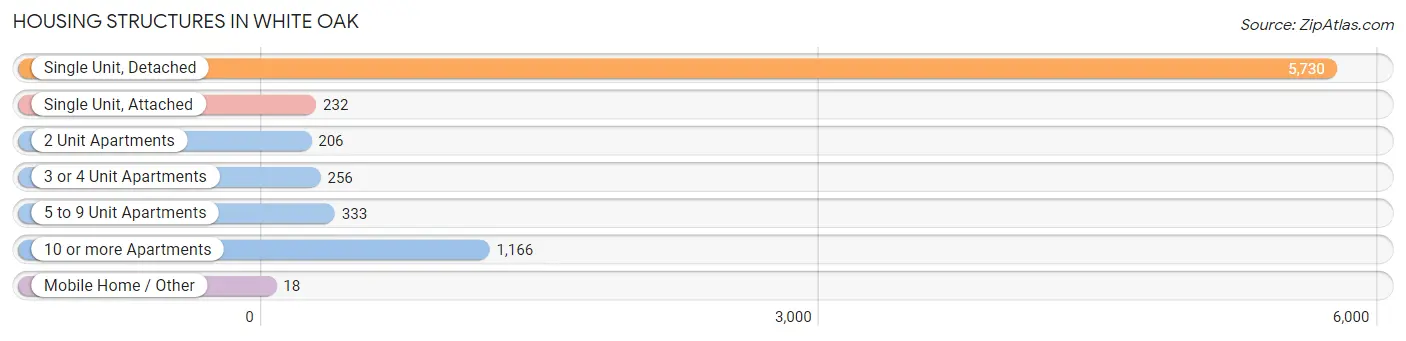
| Structure Type | # Housing Units | % Housing Units |
| Single Unit, Detached | 5,730 | 72.2% |
| Single Unit, Attached | 232 | 2.9% |
| 2 Unit Apartments | 206 | 2.6% |
| 3 or 4 Unit Apartments | 256 | 3.2% |
| 5 to 9 Unit Apartments | 333 | 4.2% |
| 10 or more Apartments | 1,166 | 14.7% |
| Mobile Home / Other | 18 | 0.2% |
| Total | 7,941 | 100.0% |
Housing Structures by Occupancy in White Oak
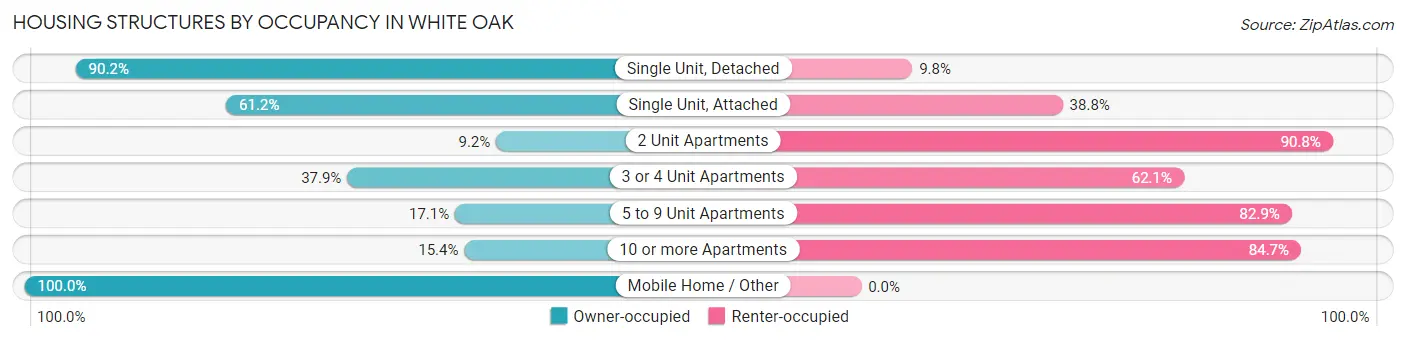
| Structure Type | Owner-occupied | Renter-occupied |
| Single Unit, Detached | 5,167 (90.2%) | 563 (9.8%) |
| Single Unit, Attached | 142 (61.2%) | 90 (38.8%) |
| 2 Unit Apartments | 19 (9.2%) | 187 (90.8%) |
| 3 or 4 Unit Apartments | 97 (37.9%) | 159 (62.1%) |
| 5 to 9 Unit Apartments | 57 (17.1%) | 276 (82.9%) |
| 10 or more Apartments | 179 (15.3%) | 987 (84.7%) |
| Mobile Home / Other | 18 (100.0%) | 0 (0.0%) |
| Total | 5,679 (71.5%) | 2,262 (28.5%) |
Housing Structures by Number of Rooms in White Oak
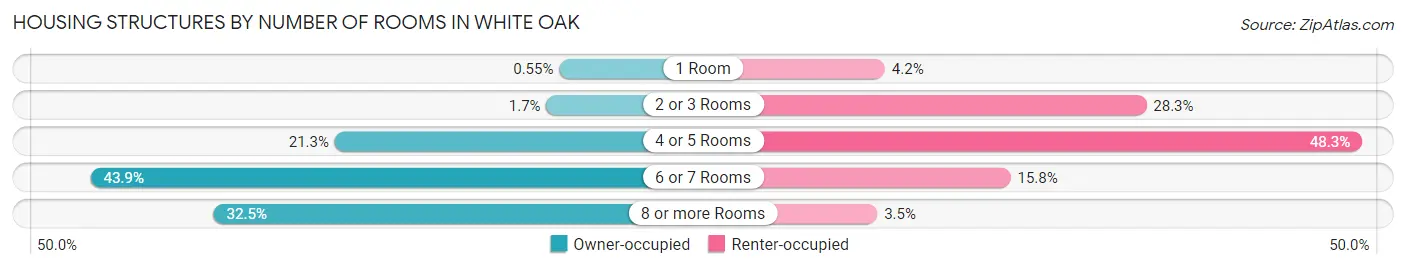
| Number of Rooms | Owner-occupied | Renter-occupied |
| 1 Room | 31 (0.5%) | 94 (4.2%) |
| 2 or 3 Rooms | 99 (1.7%) | 641 (28.3%) |
| 4 or 5 Rooms | 1,210 (21.3%) | 1,092 (48.3%) |
| 6 or 7 Rooms | 2,493 (43.9%) | 357 (15.8%) |
| 8 or more Rooms | 1,846 (32.5%) | 78 (3.5%) |
| Total | 5,679 (100.0%) | 2,262 (100.0%) |
Housing Structure by Heating Type in White Oak
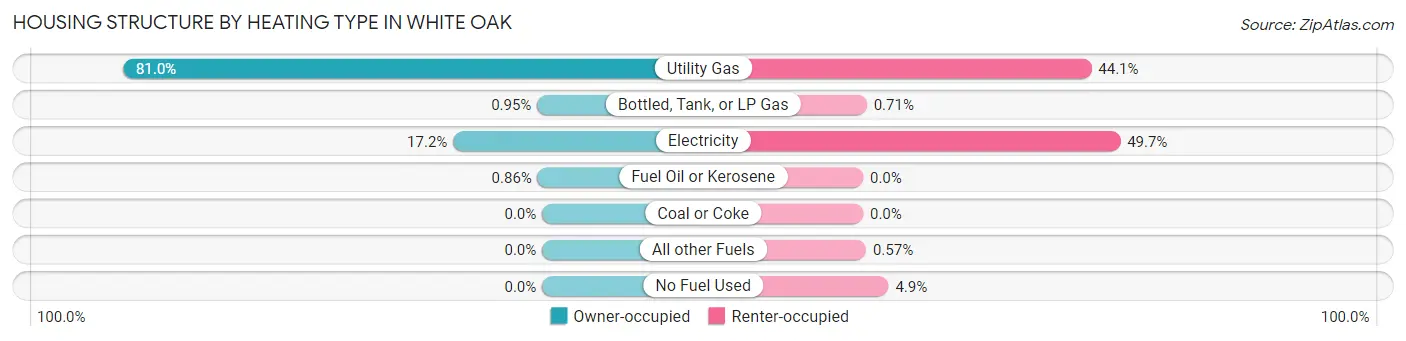
| Heating Type | Owner-occupied | Renter-occupied |
| Utility Gas | 4,600 (81.0%) | 998 (44.1%) |
| Bottled, Tank, or LP Gas | 54 (0.9%) | 16 (0.7%) |
| Electricity | 976 (17.2%) | 1,124 (49.7%) |
| Fuel Oil or Kerosene | 49 (0.9%) | 0 (0.0%) |
| Coal or Coke | 0 (0.0%) | 0 (0.0%) |
| All other Fuels | 0 (0.0%) | 13 (0.6%) |
| No Fuel Used | 0 (0.0%) | 111 (4.9%) |
| Total | 5,679 (100.0%) | 2,262 (100.0%) |
Household Vehicle Usage in White Oak
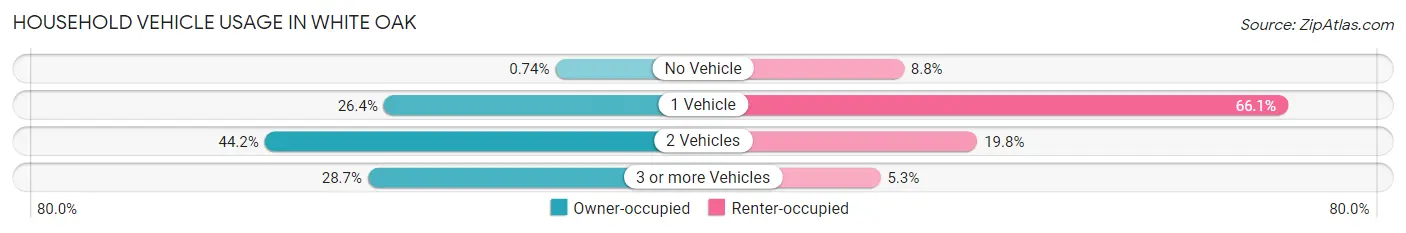
| Vehicles per Household | Owner-occupied | Renter-occupied |
| No Vehicle | 42 (0.7%) | 199 (8.8%) |
| 1 Vehicle | 1,497 (26.4%) | 1,496 (66.1%) |
| 2 Vehicles | 2,508 (44.2%) | 447 (19.8%) |
| 3 or more Vehicles | 1,632 (28.7%) | 120 (5.3%) |
| Total | 5,679 (100.0%) | 2,262 (100.0%) |
Real Estate & Mortgages in White Oak
Real Estate and Mortgage Overview in White Oak
| Characteristic | Without Mortgage | With Mortgage |
| Housing Units | 1,827 | 3,852 |
| Median Property Value | $170,400 | $182,400 |
| Median Household Income | $62,930 | $1,078 |
| Monthly Housing Costs | $559 | $168 |
| Real Estate Taxes | $2,772 | $76 |
Property Value by Mortgage Status in White Oak
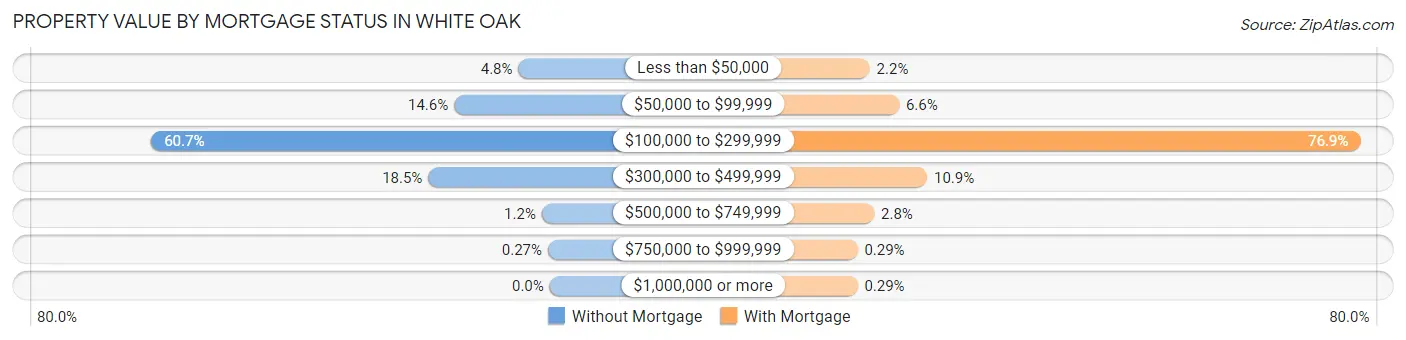
| Property Value | Without Mortgage | With Mortgage |
| Less than $50,000 | 87 (4.8%) | 83 (2.1%) |
| $50,000 to $99,999 | 266 (14.6%) | 255 (6.6%) |
| $100,000 to $299,999 | 1,109 (60.7%) | 2,963 (76.9%) |
| $300,000 to $499,999 | 338 (18.5%) | 420 (10.9%) |
| $500,000 to $749,999 | 22 (1.2%) | 109 (2.8%) |
| $750,000 to $999,999 | 5 (0.3%) | 11 (0.3%) |
| $1,000,000 or more | 0 (0.0%) | 11 (0.3%) |
| Total | 1,827 (100.0%) | 3,852 (100.0%) |
Household Income by Mortgage Status in White Oak

| Household Income | Without Mortgage | With Mortgage |
| Less than $10,000 | 71 (3.9%) | 183 (4.8%) |
| $10,000 to $24,999 | 289 (15.8%) | 0 (0.0%) |
| $25,000 to $34,999 | 249 (13.6%) | 223 (5.8%) |
| $35,000 to $49,999 | 163 (8.9%) | 117 (3.0%) |
| $50,000 to $74,999 | 221 (12.1%) | 182 (4.7%) |
| $75,000 to $99,999 | 209 (11.4%) | 742 (19.3%) |
| $100,000 to $149,999 | 370 (20.3%) | 465 (12.1%) |
| $150,000 or more | 255 (14.0%) | 1,045 (27.1%) |
| Total | 1,827 (100.0%) | 3,852 (100.0%) |
Property Value to Household Income Ratio in White Oak
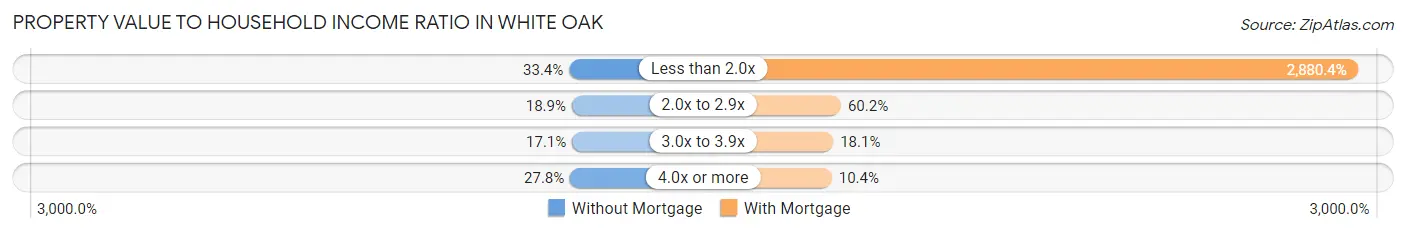
| Value-to-Income Ratio | Without Mortgage | With Mortgage |
| Less than 2.0x | 610 (33.4%) | 110,952 (2,880.4%) |
| 2.0x to 2.9x | 346 (18.9%) | 2,319 (60.2%) |
| 3.0x to 3.9x | 312 (17.1%) | 698 (18.1%) |
| 4.0x or more | 508 (27.8%) | 401 (10.4%) |
| Total | 1,827 (100.0%) | 3,852 (100.0%) |
Real Estate Taxes by Mortgage Status in White Oak
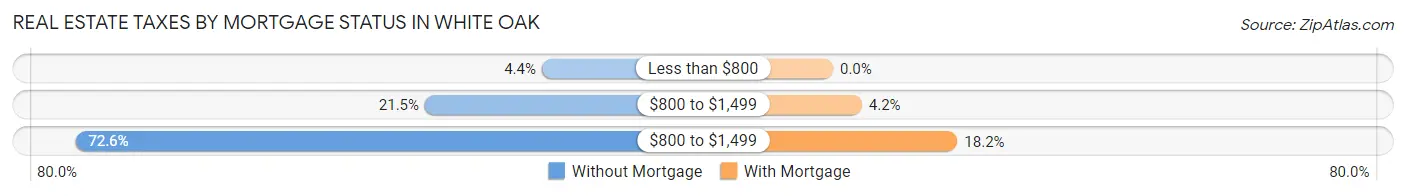
| Property Taxes | Without Mortgage | With Mortgage |
| Less than $800 | 81 (4.4%) | 0 (0.0%) |
| $800 to $1,499 | 393 (21.5%) | 162 (4.2%) |
| $800 to $1,499 | 1,326 (72.6%) | 700 (18.2%) |
| Total | 1,827 (100.0%) | 3,852 (100.0%) |
Health & Disability in White Oak
Health Insurance Coverage by Age in White Oak
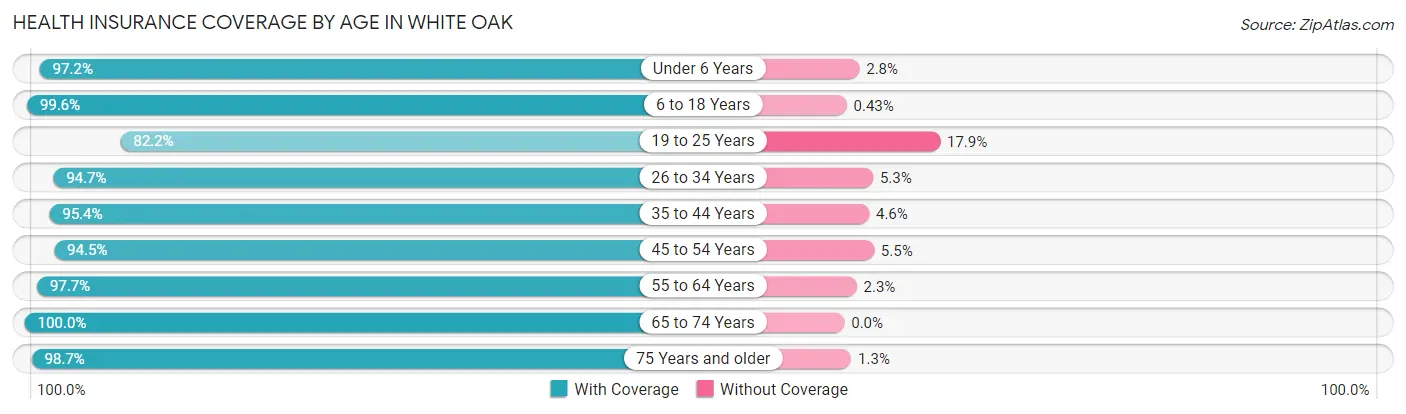
| Age Bracket | With Coverage | Without Coverage |
| Under 6 Years | 1,459 (97.2%) | 42 (2.8%) |
| 6 to 18 Years | 3,264 (99.6%) | 14 (0.4%) |
| 19 to 25 Years | 1,233 (82.2%) | 268 (17.8%) |
| 26 to 34 Years | 2,146 (94.7%) | 121 (5.3%) |
| 35 to 44 Years | 1,925 (95.4%) | 93 (4.6%) |
| 45 to 54 Years | 2,106 (94.5%) | 123 (5.5%) |
| 55 to 64 Years | 3,066 (97.7%) | 72 (2.3%) |
| 65 to 74 Years | 1,908 (100.0%) | 0 (0.0%) |
| 75 Years and older | 1,238 (98.7%) | 16 (1.3%) |
| Total | 18,345 (96.1%) | 749 (3.9%) |
Health Insurance Coverage by Citizenship Status in White Oak
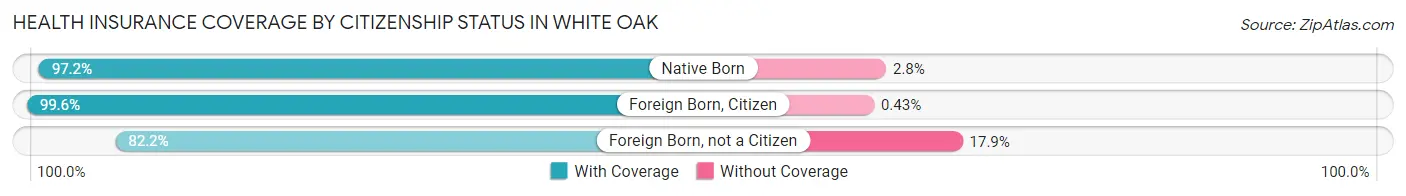
| Citizenship Status | With Coverage | Without Coverage |
| Native Born | 1,459 (97.2%) | 42 (2.8%) |
| Foreign Born, Citizen | 3,264 (99.6%) | 14 (0.4%) |
| Foreign Born, not a Citizen | 1,233 (82.2%) | 268 (17.8%) |
Health Insurance Coverage by Household Income in White Oak
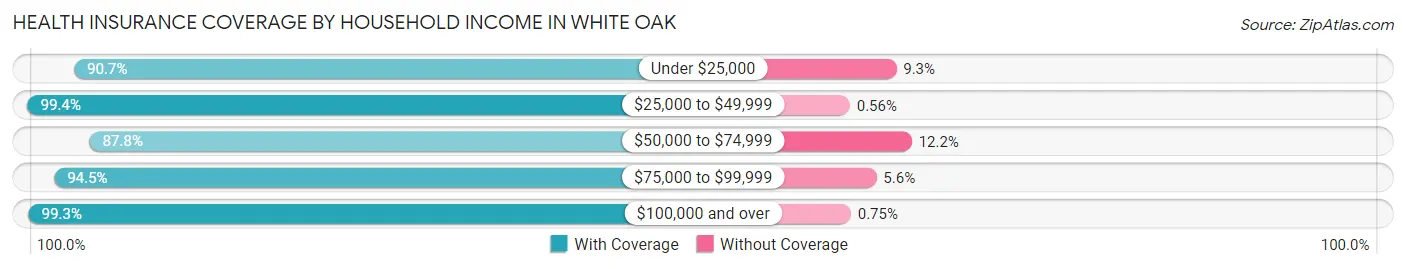
| Household Income | With Coverage | Without Coverage |
| Under $25,000 | 1,743 (90.7%) | 178 (9.3%) |
| $25,000 to $49,999 | 2,657 (99.4%) | 15 (0.6%) |
| $50,000 to $74,999 | 2,621 (87.8%) | 363 (12.2%) |
| $75,000 to $99,999 | 2,026 (94.5%) | 119 (5.6%) |
| $100,000 and over | 9,291 (99.3%) | 70 (0.7%) |
Public vs Private Health Insurance Coverage by Age in White Oak
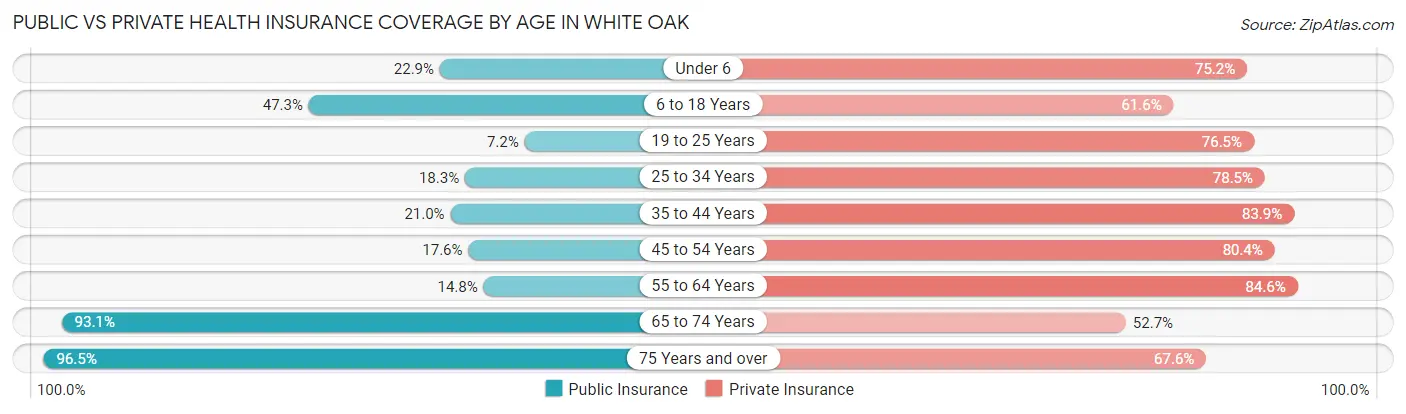
| Age Bracket | Public Insurance | Private Insurance |
| Under 6 | 344 (22.9%) | 1,129 (75.2%) |
| 6 to 18 Years | 1,549 (47.2%) | 2,018 (61.6%) |
| 19 to 25 Years | 108 (7.2%) | 1,148 (76.5%) |
| 25 to 34 Years | 414 (18.3%) | 1,780 (78.5%) |
| 35 to 44 Years | 423 (21.0%) | 1,694 (83.9%) |
| 45 to 54 Years | 393 (17.6%) | 1,791 (80.3%) |
| 55 to 64 Years | 465 (14.8%) | 2,655 (84.6%) |
| 65 to 74 Years | 1,777 (93.1%) | 1,006 (52.7%) |
| 75 Years and over | 1,210 (96.5%) | 848 (67.6%) |
| Total | 6,683 (35.0%) | 14,069 (73.7%) |
Disability Status by Sex by Age in White Oak
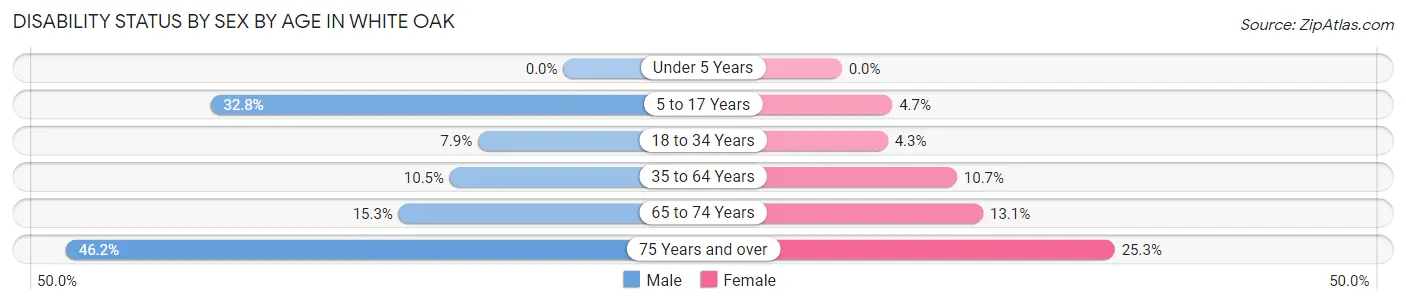
| Age Bracket | Male | Female |
| Under 5 Years | 0 (0.0%) | 0 (0.0%) |
| 5 to 17 Years | 598 (32.8%) | 63 (4.7%) |
| 18 to 34 Years | 166 (7.9%) | 83 (4.3%) |
| 35 to 64 Years | 355 (10.5%) | 429 (10.7%) |
| 65 to 74 Years | 147 (15.3%) | 124 (13.1%) |
| 75 Years and over | 229 (46.2%) | 192 (25.3%) |
Disability Class by Sex by Age in White Oak
Disability Class: Hearing Difficulty
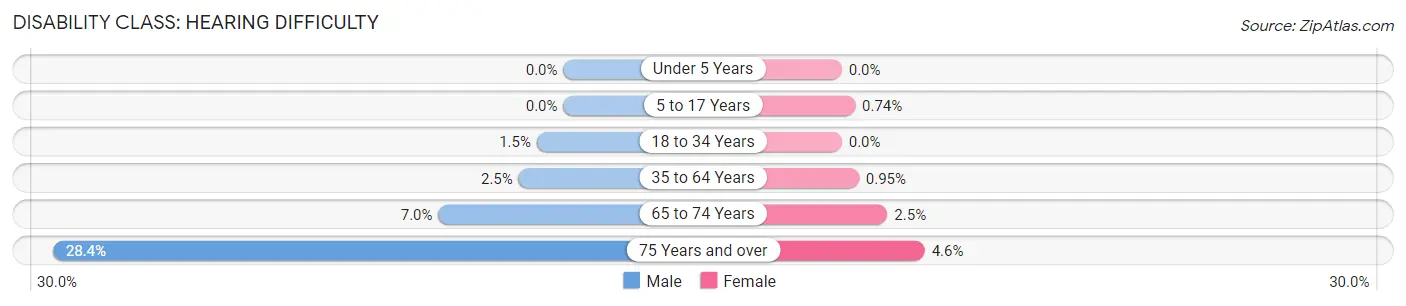
| Age Bracket | Male | Female |
| Under 5 Years | 0 (0.0%) | 0 (0.0%) |
| 5 to 17 Years | 0 (0.0%) | 10 (0.7%) |
| 18 to 34 Years | 31 (1.5%) | 0 (0.0%) |
| 35 to 64 Years | 84 (2.5%) | 38 (0.9%) |
| 65 to 74 Years | 67 (7.0%) | 24 (2.5%) |
| 75 Years and over | 141 (28.4%) | 35 (4.6%) |
Disability Class: Vision Difficulty
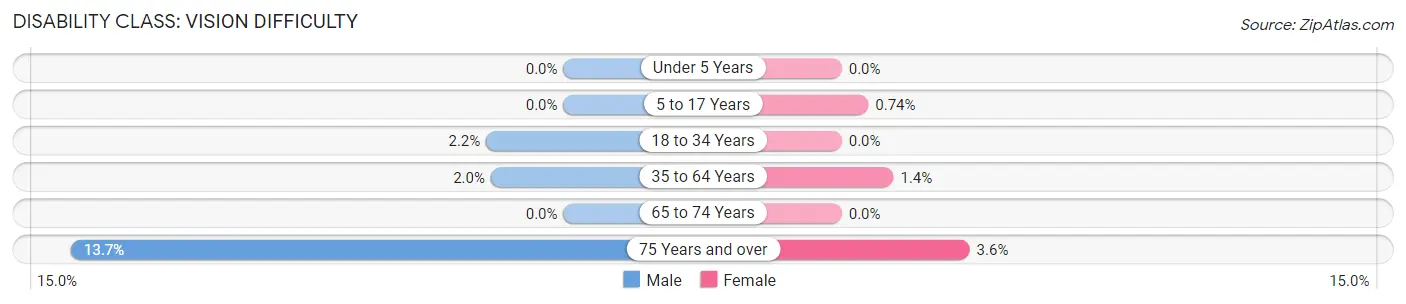
| Age Bracket | Male | Female |
| Under 5 Years | 0 (0.0%) | 0 (0.0%) |
| 5 to 17 Years | 0 (0.0%) | 10 (0.7%) |
| 18 to 34 Years | 45 (2.1%) | 0 (0.0%) |
| 35 to 64 Years | 68 (2.0%) | 58 (1.4%) |
| 65 to 74 Years | 0 (0.0%) | 0 (0.0%) |
| 75 Years and over | 68 (13.7%) | 27 (3.6%) |
Disability Class: Cognitive Difficulty
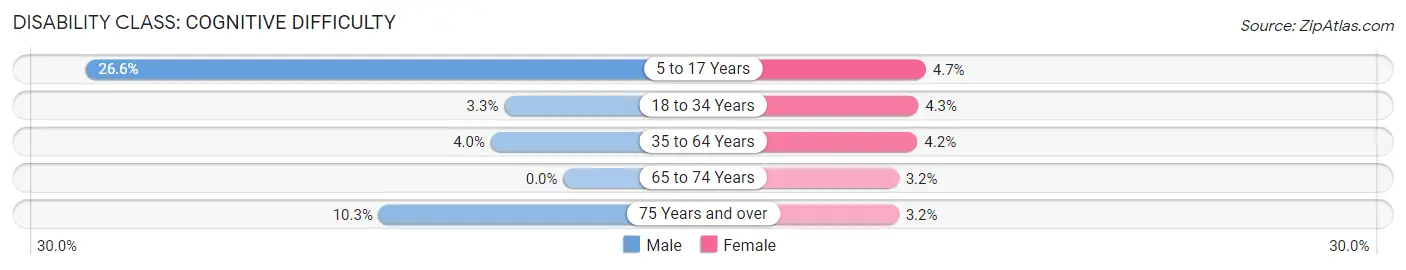
| Age Bracket | Male | Female |
| 5 to 17 Years | 486 (26.6%) | 63 (4.7%) |
| 18 to 34 Years | 69 (3.3%) | 83 (4.3%) |
| 35 to 64 Years | 136 (4.0%) | 169 (4.2%) |
| 65 to 74 Years | 0 (0.0%) | 30 (3.2%) |
| 75 Years and over | 51 (10.3%) | 24 (3.2%) |
Disability Class: Ambulatory Difficulty
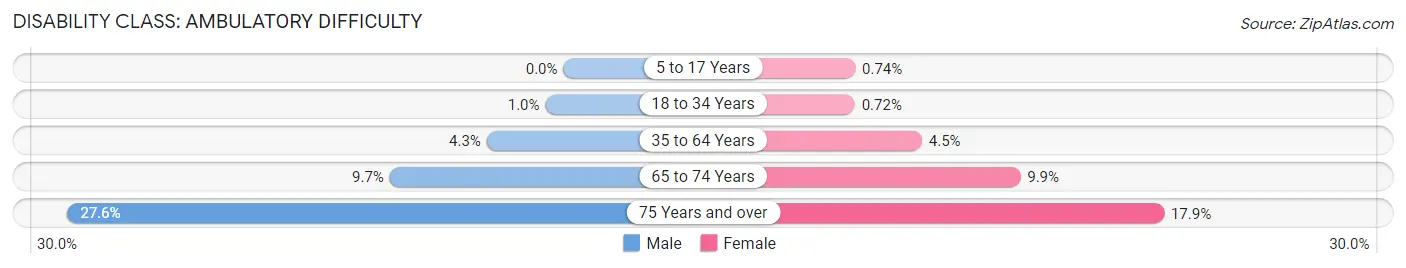
| Age Bracket | Male | Female |
| 5 to 17 Years | 0 (0.0%) | 10 (0.7%) |
| 18 to 34 Years | 21 (1.0%) | 14 (0.7%) |
| 35 to 64 Years | 144 (4.3%) | 179 (4.5%) |
| 65 to 74 Years | 93 (9.7%) | 94 (9.9%) |
| 75 Years and over | 137 (27.6%) | 136 (17.9%) |
Disability Class: Self-Care Difficulty
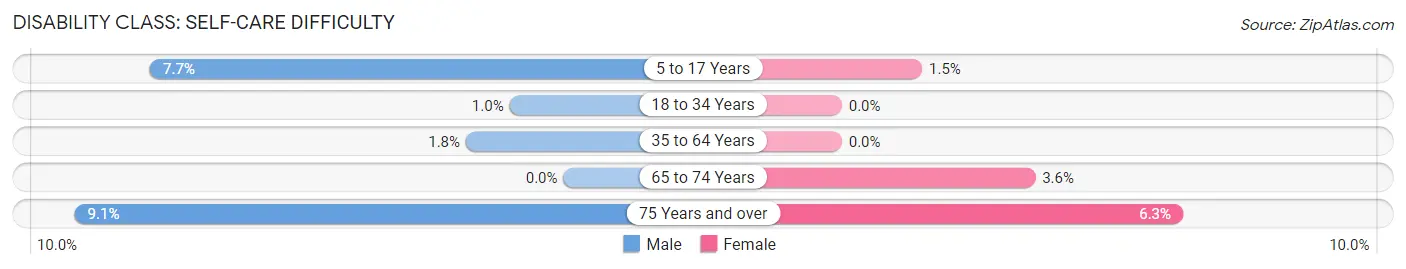
| Age Bracket | Male | Female |
| 5 to 17 Years | 140 (7.7%) | 20 (1.5%) |
| 18 to 34 Years | 21 (1.0%) | 0 (0.0%) |
| 35 to 64 Years | 61 (1.8%) | 0 (0.0%) |
| 65 to 74 Years | 0 (0.0%) | 34 (3.6%) |
| 75 Years and over | 45 (9.1%) | 48 (6.3%) |
Technology Access in White Oak
Computing Device Access in White Oak
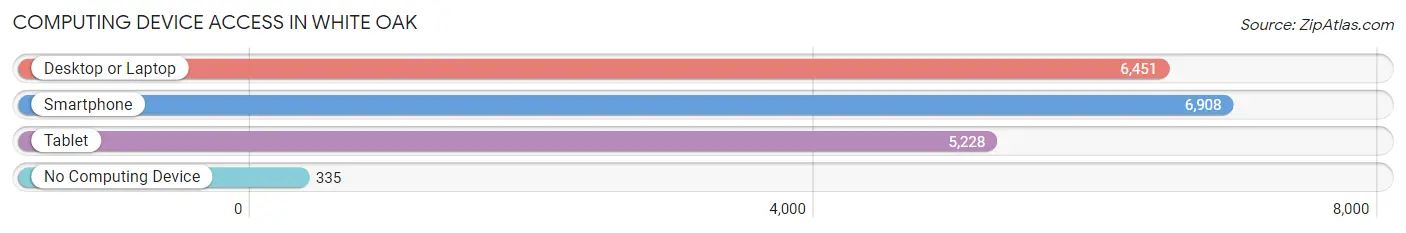
| Device Type | # Households | % Households |
| Desktop or Laptop | 6,451 | 81.2% |
| Smartphone | 6,908 | 87.0% |
| Tablet | 5,228 | 65.8% |
| No Computing Device | 335 | 4.2% |
| Total | 7,941 | 100.0% |
Internet Access in White Oak
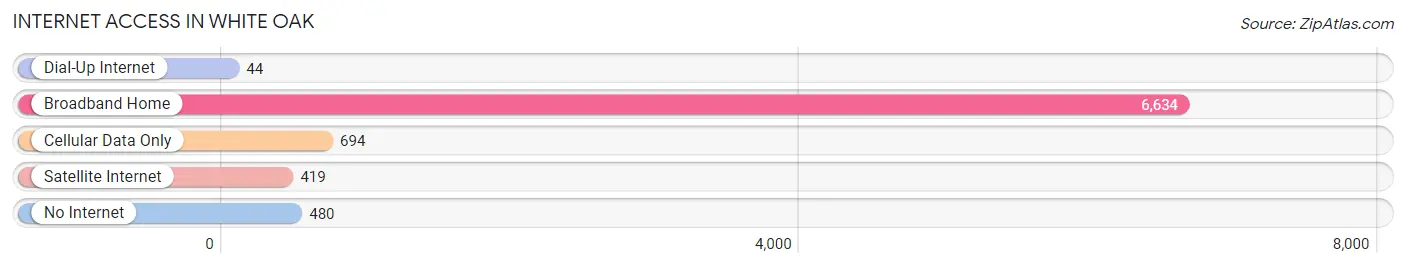
| Internet Type | # Households | % Households |
| Dial-Up Internet | 44 | 0.5% |
| Broadband Home | 6,634 | 83.5% |
| Cellular Data Only | 694 | 8.7% |
| Satellite Internet | 419 | 5.3% |
| No Internet | 480 | 6.0% |
| Total | 7,941 | 100.0% |
White Oak Summary
White Oak is a small village located in Hamilton County, Ohio. It is situated on the banks of the Great Miami River, about 10 miles north of Cincinnati. The village has a population of approximately 1,500 people and is part of the Cincinnati metropolitan area.
History
White Oak was founded in 1817 by a group of settlers from Pennsylvania. The village was originally known as White Oak Station, as it was a stop on the Cincinnati, Hamilton and Dayton Railroad. The village was incorporated in 1867 and was named after the white oak trees that grew in the area.
In the late 19th century, White Oak was a thriving agricultural community. The village was home to several mills, including a flour mill, a sawmill, and a gristmill. The village also had a blacksmith shop, a general store, and a post office.
In the early 20th century, White Oak began to experience a decline in population as many of its residents moved to larger cities in search of better job opportunities. The village was also affected by the Great Depression, which caused many businesses to close.
Geography
White Oak is located in Hamilton County, Ohio, about 10 miles north of Cincinnati. The village is situated on the banks of the Great Miami River and is surrounded by rolling hills and farmland. The village has a total area of 0.7 square miles, all of which is land.
The climate in White Oak is humid continental, with hot summers and cold winters. The average annual temperature is around 50 degrees Fahrenheit, with an average high of around 75 degrees in the summer and an average low of around 25 degrees in the winter.
Economy
White Oak’s economy is largely based on agriculture. The village is home to several farms, which produce a variety of crops, including corn, soybeans, wheat, and hay. The village also has several small businesses, including a grocery store, a hardware store, and a restaurant.
Demographics
As of the 2010 census, White Oak had a population of 1,500 people. The racial makeup of the village was 97.3% White, 0.7% African American, 0.3% Native American, 0.3% Asian, and 1.3% from other races. The median household income was $45,000, and the median family income was $50,000.
Conclusion
White Oak is a small village located in Hamilton County, Ohio. It is situated on the banks of the Great Miami River and has a population of approximately 1,500 people. The village was founded in 1817 and was originally known as White Oak Station. The economy of White Oak is largely based on agriculture, and the village is home to several small businesses. The racial makeup of the village is predominantly White, with a small percentage of African American, Native American, and Asian residents.
Common Questions
What is Per Capita Income in White Oak?
Per Capita income in White Oak is $39,936.
What is the Median Family Income in White Oak?
Median Family Income in White Oak is $106,968.
What is the Median Household income in White Oak?
Median Household Income in White Oak is $71,465.
What is Income or Wage Gap in White Oak?
Income or Wage Gap in White Oak is 33.9%.
Women in White Oak earn 66.1 cents for every dollar earned by a man.
What is Family Income Deficit in White Oak?
Family Income Deficit in White Oak is $13,093.
Families that are below poverty line in White Oak earn $13,093 less on average than the poverty threshold level.
What is Inequality or Gini Index in White Oak?
Inequality or Gini Index in White Oak is 0.43.
What is the Total Population of White Oak?
Total Population of White Oak is 19,101.
What is the Total Male Population of White Oak?
Total Male Population of White Oak is 9,307.
What is the Total Female Population of White Oak?
Total Female Population of White Oak is 9,794.
What is the Ratio of Males per 100 Females in White Oak?
There are 95.03 Males per 100 Females in White Oak.
What is the Ratio of Females per 100 Males in White Oak?
There are 105.23 Females per 100 Males in White Oak.
What is the Median Population Age in White Oak?
Median Population Age in White Oak is 38.3 Years.
What is the Average Family Size in White Oak
Average Family Size in White Oak is 3.0 People.
What is the Average Household Size in White Oak
Average Household Size in White Oak is 2.4 People.
How Large is the Labor Force in White Oak?
There are 10,603 People in the Labor Forcein in White Oak.
What is the Percentage of People in the Labor Force in White Oak?
71.1% of People are in the Labor Force in White Oak.
What is the Unemployment Rate in White Oak?
Unemployment Rate in White Oak is 3.8%.