East Liberty, OH Map & Demographics
East Liberty Map
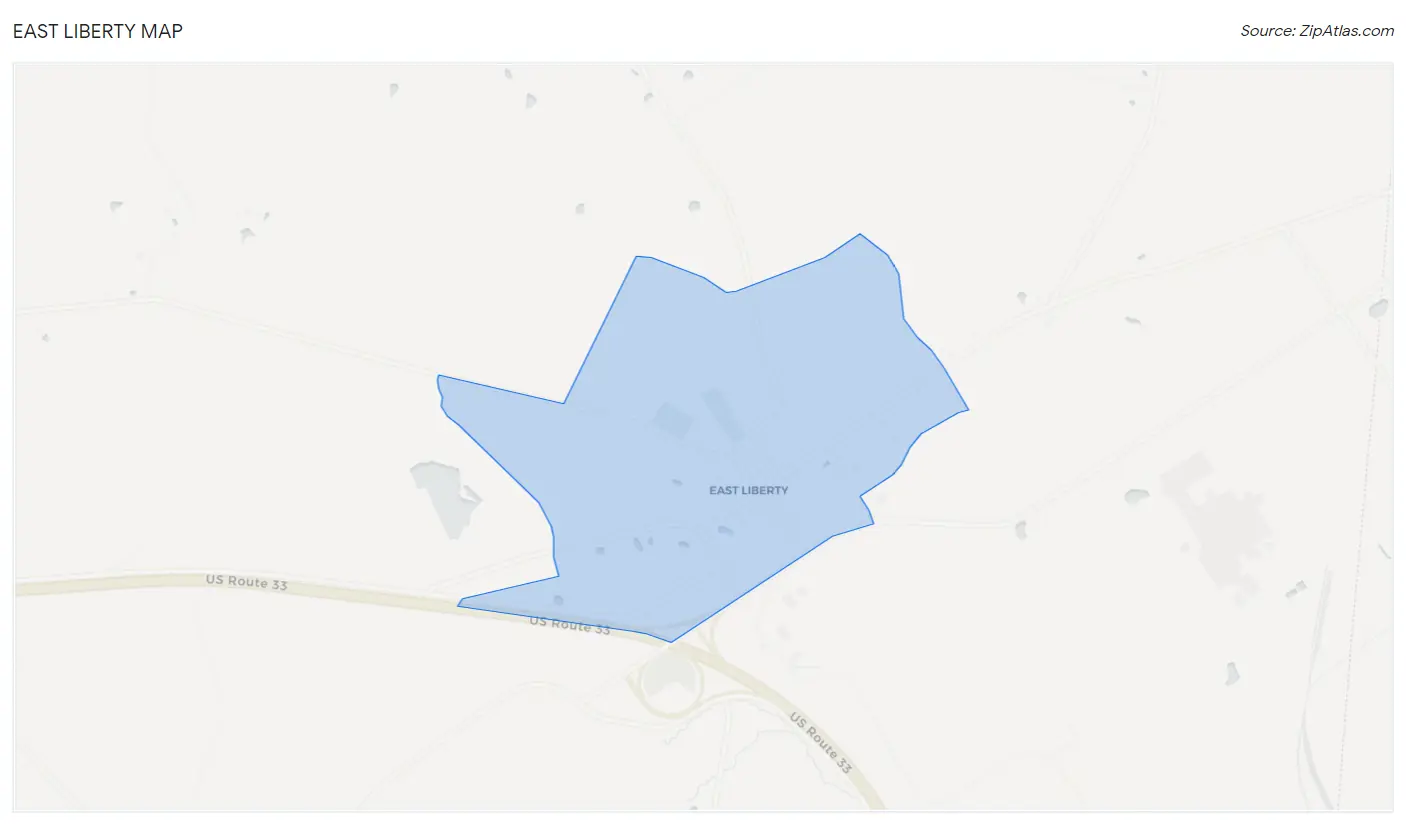
East Liberty Overview
$29,347
PER CAPITA INCOME
0.46
INEQUALITY / GINI INDEX
404
TOTAL POPULATION
208
MALE POPULATION
196
FEMALE POPULATION
106.12
MALES / 100 FEMALES
94.23
FEMALES / 100 MALES
54.8
MEDIAN AGE
2.5
AVG FAMILY SIZE
2.2
AVG HOUSEHOLD SIZE
153
LABOR FORCE [ PEOPLE ]
39.0%
PERCENT IN LABOR FORCE
East Liberty Zip Codes
East Liberty Area Codes
Income in East Liberty
Income Overview in East Liberty
| Characteristic | Number | Measure |
| Per Capita Income | 404 | $29,347 |
| Median Family Income | 148 | $0 |
| Mean Family Income | 148 | $78,793 |
| Median Household Income | 185 | $0 |
| Mean Household Income | 185 | $68,609 |
| Income Deficit | 148 | $0 |
| Wage / Income Gap (%) | 404 | 0.00% |
| Wage / Income Gap ($) | 404 | 100.00¢ per $1 |
| Gini / Inequality Index | 404 | 0.46 |
Earnings by Sex in East Liberty
| Sex | Number | Average Earnings |
| Male | 115 (65.7%) | $0 |
| Female | 60 (34.3%) | $0 |
| Total | 175 (100.0%) | $0 |
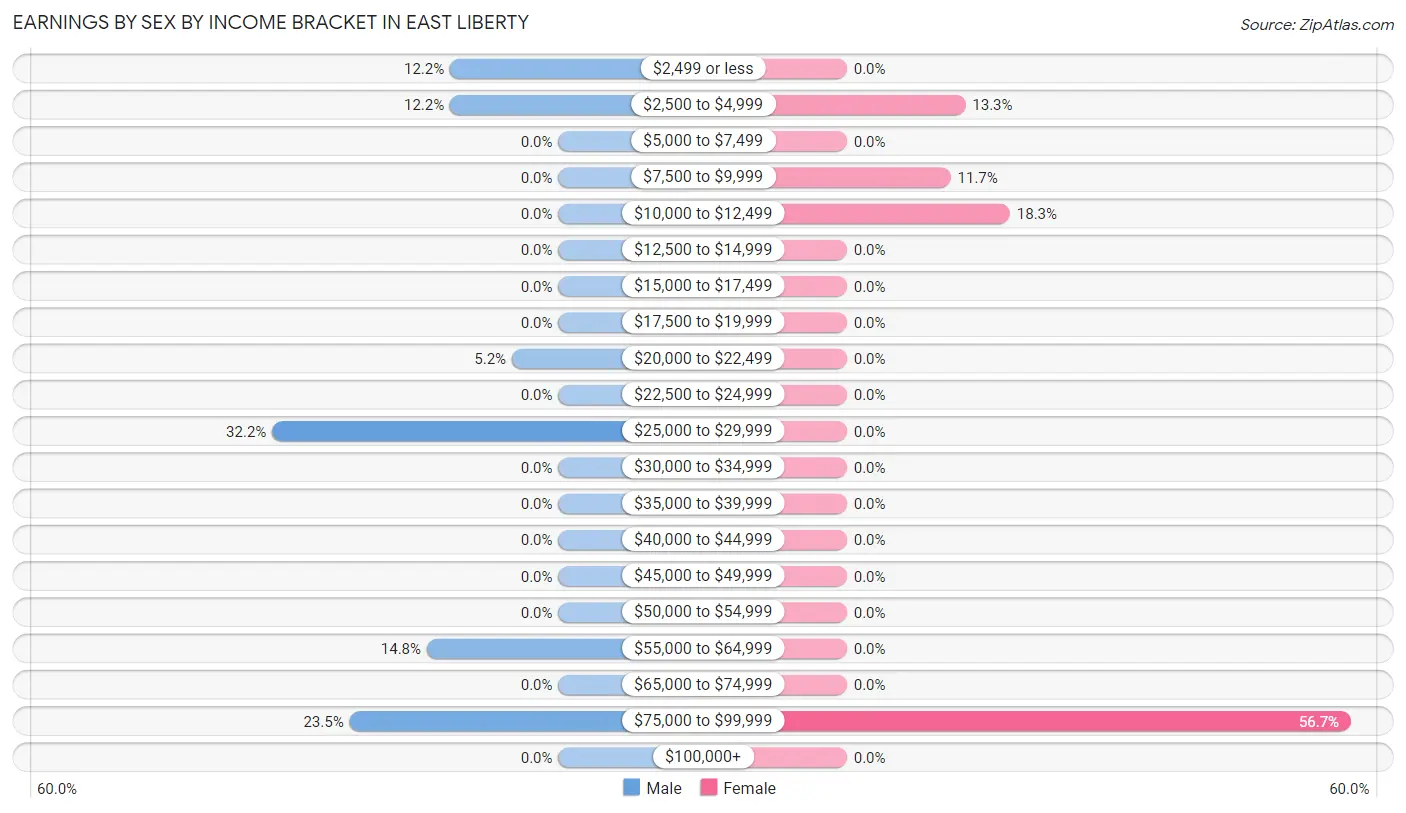
Earnings by Sex by Income Bracket in East Liberty
The most common earnings brackets in East Liberty are $25,000 to $29,999 for men (37 | 32.2%) and $75,000 to $99,999 for women (34 | 56.7%).
| Income | Male | Female |
| $2,499 or less | 14 (12.2%) | 0 (0.0%) |
| $2,500 to $4,999 | 14 (12.2%) | 8 (13.3%) |
| $5,000 to $7,499 | 0 (0.0%) | 0 (0.0%) |
| $7,500 to $9,999 | 0 (0.0%) | 7 (11.7%) |
| $10,000 to $12,499 | 0 (0.0%) | 11 (18.3%) |
| $12,500 to $14,999 | 0 (0.0%) | 0 (0.0%) |
| $15,000 to $17,499 | 0 (0.0%) | 0 (0.0%) |
| $17,500 to $19,999 | 0 (0.0%) | 0 (0.0%) |
| $20,000 to $22,499 | 6 (5.2%) | 0 (0.0%) |
| $22,500 to $24,999 | 0 (0.0%) | 0 (0.0%) |
| $25,000 to $29,999 | 37 (32.2%) | 0 (0.0%) |
| $30,000 to $34,999 | 0 (0.0%) | 0 (0.0%) |
| $35,000 to $39,999 | 0 (0.0%) | 0 (0.0%) |
| $40,000 to $44,999 | 0 (0.0%) | 0 (0.0%) |
| $45,000 to $49,999 | 0 (0.0%) | 0 (0.0%) |
| $50,000 to $54,999 | 0 (0.0%) | 0 (0.0%) |
| $55,000 to $64,999 | 17 (14.8%) | 0 (0.0%) |
| $65,000 to $74,999 | 0 (0.0%) | 0 (0.0%) |
| $75,000 to $99,999 | 27 (23.5%) | 34 (56.7%) |
| $100,000+ | 0 (0.0%) | 0 (0.0%) |
| Total | 115 (100.0%) | 60 (100.0%) |
Earnings by Sex by Educational Attainment in East Liberty
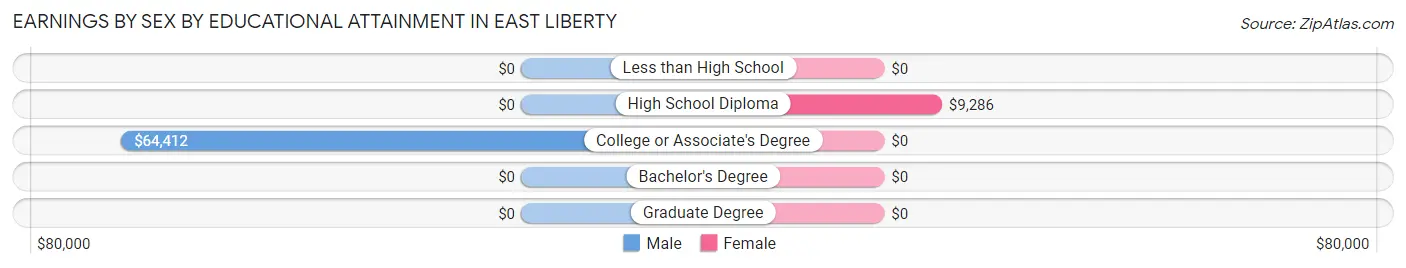
| Educational Attainment | Male Income | Female Income |
| Less than High School | - | - |
| High School Diploma | - | - |
| College or Associate's Degree | $64,412 | $0 |
| Bachelor's Degree | - | - |
| Graduate Degree | - | - |
| Total | - | - |
Family Income in East Liberty
Family Income Brackets in East Liberty
According to the East Liberty family income data, there are 49 families falling into the $10,000 to $14,999 income range, which is the most common income bracket and makes up 33.1% of all families.
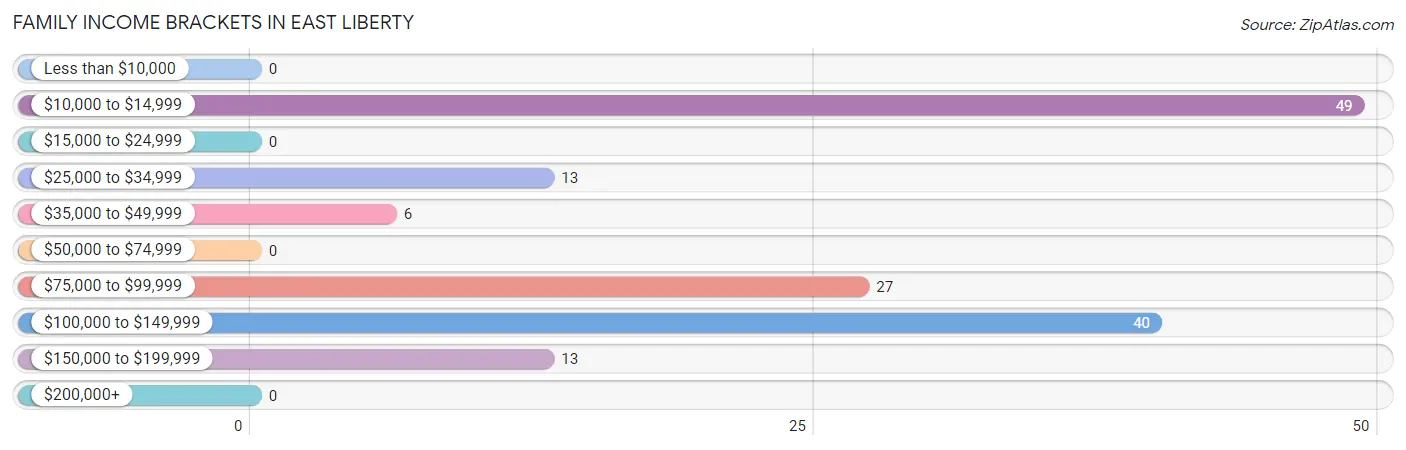
| Income Bracket | # Families | % Families |
| Less than $10,000 | 0 | 0.0% |
| $10,000 to $14,999 | 49 | 33.1% |
| $15,000 to $24,999 | 0 | 0.0% |
| $25,000 to $34,999 | 13 | 8.8% |
| $35,000 to $49,999 | 6 | 4.1% |
| $50,000 to $74,999 | 0 | 0.0% |
| $75,000 to $99,999 | 27 | 18.2% |
| $100,000 to $149,999 | 40 | 27.0% |
| $150,000 to $199,999 | 13 | 8.8% |
| $200,000+ | 0 | 0.0% |
Family Income by Famaliy Size in East Liberty
3-person families (34 | 23.0%) account for the highest median family income in East Liberty with $75,667 per family, while 3-person families (34 | 23.0%) have the highest median income of $25,222 per family member.
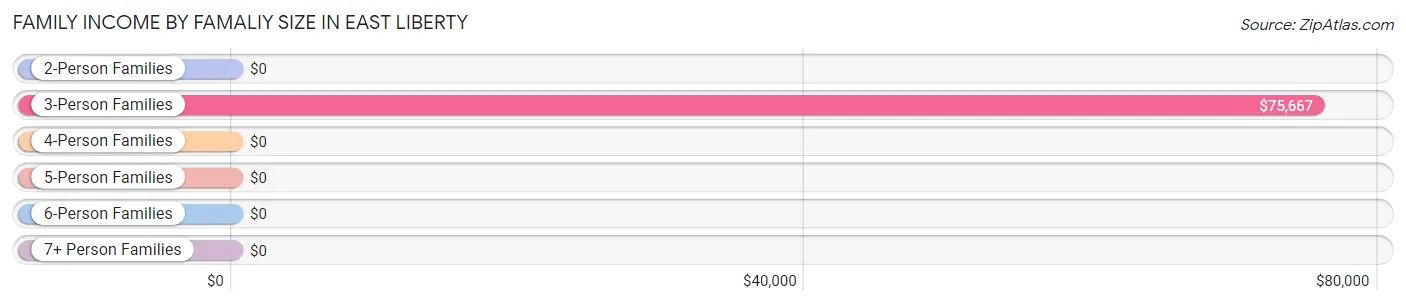
| Income Bracket | # Families | Median Income |
| 2-Person Families | 80 (54.0%) | $0 |
| 3-Person Families | 34 (23.0%) | $75,667 |
| 4-Person Families | 34 (23.0%) | $0 |
| 5-Person Families | 0 (0.0%) | $0 |
| 6-Person Families | 0 (0.0%) | $0 |
| 7+ Person Families | 0 (0.0%) | $0 |
| Total | 148 (100.0%) | $0 |
Family Income by Number of Earners in East Liberty
| Number of Earners | # Families | Median Income |
| No Earners | 55 (37.2%) | $0 |
| 1 Earner | 41 (27.7%) | $0 |
| 2 Earners | 18 (12.2%) | $0 |
| 3+ Earners | 34 (23.0%) | $0 |
| Total | 148 (100.0%) | $0 |
Household Income in East Liberty
Household Income Brackets in East Liberty
With 50 households falling in the category, the $25,000 to $34,999 income range is the most frequent in East Liberty, accounting for 27.0% of all households.
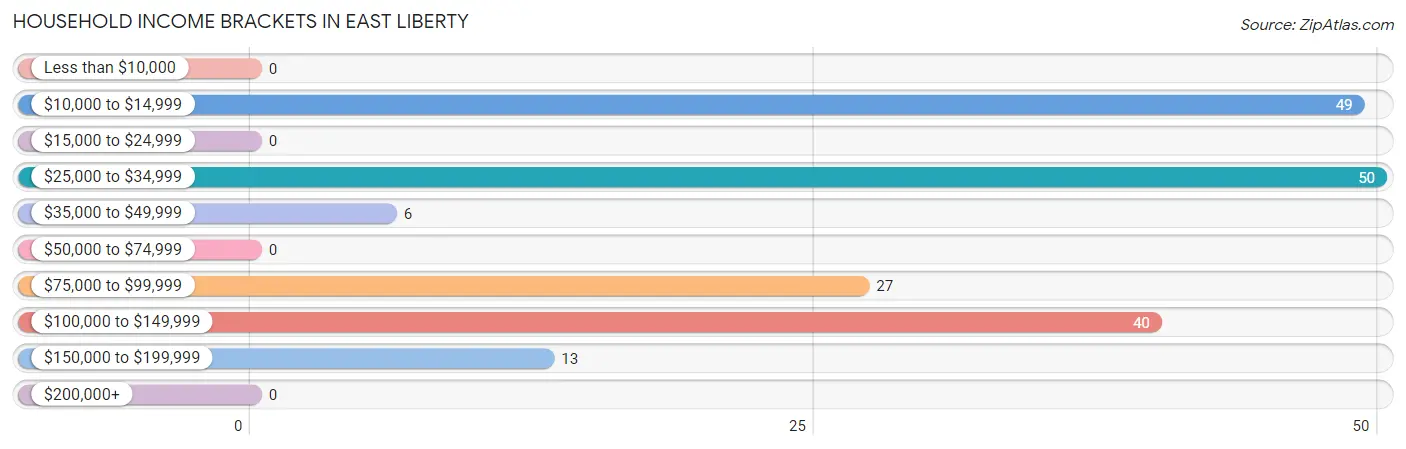
| Income Bracket | # Households | % Households |
| Less than $10,000 | 0 | 0.0% |
| $10,000 to $14,999 | 49 | 26.5% |
| $15,000 to $24,999 | 0 | 0.0% |
| $25,000 to $34,999 | 50 | 27.0% |
| $35,000 to $49,999 | 6 | 3.2% |
| $50,000 to $74,999 | 0 | 0.0% |
| $75,000 to $99,999 | 27 | 14.6% |
| $100,000 to $149,999 | 40 | 21.6% |
| $150,000 to $199,999 | 13 | 7.0% |
| $200,000+ | 0 | 0.0% |
Household Income by Householder Age in East Liberty
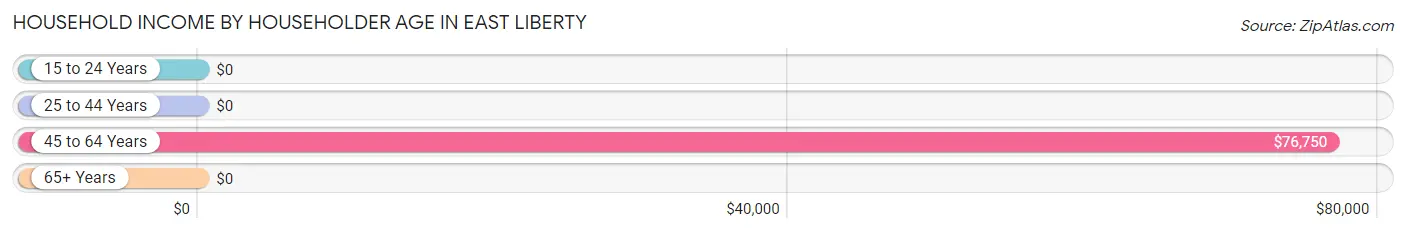
The median household income in East Liberty is $0, with the highest median household income of $76,750 found in the 45 to 64 years age bracket for the primary householder. A total of 59 households (31.9%) fall into this category.
| Income Bracket | # Households | Median Income |
| 15 to 24 Years | 0 (0.0%) | $0 |
| 25 to 44 Years | 71 (38.4%) | $0 |
| 45 to 64 Years | 59 (31.9%) | $76,750 |
| 65+ Years | 55 (29.7%) | $0 |
| Total | 185 (100.0%) | $0 |
Poverty in East Liberty
Income Below Poverty by Sex and Age in East Liberty
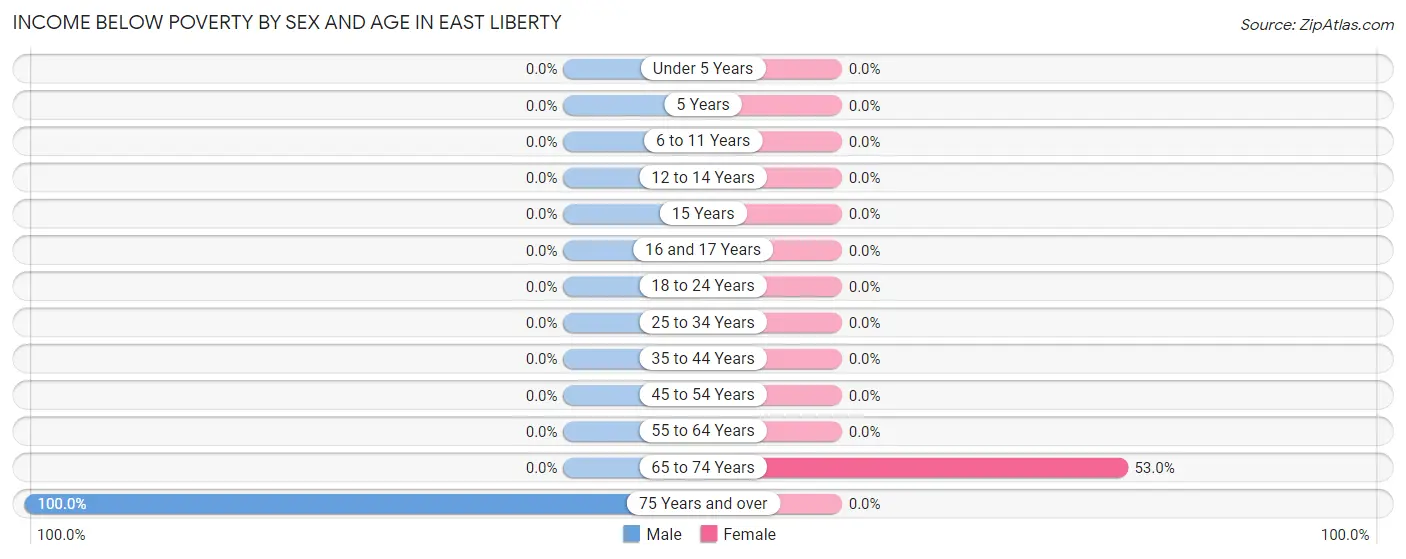
With 23.6% poverty level for males and 17.9% for females among the residents of East Liberty, 75 year old and over males and 65 to 74 year old females are the most vulnerable to poverty, with 49 males (100.0%) and 35 females (53.0%) in their respective age groups living below the poverty level.
| Age Bracket | Male | Female |
| Under 5 Years | 0 (0.0%) | 0 (0.0%) |
| 5 Years | 0 (0.0%) | 0 (0.0%) |
| 6 to 11 Years | 0 (0.0%) | 0 (0.0%) |
| 12 to 14 Years | 0 (0.0%) | 0 (0.0%) |
| 15 Years | 0 (0.0%) | 0 (0.0%) |
| 16 and 17 Years | 0 (0.0%) | 0 (0.0%) |
| 18 to 24 Years | 0 (0.0%) | 0 (0.0%) |
| 25 to 34 Years | 0 (0.0%) | 0 (0.0%) |
| 35 to 44 Years | 0 (0.0%) | 0 (0.0%) |
| 45 to 54 Years | 0 (0.0%) | 0 (0.0%) |
| 55 to 64 Years | 0 (0.0%) | 0 (0.0%) |
| 65 to 74 Years | 0 (0.0%) | 35 (53.0%) |
| 75 Years and over | 49 (100.0%) | 0 (0.0%) |
| Total | 49 (23.6%) | 35 (17.9%) |
Income Above Poverty by Sex and Age in East Liberty
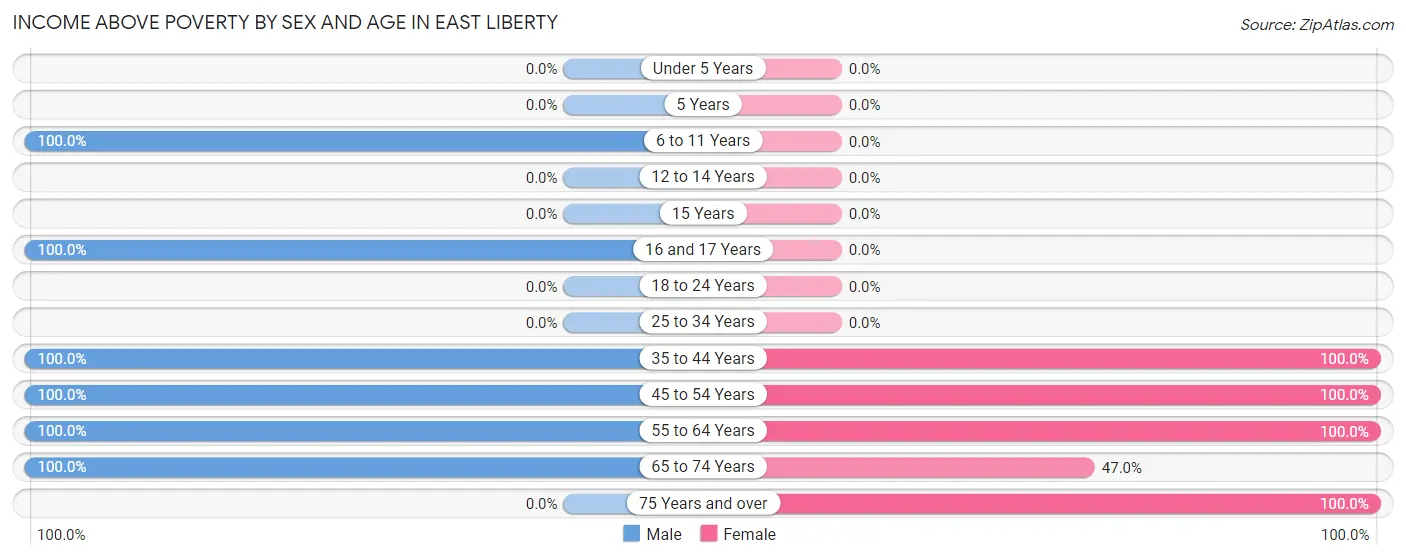
According to the poverty statistics in East Liberty, males aged 6 to 11 years and females aged 35 to 44 years are the age groups that are most secure financially, with 100.0% of males and 100.0% of females in these age groups living above the poverty line.
| Age Bracket | Male | Female |
| Under 5 Years | 0 (0.0%) | 0 (0.0%) |
| 5 Years | 0 (0.0%) | 0 (0.0%) |
| 6 to 11 Years | 12 (100.0%) | 0 (0.0%) |
| 12 to 14 Years | 0 (0.0%) | 0 (0.0%) |
| 15 Years | 0 (0.0%) | 0 (0.0%) |
| 16 and 17 Years | 14 (100.0%) | 0 (0.0%) |
| 18 to 24 Years | 0 (0.0%) | 0 (0.0%) |
| 25 to 34 Years | 0 (0.0%) | 0 (0.0%) |
| 35 to 44 Years | 50 (100.0%) | 73 (100.0%) |
| 45 to 54 Years | 44 (100.0%) | 11 (100.0%) |
| 55 to 64 Years | 33 (100.0%) | 26 (100.0%) |
| 65 to 74 Years | 6 (100.0%) | 31 (47.0%) |
| 75 Years and over | 0 (0.0%) | 20 (100.0%) |
| Total | 159 (76.4%) | 161 (82.1%) |
Income Below Poverty Among Married-Couple Families in East Liberty
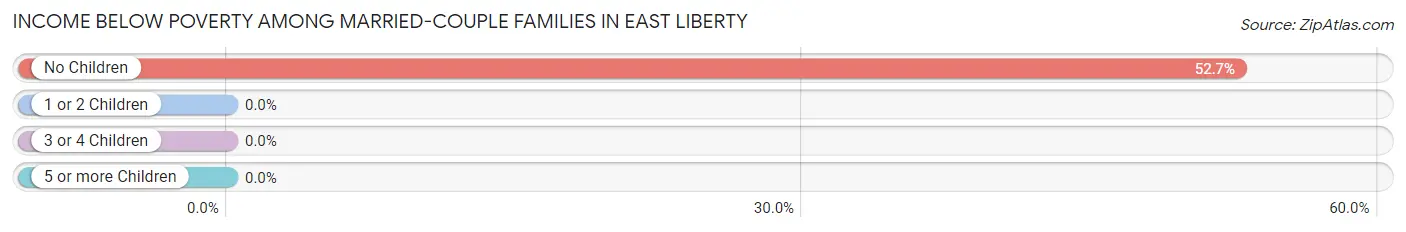
The poverty statistics for married-couple families in East Liberty show that 34.5% or 49 of the total 142 families live below the poverty line. Families with no children have the highest poverty rate of 52.7%, comprising of 49 families. On the other hand, families with 1 or 2 children have the lowest poverty rate of 0.0%, which includes 0 families.
| Children | Above Poverty | Below Poverty |
| No Children | 44 (47.3%) | 49 (52.7%) |
| 1 or 2 Children | 49 (100.0%) | 0 (0.0%) |
| 3 or 4 Children | 0 (0.0%) | 0 (0.0%) |
| 5 or more Children | 0 (0.0%) | 0 (0.0%) |
| Total | 93 (65.5%) | 49 (34.5%) |
Income Below Poverty Among Single-Parent Households in East Liberty
| Children | Single Father | Single Mother |
| No Children | 0 (0.0%) | 0 (0.0%) |
| 1 or 2 Children | 0 (0.0%) | 0 (0.0%) |
| 3 or 4 Children | 0 (0.0%) | 0 (0.0%) |
| 5 or more Children | 0 (0.0%) | 0 (0.0%) |
| Total | 0 (0.0%) | 0 (0.0%) |
Income Below Poverty Among Married-Couple vs Single-Parent Households in East Liberty
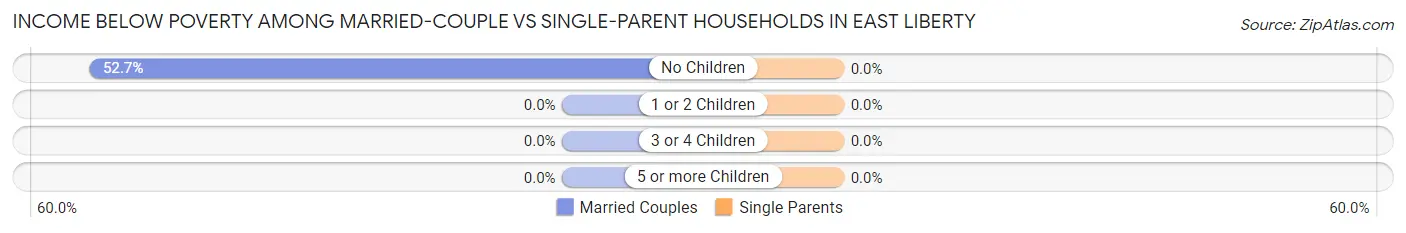
| Children | Married-Couple Families | Single-Parent Households |
| No Children | 49 (52.7%) | 0 (0.0%) |
| 1 or 2 Children | 0 (0.0%) | 0 (0.0%) |
| 3 or 4 Children | 0 (0.0%) | 0 (0.0%) |
| 5 or more Children | 0 (0.0%) | 0 (0.0%) |
| Total | 49 (34.5%) | 0 (0.0%) |
Race in East Liberty
The most populous races in East Liberty are White / Caucasian (289 | 71.5%), Asian (89 | 22.0%), and Some other Race (14 | 3.5%).
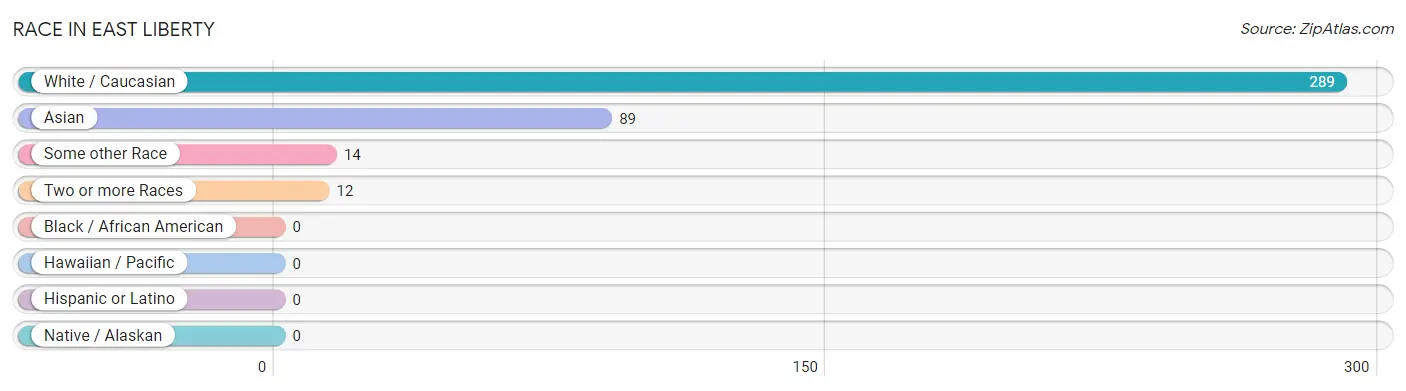
| Race | # Population | % Population |
| Asian | 89 | 22.0% |
| Black / African American | 0 | 0.0% |
| Hawaiian / Pacific | 0 | 0.0% |
| Hispanic or Latino | 0 | 0.0% |
| Native / Alaskan | 0 | 0.0% |
| White / Caucasian | 289 | 71.5% |
| Two or more Races | 12 | 3.0% |
| Some other Race | 14 | 3.5% |
| Total | 404 | 100.0% |
Ancestry in East Liberty
The most populous ancestries reported in East Liberty are American (64 | 15.8%), Thai (57 | 14.1%), English (54 | 13.4%), Welsh (49 | 12.1%), and Korean (44 | 10.9%), together accounting for 66.3% of all East Liberty residents.
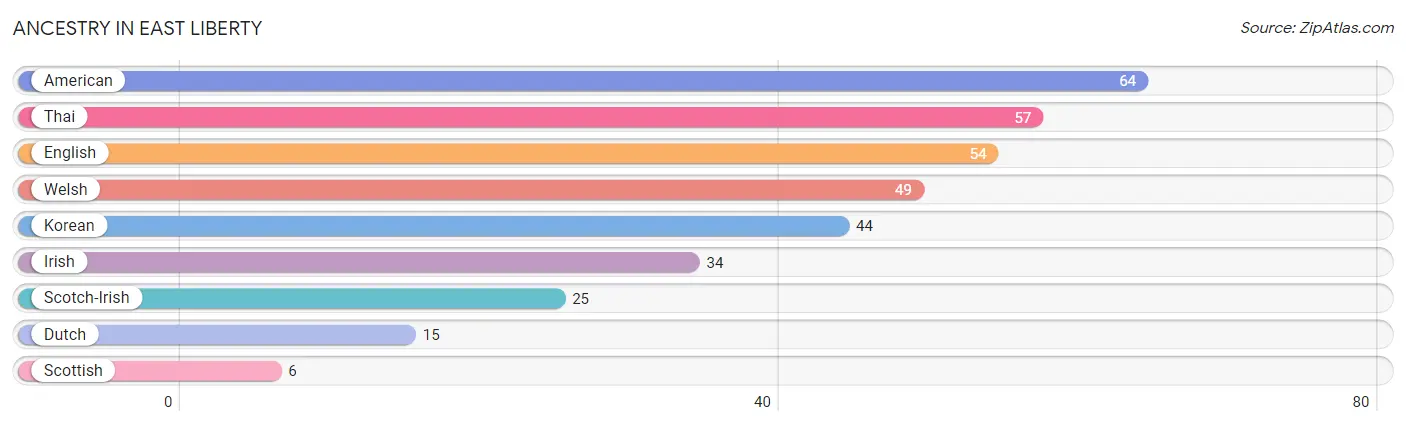
| Ancestry | # Population | % Population |
| American | 64 | 15.8% |
| Dutch | 15 | 3.7% |
| English | 54 | 13.4% |
| Irish | 34 | 8.4% |
| Korean | 44 | 10.9% |
| Scotch-Irish | 25 | 6.2% |
| Scottish | 6 | 1.5% |
| Thai | 57 | 14.1% |
| Welsh | 49 | 12.1% | View All 9 Rows |
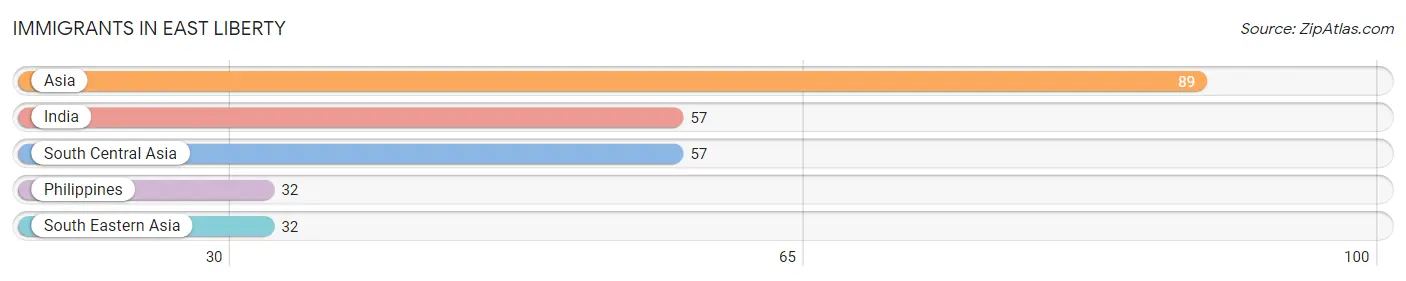
Immigrants in East Liberty
The most numerous immigrant groups reported in East Liberty came from Asia (89 | 22.0%), India (57 | 14.1%), South Central Asia (57 | 14.1%), Philippines (32 | 7.9%), and South Eastern Asia (32 | 7.9%), together accounting for 66.1% of all East Liberty residents.
| Immigration Origin | # Population | % Population |
| Asia | 89 | 22.0% |
| India | 57 | 14.1% |
| Philippines | 32 | 7.9% |
| South Central Asia | 57 | 14.1% |
| South Eastern Asia | 32 | 7.9% | View All 5 Rows |
Sex and Age in East Liberty
Sex and Age in East Liberty
The most populous age groups in East Liberty are 35 to 39 Years (50 | 24.0%) for men and 40 to 44 Years (66 | 33.7%) for women.
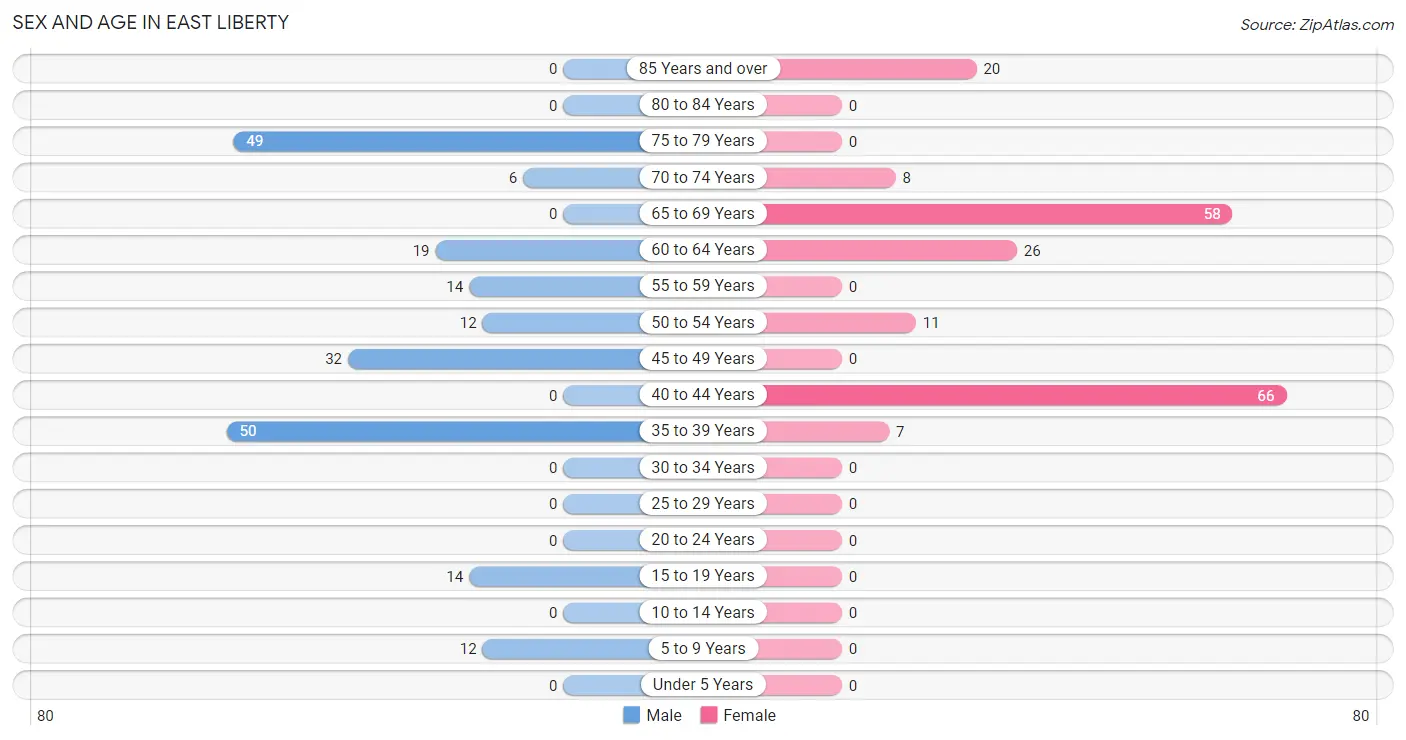
| Age Bracket | Male | Female |
| Under 5 Years | 0 (0.0%) | 0 (0.0%) |
| 5 to 9 Years | 12 (5.8%) | 0 (0.0%) |
| 10 to 14 Years | 0 (0.0%) | 0 (0.0%) |
| 15 to 19 Years | 14 (6.7%) | 0 (0.0%) |
| 20 to 24 Years | 0 (0.0%) | 0 (0.0%) |
| 25 to 29 Years | 0 (0.0%) | 0 (0.0%) |
| 30 to 34 Years | 0 (0.0%) | 0 (0.0%) |
| 35 to 39 Years | 50 (24.0%) | 7 (3.6%) |
| 40 to 44 Years | 0 (0.0%) | 66 (33.7%) |
| 45 to 49 Years | 32 (15.4%) | 0 (0.0%) |
| 50 to 54 Years | 12 (5.8%) | 11 (5.6%) |
| 55 to 59 Years | 14 (6.7%) | 0 (0.0%) |
| 60 to 64 Years | 19 (9.1%) | 26 (13.3%) |
| 65 to 69 Years | 0 (0.0%) | 58 (29.6%) |
| 70 to 74 Years | 6 (2.9%) | 8 (4.1%) |
| 75 to 79 Years | 49 (23.6%) | 0 (0.0%) |
| 80 to 84 Years | 0 (0.0%) | 0 (0.0%) |
| 85 Years and over | 0 (0.0%) | 20 (10.2%) |
| Total | 208 (100.0%) | 196 (100.0%) |
Families and Households in East Liberty
Median Family Size in East Liberty
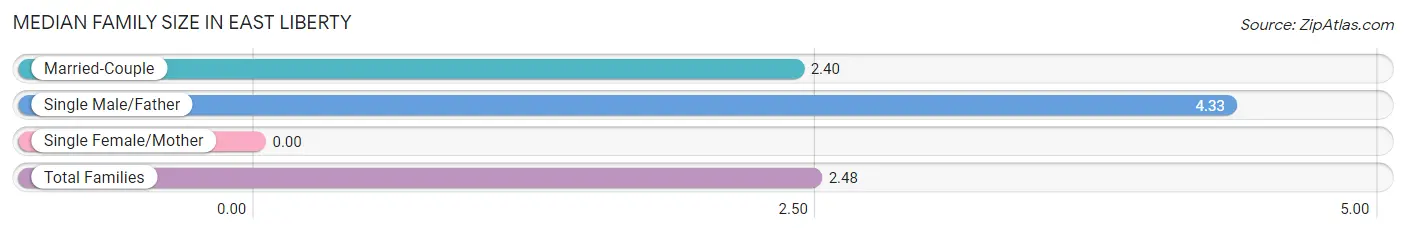
| Family Type | # Families | Family Size |
| Married-Couple | 142 (96.0%) | 2.40 |
| Single Male/Father | 6 (4.1%) | 4.33 |
| Single Female/Mother | 0 (0.0%) | - |
| Total Families | 148 (100.0%) | 2.48 |
Median Household Size in East Liberty
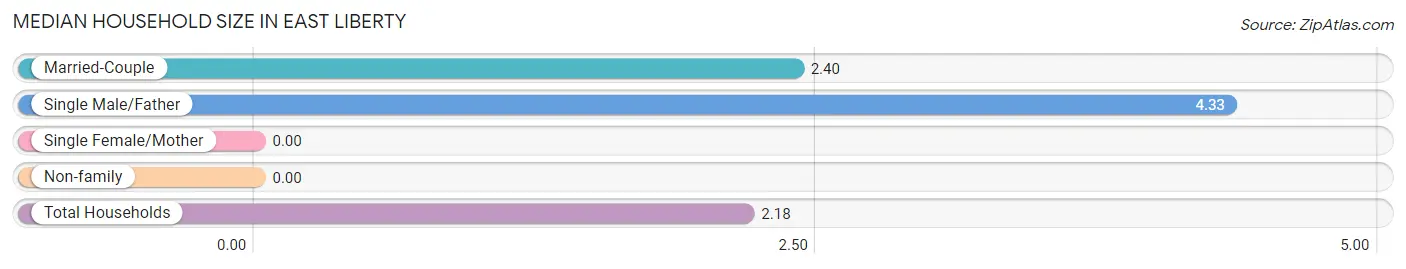
| Household Type | # Households | Household Size |
| Married-Couple | 142 (76.8%) | 2.40 |
| Single Male/Father | 6 (3.2%) | 4.33 |
| Single Female/Mother | 0 (0.0%) | - |
| Non-family | 37 (20.0%) | - |
| Total Households | 185 (100.0%) | 2.18 |
Household Size by Marriage Status in East Liberty
Out of a total of 185 households in East Liberty, 148 (80.0%) are family households, while 37 (20.0%) are nonfamily households. The most numerous type of family households are 2-person households, comprising 80, and the most common type of nonfamily households are 1-person households, comprising 37.
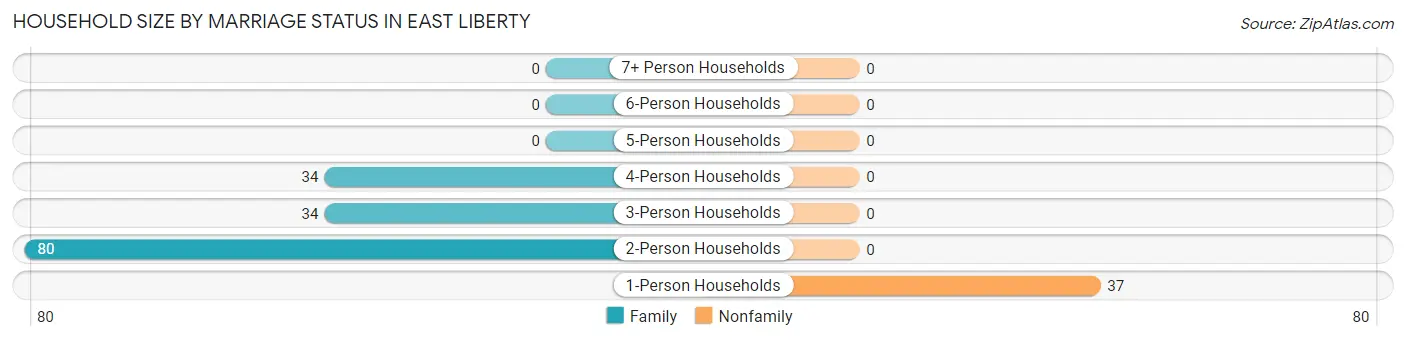
| Household Size | Family Households | Nonfamily Households |
| 1-Person Households | - | 37 (20.0%) |
| 2-Person Households | 80 (43.2%) | 0 (0.0%) |
| 3-Person Households | 34 (18.4%) | 0 (0.0%) |
| 4-Person Households | 34 (18.4%) | 0 (0.0%) |
| 5-Person Households | 0 (0.0%) | 0 (0.0%) |
| 6-Person Households | 0 (0.0%) | 0 (0.0%) |
| 7+ Person Households | 0 (0.0%) | 0 (0.0%) |
| Total | 148 (80.0%) | 37 (20.0%) |
Female Fertility in East Liberty
Fertility by Age in East Liberty
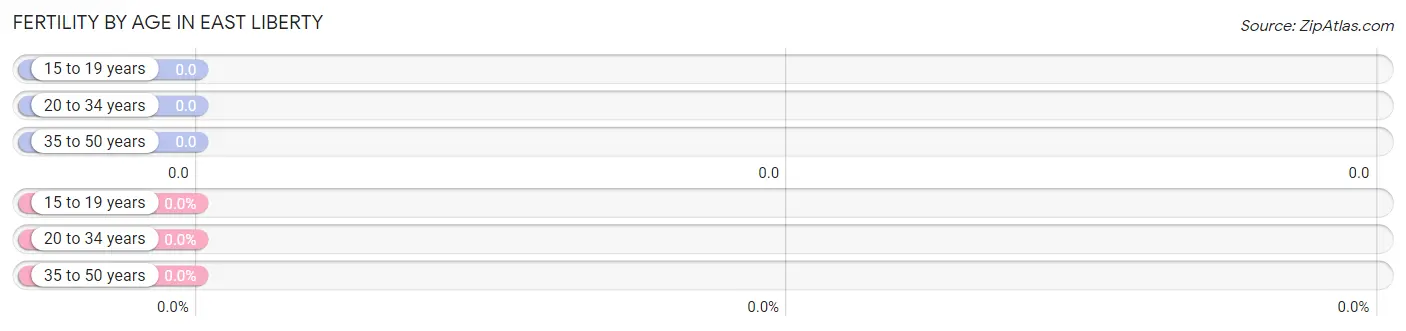
| Age Bracket | Women with Births | Births / 1,000 Women |
| 15 to 19 years | 0 (0.0%) | 0.0 |
| 20 to 34 years | 0 (0.0%) | 0.0 |
| 35 to 50 years | 0 (0.0%) | 0.0 |
| Total | 0 (0.0%) | 0.0 |
Fertility by Age by Marriage Status in East Liberty
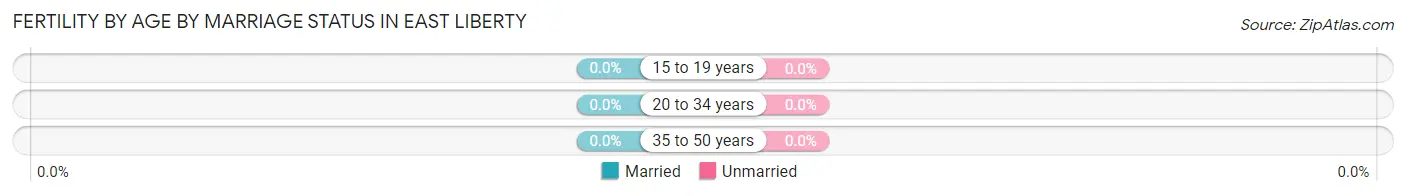
| Age Bracket | Married | Unmarried |
| 15 to 19 years | 0 (0.0%) | 0 (0.0%) |
| 20 to 34 years | 0 (0.0%) | 0 (0.0%) |
| 35 to 50 years | 0 (0.0%) | 0 (0.0%) |
| Total | 0 (0.0%) | 0 (0.0%) |
Fertility by Education in East Liberty
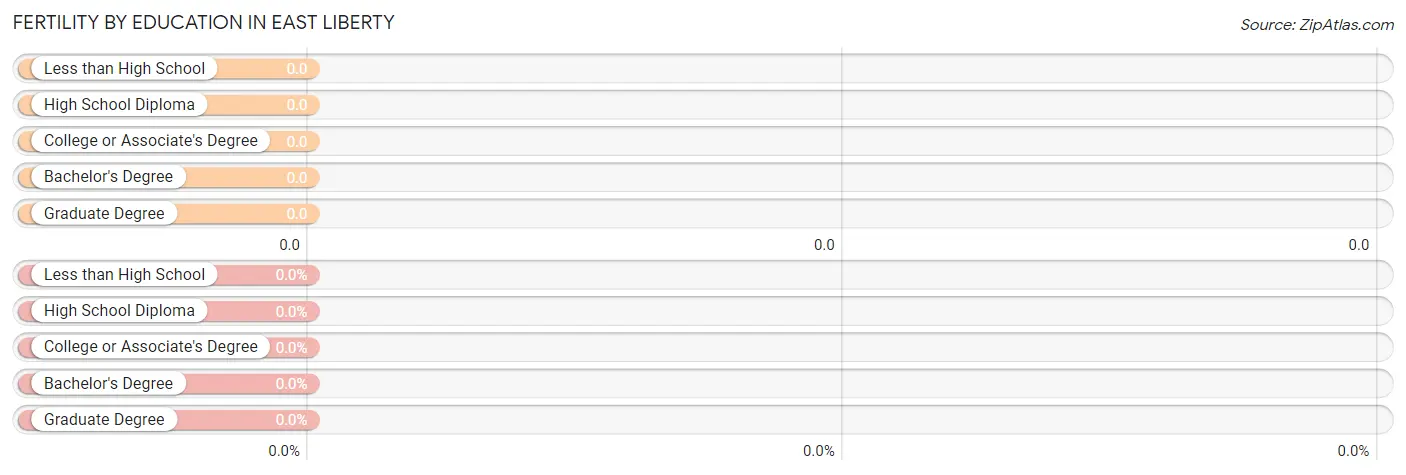
| Educational Attainment | Women with Births | Births / 1,000 Women |
| Less than High School | 0 (0.0%) | 0.0 |
| High School Diploma | 0 (0.0%) | 0.0 |
| College or Associate's Degree | 0 (0.0%) | 0.0 |
| Bachelor's Degree | 0 (0.0%) | 0.0 |
| Graduate Degree | 0 (0.0%) | 0.0 |
| Total | 0 (0.0%) | 0.0 |
Fertility by Education by Marriage Status in East Liberty
| Educational Attainment | Married | Unmarried |
| Less than High School | 0 (0.0%) | 0 (0.0%) |
| High School Diploma | 0 (0.0%) | 0 (0.0%) |
| College or Associate's Degree | 0 (0.0%) | 0 (0.0%) |
| Bachelor's Degree | 0 (0.0%) | 0 (0.0%) |
| Graduate Degree | 0 (0.0%) | 0 (0.0%) |
| Total | 0 (0.0%) | 0 (0.0%) |
Employment Characteristics in East Liberty
Employment by Class of Employer in East Liberty
Among the 153 employed individuals in East Liberty, private company employees (84 | 54.9%), local government employees (51 | 33.3%), and not-for-profit organizations (18 | 11.8%) make up the most common classes of employment.
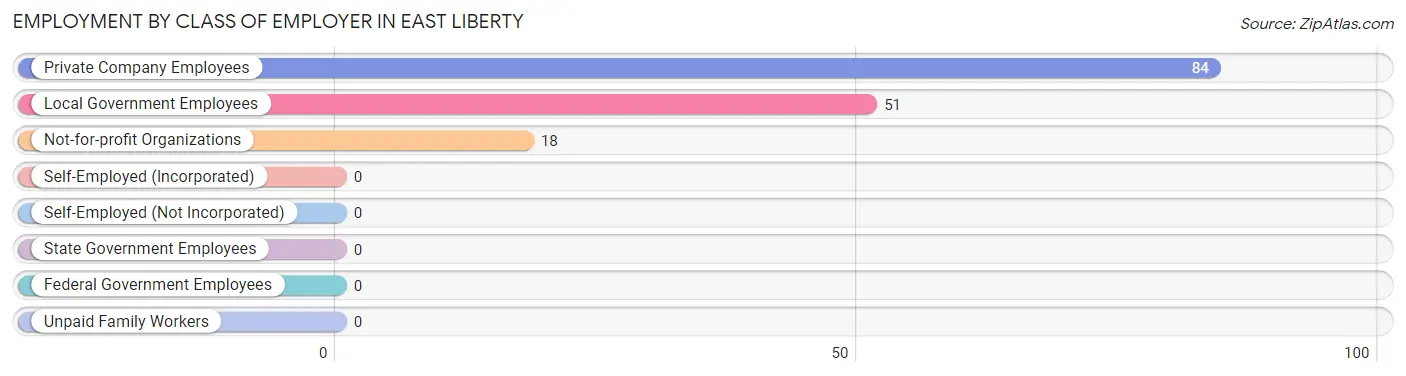
| Employer Class | # Employees | % Employees |
| Private Company Employees | 84 | 54.9% |
| Self-Employed (Incorporated) | 0 | 0.0% |
| Self-Employed (Not Incorporated) | 0 | 0.0% |
| Not-for-profit Organizations | 18 | 11.8% |
| Local Government Employees | 51 | 33.3% |
| State Government Employees | 0 | 0.0% |
| Federal Government Employees | 0 | 0.0% |
| Unpaid Family Workers | 0 | 0.0% |
| Total | 153 | 100.0% |
Employment Status by Age in East Liberty
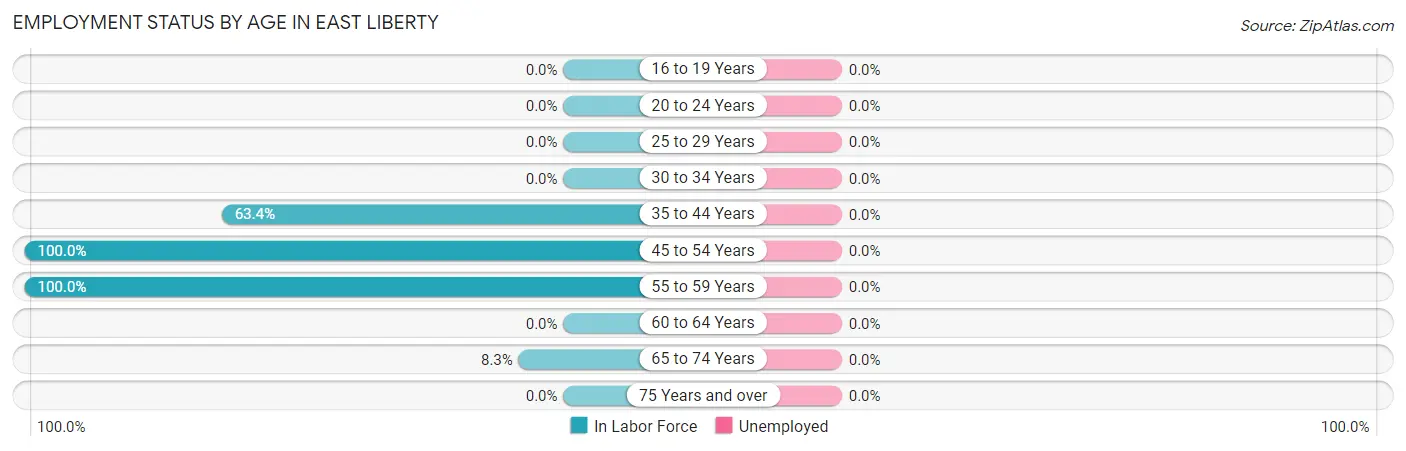
| Age Bracket | In Labor Force | Unemployed |
| 16 to 19 Years | 0 (0.0%) | 0 (0.0%) |
| 20 to 24 Years | 0 (0.0%) | 0 (0.0%) |
| 25 to 29 Years | 0 (0.0%) | 0 (0.0%) |
| 30 to 34 Years | 0 (0.0%) | 0 (0.0%) |
| 35 to 44 Years | 78 (63.4%) | 0 (0.0%) |
| 45 to 54 Years | 55 (100.0%) | 0 (0.0%) |
| 55 to 59 Years | 14 (100.0%) | 0 (0.0%) |
| 60 to 64 Years | 0 (0.0%) | 0 (0.0%) |
| 65 to 74 Years | 6 (8.3%) | 0 (0.0%) |
| 75 Years and over | 0 (0.0%) | 0 (0.0%) |
| Total | 153 (39.0%) | 0 (0.0%) |
Employment Status by Educational Attainment in East Liberty
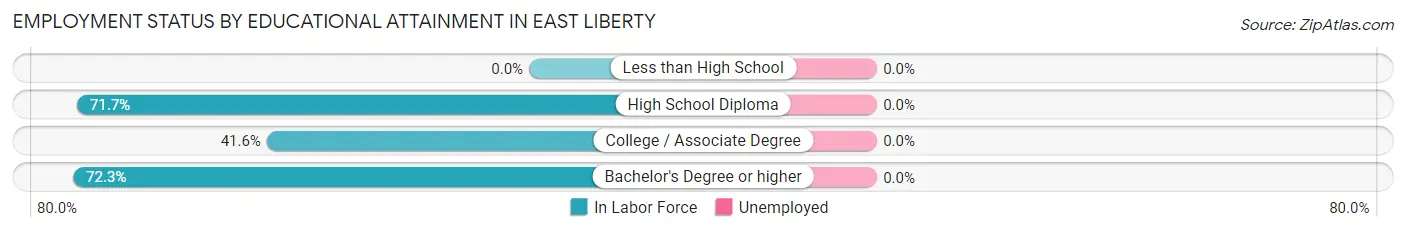
| Educational Attainment | In Labor Force | Unemployed |
| Less than High School | 0 (0.0%) | 0 (0.0%) |
| High School Diploma | 81 (71.7%) | 0 (0.0%) |
| College / Associate Degree | 32 (41.6%) | 0 (0.0%) |
| Bachelor's Degree or higher | 34 (72.3%) | 0 (0.0%) |
| Total | 147 (62.0%) | 0 (0.0%) |
Employment Occupations by Sex in East Liberty
Management, Business, Science and Arts Occupations
The most common Management, Business, Science and Arts occupations in East Liberty are Community & Social Service (34 | 22.2%), Education Instruction & Library (34 | 22.2%), and Management (14 | 9.1%).
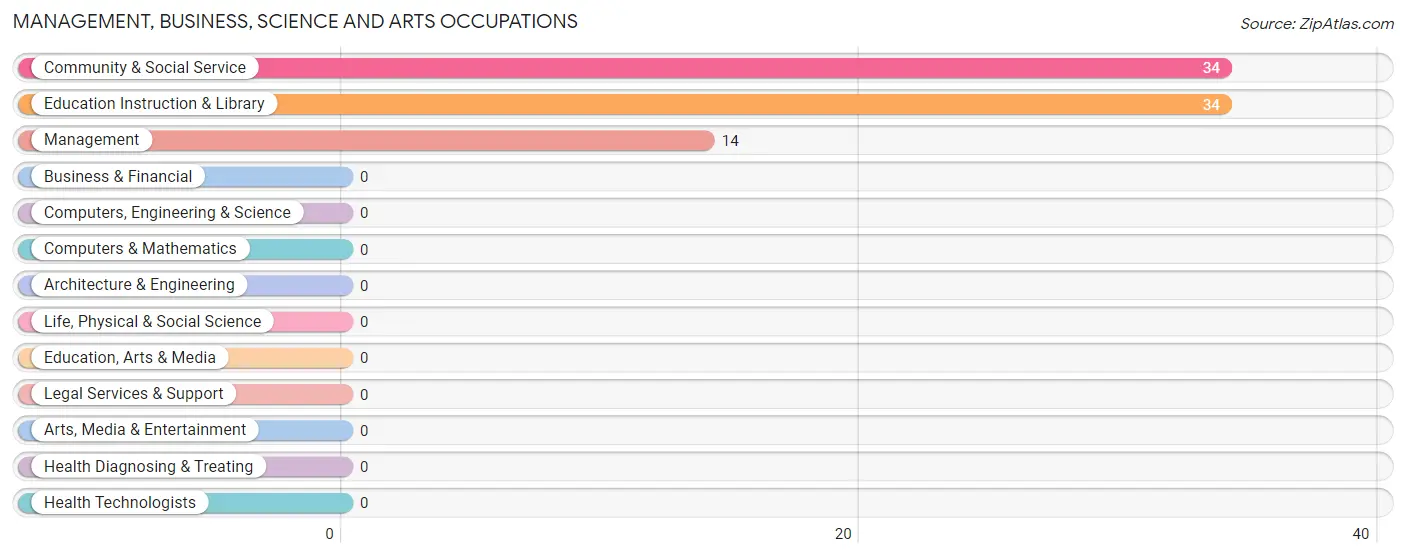
Management, Business, Science and Arts Occupations by Sex
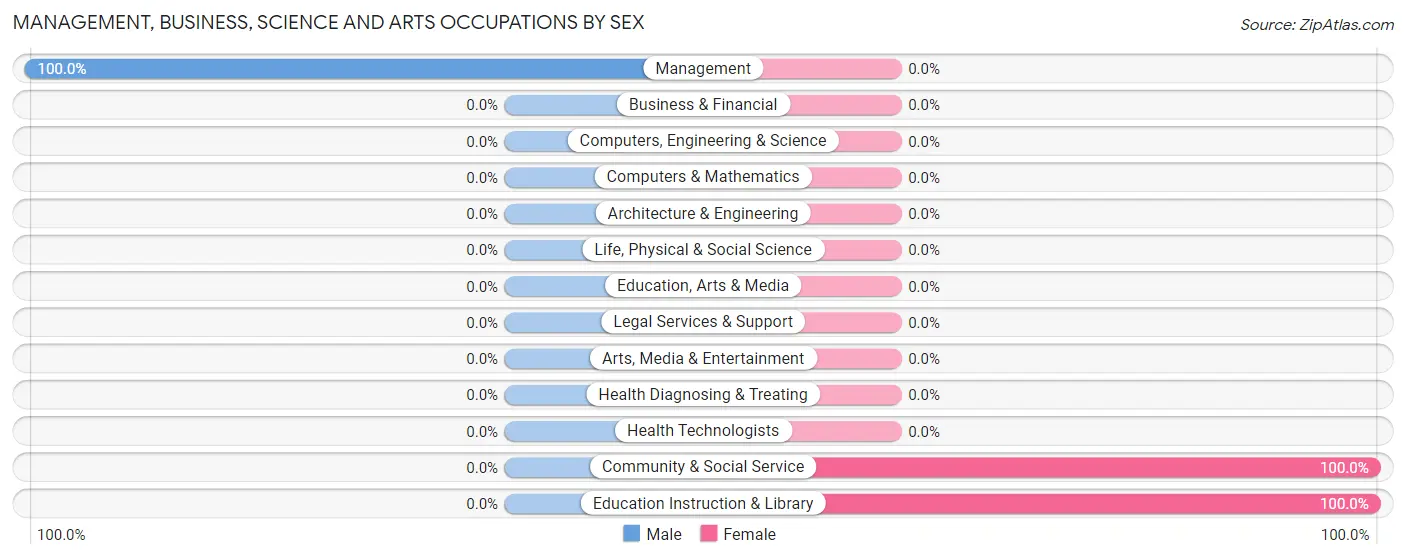
| Occupation | Male | Female |
| Management | 14 (100.0%) | 0 (0.0%) |
| Business & Financial | 0 (0.0%) | 0 (0.0%) |
| Computers, Engineering & Science | 0 (0.0%) | 0 (0.0%) |
| Computers & Mathematics | 0 (0.0%) | 0 (0.0%) |
| Architecture & Engineering | 0 (0.0%) | 0 (0.0%) |
| Life, Physical & Social Science | 0 (0.0%) | 0 (0.0%) |
| Community & Social Service | 0 (0.0%) | 34 (100.0%) |
| Education, Arts & Media | 0 (0.0%) | 0 (0.0%) |
| Legal Services & Support | 0 (0.0%) | 0 (0.0%) |
| Education Instruction & Library | 0 (0.0%) | 34 (100.0%) |
| Arts, Media & Entertainment | 0 (0.0%) | 0 (0.0%) |
| Health Diagnosing & Treating | 0 (0.0%) | 0 (0.0%) |
| Health Technologists | 0 (0.0%) | 0 (0.0%) |
| Total (Category) | 14 (29.2%) | 34 (70.8%) |
| Total (Overall) | 101 (66.0%) | 52 (34.0%) |
Services Occupations
The most common Services occupations in East Liberty are , and Cleaning & Maintenance (28 | 18.3%).
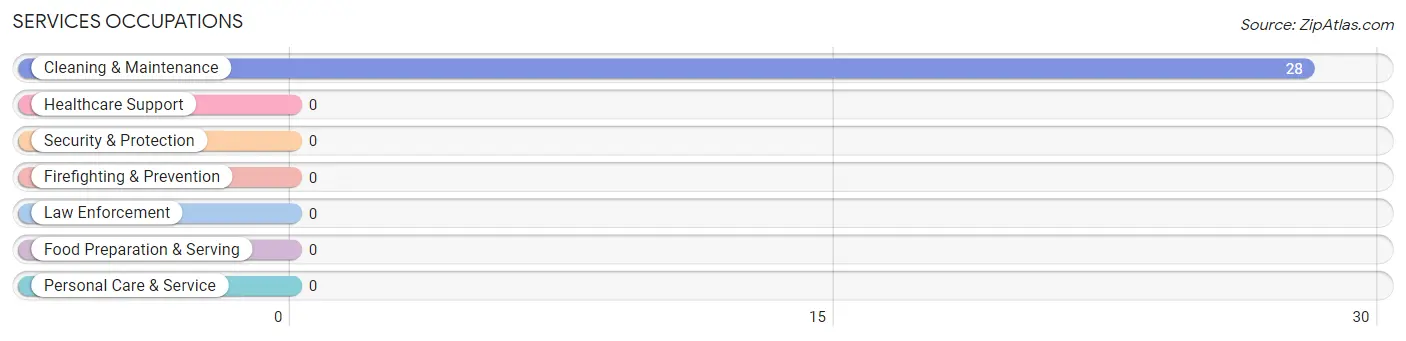
Services Occupations by Sex
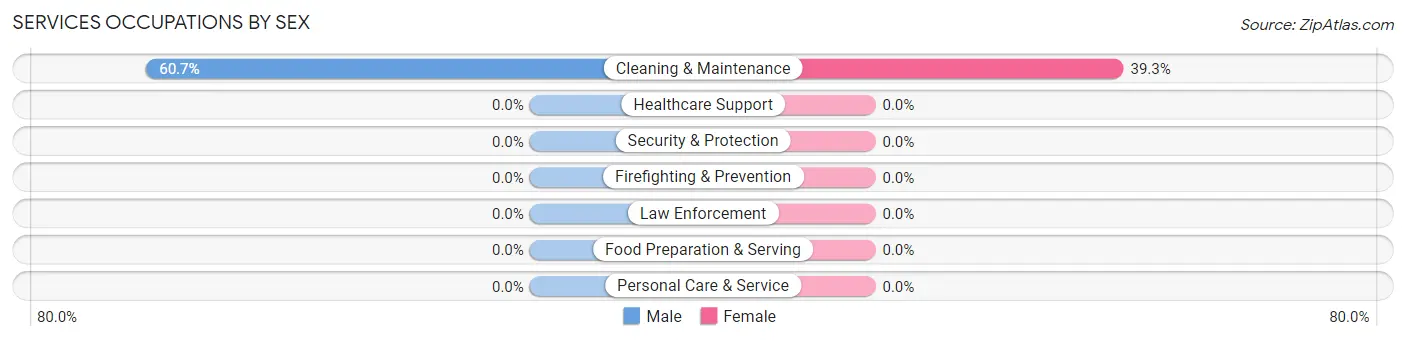
| Occupation | Male | Female |
| Healthcare Support | 0 (0.0%) | 0 (0.0%) |
| Security & Protection | 0 (0.0%) | 0 (0.0%) |
| Firefighting & Prevention | 0 (0.0%) | 0 (0.0%) |
| Law Enforcement | 0 (0.0%) | 0 (0.0%) |
| Food Preparation & Serving | 0 (0.0%) | 0 (0.0%) |
| Cleaning & Maintenance | 17 (60.7%) | 11 (39.3%) |
| Personal Care & Service | 0 (0.0%) | 0 (0.0%) |
| Total (Category) | 17 (60.7%) | 11 (39.3%) |
| Total (Overall) | 101 (66.0%) | 52 (34.0%) |
Sales and Office Occupations
The most common Sales and Office occupations in East Liberty are , and Office & Administration (7 | 4.6%).
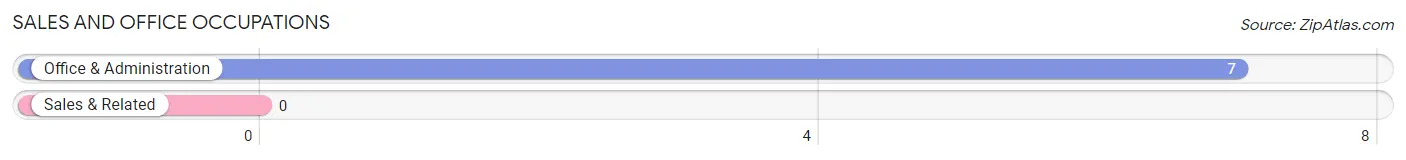
Sales and Office Occupations by Sex
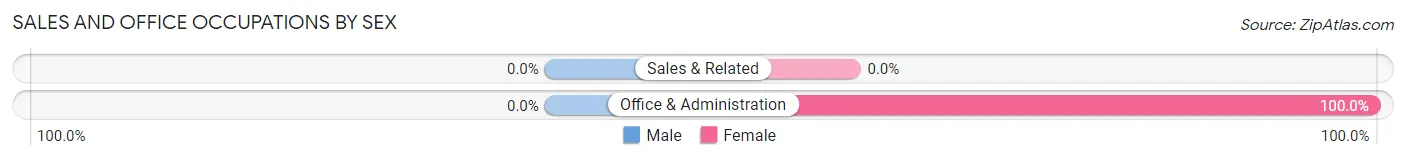
| Occupation | Male | Female |
| Sales & Related | 0 (0.0%) | 0 (0.0%) |
| Office & Administration | 0 (0.0%) | 7 (100.0%) |
| Total (Category) | 0 (0.0%) | 7 (100.0%) |
| Total (Overall) | 101 (66.0%) | 52 (34.0%) |
Natural Resources, Construction and Maintenance Occupations
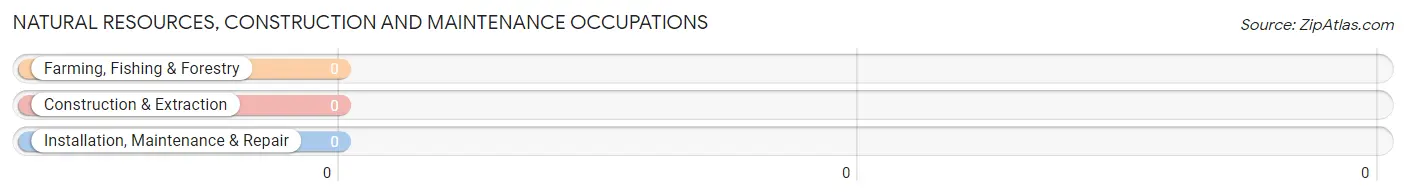
Natural Resources, Construction and Maintenance Occupations by Sex
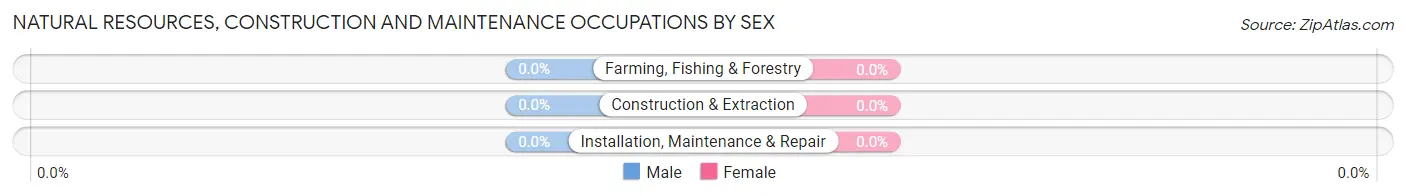
| Occupation | Male | Female |
| Farming, Fishing & Forestry | 0 (0.0%) | 0 (0.0%) |
| Construction & Extraction | 0 (0.0%) | 0 (0.0%) |
| Installation, Maintenance & Repair | 0 (0.0%) | 0 (0.0%) |
| Total (Category) | 0 (0.0%) | 0 (0.0%) |
| Total (Overall) | 101 (66.0%) | 52 (34.0%) |
Production, Transportation and Moving Occupations
The most common Production, Transportation and Moving occupations in East Liberty are Production (58 | 37.9%), and Material Moving (12 | 7.8%).
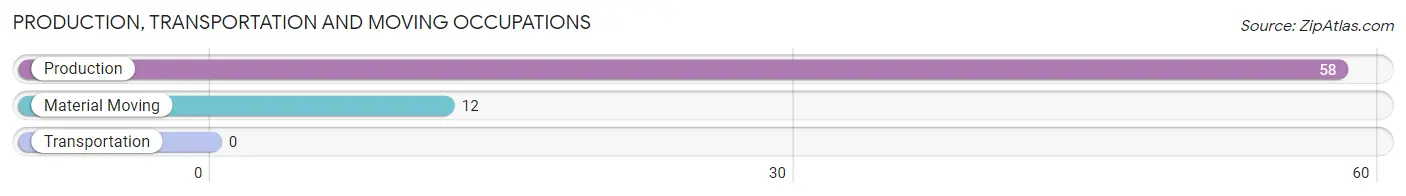
Production, Transportation and Moving Occupations by Sex
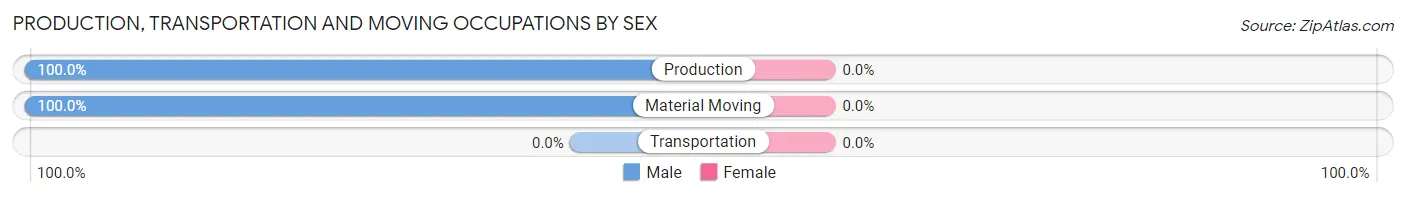
| Occupation | Male | Female |
| Production | 58 (100.0%) | 0 (0.0%) |
| Transportation | 0 (0.0%) | 0 (0.0%) |
| Material Moving | 12 (100.0%) | 0 (0.0%) |
| Total (Category) | 70 (100.0%) | 0 (0.0%) |
| Total (Overall) | 101 (66.0%) | 52 (34.0%) |
Employment Industries by Sex in East Liberty
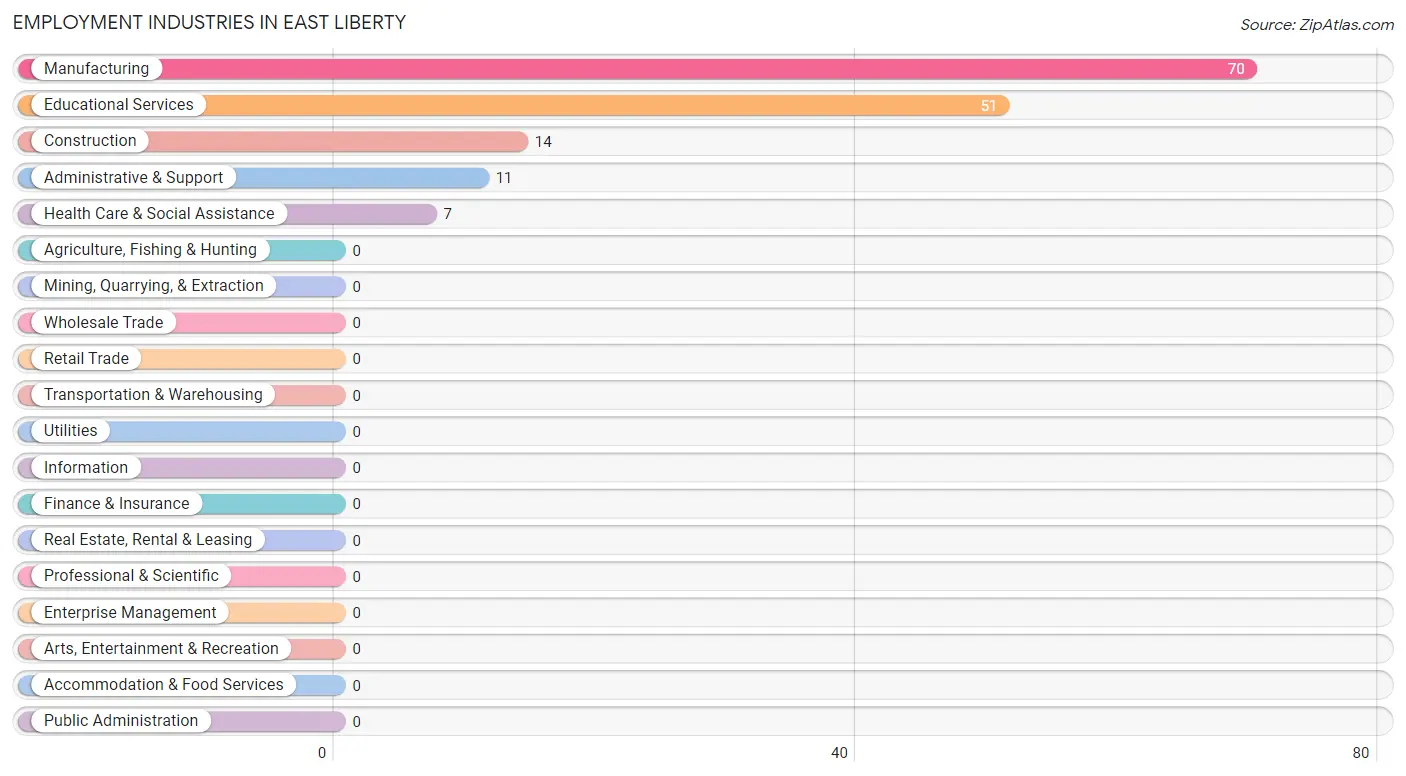
Employment Industries in East Liberty
The major employment industries in East Liberty include Manufacturing (70 | 45.8%), Educational Services (51 | 33.3%), Construction (14 | 9.1%), Administrative & Support (11 | 7.2%), and Health Care & Social Assistance (7 | 4.6%).
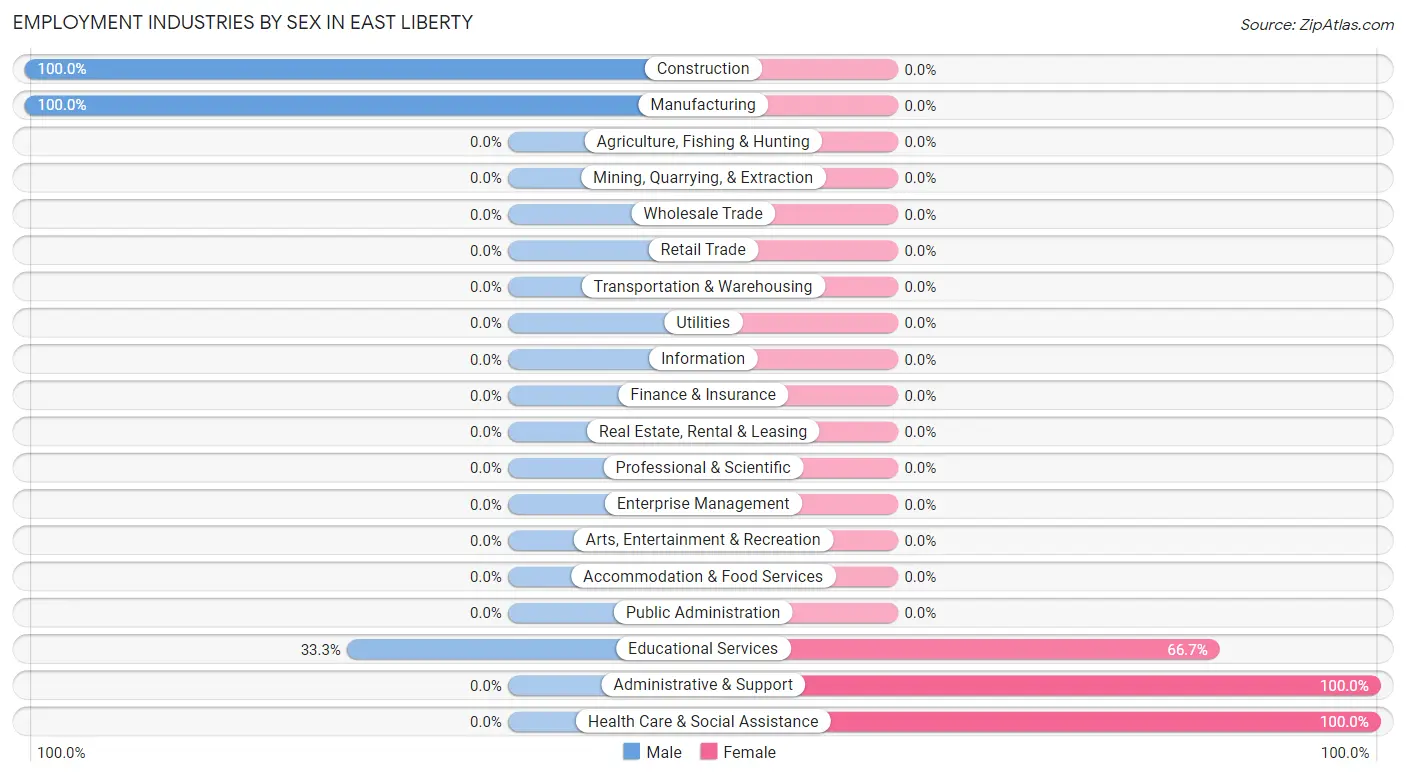
Employment Industries by Sex in East Liberty
The East Liberty industries that see more men than women are Construction (100.0%), Manufacturing (100.0%), and Educational Services (33.3%), whereas the industries that tend to have a higher number of women are Administrative & Support (100.0%), Health Care & Social Assistance (100.0%), and Educational Services (66.7%).
| Industry | Male | Female |
| Agriculture, Fishing & Hunting | 0 (0.0%) | 0 (0.0%) |
| Mining, Quarrying, & Extraction | 0 (0.0%) | 0 (0.0%) |
| Construction | 14 (100.0%) | 0 (0.0%) |
| Manufacturing | 70 (100.0%) | 0 (0.0%) |
| Wholesale Trade | 0 (0.0%) | 0 (0.0%) |
| Retail Trade | 0 (0.0%) | 0 (0.0%) |
| Transportation & Warehousing | 0 (0.0%) | 0 (0.0%) |
| Utilities | 0 (0.0%) | 0 (0.0%) |
| Information | 0 (0.0%) | 0 (0.0%) |
| Finance & Insurance | 0 (0.0%) | 0 (0.0%) |
| Real Estate, Rental & Leasing | 0 (0.0%) | 0 (0.0%) |
| Professional & Scientific | 0 (0.0%) | 0 (0.0%) |
| Enterprise Management | 0 (0.0%) | 0 (0.0%) |
| Administrative & Support | 0 (0.0%) | 11 (100.0%) |
| Educational Services | 17 (33.3%) | 34 (66.7%) |
| Health Care & Social Assistance | 0 (0.0%) | 7 (100.0%) |
| Arts, Entertainment & Recreation | 0 (0.0%) | 0 (0.0%) |
| Accommodation & Food Services | 0 (0.0%) | 0 (0.0%) |
| Public Administration | 0 (0.0%) | 0 (0.0%) |
| Total | 101 (66.0%) | 52 (34.0%) |
Education in East Liberty
School Enrollment in East Liberty
The most common levels of schooling among the 26 students in East Liberty are high school (14 | 53.8%), and kindergarten (12 | 46.2%).
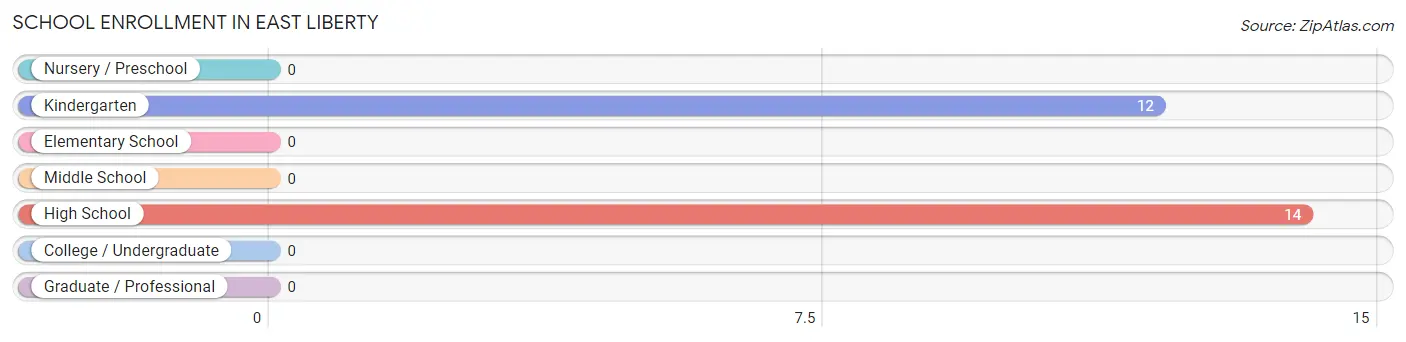
| School Level | # Students | % Students |
| Nursery / Preschool | 0 | 0.0% |
| Kindergarten | 12 | 46.2% |
| Elementary School | 0 | 0.0% |
| Middle School | 0 | 0.0% |
| High School | 14 | 53.8% |
| College / Undergraduate | 0 | 0.0% |
| Graduate / Professional | 0 | 0.0% |
| Total | 26 | 100.0% |
School Enrollment by Age by Funding Source in East Liberty
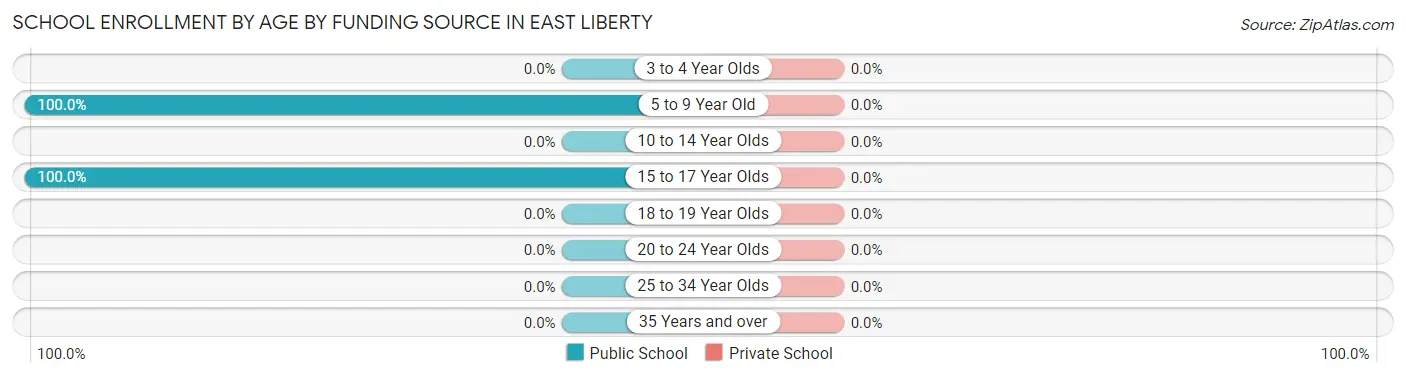
| Age Bracket | Public School | Private School |
| 3 to 4 Year Olds | 0 (0.0%) | 0 (0.0%) |
| 5 to 9 Year Old | 12 (100.0%) | 0 (0.0%) |
| 10 to 14 Year Olds | 0 (0.0%) | 0 (0.0%) |
| 15 to 17 Year Olds | 14 (100.0%) | 0 (0.0%) |
| 18 to 19 Year Olds | 0 (0.0%) | 0 (0.0%) |
| 20 to 24 Year Olds | 0 (0.0%) | 0 (0.0%) |
| 25 to 34 Year Olds | 0 (0.0%) | 0 (0.0%) |
| 35 Years and over | 0 (0.0%) | 0 (0.0%) |
| Total | 26 (100.0%) | 0 (0.0%) |
Educational Attainment by Field of Study in East Liberty
Business (35 | 30.2%), education (34 | 29.3%), literature & languages (34 | 29.3%), and psychology (13 | 11.2%) are the most common fields of study among 116 individuals in East Liberty who have obtained a bachelor's degree or higher.
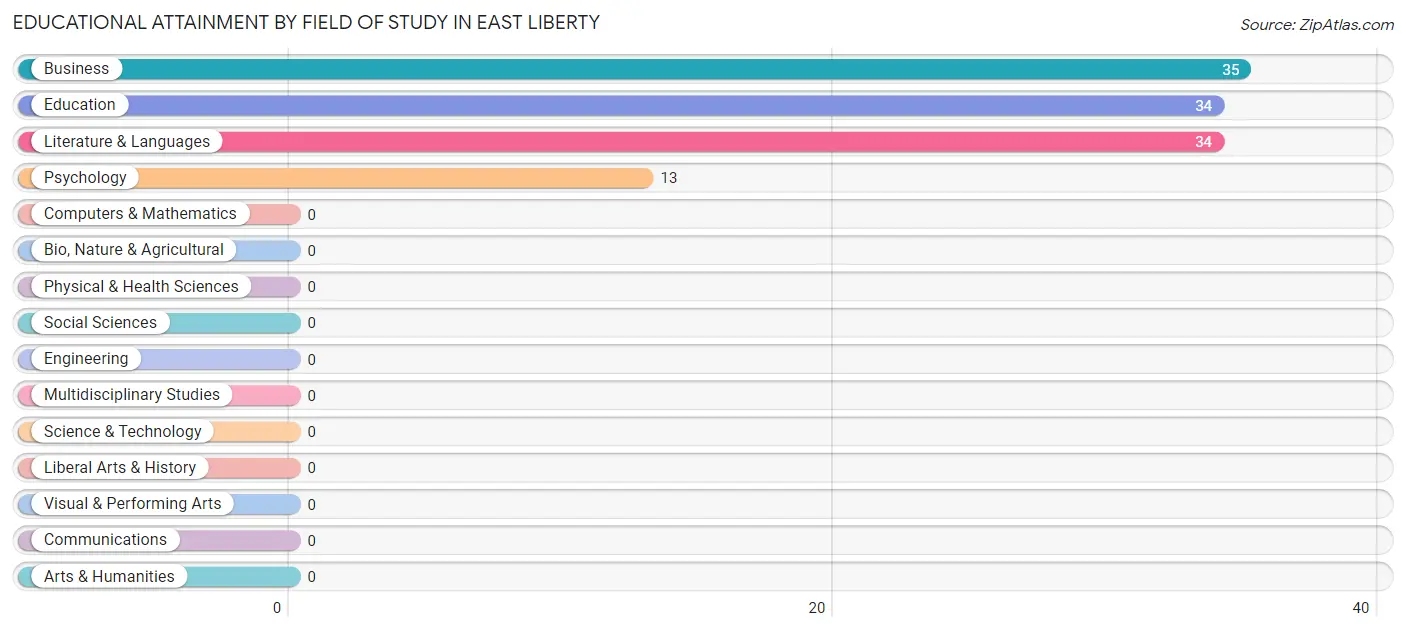
| Field of Study | # Graduates | % Graduates |
| Computers & Mathematics | 0 | 0.0% |
| Bio, Nature & Agricultural | 0 | 0.0% |
| Physical & Health Sciences | 0 | 0.0% |
| Psychology | 13 | 11.2% |
| Social Sciences | 0 | 0.0% |
| Engineering | 0 | 0.0% |
| Multidisciplinary Studies | 0 | 0.0% |
| Science & Technology | 0 | 0.0% |
| Business | 35 | 30.2% |
| Education | 34 | 29.3% |
| Literature & Languages | 34 | 29.3% |
| Liberal Arts & History | 0 | 0.0% |
| Visual & Performing Arts | 0 | 0.0% |
| Communications | 0 | 0.0% |
| Arts & Humanities | 0 | 0.0% |
| Total | 116 | 100.0% |
Transportation & Commute in East Liberty
Vehicle Availability by Sex in East Liberty
The most prevalent vehicle ownership categories in East Liberty are males with 3 vehicles (54, accounting for 53.5%) and females with 3 vehicles (41, making up 103.8%).
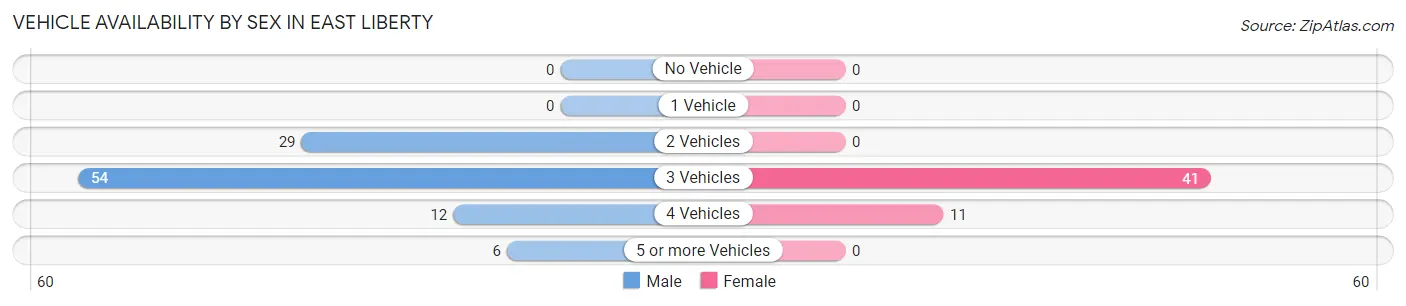
| Vehicles Available | Male | Female |
| No Vehicle | 0 (0.0%) | 0 (0.0%) |
| 1 Vehicle | 0 (0.0%) | 0 (0.0%) |
| 2 Vehicles | 29 (28.7%) | 0 (0.0%) |
| 3 Vehicles | 54 (53.5%) | 41 (78.8%) |
| 4 Vehicles | 12 (11.9%) | 11 (21.1%) |
| 5 or more Vehicles | 6 (5.9%) | 0 (0.0%) |
| Total | 101 (100.0%) | 52 (100.0%) |
Commute Time in East Liberty
The most frequently occuring commute durations in East Liberty are 15 to 19 minutes (73 commuters, 47.7%), less than 5 minutes (37 commuters, 24.2%), and 5 to 9 minutes (18 commuters, 11.8%).
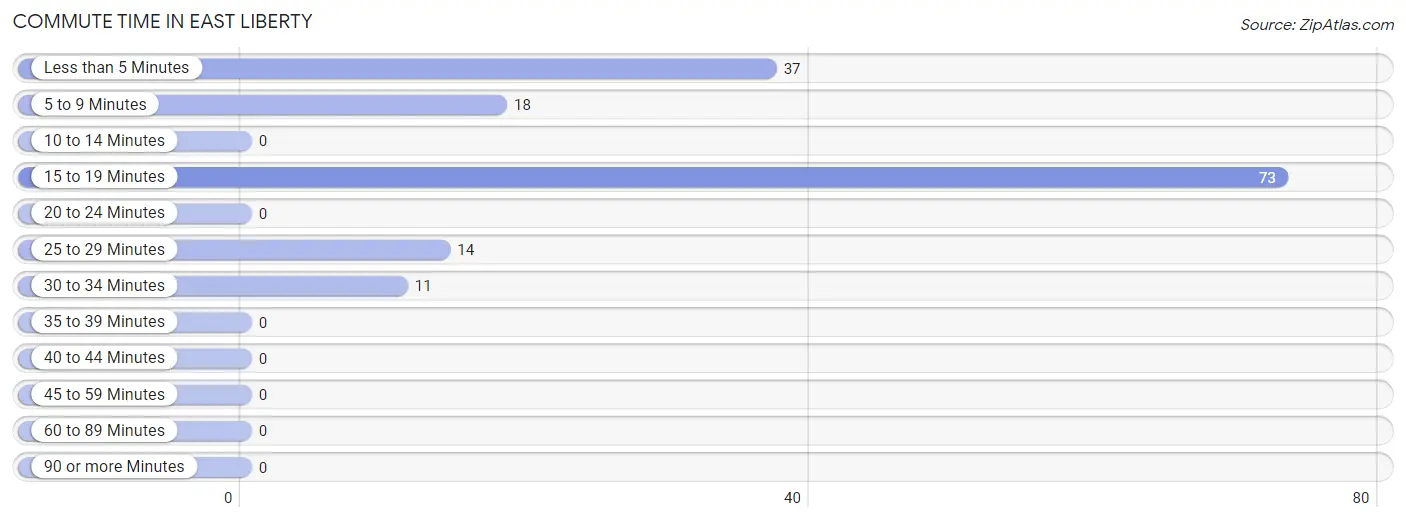
| Commute Time | # Commuters | % Commuters |
| Less than 5 Minutes | 37 | 24.2% |
| 5 to 9 Minutes | 18 | 11.8% |
| 10 to 14 Minutes | 0 | 0.0% |
| 15 to 19 Minutes | 73 | 47.7% |
| 20 to 24 Minutes | 0 | 0.0% |
| 25 to 29 Minutes | 14 | 9.1% |
| 30 to 34 Minutes | 11 | 7.2% |
| 35 to 39 Minutes | 0 | 0.0% |
| 40 to 44 Minutes | 0 | 0.0% |
| 45 to 59 Minutes | 0 | 0.0% |
| 60 to 89 Minutes | 0 | 0.0% |
| 90 or more Minutes | 0 | 0.0% |
Commute Time by Sex in East Liberty
The most common commute times in East Liberty are less than 5 minutes (37 commuters, 36.6%) for males and 15 to 19 minutes (41 commuters, 78.8%) for females.
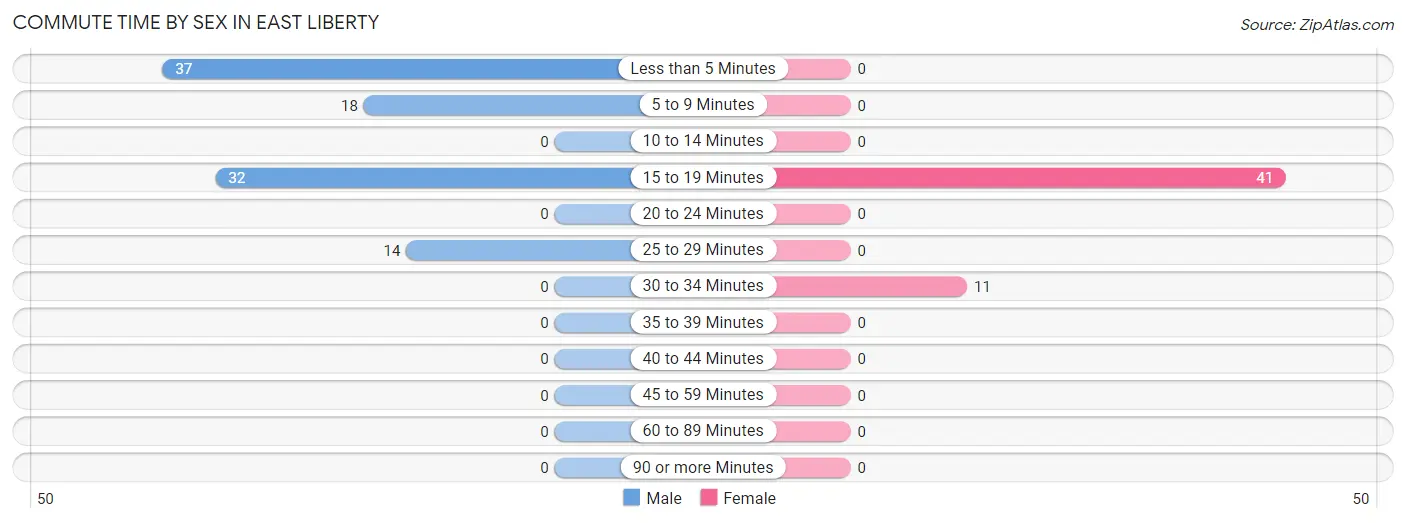
| Commute Time | Male | Female |
| Less than 5 Minutes | 37 (36.6%) | 0 (0.0%) |
| 5 to 9 Minutes | 18 (17.8%) | 0 (0.0%) |
| 10 to 14 Minutes | 0 (0.0%) | 0 (0.0%) |
| 15 to 19 Minutes | 32 (31.7%) | 41 (78.8%) |
| 20 to 24 Minutes | 0 (0.0%) | 0 (0.0%) |
| 25 to 29 Minutes | 14 (13.9%) | 0 (0.0%) |
| 30 to 34 Minutes | 0 (0.0%) | 11 (21.1%) |
| 35 to 39 Minutes | 0 (0.0%) | 0 (0.0%) |
| 40 to 44 Minutes | 0 (0.0%) | 0 (0.0%) |
| 45 to 59 Minutes | 0 (0.0%) | 0 (0.0%) |
| 60 to 89 Minutes | 0 (0.0%) | 0 (0.0%) |
| 90 or more Minutes | 0 (0.0%) | 0 (0.0%) |
Time of Departure to Work by Sex in East Liberty
The most frequent times of departure to work in East Liberty are 7:30 AM to 7:59 AM (37, 36.6%) for males and 7:00 AM to 7:29 AM (41, 78.8%) for females.
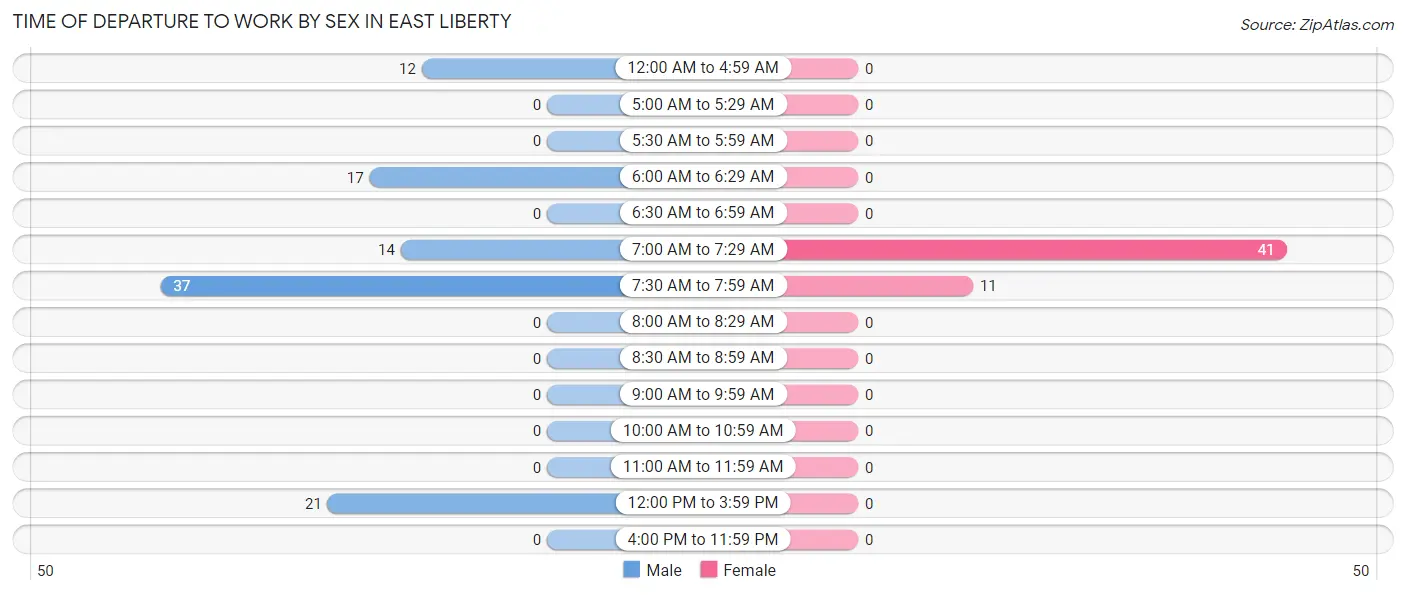
| Time of Departure | Male | Female |
| 12:00 AM to 4:59 AM | 12 (11.9%) | 0 (0.0%) |
| 5:00 AM to 5:29 AM | 0 (0.0%) | 0 (0.0%) |
| 5:30 AM to 5:59 AM | 0 (0.0%) | 0 (0.0%) |
| 6:00 AM to 6:29 AM | 17 (16.8%) | 0 (0.0%) |
| 6:30 AM to 6:59 AM | 0 (0.0%) | 0 (0.0%) |
| 7:00 AM to 7:29 AM | 14 (13.9%) | 41 (78.8%) |
| 7:30 AM to 7:59 AM | 37 (36.6%) | 11 (21.1%) |
| 8:00 AM to 8:29 AM | 0 (0.0%) | 0 (0.0%) |
| 8:30 AM to 8:59 AM | 0 (0.0%) | 0 (0.0%) |
| 9:00 AM to 9:59 AM | 0 (0.0%) | 0 (0.0%) |
| 10:00 AM to 10:59 AM | 0 (0.0%) | 0 (0.0%) |
| 11:00 AM to 11:59 AM | 0 (0.0%) | 0 (0.0%) |
| 12:00 PM to 3:59 PM | 21 (20.8%) | 0 (0.0%) |
| 4:00 PM to 11:59 PM | 0 (0.0%) | 0 (0.0%) |
| Total | 101 (100.0%) | 52 (100.0%) |
Housing Occupancy in East Liberty
Occupancy by Ownership in East Liberty
Of the total 185 dwellings in East Liberty, owner-occupied units account for 179 (96.8%), while renter-occupied units make up 6 (3.2%).
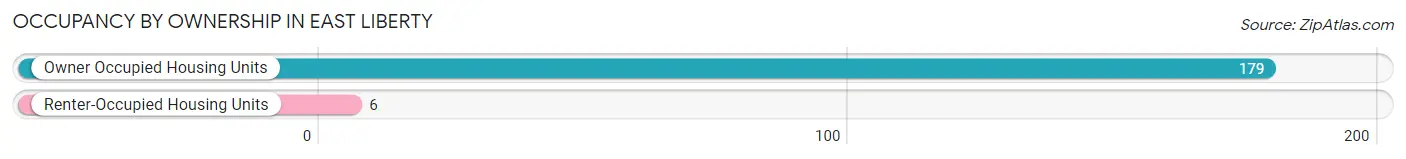
| Occupancy | # Housing Units | % Housing Units |
| Owner Occupied Housing Units | 179 | 96.8% |
| Renter-Occupied Housing Units | 6 | 3.2% |
| Total Occupied Housing Units | 185 | 100.0% |
Occupancy by Household Size in East Liberty
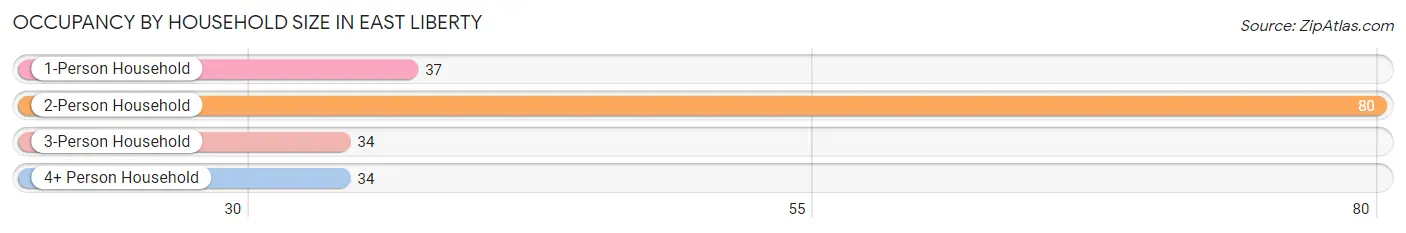
| Household Size | # Housing Units | % Housing Units |
| 1-Person Household | 37 | 20.0% |
| 2-Person Household | 80 | 43.2% |
| 3-Person Household | 34 | 18.4% |
| 4+ Person Household | 34 | 18.4% |
| Total Housing Units | 185 | 100.0% |
Occupancy by Ownership by Household Size in East Liberty
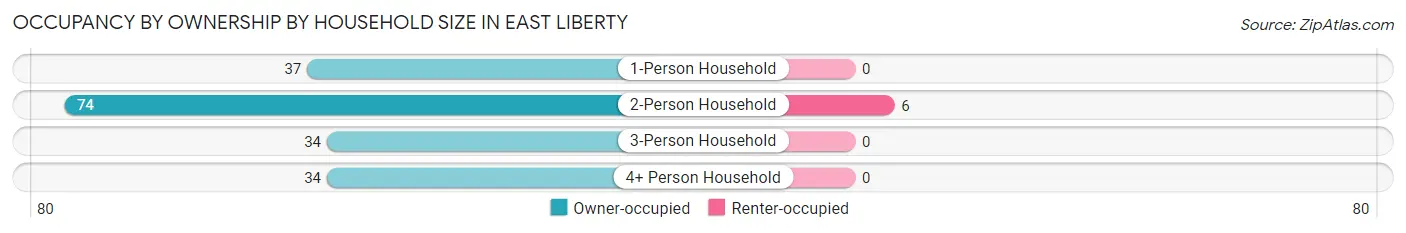
| Household Size | Owner-occupied | Renter-occupied |
| 1-Person Household | 37 (100.0%) | 0 (0.0%) |
| 2-Person Household | 74 (92.5%) | 6 (7.5%) |
| 3-Person Household | 34 (100.0%) | 0 (0.0%) |
| 4+ Person Household | 34 (100.0%) | 0 (0.0%) |
| Total Housing Units | 179 (96.8%) | 6 (3.2%) |
Occupancy by Educational Attainment in East Liberty
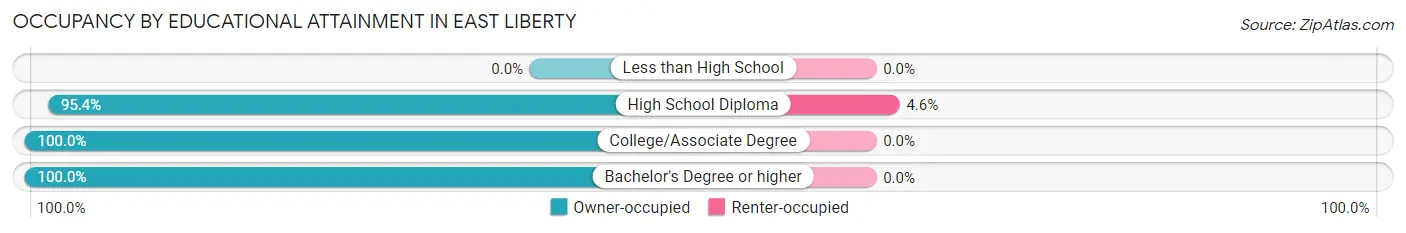
| Household Size | Owner-occupied | Renter-occupied |
| Less than High School | 0 (0.0%) | 0 (0.0%) |
| High School Diploma | 124 (95.4%) | 6 (4.6%) |
| College/Associate Degree | 21 (100.0%) | 0 (0.0%) |
| Bachelor's Degree or higher | 34 (100.0%) | 0 (0.0%) |
Occupancy by Age of Householder in East Liberty
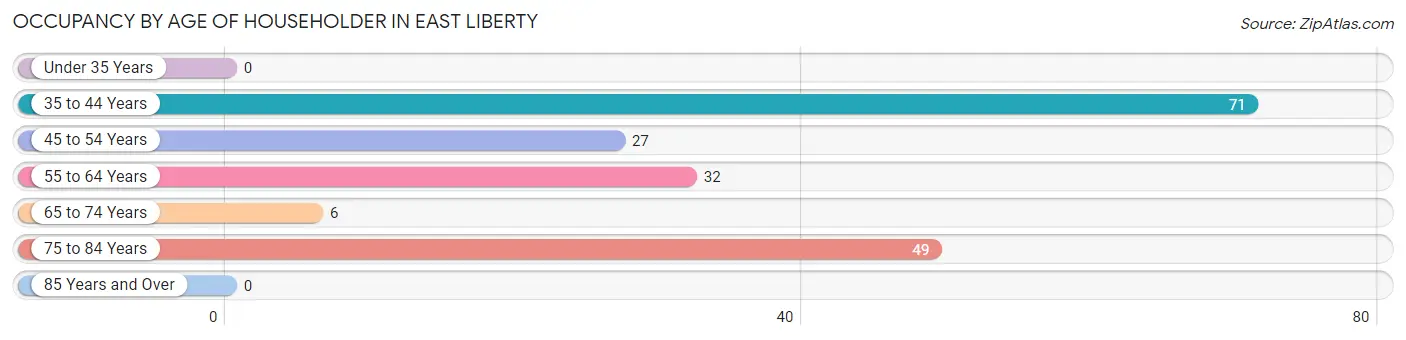
| Age Bracket | # Households | % Households |
| Under 35 Years | 0 | 0.0% |
| 35 to 44 Years | 71 | 38.4% |
| 45 to 54 Years | 27 | 14.6% |
| 55 to 64 Years | 32 | 17.3% |
| 65 to 74 Years | 6 | 3.2% |
| 75 to 84 Years | 49 | 26.5% |
| 85 Years and Over | 0 | 0.0% |
| Total | 185 | 100.0% |
Housing Finances in East Liberty
Median Income by Occupancy in East Liberty
| Occupancy Type | # Households | Median Income |
| Owner-Occupied | 179 (96.8%) | $0 |
| Renter-Occupied | 6 (3.2%) | $0 |
| Average | 185 (100.0%) | $0 |
Occupancy by Householder Income Bracket in East Liberty
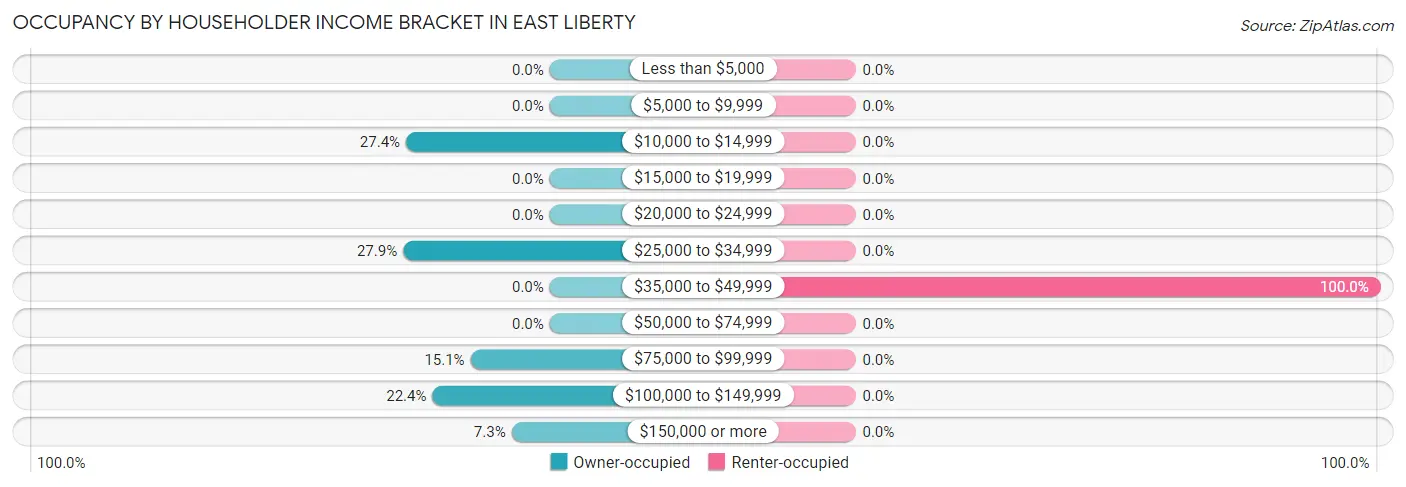
| Income Bracket | Owner-occupied | Renter-occupied |
| Less than $5,000 | 0 (0.0%) | 0 (0.0%) |
| $5,000 to $9,999 | 0 (0.0%) | 0 (0.0%) |
| $10,000 to $14,999 | 49 (27.4%) | 0 (0.0%) |
| $15,000 to $19,999 | 0 (0.0%) | 0 (0.0%) |
| $20,000 to $24,999 | 0 (0.0%) | 0 (0.0%) |
| $25,000 to $34,999 | 50 (27.9%) | 0 (0.0%) |
| $35,000 to $49,999 | 0 (0.0%) | 6 (100.0%) |
| $50,000 to $74,999 | 0 (0.0%) | 0 (0.0%) |
| $75,000 to $99,999 | 27 (15.1%) | 0 (0.0%) |
| $100,000 to $149,999 | 40 (22.4%) | 0 (0.0%) |
| $150,000 or more | 13 (7.3%) | 0 (0.0%) |
| Total | 179 (100.0%) | 6 (100.0%) |
Monthly Housing Cost Tiers in East Liberty
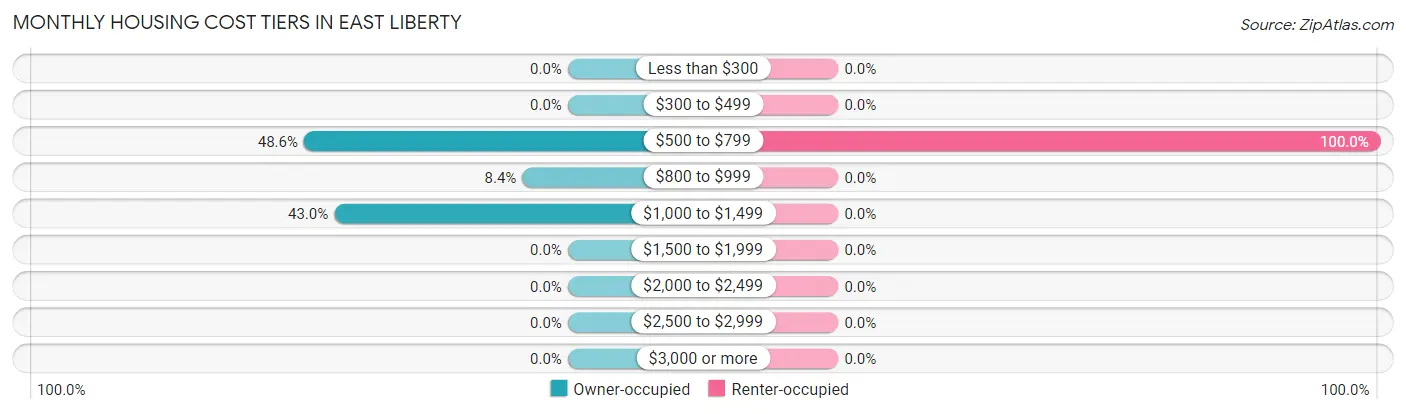
| Monthly Cost | Owner-occupied | Renter-occupied |
| Less than $300 | 0 (0.0%) | 0 (0.0%) |
| $300 to $499 | 0 (0.0%) | 0 (0.0%) |
| $500 to $799 | 87 (48.6%) | 6 (100.0%) |
| $800 to $999 | 15 (8.4%) | 0 (0.0%) |
| $1,000 to $1,499 | 77 (43.0%) | 0 (0.0%) |
| $1,500 to $1,999 | 0 (0.0%) | 0 (0.0%) |
| $2,000 to $2,499 | 0 (0.0%) | 0 (0.0%) |
| $2,500 to $2,999 | 0 (0.0%) | 0 (0.0%) |
| $3,000 or more | 0 (0.0%) | 0 (0.0%) |
| Total | 179 (100.0%) | 6 (100.0%) |
Physical Housing Characteristics in East Liberty
Housing Structures in East Liberty
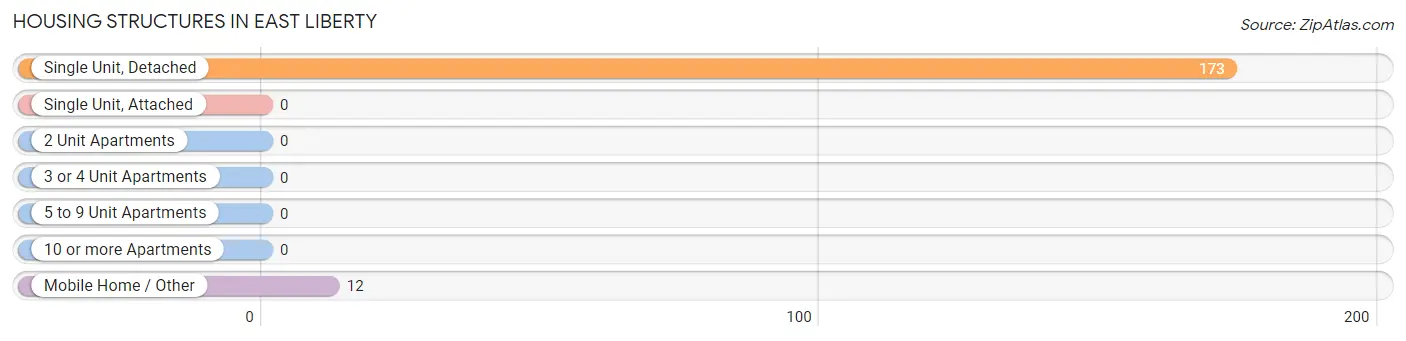
| Structure Type | # Housing Units | % Housing Units |
| Single Unit, Detached | 173 | 93.5% |
| Single Unit, Attached | 0 | 0.0% |
| 2 Unit Apartments | 0 | 0.0% |
| 3 or 4 Unit Apartments | 0 | 0.0% |
| 5 to 9 Unit Apartments | 0 | 0.0% |
| 10 or more Apartments | 0 | 0.0% |
| Mobile Home / Other | 12 | 6.5% |
| Total | 185 | 100.0% |
Housing Structures by Occupancy in East Liberty
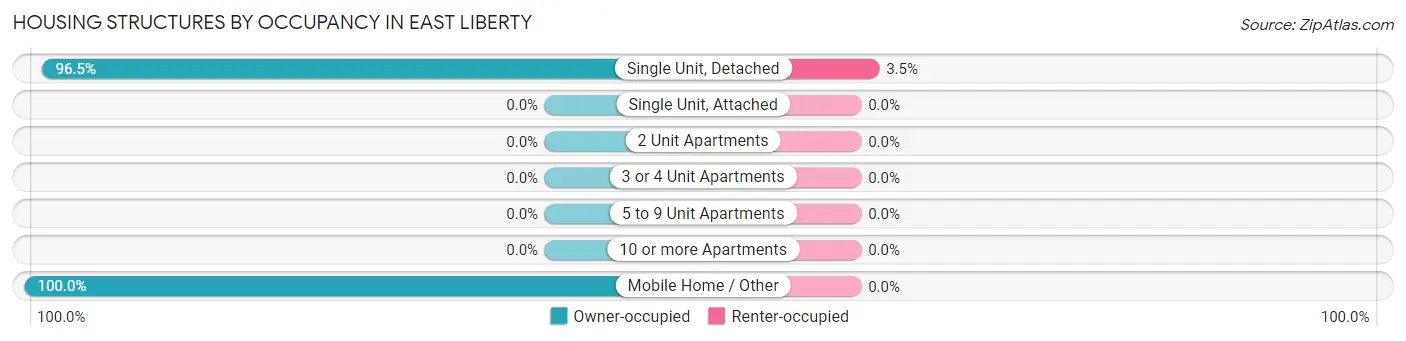
| Structure Type | Owner-occupied | Renter-occupied |
| Single Unit, Detached | 167 (96.5%) | 6 (3.5%) |
| Single Unit, Attached | 0 (0.0%) | 0 (0.0%) |
| 2 Unit Apartments | 0 (0.0%) | 0 (0.0%) |
| 3 or 4 Unit Apartments | 0 (0.0%) | 0 (0.0%) |
| 5 to 9 Unit Apartments | 0 (0.0%) | 0 (0.0%) |
| 10 or more Apartments | 0 (0.0%) | 0 (0.0%) |
| Mobile Home / Other | 12 (100.0%) | 0 (0.0%) |
| Total | 179 (96.8%) | 6 (3.2%) |
Housing Structures by Number of Rooms in East Liberty
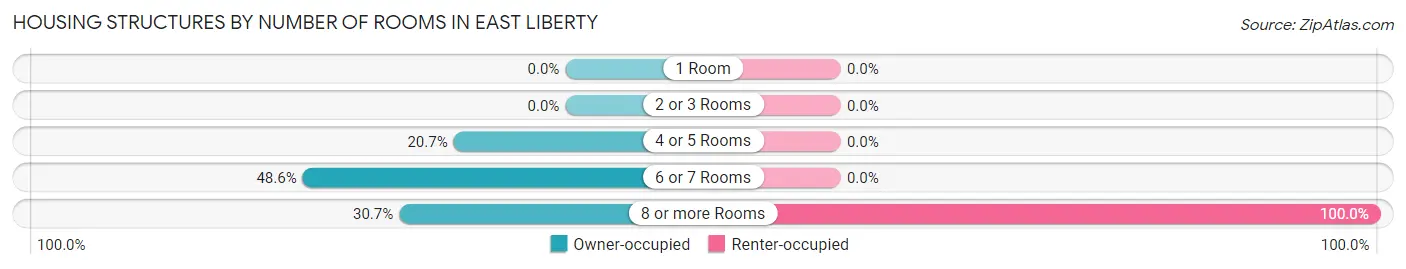
| Number of Rooms | Owner-occupied | Renter-occupied |
| 1 Room | 0 (0.0%) | 0 (0.0%) |
| 2 or 3 Rooms | 0 (0.0%) | 0 (0.0%) |
| 4 or 5 Rooms | 37 (20.7%) | 0 (0.0%) |
| 6 or 7 Rooms | 87 (48.6%) | 0 (0.0%) |
| 8 or more Rooms | 55 (30.7%) | 6 (100.0%) |
| Total | 179 (100.0%) | 6 (100.0%) |
Housing Structure by Heating Type in East Liberty
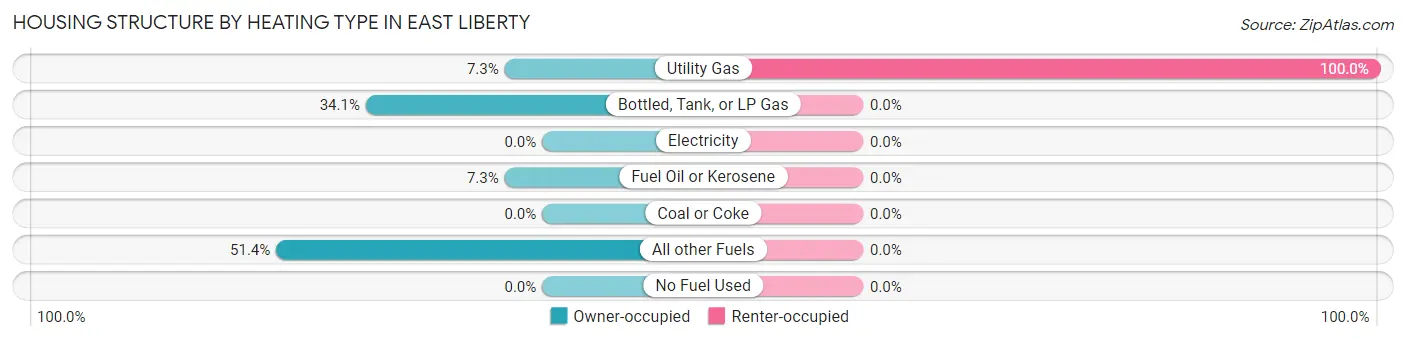
| Heating Type | Owner-occupied | Renter-occupied |
| Utility Gas | 13 (7.3%) | 6 (100.0%) |
| Bottled, Tank, or LP Gas | 61 (34.1%) | 0 (0.0%) |
| Electricity | 0 (0.0%) | 0 (0.0%) |
| Fuel Oil or Kerosene | 13 (7.3%) | 0 (0.0%) |
| Coal or Coke | 0 (0.0%) | 0 (0.0%) |
| All other Fuels | 92 (51.4%) | 0 (0.0%) |
| No Fuel Used | 0 (0.0%) | 0 (0.0%) |
| Total | 179 (100.0%) | 6 (100.0%) |
Household Vehicle Usage in East Liberty
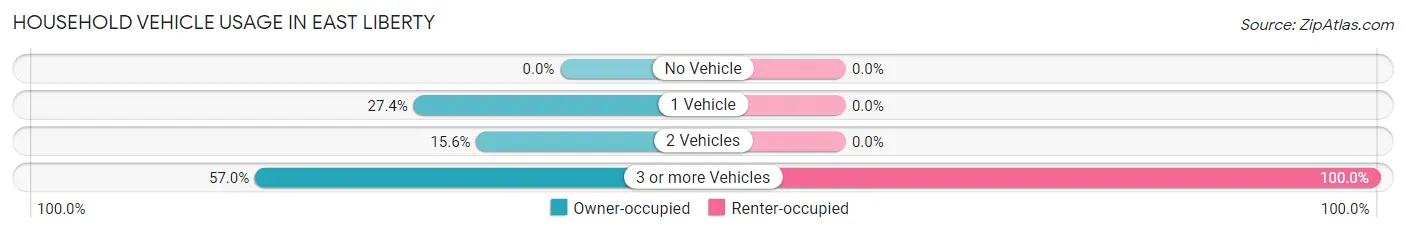
| Vehicles per Household | Owner-occupied | Renter-occupied |
| No Vehicle | 0 (0.0%) | 0 (0.0%) |
| 1 Vehicle | 49 (27.4%) | 0 (0.0%) |
| 2 Vehicles | 28 (15.6%) | 0 (0.0%) |
| 3 or more Vehicles | 102 (57.0%) | 6 (100.0%) |
| Total | 179 (100.0%) | 6 (100.0%) |
Real Estate & Mortgages in East Liberty
Real Estate and Mortgage Overview in East Liberty
| Characteristic | Without Mortgage | With Mortgage |
| Housing Units | 74 | 105 |
| Median Property Value | $262,200 | $275,000 |
| Median Household Income | - | - |
| Monthly Housing Costs | $724 | $0 |
| Real Estate Taxes | $2,245 | $0 |
Property Value by Mortgage Status in East Liberty

| Property Value | Without Mortgage | With Mortgage |
| Less than $50,000 | 12 (16.2%) | 0 (0.0%) |
| $50,000 to $99,999 | 0 (0.0%) | 13 (12.4%) |
| $100,000 to $299,999 | 62 (83.8%) | 58 (55.2%) |
| $300,000 to $499,999 | 0 (0.0%) | 34 (32.4%) |
| $500,000 to $749,999 | 0 (0.0%) | 0 (0.0%) |
| $750,000 to $999,999 | 0 (0.0%) | 0 (0.0%) |
| $1,000,000 or more | 0 (0.0%) | 0 (0.0%) |
| Total | 74 (100.0%) | 105 (100.0%) |
Household Income by Mortgage Status in East Liberty
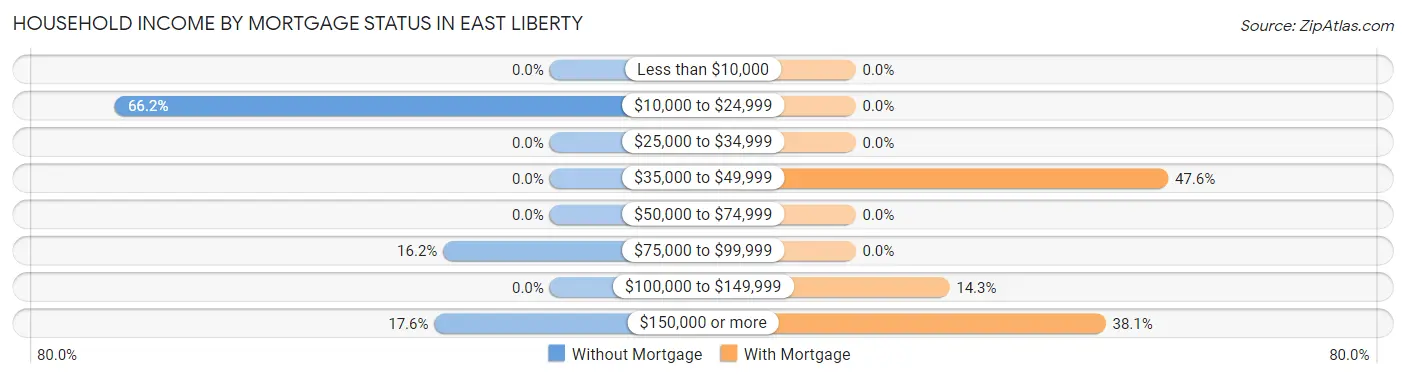
| Household Income | Without Mortgage | With Mortgage |
| Less than $10,000 | 0 (0.0%) | 0 (0.0%) |
| $10,000 to $24,999 | 49 (66.2%) | 0 (0.0%) |
| $25,000 to $34,999 | 0 (0.0%) | 0 (0.0%) |
| $35,000 to $49,999 | 0 (0.0%) | 50 (47.6%) |
| $50,000 to $74,999 | 0 (0.0%) | 0 (0.0%) |
| $75,000 to $99,999 | 12 (16.2%) | 0 (0.0%) |
| $100,000 to $149,999 | 0 (0.0%) | 15 (14.3%) |
| $150,000 or more | 13 (17.6%) | 40 (38.1%) |
| Total | 74 (100.0%) | 105 (100.0%) |
Property Value to Household Income Ratio in East Liberty
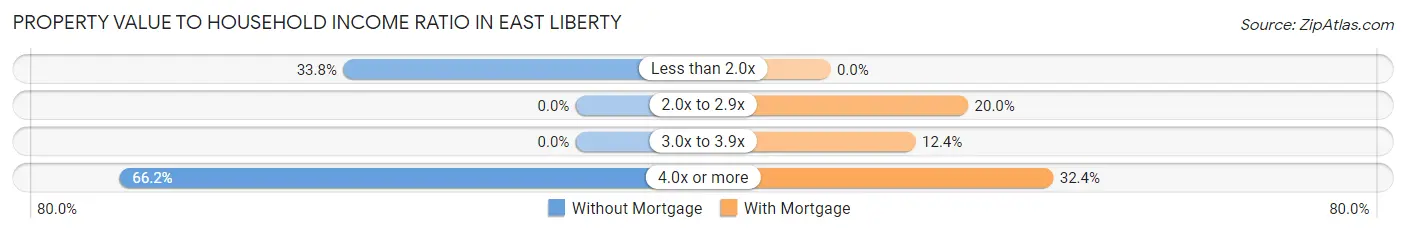
| Value-to-Income Ratio | Without Mortgage | With Mortgage |
| Less than 2.0x | 25 (33.8%) | 0 (0.0%) |
| 2.0x to 2.9x | 0 (0.0%) | 21 (20.0%) |
| 3.0x to 3.9x | 0 (0.0%) | 13 (12.4%) |
| 4.0x or more | 49 (66.2%) | 34 (32.4%) |
| Total | 74 (100.0%) | 105 (100.0%) |
Real Estate Taxes by Mortgage Status in East Liberty
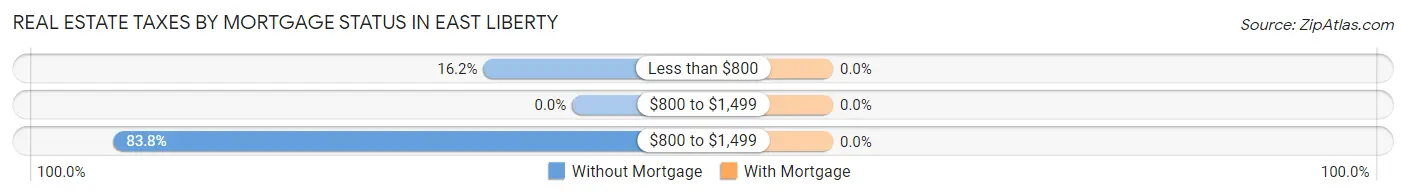
| Property Taxes | Without Mortgage | With Mortgage |
| Less than $800 | 12 (16.2%) | 0 (0.0%) |
| $800 to $1,499 | 0 (0.0%) | 0 (0.0%) |
| $800 to $1,499 | 62 (83.8%) | 0 (0.0%) |
| Total | 74 (100.0%) | 105 (100.0%) |
Health & Disability in East Liberty
Health Insurance Coverage by Age in East Liberty
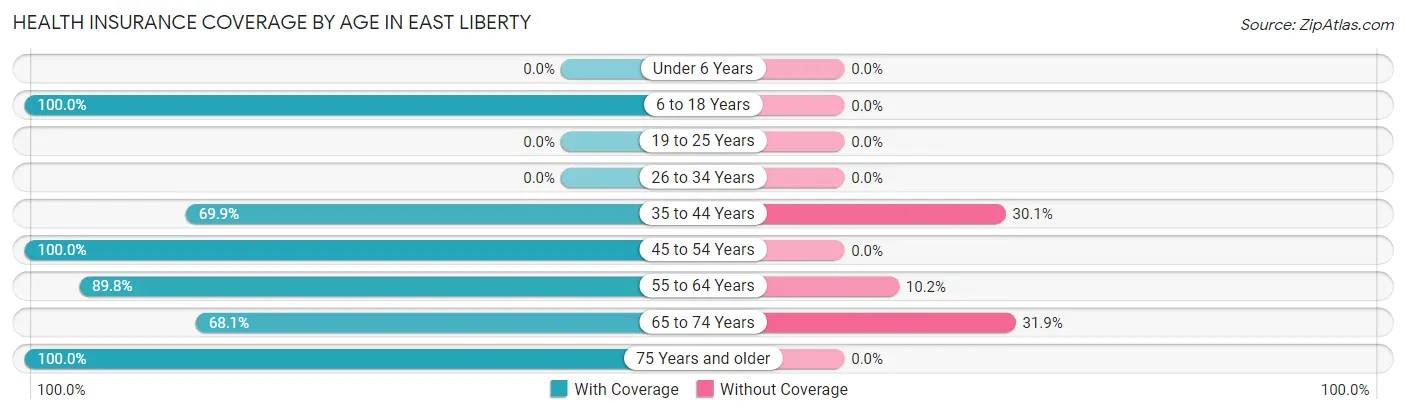
| Age Bracket | With Coverage | Without Coverage |
| Under 6 Years | 0 (0.0%) | 0 (0.0%) |
| 6 to 18 Years | 26 (100.0%) | 0 (0.0%) |
| 19 to 25 Years | 0 (0.0%) | 0 (0.0%) |
| 26 to 34 Years | 0 (0.0%) | 0 (0.0%) |
| 35 to 44 Years | 86 (69.9%) | 37 (30.1%) |
| 45 to 54 Years | 55 (100.0%) | 0 (0.0%) |
| 55 to 64 Years | 53 (89.8%) | 6 (10.2%) |
| 65 to 74 Years | 49 (68.1%) | 23 (31.9%) |
| 75 Years and older | 69 (100.0%) | 0 (0.0%) |
| Total | 338 (83.7%) | 66 (16.3%) |
Health Insurance Coverage by Citizenship Status in East Liberty
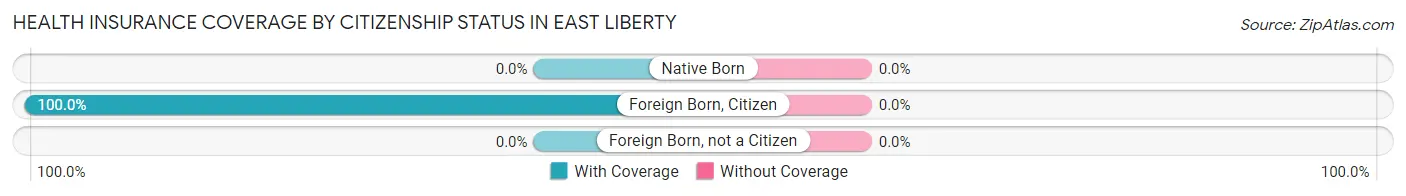
| Citizenship Status | With Coverage | Without Coverage |
| Native Born | 0 (0.0%) | 0 (0.0%) |
| Foreign Born, Citizen | 26 (100.0%) | 0 (0.0%) |
| Foreign Born, not a Citizen | 0 (0.0%) | 0 (0.0%) |
Health Insurance Coverage by Household Income in East Liberty
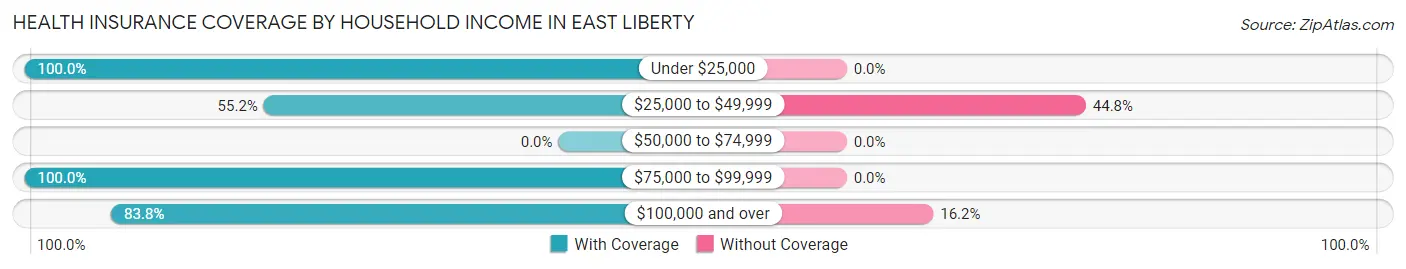
| Household Income | With Coverage | Without Coverage |
| Under $25,000 | 84 (100.0%) | 0 (0.0%) |
| $25,000 to $49,999 | 53 (55.2%) | 43 (44.8%) |
| $50,000 to $74,999 | 0 (0.0%) | 0 (0.0%) |
| $75,000 to $99,999 | 82 (100.0%) | 0 (0.0%) |
| $100,000 and over | 119 (83.8%) | 23 (16.2%) |
Public vs Private Health Insurance Coverage by Age in East Liberty
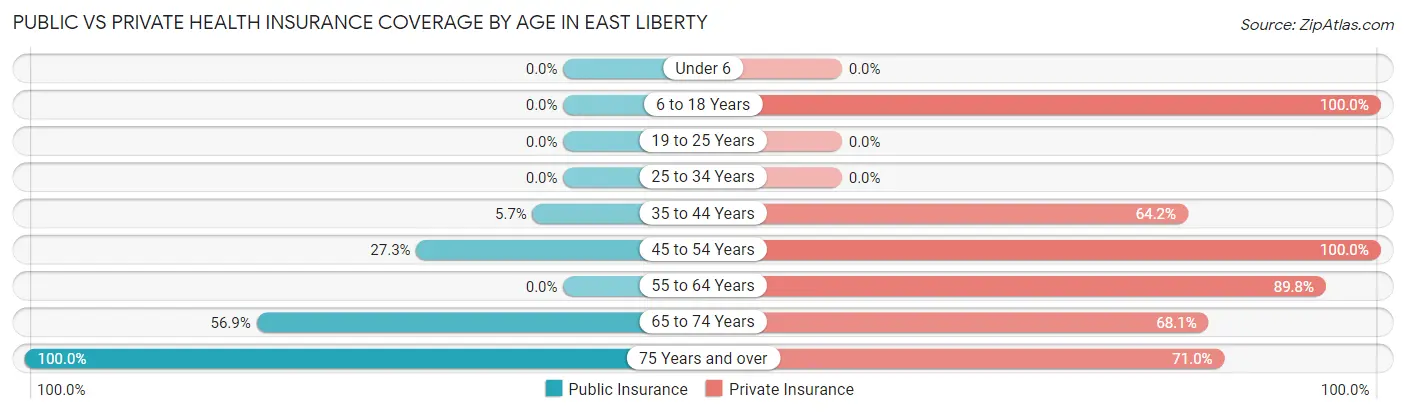
| Age Bracket | Public Insurance | Private Insurance |
| Under 6 | 0 (0.0%) | 0 (0.0%) |
| 6 to 18 Years | 0 (0.0%) | 26 (100.0%) |
| 19 to 25 Years | 0 (0.0%) | 0 (0.0%) |
| 25 to 34 Years | 0 (0.0%) | 0 (0.0%) |
| 35 to 44 Years | 7 (5.7%) | 79 (64.2%) |
| 45 to 54 Years | 15 (27.3%) | 55 (100.0%) |
| 55 to 64 Years | 0 (0.0%) | 53 (89.8%) |
| 65 to 74 Years | 41 (56.9%) | 49 (68.1%) |
| 75 Years and over | 69 (100.0%) | 49 (71.0%) |
| Total | 132 (32.7%) | 311 (77.0%) |
Disability Status by Sex by Age in East Liberty
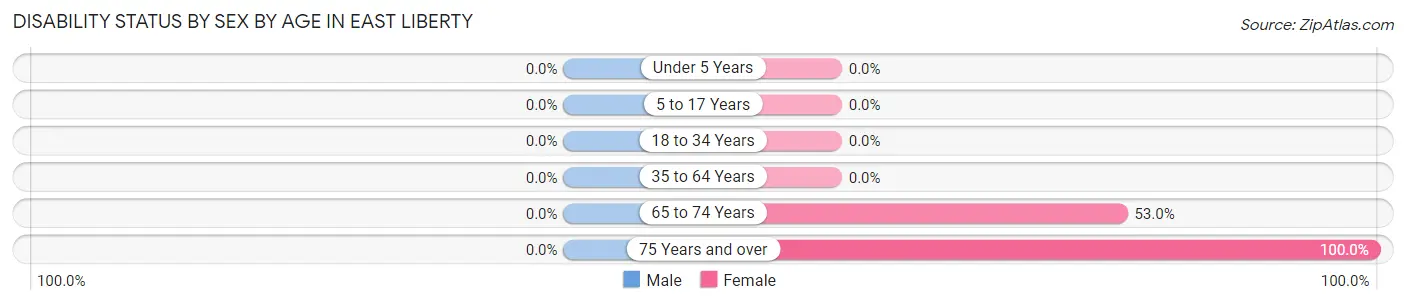
| Age Bracket | Male | Female |
| Under 5 Years | 0 (0.0%) | 0 (0.0%) |
| 5 to 17 Years | 0 (0.0%) | 0 (0.0%) |
| 18 to 34 Years | 0 (0.0%) | 0 (0.0%) |
| 35 to 64 Years | 0 (0.0%) | 0 (0.0%) |
| 65 to 74 Years | 0 (0.0%) | 35 (53.0%) |
| 75 Years and over | 0 (0.0%) | 20 (100.0%) |
Disability Class by Sex by Age in East Liberty
Disability Class: Hearing Difficulty
| Age Bracket | Male | Female |
| Under 5 Years | 0 (0.0%) | 0 (0.0%) |
| 5 to 17 Years | 0 (0.0%) | 0 (0.0%) |
| 18 to 34 Years | 0 (0.0%) | 0 (0.0%) |
| 35 to 64 Years | 0 (0.0%) | 0 (0.0%) |
| 65 to 74 Years | 0 (0.0%) | 0 (0.0%) |
| 75 Years and over | 0 (0.0%) | 0 (0.0%) |
Disability Class: Vision Difficulty
| Age Bracket | Male | Female |
| Under 5 Years | 0 (0.0%) | 0 (0.0%) |
| 5 to 17 Years | 0 (0.0%) | 0 (0.0%) |
| 18 to 34 Years | 0 (0.0%) | 0 (0.0%) |
| 35 to 64 Years | 0 (0.0%) | 0 (0.0%) |
| 65 to 74 Years | 0 (0.0%) | 0 (0.0%) |
| 75 Years and over | 0 (0.0%) | 0 (0.0%) |
Disability Class: Cognitive Difficulty
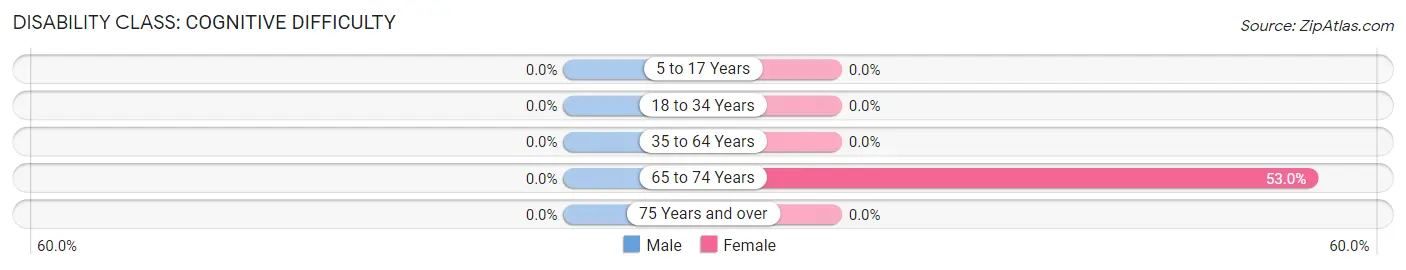
| Age Bracket | Male | Female |
| 5 to 17 Years | 0 (0.0%) | 0 (0.0%) |
| 18 to 34 Years | 0 (0.0%) | 0 (0.0%) |
| 35 to 64 Years | 0 (0.0%) | 0 (0.0%) |
| 65 to 74 Years | 0 (0.0%) | 35 (53.0%) |
| 75 Years and over | 0 (0.0%) | 0 (0.0%) |
Disability Class: Ambulatory Difficulty
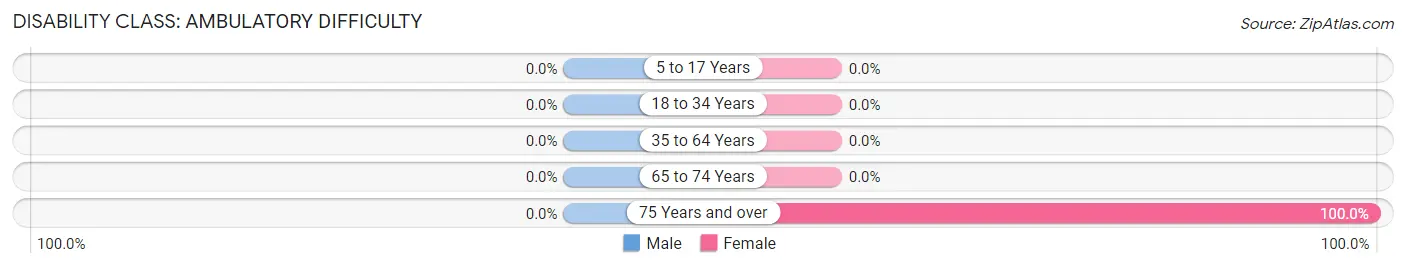
| Age Bracket | Male | Female |
| 5 to 17 Years | 0 (0.0%) | 0 (0.0%) |
| 18 to 34 Years | 0 (0.0%) | 0 (0.0%) |
| 35 to 64 Years | 0 (0.0%) | 0 (0.0%) |
| 65 to 74 Years | 0 (0.0%) | 0 (0.0%) |
| 75 Years and over | 0 (0.0%) | 20 (100.0%) |
Disability Class: Self-Care Difficulty
| Age Bracket | Male | Female |
| 5 to 17 Years | 0 (0.0%) | 0 (0.0%) |
| 18 to 34 Years | 0 (0.0%) | 0 (0.0%) |
| 35 to 64 Years | 0 (0.0%) | 0 (0.0%) |
| 65 to 74 Years | 0 (0.0%) | 0 (0.0%) |
| 75 Years and over | 0 (0.0%) | 0 (0.0%) |
Technology Access in East Liberty
Computing Device Access in East Liberty
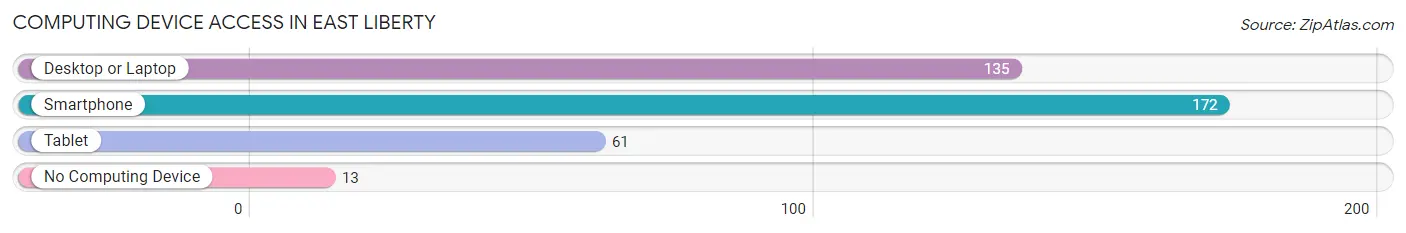
| Device Type | # Households | % Households |
| Desktop or Laptop | 135 | 73.0% |
| Smartphone | 172 | 93.0% |
| Tablet | 61 | 33.0% |
| No Computing Device | 13 | 7.0% |
| Total | 185 | 100.0% |
Internet Access in East Liberty
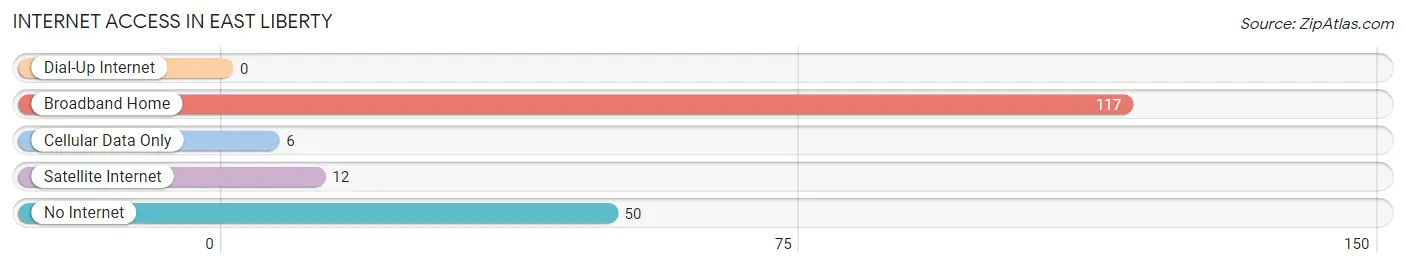
| Internet Type | # Households | % Households |
| Dial-Up Internet | 0 | 0.0% |
| Broadband Home | 117 | 63.2% |
| Cellular Data Only | 6 | 3.2% |
| Satellite Internet | 12 | 6.5% |
| No Internet | 50 | 27.0% |
| Total | 185 | 100.0% |
East Liberty Summary
History
East Liberty is a small village located in Logan County, Ohio. It is situated on the banks of the Mad River, approximately 10 miles east of Bellefontaine. The village was founded in 1837 by a group of settlers from Pennsylvania, who were looking for a place to settle and start a new life. The village was named after the Liberty Township, which was established in 1820.
The first settlers in East Liberty were mostly farmers, who grew corn, wheat, oats, and hay. They also raised livestock, such as cattle, sheep, and hogs. The village was also home to a few small businesses, such as a blacksmith shop, a general store, and a sawmill.
In the late 1800s, the village began to grow and prosper. The railroad came to East Liberty in 1881, which allowed for the transportation of goods and people. This helped to spur the growth of the village, as it allowed for the easy transportation of goods and people to and from the village.
The village continued to grow and prosper throughout the 20th century. In the 1950s, the village was home to a number of small businesses, such as a grocery store, a hardware store, and a barber shop. The village also had a post office, a bank, and a movie theater.
In the late 20th century, the village began to decline. Many of the businesses closed, and the population began to decline. In the early 2000s, the village was in danger of becoming a ghost town. However, in recent years, the village has seen a resurgence in population and businesses.
Geography
East Liberty is located in Logan County, Ohio. It is situated on the banks of the Mad River, approximately 10 miles east of Bellefontaine. The village is located in a rural area, surrounded by farmland and small towns. The village is located in the Central Lowland region of Ohio, which is characterized by rolling hills and flat plains.
The village is located in a humid continental climate zone, which is characterized by hot summers and cold winters. The average temperature in the summer is around 75 degrees Fahrenheit, and the average temperature in the winter is around 30 degrees Fahrenheit. The village receives an average of 40 inches of precipitation per year.
Economy
The economy of East Liberty is largely based on agriculture. The village is home to a number of farms, which produce corn, wheat, oats, and hay. The village is also home to a few small businesses, such as a grocery store, a hardware store, and a barber shop.
The village is also home to a few manufacturing companies, which produce a variety of products, such as furniture, clothing, and automotive parts. The village is also home to a few service-based businesses, such as a bank, a post office, and a movie theater.
Demographics
As of the 2010 census, the population of East Liberty was 1,093. The population is largely white (97.2%), with a small percentage of African Americans (1.2%) and Hispanics (1.6%). The median household income is $41,250, and the median age is 41.
The village is home to a number of churches, including the East Liberty United Methodist Church, the East Liberty Presbyterian Church, and the East Liberty Baptist Church. The village is also home to a few schools, including East Liberty Elementary School and East Liberty High School.
Common Questions
What is Per Capita Income in East Liberty?
Per Capita income in East Liberty is $29,347.
What is Inequality or Gini Index in East Liberty?
Inequality or Gini Index in East Liberty is 0.46.
What is the Total Population of East Liberty?
Total Population of East Liberty is 404.
What is the Total Male Population of East Liberty?
Total Male Population of East Liberty is 208.
What is the Total Female Population of East Liberty?
Total Female Population of East Liberty is 196.
What is the Ratio of Males per 100 Females in East Liberty?
There are 106.12 Males per 100 Females in East Liberty.
What is the Ratio of Females per 100 Males in East Liberty?
There are 94.23 Females per 100 Males in East Liberty.
What is the Median Population Age in East Liberty?
Median Population Age in East Liberty is 54.8 Years.
What is the Average Family Size in East Liberty
Average Family Size in East Liberty is 2.5 People.
What is the Average Household Size in East Liberty
Average Household Size in East Liberty is 2.2 People.
How Large is the Labor Force in East Liberty?
There are 153 People in the Labor Forcein in East Liberty.
What is the Percentage of People in the Labor Force in East Liberty?
39.0% of People are in the Labor Force in East Liberty.