Bourneville, OH Map & Demographics
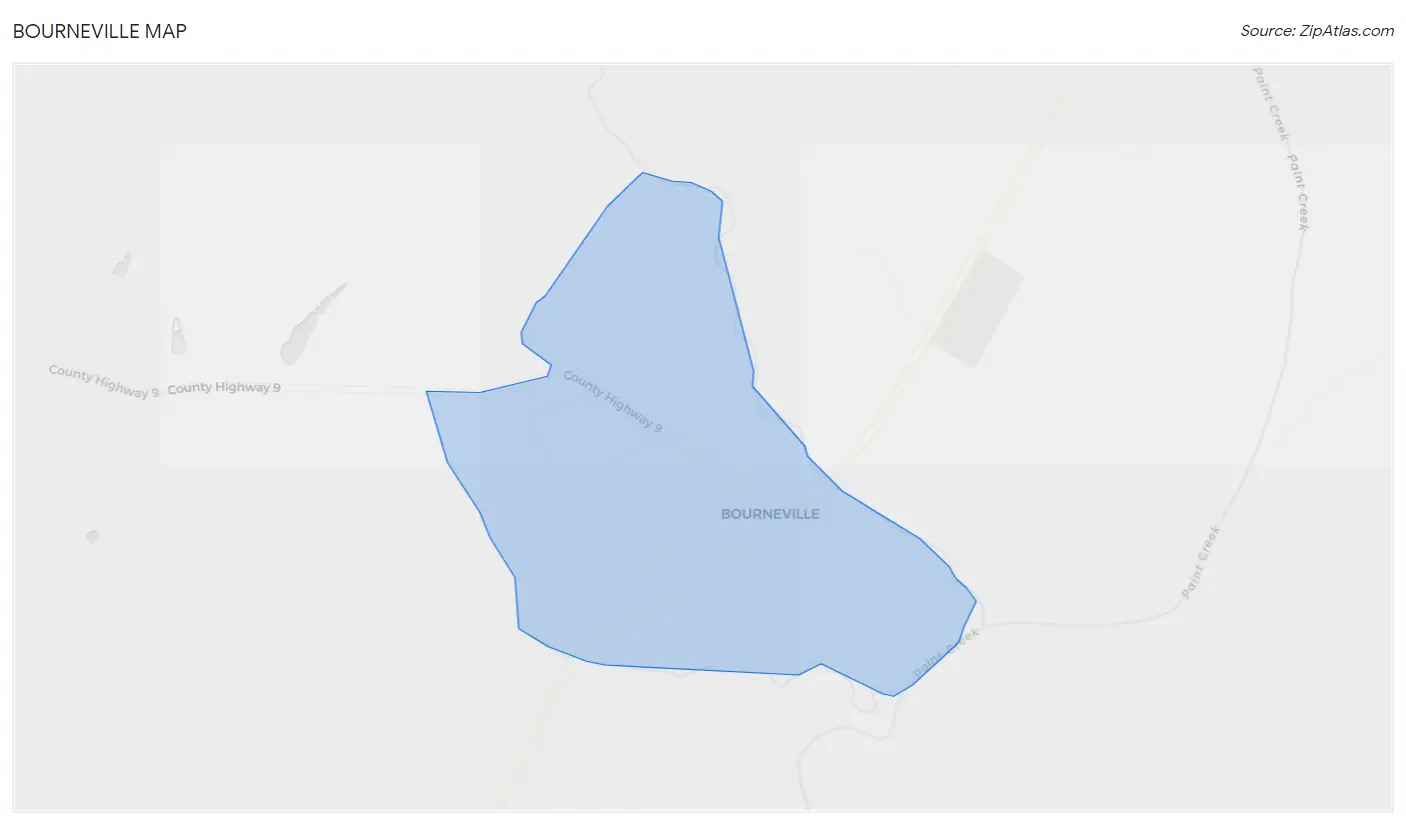
Bourneville Map
Bourneville Overview
$11,797
PER CAPITA INCOME
$50,208
AVG HOUSEHOLD INCOME
0.46
INEQUALITY / GINI INDEX
397
TOTAL POPULATION
145
MALE POPULATION
252
FEMALE POPULATION
57.54
MALES / 100 FEMALES
173.79
FEMALES / 100 MALES
17.4
MEDIAN AGE
3.6
AVG FAMILY SIZE
3.4
AVG HOUSEHOLD SIZE
107
LABOR FORCE [ PEOPLE ]
51.0%
PERCENT IN LABOR FORCE
Bourneville Area Codes
Income in Bourneville
Income Overview in Bourneville
| Characteristic | Number | Measure |
| Per Capita Income | 397 | $11,797 |
| Median Family Income | 101 | $0 |
| Mean Family Income | 101 | $31,781 |
| Median Household Income | 116 | $50,208 |
| Mean Household Income | 116 | $41,522 |
| Income Deficit | 101 | $0 |
| Wage / Income Gap (%) | 397 | 0.00% |
| Wage / Income Gap ($) | 397 | 100.00¢ per $1 |
| Gini / Inequality Index | 397 | 0.46 |
Earnings by Sex in Bourneville
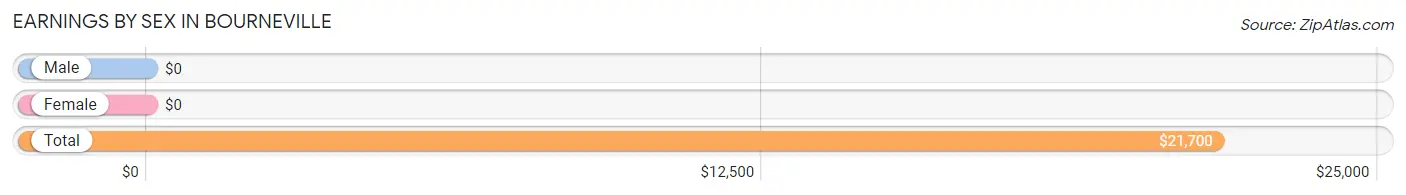
| Sex | Number | Average Earnings |
| Male | 51 (34.5%) | $0 |
| Female | 97 (65.5%) | $0 |
| Total | 148 (100.0%) | $21,700 |
Earnings by Sex by Income Bracket in Bourneville
The most common earnings brackets in Bourneville are $20,000 to $22,499 for men (36 | 70.6%) and $2,499 or less for women (40 | 41.2%).
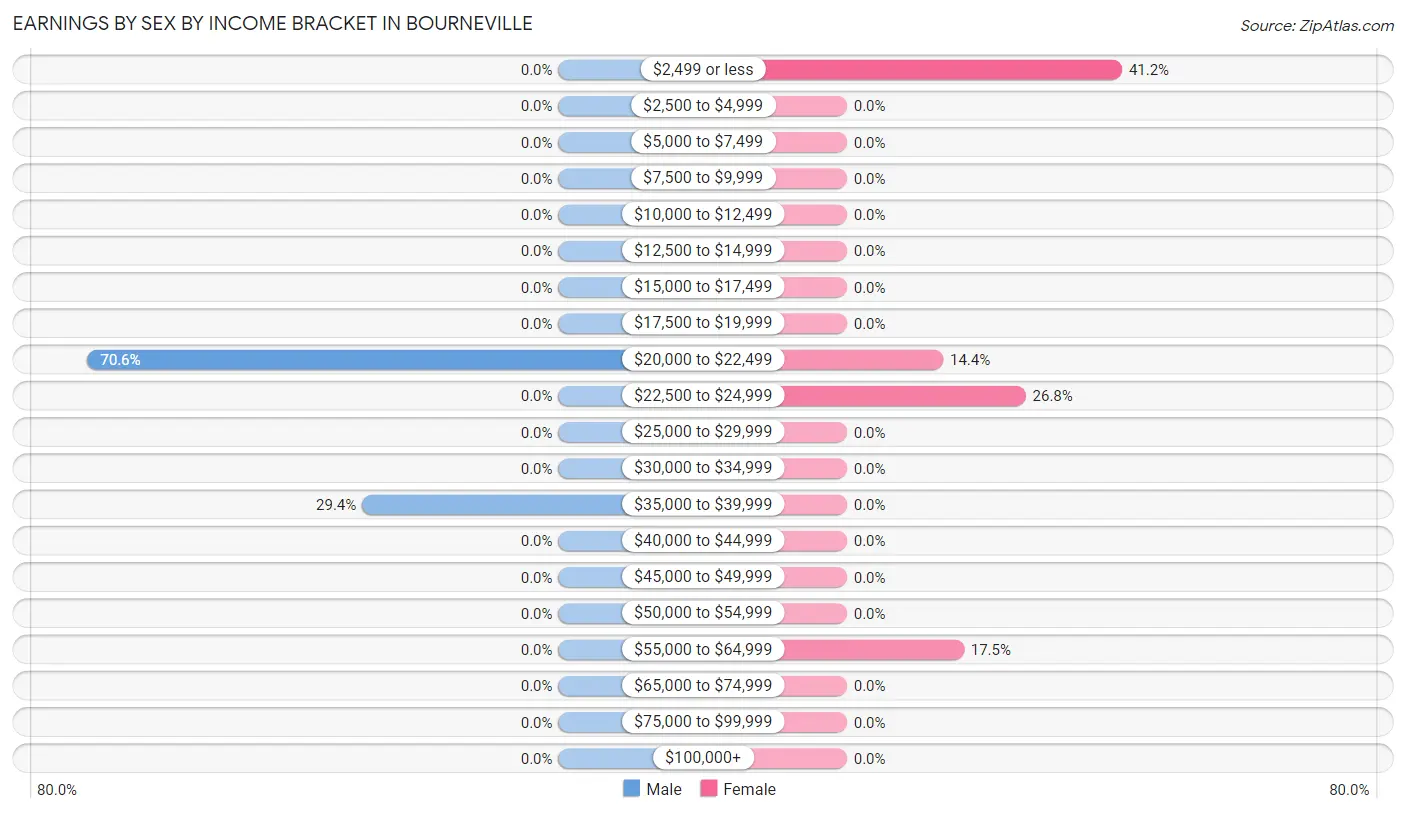
| Income | Male | Female |
| $2,499 or less | 0 (0.0%) | 40 (41.2%) |
| $2,500 to $4,999 | 0 (0.0%) | 0 (0.0%) |
| $5,000 to $7,499 | 0 (0.0%) | 0 (0.0%) |
| $7,500 to $9,999 | 0 (0.0%) | 0 (0.0%) |
| $10,000 to $12,499 | 0 (0.0%) | 0 (0.0%) |
| $12,500 to $14,999 | 0 (0.0%) | 0 (0.0%) |
| $15,000 to $17,499 | 0 (0.0%) | 0 (0.0%) |
| $17,500 to $19,999 | 0 (0.0%) | 0 (0.0%) |
| $20,000 to $22,499 | 36 (70.6%) | 14 (14.4%) |
| $22,500 to $24,999 | 0 (0.0%) | 26 (26.8%) |
| $25,000 to $29,999 | 0 (0.0%) | 0 (0.0%) |
| $30,000 to $34,999 | 0 (0.0%) | 0 (0.0%) |
| $35,000 to $39,999 | 15 (29.4%) | 0 (0.0%) |
| $40,000 to $44,999 | 0 (0.0%) | 0 (0.0%) |
| $45,000 to $49,999 | 0 (0.0%) | 0 (0.0%) |
| $50,000 to $54,999 | 0 (0.0%) | 0 (0.0%) |
| $55,000 to $64,999 | 0 (0.0%) | 17 (17.5%) |
| $65,000 to $74,999 | 0 (0.0%) | 0 (0.0%) |
| $75,000 to $99,999 | 0 (0.0%) | 0 (0.0%) |
| $100,000+ | 0 (0.0%) | 0 (0.0%) |
| Total | 51 (100.0%) | 97 (100.0%) |
Earnings by Sex by Educational Attainment in Bourneville
| Educational Attainment | Male Income | Female Income |
| Less than High School | - | - |
| High School Diploma | - | - |
| College or Associate's Degree | - | - |
| Bachelor's Degree | - | - |
| Graduate Degree | - | - |
| Total | - | - |
Family Income in Bourneville
Family Income Brackets in Bourneville
According to the Bourneville family income data, there are 46 families falling into the $50,000 to $74,999 income range, which is the most common income bracket and makes up 45.5% of all families.
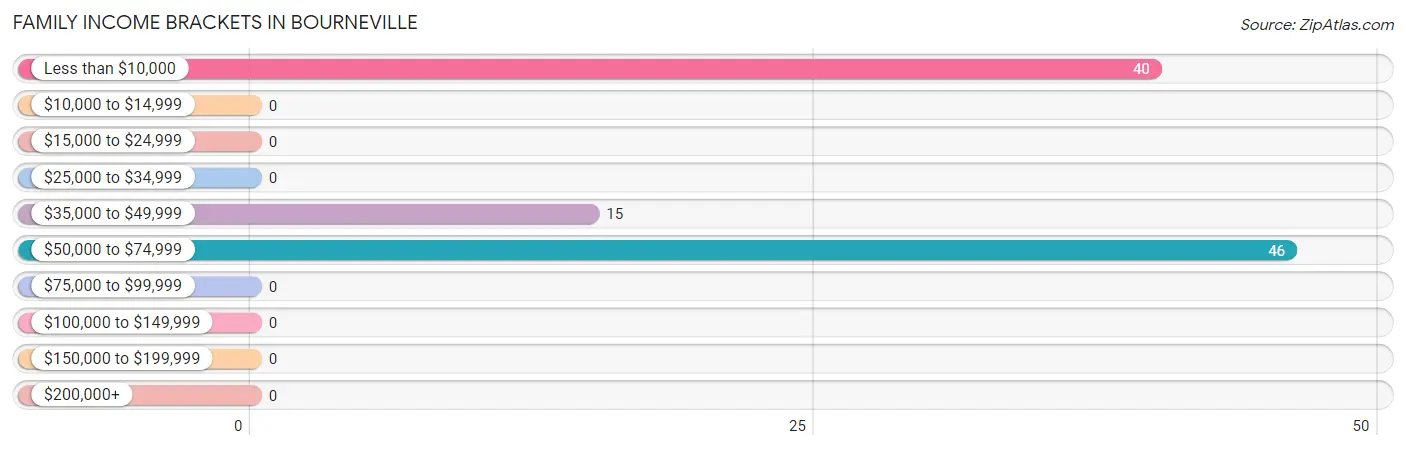
| Income Bracket | # Families | % Families |
| Less than $10,000 | 40 | 39.6% |
| $10,000 to $14,999 | 0 | 0.0% |
| $15,000 to $24,999 | 0 | 0.0% |
| $25,000 to $34,999 | 0 | 0.0% |
| $35,000 to $49,999 | 15 | 14.9% |
| $50,000 to $74,999 | 46 | 45.5% |
| $75,000 to $99,999 | 0 | 0.0% |
| $100,000 to $149,999 | 0 | 0.0% |
| $150,000 to $199,999 | 0 | 0.0% |
| $200,000+ | 0 | 0.0% |
Family Income by Famaliy Size in Bourneville
| Income Bracket | # Families | Median Income |
| 2-Person Families | 25 (24.7%) | $0 |
| 3-Person Families | 0 (0.0%) | $0 |
| 4-Person Families | 40 (39.6%) | $0 |
| 5-Person Families | 0 (0.0%) | $0 |
| 6-Person Families | 36 (35.6%) | $0 |
| 7+ Person Families | 0 (0.0%) | $0 |
| Total | 101 (100.0%) | $0 |
Family Income by Number of Earners in Bourneville
| Number of Earners | # Families | Median Income |
| No Earners | 10 (9.9%) | $0 |
| 1 Earner | 55 (54.5%) | $0 |
| 2 Earners | 36 (35.6%) | $0 |
| 3+ Earners | 0 (0.0%) | $0 |
| Total | 101 (100.0%) | $0 |
Household Income in Bourneville
Household Income Brackets in Bourneville
With 46 households falling in the category, the $50,000 to $74,999 income range is the most frequent in Bourneville, accounting for 39.7% of all households.
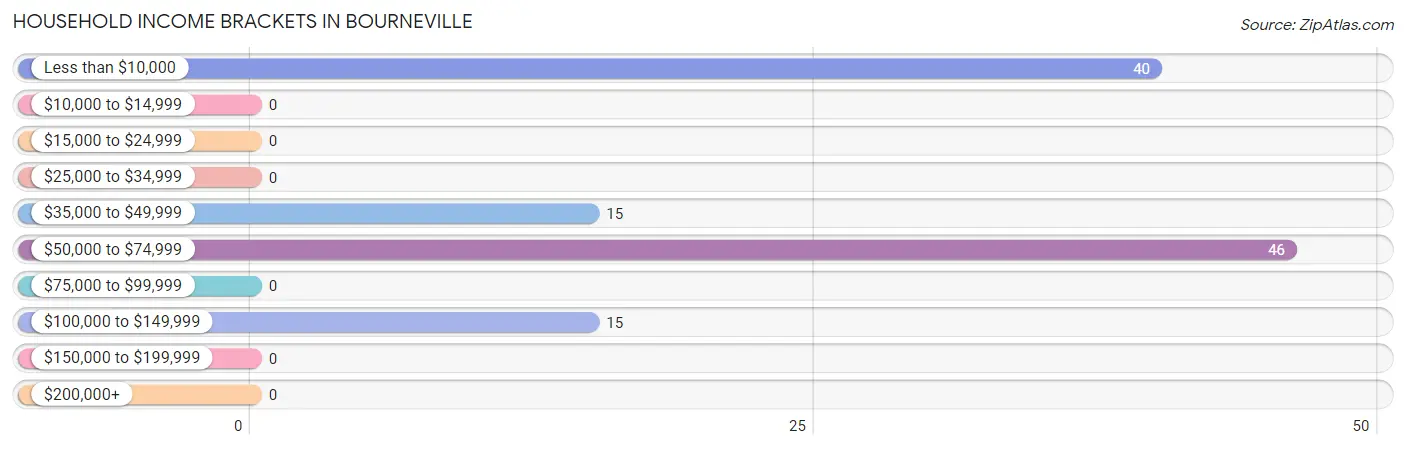
| Income Bracket | # Households | % Households |
| Less than $10,000 | 40 | 34.5% |
| $10,000 to $14,999 | 0 | 0.0% |
| $15,000 to $24,999 | 0 | 0.0% |
| $25,000 to $34,999 | 0 | 0.0% |
| $35,000 to $49,999 | 15 | 12.9% |
| $50,000 to $74,999 | 46 | 39.7% |
| $75,000 to $99,999 | 0 | 0.0% |
| $100,000 to $149,999 | 15 | 12.9% |
| $150,000 to $199,999 | 0 | 0.0% |
| $200,000+ | 0 | 0.0% |
Household Income by Householder Age in Bourneville
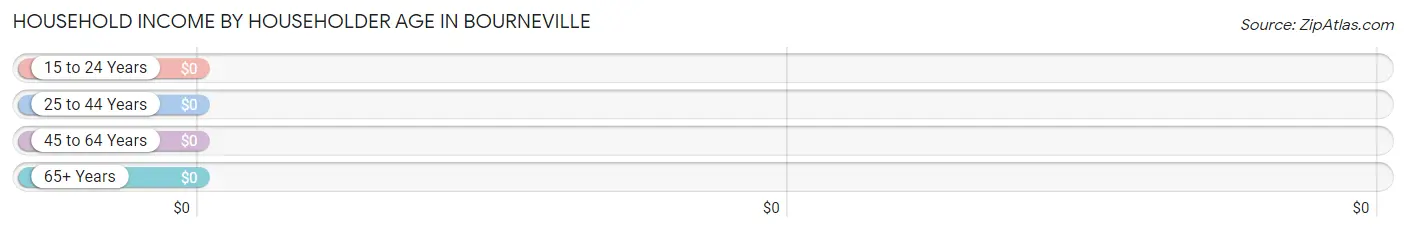
| Income Bracket | # Households | Median Income |
| 15 to 24 Years | 0 (0.0%) | $0 |
| 25 to 44 Years | 36 (31.0%) | $0 |
| 45 to 64 Years | 55 (47.4%) | $0 |
| 65+ Years | 25 (21.5%) | $0 |
| Total | 116 (100.0%) | $50,208 |
Poverty in Bourneville
Income Below Poverty by Sex and Age in Bourneville
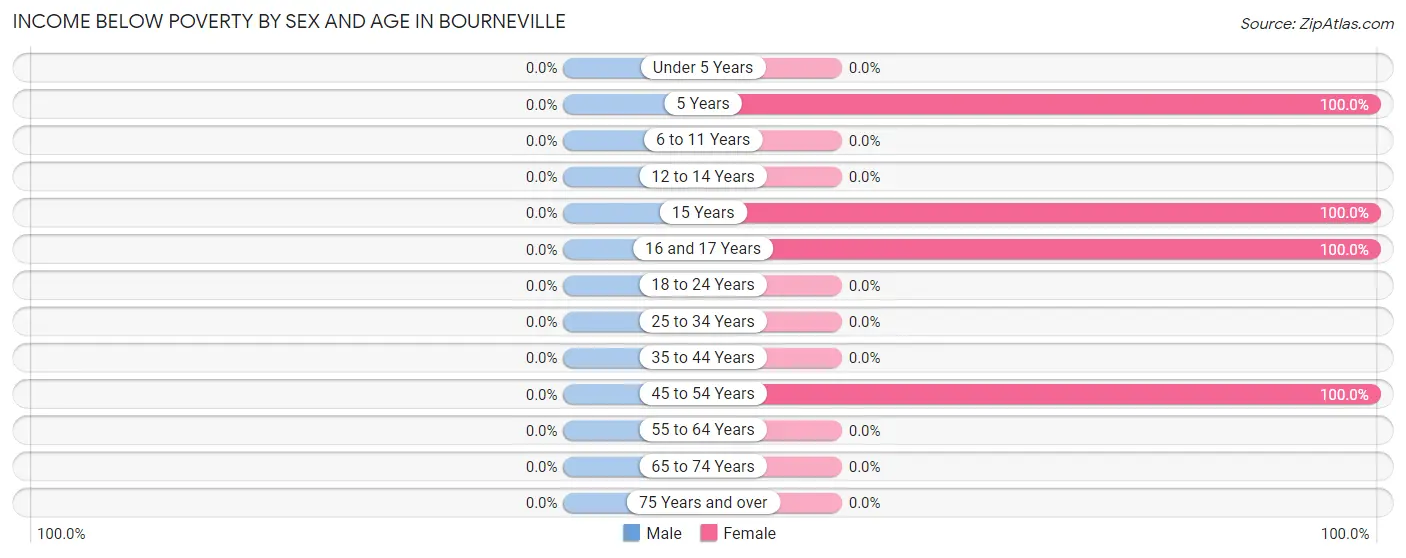
| Age Bracket | Male | Female |
| Under 5 Years | 0 (0.0%) | 0 (0.0%) |
| 5 Years | 0 (0.0%) | 26 (100.0%) |
| 6 to 11 Years | 0 (0.0%) | 0 (0.0%) |
| 12 to 14 Years | 0 (0.0%) | 0 (0.0%) |
| 15 Years | 0 (0.0%) | 25 (100.0%) |
| 16 and 17 Years | 0 (0.0%) | 26 (100.0%) |
| 18 to 24 Years | 0 (0.0%) | 0 (0.0%) |
| 25 to 34 Years | 0 (0.0%) | 0 (0.0%) |
| 35 to 44 Years | 0 (0.0%) | 0 (0.0%) |
| 45 to 54 Years | 0 (0.0%) | 40 (100.0%) |
| 55 to 64 Years | 0 (0.0%) | 0 (0.0%) |
| 65 to 74 Years | 0 (0.0%) | 0 (0.0%) |
| 75 Years and over | 0 (0.0%) | 0 (0.0%) |
| Total | 0 (0.0%) | 117 (46.4%) |
Income Above Poverty by Sex and Age in Bourneville
According to the poverty statistics in Bourneville, males aged under 5 years and females aged under 5 years are the age groups that are most secure financially, with 100.0% of males and 100.0% of females in these age groups living above the poverty line.
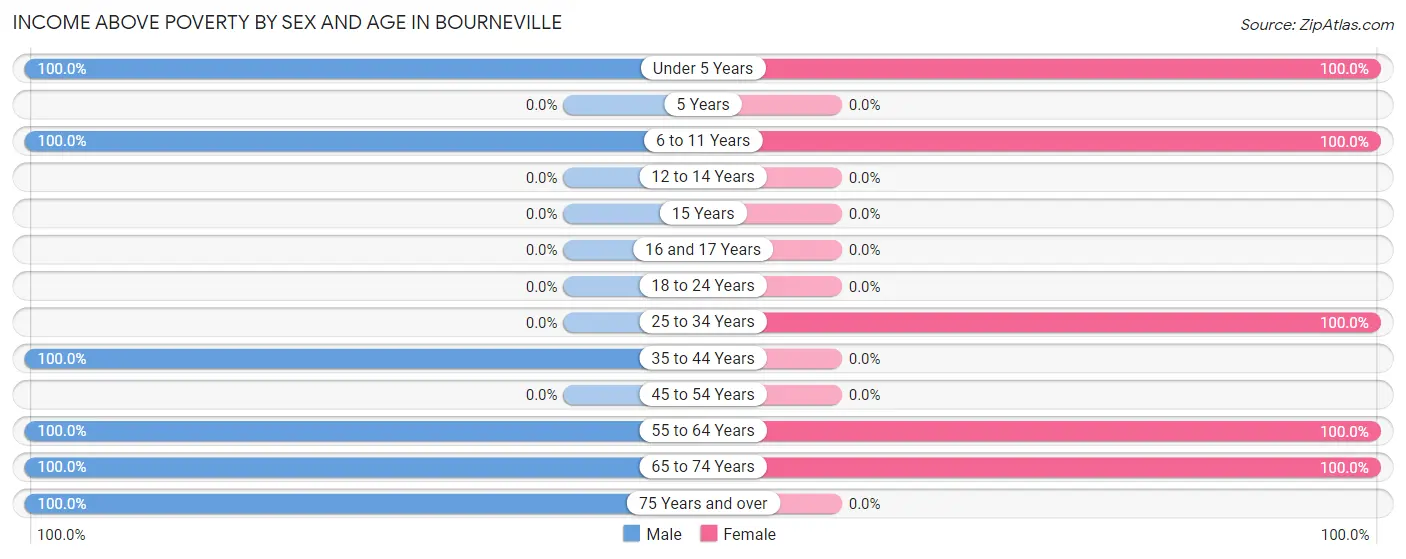
| Age Bracket | Male | Female |
| Under 5 Years | 30 (100.0%) | 36 (100.0%) |
| 5 Years | 0 (0.0%) | 0 (0.0%) |
| 6 to 11 Years | 39 (100.0%) | 31 (100.0%) |
| 12 to 14 Years | 0 (0.0%) | 0 (0.0%) |
| 15 Years | 0 (0.0%) | 0 (0.0%) |
| 16 and 17 Years | 0 (0.0%) | 0 (0.0%) |
| 18 to 24 Years | 0 (0.0%) | 0 (0.0%) |
| 25 to 34 Years | 0 (0.0%) | 26 (100.0%) |
| 35 to 44 Years | 36 (100.0%) | 0 (0.0%) |
| 45 to 54 Years | 0 (0.0%) | 0 (0.0%) |
| 55 to 64 Years | 15 (100.0%) | 14 (100.0%) |
| 65 to 74 Years | 15 (100.0%) | 28 (100.0%) |
| 75 Years and over | 10 (100.0%) | 0 (0.0%) |
| Total | 145 (100.0%) | 135 (53.6%) |
Income Below Poverty Among Married-Couple Families in Bourneville
| Children | Above Poverty | Below Poverty |
| No Children | 25 (100.0%) | 0 (0.0%) |
| 1 or 2 Children | 0 (0.0%) | 0 (0.0%) |
| 3 or 4 Children | 36 (100.0%) | 0 (0.0%) |
| 5 or more Children | 0 (0.0%) | 0 (0.0%) |
| Total | 61 (100.0%) | 0 (0.0%) |
Income Below Poverty Among Single-Parent Households in Bourneville
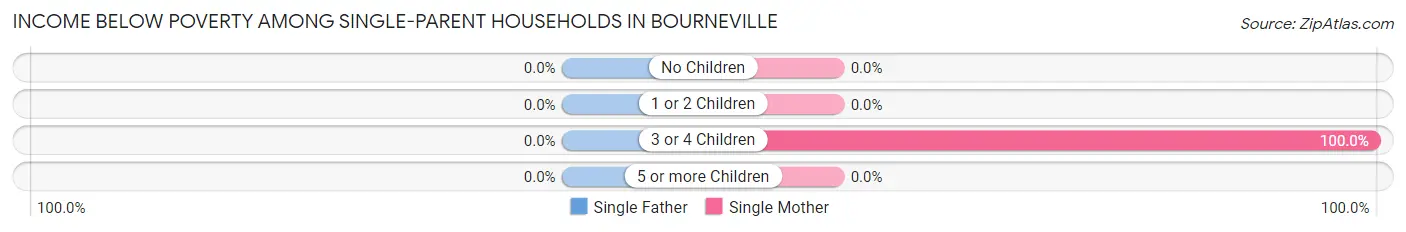
| Children | Single Father | Single Mother |
| No Children | 0 (0.0%) | 0 (0.0%) |
| 1 or 2 Children | 0 (0.0%) | 0 (0.0%) |
| 3 or 4 Children | 0 (0.0%) | 40 (100.0%) |
| 5 or more Children | 0 (0.0%) | 0 (0.0%) |
| Total | 0 (0.0%) | 40 (100.0%) |
Income Below Poverty Among Married-Couple vs Single-Parent Households in Bourneville
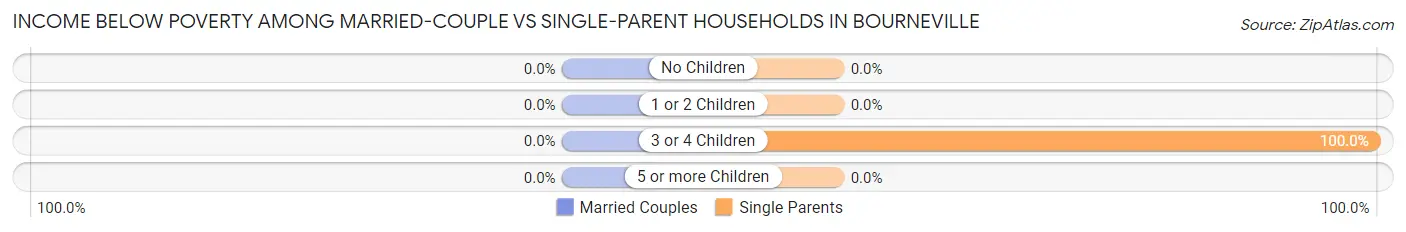
| Children | Married-Couple Families | Single-Parent Households |
| No Children | 0 (0.0%) | 0 (0.0%) |
| 1 or 2 Children | 0 (0.0%) | 0 (0.0%) |
| 3 or 4 Children | 0 (0.0%) | 40 (100.0%) |
| 5 or more Children | 0 (0.0%) | 0 (0.0%) |
| Total | 0 (0.0%) | 40 (100.0%) |
Race in Bourneville
The most populous races in Bourneville are White / Caucasian (280 | 70.5%), Two or more Races (77 | 19.4%), and Asian (40 | 10.1%).
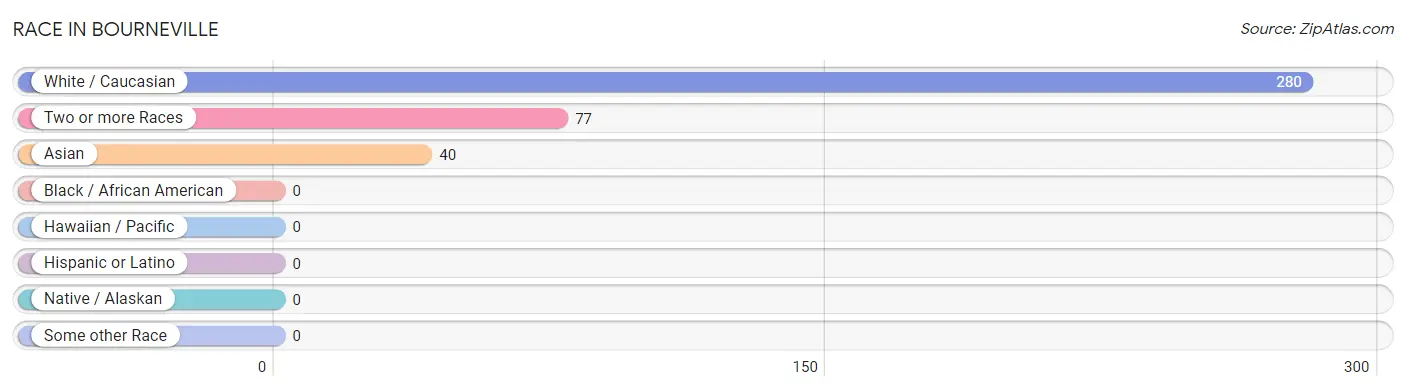
| Race | # Population | % Population |
| Asian | 40 | 10.1% |
| Black / African American | 0 | 0.0% |
| Hawaiian / Pacific | 0 | 0.0% |
| Hispanic or Latino | 0 | 0.0% |
| Native / Alaskan | 0 | 0.0% |
| White / Caucasian | 280 | 70.5% |
| Two or more Races | 77 | 19.4% |
| Some other Race | 0 | 0.0% |
| Total | 397 | 100.0% |
Ancestry in Bourneville
The most populous ancestries reported in Bourneville are Korean (117 | 29.5%), American (91 | 22.9%), German (26 | 6.6%), English (17 | 4.3%), and Irish (11 | 2.8%), together accounting for 66.0% of all Bourneville residents.
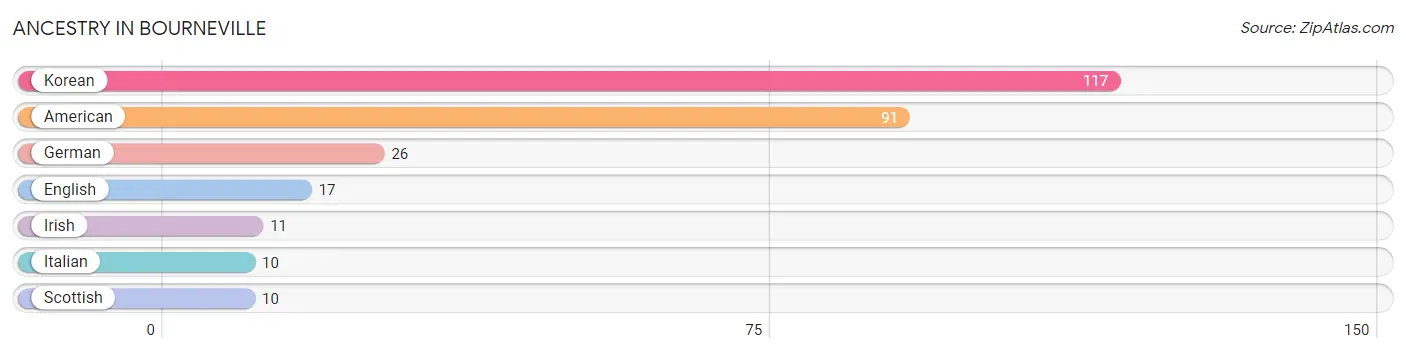
| Ancestry | # Population | % Population |
| American | 91 | 22.9% |
| English | 17 | 4.3% |
| German | 26 | 6.6% |
| Irish | 11 | 2.8% |
| Italian | 10 | 2.5% |
| Korean | 117 | 29.5% |
| Scottish | 10 | 2.5% | View All 7 Rows |
Immigrants in Bourneville
The most numerous immigrant groups reported in Bourneville came from Asia (40 | 10.1%), Philippines (40 | 10.1%), and South Eastern Asia (40 | 10.1%), together accounting for 30.2% of all Bourneville residents.
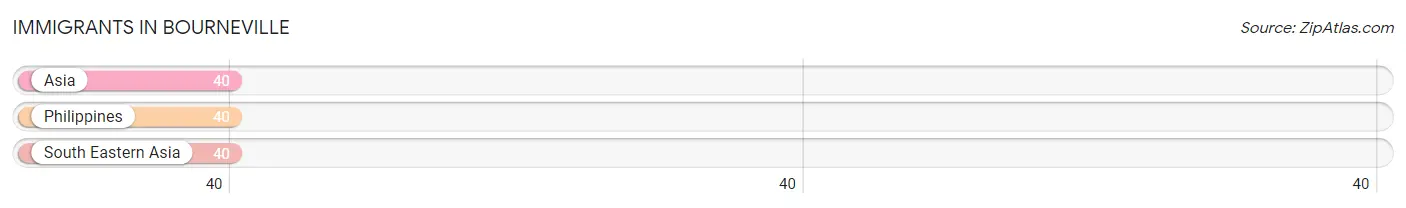
| Immigration Origin | # Population | % Population |
| Asia | 40 | 10.1% |
| Philippines | 40 | 10.1% |
| South Eastern Asia | 40 | 10.1% | View All 3 Rows |
Sex and Age in Bourneville
Sex and Age in Bourneville
The most populous age groups in Bourneville are 5 to 9 Years (39 | 26.9%) for men and 5 to 9 Years (57 | 22.6%) for women.
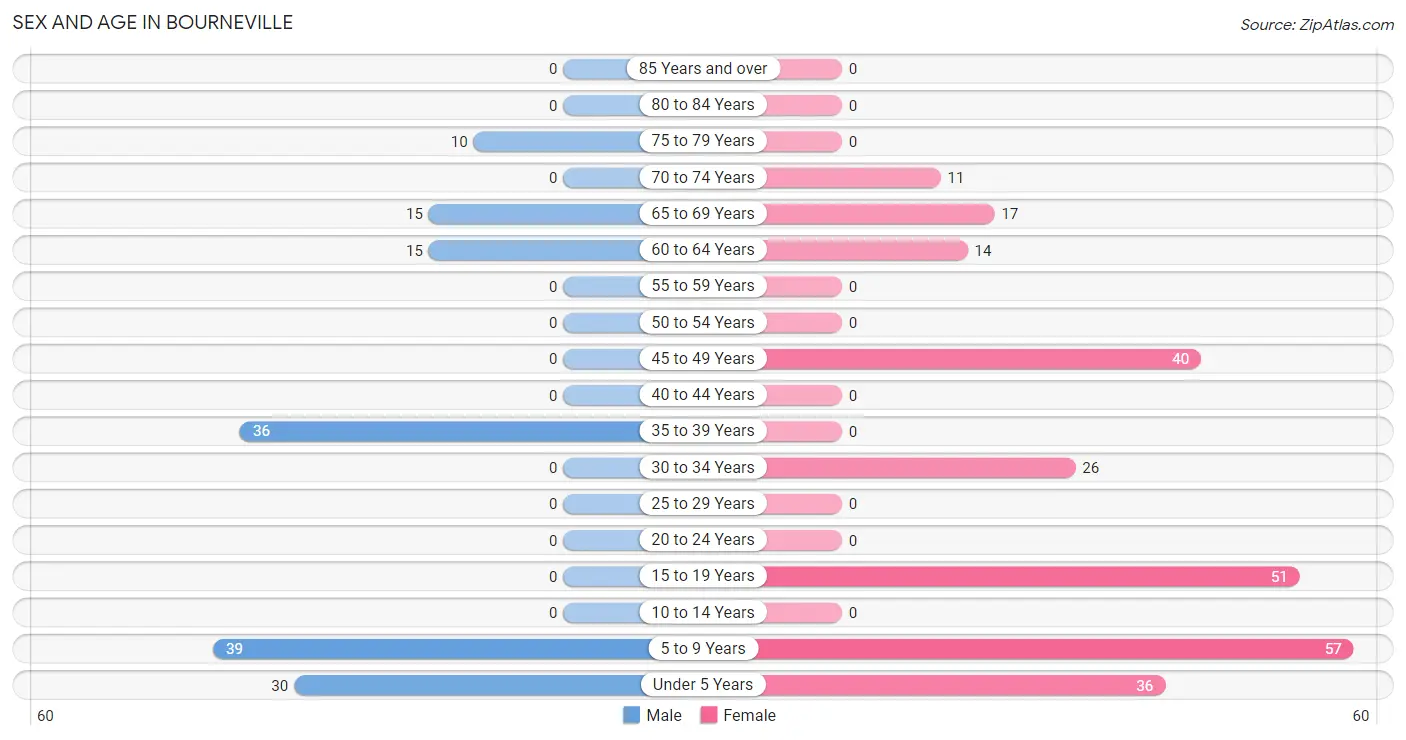
| Age Bracket | Male | Female |
| Under 5 Years | 30 (20.7%) | 36 (14.3%) |
| 5 to 9 Years | 39 (26.9%) | 57 (22.6%) |
| 10 to 14 Years | 0 (0.0%) | 0 (0.0%) |
| 15 to 19 Years | 0 (0.0%) | 51 (20.2%) |
| 20 to 24 Years | 0 (0.0%) | 0 (0.0%) |
| 25 to 29 Years | 0 (0.0%) | 0 (0.0%) |
| 30 to 34 Years | 0 (0.0%) | 26 (10.3%) |
| 35 to 39 Years | 36 (24.8%) | 0 (0.0%) |
| 40 to 44 Years | 0 (0.0%) | 0 (0.0%) |
| 45 to 49 Years | 0 (0.0%) | 40 (15.9%) |
| 50 to 54 Years | 0 (0.0%) | 0 (0.0%) |
| 55 to 59 Years | 0 (0.0%) | 0 (0.0%) |
| 60 to 64 Years | 15 (10.3%) | 14 (5.6%) |
| 65 to 69 Years | 15 (10.3%) | 17 (6.8%) |
| 70 to 74 Years | 0 (0.0%) | 11 (4.4%) |
| 75 to 79 Years | 10 (6.9%) | 0 (0.0%) |
| 80 to 84 Years | 0 (0.0%) | 0 (0.0%) |
| 85 Years and over | 0 (0.0%) | 0 (0.0%) |
| Total | 145 (100.0%) | 252 (100.0%) |
Families and Households in Bourneville
Median Family Size in Bourneville
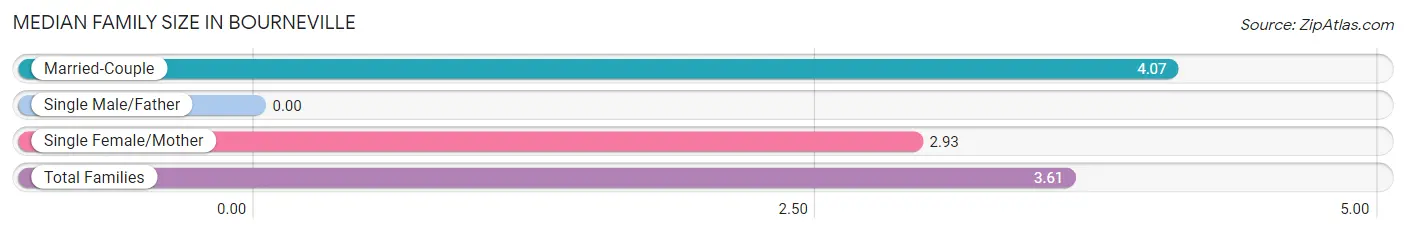
| Family Type | # Families | Family Size |
| Married-Couple | 61 (60.4%) | 4.07 |
| Single Male/Father | 0 (0.0%) | - |
| Single Female/Mother | 40 (39.6%) | 2.93 |
| Total Families | 101 (100.0%) | 3.61 |
Median Household Size in Bourneville
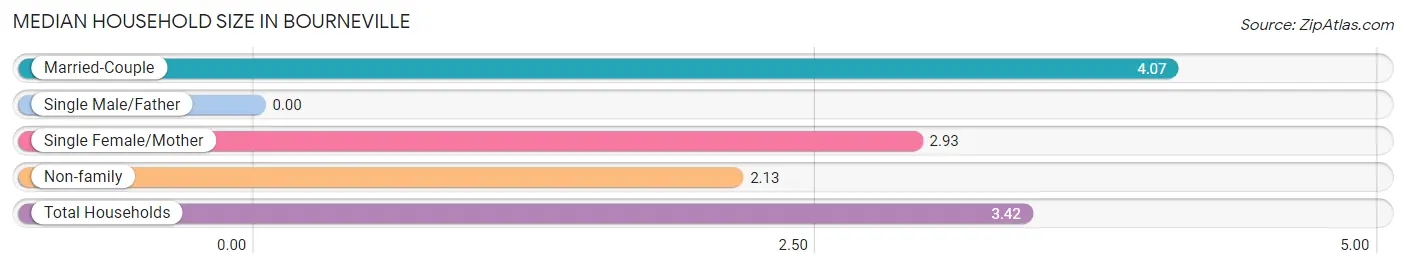
| Household Type | # Households | Household Size |
| Married-Couple | 61 (52.6%) | 4.07 |
| Single Male/Father | 0 (0.0%) | - |
| Single Female/Mother | 40 (34.5%) | 2.93 |
| Non-family | 15 (12.9%) | 2.13 |
| Total Households | 116 (100.0%) | 3.42 |
Household Size by Marriage Status in Bourneville
Out of a total of 116 households in Bourneville, 101 (87.1%) are family households, while 15 (12.9%) are nonfamily households. The most numerous type of family households are 4-person households, comprising 40, and the most common type of nonfamily households are 2-person households, comprising 15.
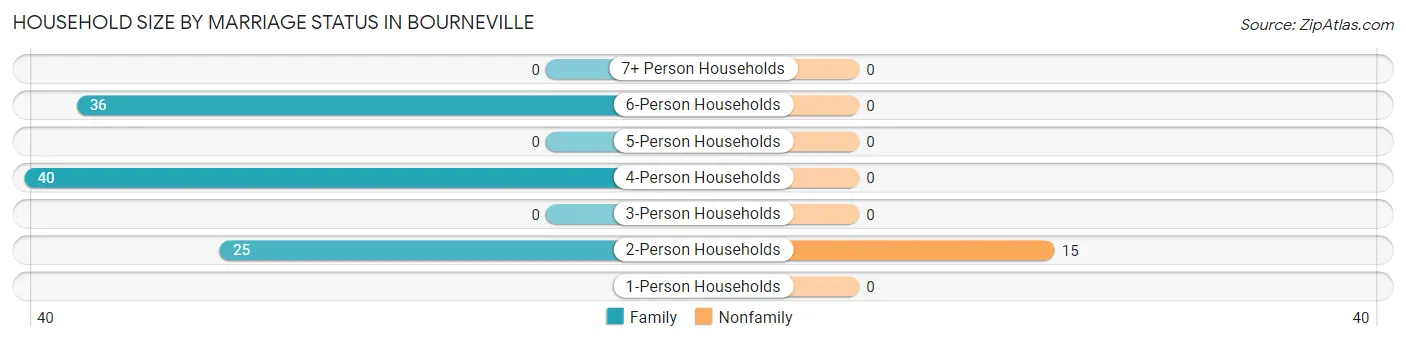
| Household Size | Family Households | Nonfamily Households |
| 1-Person Households | - | 0 (0.0%) |
| 2-Person Households | 25 (21.5%) | 15 (12.9%) |
| 3-Person Households | 0 (0.0%) | 0 (0.0%) |
| 4-Person Households | 40 (34.5%) | 0 (0.0%) |
| 5-Person Households | 0 (0.0%) | 0 (0.0%) |
| 6-Person Households | 36 (31.0%) | 0 (0.0%) |
| 7+ Person Households | 0 (0.0%) | 0 (0.0%) |
| Total | 101 (87.1%) | 15 (12.9%) |
Female Fertility in Bourneville
Fertility by Age in Bourneville
Average fertility rate in Bourneville is 222.0 births per 1,000 women. Women in the age bracket of 20 to 34 years have the highest fertility rate with 1,000.0 births per 1,000 women. Women in the age bracket of 20 to 34 years acount for 100.0% of all women with births.
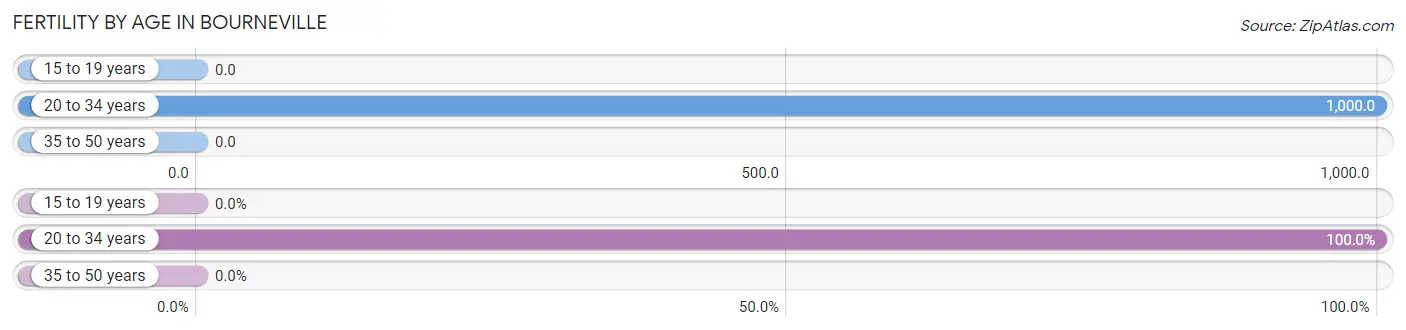
| Age Bracket | Women with Births | Births / 1,000 Women |
| 15 to 19 years | 0 (0.0%) | 0.0 |
| 20 to 34 years | 26 (100.0%) | 1,000.0 |
| 35 to 50 years | 0 (0.0%) | 0.0 |
| Total | 26 (100.0%) | 222.0 |
Fertility by Age by Marriage Status in Bourneville
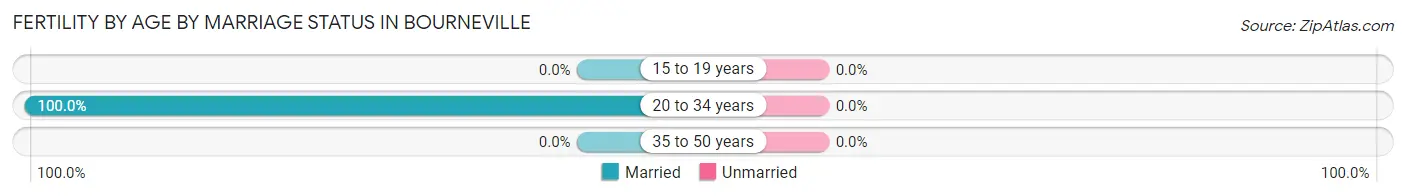
| Age Bracket | Married | Unmarried |
| 15 to 19 years | 0 (0.0%) | 0 (0.0%) |
| 20 to 34 years | 26 (100.0%) | 0 (0.0%) |
| 35 to 50 years | 0 (0.0%) | 0 (0.0%) |
| Total | 26 (100.0%) | 0 (0.0%) |
Fertility by Education in Bourneville
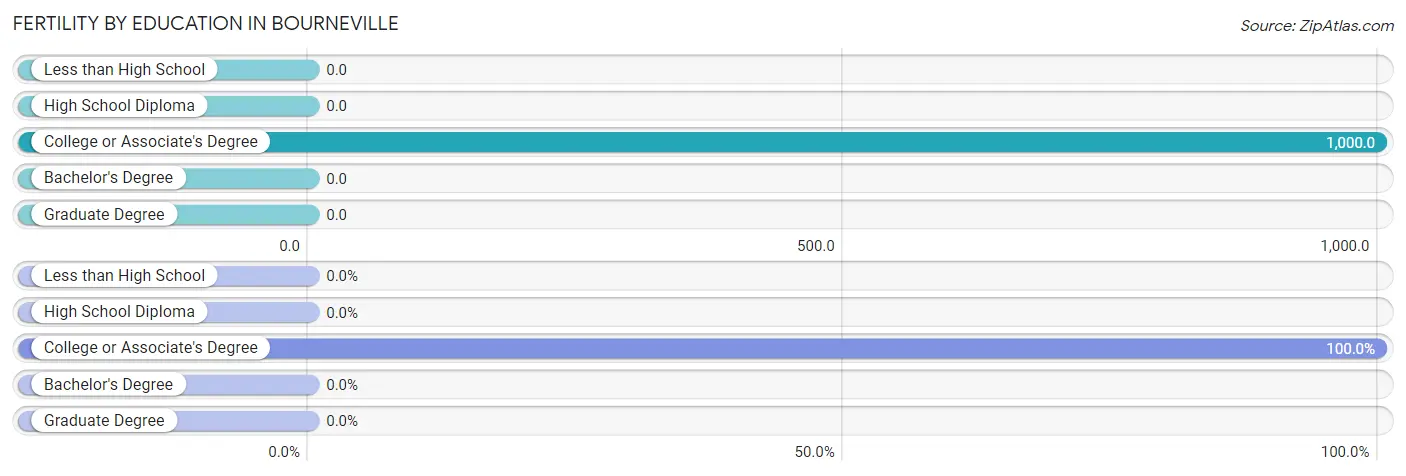
| Educational Attainment | Women with Births | Births / 1,000 Women |
| Less than High School | 0 (0.0%) | 0.0 |
| High School Diploma | 0 (0.0%) | 0.0 |
| College or Associate's Degree | 26 (100.0%) | 1,000.0 |
| Bachelor's Degree | 0 (0.0%) | 0.0 |
| Graduate Degree | 0 (0.0%) | 0.0 |
| Total | 26 (100.0%) | 222.0 |
Fertility by Education by Marriage Status in Bourneville
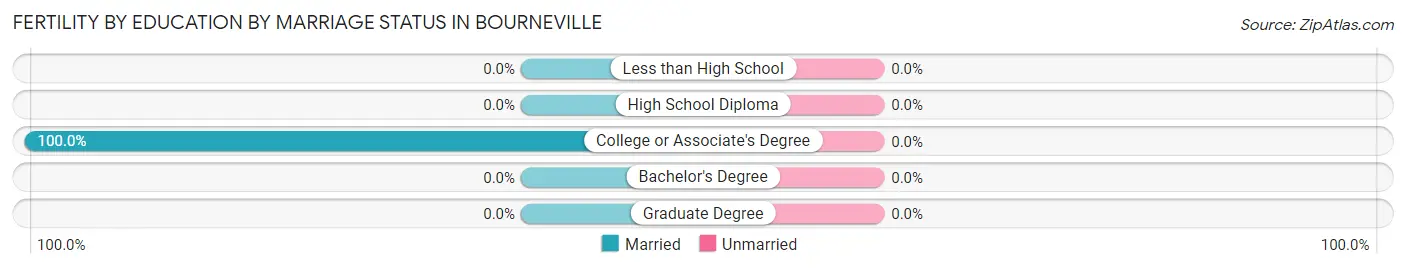
| Educational Attainment | Married | Unmarried |
| Less than High School | 0 (0.0%) | 0 (0.0%) |
| High School Diploma | 0 (0.0%) | 0 (0.0%) |
| College or Associate's Degree | 26 (100.0%) | 0 (0.0%) |
| Bachelor's Degree | 0 (0.0%) | 0 (0.0%) |
| Graduate Degree | 0 (0.0%) | 0 (0.0%) |
| Total | 26 (100.0%) | 0 (0.0%) |
Employment Characteristics in Bourneville
Employment by Class of Employer in Bourneville
Among the 107 employed individuals in Bourneville, private company employees (71 | 66.4%), and self-employed (not incorporated) (36 | 33.6%) make up the most common classes of employment.
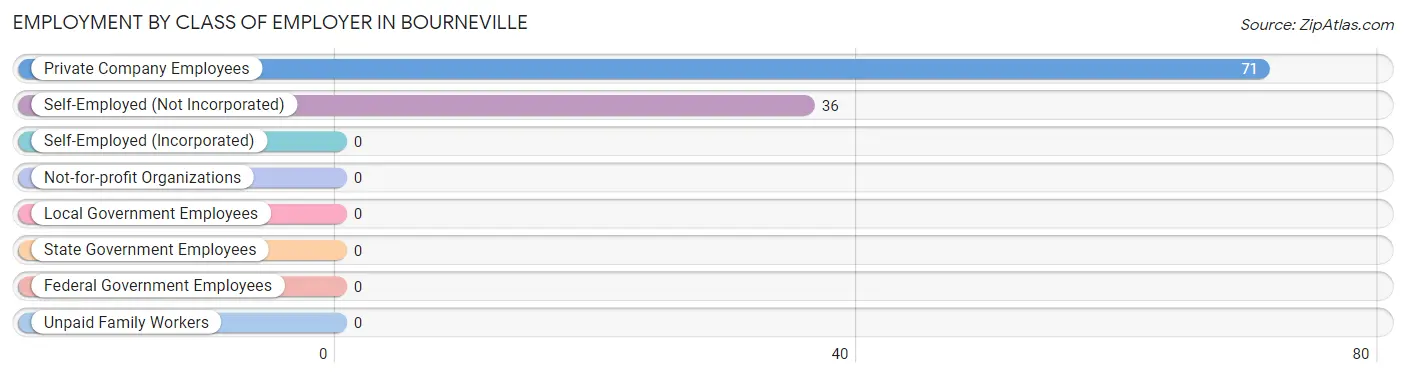
| Employer Class | # Employees | % Employees |
| Private Company Employees | 71 | 66.4% |
| Self-Employed (Incorporated) | 0 | 0.0% |
| Self-Employed (Not Incorporated) | 36 | 33.6% |
| Not-for-profit Organizations | 0 | 0.0% |
| Local Government Employees | 0 | 0.0% |
| State Government Employees | 0 | 0.0% |
| Federal Government Employees | 0 | 0.0% |
| Unpaid Family Workers | 0 | 0.0% |
| Total | 107 | 100.0% |
Employment Status by Age in Bourneville
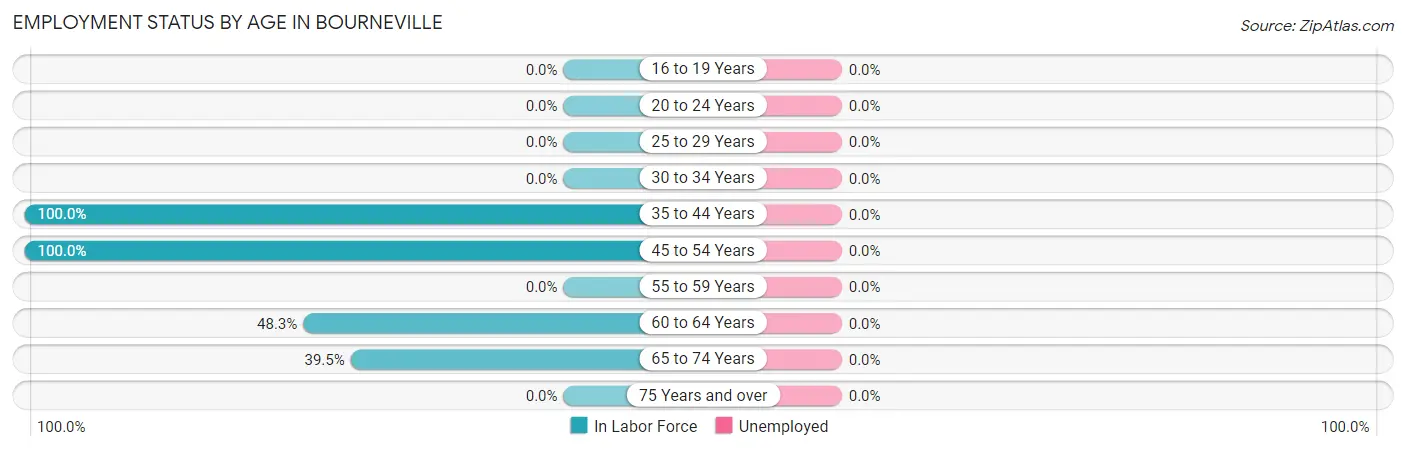
| Age Bracket | In Labor Force | Unemployed |
| 16 to 19 Years | 0 (0.0%) | 0 (0.0%) |
| 20 to 24 Years | 0 (0.0%) | 0 (0.0%) |
| 25 to 29 Years | 0 (0.0%) | 0 (0.0%) |
| 30 to 34 Years | 0 (0.0%) | 0 (0.0%) |
| 35 to 44 Years | 36 (100.0%) | 0 (0.0%) |
| 45 to 54 Years | 40 (100.0%) | 0 (0.0%) |
| 55 to 59 Years | 0 (0.0%) | 0 (0.0%) |
| 60 to 64 Years | 14 (48.3%) | 0 (0.0%) |
| 65 to 74 Years | 17 (39.5%) | 0 (0.0%) |
| 75 Years and over | 0 (0.0%) | 0 (0.0%) |
| Total | 107 (51.0%) | 0 (0.0%) |
Employment Status by Educational Attainment in Bourneville
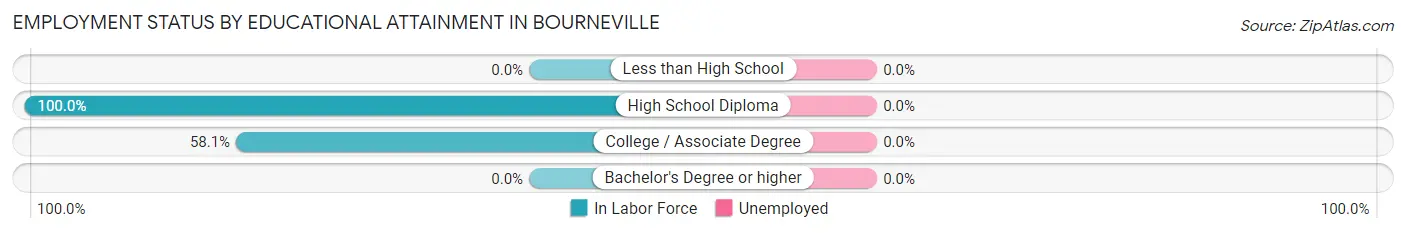
| Educational Attainment | In Labor Force | Unemployed |
| Less than High School | 0 (0.0%) | 0 (0.0%) |
| High School Diploma | 54 (100.0%) | 0 (0.0%) |
| College / Associate Degree | 36 (58.1%) | 0 (0.0%) |
| Bachelor's Degree or higher | 0 (0.0%) | 0 (0.0%) |
| Total | 90 (68.7%) | 0 (0.0%) |
Employment Occupations by Sex in Bourneville
Management, Business, Science and Arts Occupations
Management, Business, Science and Arts Occupations by Sex
| Occupation | Male | Female |
| Management | 0 (0.0%) | 0 (0.0%) |
| Business & Financial | 0 (0.0%) | 0 (0.0%) |
| Computers, Engineering & Science | 0 (0.0%) | 0 (0.0%) |
| Computers & Mathematics | 0 (0.0%) | 0 (0.0%) |
| Architecture & Engineering | 0 (0.0%) | 0 (0.0%) |
| Life, Physical & Social Science | 0 (0.0%) | 0 (0.0%) |
| Community & Social Service | 0 (0.0%) | 0 (0.0%) |
| Education, Arts & Media | 0 (0.0%) | 0 (0.0%) |
| Legal Services & Support | 0 (0.0%) | 0 (0.0%) |
| Education Instruction & Library | 0 (0.0%) | 0 (0.0%) |
| Arts, Media & Entertainment | 0 (0.0%) | 0 (0.0%) |
| Health Diagnosing & Treating | 0 (0.0%) | 0 (0.0%) |
| Health Technologists | 0 (0.0%) | 0 (0.0%) |
| Total (Category) | 0 (0.0%) | 0 (0.0%) |
| Total (Overall) | 36 (33.6%) | 71 (66.4%) |
Services Occupations
The most common Services occupations in Bourneville are Cleaning & Maintenance (40 | 37.4%), and Food Preparation & Serving (31 | 29.0%).
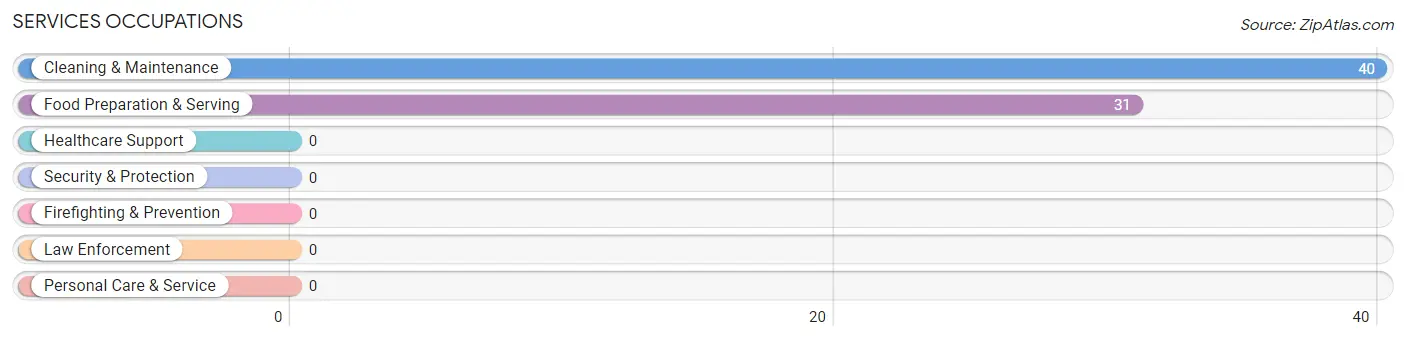
Services Occupations by Sex
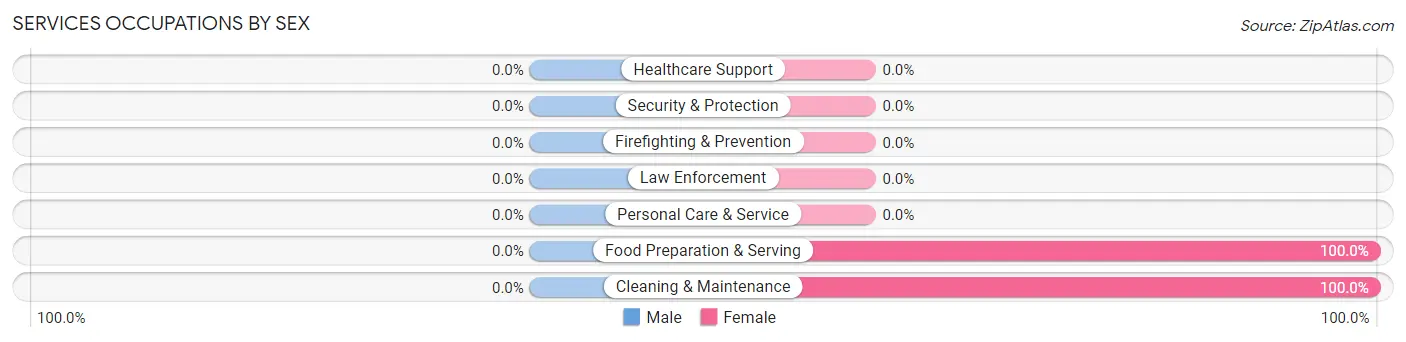
| Occupation | Male | Female |
| Healthcare Support | 0 (0.0%) | 0 (0.0%) |
| Security & Protection | 0 (0.0%) | 0 (0.0%) |
| Firefighting & Prevention | 0 (0.0%) | 0 (0.0%) |
| Law Enforcement | 0 (0.0%) | 0 (0.0%) |
| Food Preparation & Serving | 0 (0.0%) | 31 (100.0%) |
| Cleaning & Maintenance | 0 (0.0%) | 40 (100.0%) |
| Personal Care & Service | 0 (0.0%) | 0 (0.0%) |
| Total (Category) | 0 (0.0%) | 71 (100.0%) |
| Total (Overall) | 36 (33.6%) | 71 (66.4%) |
Sales and Office Occupations
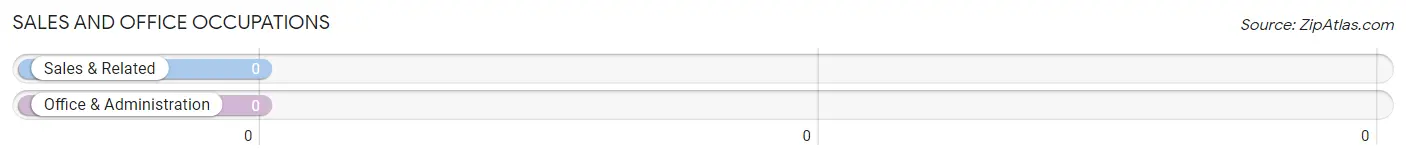
Sales and Office Occupations by Sex
| Occupation | Male | Female |
| Sales & Related | 0 (0.0%) | 0 (0.0%) |
| Office & Administration | 0 (0.0%) | 0 (0.0%) |
| Total (Category) | 0 (0.0%) | 0 (0.0%) |
| Total (Overall) | 36 (33.6%) | 71 (66.4%) |
Natural Resources, Construction and Maintenance Occupations
The most common Natural Resources, Construction and Maintenance occupations in Bourneville are , and Construction & Extraction (36 | 33.6%).
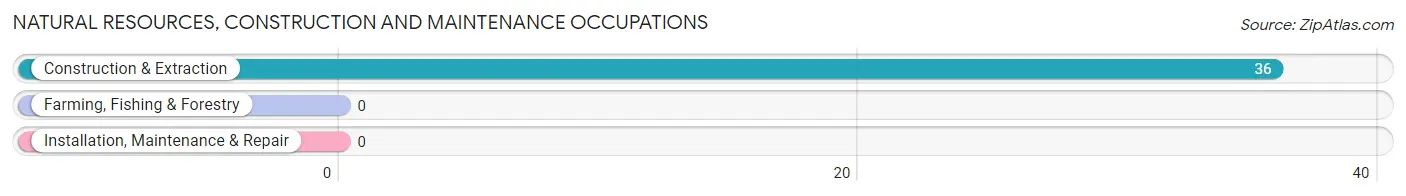
Natural Resources, Construction and Maintenance Occupations by Sex
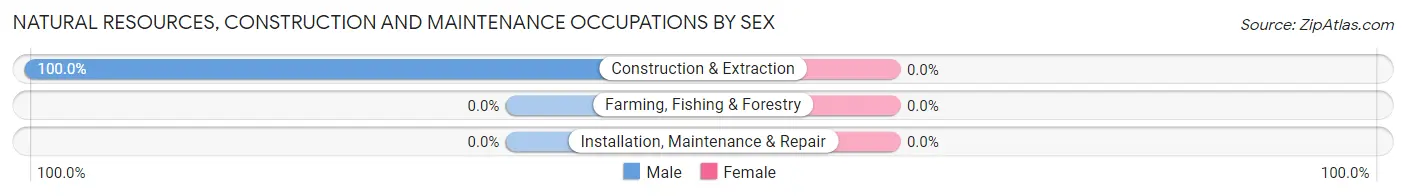
| Occupation | Male | Female |
| Farming, Fishing & Forestry | 0 (0.0%) | 0 (0.0%) |
| Construction & Extraction | 36 (100.0%) | 0 (0.0%) |
| Installation, Maintenance & Repair | 0 (0.0%) | 0 (0.0%) |
| Total (Category) | 36 (100.0%) | 0 (0.0%) |
| Total (Overall) | 36 (33.6%) | 71 (66.4%) |
Production, Transportation and Moving Occupations
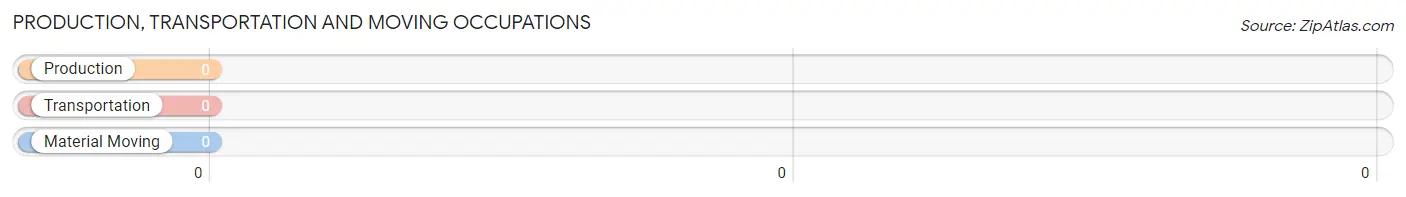
Production, Transportation and Moving Occupations by Sex
| Occupation | Male | Female |
| Production | 0 (0.0%) | 0 (0.0%) |
| Transportation | 0 (0.0%) | 0 (0.0%) |
| Material Moving | 0 (0.0%) | 0 (0.0%) |
| Total (Category) | 0 (0.0%) | 0 (0.0%) |
| Total (Overall) | 36 (33.6%) | 71 (66.4%) |
Employment Industries by Sex in Bourneville
Employment Industries in Bourneville
The major employment industries in Bourneville include Accommodation & Food Services (54 | 50.5%), Construction (36 | 33.6%), and Health Care & Social Assistance (17 | 15.9%).
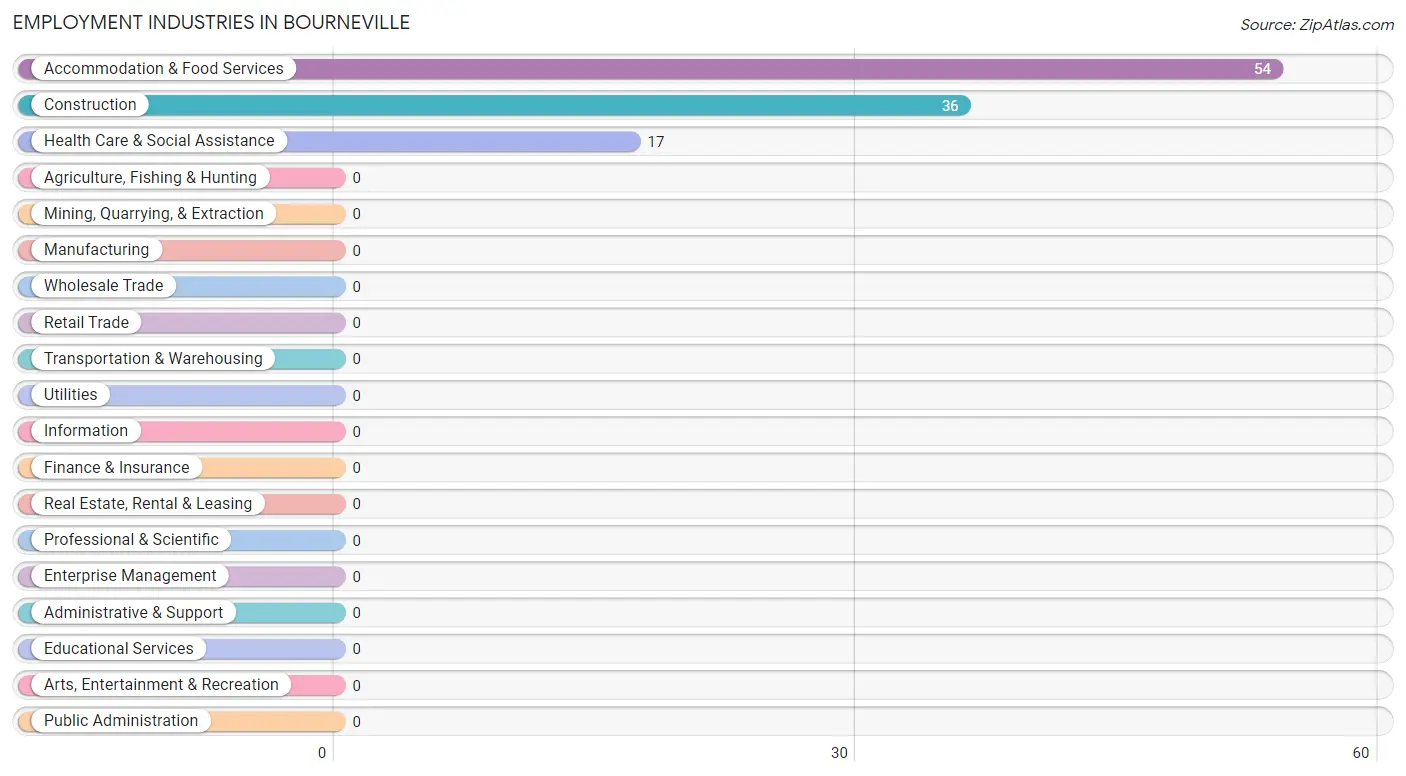
Employment Industries by Sex in Bourneville
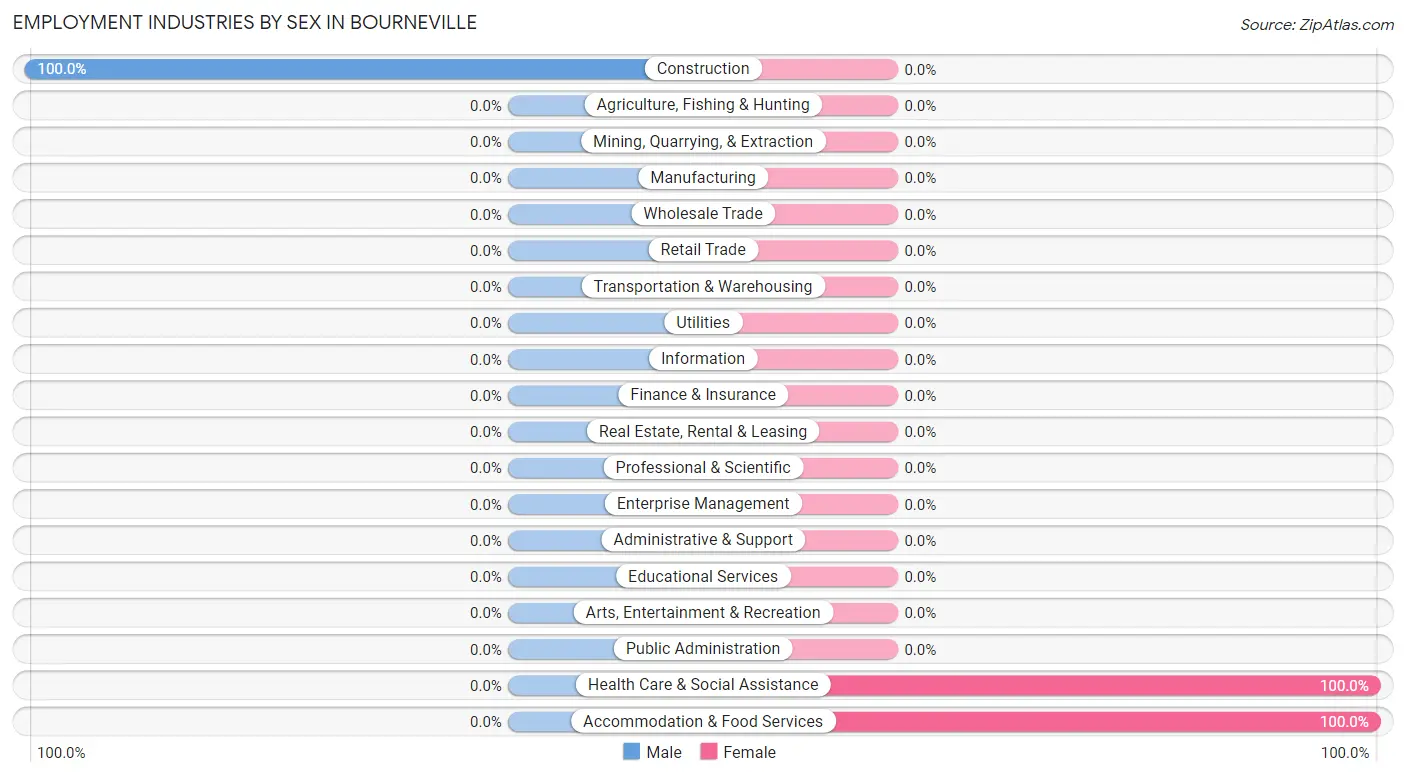
| Industry | Male | Female |
| Agriculture, Fishing & Hunting | 0 (0.0%) | 0 (0.0%) |
| Mining, Quarrying, & Extraction | 0 (0.0%) | 0 (0.0%) |
| Construction | 36 (100.0%) | 0 (0.0%) |
| Manufacturing | 0 (0.0%) | 0 (0.0%) |
| Wholesale Trade | 0 (0.0%) | 0 (0.0%) |
| Retail Trade | 0 (0.0%) | 0 (0.0%) |
| Transportation & Warehousing | 0 (0.0%) | 0 (0.0%) |
| Utilities | 0 (0.0%) | 0 (0.0%) |
| Information | 0 (0.0%) | 0 (0.0%) |
| Finance & Insurance | 0 (0.0%) | 0 (0.0%) |
| Real Estate, Rental & Leasing | 0 (0.0%) | 0 (0.0%) |
| Professional & Scientific | 0 (0.0%) | 0 (0.0%) |
| Enterprise Management | 0 (0.0%) | 0 (0.0%) |
| Administrative & Support | 0 (0.0%) | 0 (0.0%) |
| Educational Services | 0 (0.0%) | 0 (0.0%) |
| Health Care & Social Assistance | 0 (0.0%) | 17 (100.0%) |
| Arts, Entertainment & Recreation | 0 (0.0%) | 0 (0.0%) |
| Accommodation & Food Services | 0 (0.0%) | 54 (100.0%) |
| Public Administration | 0 (0.0%) | 0 (0.0%) |
| Total | 36 (33.6%) | 71 (66.4%) |
Education in Bourneville
School Enrollment in Bourneville
The most common levels of schooling among the 177 students in Bourneville are elementary school (70 | 39.6%), high school (51 | 28.8%), and nursery / preschool (30 | 17.0%).
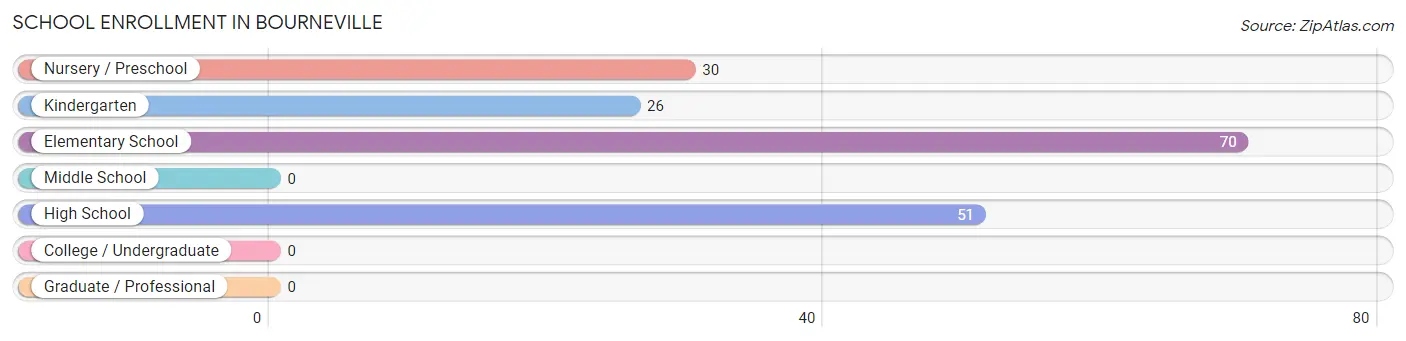
| School Level | # Students | % Students |
| Nursery / Preschool | 30 | 17.0% |
| Kindergarten | 26 | 14.7% |
| Elementary School | 70 | 39.6% |
| Middle School | 0 | 0.0% |
| High School | 51 | 28.8% |
| College / Undergraduate | 0 | 0.0% |
| Graduate / Professional | 0 | 0.0% |
| Total | 177 | 100.0% |
School Enrollment by Age by Funding Source in Bourneville
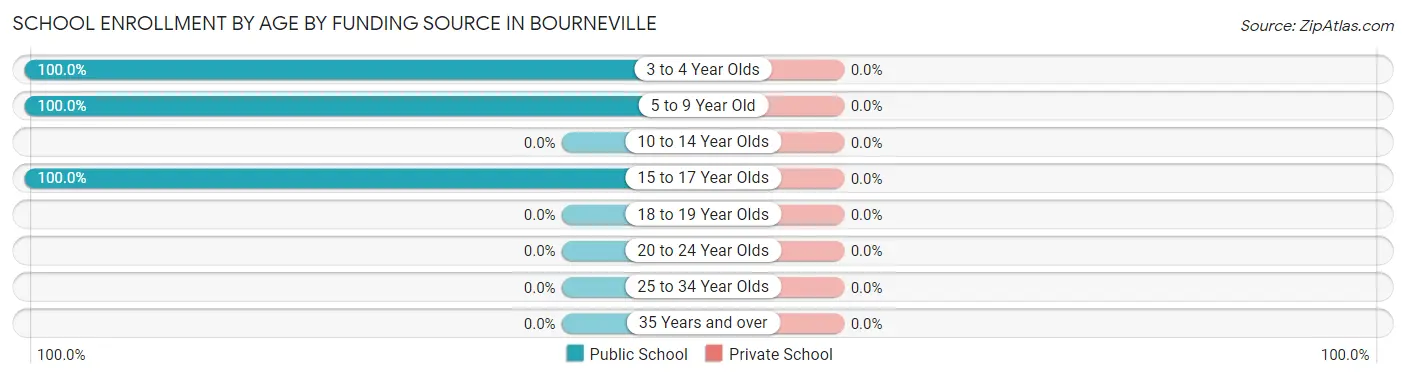
| Age Bracket | Public School | Private School |
| 3 to 4 Year Olds | 30 (100.0%) | 0 (0.0%) |
| 5 to 9 Year Old | 96 (100.0%) | 0 (0.0%) |
| 10 to 14 Year Olds | 0 (0.0%) | 0 (0.0%) |
| 15 to 17 Year Olds | 51 (100.0%) | 0 (0.0%) |
| 18 to 19 Year Olds | 0 (0.0%) | 0 (0.0%) |
| 20 to 24 Year Olds | 0 (0.0%) | 0 (0.0%) |
| 25 to 34 Year Olds | 0 (0.0%) | 0 (0.0%) |
| 35 Years and over | 0 (0.0%) | 0 (0.0%) |
| Total | 177 (100.0%) | 0 (0.0%) |
Educational Attainment by Field of Study in Bourneville
| Field of Study | # Graduates | % Graduates |
| Computers & Mathematics | 0 | 0.0% |
| Bio, Nature & Agricultural | 0 | 0.0% |
| Physical & Health Sciences | 0 | 0.0% |
| Psychology | 0 | 0.0% |
| Social Sciences | 0 | 0.0% |
| Engineering | 0 | 0.0% |
| Multidisciplinary Studies | 0 | 0.0% |
| Science & Technology | 0 | 0.0% |
| Business | 0 | 0.0% |
| Education | 0 | 0.0% |
| Literature & Languages | 0 | 0.0% |
| Liberal Arts & History | 0 | 0.0% |
| Visual & Performing Arts | 0 | 0.0% |
| Communications | 0 | 0.0% |
| Arts & Humanities | 0 | 0.0% |
| Total | 0 | 0.0% |
Transportation & Commute in Bourneville
Vehicle Availability by Sex in Bourneville
The most prevalent vehicle ownership categories in Bourneville are males with 3 vehicles (36, accounting for 100.0%) and females with 3 vehicles (0, making up 50.7%).
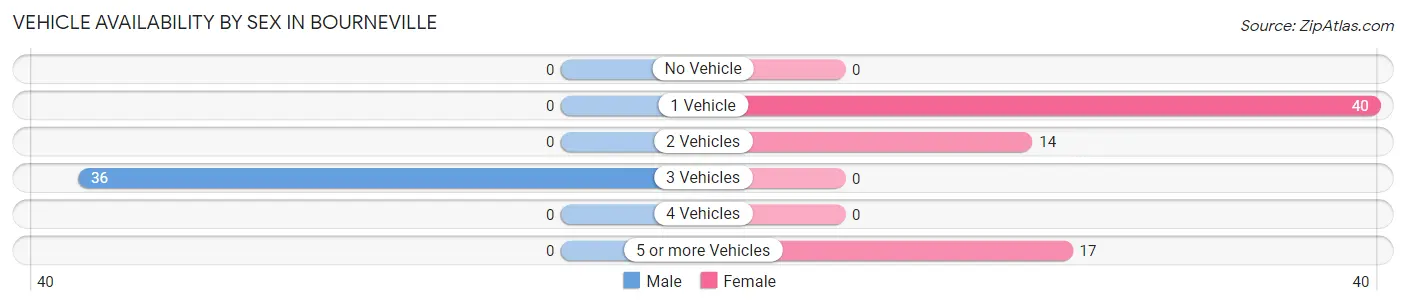
| Vehicles Available | Male | Female |
| No Vehicle | 0 (0.0%) | 0 (0.0%) |
| 1 Vehicle | 0 (0.0%) | 40 (56.3%) |
| 2 Vehicles | 0 (0.0%) | 14 (19.7%) |
| 3 Vehicles | 36 (100.0%) | 0 (0.0%) |
| 4 Vehicles | 0 (0.0%) | 0 (0.0%) |
| 5 or more Vehicles | 0 (0.0%) | 17 (23.9%) |
| Total | 36 (100.0%) | 71 (100.0%) |
Commute Time in Bourneville
The most frequently occuring commute durations in Bourneville are 30 to 34 minutes (40 commuters, 37.4%), 20 to 24 minutes (36 commuters, 33.6%), and 25 to 29 minutes (31 commuters, 29.0%).
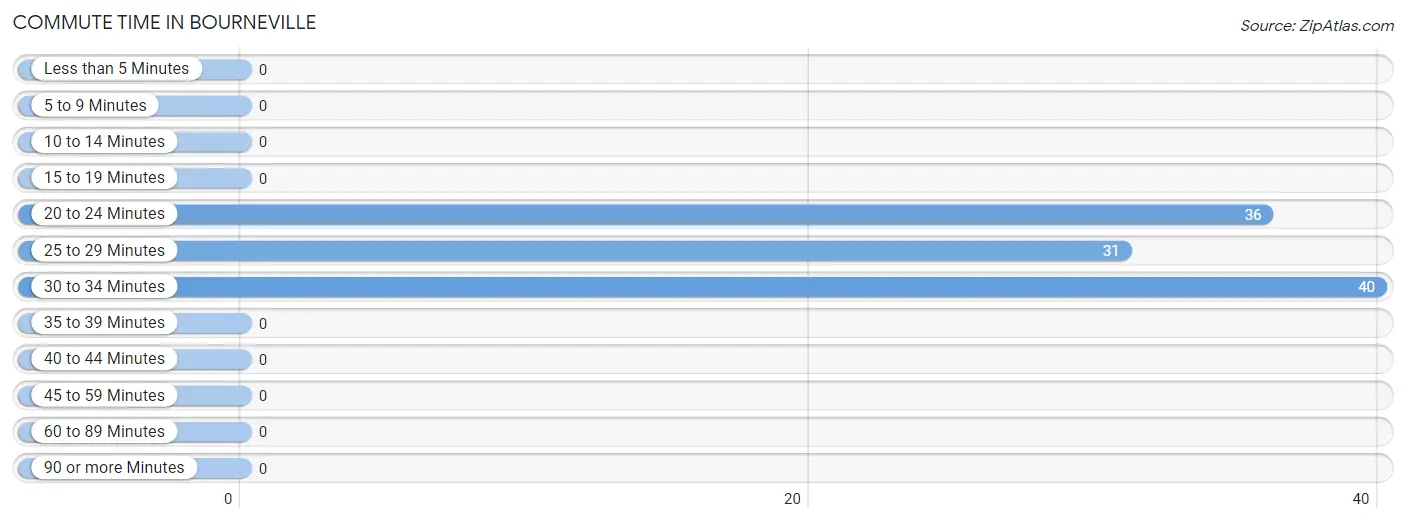
| Commute Time | # Commuters | % Commuters |
| Less than 5 Minutes | 0 | 0.0% |
| 5 to 9 Minutes | 0 | 0.0% |
| 10 to 14 Minutes | 0 | 0.0% |
| 15 to 19 Minutes | 0 | 0.0% |
| 20 to 24 Minutes | 36 | 33.6% |
| 25 to 29 Minutes | 31 | 29.0% |
| 30 to 34 Minutes | 40 | 37.4% |
| 35 to 39 Minutes | 0 | 0.0% |
| 40 to 44 Minutes | 0 | 0.0% |
| 45 to 59 Minutes | 0 | 0.0% |
| 60 to 89 Minutes | 0 | 0.0% |
| 90 or more Minutes | 0 | 0.0% |
Commute Time by Sex in Bourneville
The most common commute times in Bourneville are 20 to 24 minutes (36 commuters, 100.0%) for males and 30 to 34 minutes (40 commuters, 56.3%) for females.
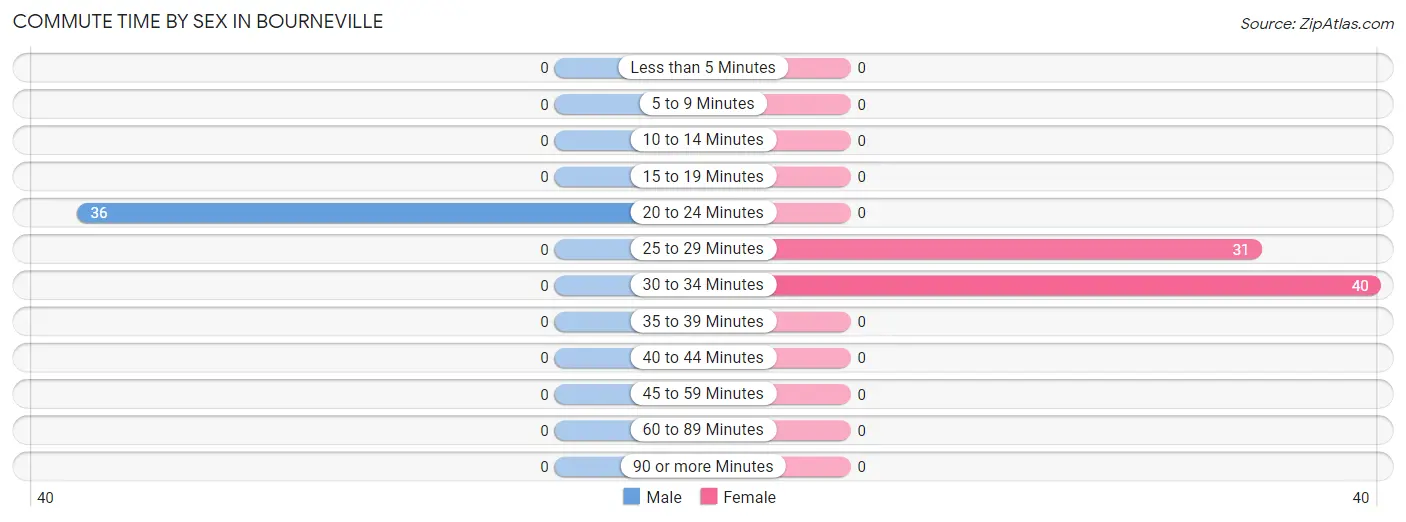
| Commute Time | Male | Female |
| Less than 5 Minutes | 0 (0.0%) | 0 (0.0%) |
| 5 to 9 Minutes | 0 (0.0%) | 0 (0.0%) |
| 10 to 14 Minutes | 0 (0.0%) | 0 (0.0%) |
| 15 to 19 Minutes | 0 (0.0%) | 0 (0.0%) |
| 20 to 24 Minutes | 36 (100.0%) | 0 (0.0%) |
| 25 to 29 Minutes | 0 (0.0%) | 31 (43.7%) |
| 30 to 34 Minutes | 0 (0.0%) | 40 (56.3%) |
| 35 to 39 Minutes | 0 (0.0%) | 0 (0.0%) |
| 40 to 44 Minutes | 0 (0.0%) | 0 (0.0%) |
| 45 to 59 Minutes | 0 (0.0%) | 0 (0.0%) |
| 60 to 89 Minutes | 0 (0.0%) | 0 (0.0%) |
| 90 or more Minutes | 0 (0.0%) | 0 (0.0%) |
Time of Departure to Work by Sex in Bourneville
The most frequent times of departure to work in Bourneville are 8:00 AM to 8:29 AM (36, 100.0%) for males and 8:00 AM to 8:29 AM (40, 56.3%) for females.
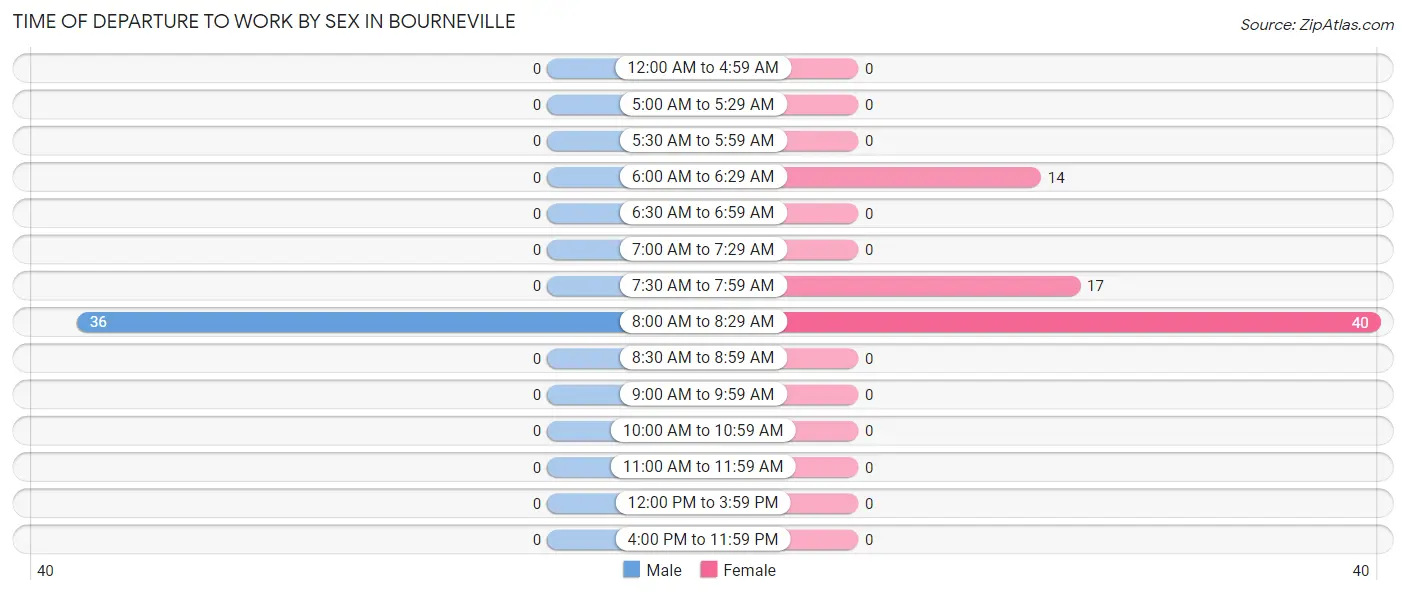
| Time of Departure | Male | Female |
| 12:00 AM to 4:59 AM | 0 (0.0%) | 0 (0.0%) |
| 5:00 AM to 5:29 AM | 0 (0.0%) | 0 (0.0%) |
| 5:30 AM to 5:59 AM | 0 (0.0%) | 0 (0.0%) |
| 6:00 AM to 6:29 AM | 0 (0.0%) | 14 (19.7%) |
| 6:30 AM to 6:59 AM | 0 (0.0%) | 0 (0.0%) |
| 7:00 AM to 7:29 AM | 0 (0.0%) | 0 (0.0%) |
| 7:30 AM to 7:59 AM | 0 (0.0%) | 17 (23.9%) |
| 8:00 AM to 8:29 AM | 36 (100.0%) | 40 (56.3%) |
| 8:30 AM to 8:59 AM | 0 (0.0%) | 0 (0.0%) |
| 9:00 AM to 9:59 AM | 0 (0.0%) | 0 (0.0%) |
| 10:00 AM to 10:59 AM | 0 (0.0%) | 0 (0.0%) |
| 11:00 AM to 11:59 AM | 0 (0.0%) | 0 (0.0%) |
| 12:00 PM to 3:59 PM | 0 (0.0%) | 0 (0.0%) |
| 4:00 PM to 11:59 PM | 0 (0.0%) | 0 (0.0%) |
| Total | 36 (100.0%) | 71 (100.0%) |
Housing Occupancy in Bourneville
Occupancy by Ownership in Bourneville
Of the total 116 dwellings in Bourneville, owner-occupied units account for 76 (65.5%), while renter-occupied units make up 40 (34.5%).
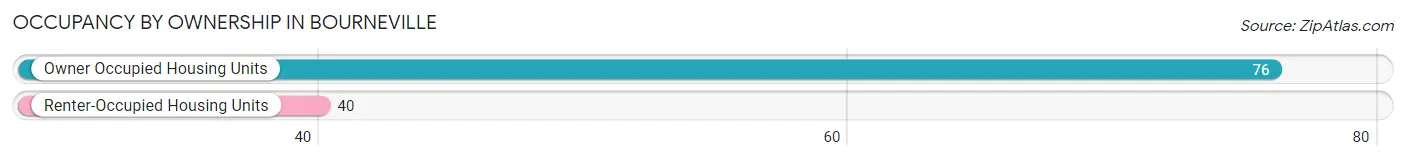
| Occupancy | # Housing Units | % Housing Units |
| Owner Occupied Housing Units | 76 | 65.5% |
| Renter-Occupied Housing Units | 40 | 34.5% |
| Total Occupied Housing Units | 116 | 100.0% |
Occupancy by Household Size in Bourneville
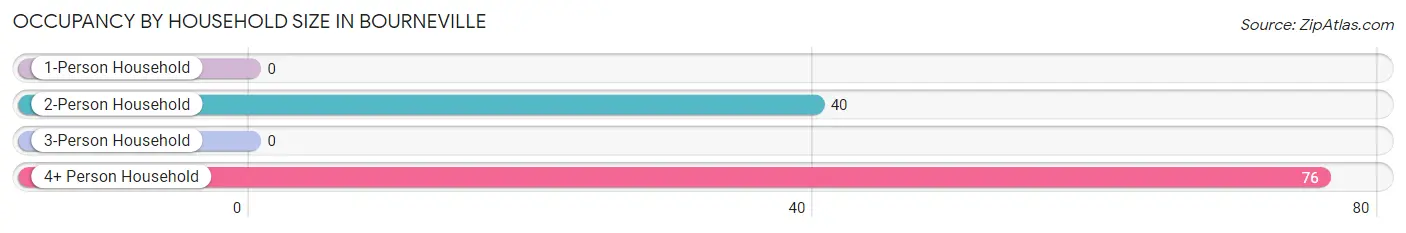
| Household Size | # Housing Units | % Housing Units |
| 1-Person Household | 0 | 0.0% |
| 2-Person Household | 40 | 34.5% |
| 3-Person Household | 0 | 0.0% |
| 4+ Person Household | 76 | 65.5% |
| Total Housing Units | 116 | 100.0% |
Occupancy by Ownership by Household Size in Bourneville
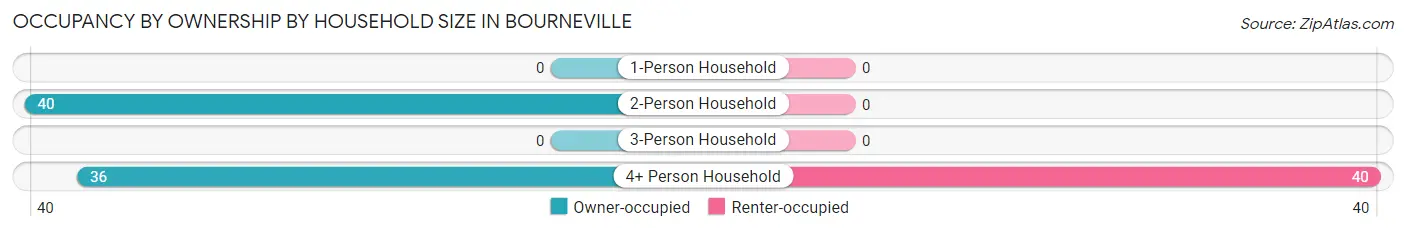
| Household Size | Owner-occupied | Renter-occupied |
| 1-Person Household | 0 (0.0%) | 0 (0.0%) |
| 2-Person Household | 40 (100.0%) | 0 (0.0%) |
| 3-Person Household | 0 (0.0%) | 0 (0.0%) |
| 4+ Person Household | 36 (47.4%) | 40 (52.6%) |
| Total Housing Units | 76 (65.5%) | 40 (34.5%) |
Occupancy by Educational Attainment in Bourneville
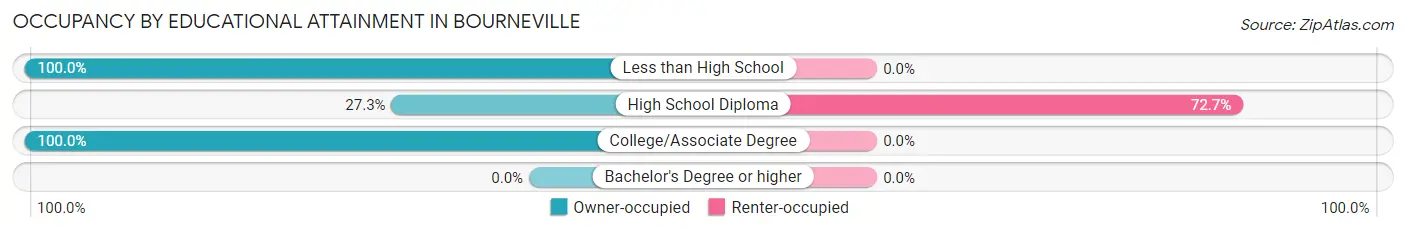
| Household Size | Owner-occupied | Renter-occupied |
| Less than High School | 15 (100.0%) | 0 (0.0%) |
| High School Diploma | 15 (27.3%) | 40 (72.7%) |
| College/Associate Degree | 46 (100.0%) | 0 (0.0%) |
| Bachelor's Degree or higher | 0 (0.0%) | 0 (0.0%) |
Occupancy by Age of Householder in Bourneville
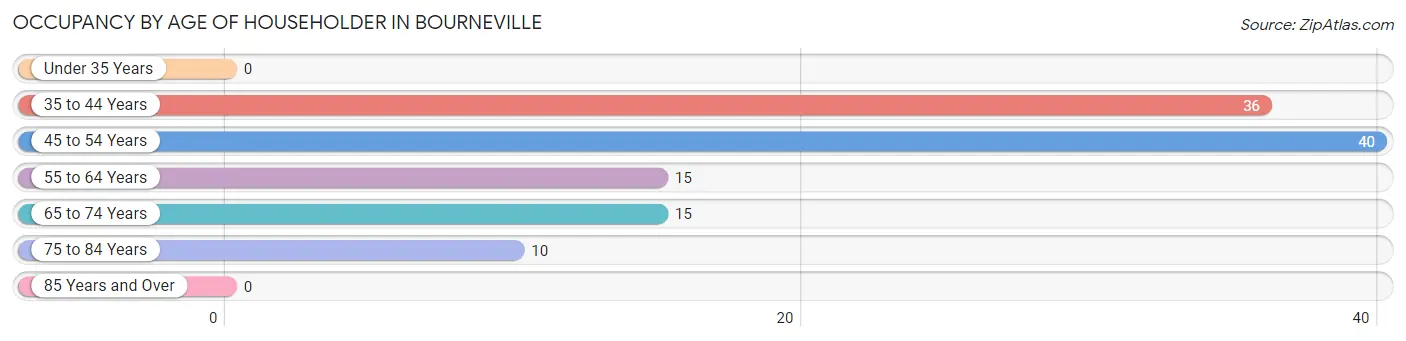
| Age Bracket | # Households | % Households |
| Under 35 Years | 0 | 0.0% |
| 35 to 44 Years | 36 | 31.0% |
| 45 to 54 Years | 40 | 34.5% |
| 55 to 64 Years | 15 | 12.9% |
| 65 to 74 Years | 15 | 12.9% |
| 75 to 84 Years | 10 | 8.6% |
| 85 Years and Over | 0 | 0.0% |
| Total | 116 | 100.0% |
Housing Finances in Bourneville
Median Income by Occupancy in Bourneville
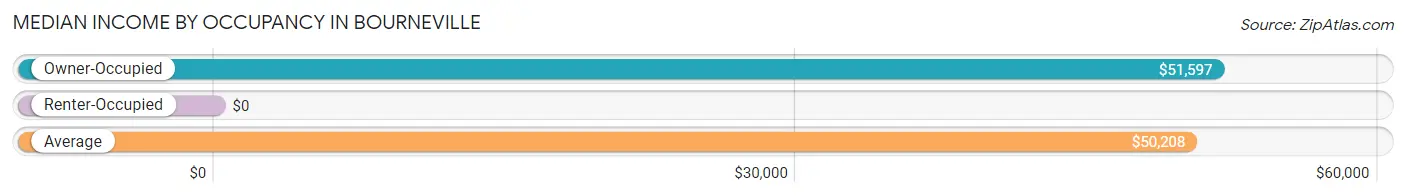
| Occupancy Type | # Households | Median Income |
| Owner-Occupied | 76 (65.5%) | $51,597 |
| Renter-Occupied | 40 (34.5%) | $0 |
| Average | 116 (100.0%) | $50,208 |
Occupancy by Householder Income Bracket in Bourneville
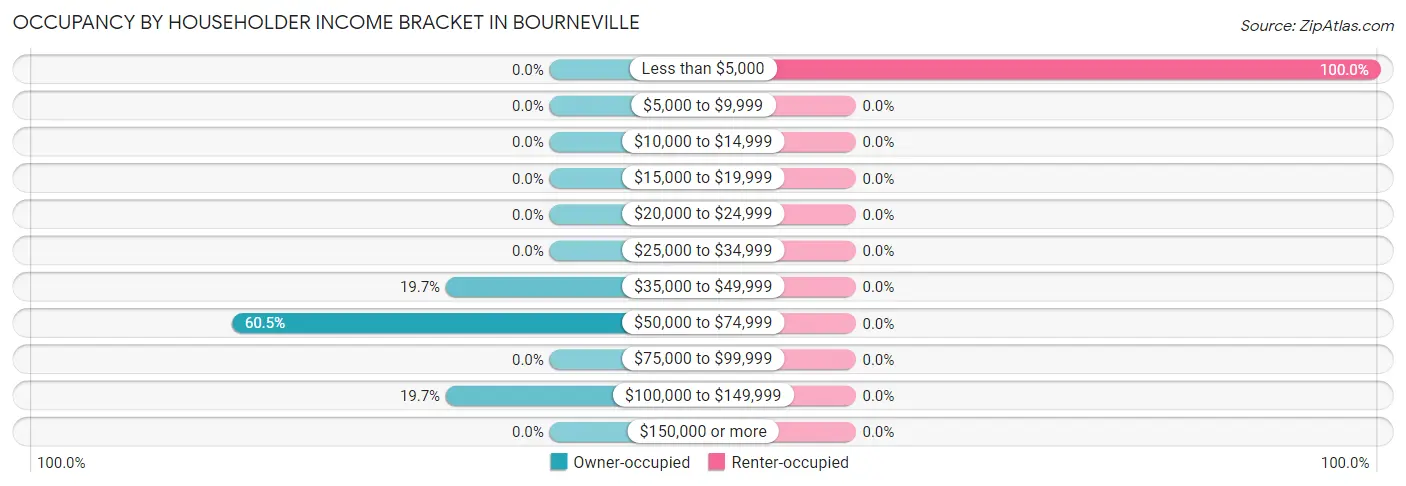
| Income Bracket | Owner-occupied | Renter-occupied |
| Less than $5,000 | 0 (0.0%) | 40 (100.0%) |
| $5,000 to $9,999 | 0 (0.0%) | 0 (0.0%) |
| $10,000 to $14,999 | 0 (0.0%) | 0 (0.0%) |
| $15,000 to $19,999 | 0 (0.0%) | 0 (0.0%) |
| $20,000 to $24,999 | 0 (0.0%) | 0 (0.0%) |
| $25,000 to $34,999 | 0 (0.0%) | 0 (0.0%) |
| $35,000 to $49,999 | 15 (19.7%) | 0 (0.0%) |
| $50,000 to $74,999 | 46 (60.5%) | 0 (0.0%) |
| $75,000 to $99,999 | 0 (0.0%) | 0 (0.0%) |
| $100,000 to $149,999 | 15 (19.7%) | 0 (0.0%) |
| $150,000 or more | 0 (0.0%) | 0 (0.0%) |
| Total | 76 (100.0%) | 40 (100.0%) |
Monthly Housing Cost Tiers in Bourneville
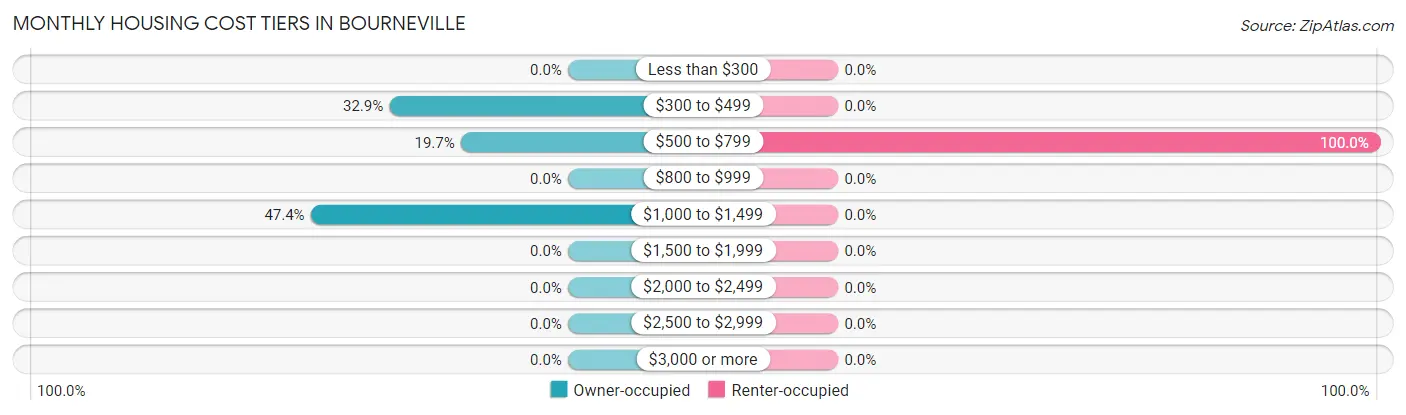
| Monthly Cost | Owner-occupied | Renter-occupied |
| Less than $300 | 0 (0.0%) | 0 (0.0%) |
| $300 to $499 | 25 (32.9%) | 0 (0.0%) |
| $500 to $799 | 15 (19.7%) | 40 (100.0%) |
| $800 to $999 | 0 (0.0%) | 0 (0.0%) |
| $1,000 to $1,499 | 36 (47.4%) | 0 (0.0%) |
| $1,500 to $1,999 | 0 (0.0%) | 0 (0.0%) |
| $2,000 to $2,499 | 0 (0.0%) | 0 (0.0%) |
| $2,500 to $2,999 | 0 (0.0%) | 0 (0.0%) |
| $3,000 or more | 0 (0.0%) | 0 (0.0%) |
| Total | 76 (100.0%) | 40 (100.0%) |
Physical Housing Characteristics in Bourneville
Housing Structures in Bourneville
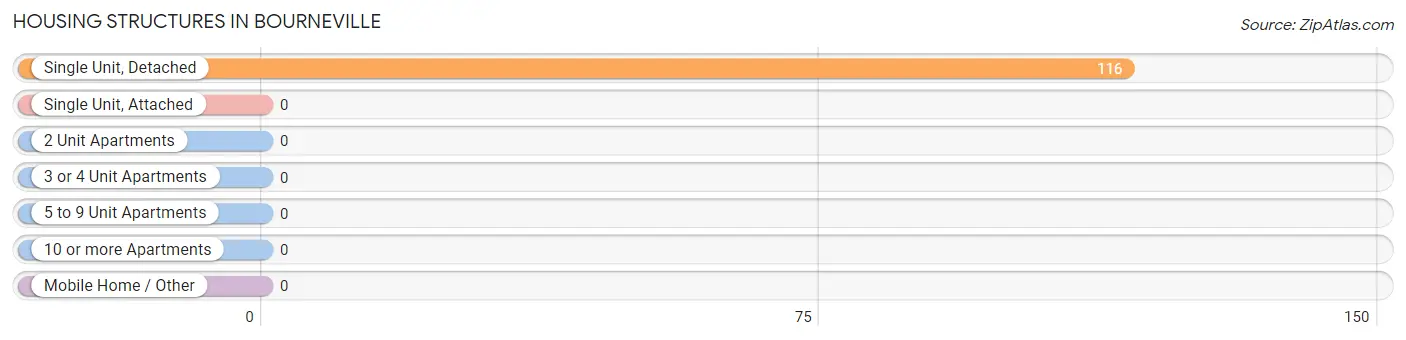
| Structure Type | # Housing Units | % Housing Units |
| Single Unit, Detached | 116 | 100.0% |
| Single Unit, Attached | 0 | 0.0% |
| 2 Unit Apartments | 0 | 0.0% |
| 3 or 4 Unit Apartments | 0 | 0.0% |
| 5 to 9 Unit Apartments | 0 | 0.0% |
| 10 or more Apartments | 0 | 0.0% |
| Mobile Home / Other | 0 | 0.0% |
| Total | 116 | 100.0% |
Housing Structures by Occupancy in Bourneville
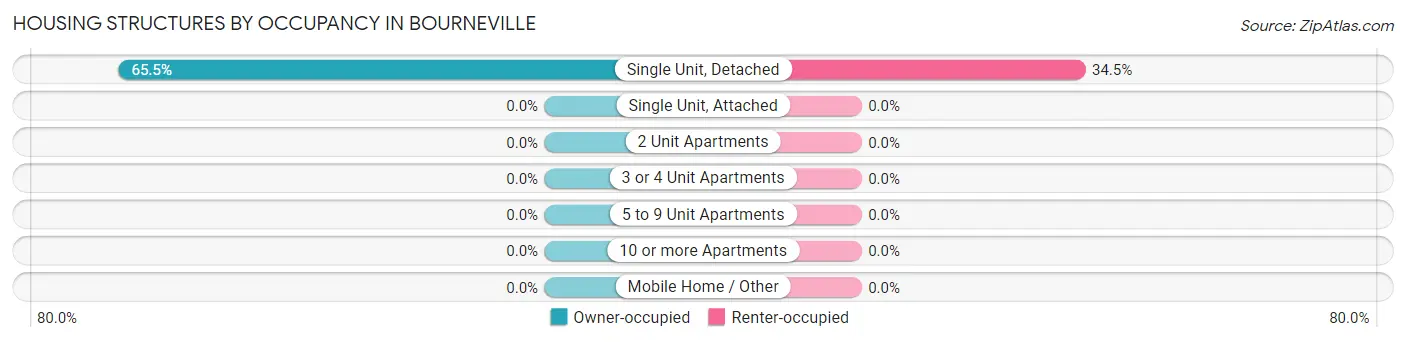
| Structure Type | Owner-occupied | Renter-occupied |
| Single Unit, Detached | 76 (65.5%) | 40 (34.5%) |
| Single Unit, Attached | 0 (0.0%) | 0 (0.0%) |
| 2 Unit Apartments | 0 (0.0%) | 0 (0.0%) |
| 3 or 4 Unit Apartments | 0 (0.0%) | 0 (0.0%) |
| 5 to 9 Unit Apartments | 0 (0.0%) | 0 (0.0%) |
| 10 or more Apartments | 0 (0.0%) | 0 (0.0%) |
| Mobile Home / Other | 0 (0.0%) | 0 (0.0%) |
| Total | 76 (65.5%) | 40 (34.5%) |
Housing Structures by Number of Rooms in Bourneville
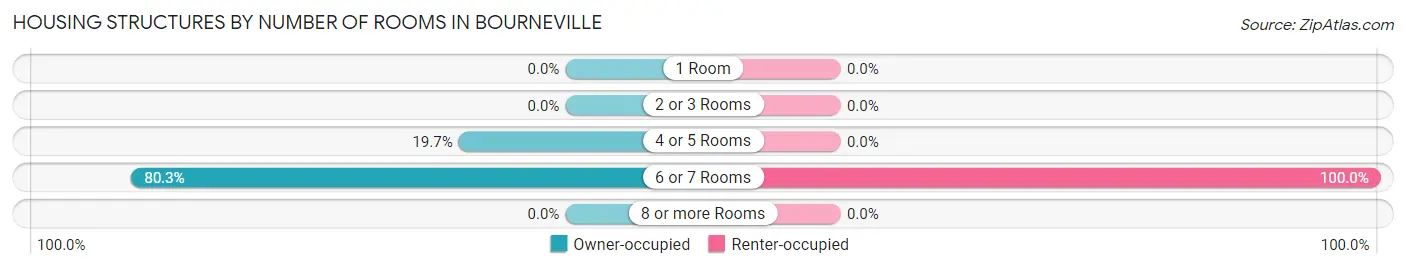
| Number of Rooms | Owner-occupied | Renter-occupied |
| 1 Room | 0 (0.0%) | 0 (0.0%) |
| 2 or 3 Rooms | 0 (0.0%) | 0 (0.0%) |
| 4 or 5 Rooms | 15 (19.7%) | 0 (0.0%) |
| 6 or 7 Rooms | 61 (80.3%) | 40 (100.0%) |
| 8 or more Rooms | 0 (0.0%) | 0 (0.0%) |
| Total | 76 (100.0%) | 40 (100.0%) |
Housing Structure by Heating Type in Bourneville
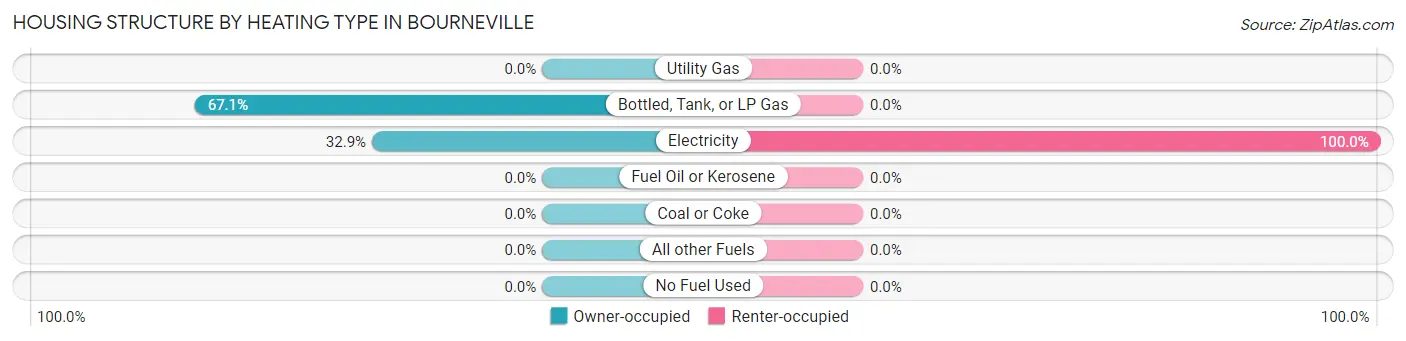
| Heating Type | Owner-occupied | Renter-occupied |
| Utility Gas | 0 (0.0%) | 0 (0.0%) |
| Bottled, Tank, or LP Gas | 51 (67.1%) | 0 (0.0%) |
| Electricity | 25 (32.9%) | 40 (100.0%) |
| Fuel Oil or Kerosene | 0 (0.0%) | 0 (0.0%) |
| Coal or Coke | 0 (0.0%) | 0 (0.0%) |
| All other Fuels | 0 (0.0%) | 0 (0.0%) |
| No Fuel Used | 0 (0.0%) | 0 (0.0%) |
| Total | 76 (100.0%) | 40 (100.0%) |
Household Vehicle Usage in Bourneville
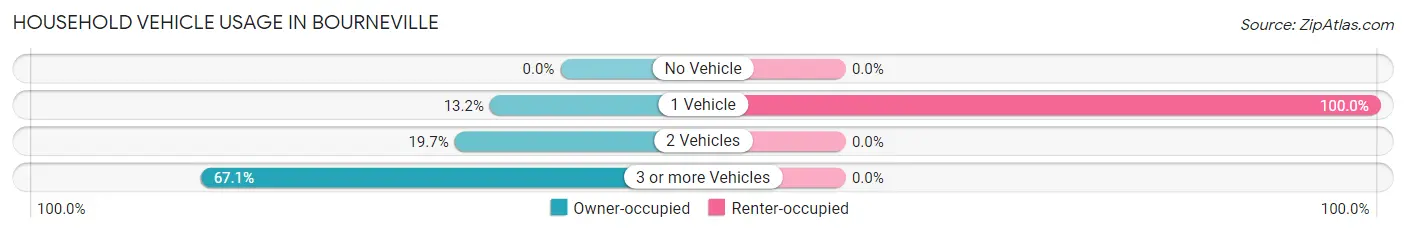
| Vehicles per Household | Owner-occupied | Renter-occupied |
| No Vehicle | 0 (0.0%) | 0 (0.0%) |
| 1 Vehicle | 10 (13.2%) | 40 (100.0%) |
| 2 Vehicles | 15 (19.7%) | 0 (0.0%) |
| 3 or more Vehicles | 51 (67.1%) | 0 (0.0%) |
| Total | 76 (100.0%) | 40 (100.0%) |
Real Estate & Mortgages in Bourneville
Real Estate and Mortgage Overview in Bourneville
| Characteristic | Without Mortgage | With Mortgage |
| Housing Units | 25 | 51 |
| Median Property Value | - | - |
| Median Household Income | - | - |
| Monthly Housing Costs | - | - |
| Real Estate Taxes | - | - |
Property Value by Mortgage Status in Bourneville
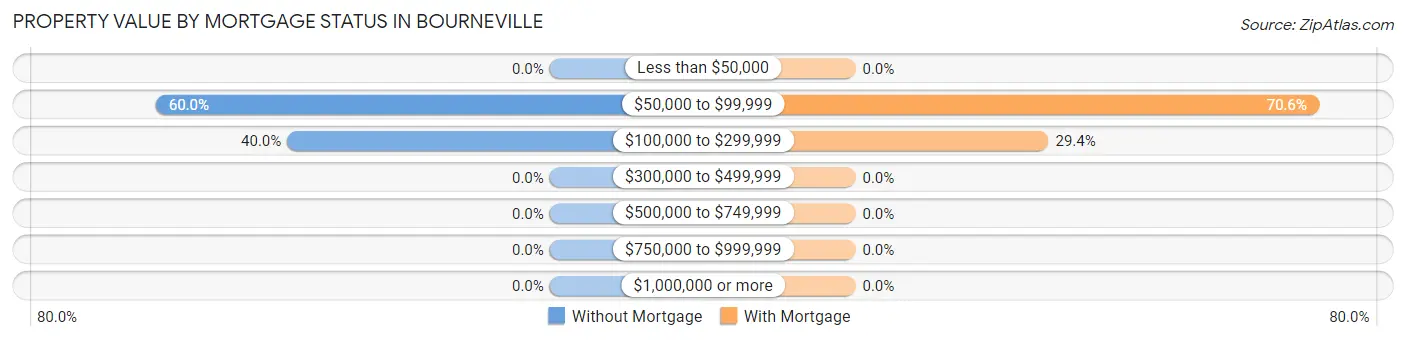
| Property Value | Without Mortgage | With Mortgage |
| Less than $50,000 | 0 (0.0%) | 0 (0.0%) |
| $50,000 to $99,999 | 15 (60.0%) | 36 (70.6%) |
| $100,000 to $299,999 | 10 (40.0%) | 15 (29.4%) |
| $300,000 to $499,999 | 0 (0.0%) | 0 (0.0%) |
| $500,000 to $749,999 | 0 (0.0%) | 0 (0.0%) |
| $750,000 to $999,999 | 0 (0.0%) | 0 (0.0%) |
| $1,000,000 or more | 0 (0.0%) | 0 (0.0%) |
| Total | 25 (100.0%) | 51 (100.0%) |
Household Income by Mortgage Status in Bourneville
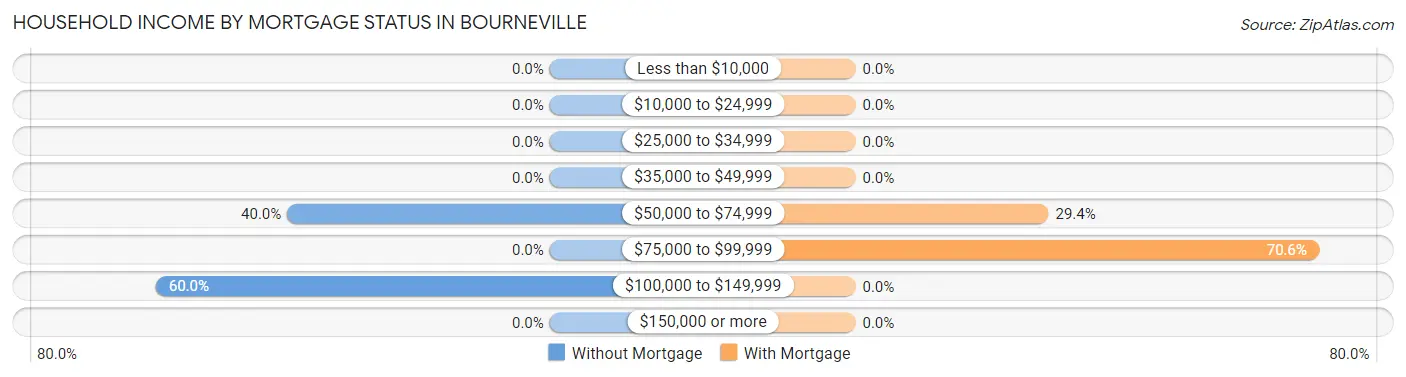
| Household Income | Without Mortgage | With Mortgage |
| Less than $10,000 | 0 (0.0%) | 0 (0.0%) |
| $10,000 to $24,999 | 0 (0.0%) | 0 (0.0%) |
| $25,000 to $34,999 | 0 (0.0%) | 0 (0.0%) |
| $35,000 to $49,999 | 0 (0.0%) | 0 (0.0%) |
| $50,000 to $74,999 | 10 (40.0%) | 15 (29.4%) |
| $75,000 to $99,999 | 0 (0.0%) | 36 (70.6%) |
| $100,000 to $149,999 | 15 (60.0%) | 0 (0.0%) |
| $150,000 or more | 0 (0.0%) | 0 (0.0%) |
| Total | 25 (100.0%) | 51 (100.0%) |
Property Value to Household Income Ratio in Bourneville
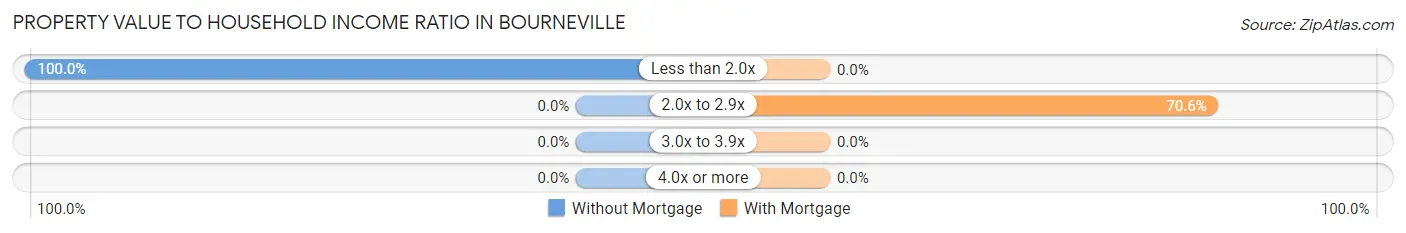
| Value-to-Income Ratio | Without Mortgage | With Mortgage |
| Less than 2.0x | 25 (100.0%) | 0 (0.0%) |
| 2.0x to 2.9x | 0 (0.0%) | 36 (70.6%) |
| 3.0x to 3.9x | 0 (0.0%) | 0 (0.0%) |
| 4.0x or more | 0 (0.0%) | 0 (0.0%) |
| Total | 25 (100.0%) | 51 (100.0%) |
Real Estate Taxes by Mortgage Status in Bourneville
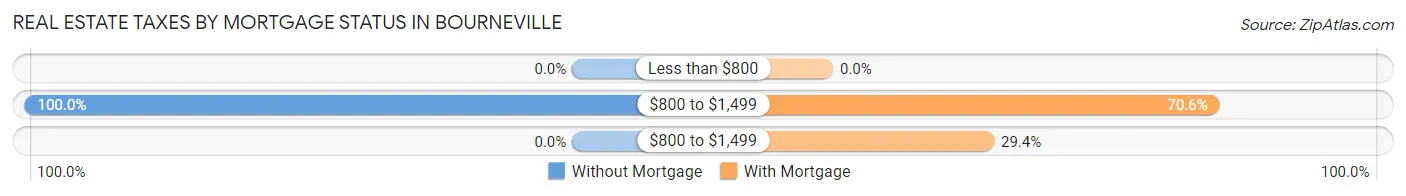
| Property Taxes | Without Mortgage | With Mortgage |
| Less than $800 | 0 (0.0%) | 0 (0.0%) |
| $800 to $1,499 | 25 (100.0%) | 36 (70.6%) |
| $800 to $1,499 | 0 (0.0%) | 15 (29.4%) |
| Total | 25 (100.0%) | 51 (100.0%) |
Health & Disability in Bourneville
Health Insurance Coverage by Age in Bourneville
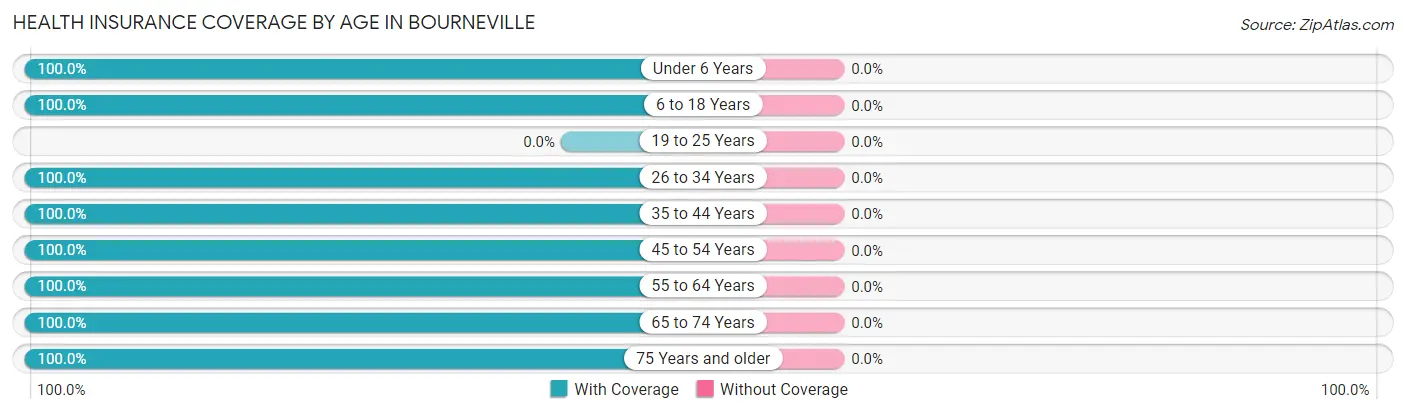
| Age Bracket | With Coverage | Without Coverage |
| Under 6 Years | 92 (100.0%) | 0 (0.0%) |
| 6 to 18 Years | 121 (100.0%) | 0 (0.0%) |
| 19 to 25 Years | 0 (0.0%) | 0 (0.0%) |
| 26 to 34 Years | 26 (100.0%) | 0 (0.0%) |
| 35 to 44 Years | 36 (100.0%) | 0 (0.0%) |
| 45 to 54 Years | 40 (100.0%) | 0 (0.0%) |
| 55 to 64 Years | 29 (100.0%) | 0 (0.0%) |
| 65 to 74 Years | 43 (100.0%) | 0 (0.0%) |
| 75 Years and older | 10 (100.0%) | 0 (0.0%) |
| Total | 397 (100.0%) | 0 (0.0%) |
Health Insurance Coverage by Citizenship Status in Bourneville
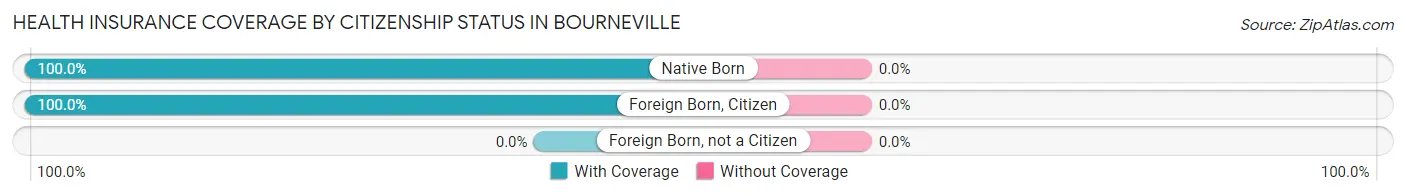
| Citizenship Status | With Coverage | Without Coverage |
| Native Born | 92 (100.0%) | 0 (0.0%) |
| Foreign Born, Citizen | 121 (100.0%) | 0 (0.0%) |
| Foreign Born, not a Citizen | 0 (0.0%) | 0 (0.0%) |
Health Insurance Coverage by Household Income in Bourneville
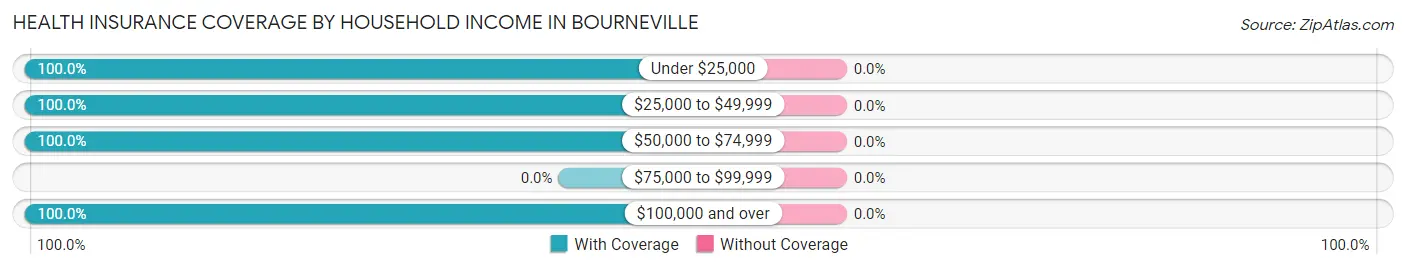
| Household Income | With Coverage | Without Coverage |
| Under $25,000 | 117 (100.0%) | 0 (0.0%) |
| $25,000 to $49,999 | 29 (100.0%) | 0 (0.0%) |
| $50,000 to $74,999 | 219 (100.0%) | 0 (0.0%) |
| $75,000 to $99,999 | 0 (0.0%) | 0 (0.0%) |
| $100,000 and over | 32 (100.0%) | 0 (0.0%) |
Public vs Private Health Insurance Coverage by Age in Bourneville
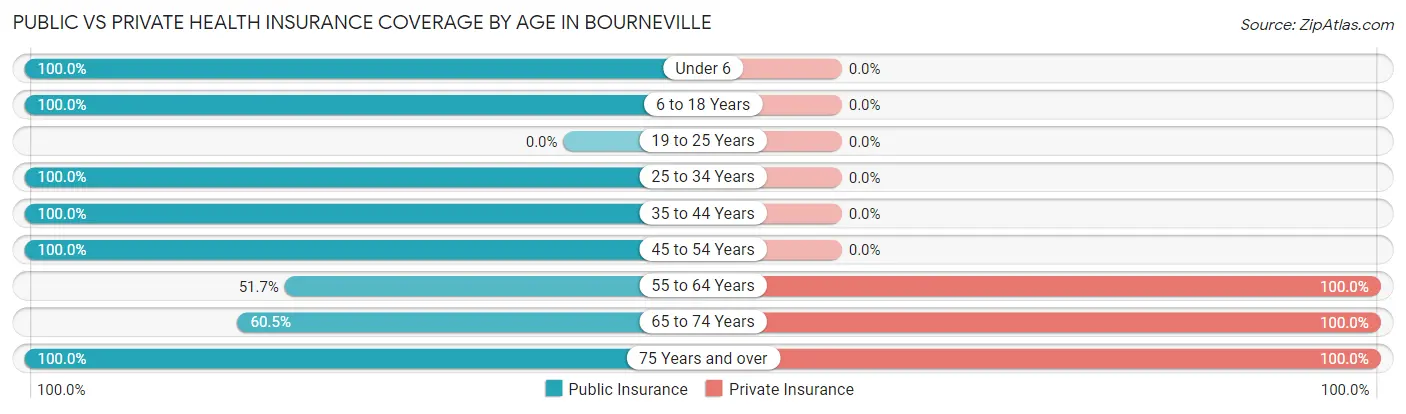
| Age Bracket | Public Insurance | Private Insurance |
| Under 6 | 92 (100.0%) | 0 (0.0%) |
| 6 to 18 Years | 121 (100.0%) | 0 (0.0%) |
| 19 to 25 Years | 0 (0.0%) | 0 (0.0%) |
| 25 to 34 Years | 26 (100.0%) | 0 (0.0%) |
| 35 to 44 Years | 36 (100.0%) | 0 (0.0%) |
| 45 to 54 Years | 40 (100.0%) | 0 (0.0%) |
| 55 to 64 Years | 15 (51.7%) | 29 (100.0%) |
| 65 to 74 Years | 26 (60.5%) | 43 (100.0%) |
| 75 Years and over | 10 (100.0%) | 10 (100.0%) |
| Total | 366 (92.2%) | 82 (20.6%) |
Disability Status by Sex by Age in Bourneville
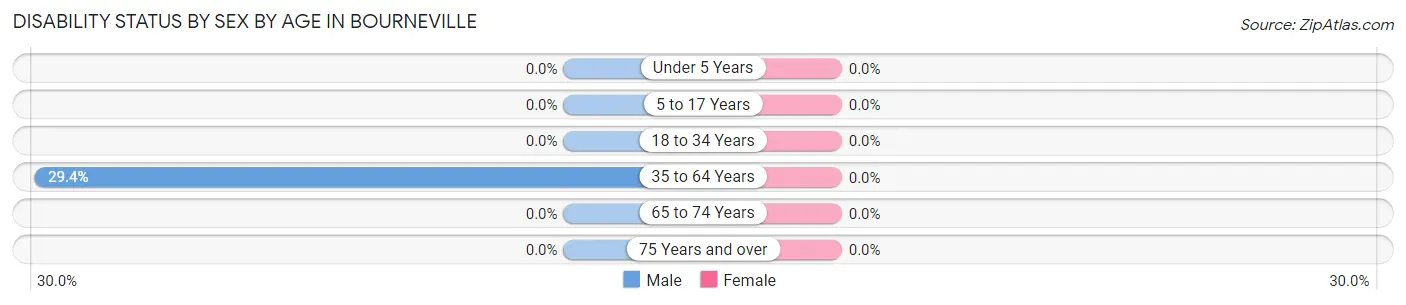
| Age Bracket | Male | Female |
| Under 5 Years | 0 (0.0%) | 0 (0.0%) |
| 5 to 17 Years | 0 (0.0%) | 0 (0.0%) |
| 18 to 34 Years | 0 (0.0%) | 0 (0.0%) |
| 35 to 64 Years | 15 (29.4%) | 0 (0.0%) |
| 65 to 74 Years | 0 (0.0%) | 0 (0.0%) |
| 75 Years and over | 0 (0.0%) | 0 (0.0%) |
Disability Class by Sex by Age in Bourneville
Disability Class: Hearing Difficulty
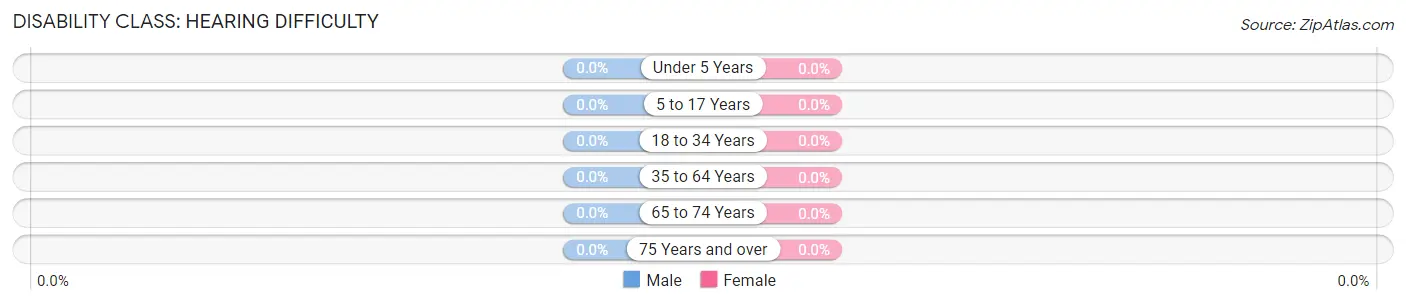
| Age Bracket | Male | Female |
| Under 5 Years | 0 (0.0%) | 0 (0.0%) |
| 5 to 17 Years | 0 (0.0%) | 0 (0.0%) |
| 18 to 34 Years | 0 (0.0%) | 0 (0.0%) |
| 35 to 64 Years | 0 (0.0%) | 0 (0.0%) |
| 65 to 74 Years | 0 (0.0%) | 0 (0.0%) |
| 75 Years and over | 0 (0.0%) | 0 (0.0%) |
Disability Class: Vision Difficulty
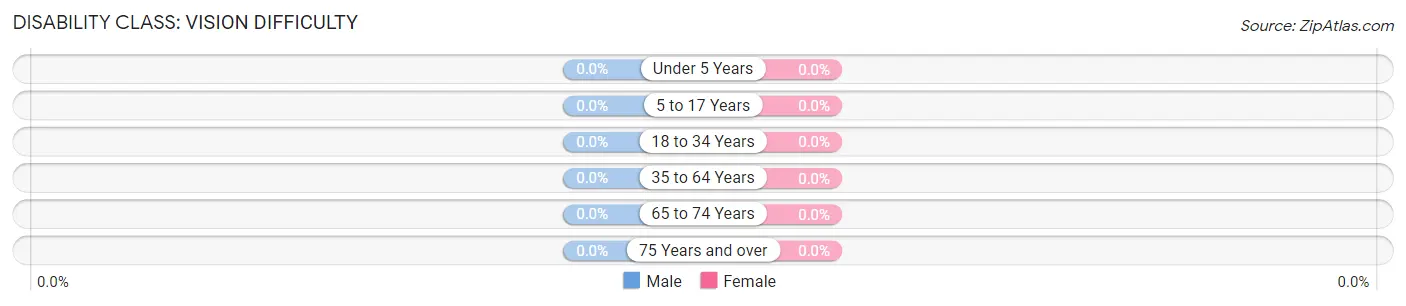
| Age Bracket | Male | Female |
| Under 5 Years | 0 (0.0%) | 0 (0.0%) |
| 5 to 17 Years | 0 (0.0%) | 0 (0.0%) |
| 18 to 34 Years | 0 (0.0%) | 0 (0.0%) |
| 35 to 64 Years | 0 (0.0%) | 0 (0.0%) |
| 65 to 74 Years | 0 (0.0%) | 0 (0.0%) |
| 75 Years and over | 0 (0.0%) | 0 (0.0%) |
Disability Class: Cognitive Difficulty
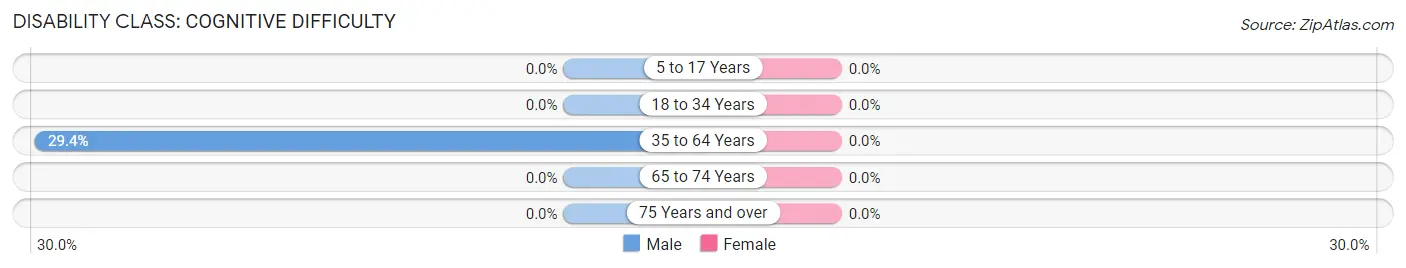
| Age Bracket | Male | Female |
| 5 to 17 Years | 0 (0.0%) | 0 (0.0%) |
| 18 to 34 Years | 0 (0.0%) | 0 (0.0%) |
| 35 to 64 Years | 15 (29.4%) | 0 (0.0%) |
| 65 to 74 Years | 0 (0.0%) | 0 (0.0%) |
| 75 Years and over | 0 (0.0%) | 0 (0.0%) |
Disability Class: Ambulatory Difficulty
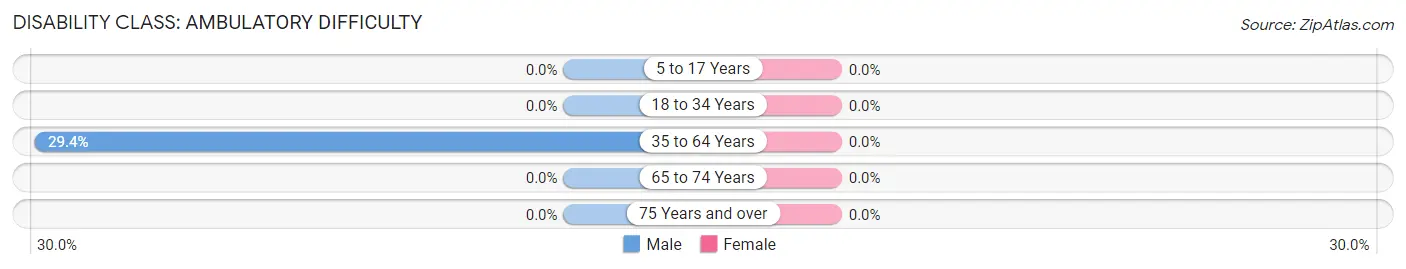
| Age Bracket | Male | Female |
| 5 to 17 Years | 0 (0.0%) | 0 (0.0%) |
| 18 to 34 Years | 0 (0.0%) | 0 (0.0%) |
| 35 to 64 Years | 15 (29.4%) | 0 (0.0%) |
| 65 to 74 Years | 0 (0.0%) | 0 (0.0%) |
| 75 Years and over | 0 (0.0%) | 0 (0.0%) |
Disability Class: Self-Care Difficulty
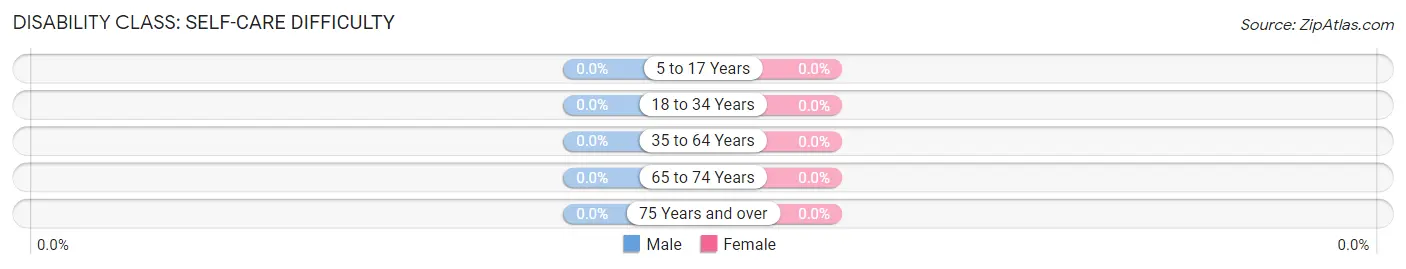
| Age Bracket | Male | Female |
| 5 to 17 Years | 0 (0.0%) | 0 (0.0%) |
| 18 to 34 Years | 0 (0.0%) | 0 (0.0%) |
| 35 to 64 Years | 0 (0.0%) | 0 (0.0%) |
| 65 to 74 Years | 0 (0.0%) | 0 (0.0%) |
| 75 Years and over | 0 (0.0%) | 0 (0.0%) |
Technology Access in Bourneville
Computing Device Access in Bourneville

| Device Type | # Households | % Households |
| Desktop or Laptop | 76 | 65.5% |
| Smartphone | 76 | 65.5% |
| Tablet | 101 | 87.1% |
| No Computing Device | 0 | 0.0% |
| Total | 116 | 100.0% |
Internet Access in Bourneville
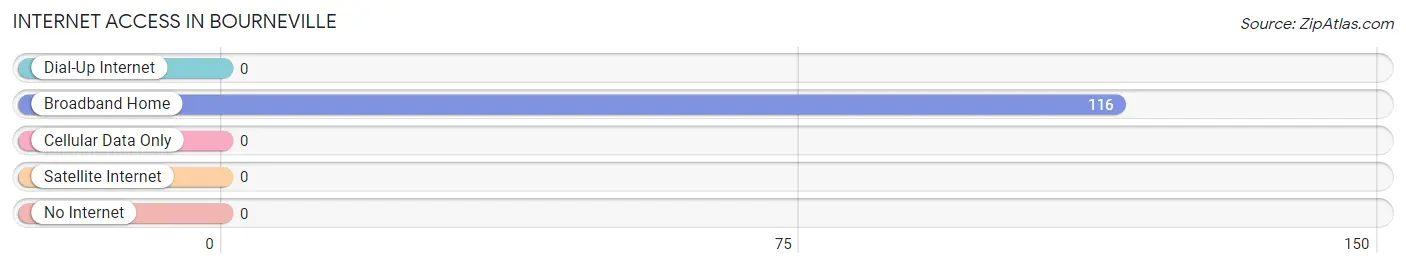
| Internet Type | # Households | % Households |
| Dial-Up Internet | 0 | 0.0% |
| Broadband Home | 116 | 100.0% |
| Cellular Data Only | 0 | 0.0% |
| Satellite Internet | 0 | 0.0% |
| No Internet | 0 | 0.0% |
| Total | 116 | 100.0% |
Bourneville Summary
Bourneville, Ohio is a small village located in Ross County, Ohio. It is situated on the banks of the Scioto River, approximately 10 miles south of Chillicothe. The village was founded in 1817 by William Bourne, a Revolutionary War veteran, and was named after him. The village has a population of approximately 1,000 people and is part of the Chillicothe Micropolitan Statistical Area.
History
Bourneville was founded in 1817 by William Bourne, a Revolutionary War veteran. He purchased the land from the Scioto Company and named the village after himself. The village was incorporated in 1837 and was the first village in Ross County to be incorporated.
The village was a major stop on the Underground Railroad, with many of the local residents helping to hide and transport runaway slaves. The village was also home to a number of abolitionists, including William Lloyd Garrison and John Brown.
The village was also home to a number of industries, including a woolen mill, a sawmill, a gristmill, and a distillery. The village was also home to a number of churches, including the Methodist Episcopal Church, the Presbyterian Church, and the Baptist Church.
Geography
Bourneville is located in Ross County, Ohio, approximately 10 miles south of Chillicothe. The village is situated on the banks of the Scioto River and is surrounded by rolling hills and farmland. The village is located in the Appalachian Plateau region of Ohio and is part of the Appalachian Mountains.
The village has a total area of 0.6 square miles, all of which is land. The village is located at an elevation of 890 feet above sea level. The climate in the village is humid continental, with hot summers and cold winters.
Economy
The economy of Bourneville is largely based on agriculture and tourism. The village is home to a number of farms, which produce a variety of crops, including corn, soybeans, wheat, and hay. The village is also home to a number of tourist attractions, including the Scioto River, the historic village of Bourneville, and the nearby Shawnee State Forest.
The village is also home to a number of small businesses, including restaurants, shops, and a grocery store. The village is also home to a number of manufacturing companies, including a furniture factory and a plastics factory.
Demographics
As of the 2010 census, the village had a population of 1,000 people. The racial makeup of the village was 97.2% White, 0.7% African American, 0.2% Native American, 0.2% Asian, 0.2% from other races, and 1.7% from two or more races. Hispanic or Latino of any race were 0.7% of the population.
The median income for a household in the village was $37,500, and the median income for a family was $45,000. The per capita income for the village was $18,000. About 10.2% of families and 12.2% of the population were below the poverty line, including 16.7% of those under age 18 and 8.3% of those age 65 or over.
Common Questions
What is Per Capita Income in Bourneville?
Per Capita income in Bourneville is $11,797.
What is the Median Household income in Bourneville?
Median Household Income in Bourneville is $50,208.
What is Inequality or Gini Index in Bourneville?
Inequality or Gini Index in Bourneville is 0.46.
What is the Total Population of Bourneville?
Total Population of Bourneville is 397.
What is the Total Male Population of Bourneville?
Total Male Population of Bourneville is 145.
What is the Total Female Population of Bourneville?
Total Female Population of Bourneville is 252.
What is the Ratio of Males per 100 Females in Bourneville?
There are 57.54 Males per 100 Females in Bourneville.
What is the Ratio of Females per 100 Males in Bourneville?
There are 173.79 Females per 100 Males in Bourneville.
What is the Median Population Age in Bourneville?
Median Population Age in Bourneville is 17.4 Years.
What is the Average Family Size in Bourneville
Average Family Size in Bourneville is 3.6 People.
What is the Average Household Size in Bourneville
Average Household Size in Bourneville is 3.4 People.
How Large is the Labor Force in Bourneville?
There are 107 People in the Labor Forcein in Bourneville.
What is the Percentage of People in the Labor Force in Bourneville?
51.0% of People are in the Labor Force in Bourneville.